Notebook-testrapporten met Intel HD Graphics 4400 grafische kaart
Kort testrapport Asus Q302LA Convertible
De betaalbare convertible. Voor ongeveer $500 is deze Asus zowel een prima tablet als notebook. Om zo'n laag prijsniveau te halen is er helaas wel op veel vlakken geld bespaard.
Intel Core i3-4030U, HD Graphics 4400, 13.3", 1.8 kgKort testrapport Acer TravelMate P246-M-598B Notebook
Simpel. Zijn 15.6 inch notebooks te groot en heb je voor uitstapjes een draagbare computer nodig? Als je geen perfectionist bent, dan kan Acer's 14 inch notebook met zijn 8 uur batterijduur voor jou de ideale TravelMate zijn.
Intel Core i5-4210U, HD Graphics 4400, 14", 2.1 kgKort testrapport Dell Latitude 12 E5250 Notebook
Kleine zakelijke partner. Na de succesvolle Dell Latitude E5450 productserie, hebben we nu de 12,5 inch Latitude E5250 getest. Dit apparaat heeft echter niet aan onze verwachtingen voldaan.
Intel Core i5-4310U, HD Graphics 4400, 12.5", 1.7 kgKort testrapport Fujitsu Lifebook U574 Ultrabook
Bedrieglijk. Slanke en aantrekkelijk ogende business notebooks zijn tegenwoordig mogelijk. Het non-glare touchscreen van Fujitsu's Lifebook U574 is echter zeldzaam. Is dit slechts een afleidingsmanoeuvre, of gaat het hier daadwerkelijk om een solide business subnotebook die aan alle fundamentele criteria voldoet?
Intel Core i5-4200U, HD Graphics 4400, 13.3", 1.6 kgKort testrapport Dell Latitude 14 Rugged 5404 Notebook
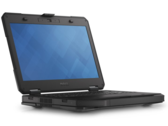
Probleem? Geen probleem! Een laptop moet stevig, veilig en altijd klaar voor gebruik zijn in industriële omgevingen. Dell stelt nu zijn Latitude 14 Rugged 5454 voor als onderdeel van de Dell-Latitude-Rugged-Extreme serie. De naam mist de "Extreme" waardoor de prijs drastisch lager ligt.
Intel Core i5-4310U, HD Graphics 4400, 14", 3.1 kgDell Latitude 14 E5450: Intel Core i5-4310U, 14.00", 2 kg
Testrapport » Kort testrapport Dell Latitude 14 E5450 Notebook
Asus ASUSPRO Advanced BU201LA-DT036G: Intel Core i5-4210U, 12.50", 1.4 kg
Testrapport » Kort testrapport Asus ASUSPRO Advanced BU201LA-DT036G Ultrabook
Lenovo Edge 15-80H10004US: Intel Core i5-4210U, 15.60", 2.4 kg
Testrapport » Kort testrapport Lenovo Edge 15-80H10004US Notebook
Lenovo Horizon 2s-F0AT0003US: Intel Core i5-4210U, 19.50", 2.5 kg
Testrapport » Kort testrapport Lenovo Horizon 2s-F0AT0003US AIO
Dell Latitude E5550: Intel Core i5-4310U, 15.60", 2.1 kg
Testrapport » Kort testrapport Dell Latitude E5550 Notebook
Toshiba Satellite Radius P50W-BST2N01: Intel Core i5-4210U, 15.60", 2.2 kg
Testrapport » Kort testrapport Toshiba Satellite Radius P50W-BST2N01 Convertible
Dell Inspiron 13 7347: Intel Core i5-4210U, 13.30", 1.7 kg
Testrapport » Kort testrapport Dell Inspiron 13 7347 Convertible
Lenovo Horizon 2e-F0AS0014US: Intel Core i3-4030U, 21.50", 4.6 kg
Testrapport » Kort testrapport Lenovo Horizon 2e-F0AS0014US AIO
Asus Transformer Book Flip TP550LA-CJ070P: Intel Core i5-4210U, 15.60", 2.3 kg
Testrapport » Kort testrapport Asus Transformer Book Flip TP550LA-CJ070P Convertible
Acer Aspire V3-371-55GS: Intel Core i5-4210U, 13.30", 1.5 kg
Testrapport » Kort testrapport Acer Aspire V3-371-55GS Subnotebook
HP Pavilion 13-a000ng x360: Intel Core i3-4030U, 13.30", 1.8 kg
Testrapport » Kort testrapport HP Pavilion 13-a000ng x360 Convertible
Toshiba Satellite P30W-B-104: Intel Core i5-4210U, 13.30", 2 kg
Testrapport » Kort testrapport Toshiba Satellite Click 2 Pro P30W-B-104 Convertible
Toshiba Tecra Z40t-A1410: Intel Core i5-4310U, 14.00", 1.6 kg
Testrapport » Kort testrapport Toshiba Tecra Z40T-A1410 Notebook
Dell Inspiron 14-7437 (FHD): Intel Core i7-4510U, 14.00", 2 kg
Testrapport » Kort testrapport Dell Inspiron 14-7437 FHD Ultrabook Update
Toshiba Satellite Pro R50-B-112: Intel Core i5-4210U, 15.60", 2.3 kg
Testrapport » Kort testrapport Toshiba Satellite Pro R50-B-112 Notebook
HP Envy 15-u001ng x360: Intel Core i5-4210U, 15.60", 2.4 kg
Testrapport » Kort testrapport HP Envy x360-15t Touch Convertible
Dell Latitude 12 Rugged Extreme: Intel Core i5-4300U, 11.60", 2.7 kg
Testrapport » Kort testrapport Dell Latitude 12 Rugged Extreme Convertible
Acer Extensa 2510-34Z4: Intel Core i3-4030U, 15.60", 2.5 kg
Testrapport » Kort testrapport Acer Extensa 2510-34Z4 Notebook
Fujitsu Stylistic Q704: Intel Core i5-4300U, 12.50", 2.1 kg
Testrapport » Kort testrapport Fujitsu Stylistic Q704 Convertible
Toshiba Portege Z30t-A-10X: Intel Core i7-4500U, 13.30", 1.4 kg
Testrapport » Testrapport Update Toshiba Portégé Z30t-A-10X Ultrabook
Lenovo IdeaPad Flex 2 15: Intel Core i5-4210U, 15.60", 2.6 kg
Testrapport » Kort testrapport Lenovo IdeaPad Flex 2 15 Notebook
Dell Latitude 14 7414 Rugged Extreme: Intel Core i5-4300U, 14.00", 3.7 kg
Testrapport » Kort testrapport Dell Latitude 14 Rugged Extreme Notebook
Acer Aspire V3-371-36M2: Intel Core i3-4030U, 13.30", 1.5 kg
Testrapport » Kort testrapport Acer Aspire V3-371-36M2 Notebook
Dell Inspiron 17-5748: Intel Core i7-4510U, 17.30", 3.2 kg
Testrapport » Kort testrapport Dell Inspiron 17-5748 Notebook
Microsoft Surface Pro 3: Intel Core i5-4300U, 12.00", 0.8 kg
Testrapport » Kort testrapport Microsoft Surface Pro 3 Tablet
HP EliteBook Revolve 810 G2: Intel Core i5-4300U, 11.60", 1.3 kg
Testrapport » Kort testrapport HP EliteBook Revolve 810 G2 Notebook
Lenovo Yoga 2 13: Intel Core i3-4010U, 13.30", 1.6 kg
Testrapport » Kort testrapport Lenovo Yoga 2 13 Convertible
Asus Transformer Book T300LA-C4006H: Intel Core i5-4200U, 13.30", 1.9 kg
Testrapport » Kort testrapport Asus Transformer Book T300LA-C4006H Convertible
Toshiba Tecra Z50 A-12K: Intel Core i7-4600U, 15.60", 1.8 kg
Testrapport » Kort testrapport Toshiba Tecra Z50 A-12K Notebook
Toshiba Tecra Z40 A-147: Intel Core i5-4200U, 14.00", 1.5 kg
Testrapport » Kort testrapport Toshiba Tecra Z40 A-147 Notebook
Asus UX32LA-R3025H: Intel Core i5-4200U, 13.30", 1.5 kg
Testrapport » Kort testrapport Asus Zenbook UX32LA-R3025H Ultrabook
Lenovo ThinkPad X240: Intel Core i7-4600U, 12.50", 1.5 kg
Testrapport » Kort testrapport Lenovo ThinkPad X240 Full HD Notebook
Samsung ATIV Book 9 2014 (NP930X5J-K02DE): Intel Core i5-4200U, 15.60", 1.8 kg
Testrapport » Kort testrapport Samsung ATIV Book 9 2014 (NP930X5J-K02DE) Ultrabook
Sony Vaio SVF14N13CXB: Intel Core i5-4200U, 14.00", 2 kg
Testrapport » Kort testrapport Sony Vaio Flip 14A SVF14N13CXB Convertible
Toshiba Kirabook 2014: Intel Core i7-4500U, 13.30", 1.3 kg
Testrapport » Kort testrapport Toshiba KIRAbook (KIRA-101) Ultrabook Review
Asus ASUSPRO Essential PU301LA-RO064G: Intel Core i7-4500U, 13.30", 1.9 kg
Testrapport » Kort Testrapport Asus AsusPro Essential PU301LA-RO064G Notebook Review
Dell Latitude 13 3340 Education Series: Intel Core i5-4200U, 13.30", 1.8 kg
Testrapport » Kort testrapport Dell Latitude 3340 Notebook
Dell Latitude E5440-4668: Intel Core i5-4300U, 14.00", 2.3 kg
Testrapport » Kort testrapport Dell Latitude E5440-4668 Notebook
Dell Latitude E5540: Intel Core i5-4300U, 15.60", 2.4 kg
Testrapport » Kort testrapport Dell Latitude E5540 Notebook
Fujitsu Lifebook T904: Intel Core i7-4600U, 13.30", 1.6 kg
Testrapport » Kort testrapport Fujitsu Lifebook T904 Convertible
Samsung ATIV Book 9 900X3G-K01: Intel Core i5-4200U, 13.30", 1.1 kg
Testrapport » Kort testrapport Samsung ATIV Book 9 900X3G-K01DE Notebook
Lenovo ThinkPad T440 20B6005YGE: Intel Core i7-4600U, 14.00", 1.7 kg
Testrapport » Testrapport Lenovo ThinkPad T440 20B6005YGE Notebook
HP EliteBook 840 G1: Intel Core i7-4600U, 14.00", 1.8 kg
Testrapport » Testrapport HP EliteBook 840 G1-H5G28ET Ultrabook
Asus VivoBook S301LA-C1073H: Intel Core i5-4200U, 13.30", 1.8 kg
Testrapport » Kort testrapport Asus VivoBook S301LA-C1073H Ultrabook
Fujitsu LifeBook S904: Intel Core i7-4600U, 13.30", 1.5 kg
Testrapport » Kort testrapport Fujitsu LifeBook S904 Notebook
HP EliteBook Folio 1040 G1 (H5F62ET): Intel Core i5-4200U, 14.00", 1.5 kg
Testrapport » Kort testrapport HP EliteBook Folio 1040 G1 (H5F62ET) Ultrabook
HP EliteBook 820 G1: Intel Core i7-4600U, 12.50", 1.5 kg
Testrapport » Kort testrapport HP EliteBook 820 G1-H5G14ET Subnotebook
HP EliteBook 850 G1-H5G34ET: Intel Core i5-4200U, 15.60", 2 kg
Testrapport » Kort testrapport HP EliteBook 850 G1-H5G34ET Notebook
Lenovo Thinkpad T440s 20AQ0069GE: Intel Core i7-4600U, 14.00", 1.7 kg
Testrapport » Kort testrapport Update Lenovo ThinkPad T440s 20AQ0069GE Notebook
HP Spectre 13-3010eg: Intel Core i7-4500U, 13.30", 1.5 kg
Testrapport » Kort testrapport HP Spectre 13-3010eg Ultrabook
Fujitsu Lifebook U904: Intel Core i7-4600U, 14.00", 1.4 kg
Testrapport » Kort testrapport Fujitsu LifeBook U904 Ultrabook
Asus Transformer Book Trio TX201LA: Intel Core i7-4500U, 11.60", 1.7 kg
Testrapport » Kort testrapport Asus Transformer Book Trio TX201LA Convertible
Lenovo ThinkPad Yoga: Intel Core i5-4200U, 12.50", 1.6 kg
Testrapport » Testrapport Lenovo ThinkPad Yoga Convertible
Toshiba Portege Z30-A-12U: Intel Core i7-4500U, 13.30", 1.2 kg
Testrapport » Kort testrapport Toshiba Portégé Z30-A-12U Notebook
Asus Zenbook UX302LA-C4003H: Intel Core i5-4200U, 13.30", 1.5 kg
Testrapport » Kort testrapport Asus Zenbook UX302LA-C4003H Ultrabook
Lenovo Yoga 2 Pro: Intel Core i5-4200U, 13.30", 1.4 kg
Testrapport » Testrapport Lenovo Yoga 2 Pro Convertible
Sony Vaio Fit multi-flip SV-F13N1L2E/S : Intel Core i5-4200U, 13.30", 1.3 kg
Testrapport » Kort testrapport Sony Vaio Fit 13A SV-F13N1L2E/S Convertible
Dell Latitude E7240 Touch: Intel Core i5-4300U, 12.50", 1.4 kg
Testrapport » Kort testrapport Update Dell Latitude E7240 Touch Notebook
Dell Inspiron 14-7437: Intel Core i7-4500U, 14.00", 1.7 kg
Testrapport » Kort testrapport Dell Inspiron 14-7437 Notebook
Acer Aspire S7-392: Intel Core i7-4500U, 13.30", 1.3 kg
Testrapport » Kort testrapport Acer Aspire S7-392 Ultrabook
Dell Latitude E7440: Intel Core i5-4200U, 14.00", 1.6 kg
Testrapport » Kort testrapport Dell Latitude E7440 Notebook
Lenovo ThinkPad X240: Intel Core i7-4600U, 12.50", 1.5 kg
Testrapport » Kort testrapport Lenovo ThinkPad X240 Ultrabook
Microsoft Surface Pro 2: Intel Core i5-4200U, 10.60", 0.9 kg
Testrapport » Kort testrapport Microsoft Surface Pro 2 Tablet
Fujitsu Lifebook U554: Intel Core i5-4200U, 13.30", 1.5 kg
Testrapport » Kort testrapport Fujitsu Lifebook U554 Notebook
HP Pavilion 15-n005sg: Intel Core i5-4200U, 15.60", 2.3 kg
Testrapport » Kort testrapport HP Pavilion 15-n005sg Notebook
Lenovo IdeaPad Flex 14-59395501: Intel Core i5-4200U, 14.00", 1.9 kg
Testrapport » Kort testrapport Lenovo IdeaPad Flex 14 Notebook
HP ProBook 430-G1: Intel Core i5-4200U, 13.30", 1.6 kg
Testrapport » Kort testrapport HP ProBook 430-G1 Notebook
Toshiba Satellite U50t-A-100: Intel Core i5-4200U, 15.60", 2.4 kg
Testrapport » Kort testrapport Toshiba Satellite U50t-A-100 Notebook
Dell Latitude E7240: Intel Core i5-4200U, 12.50", 1.3 kg
Testrapport » Kort testrapport Dell Latitude E7240 Notebook
Dell XPS 12-9Q33: Intel Core i5-4200U, 12.50", 1.5 kg
Testrapport » Kort testrapport geüpdatete Dell XPS 12-9Q33 Convertible
Lenovo IdeaPad U330p: Intel Core i5-4200U, 13.30", 1.5 kg
Testrapport » Kort testrapport Lenovo IdeaPad U330p Notebook
Dell Inspiron 15R-5537: Intel Core i7-4500U, 15.60", 2.3 kg
Testrapport » Kort testrapport Dell Inspiron 15R-5537 Notebook
HP Pavilion 13-a000ng x360: Intel Core i3-4030U, 13.30", 1.8 kg
Extern testrapport » HP Pavilion 13-a000ng x360
Acer Aspire ES1-571-50VH: Intel Core i5-4200U, 15.60", 2.4 kg
Extern testrapport » Acer Aspire ES1-571-50VH
Acer TravelMate P246-M-598B: Intel Core i5-4210U, 14.00", 2.1 kg
Extern testrapport » Acer TravelMate P246-M-598B
Dell Vostro 3558-9427: Intel Core i3-4005U, 15.60", 2.2 kg
Extern testrapport » Dell Vostro 3558-9427
Acer Aspire E5-571-38NJ: Intel Core i3-4005U, 15.60", 2.3 kg
Extern testrapport » Acer Aspire E5-571-38NJ
Acer Aspire E5-571-316T: Intel Core i3-4005U, 15.60", 2.5 kg
Extern testrapport » Acer Aspire E5-571-316T
Toshiba Satellite C55-C-11G: Intel Core i3-4005U, 15.60", 2.2 kg
Extern testrapport » Toshiba Satellite C55-C-11G
Toshiba Satellite C70-C-10l: Intel Core i3-4005U, 17.30", 2.6 kg
Extern testrapport » Toshiba Satellite C70-C-10l
Asus ASUSPRO Advanced BU401LA-CZ180G: Intel Core i5-4210U, 14.00", 1.7 kg
Extern testrapport » Asus ASUSPRO Advanced BU401LA-CZ180G
Toshiba Satellite C55-C-142: Intel Core i3-4005U, 15.60", 2.2 kg
Extern testrapport » Toshiba Satellite C55-C-142
Fujitsu Lifebook A514: Intel Core i3-4005U, 15.60", 2.2 kg
Extern testrapport » Fujitsu Lifebook A514
Acer Aspire E5-573-3870: Intel Core i3-4005U, 15.60", 2.4 kg
Extern testrapport » Acer Aspire E5-573-3870
Asus X555LA-XX290H: Intel Core i3-4030U, 15.60", 2.3 kg
Extern testrapport » Asus X555LA-XX290H
Acer Aspire R7-371T-72WX: Intel Core i7-4510U, 13.30", 1.5 kg
Extern testrapport » Acer Aspire R7-371T-72WX
Acer TravelMate P256-M-55EG: Intel Core i5-4210U, 15.60", 2.5 kg
Extern testrapport » Acer TravelMate P256-M-55EG
Asus X555LA-XX053D: Intel Core i3-4030U, 15.60", 2.3 kg
Extern testrapport » Asus X555LA-XX053D
Toshiba Portege Z30-A-1E1: Intel Core i7-4510U, 13.30", 1.2 kg
Extern testrapport » Toshiba Portege Z30-A-1E1
Medion Akoya S6413T-MD98842: Intel Core i5-4210U, 15.60", 1.4 kg
Extern testrapport » Medion Akoya S6413T-MD98842
HP Envy 15-u050sr x360: Intel Core i5-4210U, 15.60", 2.4 kg
Extern testrapport » HP Envy 15-u050sr x360
Acer Aspire R3-471T-394N: Intel Core i3-4030U, 14.00", 2.2 kg
Extern testrapport » Acer Aspire R3-471T-394N
Dell Latitude 14 Rugged Extreme-7404: Intel Core i5-4300U, 14.00", 3.5 kg
Extern testrapport » Dell Latitude 14 Rugged Extreme-7404
Acer TravelMate P256-M-385Y: Intel Core i3-4030U, 15.60", 2.5 kg
Extern testrapport » Acer TravelMate P256-M-385Y
Asus X555MA: Intel Core i5-4210U, 15.60", 2.3 kg
Extern testrapport » Asus X555MA
Acer Aspire E5-571-5552: Intel Core i5-4210U, 15.60", 2.5 kg
Extern testrapport » Acer Aspire E5-571-5552
HP Probook 430 G2: Intel Core i5-4210U, 13.30", 1.5 kg
Extern testrapport » HP Probook 430 G2
Acer Aspire R7-371T-77FF: Intel Core i7-4510U, 13.30", 1.5 kg
Extern testrapport » Acer Aspire R7-371T-77FF
Acer Aspire V3-371-33LX: Intel Core i3-4005U, 13.30", 1.5 kg
Extern testrapport » Acer Aspire V3-371-33LX
Dell Latitude 14 E5450: Intel Core i5-4310U, 14.00", 2 kg
Extern testrapport » Dell Latitude 14 E5450
Lenovo G50-70-59440028: Intel Core i3-4005U, 15.60", 2.5 kg
Extern testrapport » Lenovo G50-70-59440028
Asus ASUSPRO Advanced B551LA-CN169G: Intel Core i5-4210U, 15.60", 2.5 kg
Extern testrapport » Asus ASUSPRO Advanced B551LA-CN169G
Asus ASUSPRO Advanced BU201LA-DT036G: Intel Core i5-4210U, 12.50", 1.4 kg
Extern testrapport » Asus ASUSPRO Advanced BU201LA-DT036G
Lenovo IdeaPad U330p: Intel Core i5-4200U, 13.30", 1.5 kg
Extern testrapport » Lenovo IdeaPad U330p
Acer Aspire R7-371T-72TC: Intel Core i7-4510U, 13.30", 1.5 kg
Extern testrapport » Acer Aspire R7-371T-72TC
Acer Aspire E5-571-3205: Intel Core i3-4030U, 15.60", 2.5 kg
Extern testrapport » Acer Aspire E5-571-3205
Toshiba Portege Z30-A-189: Intel Core i5-4210U, 13.30", 1.2 kg
Extern testrapport » Toshiba Portege Z30-A-189
Dell Latitude 12 E5250: Intel Core i5-4310U, 12.50", 1.7 kg
Extern testrapport » Dell Latitude 12 E5250
Acer Aspire R7-371T-55DQ: Intel Core i5-4210U, 13.30", 1.5 kg
Extern testrapport » Acer Aspire R7-371T-55DQ
Fujitsu Lifebook U554: Intel Core i5-4200U, 13.30", 1.5 kg
Extern testrapport » Fujitsu Lifebook U554
HP Pavilion 13-b102TU: Intel Core i3-4030U, 13.30", 1.7 kg
Extern testrapport » HP Pavilion 13-b102TU
Acer Travelmate P645-MG-54208G1.02ttkk: Intel Core i5-4200U, 14.00", 1.5 kg
Extern testrapport » Acer Travelmate P645-MG-54208G1.02ttkk
Toshiba Satellite Click 2 Pro P30W-B-104: Intel Core i5-4210U, 13.30", 1 kg
Extern testrapport » Toshiba Satellite Click 2 Pro P30W-B-104
Acer Aspire R13 R7-371T-779K: Intel Core i7-4510U, 13.30", 1.5 kg
Extern testrapport » Acer Aspire R13 R7-371T-779K
Toshiba Tecra C50-B1503: Intel Core i5-4210U, 15.60", 2.3 kg
Extern testrapport » Toshiba Tecra C50-B1503
Toshiba Satellite Z30T-A-111: Intel Core i5-4200U, 13.30", 1.4 kg
Extern testrapport » Toshiba Satellite Z30T-A-111
Lenovo Edge 15-80H10004US: Intel Core i5-4210U, 15.60", 2.4 kg
Extern testrapport » Lenovo Edge 15-80H10004US
Acer Aspire R7-371T-55DJ: Intel Core i5-4210U, 13.30", 1.5 kg
Extern testrapport » Acer Aspire R7-371T-55DJ
Dell Inspiron 15-7537-3290: Intel Core i7-4510U, 15.60", 2.6 kg
Extern testrapport » Dell Inspiron 15-7537-3290
Samsung 940X3G-K07DE: Intel Core i5-4200U, 13.30", 1.4 kg
Extern testrapport » Samsung 940X3G-K07DE
Asus Transformer Book Flip TP300LA-C4034H: Intel Core i5-4210U, 13.30", 1.8 kg
Extern testrapport » Asus Transformer Book Flip TP300LA-C4034H
Toshiba Satellite L50-B-177: Intel Core i3-4005U, 15.60", 2.2 kg
Extern testrapport » Toshiba Satellite L50-B-177
HP G1 EliteBook Folio 1040 (H5F66EA): Intel Core i7-4600U, 14.00", 1.5 kg
Extern testrapport » HP G1 EliteBook Folio 1040 (H5F66EA)
HP Pavilion 13-a051sr: Intel Core i5-4210U, 13.30", 2 kg
Extern testrapport » HP Pavilion 13-a051sr
Asus Zenbook UX303LA-R5094H: Intel Core i5-4210U, 13.30", 1.5 kg
Extern testrapport » Asus Zenbook UX303LA-R5094H
HP Envy 15-u000na x360: Intel Core i5-4210U, 15.60", 2.4 kg
Extern testrapport » HP Envy 15-u000na x360
Lenovo IdeaPad U330-59427487: Intel Core i5-4200U, 13.30", 1.7 kg
Extern testrapport » Lenovo IdeaPad U330-59427487
Toshiba Satellite Pro R50-B-12U: Intel Core i5-4210U, 15.60", 2.3 kg
Extern testrapport » Toshiba Satellite Pro R50-B-12U
Lenovo IdeaPad S510р-59-394781: Intel Core i3-4010U, 15.60", 2.4 kg
Extern testrapport » Lenovo IdeaPad S510р-59-394781
Toshiba Satellite L50-B-17C: Intel Core i3-4005U, 15.60", 2.2 kg
Extern testrapport » Toshiba Satellite L50-B-17C
Toshiba Satellite Pro R50-B-11C: Intel Core i3-4005U, 15.60", 2.2 kg
Extern testrapport » Toshiba Satellite Pro R50-B-11C
Acer Aspire V3-371-52VR: Intel Core i5-4210U, 13.30", 1.5 kg
Extern testrapport » Acer Aspire V3-371-52VR
Asus Chromebox CN60: Intel Core i3-4010U, 0.00", 0.6 kg
Extern testrapport » Asus Chromebox CN60
Lenovo IdeaPad Yoga2 13-59427516: Intel Core i3-4030U, 13.30", 1.6 kg
Extern testrapport » Lenovo IdeaPad Yoga2 13-59427516
Asus ASUSPRO BU201: Intel Core i5-4210U, 12.50", 1.3 kg
Extern testrapport » Asus ASUSPRO BU201
Asus Transformer Book Flip TP300LA-DW106H: Intel Core i3-4010U, 13.30", 1.8 kg
Extern testrapport » Asus Transformer Book Flip TP300LA-DW106H
Acer Aspire V3-371-77NK: Intel Core i7-4510U, 13.00", 1.6 kg
Extern testrapport » Acer Aspire V3-371-77NK
Fujitsu Stylistic Q704: Intel Core i5-4300U, 12.50", 2.1 kg
Extern testrapport » Fujitsu Stylistic Q704
Dell Latitude E5440-4668: Intel Core i5-4300U, 14.00", 2.3 kg
Extern testrapport » Dell Latitude E5440-4668
HP Envy 15-u100ng x360: Intel Core i5-4210U, 15.60", 2.4 kg
Extern testrapport » HP Envy 15-u100ng x360
HP Pavilion 13-a000nc x360: Intel Core i3-4030U, 13.00", 1.8 kg
Extern testrapport » HP Pavilion 13-a000nc x360
Asus Zenbook UX303LA-R5097H: Intel Core i7-4510U, 13.30", 1.5 kg
Extern testrapport » Asus Zenbook UX303LA-R5097H
Toshiba Satellite L70-B-11C: Intel Core i5-4200U, 17.30", 2.7 kg
Extern testrapport » Toshiba Satellite L70-B-11C
Dell Latitude 12 Rugged Extreme: Intel Core i5-4300U, 11.60", 2.7 kg
Extern testrapport » Dell Latitude 12 Rugged Extreme
Dell Inspiron 13 7347: Intel Core i5-4210U, 13.30", 1.7 kg
Extern testrapport » Dell Inspiron 13 7347
Acer Aspire R13: Intel Core i5-4210U, 13.30", 1.8 kg
Extern testrapport » Acer Aspire R13
Toshiba Satellite Click 2 Pro P35W-B3226: Intel Core i7-4510U, 13.30", 2.3 kg
Extern testrapport » Toshiba Satellite Click 2 Pro P35W-B3226
Dell Inspiron 13-7347-3276: Intel Core i3-4010U, 13.30", 1.7 kg
Extern testrapport » Dell Inspiron 13-7347-3276
Toshiba Satellite Pro R50-B-112: Intel Core i5-4210U, 15.60", 2.3 kg
Extern testrapport » Toshiba Satellite Pro R50-B-112
Lenovo M30-70: Intel Core i3-4010U, 13.30", 1.5 kg
Extern testrapport » Lenovo M30-70
Lenovo IdeaPad U430p-59428492: Intel Core i5-4210U, 14.00", 1.7 kg
Extern testrapport » Lenovo IdeaPad U430p-59428492
Toshiba KIRA-102: Intel Core i7-4510U, 13.30", 1.4 kg
Extern testrapport » Toshiba KIRA-102
Toshiba Satellite Z30-A-1D2: Intel Core i7-4510U, 13.30", 1.2 kg
Extern testrapport » Toshiba Satellite Z30-A-1D2
Acer Aspire E5-471-64WR: Intel Core i3-4030U, 14.00", 2 kg
Extern testrapport » Acer Aspire E5-471-64WR
Asus Transformer Book Flip TP300LA-C4032H: Intel Core i5-4210U, 13.30", 1.8 kg
Extern testrapport » Asus Transformer Book Flip TP300LA-C4032H
Toshiba Satellite Radius P50W-BST2N22: Intel Core i5-4210U, 15.60", 2.2 kg
Extern testrapport » Toshiba Satellite Radius P50W-BST2N22
Asus ASUSPRO Advanced BU401LA-CZ040G: Intel Core i5-4200U, 14.00", 1.7 kg
Extern testrapport » Asus ASUSPRO Advanced BU401LA-CZ040G
Toshiba Satellite Click 2 Pro P30W-BST2N22: Intel Core i7-4510U, 13.30", 2.3 kg
Extern testrapport » Toshiba Satellite Click 2 Pro P30W-BST2N22
Asus Transformer Book Flip TP300LA-DW063H: Intel Core i3-4030U, 13.30", 1.8 kg
Extern testrapport » Asus Transformer Book Flip TP300LA-DW063H
Acer Extensa 2510-34Z4: Intel Core i3-4030U, 15.60", 2.5 kg
Extern testrapport » Acer Extensa 2510-34Z4
Acer Aspire E5-471-59RT: Intel Core i5-4210U, 14.00", 2.3 kg
Extern testrapport » Acer Aspire E5-471-59RT
Toshiba Satellite Radius P55W-B5224: Intel Core i7-4510U, 15.60", 2.2 kg
Extern testrapport » Toshiba Satellite Radius P55W-B5224
Dell Inspiron 17-5748: Intel Core i7-4510U, 17.30", 3.2 kg
Extern testrapport » Dell Inspiron 17-5748
HP Envy 15-U002NF: Intel Core i5-4210U, 15.60", 2.4 kg
Extern testrapport » HP Envy 15-U002NF
Lenovo ThinkPad Yoga S1: Intel Core i7-4500U, 12.50", 1.6 kg
Extern testrapport » Lenovo ThinkPad Yoga S1
Acer C720-3404 Chromebook: Intel Core i3-4005U, 11.60", 1.2 kg
Extern testrapport » Acer C720-3404 Chromebook
Acer C720-3605 Chromebook: Intel Core i3-4005U, 11.60", 1.2 kg
Extern testrapport » Acer C720-3605 Chromebook
Lenovo Yoga 2 13: Intel Core i3-4010U, 13.30", 1.6 kg
Extern testrapport » Lenovo Yoga 2 13
Lenovo IdeaPad Flex 2 15: Intel Core i5-4210U, 15.60", 2.6 kg
Extern testrapport » Lenovo IdeaPad Flex 2 15
Acer Aspire S7-392: Intel Core i7-4500U, 13.30", 1.3 kg
Extern testrapport » Acer Aspire S7-392
Acer Aspire V7-482P: Intel Core i5-4200U, 14.00", 1.9 kg
Extern testrapport » Acer Aspire V7-482P
Acer Aspire E5-571P-363N: Intel Core i3-4030U, 15.60", 2.5 kg
Extern testrapport » Acer Aspire E5-571P-363N
Dell Latitude 14 7414 Rugged Extreme: Intel Core i5-4300U, 14.00", 3.7 kg
Extern testrapport » Dell Latitude 14 Rugged Extreme
Acer Aspire S7-392-5410: Intel Core i5-4210U, 13.30", 1.3 kg
Extern testrapport » Acer Aspire S7-392-5410
Acer Aspire S3-392G-54206G50tws: Intel Core i5-4200U, 13.30", 1.7 kg
Extern testrapport » Acer Aspire S3-392G-54206G50tws
Asus VivoBook S301LA-C1073H: Intel Core i5-4200U, 13.30", 1.8 kg
Extern testrapport » Asus VivoBook S301LA-C1073H
Toshiba Satellite Z30-A-12R: Intel Core i5-4200U, 13.30", 1.2 kg
Extern testrapport » Toshiba Satellite Z30-A-12R
Asus Zenbook UX302LA-C4004H: Intel Core i5-4200U, 13.30", 1.5 kg
Extern testrapport » Asus Zenbook UX302LA-C4004H
Toshiba Portege Z30T-A-11C: Intel Core i5-4200U, 13.30", 1.4 kg
Extern testrapport » Toshiba Portege Z30T-A-11C
Acer Aspire M5-583P-6637: Intel Core i5-4200U, 15.60", 2.4 kg
Extern testrapport » Acer Aspire M5-583P-6637
Dell Inspiron 14-5447: Intel Core i5-4210U, 14.00", 2.2 kg
Extern testrapport » Dell Inspiron 14-544
Asus X751L: Intel Core i7-4500U, 17.30", 2.8 kg
Extern testrapport » Asus X751L
Asus Transformer Book T300LA 90NB02W1-M01450: Intel Core i7-4500U, 13.30", 1.9 kg
Extern testrapport » Asus Transformer Book T300LA 90NB02W1-M01450
Panasonic Toughbook CF-AX3: Intel Core i5-4300U, 11.60", 1.2 kg
Extern testrapport » Panasonic Toughbook CF-AX3
Dell Latitude E7240-SM008LE72408GER: Intel Core i5-4300U, 12.50", 1.4 kg
Extern testrapport » Dell Latitude E7240-SM008LE72408GER
HP Envy 15-u001ng x360: Intel Core i5-4210U, 15.60", 2.4 kg
Extern testrapport » HP Envy 15-u001ng x360
Asus K511LA: Intel Core i7-4500U, 15.60", 2.2 kg
Extern testrapport » Asus K511LA
Asus VivoBook S451LA-CA045H: Intel Core i5-4200U, 14.00", 2.2 kg
Extern testrapport » Asus VivoBook S451LA-CA045H
Toshiba Tecra Z50-A-11H: Intel Core i5-4200U, 15.60", 1.8 kg
Extern testrapport » Toshiba Tecra Z50-A-11H
HP Spectre 13-3010ea: Intel Core i5-4200U, 13.30", 1.5 kg
Extern testrapport » HP Spectre 13-3010ea
Asus Transformer Book T300LA-C4001H: Intel Core i5-4200U, 13.30", 1.9 kg
Extern testrapport » Asus Transformer Book T300LA-C4001H
Fujitsu Lifebook U574: Intel Core i5-4200U, 13.30", 1.6 kg
Extern testrapport » Fujitsu Lifebook U574
Toshiba Satellite L50-B-1DV: Intel Core i5-4200U, 15.60", 2.2 kg
Extern testrapport » Toshiba Satellite L50-B-1DV
Toshiba Tecra Z40-A-121: Intel Core i7-4600U, 14.00", 1.5 kg
Extern testrapport » Toshiba Tecra Z40-A-121
Asus B551LA-CN018G: Intel Core i5-4200U, 15.60", 2.5 kg
Extern testrapport » Asus B551LA-CN018G
Toshiba Kirabook 2014: Intel Core i7-4500U, 13.30", 1.3 kg
Extern testrapport » Toshiba Kirabook 2014
Microsoft Surface Pro 3: Intel Core i5-4300U, 12.00", 0.8 kg
Extern testrapport » Microsoft Surface Pro 3
Toshiba Satellite L50-B-1DJ: Intel Core i3-4005U, 15.60", 2.2 kg
Extern testrapport » Toshiba Satellite L50-B-1DJ
Sony Vaio Fit Multi-Flip SV-F13N1J2R: Intel Core i3-4005U, 13.30", 1.3 kg
Extern testrapport » Sony Vaio Fit Multi-Flip SV-F13N1J2R
HP EliteBook 820 G1-F1R78AW: Intel Core i5-4300U, 12.50", 1.5 kg
Extern testrapport » HP EliteBook 820 G1-F1R78AW
Fujitsu Lifebook T904: Intel Core i7-4600U, 13.30", 1.6 kg
Extern testrapport » Fujitsu Lifebook T904
Samsung ATIV Book 9 900X3G-K01: Intel Core i5-4200U, 13.30", 1.1 kg
Extern testrapport » Samsung ATIV Book 9 900X3G-K01
Acer Aspire V5-561-6607: Intel Core i5-4200U, 15.60", 2.5 kg
Extern testrapport » Acer Aspire V5-561-6607
Dell Latitude 13 3340 Education Series: Intel Core i5-4200U, 13.30", 1.8 kg
Extern testrapport » Dell Latitude 3340 i5
Toshiba Tecra Z50-A1503: Intel Core i7-4600U, 15.60", 1.5 kg
Extern testrapport » Toshiba Tecra Z50-A1503
Fujitsu LifeBook U904-0M75A1DE: Intel Core i5-4200U, 14.00", 1.4 kg
Extern testrapport » Fujitsu LifeBook U904-0M75A1DE
Acer TravelMate P645-M-5420G12Tkk: Intel Core i5-4200U, 14.00", 1.5 kg
Extern testrapport » Acer TravelMate P645-M-5420G12Tkk
Toshiba Portege Z30-A-M5S: Intel Core i5-4200U, 13.30", 1.2 kg
Extern testrapport » Toshiba Portege Z30-A-M5S
Lenovo IdeaPad Yoga 2 13-59402183: Intel Core i3-4010U, 13.30", 1.6 kg
Extern testrapport » Lenovo IdeaPad Yoga 2 13-59402183
Toshiba Tecra Z50-A-11C: Intel Core i7-4600U, 15.60", 1.7 kg
Extern testrapport » Toshiba Tecra Z50-A-11C
Lenovo ThinkPad X1 Carbon Touch 20A8-003UGE: Intel Core i7-4600U, 14.00", 1.4 kg
Extern testrapport » Lenovo ThinkPad X1 Carbon Touch 20A8-003UGE
Lenovo IdeaPad Yoga 2 13 inch-59402636: Intel Core i5-4200U, 13.30", 1.6 kg
Extern testrapport » Lenovo IdeaPad Yoga 2 13 inch-59402636
Eurocom Armadillo 14 inch: Intel Core i7-4500U, 14.00", 2 kg
Extern testrapport » Eurocom Armadillo 14 inch
Asus Transformer Book Trio TX201LA-CQ026H: Intel Core i5-4200U, 11.60", 1.7 kg
Extern testrapport » Asus Transformer Book Trio TX201LA-CQ026H
HP Spectre 13 Pro: Intel Core i5-4200U, 13.00", 1.5 kg
Extern testrapport » HP Spectre 13 Pro
HP EliteBook Revolve 810 G2: Intel Core i5-4300U, 11.60", 1.3 kg
Extern testrapport » HP EliteBook Revolve 810 G2
Dell Latitude E5540: Intel Core i5-4300U, 15.60", 2.4 kg
Extern testrapport » Dell Latitude E5540
Acer Aspire S7-392-6807: Intel Core i5-4200U, 13.30", 1.3 kg
Extern testrapport » Acer Aspire S7-392-6807
Asus VivoBook V451LA-DS51T: Intel Core i5-4200U, 14.00", 2.2 kg
Extern testrapport » Asus VivoBook V451LA-DS51T
Asus UX301LA-DH51T: Intel Core i5-4200U, 13.30", 1.2 kg
Extern testrapport » Asus UX301LA-DH51T
Asus UX32L : Intel Core i5-4200U, 13.30", 1.5 kg
Extern testrapport » Asus UX32L
HP Spectre 13-3000eo: Intel Core i5-4200U, 13.30", 1.5 kg
Extern testrapport » HP Spectre 13-3000eo
Toshiba Portege Z30-A-12U: Intel Core i7-4500U, 13.30", 1.2 kg
Extern testrapport » Toshiba Portege Z30-A-12U
Sony Vaio Flip 15 SV-F15N1L2ES: Intel Core i5-4200U, 15.60", 2.3 kg
Extern testrapport » Sony Vaio Flip 15 SV-F15N1L2ES
Acer Aspire R7-572-6423: Intel Core i5-4200U, 15.60", 2.4 kg
Extern testrapport » Acer Aspire R7-572-6423
Toshiba Satellite Z30-A-134: Intel Core i5-4200U, 13.30", 1.2 kg
Extern testrapport » Toshiba Satellite Z30-A-134
Fujitsu LifeBook S904: Intel Core i7-4600U, 13.30", 1.5 kg
Extern testrapport » Fujitsu LifeBook S904
Fujitsu LifeBook U904-0M0006PL: Intel Core i5-4300U, 14.00", 1.4 kg
Extern testrapport » Fujitsu LifeBook U904-0M0006PL
Asus Transformer Book Trio TX201LA-CQ003H: Intel Core i7-4500U, 11.60", 1.7 kg
Extern testrapport » Asus Transformer Book Trio TX201LA-CQ003H
HP EliteBook Folio 1040 G1: Intel Core i5-4300U, 14.00", 1.6 kg
Extern testrapport » HP EliteBook Folio 1040 G1
HP Spectre 13-3090EF: Intel Core i5-4200U, 13.30", 1.5 kg
Extern testrapport » HP Spectre 13-3090EF
Sony VAIO 13 SV-F13N1A4E: Intel Core i5-4200U, 13.30", 1.3 kg
Extern testrapport » Sony VAIO 13 SV-F13N1A4E
Toshiba Portege Z30-A-12N: Intel Core i5-4200U, 13.00", 1.2 kg
Extern testrapport » Toshiba Portege Z30-A-12N
Asus UX301LA-DH71T: Intel Core i7-4558U, 13.30", 1.2 kg
Extern testrapport » Asus UX301LA-DH71T
Lenovo ThinkPad X1 Carbon 2014: Intel Core i5-4200U, 14.00", 1.4 kg
Extern testrapport » Lenovo ThinkPad X1 Carbon 2014
Sony Vaio Tap 21 SV-T21227CXB: Intel Core i7-4500U, 21.50", 3.9 kg
Extern testrapport » Sony Vaio Tap 21 SV-T21227CXB
Toshiba Portege Z30-A-12T: Intel Core i5-4200U, 13.30", 1.2 kg
Extern testrapport » Toshiba Portege Z30-A-12T
Lenovo ThinkPad T440s 20AQ-0069GE: Intel Core i7-4600U, 14.00", 1.6 kg
Extern testrapport » Lenovo ThinkPad T440s 20AQ-0069GE
Toshiba Satellite M50-A-11Q: Intel Core i3-4005U, 15.60", 2.2 kg
Extern testrapport » Toshiba Satellite M50-A-11Q
Lenovo ThinkPad X240-20AL007YGE: Intel Core i5-4200U, 12.50", 1.4 kg
Extern testrapport » Lenovo ThinkPad X240-20AL007YGE
Asus Transformer Book Trio TX201LA-CQ004: Intel Core i5-4200U, 11.60", 1.7 kg
Extern testrapport » Asus Transformer Book Trio TX201LA-CQ004
Sony Vaio Fit multi-flip SV-F13N1X2E/S: Intel Core i7-4500U, 13.00", 1.4 kg
Extern testrapport » Sony Vaio Fit multi-flip SV-F13N1X2E/S
Dell XPS 13-9333: Intel Core i5-4200U, 13.30", 1.4 kg
Extern testrapport » Dell XPS 13-9333
Toshiba Satellite U50t-A-10F: Intel Core i5-4200U, 15.60", 2.4 kg
Extern testrapport » Toshiba Satellite U50t-A-10F
HP Spectre 13-3010eg: Intel Core i7-4500U, 13.30", 1.5 kg
Extern testrapport » HP Spectre 13-3010eg
Toshiba Portege Z30-A1302: Intel Core i7-4600U, 13.30", 1.2 kg
Extern testrapport » Toshiba Portege Z30-A1302
Fujitsu Lifebook U904: Intel Core i7-4600U, 14.00", 1.4 kg
Extern testrapport » Fujitsu Lifebook U904
Toshiba Kirabook 2014: Intel Core i5-4200U, 13.30", 1.4 kg
Extern testrapport » Toshiba Kirabook 2014
Sony Vaio Pro SVP1321M2E: Intel Core i5-4200U, 13.30", 1 kg
Extern testrapport » Sony Vaio Pro SVP1321M2E
Dell Latitude E7240 Touch: Intel Core i5-4300U, 12.50", 1.4 kg
Extern testrapport » Dell Latitude E7240 Touch
Acer Aspire S7-392-9460: Intel Core i7-4500U, 13.30", 1.3 kg
Extern testrapport » Acer Aspire S7-392-9460
Asus Transformer Book T300LA-C4002H: Intel Core i3-4010U, 13.30", 2 kg
Extern testrapport » Asus Transformer Book T300LA-C4002H
Acer Aspire S7-392-54208G12tws: Intel Core i5-4200U, 13.30", 1.3 kg
Extern testrapport » Acer Aspire S7-392-54208G12tws
Toshiba Satellite U50t-A-10H: Intel Core i5-4200U, 15.60", 2.2 kg
Extern testrapport » Toshiba Satellite U50t-A-10H
Toshiba Satellite E45t-A4300: Intel Core i5-4200U, 14.00", 2 kg
Extern testrapport » Toshiba Satellite E45t-A4300
Toshiba Portege Z30-A1301: Intel Core i5-4300U, 13.30", 1.2 kg
Extern testrapport » Toshiba Portege Z30-A1301
Acer Aspire E1-572-34014G50Mnkk: Intel Core i3-4010U, 15.60", 2.2 kg
Extern testrapport » Acer Aspire E1-572-34014G50Mnkk
Sony Vaio Flip 14 SV-F14N16CXB: Intel Core i7-4500U, 14.00", 1.9 kg
Extern testrapport » Sony Vaio Flip 14 SV-F14N16CXB
Asus Transformer Book Trio TX201LA: Intel Core i7-4500U, 11.60", 1.7 kg
Extern testrapport » Asus Transformer Book Trio TX201LA
Lenovo ThinkPad Yoga: Intel Core i5-4200U, 12.50", 1.6 kg
Extern testrapport » Lenovo ThinkPad Yoga
Asus UX301LA-C4006H: Intel Core i7-4500U, 13.30", 1.2 kg
Extern testrapport » Asus UX301LA-C4006H
Lenovo IdeaPad Flex 15-59393845: Intel Core i5-4200U, 15.60", 2.2 kg
Extern testrapport » Lenovo IdeaPad Flex 15-59393845
Sony Vaio Fit multi-flip SV-F13N1L2E/S : Intel Core i5-4200U, 13.30", 1.3 kg
Extern testrapport » Sony Vaio Fit multi-flip SV-F13N1L2E/S
Samsung ATIV 940X3G-K01NL: Intel Core i5-4200U, 13.30", 2.4 kg
Extern testrapport » Samsung ATIV 940X3G-K01NL
Samsung ATIV 940X3G-K01PL: Intel Core i5-4200U, 13.30", 1.3 kg
Extern testrapport » Samsung ATIV 940X3G-K01PL
HP EliteBook 820 G1: Intel Core i5-4200U, 12.50", 1.3 kg
Extern testrapport » HP EliteBook 820 G1
Dell Latitude E7440: Intel Core i5-4300U, 14.00"
Extern testrapport » Dell Latitude E7440
Sony Vaio Flip 13 SV-F13N17PXB: Intel Core i7-4500U, 13.30", 1.3 kg
Extern testrapport » Sony Vaio Flip 13 SV-F13N17PXB
Lenovo ThinkPad X240: Intel Core i7-4600U, 12.50", 1.5 kg
Extern testrapport » Lenovo ThinkPad X240
Sony Vaio SV-F13N1Y9E/S: Intel Core i7-4500U, 13.30", 1.2 kg
Extern testrapport » Sony Vaio SV-F13N1Y9E/S
Toshiba Tecra Z40-A1401: Intel Core i5-4300U, 14.00", 1.5 kg
Extern testrapport » Toshiba Tecra Z40-A1401
Toshiba Tecra Z40-A1402: Intel Core i7-4600U, 14.00", 1.5 kg
Extern testrapport » Toshiba Tecra Z40-A1402
Sony Vaio Flip 13 SV-F13N13CXB: Intel Core i5-4200U, 13.30", 1.3 kg
Extern testrapport » Sony Vaio Flip 13 SV-F13N13CXB
Samsung ATIV 940X3G-K01HU: Intel Core i5-4200U, 13.30", 1.3 kg
Extern testrapport » Samsung ATIV 940X3G-K01HU
Sony Vaio Duo 13 SVD1321M2E: Intel Core i5-4200U, 13.30", 1.3 kg
Extern testrapport » Sony Vaio Duo 13 SVD1321M2E
Samsung ATIV 940X3G-K01SE: Intel Core i5-4200U, 13.30", 1.4 kg
Extern testrapport » Samsung ATIV 940X3G-K01SE
Dell Latitude E7240: Intel Core i5-4200U, 12.50", 1.3 kg
Extern testrapport » Dell Latitude E7240
Asus UX301LA-C4019H: Intel Core i5-4200U, 13.30", 1.2 kg
Extern testrapport » Asus UX301LA-C4019H
Lenovo IdeaPad U330-59372367: Intel Core i5-4200U, 13.30", 1.7 kg
Extern testrapport » Lenovo IdeaPad U330-59372367
Dell Inspiron 14-7437: Intel Core i7-4500U, 14.00", 1.7 kg
Extern testrapport » Dell Inspiron 14-7437
Acer Aspire S7-392-6832: Intel Core i5-4200U, 13.30", 1.3 kg
Extern testrapport » Acer Aspire S7-392-6832
Medion Akoya S6212T: Intel Core i3-4010U, 15.60", 2.6 kg
Extern testrapport » Medion Akoya S6212T
Sony Vaio Flip 14 SV-F14N13CXB: Intel Core i5-4200U, 14.10", 1.9 kg
Extern testrapport » Sony Vaio Flip 14 SV-F14N13CXB
Samsung 940X3G-K01DE: Intel Core i5-4200U, 13.30", 1.3 kg
Extern testrapport » Samsung 940X3G-K01DE
Sony Vaio Flip 15 SV-F15N190X: Intel Core i7-4500U, 15.60", 2.3 kg
Extern testrapport » Sony Vaio Flip 15 SV-F15N190X
Toshiba Satellite L50T-A-130: Intel Core i5-4200U, 15.60", 2.6 kg
Extern testrapport » Toshiba Satellite L50T-A-130
Asus VivoBook S551LA-CJ022H: Intel Core i3-4010U, 15.60", 2.4 kg
Extern testrapport » Asus VivoBook S551LA-CJ022H
Acer Aspire E1-572-34016G75Dnkk: Intel Core i3-4010U, 15.60", 2.4 kg
Extern testrapport » Acer Aspire E1-572-34016G75Dnkk
Samsung ATIV Book 9 Plus: Intel Core i5-4200U, 13.30", 1.4 kg
Extern testrapport » Samsung ATIV Book 9 Plus
Lenovo IdeaPad Flex 14-59395501: Intel Core i5-4200U, 14.00", 1.9 kg
Extern testrapport » Lenovo IdeaPad Flex 14-59395501
Sony Vaio SV-P1321SCXS: Intel Core i7-4500U, 13.30", 1.1 kg
Extern testrapport » Sony Vaio SV-P1321SCXS
Samsung ATIV 940X3G-K01FR: Intel Core i5-4200U, 13.30", 1.4 kg
Extern testrapport » Samsung ATIV 940X3G-K01FR
Toshiba Satellite U50t-A-100: Intel Core i5-4200U, 15.60", 2.4 kg
Extern testrapport » Toshiba Satellite U50t-A-100
Lenovo ThinkPad T440s 20AQ-S00500: Intel Core i5-4200U, 14.00", 1.6 kg
Extern testrapport » Lenovo ThinkPad T440s 20AQ-S00500
Dell Inspiron 15R-5537: Intel Core i7-4500U, 15.60", 2.3 kg
Extern testrapport » Dell Inspiron 15R-5537
Lenovo ThinkPad X240s: Intel Core i5-4200U, 12.50", 1.3 kg
Extern testrapport » Lenovo ThinkPad X240s
HP ProBook 430-G1: Intel Core i5-4200U, 13.30", 1.6 kg
Extern testrapport » HP ProBook 430-G1
Acer Aspire V7-582P-6673: Intel Core i5-4200U, 15.60", 2.2 kg
Extern testrapport » Acer Aspire V7-582P-6673
Microsoft Surface Pro 2: Intel Core i5-4200U, 10.60", 0.9 kg
Extern testrapport » Microsoft Surface Pro 2
HP Envy Rove 20: Intel Core i3-4010U, 20.00", 5.4 kg
Extern testrapport » HP Envy Rove 20
Sony Vaio SV-P1321WSNB: Intel Core i5-4200U, 13.30", 1.1 kg
Extern testrapport » Sony Vaio SV-P1321WSNB
Toshiba Satellite E45t-A4200: Intel Core i5-4200U, 14.00", 2 kg
Extern testrapport » Toshiba Satellite E45t-A4200
Sony Vaio Duo 13 SV-D1321L2EW: Intel Core i5-4200U, 13.30", 1.3 kg
Extern testrapport » Sony Vaio Duo 13 SV-D1321L2EW
Samsung ATIV 940X3G-K01US: Intel Core i5-4200U, 13.30", 1.4 kg
Extern testrapport » Samsung ATIV 940X3G-K01US
HP Envy TouchSmart 14t-k000: Intel Core i5-4200U, 14.00", 2 kg
Extern testrapport » HP Envy TouchSmart 14t-k000
Lenovo Yoga 2 Pro: Intel Core i5-4200U, 13.30", 1.4 kg
Extern testrapport » Lenovo IdeaPad Yoga 2 Pro
Sony Vaio Pro SVP1321M9RB: Intel Core i5-4200U, 13.30", 1.1 kg
Extern testrapport » Sony Vaio Pro SVP1321M9RB
Acer Aspire S7-392-74508G25tws: Intel Core i7-4500U, 13.30", 1.3 kg
Extern testrapport » Acer Aspire S7-392-74508G25tws
Asus UX31LA: Intel Core i7-4500U, 13.30", 1.5 kg
Extern testrapport » Asus UX31LA
Sony Vaio Duo 13 SV-D1321M2R: Intel Core i5-4200U, 13.30", 1.4 kg
Extern testrapport » Sony Vaio Duo 13 SV-D1321M2R
Samsung ATIV 940X3G-K03DE: Intel Core i5-4200U, 13.30", 1.3 kg
Extern testrapport » Samsung ATIV 940X3G-K03DE
Sony Vaio Duo 13 SV-D1321Z9R: Intel Core i7-4500U, 13.30", 1.4 kg
Extern testrapport » Sony Vaio Duo 13 SV-D1321Z9R
Sony Vaio SV-P132A1CM: Intel Core i7-4500U, 13.30", 1.1 kg
Extern testrapport » Sony Vaio SV-P132A1CM
Sony Vaio Pro 13 SVP-1321C5ER: Intel Core i7-4500U, 13.30", 1.1 kg
Extern testrapport » Sony Vaio Pro 13 SVP-1321C5ER
Acer Aspire M5-583P-6428: Intel Core i5-4200U, 15.60", 2.4 kg
Extern testrapport » Acer Aspire M5-583P-6428
Acer Aspire E1-572-6870: Intel Core i5-4200U, 15.60", 2.3 kg
Extern testrapport » Acer Aspire E1-572-6870
Sony Vaio SV-P1121C5ER2: Intel Core i7-4500U, 11.60", 0.9 kg
Extern testrapport » Sony Vaio SV-P1121C5ER2
Sony Vaio Pro SVP1321L1EBI.G4: Intel Core i5-4200U, 13.30", 1 kg
Extern testrapport » Sony Vaio Pro SVP1321L1EBI.G4
Sony Vaio Pro 11 SVP121M2EB.G4: Intel Core i5-4200U, 11.60", 0.9 kg
Extern testrapport » Sony Vaio Pro 11 SVP121M2EB.G4
Dell XPS 12-9Q33: Intel Core i5-4200U, 12.50", 1.5 kg
Extern testrapport » Dell XPS 12-9Q33
Sony Vaio SV-P1121M2E: Intel Core i5-4200U, 11.60", 0.9 kg
Extern testrapport » Sony Vaio SV-P1121M2E
Sony Vaio Pro SVP1321X9EB: Intel Core i7-4500U, 13.30", 0.9 kg
Extern testrapport » Sony Vaio Pro SVP1321X9EB
Sony Vaio Duo 13 SV-D1321Z9EB: Intel Core i7-4500U, 13.30", 1.3 kg
Extern testrapport » Sony Vaio Duo 13 SV-D1321Z9EB
Sony Vaio SV-P13213CGB: Intel Core i5-4200U, 13.30", 1.1 kg
Extern testrapport » Sony Vaio SV-P13213CGB
Sony Vaio SV-P13213CXB: Intel Core i5-4200U, 13.30", 1.1 kg
Extern testrapport » Sony Vaio SV-P13213CXB
Sony Vaio SV-P1321Z9EB: Intel Core i7-4500U, 13.30", 1.1 kg
Extern testrapport » Sony Vaio SV-P1321Z9EB
Acer Aspire S7-392-6411: Intel Core i5-4200U, 13.30", 1.3 kg
Extern testrapport » Acer Aspire S7-392-6411
Samsung ATIV Q: unknown, 13.30", 1.3 kg
Extern testrapport » Samsung ATIV Q
Sony Vaio SV-P1321BPXB: Intel Core i7-4500U, 13.30", 1.1 kg
Extern testrapport » Sony Vaio SV-P1321BPXB
Sony Vaio Duo 13 SV-D13213CXB: Intel Core i5-4200U, 13.30", 1.4 kg
Extern testrapport » Sony Vaio Duo 13 SV-D13213CXB
Sony Vaio SV-P11215PXB: Intel Core i7-4500U, 11.60", 0.9 kg
Extern testrapport » Sony Vaio SV-P11215PXB