Notebookcheck Logo

NVIDIA GeForce RTX 3070 Ti Laptop GPU

NVIDIA GeForce RTX 3070 Ti Laptop GPU

De Nvidia GeForce RTX 3070 Ti Laptop GPU (mobiel, GN20-E6, Max-P, Max-Q) is een mobiele grafische kaart voor notebooks en de opfrisser van de RTX 3070. Hij werd begin 2021 aangekondigd op CES en is gebaseerd op dezelfde GA104 Ampere chip als de oude RTX 3070 Laptop. Vergeleken met de oude kaart biedt de nieuwere 15% meer shaders maar minder kloksnelheid. Hij zal nog steeds beschikken over de 256 Bit geheugenbus en 8 GB GDDR6. De RTX 3070ti is verkrijgbaar in verschillende vermogensvarianten, variërend van 80 Watt TGP met een Boost klok van 1035 MHz tot 125 Watt modellen met een Boost klok van 1485 MHz.

Er is geen Max-Q variant meer (voorheen gebruikt voor de low power varianten) maar elke OEM kan ervoor kiezen om Max-Q technologieën te implementeren (Dynamic Boost, Whispermode).

De prestaties zijn afhankelijk van de TGP instelling en de koeling van de laptop. Gemiddeld zou het ergens tussen de oude RTX 3070 Mobile en RTX 3080 Mobile moeten liggen (bij vergelijkbare TDP-instellingen). De kaart is dan ook het meest geschikt voor QHD gaming in max details (voor veeleisende games als Cyberpunk 2077). Minder veeleisende games zoals de Farming Simulator 22 of oudere games zouden ook in 4K moeten draaien met max. detail instellingen.

De GA104 chip biedt 6.144 FP32 ALUs waarvan de helft ook INT32 instructies kan uitvoeren (dus 3.072 INT32 ALUs). De RTX 3070 Ti zal echter niet alle ALU's op de chip gebruiken. Met Turing zouden alle shaders nog steeds FP32 of INT32 instructies kunnen uitvoeren. De raytracing en tensor cores op de chip zijn volgens Nvidia ook verbeterd. De RTX 3070 Ti mobiele serie gebruikt 5.888 van de 6.144 cores. De Ampere-chips bevatten ook een verbeterde 5e generatie video-encoder (NVENC voor H.264 en H.265) en een 7e generatie decoder (voor diverse formaten nu inclusief AV1).

De GA104 chip wordt door Samsung gefabriceerd in 8nm (8N), wat de 7nm node bij TSMC (o.a. gebruikt door AMD en ook voor de professionele GA100 Ampere chip) niet helemaal kan bijbenen.

GeForce RTX 3000 Serie

NVIDIA GeForce RTX 3090 Ti 10752 @ 1.56 - 1.86 GHz384 bit @ 21000 MHz
NVIDIA GeForce RTX 3090 10496 @ 1.4 - 1.7 GHz384 bit @ 19500 MHz
NVIDIA GeForce RTX 3080 Ti 10240 @ 1.37 - 1.67 GHz384 bit @ 19000 MHz
NVIDIA GeForce RTX 3080 12 GB 8960/ cores @ 1.26 - 1.71 GHz384 bit @ 19000 MHz
NVIDIA GeForce RTX 3080 8704 @ 1.45 - 1.71 GHz320 bit @ 19000 MHz
GeForce RTX 3070 Ti 6144 @ 1.58 - 1.77 GHz256 bit @ 19000 MHz
GeForce RTX 3080 Ti Laptop GPU 7424 @ 0.98 - 1.59 GHz256 bit @ 14000 MHz
NVIDIA GeForce RTX 3070 5888 @ 1.5 - 1.73 GHz256 bit @ 14000 MHz
GeForce RTX 3080 Laptop GPU 6144 @ 0.78 - 1.25 GHz256 bit @ 14000 MHz
NVIDIA GeForce RTX 3060 Ti 4864 @ 1.41 - 1.67 GHz256 bit @ 14000 MHz
GeForce RTX 3070 Ti Laptop GPU 5888 @ 0.92 - 1.48 GHz256 bit @ 14000 MHz
GeForce RTX 3070 Laptop GPU 5120 @ 0.78 - 1.29 GHz256 bit @ 14000 MHz
NVIDIA GeForce RTX 3060 3584 @ 1.32 - 1.78 GHz192 bit @ 15000 MHz
GeForce RTX 3080 Max-Q 6144 @ 0.78 - 1.25 GHz256 bit @ 6000 MHz
GeForce RTX 3070 Max-Q 5120 @ 1.29 GHz256 bit
GeForce RTX 3060 Laptop GPU 3840 @ 0.82 - 1.7 GHz192 bit @ 14000 MHz
GeForce RTX 3060 Max-Q 3840 @ 1.28 GHz192 bit
NVIDIA GeForce RTX 3050 2560 @ 1.55 - 1.78 GHz128 Bit bit @ 1750 MHz
GeForce RTX 3050 Ti Laptop GPU 2560 @ 1.22 - 1.49 GHz128 bit @ 12000 MHz
GeForce RTX 3050 6GB Laptop GPU 2560 @ 1.24 - 1.49 GHz96 bit @ 12000 MHz
GeForce RTX 3050 A Laptop GPU 1792 64 bit
GeForce RTX 3050 4GB Laptop GPU 2048 @ 1.24 - 1.5 GHz128 bit @ 12000 MHz
CodenaamGN20-E6
ArchitectuurAmpere
Pipelines5888 - verenigd
TMUs184
ROPs96
Raytracing Cores46
Tensor / AI Cores184
Core-snelheid915 - 1480 (Boost) MHz
Geheugensnelheid14000 effective = 1750 MHz
Geheugenbusbreedte256 bit
GeheugentypeGDDR6
Max. hoeveelheid geheugen8 GB
Gedeeld geheugennee
Memory Bandwidth448 GB/s
APIDirectX 12_2, Shader 6.7, OpenGL 4.6
Stroomverbruik125 Watt (80 - 125 Watt TGP)
Aantal Transistoren17.4 Billion
Die Size 392 mm²
technologie8 nm
PCIe4.0
DisplaysHDMI 2.1, DisplayPort 1.4a
FaciliteitenNVIDIA DLSS, NVIDIA Reflex, Resizable BAR, NVIDIA Broadcast, NVIDIA Ansel, NVIDIA ShadowPlay®, NVIDIA G-SYNC®, Advanced Optimus, Nvidia Max-Q, Dynamic Boost, VR-ready, Nvidia Omniverse
Laptop Groottegroot
Aangekondigde datum04.01.2022

Benchmarks

Performance Rating - 3DMark 11 + Fire Strike + Time Spy
12.6 pt (38%)
3DMark - 3DMark Time Spy Score
min: 7369     gem: 10556     mediaan: 10673 (31%)     max: 12239 Points
3DMark - 3DMark Time Spy Graphics
min: 8142     gem: 10478     mediaan: 10462 (28%)     max: 12324 Points
3DMark - 3DMark Ice Storm Unlimited Graphics
min: 180384     gem: 516185     mediaan: 581927 (59%)     max: 646153 Points
3DMark - 3DMark Ice Storm Extreme Graphics
min: 73475     gem: 116904     mediaan: 122313 (15%)     max: 154923 Points
3DMark - 3DMark Cloud Gate Score
min: 19528     gem: 55293     mediaan: 58464 (62%)     max: 68738 Points
3DMark - 3DMark Cloud Gate Graphics
min: 33126     gem: 130456     mediaan: 141689 (37%)     max: 181005 Points
3DMark - 3DMark Fire Strike Standard Score
min: 13606     gem: 23800     mediaan: 24043 (42%)     max: 28492 Points
3DMark - 3DMark Fire Strike Standard Graphics
min: 22612     gem: 27554     mediaan: 27776 (31%)     max: 32550 Points
3DMark - 3DMark Ice Storm Graphics
min: 71049     gem: 116608     mediaan: 124203 (15%)     max: 154571 Points
3DMark - 3DMark Wild Life Unlimited
min: 65778     gem: 68001     mediaan: 65913 (33%)     max: 72313 Points
3DMark - 3DMark Wild Life Extreme Unlimited
min: 18372     gem: 21359     mediaan: 21676.5 (25%)     max: 23709 Points
3DMark - 3DMark Night Raid
min: 35985     gem: 42868     mediaan: 42099.5 (40%)     max: 51287 Points
3DMark - 3DMark Night Raid Graphics Score
min: 46335     gem: 70518     mediaan: 73622.5 (28%)     max: 88491 Points
3DMark 11 - 3DM11 Performance Score
min: 14168     gem: 29851     mediaan: 30737 (43%)     max: 34703 Points
3DMark 11 - 3DM11 Performance GPU
min: 13799     gem: 35944     mediaan: 36969.5 (32%)     max: 42569 Points
AMD Radeon HD 6250
171.8 -100%
...
32846 -9%
33169 -8%
33497 -7%
34188 -5%
34842 -3%
35101 -2%
NVIDIA GeForce RTX 2080 Super Mobile
35153 -2%
35286 -2%
35743 -1%
NVIDIA GeForce RTX 3070 Ti Laptop GPU
35944
36101 0%
36164 1%
36378 1%
37375 4%
37918 5%
NVIDIA GeForce RTX 3080 Laptop GPU
38259 6%
39402 10%
40391 12%
40410 12%
...
59943 67%
max:
105410 193%
0%
100%
3DMark Vantage
3DM Vant. Perf. total +
3DMark Vantage - 3DM Vant. Perf. total
81895 Points (24%)
3DM Vant. Perf. GPU no PhysX +
3DMark Vantage - 3DM Vant. Perf. GPU no PhysX
85672 Points (47%)
62 -100%
...
76250 -11%
NVIDIA GeForce RTX 2080 Super Mobile
77180 -10%
77533 -10%
77766 -9%
79140 -8%
80346 -6%
80643 -6%
82368 -4%
NVIDIA GeForce RTX 3070 Laptop GPU
85013 -1%
NVIDIA GeForce RTX 3070 Ti Laptop GPU
85672
86536 1%
88394 3%
NVIDIA GeForce RTX 3080 Laptop GPU
90128 5%
96677 13%
97664 14%
102426 20%
103306 21%
129977 52%
132443 55%
max:
170928 100%
0%
100%
3DMark 06 3DMark 06 - Standard 1280x1024 +
3DMark 06
min: 43453     gem: 49439     mediaan: 50062 (65%)     max: 54178 Points
Blender - Blender 3.3 Classroom CUDA *
min: 36     gem: 41.4     mediaan: 41 (6%)     max: 46 Seconds
Blender - Blender 3.3 Classroom OPTIX *
min: 22     gem: 25.3     mediaan: 25 (9%)     max: 30 Seconds
Blender - Blender 3.3 Classroom HIP *
380 Seconds (31%)
SPECviewperf 13 specvp13 sw-04 +
SPECviewperf 13 - specvp13 sw-04
103.4 fps (28%)
specvp13 snx-03 +
SPECviewperf 13 - specvp13 snx-03
19.2 fps (2%)
specvp13 showcase-02 +
SPECviewperf 13 - specvp13 showcase-02
130.4 fps (28%)
specvp13 medical-02 +
SPECviewperf 13 - specvp13 medical-02
67.4 fps (14%)
specvp13 maya-05 +
SPECviewperf 13 - specvp13 maya-05
270.4 fps (31%)
specvp13 energy-02 +
SPECviewperf 13 - specvp13 energy-02
23 fps (7%)
specvp13 creo-02 +
SPECviewperf 13 - specvp13 creo-02
204.5 fps (30%)
specvp13 catia-05 +
SPECviewperf 13 - specvp13 catia-05
150.6 fps (17%)
specvp13 3dsmax-06 +
SPECviewperf 13 - specvp13 3dsmax-06
195.1 fps (34%)
SPECviewperf 2020 specvp2020 solidworks-05 1080p +
SPECviewperf 2020 - specvp2020 solidworks-05 1080p
226 fps (44%)
specvp2020 snx-04 1080p +
SPECviewperf 2020 - specvp2020 snx-04 1080p
min: 19.92     gem: 20.2     mediaan: 20.2 (3%)     max: 20.4 fps
specvp2020 medical-03 1080p +
SPECviewperf 2020 - specvp2020 medical-03 1080p
min: 32.08     gem: 32.6     mediaan: 32.6 (23%)     max: 33.1 fps
specvp2020 maya-06 1080p +
specvp2020 energy-03 1080p +
SPECviewperf 2020 - specvp2020 energy-03 1080p
min: 23.6     gem: 23.7     mediaan: 23.7 (16%)     max: 23.8 fps
specvp2020 creo-03 1080p +
SPECviewperf 2020 - specvp2020 creo-03 1080p
95 fps (47%)
specvp2020 catia-06 1080p +
SPECviewperf 2020 - specvp2020 catia-06 1080p
min: 63.58     gem: 64.5     mediaan: 64.5 (40%)     max: 65.5 fps
specvp2020 3dsmax-07 1080p +
SPECviewperf 2020 - specvp2020 3dsmax-07 1080p
min: 95.55     gem: 97     mediaan: 97 (30%)     max: 98.5 fps
Cinebench R10 Cinebench R10 Shading (32bit) +
Cinebench R10 - Cinebench R10 Shading (32bit)
min: 15906     gem: 17947     mediaan: 17947 (13%)     max: 19988 punten
Cinebench R11.5 Cinebench R11.5 OpenGL 64 Bit +
Cinebench R11.5 - Cinebench R11.5 OpenGL 64 Bit
min: 93.54     gem: 132     mediaan: 132 (43%)     max: 170.5 fps
Cinebench R15
Cinebench R15 OpenGL 64 Bit +
Cinebench R15 - Cinebench R15 OpenGL 64 Bit
min: 98.7     gem: 196.9     mediaan: 201.5 (12%)     max: 276 fps
Cinebench R15 OpenGL Ref. Match 64 Bit +
Cinebench R15 - Cinebench R15 OpenGL Ref. Match 64 Bit
min: 97.8     gem: 99.6     mediaan: 99.6 (100%)     max: 99.62 %
LuxMark v2.0 64Bit - LuxMark v2.0 Room GPU
3623 Samples/s (16%)
LuxMark v2.0 64Bit - LuxMark v2.0 Sala GPU
8022 Samples/s (14%)
ComputeMark v2.1 - ComputeMark v2.1 Result
22796 punten (25%)
Power Consumption - Furmark Stress Test Power Consumption - external Monitor *
min: 123.6     gem: 175.1     mediaan: 190 (27%)     max: 211 Watt
0153045607590105120135150165180195210225Tooltip
Power Consumption - The Witcher 3 Power Consumption - external Monitor *
min: 115     gem: 181     mediaan: 191 (27%)     max: 234 Watt
0153045607590105120135150165180195210225240Tooltip
Power Consumption - Witcher 3 Power Consumption *
min: 144     gem: 190     mediaan: 196.1 (43%)     max: 237 Watt
0153045607590105120135150165180195210225240255Tooltip
Power Consumption - Witcher 3 ultra Power Efficiency
min: 0.424     gem: 0.5     mediaan: 0.5 (48%)     max: 0.691 fps per Watt
0153045607590105120135150165180195Tooltip
Power Consumption - Witcher 3 ultra Power Efficiency - external Monitor
min: 0.4399     gem: 0.6     mediaan: 0.6 (46%)     max: 0.97 fps per Watt
Emissions Witcher 3 Fan Noise +
Emissions - Witcher 3 Fan Noise
min: 42.1     gem: 52     mediaan: 52.2 (84%)     max: 62.48 dB(A)
Clock Speed - GPU Clock Witcher 3 ultra
min: 1155     gem: 1341     mediaan: 1393 (55%)     max: 1410 MHz
Clock Speed - GPU Clock Speed Furmark
min: 735     gem: 1155     mediaan: 1154.5 (46%)     max: 1574 MHz
- Benchmarkresultaten voor deze videokaart
- Gemiddelde benchmarkresultaten voor deze videokaart
* Kleinere getallen betekenen een hogere prestatie

Game Benchmarks

De volgende benchmarks zijn afgeleid van onze laptop-testrapporten. De prestaties variëren afhankelijk van het gebruikte grafische geheugen, kloksnelheid, processor, systeeminstellingen, drivers en besturingssysteem. De resultaten zijn daarom niet noodzakelijk representatief voor alle laptops met deze GPU. Voor meer gedetailleerde informatie over de benchmarkresultaten, klik op het fps-aantal.

gem. 1920x1080
76.6  fps    + Vergelijk + 📈 Graph
hoge 1920x1080
56.4  fps    + Vergelijk + 📈 Graph
ultra 1920x1080
39.4  fps    + Vergelijk + 📈 Graph
QHD 2560x1440
27  fps    + Vergelijk + 📈 Graph
4K 3840x2160
10.9  fps    + Vergelijk + 📈 Graph
4K DLSS 3840x2160
26.8  fps    + Vergelijk + 📈 Graph
» Met alle geteste laptops speelbaar met ultra instellingen.
gem. 1920x1080
106  fps    + Vergelijk
hoge 1920x1080
102  fps    + Vergelijk
ultra 1920x1080
80  fps    + Vergelijk
QHD 2560x1440
63  fps    + Vergelijk
4K 3840x2160
40  fps    + Vergelijk
4K DLSS 3840x2160
52  fps    + Vergelijk
» Met alle geteste laptops speelbaar met ultra instellingen.
gem. 1920x1080
154  fps    + Vergelijk + 📈 Graph
hoge 1920x1080
134.2  fps    + Vergelijk + 📈 Graph
ultra 1920x1080
129.7  fps    + Vergelijk + 📈 Graph
QHD 2560x1440
129.2  fps    + Vergelijk + 📈 Graph
4K 3840x2160
81.8  fps    + Vergelijk + 📈 Graph
» Met alle geteste laptops speelbaar met ultra instellingen.
gem. 1920x1080
99  fps    + Vergelijk
hoge 1920x1080
90.7  fps    + Vergelijk
ultra 1920x1080
81.9  fps    + Vergelijk
QHD 2560x1440
54  fps    + Vergelijk
4K 3840x2160
26.3  fps    + Vergelijk
» Met alle geteste laptops speelbaar met ultra instellingen.
Additional Benchmarks
Ray Tracing Ultra Preset (DLSS off) 1920x1080
36.7
gem. 1920x1080
110.9  fps    + Vergelijk + 📈 Graph
hoge 1920x1080
94.9  fps    + Vergelijk + 📈 Graph
ultra 1920x1080
93.4  fps    + Vergelijk + 📈 Graph
QHD 2560x1440
66.3  fps    + Vergelijk + 📈 Graph
4K 3840x2160
34  fps    + Vergelijk + 📈 Graph
4K DLSS 3840x2160
55.5  fps    + Vergelijk + 📈 Graph
» Met alle geteste laptops speelbaar met ultra instellingen.
Lies of P

Lies of P

2023
gem. 1920x1080
151.3  fps    + Vergelijk + 📈 Graph
hoge 1920x1080
134.1  fps    + Vergelijk + 📈 Graph
ultra 1920x1080
121.1  fps    + Vergelijk + 📈 Graph
QHD 2560x1440
84.7  fps    + Vergelijk + 📈 Graph
4K 3840x2160
44.9  fps    + Vergelijk + 📈 Graph
4K DLSS 3840x2160
67.1  fps    + Vergelijk + 📈 Graph
» Met alle geteste laptops speelbaar met ultra instellingen.
gem. 1920x1080
60  fps    + Vergelijk
hoge 1920x1080
60  fps    + Vergelijk
ultra 1920x1080
60  fps    + Vergelijk
QHD 2560x1440
55  fps    + Vergelijk
4K 3840x2160
35  fps    + Vergelijk
» Met alle geteste laptops speelbaar met ultra instellingen.
Starfield

Starfield

2023
gem. 1920x1080
61.7  fps    + Vergelijk + 📈 Graph
hoge 1920x1080
50  fps    + Vergelijk + 📈 Graph
ultra 1920x1080
44.8  fps    + Vergelijk + 📈 Graph
QHD 2560x1440
36.2  fps    + Vergelijk + 📈 Graph
4K 3840x2160
23.5  fps    + Vergelijk + 📈 Graph
» Met alle geteste laptops speelbaar met ultra instellingen.
gem. 1920x1080
96.3  fps    + Vergelijk + 📈 Graph
hoge 1920x1080
89.5  fps    + Vergelijk + 📈 Graph
ultra 1920x1080
84.6  fps    + Vergelijk + 📈 Graph
QHD 2560x1440
74.5  fps    + Vergelijk + 📈 Graph
4K 3840x2160
47.6  fps    + Vergelijk + 📈 Graph
» Met alle geteste laptops speelbaar met ultra instellingen.
hoge 1920x1080
52.5  fps    + Vergelijk + 📈 Graph
ultra 1920x1080
42.7  fps    + Vergelijk + 📈 Graph
QHD 2560x1440
29.9  fps    + Vergelijk + 📈 Graph
4K 3840x2160
16.1  fps    + Vergelijk + 📈 Graph
» Met alle geteste laptops speelbaar met ultra instellingen.
gem. 1920x1080
124.2  fps    + Vergelijk + 📈 Graph
hoge 1920x1080
118.6  fps    + Vergelijk + 📈 Graph
ultra 1920x1080
101.7  fps    + Vergelijk + 📈 Graph
QHD 2560x1440
77.8  fps    + Vergelijk + 📈 Graph
4K 3840x2160
47.3  fps    + Vergelijk + 📈 Graph
» Met alle geteste laptops speelbaar met ultra instellingen.
gem. 1920x1080
73.9  fps    + Vergelijk + 📈 Graph
hoge 1920x1080
59.5  fps    + Vergelijk + 📈 Graph
ultra 1920x1080
55  fps    + Vergelijk + 📈 Graph
QHD 2560x1440
45.8  fps    + Vergelijk + 📈 Graph
4K 3840x2160
30.6  fps    + Vergelijk + 📈 Graph
» Met alle geteste laptops speelbaar met ultra instellingen.
Additional Benchmarks
Very High Preset + Very High Raytracing TAA 1920x1080
38.3
F1 23

F1 23

2023
gem. 1920x1080
229  fps    + Vergelijk
hoge 1920x1080
178  fps    + Vergelijk
ultra 1920x1080
63  fps    + Vergelijk
QHD 2560x1440
41  fps    + Vergelijk
4K 3840x2160
19  fps    + Vergelijk
» Met alle geteste laptops speelbaar met ultra instellingen.
Diablo 4

Diablo 4

2023
lage 1920x1080
280  fps    + Vergelijk + 📈 Graph
gem. 1920x1080
248  fps    + Vergelijk + 📈 Graph
hoge 1920x1080
223  fps    + Vergelijk + 📈 Graph
ultra 1920x1080
189.2  fps    + Vergelijk + 📈 Graph
QHD 2560x1440
129.6  fps    + Vergelijk + 📈 Graph
4K 3840x2160
67.4  fps    + Vergelijk + 📈 Graph
» Met alle geteste laptops speelbaar met ultra instellingen.
gem. 1920x1080
79.5  fps    + Vergelijk + 📈 Graph
hoge 1920x1080
74.3  fps    + Vergelijk + 📈 Graph
ultra 1920x1080
71.8  fps    + Vergelijk + 📈 Graph
QHD 2560x1440
46  fps    + Vergelijk + 📈 Graph
4K 3840x2160
22.8  fps    + Vergelijk + 📈 Graph
» Met alle geteste laptops speelbaar met ultra instellingen.
gem. 1920x1080
198.6  fps    + Vergelijk + 📈 Graph
hoge 1920x1080
173.3  fps    + Vergelijk + 📈 Graph
ultra 1920x1080
134.1  fps    + Vergelijk + 📈 Graph
QHD 2560x1440
95.1  fps    + Vergelijk + 📈 Graph
4K 3840x2160
48.5  fps    + Vergelijk + 📈 Graph
» Met alle geteste laptops speelbaar met ultra instellingen.
gem. 1920x1080
121.5  fps    + Vergelijk + 📈 Graph
hoge 1920x1080
110.7  fps    + Vergelijk + 📈 Graph
ultra 1920x1080
81.7  fps    + Vergelijk + 📈 Graph
QHD 2560x1440
61.4  fps    + Vergelijk + 📈 Graph
4K 3840x2160
35.4  fps    + Vergelijk + 📈 Graph
» Met alle geteste laptops speelbaar met ultra instellingen.
gem. 1920x1080
186  fps    + Vergelijk
hoge 1920x1080
148  fps    + Vergelijk
ultra 1920x1080
146  fps    + Vergelijk
QHD 2560x1440
109  fps    + Vergelijk
4K 3840x2160
67  fps    + Vergelijk
» Met alle geteste laptops speelbaar met ultra instellingen.
gem. 1920x1080
85  fps    + Vergelijk + 📈 Graph
hoge 1920x1080
82.8  fps    + Vergelijk + 📈 Graph
ultra 1920x1080
81.7  fps    + Vergelijk + 📈 Graph
QHD 2560x1440
65.5  fps    + Vergelijk + 📈 Graph
4K 3840x2160
44.2  fps    + Vergelijk + 📈 Graph
» Met alle geteste laptops speelbaar met ultra instellingen.
gem. 1920x1080
157.9  fps    + Vergelijk + 📈 Graph
hoge 1920x1080
94.5  fps    + Vergelijk + 📈 Graph
ultra 1920x1080
76.3  fps    + Vergelijk + 📈 Graph
QHD 2560x1440
60.2  fps    + Vergelijk + 📈 Graph
4K 3840x2160
37  fps    + Vergelijk + 📈 Graph
» Met alle geteste laptops speelbaar met ultra instellingen.
Returnal

Returnal

2023
gem. 1920x1080
113  fps    + Vergelijk
hoge 1920x1080
103  fps    + Vergelijk
ultra 1920x1080
89  fps    + Vergelijk
QHD 2560x1440
66  fps    + Vergelijk
4K 3840x2160
39  fps    + Vergelijk
» Met alle geteste laptops speelbaar met ultra instellingen.
lage 1920x1080
88.5  fps    + Vergelijk + 📈 Graph
gem. 1920x1080
79  fps    + Vergelijk + 📈 Graph
hoge 1920x1080
69.7  fps    + Vergelijk + 📈 Graph
ultra 1920x1080
59.3  fps    + Vergelijk + 📈 Graph
QHD 2560x1440
42.6  fps    + Vergelijk + 📈 Graph
» Met alle geteste laptops speelbaar met ultra instellingen.
Additional Benchmarks
Low Preset Low TAA 1280x720
92.8
Ultra Preset + Full Ray Tracing High TAA 1920x1080
37.7
lage 1920x1080
82.1  fps    + Vergelijk + 📈 Graph
gem. 1920x1080
74.6  fps    + Vergelijk + 📈 Graph
hoge 1920x1080
68.1  fps    + Vergelijk + 📈 Graph
ultra 1920x1080
66.8  fps    + Vergelijk + 📈 Graph
QHD 2560x1440
47.2  fps    + Vergelijk + 📈 Graph
» Met alle geteste laptops speelbaar met ultra instellingen.
Additional Benchmarks
Low Preset TAA 1280x720
113.4
lage 1920x1080
174.4  fps    + Vergelijk + 📈 Graph
gem. 1920x1080
149.6  fps    + Vergelijk + 📈 Graph
hoge 1920x1080
81.3  fps    + Vergelijk + 📈 Graph
ultra 1920x1080
71.4  fps    + Vergelijk + 📈 Graph
QHD 2560x1440
47.4  fps    + Vergelijk + 📈 Graph
» Met alle geteste laptops speelbaar met ultra instellingen.
Additional Benchmarks
Low Preset / Off 1280x720
185.9
RT Ultra Preset / On FXAA 1920x1080
29.4
lage 1920x1080
175.7  fps    + Vergelijk + 📈 Graph
gem. 1920x1080
139.4  fps    + Vergelijk + 📈 Graph
hoge 1920x1080
117.5  fps    + Vergelijk + 📈 Graph
ultra 1920x1080
97.1  fps    + Vergelijk + 📈 Graph
QHD 2560x1440
60.8  fps    + Vergelijk + 📈 Graph
» Met alle geteste laptops speelbaar met ultra instellingen.
Additional Benchmarks
Low Preset 1280x720
196
lage 1920x1080
117  fps    + Vergelijk
gem. 1920x1080
99.3  fps    + Vergelijk
hoge 1920x1080
71  fps    + Vergelijk
ultra 1920x1080
70.7  fps    + Vergelijk
QHD 2560x1440
52.8  fps    + Vergelijk
» Met alle geteste laptops speelbaar met ultra instellingen.
Additional Benchmarks
Low Preset (without FSR Upscaling) 1280x720
132.8
lage 1920x1080
112.8  fps    + Vergelijk + 📈 Graph
gem. 1920x1080
106.9  fps    + Vergelijk + 📈 Graph
hoge 1920x1080
93  fps    + Vergelijk + 📈 Graph
ultra 1920x1080
84.6  fps    + Vergelijk + 📈 Graph
QHD 2560x1440
66.7  fps    + Vergelijk + 📈 Graph
» Met alle geteste laptops speelbaar met ultra instellingen.
Additional Benchmarks
Low Preset 1280x720
116.4
lage 1920x1080
107 108.2 ~ 108 fps    + Vergelijk + 📈 Graph
gem. 1920x1080
102.6 103.8 ~ 103 fps    + Vergelijk + 📈 Graph
hoge 1920x1080
93 94.9 ~ 94 fps    + Vergelijk + 📈 Graph
ultra 1920x1080
91 93.2 ~ 92 fps    + Vergelijk + 📈 Graph
QHD 2560x1440
69.6 73.5 ~ 72 fps    + Vergelijk + 📈 Graph
» Met alle geteste laptops speelbaar met ultra instellingen.
Additional Benchmarks
Very Low Preset 1280x720
122.3
120.7
Very High Preset + Ray-Tracing TAA 1920x0180
54.3
52.4
lage 1920x1080
126 127 ~ 127 fps    + Vergelijk
gem. 1920x1080
111 112 ~ 112 fps    + Vergelijk
hoge 1920x1080
87 89 ~ 88 fps    + Vergelijk
ultra 1920x1080
84 85 86 ~ 85 fps    + Vergelijk
QHD 2560x1440
61 62 63 ~ 62 fps    + Vergelijk
» Met alle geteste laptops speelbaar met ultra instellingen.
Additional Benchmarks
Basic Quality Preset T2X SMAA 1280x720
160
167
lage 1920x1080
78 81 ~ 80 fps    + Vergelijk + 📈 Graph
gem. 1920x1080
75.2 80.2 ~ 78 fps    + Vergelijk + 📈 Graph
hoge 1920x1080
71.8 75.4 ~ 74 fps    + Vergelijk + 📈 Graph
ultra 1920x1080
69.3 72.4 ~ 71 fps    + Vergelijk + 📈 Graph
QHD 2560x1440
55.5 56.2 ~ 56 fps    + Vergelijk + 📈 Graph
» Met alle geteste laptops speelbaar met ultra instellingen.
Additional Benchmarks
Low Preset 1280x720
87.3
81
lage 1920x1080
93.8 101.6 ~ 98 fps    + Vergelijk + 📈 Graph
gem. 1920x1080
81.8 84 ~ 83 fps    + Vergelijk + 📈 Graph
hoge 1920x1080
71.1 73.3 ~ 72 fps    + Vergelijk + 📈 Graph
ultra 1920x1080
61.9 62.9 ~ 62 fps    + Vergelijk + 📈 Graph
QHD 2560x1440
48.6 50.5 ~ 50 fps    + Vergelijk + 📈 Graph
» Met alle geteste laptops speelbaar met ultra instellingen.
Additional Benchmarks
Low Preset 1280x720
106.1
126.7
FIFA 23

FIFA 23

2022
QHD 2560x1440
104.3  fps    + Vergelijk + 📈 Graph
lage 1920x1080
149.6 156.2 ~ 153 fps    + Vergelijk + 📈 Graph
gem. 1920x1080
119.1 120.7 ~ 120 fps    + Vergelijk + 📈 Graph
hoge 1920x1080
98.4 101.5 ~ 100 fps    + Vergelijk + 📈 Graph
ultra 1920x1080
80 81.5 ~ 81 fps    + Vergelijk + 📈 Graph
QHD 2560x1440
56.1  fps    + Vergelijk + 📈 Graph
» Met alle geteste laptops speelbaar met ultra instellingen.
Additional Benchmarks
Low Preset 1280x720
176.8
214
F1 22

F1 22

2022
lage 1920x1080
203 207 209 220 ~ 210 fps    + Vergelijk
gem. 1920x1080
202 205 205 215 ~ 207 fps    + Vergelijk
hoge 1920x1080
157.3 173.1 181.3 192.3 ~ 176 fps    + Vergelijk
ultra 1920x1080
58.1 64 64.2 65.2 66.3 67.4 73.2 80 ~ 67 fps    + Vergelijk
QHD 2560x1440
36.8 41.9 42.3 42.7 42.8 43.5 50.5 ~ 43 fps    + Vergelijk
» Met alle geteste laptops speelbaar met ultra instellingen.
Additional Benchmarks
Ultra Low Preset 16xAF TAA 1280x720
247
287
263
lage 1920x1080
197.6  fps    + Vergelijk + 📈 Graph
gem. 1920x1080
185.1 205 ~ 195 fps    + Vergelijk + 📈 Graph
hoge 1920x1080
172.7 196 ~ 184 fps    + Vergelijk + 📈 Graph
ultra 1920x1080
168.6 189.9 ~ 179 fps    + Vergelijk + 📈 Graph
QHD 2560x1440
128.4  fps    + Vergelijk + 📈 Graph
» Met alle geteste laptops speelbaar met ultra instellingen.
Additional Benchmarks
Low Preset 1280x720
214
lage 1920x1080
127 181.2 ~ 154 fps    + Vergelijk
gem. 1920x1080
124 151.3 156.2 ~ 144 fps    + Vergelijk + 📈 Graph
hoge 1920x1080
123.9 131 146.2 152 ~ 138 fps    + Vergelijk + 📈 Graph
ultra 1920x1080
115.4 130.2 143 145.1 ~ 133 fps    + Vergelijk + 📈 Graph
QHD 2560x1440
83.9 93.1 ~ 89 fps    + Vergelijk + 📈 Graph
» Met alle geteste laptops speelbaar met ultra instellingen.
Additional Benchmarks
Highest Settings + Maximum Ray Tracing 1920x1080
48.9
59.9
57.2
lage 1920x1080
183.3  fps    + Vergelijk
gem. 1920x1080
159.8 165 ~ 162 fps    + Vergelijk
hoge 1920x1080
115 115.2 118.3 ~ 116 fps    + Vergelijk
ultra 1920x1080
89.8 89.9 90.7 93.7 ~ 91 fps    + Vergelijk
QHD 2560x1440
59.3 62.4 63.9 ~ 62 fps    + Vergelijk
» Met alle geteste laptops speelbaar met ultra instellingen.
Additional Benchmarks
Lowest Preset (DX12) 1280x720
204.8
lage 1920x1080
105 117 117.5 123 124.5 129.3 140.3 140.4 141.2 145 148.9 ~ 130 fps    + Vergelijk
gem. 1920x1080
93 98.9 100.3 108 108.6 108.8 113 114.6 123 124.6 130.2 133.2 ~ 113 fps    + Vergelijk
hoge 1920x1080
65 77 84.2 86 87.4 89.2 89.5 96 102.1 105 106 132.3 ~ 93 fps    + Vergelijk
ultra 1920x1080
48.5 64 69.7 74.8 75.6 76 81.3 81.8 86 86 88.1 94 104 ~ 79 fps    + Vergelijk
QHD 2560x1440
40 43.1 45.2 46 49 51 54.3 54.4 56.4 62 ~ 50 fps    + Vergelijk
4K 3840x2160
24.6 28.1 ~ 26 fps    + Vergelijk
» Met alle geteste laptops speelbaar met ultra instellingen.
Additional Benchmarks
Low Preset 1280x720
140
132
127.3
165.5
164.7
Ray Tracing Ultra Preset (DLSS off) 1920x1080
63
31.9
36
28.5
34.7
27.9
35.8
Ray Tracing Ultra Preset (DLSS off) 3840x2160
5.3
Elex 2

Elex 2

2022
lage 1920x1080
110  fps    + Vergelijk + 📈 Graph
gem. 1920x1080
104  fps    + Vergelijk + 📈 Graph
hoge 1920x1080
83 88.8 99.4 ~ 90 fps    + Vergelijk + 📈 Graph
ultra 1920x1080
75 80.1 89 ~ 81 fps    + Vergelijk + 📈 Graph
» Met alle geteste laptops speelbaar met ultra instellingen.
Additional Benchmarks
Low / Off 1280x720
112
lage 1920x1080
187.3 209 ~ 198 fps    + Vergelijk
gem. 1920x1080
169 169.1 ~ 169 fps    + Vergelijk
hoge 1920x1080
148 149.1 ~ 149 fps    + Vergelijk
ultra 1920x1080
111.2 114 ~ 113 fps    + Vergelijk
QHD 2560x1440
99  fps    + Vergelijk
» Met alle geteste laptops speelbaar met ultra instellingen.
Additional Benchmarks
Low Preset 1280x720
212.2
gem. 1920x1080
59.8  fps    + Vergelijk + 📈 Graph
hoge 1920x1080
59.8 59.9 ~ 60 fps    + Vergelijk + 📈 Graph
ultra 1920x1080
46.3 59.7 ~ 53 fps    + Vergelijk + 📈 Graph
QHD 2560x1440
59.7  fps    + Vergelijk + 📈 Graph
» Met alle geteste laptops speelbaar met ultra instellingen.
lage 1920x1080
98.5 100 119.6 ~ 106 fps    + Vergelijk + 📈 Graph
gem. 1920x1080
78.4 79 80.7 81 81.8 101 ~ 84 fps    + Vergelijk + 📈 Graph
hoge 1920x1080
66 67.2 69.6 69.6 71.1 82.5 85.5 ~ 73 fps    + Vergelijk + 📈 Graph
QHD 2560x1440
46.7 46.7 48.7 50.8 51.3 59 60 ~ 52 fps    + Vergelijk + 📈 Graph
4K 3840x2160
28.3  fps    + Vergelijk + 📈 Graph
» Met alle geteste laptops speelbaar met hoge instellingen.
Additional Benchmarks
Low Quality 1280x720
156
143
High Quality Raytracing 1920x1080
31.1
54.9
28.7
35
37.4
32.2
lage 1920x1080
210  fps    + Vergelijk
gem. 1920x1080
181 183 ~ 182 fps    + Vergelijk
hoge 1920x1080
176 177 ~ 177 fps    + Vergelijk
ultra 1920x1080
138 141 ~ 140 fps    + Vergelijk
QHD 2560x1440
91  fps    + Vergelijk
4K 3840x2160
46  fps    + Vergelijk
» Met alle geteste laptops speelbaar met ultra instellingen.
Additional Benchmarks
Ultra Low Preset (with Fixed Resolution Quality) 1280x720
322
lage 1920x1080
117.3 124 ~ 121 fps    + Vergelijk + 📈 Graph
gem. 1920x1080
91.3 104 104.8 ~ 100 fps    + Vergelijk + 📈 Graph
hoge 1920x1080
76.6 83.6 84.7 88.7 92 ~ 85 fps    + Vergelijk + 📈 Graph
ultra 1920x1080
55.1 59.6 59.8 61 64.3 ~ 60 fps    + Vergelijk + 📈 Graph
QHD 2560x1440
44.7 45.2 ~ 45 fps    + Vergelijk + 📈 Graph
4K 3840x2160
31.5  fps    + Vergelijk + 📈 Graph
» Met alle geteste laptops speelbaar met ultra instellingen.
Additional Benchmarks
Low Preset 1280x720
136
gem. 1920x1080
120 129.9 ~ 125 fps    + Vergelijk + 📈 Graph
hoge 1920x1080
101 113.3 ~ 107 fps    + Vergelijk + 📈 Graph
ultra 1920x1080
95.5 106.7 ~ 101 fps    + Vergelijk + 📈 Graph
QHD 2560x1440
65.5  fps    + Vergelijk + 📈 Graph
4K 3840x2160
34.6  fps    + Vergelijk + 📈 Graph
» Met alle geteste laptops speelbaar met ultra instellingen.
Additional Benchmarks
Low Preset 1920x1080
149.5
gem. 1920x1080
170.7 196 ~ 183 fps    + Vergelijk + 📈 Graph
hoge 1920x1080
149.3 170 ~ 160 fps    + Vergelijk + 📈 Graph
ultra 1920x1080
137.9 144 ~ 141 fps    + Vergelijk + 📈 Graph
QHD 2560x1440
112 118.6 ~ 115 fps    + Vergelijk + 📈 Graph
4K 3840x2160
69.7  fps    + Vergelijk + 📈 Graph
» Met alle geteste laptops speelbaar met ultra instellingen.
lage 1280x720
136.4  fps    + Vergelijk + 📈 Graph
gem. 1920x1080
111.7 115 ~ 113 fps    + Vergelijk + 📈 Graph
hoge 1920x1080
96.7 101.4 ~ 99 fps    + Vergelijk + 📈 Graph
ultra 1920x1080
85.6 90 ~ 88 fps    + Vergelijk + 📈 Graph
QHD 2560x1440
63.2  fps    + Vergelijk + 📈 Graph
4K 3840x2160
39.5  fps    + Vergelijk + 📈 Graph
» Met alle geteste laptops speelbaar met ultra instellingen.
Additional Benchmarks
Low Preset 1920x1080
119.4
Ultra Preset + Ray Tracing 1920x1080
69.1
69.8
lage 1280x720
195  fps    + Vergelijk
gem. 1920x1080
130 136 ~ 133 fps    + Vergelijk
hoge 1920x1080
122 124 130 ~ 125 fps    + Vergelijk
ultra 1920x1080
76 79 80 ~ 78 fps    + Vergelijk
QHD 2560x1440
65  fps    + Vergelijk
4K 3840x2160
47  fps    + Vergelijk
» Met alle geteste laptops speelbaar met ultra instellingen.
Additional Benchmarks
Low Preset 1920x1080
142
lage 1280x720
189  fps    + Vergelijk
gem. 1920x1080
127 139 ~ 133 fps    + Vergelijk
hoge 1920x1080
104 115 ~ 110 fps    + Vergelijk
ultra 1920x1080
96 105 ~ 101 fps    + Vergelijk
QHD 2560x1440
70  fps    + Vergelijk
4K 3840x2160
39  fps    + Vergelijk
» Met alle geteste laptops speelbaar met ultra instellingen.
Additional Benchmarks
Low Preset 1920x1080
164
lage 1280x720
120  fps    + Vergelijk
gem. 1920x1080
109 126 ~ 118 fps    + Vergelijk
hoge 1920x1080
111 125 ~ 118 fps    + Vergelijk
ultra 1920x1080
108 120 ~ 114 fps    + Vergelijk
QHD 2560x1440
87  fps    + Vergelijk
4K 3840x2160
49  fps    + Vergelijk
» Met alle geteste laptops speelbaar met ultra instellingen.
Additional Benchmarks
Low Preset 1920x1080
109
Ultra Preset + Ultra Ray-Tracing 1920x1080
63
69
gem. 1920x1080
219 221 ~ 220 fps    + Vergelijk + 📈 Graph
hoge 1920x1080
189 195.1 ~ 192 fps    + Vergelijk + 📈 Graph
ultra 1920x1080
176 187.8 ~ 182 fps    + Vergelijk + 📈 Graph
QHD 2560x1440
120 124.9 ~ 122 fps    + Vergelijk + 📈 Graph
4K 3840x2160
63.9  fps    + Vergelijk + 📈 Graph
» Met alle geteste laptops speelbaar met ultra instellingen.
Far Cry 6

Far Cry 6

2021
lage 1280x720
149  fps    + Vergelijk + 📈 Graph
gem. 1920x1080
99 116 125 ~ 113 fps    + Vergelijk + 📈 Graph
hoge 1920x1080
89 103 108 ~ 100 fps    + Vergelijk + 📈 Graph
ultra 1920x1080
82 95 95 95.3 ~ 92 fps    + Vergelijk + 📈 Graph
QHD 2560x1440
70 73 ~ 72 fps    + Vergelijk
4K 3840x2160
38  fps    + Vergelijk
» Met alle geteste laptops speelbaar met ultra instellingen.
Additional Benchmarks
Low Graphics Quality 1920x1080
129
110
Ultra Graphics Quality + HD Textures + DXR TAA 1920x1080
59
77.7
lage 1280x720
169.3  fps    + Vergelijk + 📈 Graph
gem. 1920x1080
136.3 154 ~ 145 fps    + Vergelijk + 📈 Graph
hoge 1920x1080
130.5 146 ~ 138 fps    + Vergelijk + 📈 Graph
QHD 2560x1440
104  fps    + Vergelijk + 📈 Graph
4K 3840x2160
56.7  fps    + Vergelijk + 📈 Graph
» Met alle geteste laptops speelbaar met hoge instellingen.
New World

New World

2021
gem. 1920x1080
100.4 107 ~ 104 fps    + Vergelijk + 📈 Graph
hoge 1920x1080
93.3 94.3 ~ 94 fps    + Vergelijk + 📈 Graph
ultra 1920x1080
83.3 85.8 ~ 85 fps    + Vergelijk + 📈 Graph
QHD 2560x1440
58.3 70.4 ~ 64 fps    + Vergelijk + 📈 Graph
4K 3840x2160
32.2  fps    + Vergelijk + 📈 Graph
» Met alle geteste laptops speelbaar met ultra instellingen.
Deathloop

Deathloop

2021
gem. 1920x1080
117 128.6 ~ 123 fps    + Vergelijk + 📈 Graph
hoge 1920x1080
98.1 112.2 ~ 105 fps    + Vergelijk + 📈 Graph
ultra 1920x1080
80.2 90.3 ~ 85 fps    + Vergelijk + 📈 Graph
QHD 2560x1440
56.1 62.6 ~ 59 fps    + Vergelijk + 📈 Graph
4K 3840x2160
30.8  fps    + Vergelijk + 📈 Graph
» Met alle geteste laptops speelbaar met ultra instellingen.
F1 2021

F1 2021

2021
lage 1280x720
266 327 332 333 365 371 405 ~ 343 fps    + Vergelijk
gem. 1920x1080
169.5 208 229 231 252 255 268 317 ~ 241 fps    + Vergelijk
hoge 1920x1080
139.2 178.3 194.4 196 201 208 210 238 ~ 196 fps    + Vergelijk
ultra 1920x1080
67.3 88.1 89.6 106.2 108 109.1 116 116.9 118 119.8 129.6 130 134.2 ~ 110 fps    + Vergelijk
QHD 2560x1440
47.5 68.7 71.6 80 82.2 82.6 90 93.5 98.3 98.4 99.2 ~ 83 fps    + Vergelijk
4K 3840x2160
47 53.5 56.8 ~ 52 fps    + Vergelijk
» Met alle geteste laptops speelbaar met ultra instellingen.
Additional Benchmarks
Ultra Low Preset 1920x1080
388
Days Gone

Days Gone

2021
gem. 1920x1080
130 151.7 ~ 141 fps    + Vergelijk + 📈 Graph
hoge 1920x1080
115 135.1 ~ 125 fps    + Vergelijk + 📈 Graph
ultra 1920x1080
86.3 100.8 ~ 94 fps    + Vergelijk + 📈 Graph
QHD 2560x1440
64.1 73.6 ~ 69 fps    + Vergelijk + 📈 Graph
4K 3840x2160
36.9  fps    + Vergelijk + 📈 Graph
» Met alle geteste laptops speelbaar met ultra instellingen.
ultra 1920x1080
122.4 147 ~ 135 fps    + Vergelijk + 📈 Graph
QHD 2560x1440
119.4 128 ~ 124 fps    + Vergelijk + 📈 Graph
4K 3840x2160
80.5  fps    + Vergelijk + 📈 Graph
» Met alle geteste laptops speelbaar met ultra instellingen.
gem. 1920x1080
176 193.6 ~ 185 fps    + Vergelijk + 📈 Graph
hoge 1920x1080
160 177.8 ~ 169 fps    + Vergelijk + 📈 Graph
ultra 1920x1080
141 154.5 ~ 148 fps    + Vergelijk + 📈 Graph
QHD 2560x1440
98.1 103.6 ~ 101 fps    + Vergelijk + 📈 Graph
4K 3840x2160
52.9  fps    + Vergelijk + 📈 Graph
» Met alle geteste laptops speelbaar met ultra instellingen.
Additional Benchmarks
Ray Tracing Preset 1920x1080
89.7
Outriders

Outriders

2021
gem. 1920x1080
143 147 ~ 145 fps    + Vergelijk + 📈 Graph
hoge 1920x1080
124 135.6 ~ 130 fps    + Vergelijk + 📈 Graph
ultra 1920x1080
104 116.1 ~ 110 fps    + Vergelijk + 📈 Graph
QHD 2560x1440
70 80.8 ~ 75 fps    + Vergelijk + 📈 Graph
4K 3840x2160
37.4  fps    + Vergelijk + 📈 Graph
» Met alle geteste laptops speelbaar met ultra instellingen.
Hitman 3

Hitman 3

2021
lage 1280x720
207.9 250.8 ~ 229 fps    + Vergelijk
gem. 1920x1080
169 169.1 183.5 ~ 174 fps    + Vergelijk
hoge 1920x1080
146 162.1 165.5 ~ 158 fps    + Vergelijk
ultra 1920x1080
138 156.9 157.7 ~ 151 fps    + Vergelijk
QHD 2560x1440
95.8  fps    + Vergelijk
4K 3840x2160
54.3  fps    + Vergelijk
» Met alle geteste laptops speelbaar met ultra instellingen.
Additional Benchmarks
Minimum Settings 1920x1080
203.1
210.5
gem. 1920x1080
82.1  fps    + Vergelijk + 📈 Graph
hoge 1920x1080
66.9  fps    + Vergelijk + 📈 Graph
ultra 1920x1080
56.1  fps    + Vergelijk + 📈 Graph
QHD 2560x1440
35.9  fps    + Vergelijk + 📈 Graph
4K 3840x2160
17.5  fps    + Vergelijk + 📈 Graph
» Met alle geteste laptops speelbaar met ultra instellingen.
Additional Benchmarks
Ray Tracing Ultra Preset (DLSS off) 1920x1080
30
gem. 1920x1080
117  fps    + Vergelijk + 📈 Graph
hoge 1920x1080
113  fps    + Vergelijk + 📈 Graph
ultra 1920x1080
100  fps    + Vergelijk + 📈 Graph
QHD 2560x1440
68.5  fps    + Vergelijk + 📈 Graph
4K 3840x2160
37  fps    + Vergelijk + 📈 Graph
» Met alle geteste laptops speelbaar met ultra instellingen.
lage 1280x720
157 160 ~ 159 fps    + Vergelijk
gem. 1920x1080
102 107 111 ~ 107 fps    + Vergelijk
hoge 1920x1080
85 88 90 94 ~ 89 fps    + Vergelijk
ultra 1920x1080
73 77 79 80 ~ 77 fps    + Vergelijk
QHD 2560x1440
56 61 62 ~ 60 fps    + Vergelijk
4K 3840x2160
35 37 ~ 36 fps    + Vergelijk
» Met alle geteste laptops speelbaar met ultra instellingen.
Dirt 5

Dirt 5

2020
lage 1280x720
219  fps    + Vergelijk
gem. 1920x1080
124 136.5 ~ 130 fps    + Vergelijk
hoge 1920x1080
98.4 111.9 ~ 105 fps    + Vergelijk
ultra 1920x1080
78.5 88.7 ~ 84 fps    + Vergelijk
QHD 2560x1440
64  fps    + Vergelijk
4K 3840x2160
41.6  fps    + Vergelijk
» Met alle geteste laptops speelbaar met ultra instellingen.
lage 1280x720
121  fps    + Vergelijk + 📈 Graph
gem. 1920x1080
106 107 ~ 107 fps    + Vergelijk + 📈 Graph
hoge 1920x1080
96.3 97 ~ 97 fps    + Vergelijk + 📈 Graph
ultra 1920x1080
65 70.6 ~ 68 fps    + Vergelijk + 📈 Graph
QHD 2560x1440
50  fps    + Vergelijk
4K 3840x2160
29  fps    + Vergelijk
» Met alle geteste laptops speelbaar met ultra instellingen.
Additional Benchmarks
Ultra Preset + Ultra Ray Tracing (DX12) 1920x1080
36
41.2
gem. 1920x1080
292  fps    + Vergelijk + 📈 Graph
hoge 1920x1080
269  fps    + Vergelijk + 📈 Graph
ultra 1920x1080
237  fps    + Vergelijk + 📈 Graph
QHD 2560x1440
167  fps    + Vergelijk + 📈 Graph
4K 3840x2160
92.9  fps    + Vergelijk + 📈 Graph
» Met alle geteste laptops speelbaar met ultra instellingen.
lage 1280x720
161.8  fps    + Vergelijk + 📈 Graph
gem. 1920x1080
103 119.8 ~ 111 fps    + Vergelijk + 📈 Graph
hoge 1920x1080
95.1 111.5 ~ 103 fps    + Vergelijk + 📈 Graph
QHD 2560x1440
66.1  fps    + Vergelijk + 📈 Graph
4K 3840x2160
35.7  fps    + Vergelijk + 📈 Graph
» Met alle geteste laptops speelbaar met hoge instellingen.
gem. 1920x1080
110  fps    + Vergelijk
hoge 1920x1080
99.2  fps    + Vergelijk
ultra 1920x1080
82.4  fps    + Vergelijk
QHD 2560x1440
64.2  fps    + Vergelijk
4K 3840x2160
40.5  fps    + Vergelijk
» Met alle geteste laptops speelbaar met ultra instellingen.
gem. 1920x1080
178  fps    + Vergelijk + 📈 Graph
hoge 1920x1080
71.8  fps    + Vergelijk + 📈 Graph
ultra 1920x1080
64.3  fps    + Vergelijk + 📈 Graph
QHD 2560x1440
48.5  fps    + Vergelijk + 📈 Graph
4K 3840x2160
27.6  fps    + Vergelijk + 📈 Graph
» Met alle geteste laptops speelbaar met ultra instellingen.
lage 1280x720
124.8  fps    + Vergelijk + 📈 Graph
gem. 1920x1080
97.8  fps    + Vergelijk + 📈 Graph
hoge 1920x1080
70.2  fps    + Vergelijk + 📈 Graph
ultra 1920x1080
52.2  fps    + Vergelijk + 📈 Graph
QHD 2560x1440
41.3  fps    + Vergelijk + 📈 Graph
» Met alle geteste laptops speelbaar met ultra instellingen.
Additional Benchmarks
Low-End TAAAA 1920x1080
122
lage 1280x720
156.9  fps    + Vergelijk + 📈 Graph
gem. 1920x1080
139 143.1 ~ 141 fps    + Vergelijk + 📈 Graph
hoge 1920x1080
132 137.9 ~ 135 fps    + Vergelijk + 📈 Graph
ultra 1920x1080
129 137.1 ~ 133 fps    + Vergelijk + 📈 Graph
QHD 2560x1440
94.4  fps    + Vergelijk + 📈 Graph
4K 3840x2160
55.2  fps    + Vergelijk + 📈 Graph
» Met alle geteste laptops speelbaar met ultra instellingen.
gem. 1920x1080
204  fps    + Vergelijk
hoge 1920x1080
135  fps    + Vergelijk
ultra 1920x1080
102  fps    + Vergelijk
QHD 2560x1440
75.2  fps    + Vergelijk
4K 3840x2160
40.1  fps    + Vergelijk
» Met alle geteste laptops speelbaar met ultra instellingen.
lage 1280x720
365  fps    + Vergelijk + 📈 Graph
gem. 1920x1080
222 240 ~ 231 fps    + Vergelijk + 📈 Graph
hoge 1920x1080
196 207 ~ 202 fps    + Vergelijk + 📈 Graph
ultra 1920x1080
188 198.4 ~ 193 fps    + Vergelijk + 📈 Graph
QHD 2560x1440
145  fps    + Vergelijk + 📈 Graph
4K 3840x2160
78.2  fps    + Vergelijk + 📈 Graph
» Met alle geteste laptops speelbaar met ultra instellingen.
gem. 1920x1080
139  fps    + Vergelijk + 📈 Graph
hoge 1920x1080
116 125.9 ~ 121 fps    + Vergelijk + 📈 Graph
QHD 2560x1440
75.1 82.5 ~ 79 fps    + Vergelijk + 📈 Graph
4K 3840x2160
36.5  fps    + Vergelijk + 📈 Graph
» Met alle geteste laptops speelbaar met hoge instellingen.
gem. 1920x1080
104.2  fps    + Vergelijk
hoge 1920x1080
92.4  fps    + Vergelijk
ultra 1920x1080
80.9  fps    + Vergelijk
QHD 2560x1440
58.7  fps    + Vergelijk
» Met alle geteste laptops speelbaar met ultra instellingen.
lage 1280x720
140.3 149.2 ~ 145 fps    + Vergelijk
gem. 1920x1080
114.3 120.3 ~ 117 fps    + Vergelijk
hoge 1920x1080
88.3 97.2 ~ 93 fps    + Vergelijk
ultra 1920x1080
71 77.2 ~ 74 fps    + Vergelijk
QHD 2560x1440
52.7  fps    + Vergelijk
» Met alle geteste laptops speelbaar met ultra instellingen.
Additional Benchmarks
Ultra Quality DXR 16xAF 1920x1080
65.1
61.3
hoge 1920x1080
124 131 ~ 128 fps    + Vergelijk
ultra 1920x1080
119 129 ~ 124 fps    + Vergelijk
QHD 2560x1440
83  fps    + Vergelijk
» Met alle geteste laptops speelbaar met ultra instellingen.
Strange Brigade

Strange Brigade

2018
lage 1280x720
150 289 304 305 351 358 369 376 383 393 405 425 426 435 441 445 453 453 460 471 490 519 ~ 396 fps    + Vergelijk
gem. 1920x1080
116 212 214 216 224 224 227 229 231 232 240 244 254 255 257 258 259 263 267 270 271 274 288 298 298 ~ 245 fps    + Vergelijk
hoge 1920x1080
112 164.1 175 183.1 184 184.7 186.1 187.9 190.3 193.4 197.2 198.2 200 202 206 209 212 214 217 222 223 224 235 235 241 244 248 ~ 203 fps    + Vergelijk
ultra 1920x1080
109 146.6 149.1 151.8 153 159.5 160.6 162.6 163.2 163.8 167.2 171.2 173.4 175.9 177 177.4 177.4 178 178.3 183 183.8 186.4 188.5 189 189.7 191.7 192.1 194 195.1 196.2 199 204 207 209 213 217 221 ~ 180 fps    + Vergelijk
QHD 2560x1440
110.7 117.4 119.3 119.8 130 130 130.9 131.9 132.3 136.7 136.9 140.9 143 144 144.4 148.5 150 151.4 152.6 154.1 160.5 ~ 137 fps    + Vergelijk
4K 3840x2160
74.4 87.9 ~ 81 fps    + Vergelijk
» Met alle geteste laptops speelbaar met ultra instellingen.
Far Cry 5

Far Cry 5

2018
lage 1280x720
134 141 144 154 155 159 160 166 170 172 174 177 180 182 187 ~ 164 fps    + Vergelijk + 📈 Graph
gem. 1920x1080
105 116 123 123 128 128 131 131 137 139 141 143 144 145 146 152 154 155 ~ 136 fps    + Vergelijk + 📈 Graph
hoge 1920x1080
99 112 113 116 118 119 121 123 124 128 129 131 135 136 137 137 138 138 144 145 145 146 147 ~ 130 fps    + Vergelijk + 📈 Graph
ultra 1920x1080
91 103 106 109 110 110 110 112 114 116 117 118 122 124 124 126 126 129 130 130 135 136 137 137 138 ~ 120 fps    + Vergelijk + 📈 Graph
QHD 2560x1440
77 88 90 90 92 93 94 100 102 102 103 104 107 108 111 ~ 97 fps    + Vergelijk + 📈 Graph
4K 3840x2160
57 61 ~ 59 fps    + Vergelijk + 📈 Graph
» Met alle geteste laptops speelbaar met ultra instellingen.
Additional Benchmarks
Low Preset TAA 1920x1080
127
171
163
140
133
143
137
116
157
159
175
163
158
149
169
lage 1280x720
68.8 97.4 100.3 109.5 112.5 114.9 119.6 126.2 126.3 127.2 127.5 128 129.5 130.5 133.3 135.9 138.6 139 139.1 142 143.2 143.8 144 144.3 145.5 145.9 147 148 149.4 150.9 151.2 152.5 155 160.9 161 166.8 ~ 135 fps    + Vergelijk
gem. 1920x1080
57.3 87.9 89.3 94.9 100.8 101.3 103.6 103.6 107.5 109.1 109.8 111.2 112.9 114.7 115.2 117 117.7 121.6 123 125 126.4 127.5 128 129.6 130 130.7 131 132 132.5 133.4 135.3 136.1 137.6 141.3 143 145.7 ~ 118 fps    + Vergelijk
hoge 1920x1080
51.6 70.8 72.3 77.6 80.8 81.7 82.9 83.9 86.9 89.7 91.1 91.3 91.4 91.6 92.4 95 95 95.8 100 100.7 100.8 100.9 101 101.6 102.5 102.8 103 105 105.3 105.9 107.6 108.4 109.9 112 112.5 115 116.9 ~ 96 fps    + Vergelijk
4K 3840x2160
91.3 91.7 102 ~ 95 fps    + Vergelijk
» Met alle geteste laptops speelbaar met hoge instellingen.
lage 1280x720
141.1 144.4 158.4 170.6 171.8 174.2 174.3 177.1 180 183.6 186.6 187.2 196.3 201 202 202 205 207 209 211 ~ 184 fps    + Vergelijk
gem. 1920x1080
113.9 117 117.7 117.9 119.2 120.6 123.5 123.8 126 128.9 129.7 131 133.3 134.3 137.8 138.8 139.9 140.1 142 145.8 152 154.8 156 162.6 ~ 134 fps    + Vergelijk
hoge 1920x1080
49.5 67.4 78.2 85.4 87 88.3 89.5 89.7 91.4 94.7 94.8 94.9 95.7 96.5 96.6 97.8 98.1 99.6 100.3 102.8 103.2 103.8 104.6 104.6 106.9 107 107.3 107.7 108.6 109.5 115 115.6 116.8 117.1 122.4 ~ 99 fps    + Vergelijk
QHD 2560x1440
57.9 59.7 62.5 67 68.2 70.1 72.1 72.2 74.1 74.3 75.1 75.5 75.9 76 78.5 79.2 79.8 81 81.1 82.3 85.4 90.4 92.1 93 ~ 76 fps    + Vergelijk
4K 3840x2160
39.6 43 43.9 46.2 46.6 ~ 44 fps    + Vergelijk
» Met alle geteste laptops speelbaar met hoge instellingen.
lage 1280x720
89.3 130.9 135.4 135.9 137.7 145.6 150.4 158.1 159.4 161 161.9 162 163.1 164.6 164.8 166.6 166.9 167.8 168.4 168.8 169 171.4 172.1 173.6 174 178 178 180.4 180.8 181 181.2 185 187 190.6 191.9 195.2 199 ~ 166 fps    + Vergelijk
gem. 1366x768
79.7 120 123.1 125.8 128.9 131.1 138 142.6 142.9 145 146.2 147 148.2 148.2 150.2 150.7 152 152.8 153.6 153.7 155 155.6 156.5 158 159.3 161 161.2 164.7 165.1 165.6 166 169 173.3 174.7 174.7 177.5 178.4 ~ 151 fps    + Vergelijk
hoge 1920x1080
75.4 112.1 116 116.3 122.5 126 128.1 131.2 132.2 132.4 133.3 138.1 139.8 140.9 141.2 142 142.6 143.4 145.1 147 148.1 148.3 148.4 148.4 149.1 150 150 152 155.3 155.4 158 158.3 164 164.8 165.6 166.3 168.3 170.2 ~ 143 fps    + Vergelijk
ultra 1920x1080
68.7 108.5 112.1 114.1 115.8 117.8 120.5 125.2 125.4 126.6 126.8 132.8 133 134.4 134.5 134.9 135 135.8 137.9 138.1 139 140.8 140.8 140.8 141.6 142.7 145 145.2 146.7 147.7 148 151 155 155.6 158.4 158.5 159.2 160.5 ~ 136 fps    + Vergelijk
4K 3840x2160
58.3 122.6 127.8 130.2 148.9 ~ 118 fps    + Vergelijk
» Met alle geteste laptops speelbaar met ultra instellingen.
lage 1024x768
284 307 329 339 357 365.8 370.2 370.5 385 386.2 388 403 417 417.5 422 426.4 428 429 441 492.3 ~ 388 fps    + Vergelijk + 📈 Graph
gem. 1366x768
237 244 251 264 267 267 271 273.2 288.5 289.4 291 296.4 300 300.4 308 308.8 316 317.5 324 326 329 329.2 360 ~ 294 fps    + Vergelijk + 📈 Graph
hoge 1920x1080
139.7 158 162.7 165 165.6 166 171 172 173.4 176.6 179.4 180 183.2 187.5 188 189 195 195.9 204.8 209 210 213.9 219 219 223.3 223.9 226 ~ 189 fps    + Vergelijk + 📈 Graph
ultra 1920x1080
76.8 77.2 84.9 90.4 90.5 91.5 93.7 94.1 95.2 96.4 96.8 97.7 97.7 97.8 99.4 99.5 99.9 100.1 101.1 103 103 103.7 104.7 105 105.6 107.4 107.4 108.5 110 111 111.4 111.6 112.7 112.8 114.6 117 119 119.8 124.1 ~ 102 fps    + Vergelijk + 📈 Graph
4K 3840x2160
73.2 78 ~ 76 fps    + Vergelijk + 📈 Graph
» Met alle geteste laptops speelbaar met ultra instellingen.
Additional Benchmarks
Ultra Graphics & Postprocessing (HBAO+) 3840x2160
52.3
48.4
Medium Graphics & Postprocessing 1920x1080
198.5
194
209
240
197.5
223
242
197.5
231
GTA V

GTA V

2015
lage 1024x768
101 174.2 176.6 178.4 180.3 180.7 181.5 182.6 182.7 182.7 184.6 185 185 185 185.9 186.1 186.4 186.6 186.8 187.2 ~ 179 fps    + Vergelijk
gem. 1366x768
95.5 167.3 170.3 173.1 174.4 175.2 176.5 176.8 176.9 177.2 179 179.1 179.3 179.5 180.1 181 181.7 182 182.1 182.3 182.8 184 184.5 184.6 184.7 186.4 ~ 176 fps    + Vergelijk
hoge 1920x1080
80 149.5 152.5 156 156 156.2 156.3 158.4 164.2 167.6 167.9 168 170 171 171.4 172.2 172.8 173.5 173.9 174.6 175 175.8 176.4 177.3 178.1 178.5 179 181.9 ~ 166 fps    + Vergelijk
ultra 1920x1080
44 86.6 87.9 92.5 92.5 93 94.6 95 97.6 97.7 102.5 103.8 104 104.8 105 108.1 109.7 110.1 110.2 110.9 112.9 112.9 113 113.7 115.6 116.5 117 117 117.5 118.7 121 122 122.2 122.9 123 123.9 ~ 107 fps    + Vergelijk
QHD 2560x1440
72.7 74.5 81.8 83.7 86 88.8 89.5 90.3 90.7 93 93.9 94.3 94.6 97.6 98.7 98.8 99.9 100 101.2 101.9 103 108.7 ~ 93 fps    + Vergelijk
4K 3840x2160
92.1 98 ~ 95 fps    + Vergelijk
» Met alle geteste laptops speelbaar met ultra instellingen.
Additional Benchmarks
Highest Settings possible 16xAF 4xMSAA + FXAA 3840x2160
51.4
48.7
Normal/Off 4xAF 1920x1080
166.5
180
183
180
173.1
97.2
171.5
175.2
178.8
172.6
168.7
179.8
181.4
180.8
180.9
183.7
167
176
178.7
183.9
186.2
Lowest Settings possible 1920x1080
173.1
186
185
178
183.5
179.1
178.9
174
183.9
184.4
185
182.6
186.9
178.2
180.8
181.6
187.2
187.3
lagegem.hogeultraQHD4K
Lords of the Fallen76.656.439.42710.9
Assassin's Creed Mirage106102806340
EA Sports FC 24154134.2129.7129.281.8
Cyberpunk 2077 2.1 Phantom Liberty9990.781.95426.3
Baldur's Gate 3110.994.993.466.334
Lies of P151.3134.1121.184.744.9
The Crew Motorfest6060605535
Starfield61.75044.836.223.5
Armored Core 696.389.584.674.547.6
Immortals of Aveum52.542.729.916.1
Atlas Fallen124.2118.6101.777.847.3
Ratchet & Clank Rift Apart73.959.55545.830.6
F1 23229178634119
Diablo 4280248223189.2129.667.4
Star Wars Jedi Survivor79.574.371.84622.8
Dead Island 2198.6173.3134.195.148.5
Resident Evil 4 Remake121.5110.781.761.435.4
Company of Heroes 318614814610967
Sons of the Forest8582.881.765.544.2
Atomic Heart157.994.576.360.237
Returnal113103896639
Hogwarts Legacy88.57969.759.342.6
Dead Space Remake82.174.668.166.847.2
The Witcher 3 v4.00174.4149.681.371.447.4
High On Life175.7139.4117.597.160.8
The Callisto Protocol11799.37170.752.8
Need for Speed Unbound112.8106.99384.666.7
Spider-Man Miles Morales108103949272
Call of Duty Modern Warfare 2 2022127112888562
Uncharted Legacy of Thieves Collection8078747156
A Plague Tale Requiem9883726250
FIFA 23104.3
The Quarry1531201008156.1
F1 222102071766743
Vampire Bloodhunt197.6195184179128.4
Ghostwire Tokyo15414413813389
Tiny Tina's Wonderlands183.31621169162
Cyberpunk 2077 1.613011393795026
Elex 21101049081
GRID Legends19816914911399
Elden Ring59.8605359.7
Dying Light 210684735228.3
Rainbow Six Extraction2101821771409146
God of War12110085604531.5
Halo Infinite12510710165.534.6
Farming Simulator 2218316014111569.7
Battlefield 2042136.4113998863.239.5
Forza Horizon 5195133125786547
Riders Republic1891331101017039
Guardians of the Galaxy1201181181148749
Back 4 Blood22019218212263.9
Far Cry 6149113100927238
Alan Wake Remastered169.314513810456.7
New World10494856432.2
Deathloop123105855930.8
F1 20213432411961108352
Days Gone141125946936.9
Mass Effect Legendary Edition13512480.5
Resident Evil Village18516914810152.9
Outriders1451301107537.4
Hitman 322917415815195.854.3
Cyberpunk 2077 1.082.166.956.135.917.5
Yakuza Like a Dragon11711310068.537
Assassin´s Creed Valhalla15910789776036
Dirt 5219130105846441.6
Watch Dogs Legion12110797685029
Star Wars Squadrons29226923716792.9
Mafia Definitive Edition161.811110366.135.7
Serious Sam 411099.282.464.240.5
Crysis Remastered17871.864.348.527.6
Flight Simulator 2020124.897.870.252.241.3
Death Stranding156.914113513394.455.2
Gears Tactics20413510275.240.1
Doom Eternal36523120219314578.2
Hunt Showdown1391217936.5
Borderlands 3104.292.480.958.7
Metro Exodus145117937452.7
Shadow of the Tomb Raider12812483
Strange Brigade39624520318013781
Far Cry 51641361301209759
X-Plane 11.111351189695
Final Fantasy XV Benchmark184134997644
Dota 2 Reborn166151143136118
The Witcher 338829418910276
GTA V1791761661079395
< 30 fps
< 60 fps
< 120 fps
≥ 120 fps


9
36

1
37
43

4
48
31

8
50
20
2
25
46
8
11
38
13

Voor meer games die mogelijk speelbaar zijn of voor een lijst van alle games en videokaarten, bezoek onze Gaming List

v1.28
log 21. 22:54:17

#0 ran 0s before starting gpusingle class +0s ... 0s

#1 no ids found in url (should be separated by "_") +0s ... 0s

#2 not redirecting to Ajax server +0s ... 0s

#3 did not recreate cache, as it is less than 5 days old! Created at Sat, 19 Oct 2024 05:36:04 +0200 +0.001s ... 0.001s

#4 no comparison url found in template nbc.compare_page_1 needed +0.036s ... 0.037s

#5 no comparison url found in template nbc.compare_page_1 needed +0s ... 0.037s

#6 no comparison url found in template nbc.compare_page_1 needed +0s ... 0.038s

#7 no comparison url found in template nbc.compare_page_1 needed +0s ... 0.038s

#8 no comparison url found in template nbc.compare_page_1 needed +0s ... 0.038s

#9 no comparison url found in template nbc.compare_page_1 needed +0s ... 0.038s

#10 no comparison url found in template nbc.compare_page_1 needed +0s ... 0.038s

#11 no comparison url found in template nbc.compare_page_1 needed +0s ... 0.039s

#12 no comparison url found in template nbc.compare_page_1 needed +0s ... 0.039s

#13 no comparison url found in template nbc.compare_page_1 needed +0s ... 0.039s

#14 no comparison url found in template nbc.compare_page_1 needed +0s ... 0.039s

#15 no comparison url found in template nbc.compare_page_1 needed +0s ... 0.039s

#16 no comparison url found in template nbc.compare_page_1 needed +0s ... 0.039s

#17 no comparison url found in template nbc.compare_page_1 needed +0s ... 0.039s

#18 no comparison url found in template nbc.compare_page_1 needed +0s ... 0.039s

#19 no comparison url found in template nbc.compare_page_1 needed +0s ... 0.039s

#20 no comparison url found in template nbc.compare_page_1 needed +0s ... 0.04s

#21 no comparison url found in template nbc.compare_page_1 needed +0s ... 0.04s

#22 no comparison url found in template nbc.compare_page_1 needed +0s ... 0.04s

#23 no comparison url found in template nbc.compare_page_1 needed +0s ... 0.04s

#24 no comparison url found in template nbc.compare_page_1 needed +0s ... 0.04s

#25 composed specs +0s ... 0.04s

#26 did output specs +0s ... 0.04s

#27 start showIntegratedCPUs +0s ... 0.04s

#28 getting avg benchmarks for device 11120 +0.029s ... 0.069s

#29 got single benchmarks 11120 +0.107s ... 0.177s

#30 got avg benchmarks for devices +0s ... 0.177s

#31 min, max, avg, median took s +0.972s ... 1.149s

#32 before gaming benchmark output +0s ... 1.149s

#33 Got 1558 rows for game benchmarks. +0.64s ... 1.79s

#34 composed SQL query for gamebenchmarks +0s ... 1.79s

#35 got data and put it in $dataArray +0.054s ... 1.844s

#36 benchmarks composed for output. +4.229s ... 6.073s

#37 no comparison url found in template nbc.compare_page_1 needed +0.009s ... 6.082s

#38 return log +0s ... 6.082s

Notebook-testrapporten met NVIDIA GeForce RTX 3070 Ti Laptop GPU grafische kaart

Razer Blade 15 OLED (begin 2022) review: Een compacte gaming laptop met een RTX 3070 Ti

Razer Blade 15 OLED (begin 2022) review: Een compacte gaming laptop met een RTX 3070 Ti

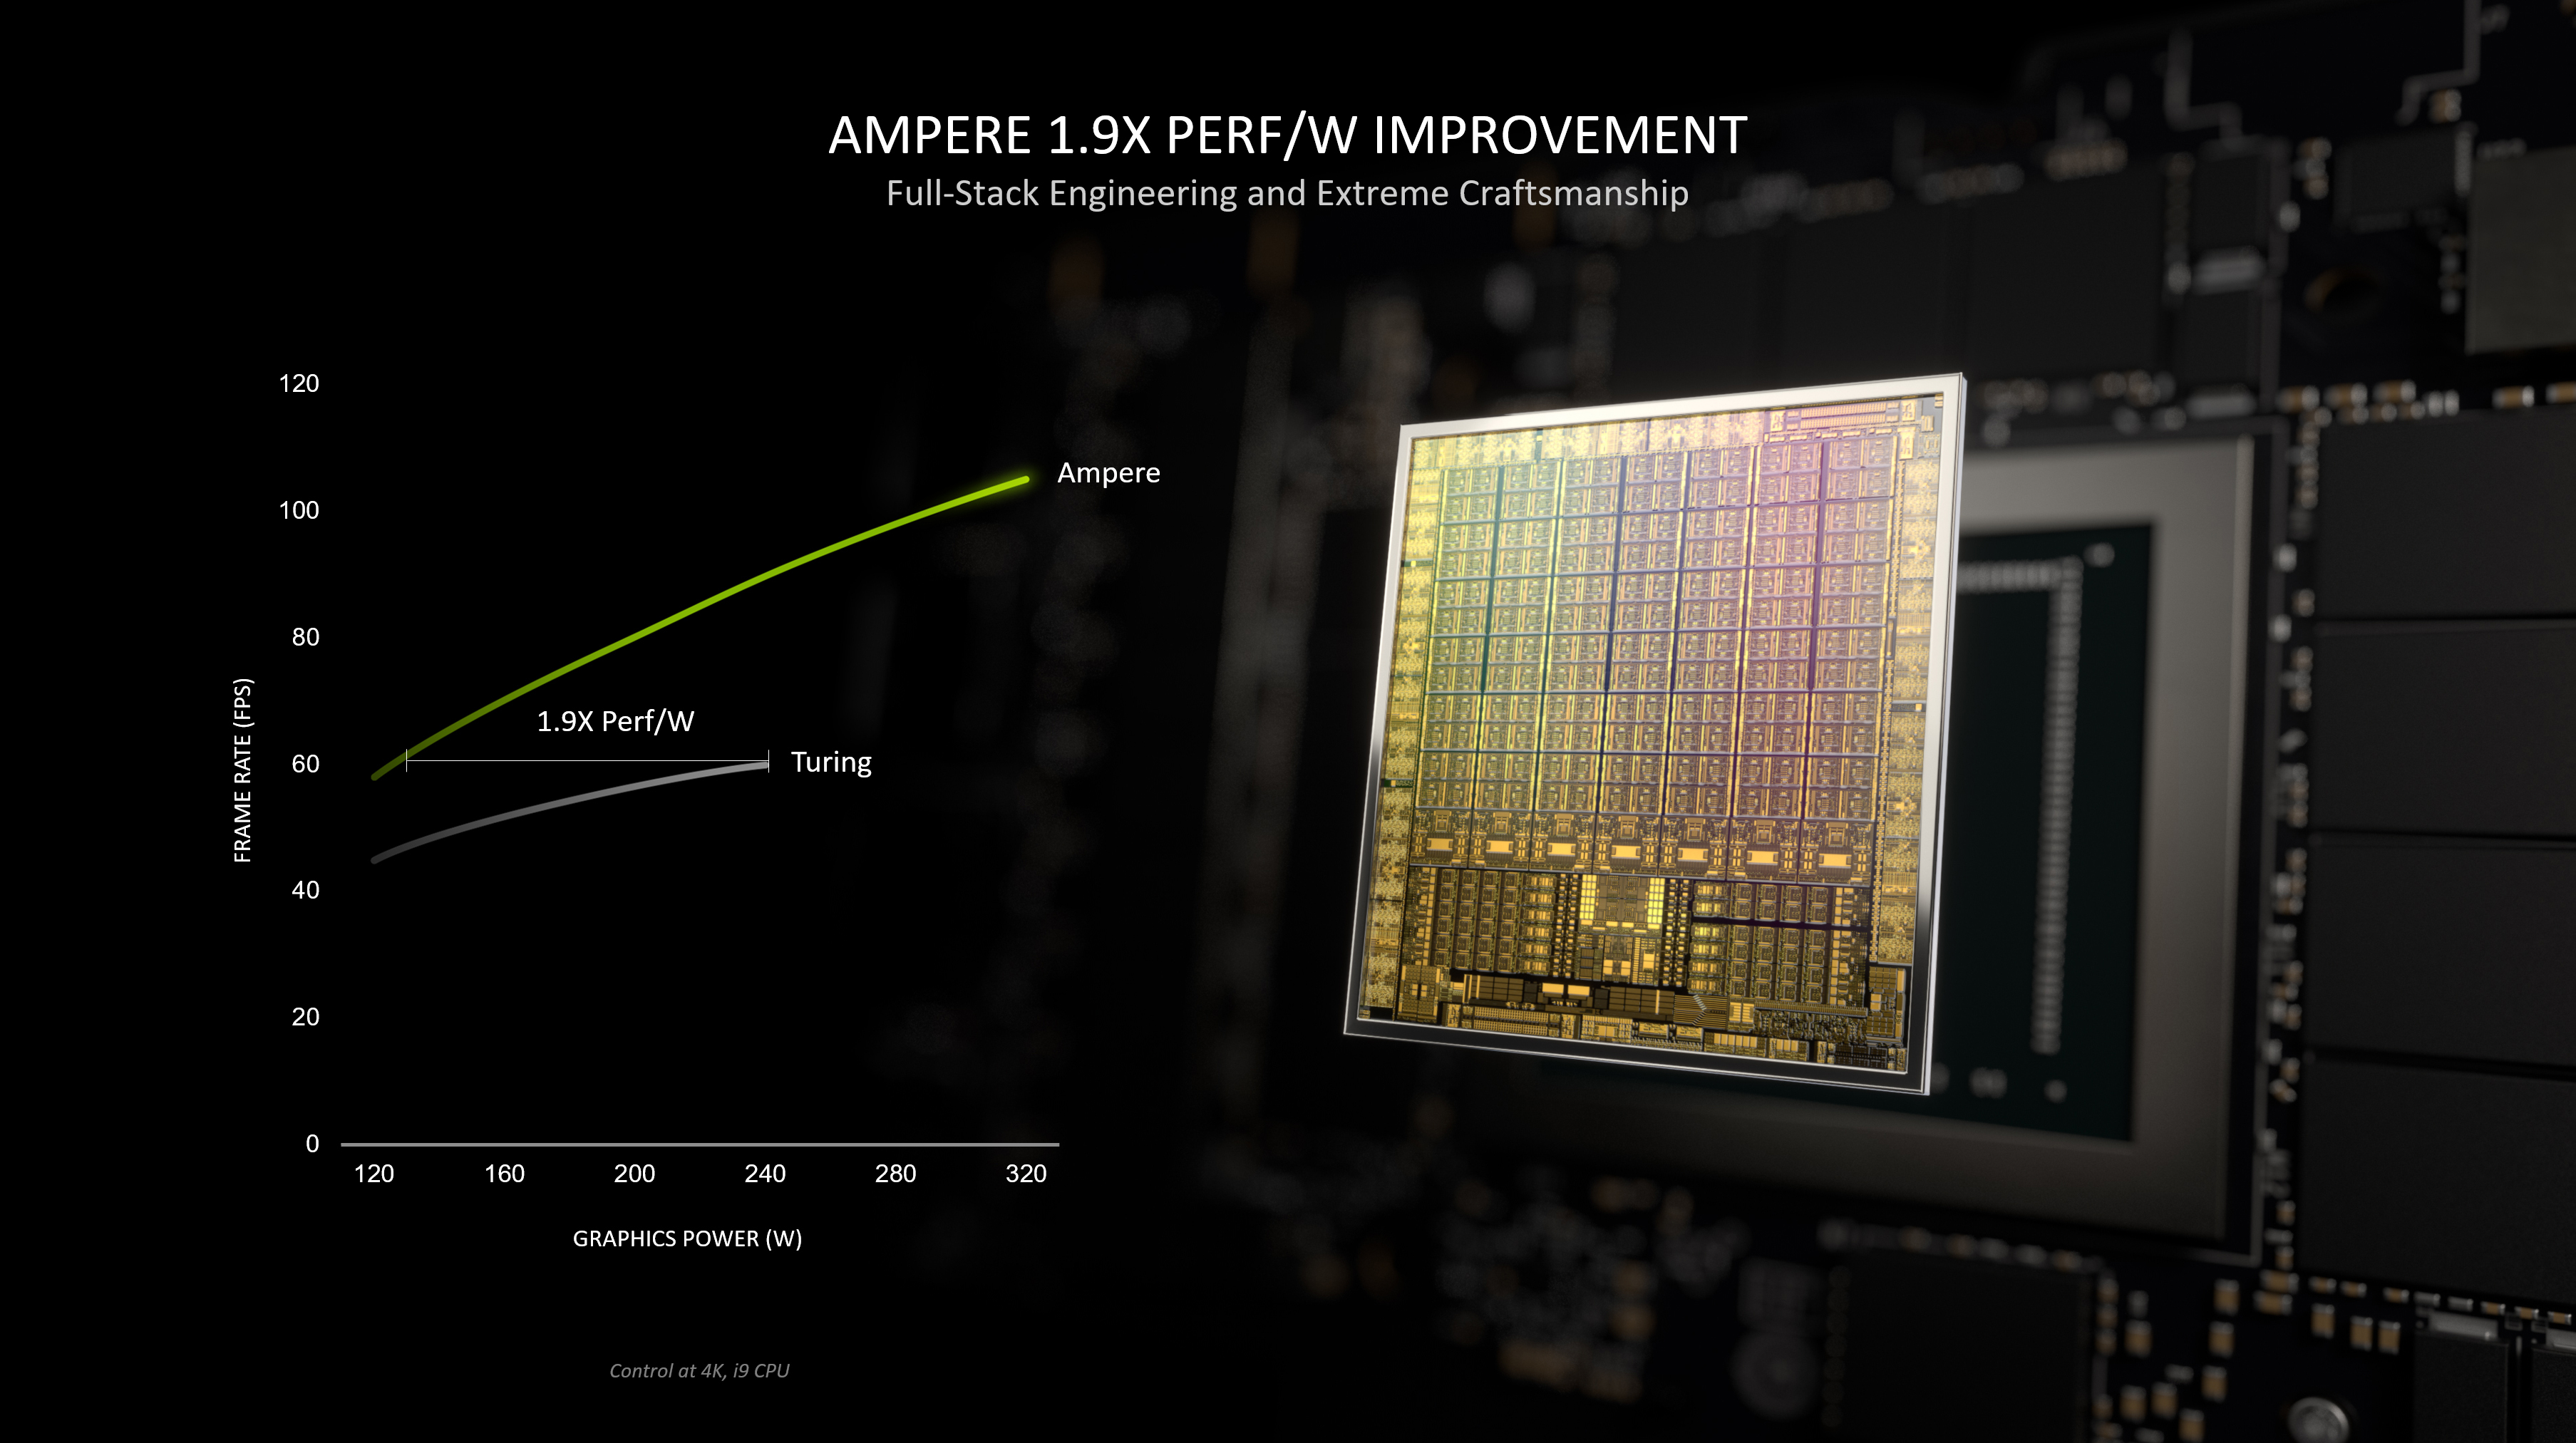
De huidige incarnatie van de Blade 15 vertrouwt nog steeds op de krachtige Alder Lake en Ampere hardware, maar biedt ook een verleidelijke upgrade: Razer is geg...
Intel Core i9-12900H | NVIDIA GeForce RTX 3070 Ti Laptop GPU | 15.60" | 2 kg
Asus ProArt StudioBook 16 in review

Asus ProArt StudioBook 16 H7600ZW Review: Het definitieve MacBook Pro alternatief voor content creators

Asus probeert het MacBook Pro-publiek het hof te maken met de ProArt StudioBook 16 met een Core i9-12900H en RTX 3070 Ti combinatie gekoppeld aan een levendig 1...
Intel Core i9-12900H | NVIDIA GeForce RTX 3070 Ti Laptop GPU | 16.00" | 2.4 kg
Asus ROG Zephyrus M16 laptop review: Een goed afgerond gaming pakket

Asus ROG Zephyrus M16 laptop review: Een goed afgerond gaming pakket

Met een Core i9-12900H, RTX 3070 Ti en DDR5 RAM bevat de Zephyrus M16 een aantal krachtige hardware. Onze uitgebreide test laat zien of de gaming laptop tegen h...
Intel Core i9-12900H | NVIDIA GeForce RTX 3070 Ti Laptop GPU | 16.00" | 2.1 kg
Aorus 15 XE5 review: Compacte QHD gaming laptop met Thunderbolt 4

Aorus 15 XE5 review: Compacte QHD gaming laptop met Thunderbolt 4

Met de Aorus 15 XE5 brengt Gigabyte opnieuw een 15,6 inch compacte gaming notebook op de markt. De laptop blinkt onder andere uit door zijn indrukwekkende prest...
Intel Core i7-12700H | NVIDIA GeForce RTX 3070 Ti Laptop GPU | 15.60" | 2.3 kg
Schenker Vision 16 Pro Laptop Review - Lichtgewicht 16-inch Ultrabook met RTX 3070 Ti

Schenker Vision 16 Pro Laptop Review - Lichtgewicht 16-inch Ultrabook met RTX 3070 Ti

Schenker's nieuwe Vision 16 Pro is een 16-inch multimedia laptop met een gewicht van slechts 1,6 kg. Dit betekent niet dat het ontbreekt aan prestaties en het 2...
Intel Core i7-12700H | NVIDIA GeForce RTX 3070 Ti Laptop GPU | 16.00" | 1.7 kg

Acer Predator Helios 300 (i7-12700H, RTX 3070 Ti): Intel Core i7-12700H, 17.30", 3 kg
  Testrapport » Acer Predator Helios 300 review: Overgeklokte gaming laptop met een goed beeldscherm

Acer Nitro 5 AN515-46-R1A1: AMD Ryzen 7 6800H, 15.60", 2.5 kg
  Testrapport » Acer Nitro 5 AN515-46 review: krachtige FHD gaming met USB 4

SCHENKER XMG Neo 15 (Ryzen 9 6900HX, RTX 3070 Ti): AMD Ryzen 9 6900HX, 15.60", 2.3 kg
  Testrapport » Schenker XMG Neo 15 gaming laptop review: Ryzen 6000 met poorten voor vloeistofkoeling

Lenovo Legion 5 Pro 16ARH7H RTX 3070 Ti: AMD Ryzen 7 6800H, 16.00", 2.6 kg
  Testrapport » Lenovo Legion 5 Pro Gen 7 laptop review: Ryzen 7 6800H of Ryzen 9 6900HX?

MSI Creator Z17 A12UGST-054: Intel Core i9-12900H, 17.00", 2.5 kg
  Testrapport » MSI Creator Z17 Laptop review: Wat krijgen creatieven en gamers voor ongeveer 4.000 euro?

HP Omen 17-ck1075ng: Intel Core i7-12700H, 17.30", 2.8 kg
  Testrapport » HP Omen 17 (2022) gaming laptop in review: Stijlvolle behuizing en hardware met veel potentieel

Aorus 17X XES: Intel Core i9-12900HX, 17.30", 2.7 kg
  Testrapport » Aorus 17X XES review: Gaming laptop met een i9-12900HX biedt topprestaties

Asus ROG Flow X16 GV601RW-M5082W: AMD Ryzen 9 6900HS, 16.10", 2.1 kg
  Testrapport » Asus ROG Flow X16 laptop review: 2-in-1 gamer met mini-LED

MSI GE67 HX 12UGS: Intel Core i7-12800HX, 15.60", 2.5 kg
  Testrapport » De Intel Core i7-12800HX is waanzinnig: MSI Raider GE67 HX 12UGS laptop review

Eurocom Raptor X15: Intel Core i7-12700K, 15.60", 2.7 kg
  Testrapport » Eurocom Raptor X15 review: LGA1700 Core i7-12700K in een laptop

Acer Nitro 5 AN515-58-72QR: Intel Core i7-12700H, 15.60", 2.5 kg
  Testrapport » Acer Nitro 5 AN515-58 review: Snelle QHD gaming notebook

MSI Katana GF66 12UGS: Intel Core i7-12700H, 15.60", 2.3 kg
  Testrapport » MSI Katana GF66 12UGS laptop review: De update naar Alder Lake brengt aanzienlijk meer prestaties

Asus ROG Strix Scar 15 G533ZW-LN106WS: Intel Core i9-12900H, 15.60", 2.3 kg
  Testrapport » Asus ROG Strix Scar 15 G533ZW Laptop Review: 1440p 240 Hz gaming krachtpatser met Alder Lake Core i9 en 150 W RTX 3070 Ti

MSI Katana GF76 12UGS: Intel Core i7-12700H, 17.30", 2.7 kg
  Testrapport » MSI Katana GF76 12UGS review: Is een van de meest betaalbare RTX 3070 Ti gaming laptops de moeite waard?

MSI Vector GP76 12UGS-434: Intel Core i7-12700H, 17.30", 2.9 kg
  Testrapport » MSI Vector GP76 12UGS review: Gaming laptop op snelheid

Razer Blade 17 (i7-12800H, RTX 3070 Ti): Intel Core i7-12800H, 17.30", 2.8 kg
  Testrapport » Razer Blade 17 laptop review: RTX 3070 Ti of RTX 3080 Ti - Wat is de superieure Blade?

Razer Blade 14 Ryzen 9 6900HX: AMD Ryzen 9 6900HX, 14.00", 1.8 kg
  Testrapport » AMD Ryzen 9 6900HX debuut: Razer Blade 14 laptop review

HP Omen 16-b1090ng: Intel Core i7-12700H, 16.10", 2.3 kg
  Testrapport » HP Omen 16 (2022) review: Gelikte gaming laptop met hoge resolutie 165 Hz beeldscherm

Aorus 17 XE4: Intel Core i7-12700H, 17.30", 2.6 kg
  Testrapport » Aorus 17 XE4 Review: Krachtig gaming-notebook met 360 Hz scherm

Lenovo Legion 5 Pro 16 G7 i7 RTX 3070Ti: Intel Core i7-12700H, 16.00", 2.6 kg
  Testrapport » Lenovo Legion 5i Pro 16 G7 Review: Gaming laptop nu met Alder Lake en RTX 3070 Ti

MSI Vector GP66 12UGS: Intel Core i9-12900H, 15.60", 2.3 kg
  Testrapport » MSI Vector GP66 12UGS laptop review: 150 W TGP GeForce RTX 3070 Ti sweet spot

MSI Stealth GS66 12UGS: Intel Core i7-12700H, 15.60", 2.2 kg
  Testrapport » MSI Stealth GS66 12UGS gaming laptop review: Krachtig genoeg voor QHD

Acer Predator Helios 300 PH317-56-72QY: Intel Core i7-12700H, 17.30", 3 kg
  Extern testrapport » Acer Predator Helios 300 PH317-56-72QY

HP ZBook Studio 16 G9, i7-12700H RTX 3070 Ti: Intel Core i7-12700H, 16.00", 1.7 kg
  Extern testrapport » HP ZBook Studio 16 G9, i7-12700H RTX 3070 Ti

Acer Predator Helios 300 PH315-55-98R7: Intel Core i9-12900H, 15.60", 2.6 kg
  Extern testrapport » Acer Predator Helios 300 PH315-55-98R7

Razer Blade 15 OLED (Early 2022): Intel Core i9-12900H, 15.60", 2 kg
  Extern testrapport » Razer Blade 15 OLED (Early 2022)

HP Omen 16-k0097ng: Intel Core i9-12900H, 16.10", 2.4 kg
  Extern testrapport » HP Omen 16-k0097ng

HP Omen 17-ck1075ng: Intel Core i7-12700H, 17.30", 2.8 kg
  Extern testrapport » HP Omen 17-ck1075ng

Acer ConceptD 5 CN516-73G-70XD: Intel Core i7-12700H, 16.00", 2.4 kg
  Extern testrapport » Acer ConceptD 5 CN516-73G-70XD

Razer Blade 17 (i7-12800H, RTX 3070 Ti): Intel Core i7-12800H, 17.30", 2.8 kg
  Extern testrapport » Razer Blade 17 (i7-12800H, RTX 3070 Ti)

HP Omen 16-k0168ng: Intel Core i7-12700H, 16.10", 2.4 kg
  Extern testrapport » HP Omen 16-k0168ng

MSI Raider GE77 HX 12UGS: Intel Core i7-12800HX, 17.30", 2.9 kg
  Extern testrapport » MSI Raider GE77 HX 12UGS

MSI Vector GP66 12UGSO-671RU: Intel Core i7-12700H, 15.60", 2.4 kg
  Extern testrapport » MSI Vector GP66 12UGSO-671RU

Lenovo Legion 7 16IAX7-82TD0075GE: Intel Core i7-12800HX, 16.00", 2.5 kg
  Extern testrapport » Lenovo Legion 7 16IAX7-82TD0075GE

HP Omen 16-n0007ns: AMD Ryzen 9 6900HX, 16.10", 2.3 kg
  Extern testrapport » HP Omen 16-n0007ns

HP Omen 16-n0598nd: AMD Ryzen 9 6900HX, 16.00", 2.3 kg
  Extern testrapport » HP Omen 16-n0598nd

MSI Vector GP76 12UGS-491ES: Intel Core i7-12700H, 17.30", 2.8 kg
  Extern testrapport » MSI Vector GP76 12UGS-491ES

Asus ROG Strix Scar 17 SE G733CW-LL044W: Intel Core i9-12950HX, 17.30", 2.9 kg
  Extern testrapport » Asus ROG Strix Scar 17 SE G733CW-LL044W

Lenovo Legion 5 Pro 16ARH7H RTX 3070 Ti: AMD Ryzen 7 6800H, 16.00", 2.6 kg
  Extern testrapport » Lenovo Legion 5 Pro 16ARH7H RTX 3070 Ti

Acer Predator Triton 300 SE PT316-51s-74RM: Intel Core i7-12700H, 16.00", 2.4 kg
  Extern testrapport » Acer Predator Triton 300 SE PT316-51s-74RM

Lenovo ThinkPad X1 Extreme G5, i7-12800H RTX 3070 Ti: Intel Core i7-12800H, 16.00", 1.9 kg
  Extern testrapport » Lenovo ThinkPad X1 Extreme G5, i7-12800H RTX 3070 Ti

Lenovo Legion 5 Pro 16IAH7H, i9-12900H RTX 3070 Ti: Intel Core i9-12900H, 16.00", 2.5 kg
  Extern testrapport » Lenovo Legion 5 Pro 16IAH7H, i9-12900H RTX 3070 Ti

Asus ROG Strix G17 G713RW-LL009: AMD Ryzen 9 6900HX, 17.30", 2.8 kg
  Extern testrapport » Asus ROG Strix G17 G713RW-LL009

Acer Predator Helios 300 PH315-55-764C: Intel Core i7-12700H, 15.60", 2.6 kg
  Extern testrapport » Acer Predator Helios 300 PH315-55-764C

Gigabyte Aero 16 XE5: Intel Core i7-12700H, 16.00", 2.3 kg
  Extern testrapport » Gigabyte Aero 16 XE5

Razer Blade 15 2022 RZ09-0421NGG3-R3G1: Intel Core i9-12900H, 15.60", 2 kg
  Extern testrapport » Razer Blade 15 2022 RZ09-0421NGG3-R3G1

Acer Predator Helios 300 PH315-55-902L: Intel Core i9-12900H, 15.60", 2.6 kg
  Extern testrapport » Acer Predator Helios 300 PH315-55-902L

Lenovo Legion 5 Pro 16 G7 i7 RTX 3070Ti: Intel Core i7-12700H, 16.00", 2.6 kg
  Extern testrapport » Lenovo Legion 5 Pro 16 G7 i7 RTX 3070Ti

Acer Nitro 5 AN515-46-R606: AMD Ryzen 7 6800H, 15.60", 2.5 kg
  Extern testrapport » Acer Nitro 5 AN515-46-R606

Dell G15 5520, i7-12700H RTX 3070 Ti: Intel Core i7-12700H, 15.60", 2.7 kg
  Extern testrapport » Dell G15 5520, i7-12700H RTX 3070 Ti

Acer Predator Helios 300 PH315-55-766X: Intel Core i7-12700H, 15.60", 2.4 kg
  Extern testrapport » Acer Predator Helios 300 PH315-55-766X

MSI Raider GE76 12UGS-018NL: Intel Core i7-12700H, 17.30", 2.9 kg
  Extern testrapport » MSI Raider GE76 12UGS-018NL

Alienware x15 R2 YMGXH: Intel Core i7-12700H, 15.60", 2.5 kg
  Extern testrapport » Alienware x15 R2 YMGXH

Asus ROG Flow X16 GV601RW-M5093W: AMD Ryzen 7 6800HS, 16.00", 2.1 kg
  Extern testrapport » Asus ROG Flow X16 GV601RW-M5093W

MSI Creator Z16P B12UGST: Intel Core i9-12900H, 16.00", 2.4 kg
  Extern testrapport » MSI Creator Z16P B12UGST

MSI Raider GE67 HX 12UGS-002: Intel Core i7-12800HX, 15.60", 2.4 kg
  Extern testrapport » MSI Raider GE67 HX 12UGS-002

MSI Raider GE76 12UGS-070: Intel Core i7-12800HX, 15.60", 2.9 kg
  Extern testrapport » MSI Raider GE76 12UGS-070

MSI Stealth GS66 12UGS-025: Intel Core i9-12900H, 15.60", 2.1 kg
  Extern testrapport » MSI Stealth GS66 12UGS-025

MSI Stealth GS77 12UH-088ES: Intel Core i7-12700H, 17.30", 2.8 kg
  Extern testrapport » MSI Stealth GS77 12UH-088ES

Lenovo Legion 5 Pro 16IAH7H-82RF000TUS: Intel Core i7-12700H, 16.00", 2.5 kg
  Extern testrapport » Lenovo Legion 5 Pro 16IAH7H-82RF000TUS

Acer Predator Helios 300 PH315-55-79FW: Intel Core i7-12700H, 15.60", 2.6 kg
  Extern testrapport » Acer Predator Helios 300 PH315-55-79FW

Asus ROG Flow X16 GV601RW-M5082W: AMD Ryzen 9 6900HS, 16.10", 2.1 kg
  Extern testrapport » Asus ROG Flow X16 GV601RW-M5082W

MSI Katana GF66 12UGS: Intel Core i7-12700H, 15.60", 2.3 kg
  Extern testrapport » MSI Katana GF66 12UGS

Alienware m17 R5, 6900HX RTX 3070 Ti : AMD Ryzen 9 6900HX, 17.30", 3.3 kg
  Extern testrapport » Alienware m17 R5, 6900HX RTX 3070 Ti

Asus Zephyrus G15 GA503RW-LN030W: AMD Ryzen 9 6900HS, 15.60", 1.9 kg
  Extern testrapport » Asus Zephyrus G15 GA503RW-LN030W

MSI Vector GP66 12UGS-207XFR: Intel Core i7-12700H, 15.60", 2.4 kg
  Extern testrapport » MSI Vector GP66 12UGS-207XFR

MSI Vector GP76 12UGS-618: Intel Core i9-12900HK, 17.30", 2.8 kg
  Extern testrapport » MSI Vector GP76 12UGS-618

Razer Blade 14 Ryzen 9 6900HX: AMD Ryzen 9 6900HX, 14.00", 1.8 kg
  Extern testrapport » Razer Blade 14 Ryzen 9 6900HX

HP Omen 16-b1090ng: Intel Core i7-12700H, 16.10", 2.3 kg
  Extern testrapport » HP Omen 16-b1090ng

Aorus 15 XE5: Intel Core i7-12700H, 15.60", 2.3 kg
  Extern testrapport » Aorus 15 XE5

MSI Creator Z17 A12UGST-049: Intel Core i7-12700H, 17.30", 2.5 kg
  Extern testrapport » MSI Creator Z17 A12UGST-049

Aorus 15 XE4: Intel Core i7-12700H, 15.60", 2.4 kg
  Extern testrapport » Aorus 15 XE4

Acer Predator Helios 300 PH317-56-718D: Intel Core i7-12700H, 17.30", 3 kg
  Extern testrapport » Acer Predator Helios 300 PH317-56-718D

Asus ROG Strix Scar 15 G533ZW-AS94: Intel Core i9-12900H, 15.60", 2.4 kg
  Extern testrapport » Asus ROG Strix Scar 15 G533ZW-AS94

Razer Blade 15 RZ09-0421NGD3-R3G1: Intel Core i7-12800H, 15.60", 2 kg
  Extern testrapport » Razer Blade 15 RZ09-0421NGD3-R3G1

Asus ROG Strix G17 G713RW-LL103W: AMD Ryzen 9 6900HX, 17.30", 2.8 kg
  Extern testrapport » Asus ROG Strix G17 G713RW-LL103W

Asus ROG Strix G15 G513RW-HQ021W: AMD Ryzen 9 6900HX, 15.60", 2.3 kg
  Extern testrapport » Asus ROG Strix G15 G513RW-HQ021W

MSI Stealth GS77 12UGS-065: Intel Core i7-12700H, 17.30", 2.8 kg
  Extern testrapport » MSI Stealth GS77 12UGS-065

MSI Raider GE76 12UGS-493: Intel Core i7-12700H, 17.30", 2.9 kg
  Extern testrapport » MSI Raider GE76 12UGS-493

Acer Nitro 5 AN517-55-78NJ: Intel Core i7-12700H, 17.30", 3 kg
  Extern testrapport » Acer Nitro 5 AN517-55-78NJ

Alienware m15 R7-D8YK4: Intel Core i7-12700H, 15.60", 2.7 kg
  Extern testrapport » Alienware m15 R7-D8YK4

Lenovo Legion 5 Pro 16IAH7H-82RF000VGE: Intel Core i7-12700H, 16.00", 2.5 kg
  Extern testrapport » Lenovo Legion 5 Pro 16IAH7H-82RF000VGE

Acer Predator Triton 500 SE PT516-52s-73YD: Intel Core i7-12700H, 16.00", 2.4 kg
  Extern testrapport » Acer Predator Triton 500 SE PT516-52s-73YD

MSI Stealth GS66 12UGS: Intel Core i7-12700H, 15.60", 2.2 kg
  Extern testrapport » MSI Stealth GS66 12UGS

Asus ROG Zephyrus M16 GU603ZW-K8062W: Intel Core i9-12900H, 16.00", 1.9 kg
  Extern testrapport » Asus ROG Zephyrus M16 GU603ZW-K8062W

Asus ROG Strix Scar 15 G533ZW-LN106WS: Intel Core i9-12900H, 15.60", 2.3 kg
  Extern testrapport » Asus ROG Strix Scar 15 G533ZW-LN106WS

Asus ROG Strix Scar 15 G533ZW-LN017W: Intel Core i9-12900H, 15.60", 2.4 kg
  Extern testrapport » Asus ROG Strix Scar 15 G533ZW-LN017W

Aorus 17 XE4: Intel Core i7-12700H, 17.30", 2.6 kg
  Extern testrapport » Aorus 17 XE4

MSI Vector GP76 12UGS-434: Intel Core i7-12700H, 17.30", 2.9 kg
  Extern testrapport » MSI Vector GP76 12UGS-434

Acer Predator Helios 300 PH305-55: Intel Core i7-12700H, 15.60", 2.5 kg
  Extern testrapport » Acer Predator Helios 300 PH305-55

Asus ROG Strix G17 G733ZW-LL103W: Intel Core i9-12900H, 17.30", 2.9 kg
  Extern testrapport » Asus ROG Strix G17 G733ZW-LL103W

Alienware x17 R2, i7-12700H 3070 Ti 4K: Intel Core i7-12700H, 17.30", 3.1 kg
  Extern testrapport » Alienware x17 R2, 12900HK 3080 Ti FHD

Acer Nitro 5 AN515-58-75UH: Intel Core i7-12700H, 15.60", 2.5 kg
  Extern testrapport » Acer Nitro 5 AN515-58-75UH

MSI GE66 Raider 10UG-605ES: Intel Core i7-10870H, 15.60", 2.4 kg
  Extern testrapport » MSI GE66 Raider 10UG-605ES

Lenovo Legion 5 Pro 16ARH7H RTX 3070 Ti: AMD Ryzen 7 6800H, 16.00", 2.6 kg
   » De Ryzen 9 6900HX is geldverspilling in vergelijking met de Ryzen 7 6800H en de benchmarks bewijzen het

Razer Blade 14 Ryzen 9 6900HX: AMD Ryzen 9 6900HX, 14.00", 1.8 kg
   » AMD Ryzen 9 6900HX vs. Core i7-12800H: Intel nog steeds in het voordeel

Please share our article, every link counts!

Klasse 1

GeForce RTX 3080 Laptop GPU
GeForce RTX 2080 Super Mobile
GeForce RTX 3070 Laptop GPU

Klasse 2

GeForce RTX 3060 Laptop GPU
M1 Max 32-Core GPU *
GeForce RTX 2070 Super Mobile
M1 Max 24-Core GPU *
Quadro RTX 5000 Max-Q
Radeon RX 5700M *
Quadro RTX 4000 (Laptop)
M1 Pro 16-Core GPU *
Radeon PRO W6600M *
GeForce RTX 2070 Super Max-Q
Quadro RTX 4000 Max-Q *
M1 Pro 14-Core GPU *
Quadro P5200
GeForce GTX 1080 Max-Q
GeForce GTX 1070 Mobile
Quadro P4200
Quadro P5000
GeForce GTX 1070 Max-Q
Quadro P5000 Max-Q *
GeForce RTX 3050 4GB Laptop GPU
Quadro P4000
Quadro P4000 Max-Q
Quadro P3200
Radeon RX 580X (Laptop) *
Radeon RX 580 (Laptop)
Radeon Pro 5300M
Radeon RX 5300M
Quadro P3000
Quadro P3000 Max-Q *
Quadro T2000 Max-Q *
Radeon Pro WX 7100 *
Radeon RX 570X (Laptop) *
Radeon RX 570 (Laptop) *
Radeon RX 470 (Laptop) *
Quadro T1000 Max-Q *

Klasse 3

Vega M GH
GeForce GTX 1050 Ti Mobile
Radeon 680M
Quadro P2000
Quadro P2000 Max-Q
Quadro M4000M
T500 Laptop GPU *
Radeon R9 M395X
GeForce GTX 1050 Ti Max-Q *
Radeon Pro Vega 16
WX Vega M GL
Radeon R9 M485X
Quadro M3000M
FirePro W7170M
GeForce GTX 1050 Max-Q *
Radeon 660M
Radeon Pro WX 4150 *
Radeon RX 560X (Laptop)
Radeon RX 560 (Laptop)
Quadro M2200
Quadro P1000
Radeon Pro 560X
Radeon Pro 560
Radeon Pro 460
Radeon Pro WX 4130 *
Quadro P620 *
Radeon RX 550X (Laptop)
Radeon RX 550 (Laptop)
Radeon Pro WX 3200 *
Radeon Pro 555X
Radeon Pro 555
Radeon Pro 455
Quadro P600
Radeon RX 540X *
Radeon Pro WX 2100 *
Radeon Pro WX 3100 *
Radeon Pro 450
Radeon 630
Radeon 540X *
Radeon R9 M385X
Quadro P520
Quadro M620 *
Quadro P500 *
Iris Plus Graphics G7 (Ice Lake 64 EU) *
Vega 10 *
Iris Pro Graphics 580
FirePro W5170M *
Vega 9
FirePro W5130M
UHD Graphics Xe G4 48EUs *
UHD Graphics 32EUs
UHD Graphics Xe 32EUs (Tiger Lake-H) *
UHD Graphics 750
UHD Graphics 730
Vega 7
Radeon R7 M465
Quadro M520
Vega 8
Iris Plus Graphics G4 (Ice Lake 48 EU)
Quadro M600M
FirePro W4190M
Radeon R9 M375
Radeon R7 M445
Iris Plus Graphics 650
Radeon 625
Vega 6 *
UHD Graphics 24EUs (Alder Lake-N) *
Radeon R7 M460 *
Radeon R7 M360
Radeon 620
Radeon R7 M340
Radeon 610
Radeon 610M *
Vega 6 *
UHD Graphics G1 (Ice Lake 32 EU)
UHD Graphics Xe 16EUs (Tiger Lake-H) *
Radeon R5 (Bristol Ridge)
Adreno 690 *
Adreno 685 *
Adreno 680 *
Radeon R5 M330
GeForce 910M

Klasse 4

Radeon R5 M320 *
Radeon R5 M315 *
Radeon R5 M420 *
UHD Graphics 617
UHD Graphics 615
UHD Graphics (Jasper Lake 24 EU) *
UHD Graphics 610
HD Graphics 610
UHD Graphics 605
Radeon R4 (Stoney Ridge)
Radeon R2 (Stoney Ridge)
VideoCore VII *
UHD Graphics 600

* Benaderende positie van de videokaart

> Overzichten en testrapporten over laptops en mobieltjes > FAQ / Techniek > Vergelijking van Video Kaarten > NVIDIA > NVIDIA GeForce RTX 3070 Ti Laptop GPU
Klaus Hinum, 2022-04- 3 (Update: 2022-04- 3)