Notebook-testrapporten met NVIDIA GeForce RTX 4060 Laptop GPU grafische kaart
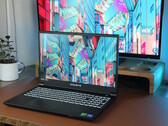
Asus TUF Gaming A16 Review: Koele, stille en betaalbare gaming laptop met een prominente maar werkbare zwakte
Een Ryzen AI 9 HX 370 plus een RTX 4060 en een 144 Hz beeldscherm met een resolutie van 1.200p zijn de belangrijkste troeven van de Asus TUF Gaming A16. Wij testen deze relatief betaalbare 16-inch gaming laptop en bekijken de prestaties ten opzichte van de concurrentie.
AMD Ryzen AI 9 HX 370, NVIDIA GeForce RTX 4060 Laptop GPU, 16", 2.2 kgSchenker Key 14 review - 100 W RTX 4060 in een compacte multimedia-laptop
Met de Key 14 heeft Schenker een compacte 14-inch notebook in zijn assortiment met een voorgekalibreerd 120 Hz beeldscherm en een keuze uit snelle dedicated grafische kaarten van Nvidia. Wij hebben de SKU getest die gebouwd is rond de GeForce RTX 4060 Laptop met een TGP van 100 watt.
Intel Core Ultra 7 155H, NVIDIA GeForce RTX 4060 Laptop GPU, 14", 1.7 kgAcer Nitro V 16 ANV16-41 beoordeling: Een betaalbare gaminglaptop met een kink in de kabel
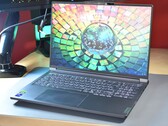
De Nitro V16 is een gaming-laptop van rond de 1000 dollar die meer dan behoorlijke prestaties levert voor zijn prijs (Ryzen 8000 & RTX 4060). Ontdek hier of het 16-inch apparaat het net zo goed deed in alle andere categorieën. Eerst dit: Acer heeft helaas op één belangrijk punt gefaald.
AMD Ryzen 7 8845HS, NVIDIA GeForce RTX 4060 Laptop GPU, 16", 2.5 kgGigabyte G5 KF5 2024 laptop test: RTX 4060 gaming voor een spotprijs - is de deal het waard?
Intel Core i7-13620H, een RTX 4060, plus 16 GB RAM en een 1 TB SSD - alles voor 899 euro. Veel goedkoper kunt u een RTX 4060-gamer momenteel niet krijgen. Wij controleren of de nieuwste G5 het geld waard is en een kandidaat is voor onze lijst van de voordeligste gaming laptops.
Intel Core i7-13620H, NVIDIA GeForce RTX 4060 Laptop GPU, 15.6", 2 kgLenovo ThinkBook 16p Gen 5 laptop in review: De verborgen Lenovo Legion voor ontwerpers
De Lenovo ThinkBook 16p Gen 5 IRX is het krachtigste model van de ThinkBook-laptopserie voor het MKB. Met een breedbeeldscherm, de sterkste i9 voor laptops en de Nvidia GeForce RTX 4060 richt hij zich op de creatieve en multimediamarkt. Maar niet alleen ontwerpers zullen hem aantrekkelijk vinden - de ThinkBook is ook geschikt voor games.
Intel Core i9-14900HX, NVIDIA GeForce RTX 4060 Laptop GPU, 16", 2.2 kgLenovo ThinkPad P1 Gen 7 21KV001SGE: Intel Core Ultra 7 155H, 16.00", 2 kg
Testrapport » Lenovo ThinkPad P1 Gen 7 beoordeling: Zonder TrackPoint-knoppen, met Nvidia GeForce RTX 4060
Acer Nitro 14 AN14-41-R3MX: AMD Ryzen 5 8645HS, 14.50", 2 kg
Testrapport » Acer Nitro 14 (2024) beoordeling: Compacte RTX 4060 gaming notebook met lange accuduur
Asus TUF Gaming A14 FA401WV-WB94: AMD Ryzen AI 9 HX 370, 14.00", 1.5 kg
Testrapport » Asus TUF Gaming A14 FA401WV beoordeling: Zen 5 Ryzen 9 blijft indruk maken
Nubia RedMagic Titan 16 Pro: Intel Core i9-14900HX, 16.00", 2.4 kg
Testrapport » RedMagic Titan 16 Pro beoordeling: Een gaming-laptop gemaakt door een smartphonefabrikant
Asus ROG Zephyrus G16 GA605WV: AMD Ryzen AI 9 HX 370, 16.00", 1.8 kg
Testrapport » Asus ROG Zephyrus G16 2024 review - De slanke gaming laptop nu met AMD Zen 5
Asus TUF Gaming A15 FA507UV: AMD Ryzen 9 8945H, 15.60", 2.1 kg
Testrapport » Asus TUF Gaming A15 (2024) beoordeling: RTX 4060-kracht, matige prijs, lange batterijlevensduur
Lenovo LOQ 15IRX9: Intel Core i5-13450HX, 15.60", 2.4 kg
Testrapport » Lenovo LOQ 15 beoordeling: De FHD gaming laptop met een RTX 4060 van rond de US$1,000
Lenovo Legion Pro 5 16IRX9 G9: Intel Core i7-14700HX, 16.00", 2.5 kg
Testrapport » Lenovo Legion Pro 5i laptop review: Super krachtige i7-14700HX en RTX 4060 prestaties
Dell Inspiron 16 Plus 7640: Intel Core Ultra 7 155H, 16.00", 2.2 kg
Testrapport » Dell Inspiron 16 Plus 7640 laptop test: Kleine maar belangrijke wijzigingen ten opzichte van het model van vorig jaar
Schenker XMG Core 15 (M24): AMD Ryzen 7 8845HS, 15.30", 2.1 kg
Testrapport » SCHENKER XMG Core 15 (M24) laptop test: Een eersteklas gamingmachine met metalen behuizing uit Duitsland
Tulpar T7 V20.6: Intel Core i7-13700H, 17.30", 2.6 kg
Testrapport » Tulpar T7 V20.6 (Tongfang GM7PG0R) laptop review: Momenteel een van de goedkoopste RTX 4060-gamers
HP Victus 16 (2024): Intel Core i7-14700HX, 16.10", 2.4 kg
Testrapport » HP Victus 16 (2024) laptop review: RTX 4060-kracht gekoppeld aan lange looptijden
Gigabyte G6X 9KG (2024): Intel Core i7-13650HX, 16.00", 2.6 kg
Testrapport » Gigabyte G6X 9KG (2024) review: Betaalbare gaming notebook met RTX 4060
HP Omen Transcend 14-fb0014: Intel Core Ultra 7 155H, 14.00", 1.6 kg
Testrapport » HP Omen Transcend 14 laptop test: Razer Blade alternatief het overwegen waard
Honor MagicBook Pro 16 2024: Intel Core Ultra 7 155H, 16.00", 1.9 kg
Testrapport » Honor MagicBook Pro 16 2024 - Een multimedia-laptop met een 165 Hz IPS-paneel en RTX 4060
Dell G16, i7-13650HX, RTX 4060: Intel Core i7-13650HX, 16.00", 2.8 kg
Testrapport » Dell G16 (2024) laptop test: Een betaalbaar Alienware-alternatief van dezelfde fabrikant?
Lenovo Legion 5 16IRX G9: Intel Core i7-14650HX, 16.00", 2.4 kg
Testrapport » Lenovo Legion 5i 16 G9 review - De snelle gaming-laptop met Raptor Lake-HX en een AI-engine
Colorful EVOL X15 AT 23: Intel Core i7-13700HX, 15.60", 2.3 kg
Testrapport » Kleurrijke EVOL X15 AT 23 Review: Indrukwekkende QHD-gamer met Raptor Lake-HX en een paar niet te missen eigenaardigheden
Lenovo Legion Slim 7 16APH8: AMD Ryzen 7 7840HS, 16.00", 2.1 kg
Testrapport » Lenovo Legion Slim 7 16 gaming laptop in review: Overtuigend, zelfs met AMD Ryzen
Gigabyte G5 KF: Intel Core i5-12500H, 15.60", 1.9 kg
Testrapport » Gigabyte G5 KF review: Gaming laptop met RTX 4060 voor 969 euro
Schenker XMG Apex 17 (Late 23): AMD Ryzen 7 7840HS, 17.30", 2.5 kg
Testrapport » XMG Apex 17 (eind 23) review: een QHD gaming laptop met een RTX 4060
Asus ROG Flow X13 GV302XV: AMD Ryzen 9 7940HS, 13.40", 1.3 kg
Testrapport » Asus ROG Flow X13 GV302XV (2023) Review: Slanke gaming convertible die een punch inpakt met AMD Zen 4 Ryzen 9 7940HS en 60 W Nvidia RTX 4060
Microsoft Surface Laptop Studio 2 RTX 4060: Intel Core i7-13700H, 14.40", 2 kg
Testrapport » Microsoft Surface Laptop Studio 2 Review - Multimedia-convertible met snellere onderdelen
MSI Raider GE68HX 13VF: Intel Core i9-13950HX, 16.00", 2.7 kg
Testrapport » MSI Raider GE68 HX 13VF laptop review: Een compleet nieuw ontwerp
Lenovo LOQ 16IRH8: Intel Core i7-13620H, 16.00", 2.7 kg
Testrapport » Lenovo LOQ 16 gaming laptop review: Waar zit de kink in de kabel vergeleken met de duurdere Legion?
Captiva Advanced Gaming I74-121: Intel Core i5-13500H, 15.60", 2.3 kg
Testrapport » Captiva Advanced Gaming I74-121 (Clevo V150RND) review: Een goedkope gaming laptop met een krachtige RTX 4060
Lenovo Legion Slim 5 14APH8: AMD Ryzen 7 7840HS, 14.50", 1.7 kg
Testrapport » Lenovo Legion Slim 5 14APH8 laptop review: 120 Hz 2.8K OLED sweet spot
Alienware m16 R1 Intel: Intel Core i7-13700HX, 16.00", 3 kg
Testrapport » Alienware m16 R1 test: QHD-gamingmachine met RTX 4060 en Thunderbolt 4
Dell Inspiron 16 Plus 7630: Intel Core i7-13700H, 16.00", 2.2 kg
Testrapport » Dell Inspiron 16 Plus 7630 laptop review: 60 W GeForce RTX 4060 is zo slecht nog niet
Lenovo Legion Slim 5 16APH8: AMD Ryzen 7 7840HS, 16.00", 2.4 kg
Testrapport » Lenovo Legion Slim 5 16APH8 laptop review: Ondergewaardeerd ontwerp met een ondermaats presterende GPU
Lenovo Yoga Pro 9 16-IRP G8: Intel Core i7-13705H, 16.00", 2.2 kg
Testrapport » Lenovo Yoga Pro 9i 16 laptop test: Geweldig mini-LED-paneel, maar onnodige kostenbesparende maatregelen
Asus Vivobook Pro 16X K6604JV-MX016W: Intel Core i9-13980HX, 16.00", 2.1 kg
Testrapport » Asus Vivobook Pro 16X review: Creator notebook met een uitstekende processor
Acer Predator Helios 16 PH16-71-731Q: Intel Core i7-13700HX, 16.00", 2.6 kg
Testrapport » Acer Predator Helios 16 laptop review: Een stille gaming laptop met veel sterke punten
Schenker XMG Pro 15 (E23): Intel Core i9-13900HX, 15.60", 2.4 kg
Testrapport » Schenker XMG Pro 15 E23 (PD50SND-G) gaminglaptop besproken: Op de balans tussen werk en ontspanning!
Acer Nitro 17 AN17-51-71ER: Intel Core i7-13700H, 17.30", 3 kg
Testrapport » Een review van Acer's stille Nitro 17 laptop: De RTX 4060, perfect geconfigureerd
Dell G15 5530: Intel Core i7-13650HX, 15.60", 3 kg
Testrapport » Dell G15 5530 Review: Een levensvatbaar Alienware-alternatief nu met Raptor Lake-HX
Asus ROG Flow X16 GV601V: Intel Core i9-13900H, 16.00", 2.1 kg
Testrapport » De slanke Asus ROG Flow X16 laptop review: Een krachtig, 16-inch gaming workstation 2-in-1 met een aanraakscherm
Asus ZenBook Pro 14 Duo UX8402VV-P1021W: Intel Core i9-13900H, 14.50", 1.8 kg
Testrapport » Asus ZenBook Pro 14 Duo laptop review met tweede scherm voor creatieven: Verhoogde productiviteit
Medion Erazer Defender P40: Intel Core i7-13700HX, 17.30", 2.9 kg
Testrapport » Medion Erazer Defender P40 review: De betaalbare QHD gaming laptop met een RTX 4060
Lenovo Legion Pro 5 16IRX8: Intel Core i7-13700HX, 16.00", 2.5 kg
Testrapport » Lenovo Legion Pro 5 16IRX8 laptop review: Een flinke US$1600 voor de GeForce RTX 4060
Asus ROG Flow Z13 GZ301V: Intel Core i9-13900H, 13.40", 1.6 kg
Testrapport » Asus ROG Flow Z13 in review: Waanzin - RTX 4060 in een indrukwekkende gaming tablet
MSI Cyborg 15 A12VF: Intel Core i7-12650H, 15.60", 2 kg
Testrapport » MSI Cyborg 15 A12VF review: Gaming laptop met low-power RTX 4060
MSI Katana 17 B13VFK: Intel Core i7-13620H, 17.30", 2.8 kg
Testrapport » MSI Katana 17 B13V laptop review: Nvidia GeForce RTX 4060 maakt zijn debuut
MSI Thin A15 B7VF: AMD Ryzen 7 7735HS, 15.60", 1.9 kg
Extern testrapport » MSI Thin A15 B7VF
MSI Creator A16 AI+ A3HVFG: AMD Ryzen AI 9 HX 370, 16.00", 2.1 kg
Extern testrapport » MSI Creator A16 AI+ A3HVFG
Acer Nitro V16 AI ANV16-61: AMD Ryzen AI 7 350, 16.00", 2.4 kg
Extern testrapport » Acer Nitro V16 AI ANV16-61
Asus TUF Gaming F15 FX507VV, i7-13620H: Intel Core i7-13620H, 15.60", 2.2 kg
Extern testrapport » Asus TUF Gaming F15 FX507VV, i7-13620H
Acer Nitro 5 AN515-58, i9-12900H RTX 4060: Intel Core i9-12900H, 15.60", 2.6 kg
Extern testrapport » Acer Nitro 5 AN515-58, i9-12900H RTX 4060
Asus TUF Gaming A17 FA707NVR: AMD Ryzen 7 7435HS, 17.30", 2.6 kg
Extern testrapport » Asus TUF Gaming A17 FA707NVR
HP Omen Transcend 14-fb0000ng, Ultra 9 185H: Intel Core Ultra 9 185H, 14.00", 1.6 kg
Extern testrapport » HP Omen Transcend 14-fb0000ng, Ultra 9 185H
Schenker XMG Core 15 (M24): AMD Ryzen 7 8845HS, 15.30", 2.1 kg
Extern testrapport » SCHENKER XMG Core 15 (M24)
Acer Nitro 16 AN16-42, RTX 4060: AMD Ryzen 7 8845HS, 16.00", 2.7 kg
Extern testrapport » Acer Nitro 16 AN16-42, RTX 4060
Acer Nitro V 16 ANV16-41-R5AT: AMD Ryzen 7 8845HS, 16.00", 2.5 kg
Extern testrapport » Acer Nitro V 16 ANV16-41-R5AT
Acer Predator Triton Neo 16 PTN16-51, Ultra 9 185H: Intel Core Ultra 9 185H, 16.00", 2.1 kg
Extern testrapport » Acer Predator Triton Neo 16 PTN16-51, Ultra 9 185H
MSI VenturePro 16 AI A1VFG: Intel Core Ultra 7 155H, 16.00", 1.9 kg
Extern testrapport » MSI VenturePro 16 AI A1VFG
Lenovo Legion 5 15IRX9: Intel Core i7-13650HX, 15.60", 2.3 kg
Extern testrapport » Lenovo Legion 5 15IRX9
MSI Stealth A16 AI+ A3XVFG: AMD Ryzen AI 9 365, 16.00", 2.1 kg
Extern testrapport » MSI Stealth A16 AI+ A3XVFG
Acer Nitro V16 ANV16-71: Intel Core i7-14650HX, 16.00", 2.5 kg
Extern testrapport » Acer Nitro V16 ANV16-71
Acer Nitro V15 ANV15-41: AMD Ryzen 7 7735HS, 15.60", 2.1 kg
Extern testrapport » Acer Nitro V15 ANV15-41
Acer Nitro V15 ANV15-41, R5 7535HS: AMD Ryzen 5 7535HS, 15.60", 2.1 kg
Extern testrapport » Acer Nitro V15 ANV15-41, R5 7535HS
MSI Sword 16 HX B14VFKG, i7-14700HX: Intel Core i7-14700HX, 16.00", 2.3 kg
Extern testrapport » MSI Sword 16 HX B14VFKG, i7-14700HX
Asus TUF Gaming A16 FA608WV: AMD Ryzen AI 9 HX 370, 16.00", 2.2 kg
Extern testrapport » Asus TUF Gaming A16 FA608WV
MSI Prestige 14 AI Studio C1VFG, Ultra 9 185H: Intel Core Ultra 9 185H, 14.00", 1.7 kg
Extern testrapport » MSI Prestige 14 AI Studio C1VFG, Ultra 9 185H
Lenovo Legion 5 16IRX9, i9-14900HX: Intel Core i9-14900HX, 16.00", 2.3 kg
Extern testrapport » Lenovo Legion 5 16IRX9, i9-14900HX
MSI Cyborg 15 AI A1VFK: Intel Core Ultra 7 155H, 15.60", 2 kg
Extern testrapport » MSI Cyborg 15 AI A1VFK
Lenovo Yoga Pro 9 16IMH9, Ultra 7 155H: Intel Core Ultra 7 155H, 16.00", 2.1 kg
Extern testrapport » Lenovo Yoga Pro 9 16IMH9, Ultra 7 155H
MSI Sword 16 HX B14VFKG, i7-14650HX: Intel Core i7-14650HX, 16.00", 2.3 kg
Extern testrapport » MSI Sword 16 HX B14VFKG, i7-14650HX
MSI Prestige 14 AI Studio C1VFG: Intel Core Ultra 7 155H, 14.00", 1.7 kg
Extern testrapport » MSI Prestige 14 AI Studio C1VFG
Acer Predator Helios Neo 14 PHN14-51, RTX 4060: Intel Core Ultra 9 185H, 14.50", 1.9 kg
Extern testrapport » Acer Predator Helios Neo 14 PHN14-51, RTX 4060
Acer Nitro 16 AN16-73, i7-14700HX: Intel Core i7-14700HX, 16.00", 2.5 kg
Extern testrapport » Acer Nitro 16 AN16-73, i7-14700HX
Lenovo LOQ 15IRX9, i7-13650HX RTX 4060: Intel Core i7-13650HX, 15.60", 2.4 kg
Extern testrapport » Lenovo LOQ 15IRX9, i7-13650HX RTX 4060
Acer Nitro V16 ANV16-41, R7 8845HS RTX 4060: AMD Ryzen 7 8845HS, 16.00", 2.5 kg
Extern testrapport » Acer Nitro V16 ANV16-41, R7 8845HS RTX 4060
Alienware x14 R2: Intel Core i7-13620H, 14.00", 1.9 kg
Extern testrapport » Alienware x14 R2
Gigabyte Aero 16 OLED BKF: Intel Core i7-13700H, 16.00", 2.1 kg
Extern testrapport » Gigabyte Aero 16 OLED BKF
Asus TUF Gaming A14 FA401UV: AMD Ryzen 7 8845HS, 14.00", 1.5 kg
Extern testrapport » Asus TUF Gaming A14 FA401UV
Acer Nitro 16 AN16-73: Intel Core i7-14650HX, 16.00", 2.5 kg
Extern testrapport » Acer Nitro 16 AN16-73
Asus ProArt PX13 HN7306WV: AMD Ryzen AI 9 HX 370, 13.30", 1.4 kg
Extern testrapport » Asus ProArt PX13 HN7306, RTX 4060
MSI Crosshair 16 HX D14VFKG: Intel Core i7-14700HX, 16.00", 2.5 kg
Extern testrapport » MSI Crosshair 16 HX D14VFKG
Acer Nitro V16 ANV16-41, RTX 4060: AMD Ryzen 5 8645HS, 16.00", 2.5 kg
Extern testrapport » Acer Nitro V16 ANV16-41, RTX 4060
Asus TUF Gaming A14 FA401WV-WB94: AMD Ryzen AI 9 HX 370, 14.00", 1.5 kg
Extern testrapport » Asus TUF Gaming A14 FA401WV-WB94
Lenovo ThinkBook 16p G5 IRX 21N50011GE: Intel Core i9-14900HX, 16.00", 2.2 kg
Extern testrapport » Lenovo ThinkBook 16p G5 IRX 21N50011GE
Lenovo ThinkPad P1 Gen 7 21KV001SGE: Intel Core Ultra 7 155H, 16.00", 2 kg
Extern testrapport » Lenovo ThinkPad P1 Gen 7 21KV001SGE
HP Omen 16-wf1: Intel Core i9-14900HX, 16.10", 2.4 kg
Extern testrapport » HP Omen 16-wf1
Nubia RedMagic Titan 16 Pro: Intel Core i9-14900HX, 16.00", 2.4 kg
Extern testrapport » Nubia RedMagic Titan 16 Pro
MSI Prestige 16 AI Studio B1VFG, Ultra 7 155H: Intel Core Ultra 7 155H, 16.00", 1.6 kg
Extern testrapport » MSI Prestige 16 AI Studio B1VFG, Ultra 7 155H
Acer Nitro 16 AN16-41, R7 7840HS RTX 4060: AMD Ryzen 7 7840HS, 16.00", 2.7 kg
Extern testrapport » Acer Nitro 16 AN16-41, R7 7840HS RTX 4060
HP Victus 16-r1300: Intel Core i5-14500HX, 16.10", 2.3 kg
Extern testrapport » HP Victus 16-r1300
HP Omen 17-db0000: AMD Ryzen 9 8945HS, 17.30", 3 kg
Extern testrapport » HP Omen 17-db0000
Lenovo Legion Slim 5 16AHP9, RTX 4060: AMD Ryzen 7 8845HS, 16.00", 2.3 kg
Extern testrapport » Lenovo Legion Slim 5 16AHP9, RTX 4060
Acer Nitro 17 AN17-41-R38P: AMD Ryzen 7 7735HS, 17.30", 3.1 kg
Extern testrapport » Acer Nitro 17 AN17-41-R38P
Gigabyte G6 KF: Intel Core i7-13620H, 16.00", 2.3 kg
Extern testrapport » Gigabyte G6 KF
Acer Nitro 14 AN14-41: AMD Ryzen 7 8845HS, 14.50", 2 kg
Extern testrapport » Acer Nitro 14 AN14-41
Aorus 16X 2024 9KG: Intel Core i7-13650HX, 16.00", 2.3 kg
Extern testrapport » Aorus 16X 2024 9KG
Lenovo Yoga Pro 7 14IMH9, Ultra 9 185H RTX 4060: Intel Core Ultra 9 185H, 14.50", 1.6 kg
Extern testrapport » Lenovo Yoga Pro 7 14IMH9, Ultra 9 185H RTX 4060
Acer Nitro V 15 ANV15-51, i9-13900H: Intel Core i9-13900H, 15.60", 2.1 kg
Extern testrapport » Acer Nitro V 15 ANV15-51, i9-13900H
Lenovo Yoga Pro 9 16IMH9, RTX 4060: Intel Core Ultra 9 185H, 16.00", 2.1 kg
Extern testrapport » Lenovo Yoga Pro 9 16IMH9, RTX 4060
Asus ROG Zephyrus G16 GU605MV: Intel Core Ultra 7 155H, 16.00", 1.9 kg
Extern testrapport » Asus ROG Zephyrus G16 GU605MV
Lenovo Legion Pro 5 16IRX9, i9-14900HX RTX 4060: Intel Core i9-14900HX, 16.00", 2.5 kg
Extern testrapport » Lenovo Legion Pro 5 16IRX9, i9-14900HX RTX 4060
Acer Nitro 17 AN17-42: AMD Ryzen 7 8845HS, 17.30", 3.1 kg
Extern testrapport » Acer Nitro 17 AN17-42
MSI Sword 16 HX B14VFKG, i9-14900HX: Intel Core i9-14900HX, 16.00", 2.3 kg
Extern testrapport » MSI Sword 16 HX B14VFKG, i9-14900HX
Asus ROG Zephyrus G16 2024 GU605MV: Intel Core Ultra 9 185H, 16.00", 1.9 kg
Extern testrapport » Asus ROG Zephyrus G16 2024 GU605MV
Acer Predator Triton Neo 16 PTN16-51: Intel Core Ultra 7 155H, 16.00", 2.1 kg
Extern testrapport » Acer Predator Triton Neo 16 PTN16-51
Asus ROG Zephyrus G16 GA605WV: AMD Ryzen AI 9 HX 370, 16.00", 1.8 kg
Extern testrapport » Asus ROG Zephyrus G16 GA605WV
Asus TUF Gaming A14 FA401: AMD Ryzen AI 9 HX 370, 14.00", 1.5 kg
Extern testrapport » Asus TUF Gaming A14 FA401
Acer Predator Helios Neo 16 PHN16-72, RTX 4060: Intel Core i9-14900HX, 16.00", 2.5 kg
Extern testrapport » Acer Predator Helios Neo 16 PHN16-72, RTX 4060
Infinix GT Book 16: Intel Core i9-13900H, 16.00", 2 kg
Extern testrapport » Infinix GT Book 16
Asus VivoBook Pro 15 OLED N6506, Ultra 5 125H: Intel Core Ultra 5 125H, 15.60", 1.8 kg
Extern testrapport » Asus VivoBook Pro 15 OLED N6506, Ultra 5 125H
Acer Predator Helios Neo 16 PHN16-72, i7-14650HX RTX 4060: Intel Core i7-14650HX, 16.00", 2.5 kg
Extern testrapport » Acer Predator Helios Neo 16 PHN16-72, i7-14650HX RTX 4060
Lenovo Yoga Pro 7 14IMH9, RTX 4060: Intel Core Ultra 5 125H, 14.50", 1.6 kg
Extern testrapport » Lenovo Yoga Pro 7 14IMH9, RTX 4060
Asus ProArt P16 H7606: AMD Ryzen AI 9 HX 370, 16.00", 1.9 kg
Extern testrapport » Asus ProArt P16 H7606
Dell Inspiron 16 Plus 7640: Intel Core Ultra 7 155H, 16.00", 2.2 kg
Extern testrapport » Dell Inspiron 16 Plus 7640
Acer Predator Helios Neo 18 PHN18-71, i7-14650HX RTX 4060: Intel Core i7-14650HX, 18.00", 3.4 kg
Extern testrapport » Acer Predator Helios Neo 18 PHN18-71, i7-14650HX RTX 4060
Acer Predator Helios 18 PH18-71: Intel Core i9-13900HX, 18.00", 3.3 kg
Extern testrapport » Acer Predator Helios 18 PH18-71
MSI Prestige 16 AI Studio B1VFG: Intel Core Ultra 9 185H, 16.00", 1.6 kg
Extern testrapport » MSI Prestige 16 AI Studio B1VFG
Lenovo Legion Pro 5 16IRX9, i7-14650HX: Intel Core i7-14650HX, 16.00", 2.5 kg
Extern testrapport » Lenovo Legion Pro 5 16IRX9, i7-14650HX
Asus TUF Gaming F16 FX607JV: Intel Core i7-13650HX, 16.00", 2.3 kg
Extern testrapport » Asus TUF Gaming F16 FX607JV
Asus ROG Zephyrus G14 2024 GA403UV: AMD Ryzen 9 8945HS, 14.00", 1.5 kg
Extern testrapport » Asus ROG Zephyrus G14 2024 GA403UV
Asus VivoBook Pro 15 OLED N6506M: Intel Core Ultra 7 155H, 15.60", 1.8 kg
Extern testrapport » Asus VivoBook Pro 15 OLED N6506M
MSI Sword 16 HX B14VFKG: Intel Core Ultra 9 185H, 16.00", 2.3 kg
Extern testrapport » MSI Sword 16 HX B14VFKG
Asus TUF Gaming A15 FA507UI : AMD Ryzen 9 8945HS, 15.60", 2.2 kg
Extern testrapport » Asus TUF Gaming A15 FA507UI
HP Omen Transcend 16-u1000ng: Intel Core i7-14700HX, 16.00", 2.2 kg
Extern testrapport » HP Omen Transcend 16-u1000ng
HP Omen 16-wf1000: Intel Core i7-14700HX, 16.10", 2.4 kg
Extern testrapport » HP Omen 16-wf1000
MSI Raider GE68 HX 14VFG: Intel Core i7-14700HX, 16.00", 2.8 kg
Extern testrapport » MSI Raider GE68 HX 14VFG
Dell XPS 16 9640, RTX 4060: Intel Core Ultra 7 155H, 16.30", 2.1 kg
Extern testrapport » Dell XPS 16 9640, RTX 4060
Aorus 15 BKG: Intel Core Ultra 7 155H, 15.60", 2.4 kg
Extern testrapport » Aorus 15 BKG
Asus TUF Gaming A16 FA607PV: AMD Ryzen 9 7845HX, 16.00", 2.3 kg
Extern testrapport » Asus TUF Gaming A16 FA607PV
Asus ROG Zephyrus G14 OLED GA403UV: AMD Ryzen 9 8945HS, 14.00", 1.5 kg
Extern testrapport » Asus ROG Zephyrus G14 OLED GA403UV
Lenovo Legion 5 16IRX9: Intel Core i5-13450HX, 16.00", 2.3 kg
Extern testrapport » Lenovo Legion 5 16IRX9
Lenovo LOQ 15IRX9, i7-14700HX: Intel Core i7-14700HX, 16.00", 2.3 kg
Extern testrapport » Lenovo LOQ 15IRX9
Xiaomi Redmi G Pro 2024: Intel Core i9-14900HX, 16.00", 2.7 kg
Extern testrapport » Xiaomi Redmi G Pro 2024
Acer Nitro 16 AN16-41, R7 7735HS RTX 4060: AMD Ryzen 7 7735HS, 16.00", 2.7 kg
Extern testrapport » Acer Nitro 16 AN16-41, R7 7735HS RTX 4060
Honor MagicBook Pro 16 2024: Intel Core Ultra 7 155H, 16.00", 1.9 kg
Extern testrapport » Honor MagicBook Pro 16 2024
MSI Cyborg 14 A13VE: Intel Core i7-13620H, 14.00", 1.6 kg
Extern testrapport » MSI Cyborg 14 A13VE
Asus Vivobook Pro 15 OLED N6506: Intel Core Ultra 9 185H, 15.60", 1.8 kg
Extern testrapport » Asus Vivobook Pro 15 OLED N6506
Gigabyte G6X 9KG (2024): Intel Core i7-13650HX, 16.00", 2.6 kg
Extern testrapport » Gigabyte G6X 9KG (2024)
Lenovo Legion 5 16IRX G9: Intel Core i7-14650HX, 16.00", 2.4 kg
Extern testrapport » Lenovo Legion 5 16IRX G9
HP Omen Transcend 14-fb0014: Intel Core Ultra 7 155H, 14.00", 1.6 kg
Extern testrapport » HP Omen Transcend 14-fb0014
Acer Nitro 5 AN517-55-96S6: Intel Core i9-12900H, 17.30", 3 kg
Extern testrapport » Acer Nitro 5 AN517-55-96S6
Aorus 15X BKF: Intel Core i7-13700H, 15.60", 2.3 kg
Extern testrapport » Aorus 15X BKF
MSI Creator Z16 HX Studio B13VFT: Intel Core i7-13700H, 16.00", 2.4 kg
Extern testrapport » MSI Creator Z16 HX Studio B13VFT
Lenovo LOQ 16APH8: AMD Ryzen 5 7640HS, 16.00", 2.6 kg
Extern testrapport » Lenovo LOQ 16APH8
Acer Nitro 17 AN17-72: Intel Core i7-14700HX, 17.30", 3.2 kg
Extern testrapport » Acer Nitro 17 AN17-72
Asus VivoBook Pro 15 M6500XV: AMD Ryzen 9 7940HS, 15.60", 1.8 kg
Extern testrapport » Asus VivoBook Pro 15 M6500XV
Asus Zenbook Pro 14 OLED UX6404VV, i5-13500H: Intel Core i5-13500H, 14.50", 1.6 kg
Extern testrapport » Asus Zenbook Pro 14 OLED UX6404VV, i5-13500H
HP Victus 16-s0475ng: AMD Ryzen 7 7840HS, 16.10", 2.3 kg
Extern testrapport » HP Victus 16-s0475ng
Lenovo Legion Slim 5 16IRH8, i7-13700H RTX 4060: Intel Core i7-13700H, 16.00", 2.4 kg
Extern testrapport » Lenovo Legion Slim 5 16IRH8, i7-13700H RTX 4060
Asus ZenBook Pro 14 Duo UX8402VV: Intel Core i7-13700H, 14.50", 1.8 kg
Extern testrapport » Asus ZenBook Pro 14 Duo UX8402VV
HP Omen 16-wf0000ng: Intel Core i5-13500HX, 16.10", 2.4 kg
Extern testrapport » HP Omen 16-wf0000ng
MSI Stealth 16 Studio A13VG, i7-13620H: Intel Core i7-13620H, 17.30", 2.8 kg
Extern testrapport » MSI Stealth 16 Studio A13VG, i7-13620H
Acer Nitro 17 AN17-41-R182: AMD Ryzen 7 7840HS, 17.30", 3 kg
Extern testrapport » Acer Nitro 17 AN17-41-R182
Acer Nitro 17 AN17-51-71ER: Intel Core i7-13700H, 17.30", 3 kg
Extern testrapport » Acer Nitro 17 AN17-51-71ER
HP Omen Transcend 16-u0000ng: Intel Core i7-13700HX, 16.00", 2.2 kg
Extern testrapport » HP Omen Transcend 16-u0000ng
Lenovo LOQ 15IRH8, i5-13500H RTX 4060: Intel Core i5-13500H, 15.60", 2.4 kg
Extern testrapport » Lenovo LOQ 15IRH8, i5-13500H RTX 4060
HP Victus 16-s0000ax: AMD Ryzen 5 7640HS, 16.10", 2.3 kg
Extern testrapport » HP Victus 16-s0000ax
MSI Bravo 15 C7VF: AMD Ryzen 7 7735HS, 15.60", 2.3 kg
Extern testrapport » MSI Bravo 15 C7VF
Asus Zenbook Pro 14 OLED UX6404VV, i7-13700H: Intel Core i7-13700H, 14.50", 1.6 kg
Extern testrapport » Asus Zenbook Pro 14 OLED UX6404VV, i7-13700H
Asus VivoBook Pro 16X K6604JV: Intel Core i9-13980HX, 16.00", 1.9 kg
Extern testrapport » Asus VivoBook Pro 16X K6604JV
Asus TUF Gaming F17 FX707VV: Intel Core i9-13900H, 17.30", 2.6 kg
Extern testrapport » Asus TUF Gaming F17 FX707VV
HP Omen 16-xf0000: AMD Ryzen 7 7840HS, 16.10", 2.4 kg
Extern testrapport » HP Omen 16-xf0000
Lenovo LOQ 15, R7 7840HS RTX 4060: AMD Ryzen 7 7840HS, 15.60", 2.4 kg
Extern testrapport » Lenovo LOQ 15, R7 7840HS RTX 4060
MSI Stealth 16 Studio A13VF, i9-13900H: Intel Core i9-13900H, 16.00", 2 kg
Extern testrapport » MSI Stealth 16 Studio A13VF, i9-13900H
HP Victus 16-r0017ns: Intel Core i7-13700H, 16.10", 2.3 kg
Extern testrapport » HP Victus 16-r0017ns
Lenovo ThinkBook 16p G4: Intel Core i7-13700H, 16.00", 2.2 kg
Extern testrapport » Lenovo ThinkBook 16p G4
Dell Inspiron 16 Plus 7630, i7-13700H: Intel Core i7-13700H, 16.00", 2.1 kg
Extern testrapport » Dell Inspiron 16 Plus 7630, i7-13700H
Lenovo Legion Slim 5 14APH8: AMD Ryzen 7 7840HS, 14.50", 1.7 kg
Extern testrapport » Lenovo Legion Slim 5 14APH8
Microsoft Surface Laptop Studio 2 RTX 4060: Intel Core i7-13700H, 14.40", 2 kg
Extern testrapport » Microsoft Surface Laptop Studio 2 RTX 4060
Dell Inspiron 16 Plus 7630: Intel Core i7-13700H, 16.00", 2.2 kg
Extern testrapport » Dell Inspiron 16 Plus 7630
Asus VivoBook 16X OLED K3605VV: Intel Core i9-13900H, 16.00", 1.8 kg
Extern testrapport » Asus VivoBook 16X OLED K3605VV
MSI Stealth 15 A13VF: Intel Core i7-13620H, 15.60", 2.1 kg
Extern testrapport » MSI Stealth 15 A13VF
MSI Raider GE68 HX 13VF: Intel Core i9-13950HX, 16.00", 2.7 kg
Extern testrapport » MSI Raider GE68 HX 13VF
Alienware x14 R2 2023, RTX 4060: Intel Core i7-13620H, 14.00", 1.9 kg
Extern testrapport » Alienware x14 R2 2023, RTX 4060
Lenovo ThinkPad P1 G6: Intel Core i7-13700H, 16.00", 1.9 kg
Extern testrapport » Lenovo ThinkPad P1 G6
Aorus 15 9KF: Intel Core i5-12500H, 15.60", 2.3 kg
Extern testrapport » Aorus 15 9KF
Asus ROG Strix G17 G713PV: AMD Ryzen 9 7845HX, 17.30", 2.8 kg
Extern testrapport » Asus ROG Strix G17 G713PV
Lenovo Legion Slim 5 16IRH8: Intel Core i5-13500H, 16.00", 2.4 kg
Extern testrapport » Lenovo Legion Slim 5 16IRH8
Razer Blade 15 2023: Intel Core i7-13800H, 15.60", 2 kg
Extern testrapport » Razer Blade 15 2023
Asus ZenBook Pro 14 Duo UX8402VV-P1021W: Intel Core i9-13900H, 14.50", 1.8 kg
Extern testrapport » Asus ZenBook Pro 14 Duo UX8402VV-P1021W
Razer Blade 14 RTX 4060: AMD Ryzen 9 7940HS, 14.00", 1.8 kg
Extern testrapport » Razer Blade 14 RTX 4060
Lenovo LOQ 15IRH8, i7-13700H RTX 4060: Intel Core i7-13700H, 15.60", 2.4 kg
Extern testrapport » Lenovo LOQ 15IRH8, i7-13700H RTX 4060
Lenovo LOQ 16IRH8, i7-13700H RTX 4060: Intel Core i7-13700H, 16.00", 2.6 kg
Extern testrapport » Lenovo LOQ 16IRH8, i7-13700H RTX 4060
Asus ROG Zephyrus G14 GA402XV: AMD Ryzen 9 7940HS, 14.00", 1.7 kg
Extern testrapport » Asus ROG Zephyrus G14 GA402XV
Acer Predator Helios Neo 16 PHN16-71, i5-13500HX RTX 4060: Intel Core i5-13500HX, 16.00", 2.6 kg
Extern testrapport » Acer Predator Helios Neo 16 PHN16-71, i5-13500HX RTX 4060
HP Envy 16-h1000: Intel Core i9-13900H, 16.00", 2.7 kg
Extern testrapport » HP Envy 16-h1000
Acer Predator Helios 16 PH16-71-74UU: Intel Core i7-13700HX, 16.00", 2.7 kg
Extern testrapport » Acer Predator Helios 16 PH16-71-74UU
MSI Cyborg 15 A12VF, i5-12450H: Intel Core i5-12450H, 15.60", 2 kg
Extern testrapport » MSI Cyborg 15 A12VF, i5-12450H
Asus TUF Gaming F15 FX507VV: Intel Core i7-13700H, 15.60", 2.2 kg
Extern testrapport » Asus TUF Gaming F15 FX507VV
Lenovo Yoga Pro 9 14IRP G8, i9-13905H RTX 4060: Intel Core i9-13905H, 14.50", 1.7 kg
Extern testrapport » Lenovo Yoga Pro 9 14IRP G8, i9-13905H RTX 4060
MSI Cyborg 15 A12VF-248: Intel Core i7-12700H, 15.60", 2 kg
Extern testrapport » MSI Cyborg 15 A12VF-248
Lenovo Legion Slim 5 16APH8: AMD Ryzen 7 7840HS, 16.00", 2.4 kg
Extern testrapport » Lenovo Legion Slim 5 16APH8
Lenovo LOQ 16IRH8: Intel Core i7-13620H, 16.00", 2.7 kg
Extern testrapport » Lenovo LOQ 16IRH8
Acer Predator Helios 18 PH18-71-74ET: Intel Core i7-13700HX, 18.00", 3.3 kg
Extern testrapport » Acer Predator Helios 18 PH18-71-74ET
Medion Erazer Defender P40: Intel Core i7-13700HX, 17.30", 2.9 kg
Extern testrapport » Medion Erazer Defender P40
MSI Prestige 16 Studio A13VF: Intel Core i7-13700H, 16.00", 2.1 kg
Extern testrapport » MSI Prestige 16 Studio A13VF
MSI Cyborg 15 A13VF: Intel Core i7-13620H, 15.60", 2 kg
Extern testrapport » MSI Cyborg 15 A13VF
Dell XPS 15 9530 RTX 4060: Intel Core i7-13700H, 15.60", 1.9 kg
Extern testrapport » Dell XPS 15 9530 RTX 4060
Medion Erazer Deputy P50: Intel Core i7-13700HX, 15.60", 2.1 kg
Extern testrapport » Medion Erazer Deputy P50
Asus TUF Gaming A15 FA507NV: AMD Ryzen 7 7735HS, 15.60", 2.2 kg
Extern testrapport » Asus TUF Gaming A15 FA507NV
Dell G16 7630: Intel Core i7-13650HX, 15.60", 2.9 kg
Extern testrapport » Dell G16 7630
Asus TUF Gaming A15 FA507XV: AMD Ryzen 9 7940HS, 15.60", 2.2 kg
Extern testrapport » Asus TUF Gaming A15 FA507XV
Acer Nitro 17 AN17-71: Intel Core i7-13700HX, 17.30", 3.3 kg
Extern testrapport » Acer Nitro 17 AN17-71
MSI Stealth 14 Studio A13VF: Intel Core i7-13700H, 14.00", 1.7 kg
Extern testrapport » MSI Stealth 14 Studio A13VF
Asus VivoBook Pro 16 OLED K6602VV: Intel Core i9-13900H, 16.00", 1.9 kg
Extern testrapport » Asus VivoBook Pro 16 OLED K6602VV
Asus Zenbook Pro 14 OLED UX6404VV: Intel Core i9-13900H, 14.50", 1.6 kg
Extern testrapport » Asus Zenbook Pro 14 OLED UX6404VV
MSI Katana 17 B12VFK: Intel Core i7-12650H, 17.30", 2.6 kg
Extern testrapport » MSI Katana 17 B12VFK
Asus ROG Strix G16 G614JV, i7-13650HX: Intel Core i7-13650HX, 16.00", 2.5 kg
Extern testrapport » Asus ROG Strix G16 G614JV, i7-13650HX
Dell G15 5530: Intel Core i7-13650HX, 15.60", 3 kg
Extern testrapport » Dell G15 5530
MSI Summit E16 Flip A13 VFT: Intel Core i7-1360P, 16.00", 2.1 kg
Extern testrapport » MSI Summit E16 Flip A13 VFT
MSI Vector GP77 13VF: Intel Core i7-13700H, 17.30", 2.8 kg
Extern testrapport » MSI Vector GP77 13VF
MSI Stealth 16 Studio A13VF: Intel Core i7-13620H, 16.00", 2 kg
Extern testrapport » MSI Stealth 16 Studio A13VF
Alienware m16 R1 Intel: Intel Core i7-13700HX, 16.00", 3 kg
Extern testrapport » Alienware m16 R1, i7-13700HX RTX 4060
Acer Predator Helios 16 PH16-71-731Q: Intel Core i7-13700HX, 16.00", 2.6 kg
Extern testrapport » Acer Predator Helios 16 PH16-71-731Q
Lenovo LOQ 15IRH8, i7-13620H: Intel Core i7-13620H, 15.60", 2.4 kg
Extern testrapport » Lenovo LOQ 15IRH8, i7-13620H
Razer Blade 18 2023 RTX 4060: Intel Core i9-13950HX, 18.00", 3.2 kg
Extern testrapport » Razer Blade 18 2023 RTX 4060
Asus ROG Flow X13 GV302XV: AMD Ryzen 9 7940HS, 13.40", 1.3 kg
Extern testrapport » Asus ROG Flow X13 GV302XV
MSI Pulse 15 B13VFK: Intel Core i9-13900H, 15.60", 2.3 kg
Extern testrapport » MSI Pulse 15 B13VFK
MSI Pulse 17 B13VFK: Intel Core i7-13700H, 17.30", 2.7 kg
Extern testrapport » MSI Pulse 17 B13VFK
MSI Cyborg 15 A12VF: Intel Core i7-12650H, 15.60", 2 kg
Extern testrapport » MSI Cyborg 15 A12VF
MSI Katana 17 B13VFK: Intel Core i7-13620H, 17.30", 2.8 kg
Extern testrapport » MSI Katana 17 B13VFK
Acer Predator Helios Neo 16 PHN16-71-702Z: Intel Core i7-13700HX, 16.00", 2.6 kg
Extern testrapport » Acer Predator Helios Neo 16 PHN16-71-702Z
Asus ROG Strix G18 G814JV: Intel Core i7-13700HX, 18.00", 3 kg
Extern testrapport » Asus ROG Strix G18 G814JV
Asus ROG Strix G16 G614JV: Intel Core i9-13980HX, 16.00", 2.5 kg
Extern testrapport » Asus ROG Strix G16 G614JV
Asus ROG Flow X16 GV601V: Intel Core i9-13900H, 16.00", 2.1 kg
Extern testrapport » Asus ROG Flow X16 GV601V
Lenovo Legion Pro 5 16IRX8, i5-13500HX RTX 4060: Intel Core i5-13500HX, 16.00", 2.6 kg
Extern testrapport » Lenovo Legion Pro 5 16IRX8, i5-13500HX RTX 4060
Lenovo Legion Slim 7 16IRH8: Intel Core i7-13700H, 16.00", 2 kg
Extern testrapport » Lenovo Legion Slim 7 16IRH8
MSI Katana 15 B13VFK: Intel Core i7-13620H, 15.60", 2.3 kg
Extern testrapport » MSI Katana 15 B13VFK
Gigabyte G5 KF: Intel Core i5-12500H, 15.60", 1.9 kg
Extern testrapport » Gigabyte G5 KF
Asus ROG Flow Z13 GZ301V: Intel Core i9-13900H, 13.40", 1.6 kg
Extern testrapport » Asus ROG Flow Z13 GZ301V
Asus ROG Zephyrus G16 GU603VV: Intel Core i7-13620H, 16.00", 2 kg
Extern testrapport » Asus ROG Zephyrus G16 GU603VV
Lenovo Legion Pro 5 16IRX8: Intel Core i7-13700HX, 16.00", 2.5 kg
Extern testrapport » Lenovo Legion Pro 5 16IRX8
Asus ROG Zephyrus G16 GU603VV-N4007W: Intel Core i9-13900H, 16.00", 2 kg
Extern testrapport » Asus ROG Zephyrus G16 2023 GU603VV-N4007W
MSI Prestige 16 AI Studio B1VFG, Ultra 7 155H: Intel Core Ultra 7 155H, 16.00", 1.6 kg
» Intel Core 200 Geekbench lek tipt nieuwe laptop CPU als rebranded Raptor Lake gaming processor
Acer Nitro 14 AN14-41-R3MX: AMD Ryzen 5 8645HS, 14.50", 2 kg
» De Acer Nitro 14 is een QHD gaming notebook met fatsoenlijke thermiek en een batterijduur van 18 uur
Microsoft Surface Laptop Studio 2 RTX 4060: Intel Core i7-13700H, 14.40", 2 kg
» Microsofts nieuwe Surface Laptops zijn duur, maar de producten zijn niet goed genoeg