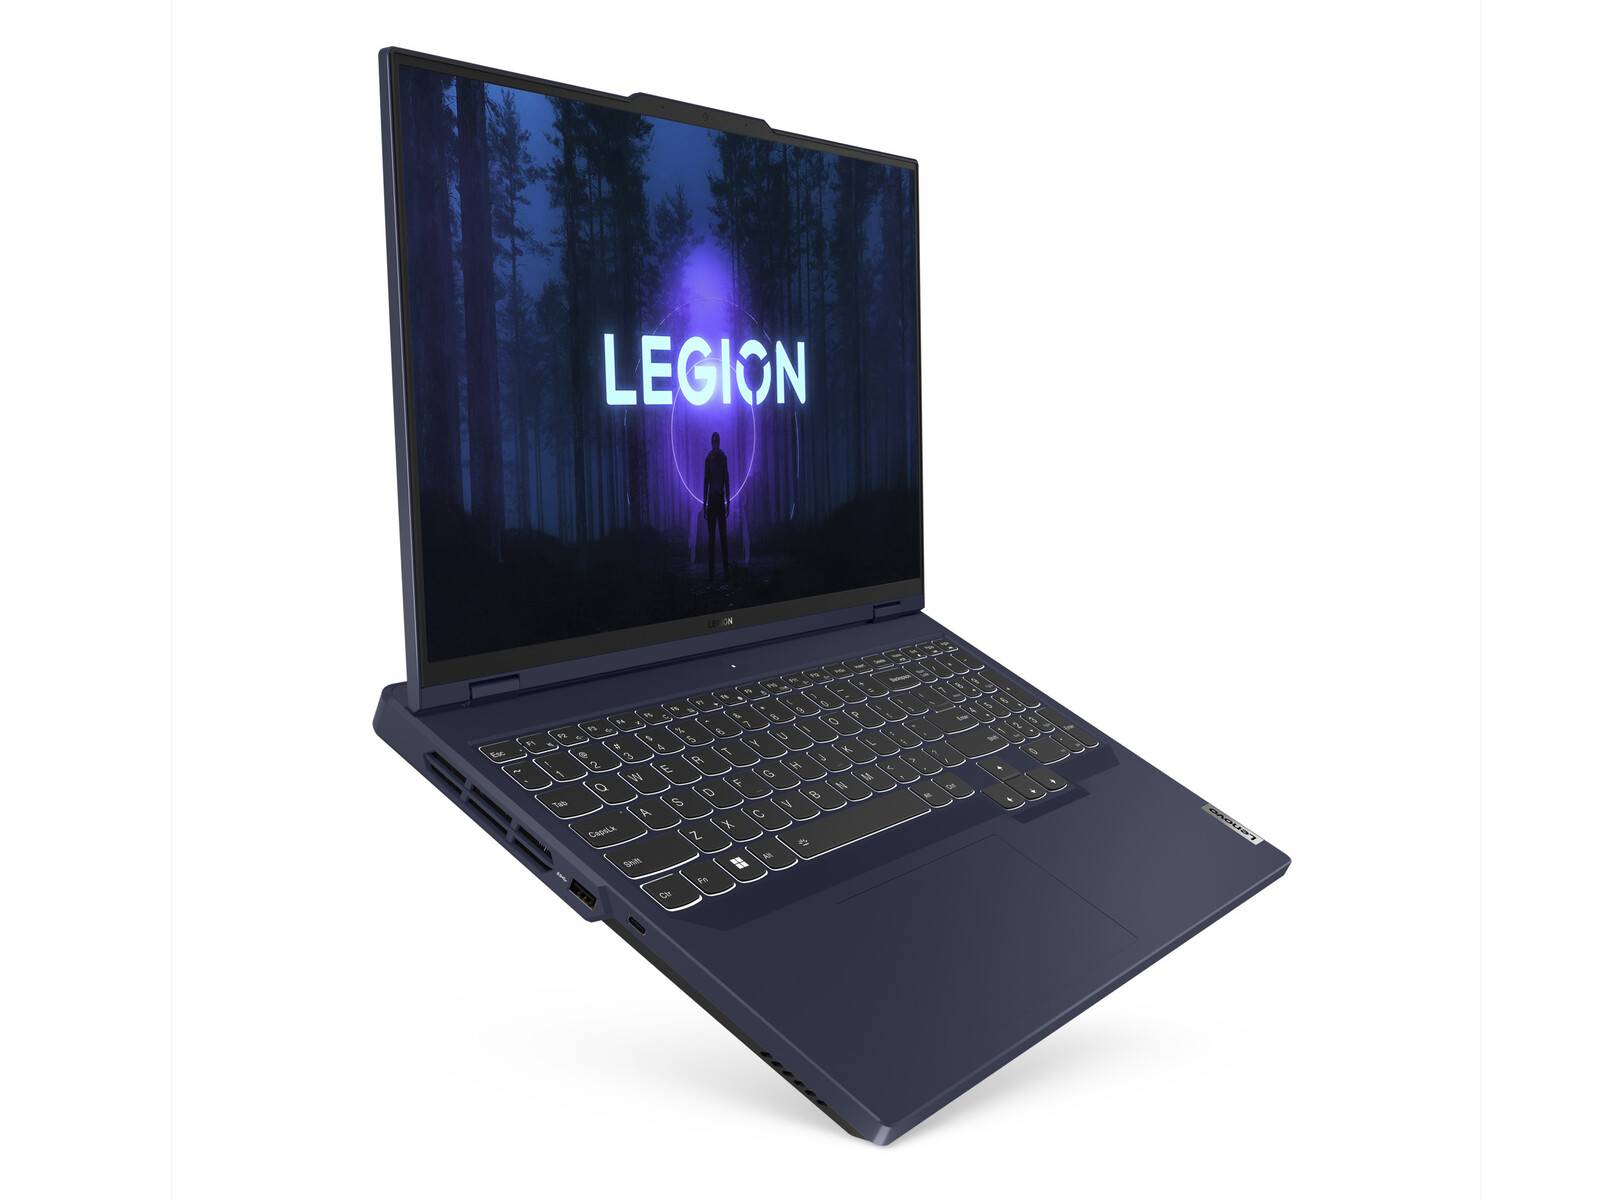
Lenovo Legion Pro 5 16IRX8 laptop review: Een flinke US$1600 voor de GeForce RTX 4060
De Legion Pro 5 16 IRX8 (of Legion Pro 5i 16 Gen 8) is de opvolger van de 2022 Legion Pro 5i 16 Gen 7. Het introduceert verschillende veranderingen, waaronder een chassis revisie met 13e gen Intel Raptor Lake-H CPU en Nvidia Ada Lovelace GPU opties ter vervanging van de oudere 12e gen Alder Lake-H en Ampere opties, respectievelijk. Het is een gaming-model uit het hogere middensegment dat tussen de IdeaPad gaming-serie op instapniveau en het vlaggenschip Legion Pro 7 serie.
Onze specifieke testunit is een middelste configuratie met de Core i7-13700HX, GeForce RTX 4060 en 165 Hz IPS-scherm voor ongeveer $ 1400 tot $ 1700 USD. Er zijn goedkopere en duurdere SKU's beschikbaar met de Core i5-12500H, RTX 4050, RTX 4070, of 240 Hz IPS display in plaats daarvan, maar alle display opties op dit moment hebben G-Sync en een native resolutie van 2560 x 1600.
Concurrenten voor de Legion Pro 5 16 zijn andere 16-inch gaming laptops zoals de Razer Blade 16,Asus ROG Zephyrus M16,Dell G16 7620of Gigabyte Aero 16.
Meer Lenovo beoordelingen:
Potentiële concurrenten in vergelijking
Evaluatie | Datum | Model | Gewicht | Hoogte | Formaat | Resolutie | Beste prijs |
|---|---|---|---|---|---|---|---|
| 87.9 % v7 (old) | 05-2023 | Lenovo Legion Pro 5 16IRX8 i7-13700HX, GeForce RTX 4060 Laptop GPU | 2.5 kg | 26.8 mm | 16.00" | 2560x1600 | |
| 87.8 % v7 (old) | 02-2023 | Asus ROG Zephyrus M16 GU603Z i9-12900H, GeForce RTX 3070 Ti Laptop GPU | 2.1 kg | 19.9 mm | 16.00" | 2560x1600 | |
| 91.2 % v7 (old) | 02-2023 | Razer Blade 16 Early 2023 i9-13950HX, GeForce RTX 4080 Laptop GPU | 2.4 kg | 21.99 mm | 16.00" | 2560x1600 | |
| 89.4 % v7 (old) | 02-2023 | Lenovo Legion Pro 7 16IRX8H i9-13900HX, GeForce RTX 4080 Laptop GPU | 2.7 kg | 26 mm | 16.00" | 2560x1600 | |
| 87.7 % v7 (old) | 10-2022 | Lenovo Legion 5 Pro 16ARH7H RTX 3070 Ti R7 6800H, GeForce RTX 3070 Ti Laptop GPU | 2.6 kg | 26.6 mm | 16.00" | 2560x1600 | |
| 89.3 % v7 (old) | 01-2023 | Lenovo Legion S7 16ARHA7 R9 6900HX, Radeon RX 6800S | 2.2 kg | 16.9 mm | 16.00" | 2560x1600 |
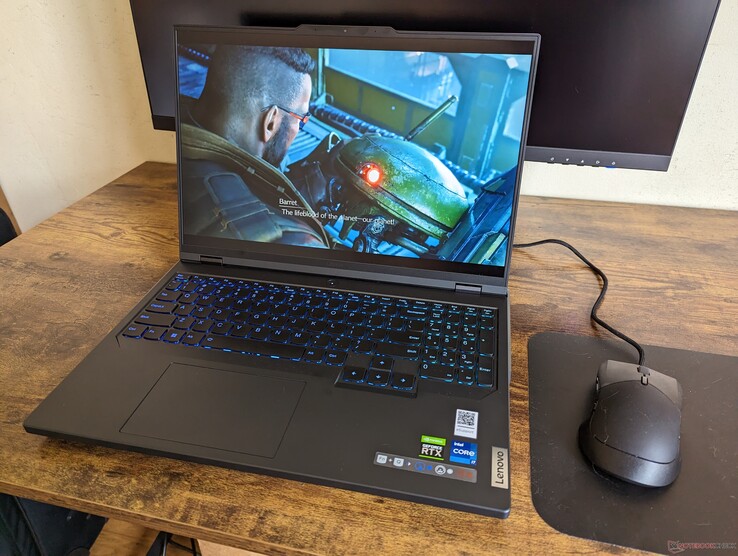
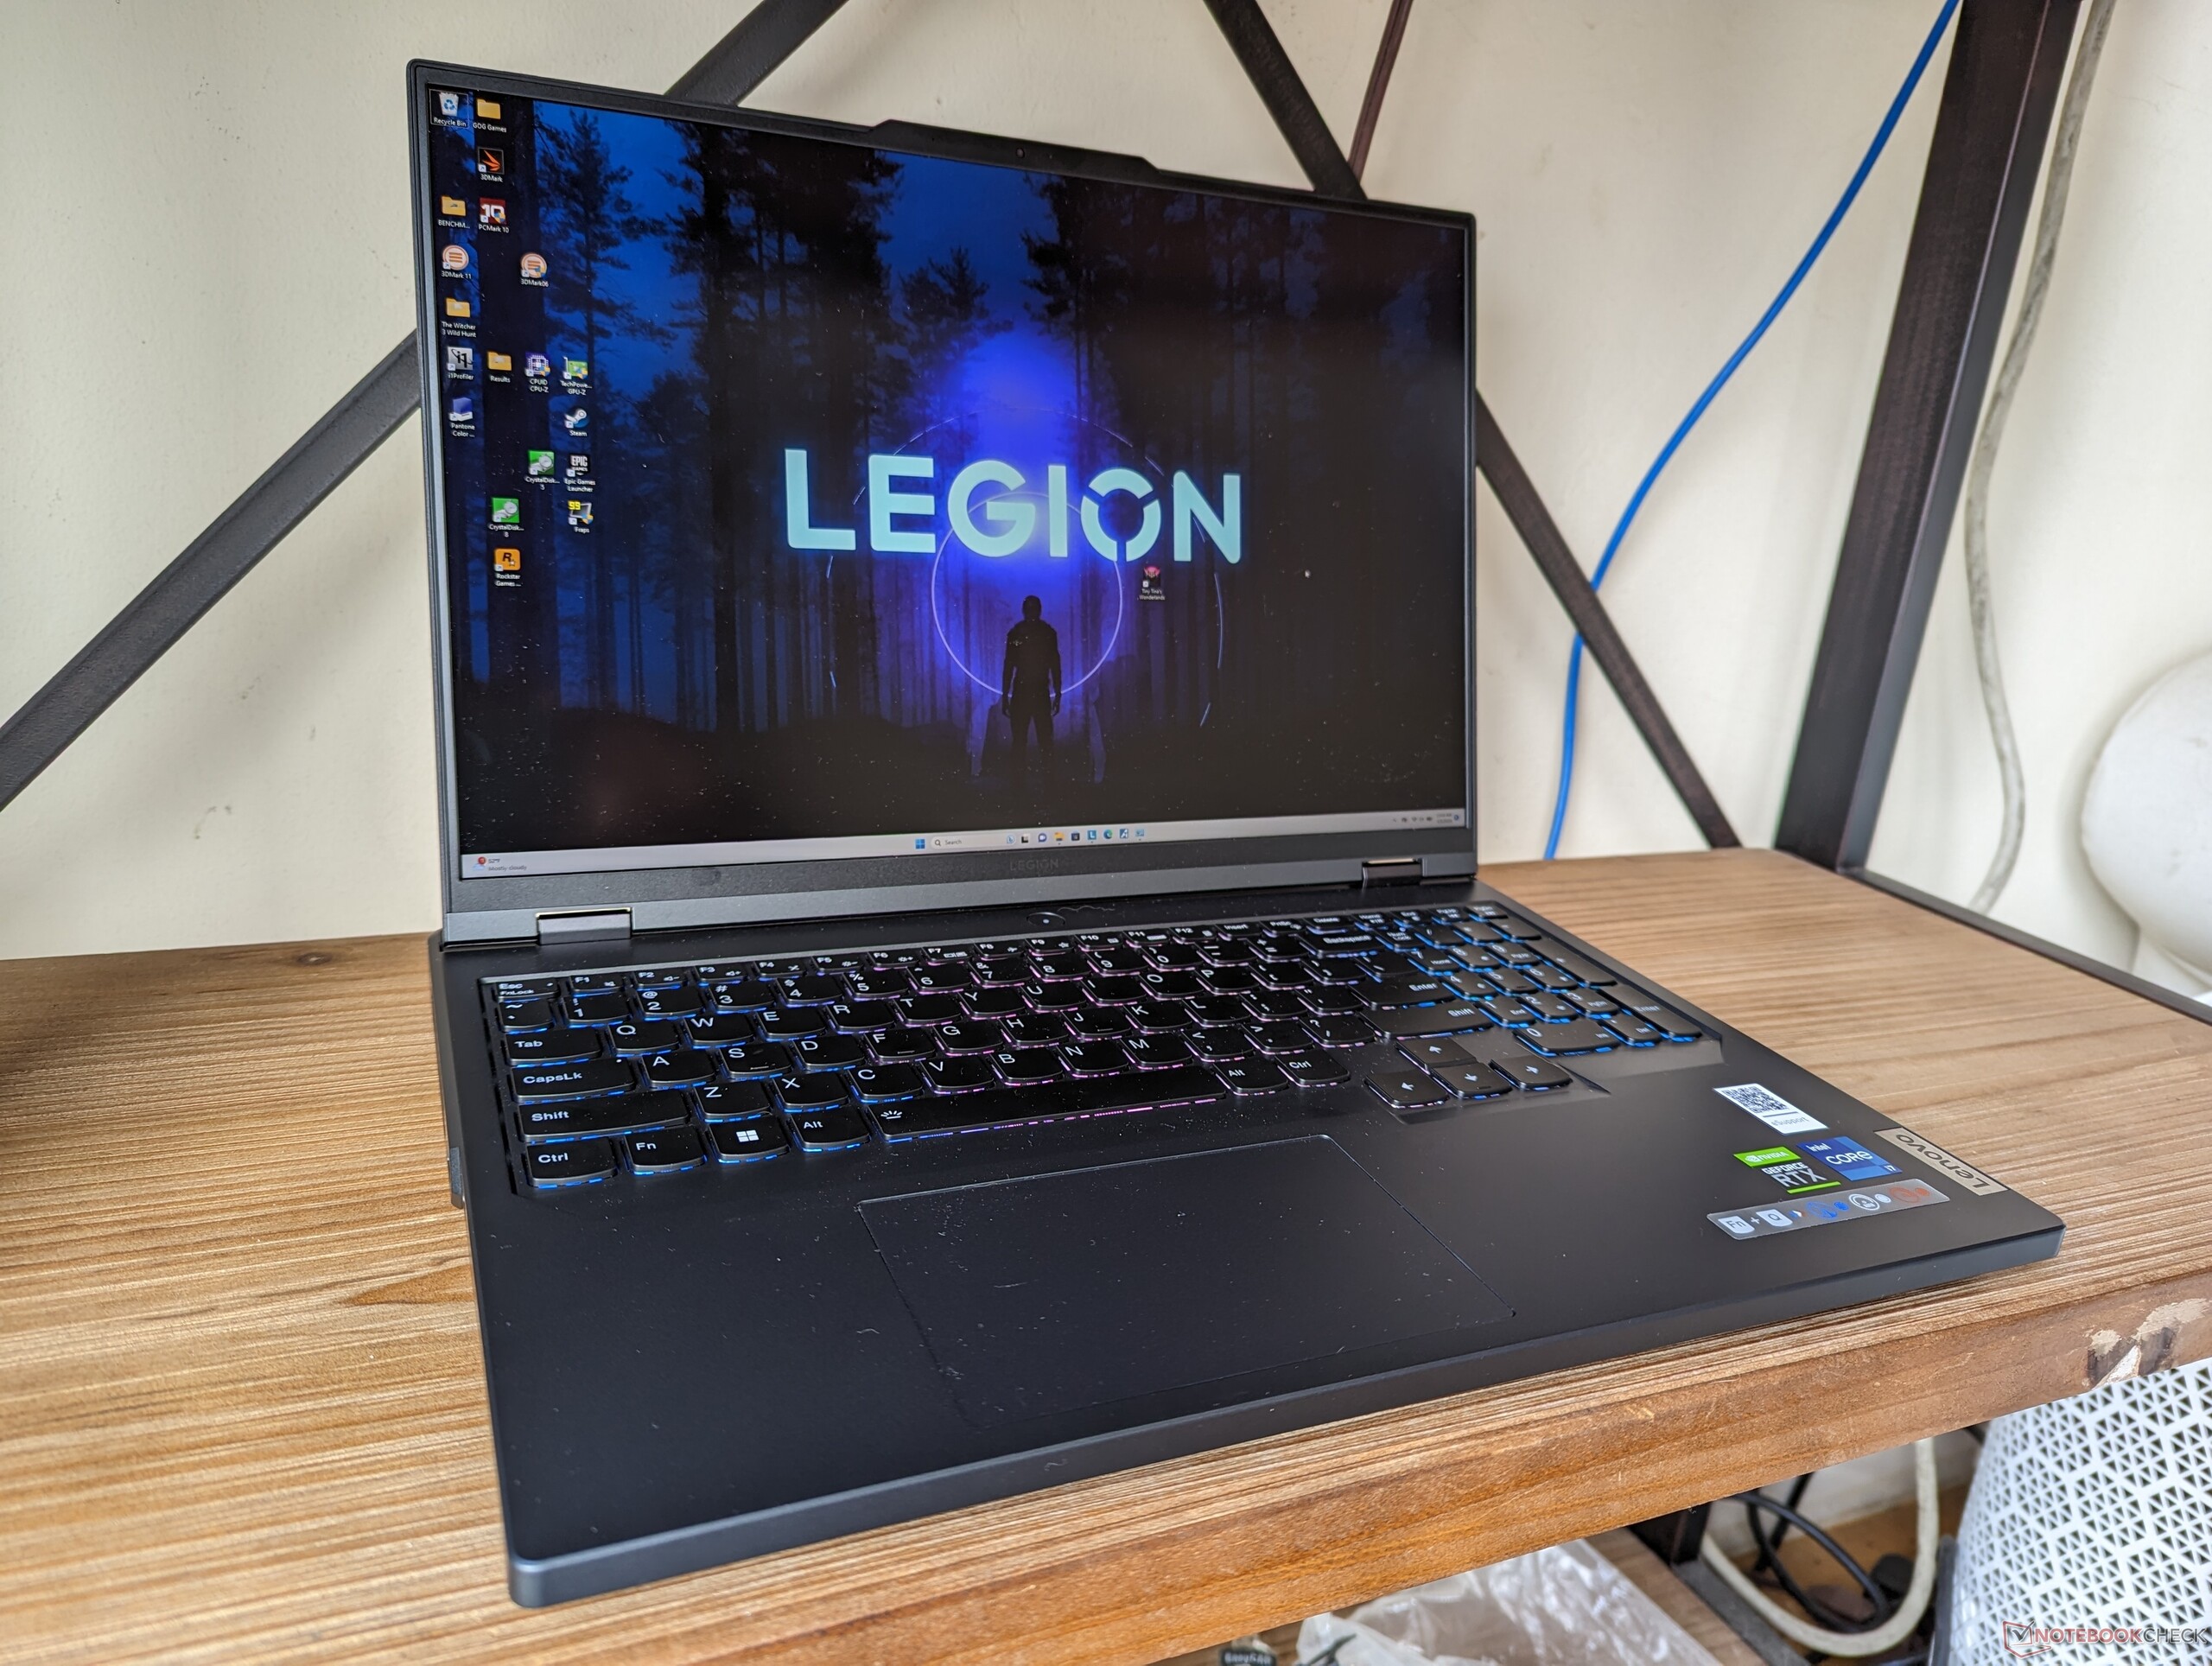
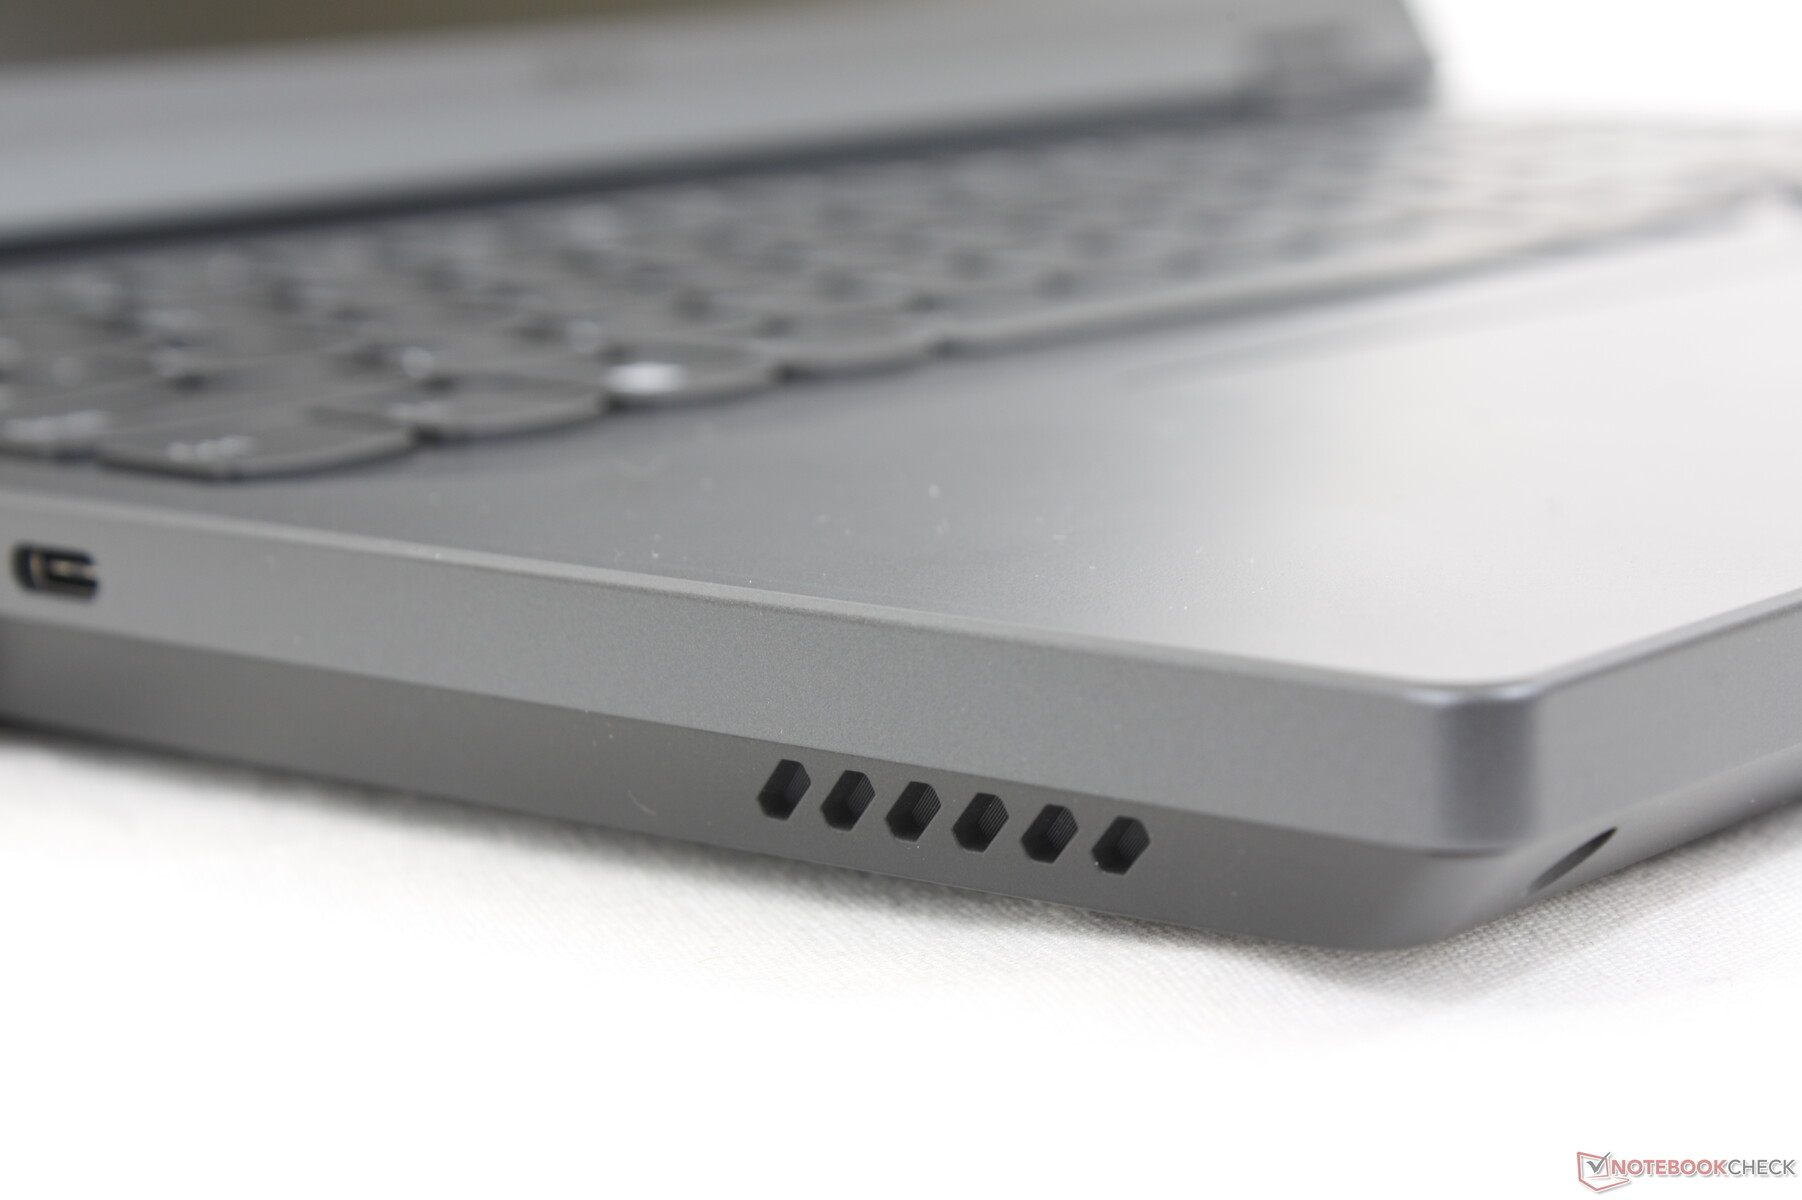
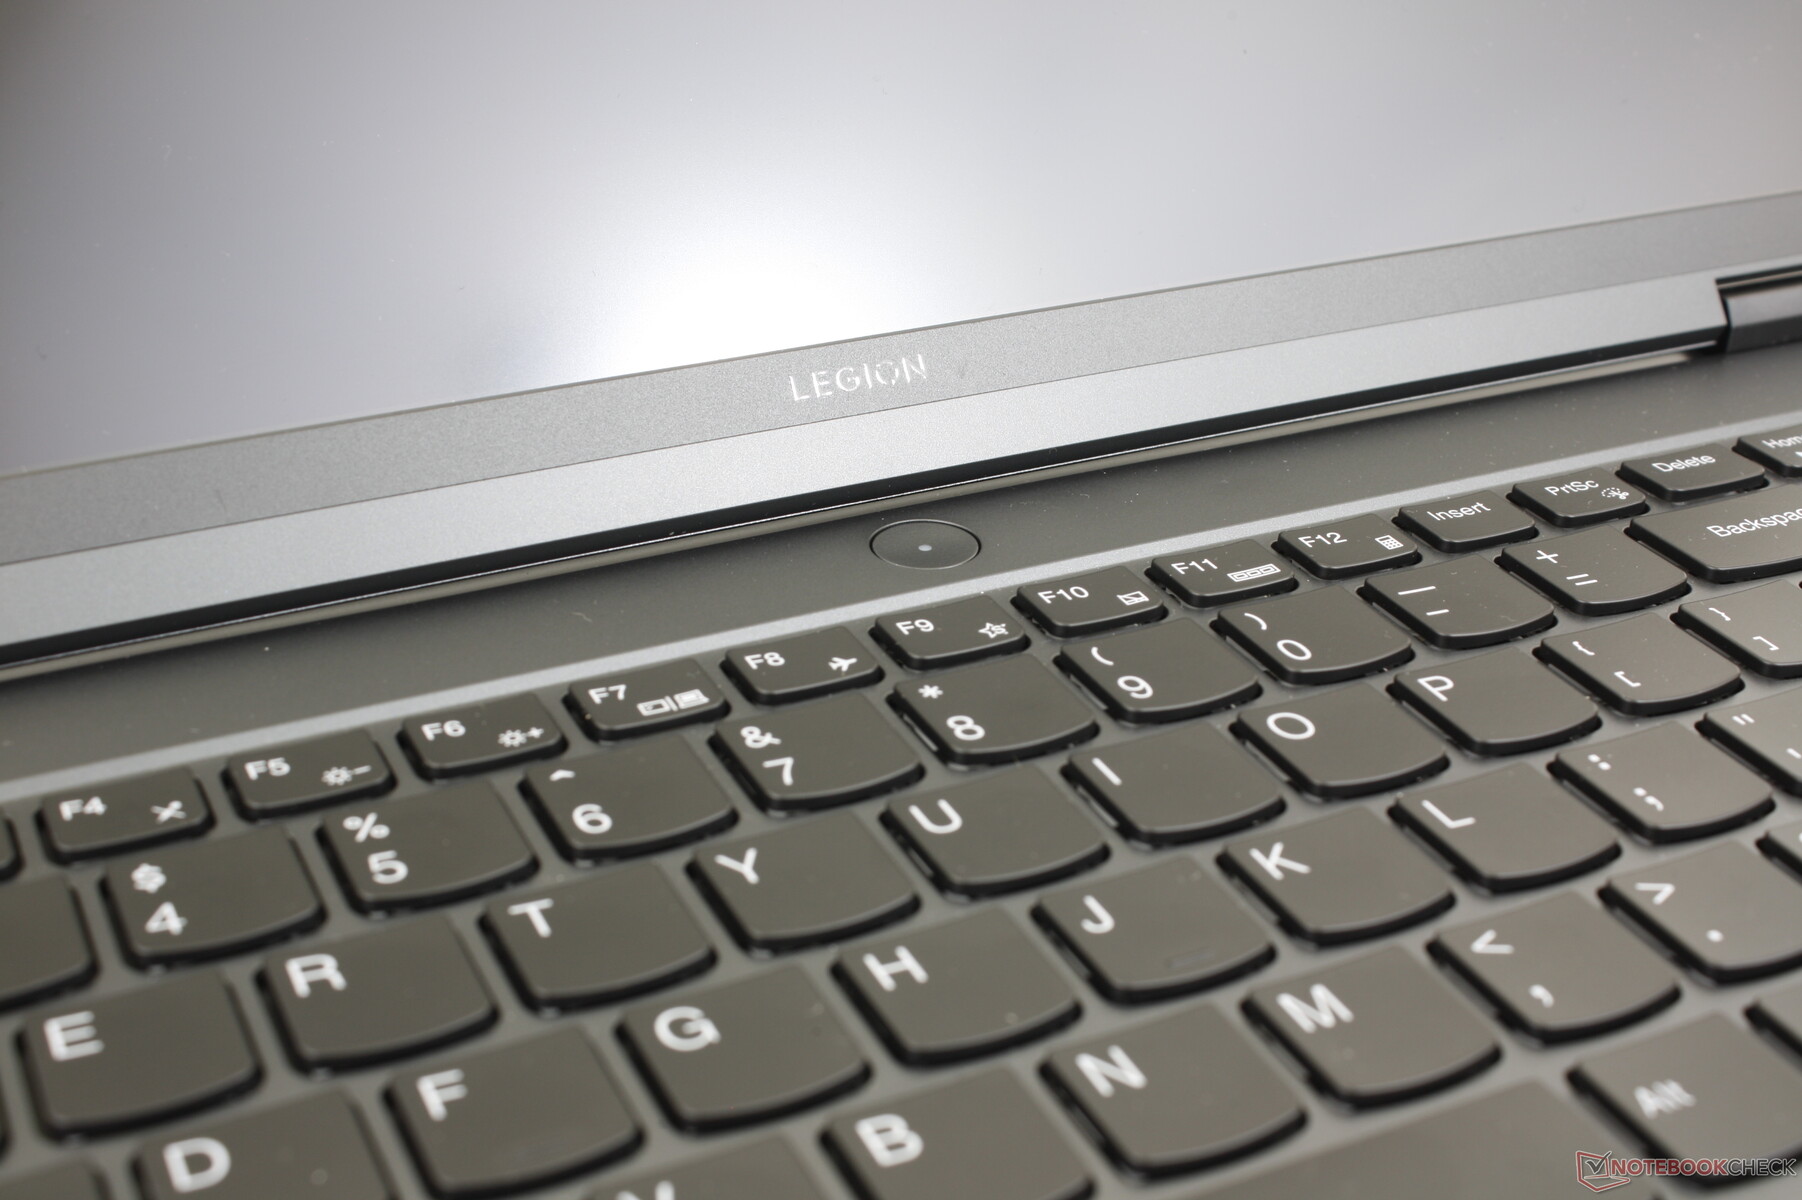
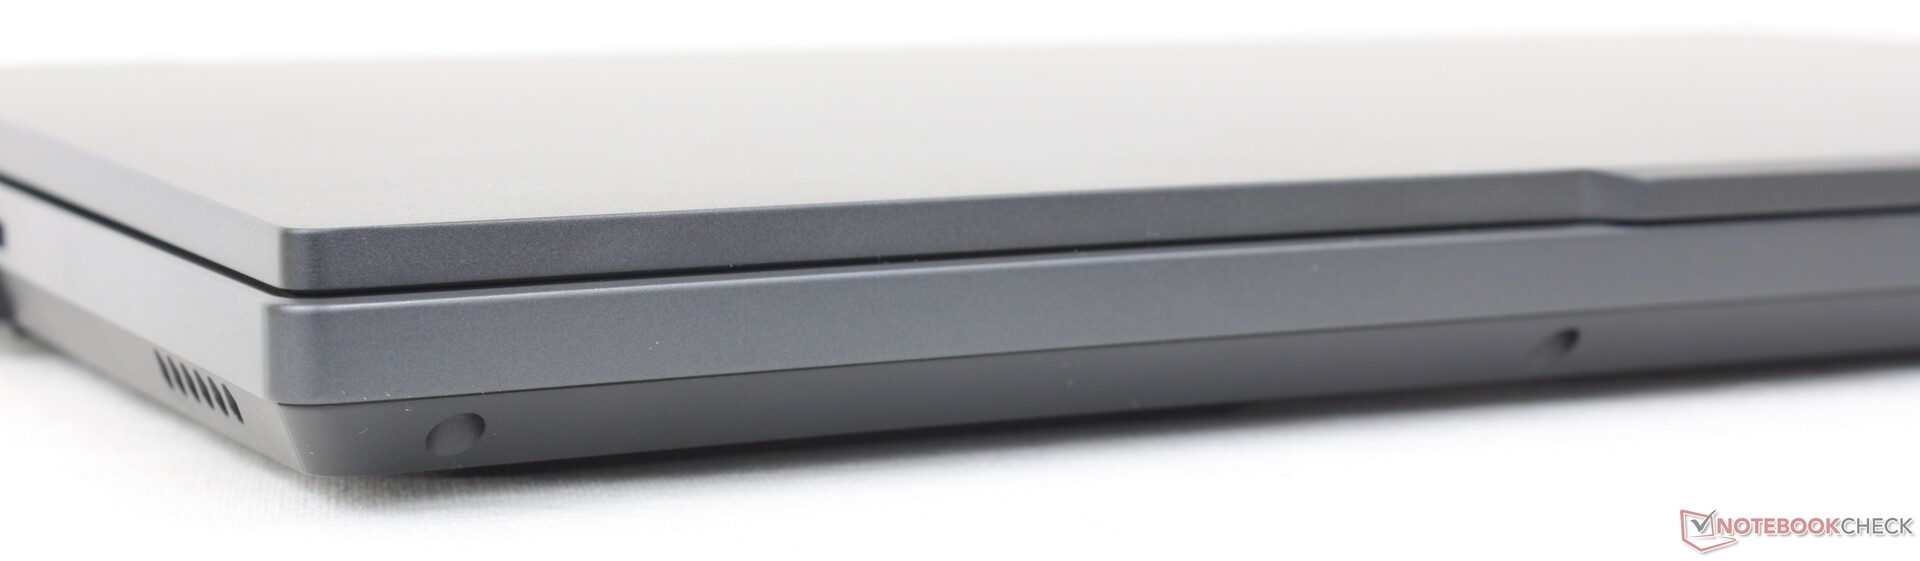
Zaak - Een slanker Legion
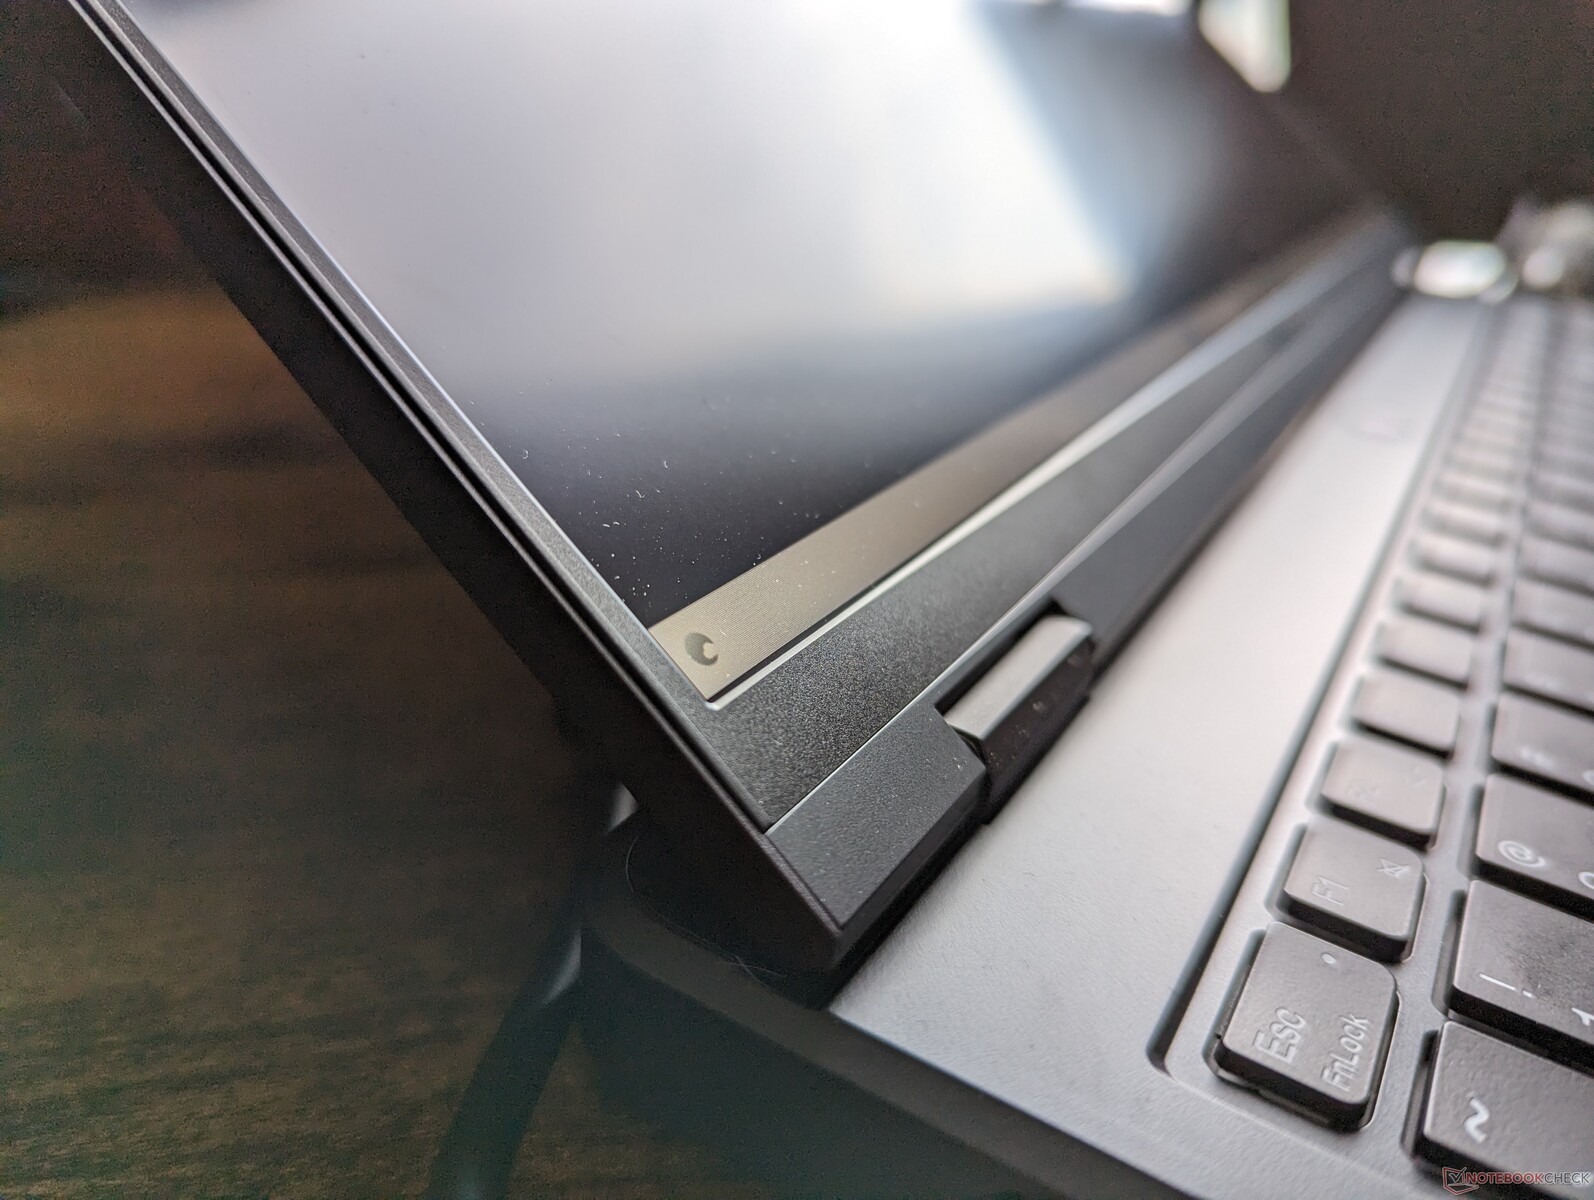
Visueel heeft het herziene chassis minder accenten en hoeken voor een vlakkere en professionelere uitstraling dan het model van vorig jaar, vooral langs de achterzijde. Het tweekleurige grijs en zilver is verdwenen ten gunste van een meer uniforme uitstraling. Wij geven de voorkeur aan het nieuwe ontwerp omdat het meer neigt naar minimalisme met behoud van veel van de kenmerkende Legion eigenschappen.
De stevigheid van het chassis is uitstekend bij ons toestel, zonder hoorbaar kraken of vreselijk zwakke punten. De basis en het deksel vertonen meer draaiing dan de stijvere Blade 16maar niet genoeg om je grote zorgen te maken.
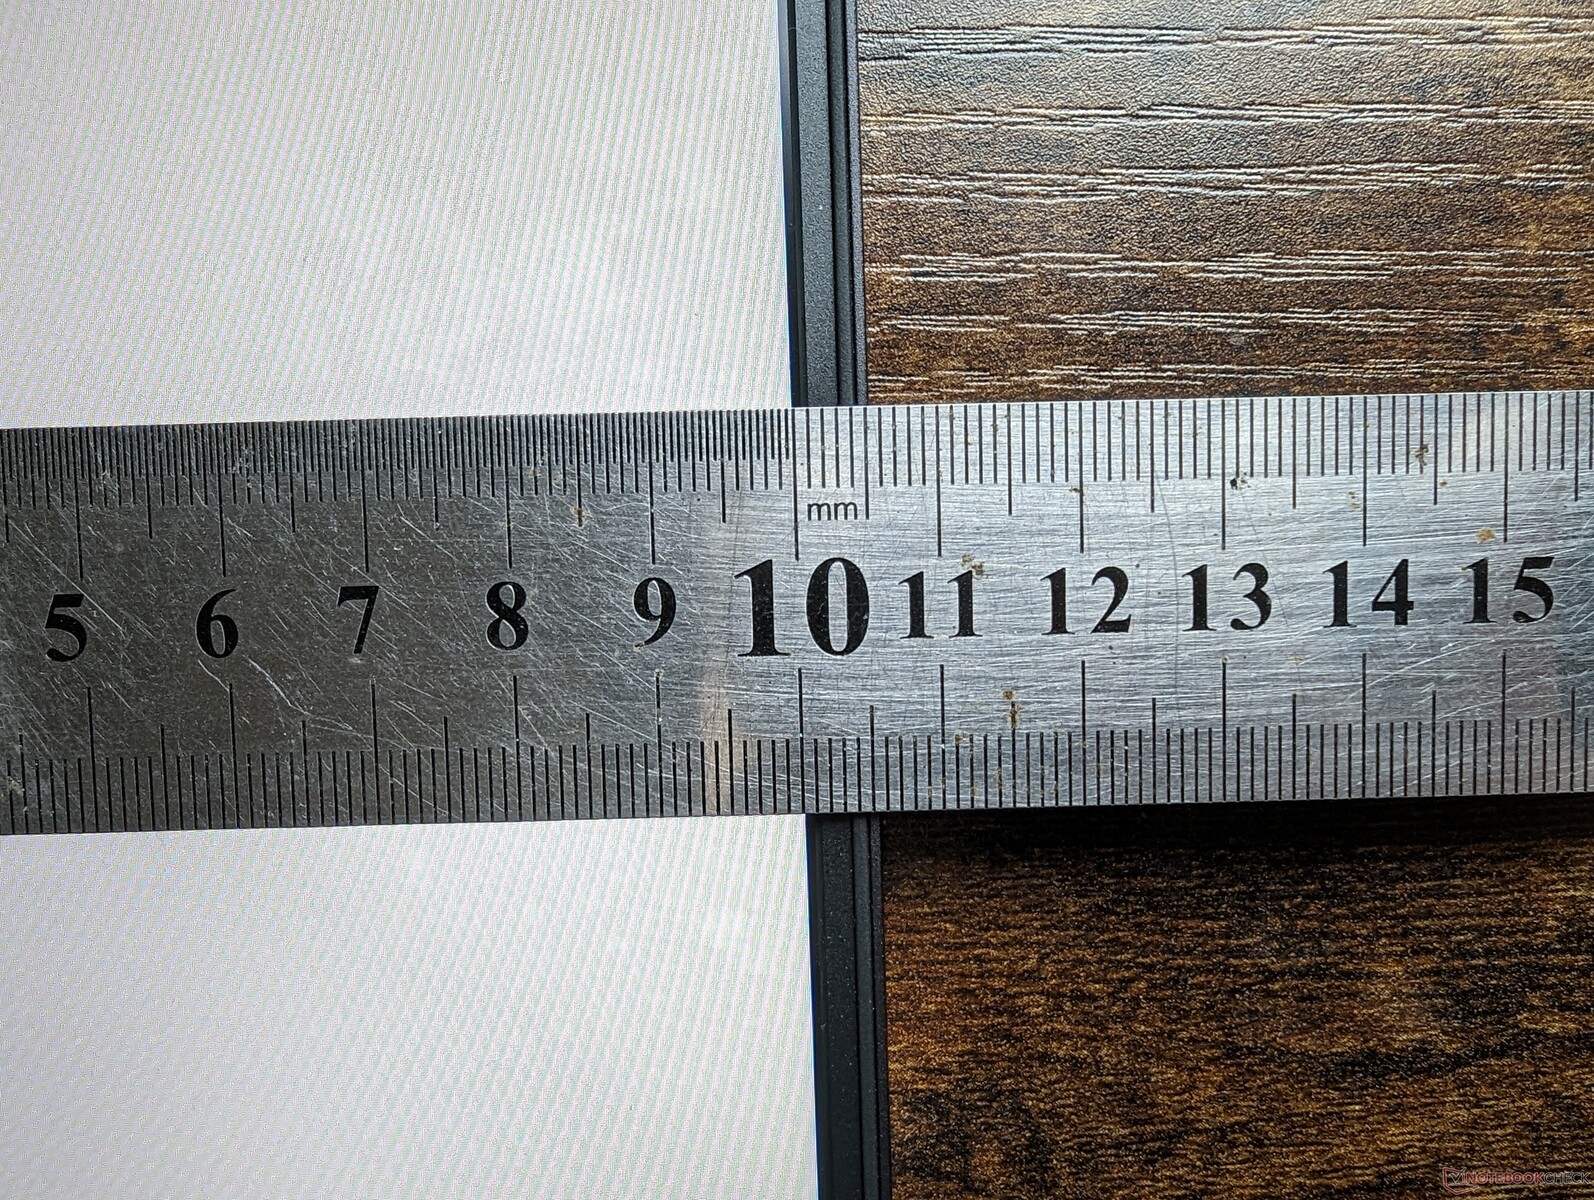
De Legion Pro 5 16 is merkbaar groter en zwaarder dan veel van zijn soortgenoten. De Aero 16, Blade 16, en Zephyrus M16 zijn allemaal dunner en lichter dan de Lenovo met maximaal 8 mm of 400 gram, wat niet onbelangrijk is. Hoewel hij zeker niet zo omvangrijk is als veel 17,3-inch gaming laptops, is de Legion Pro 5 16 ook niet bepaald de meest reisvriendelijke optie in zijn 16-inch formaatklasse.
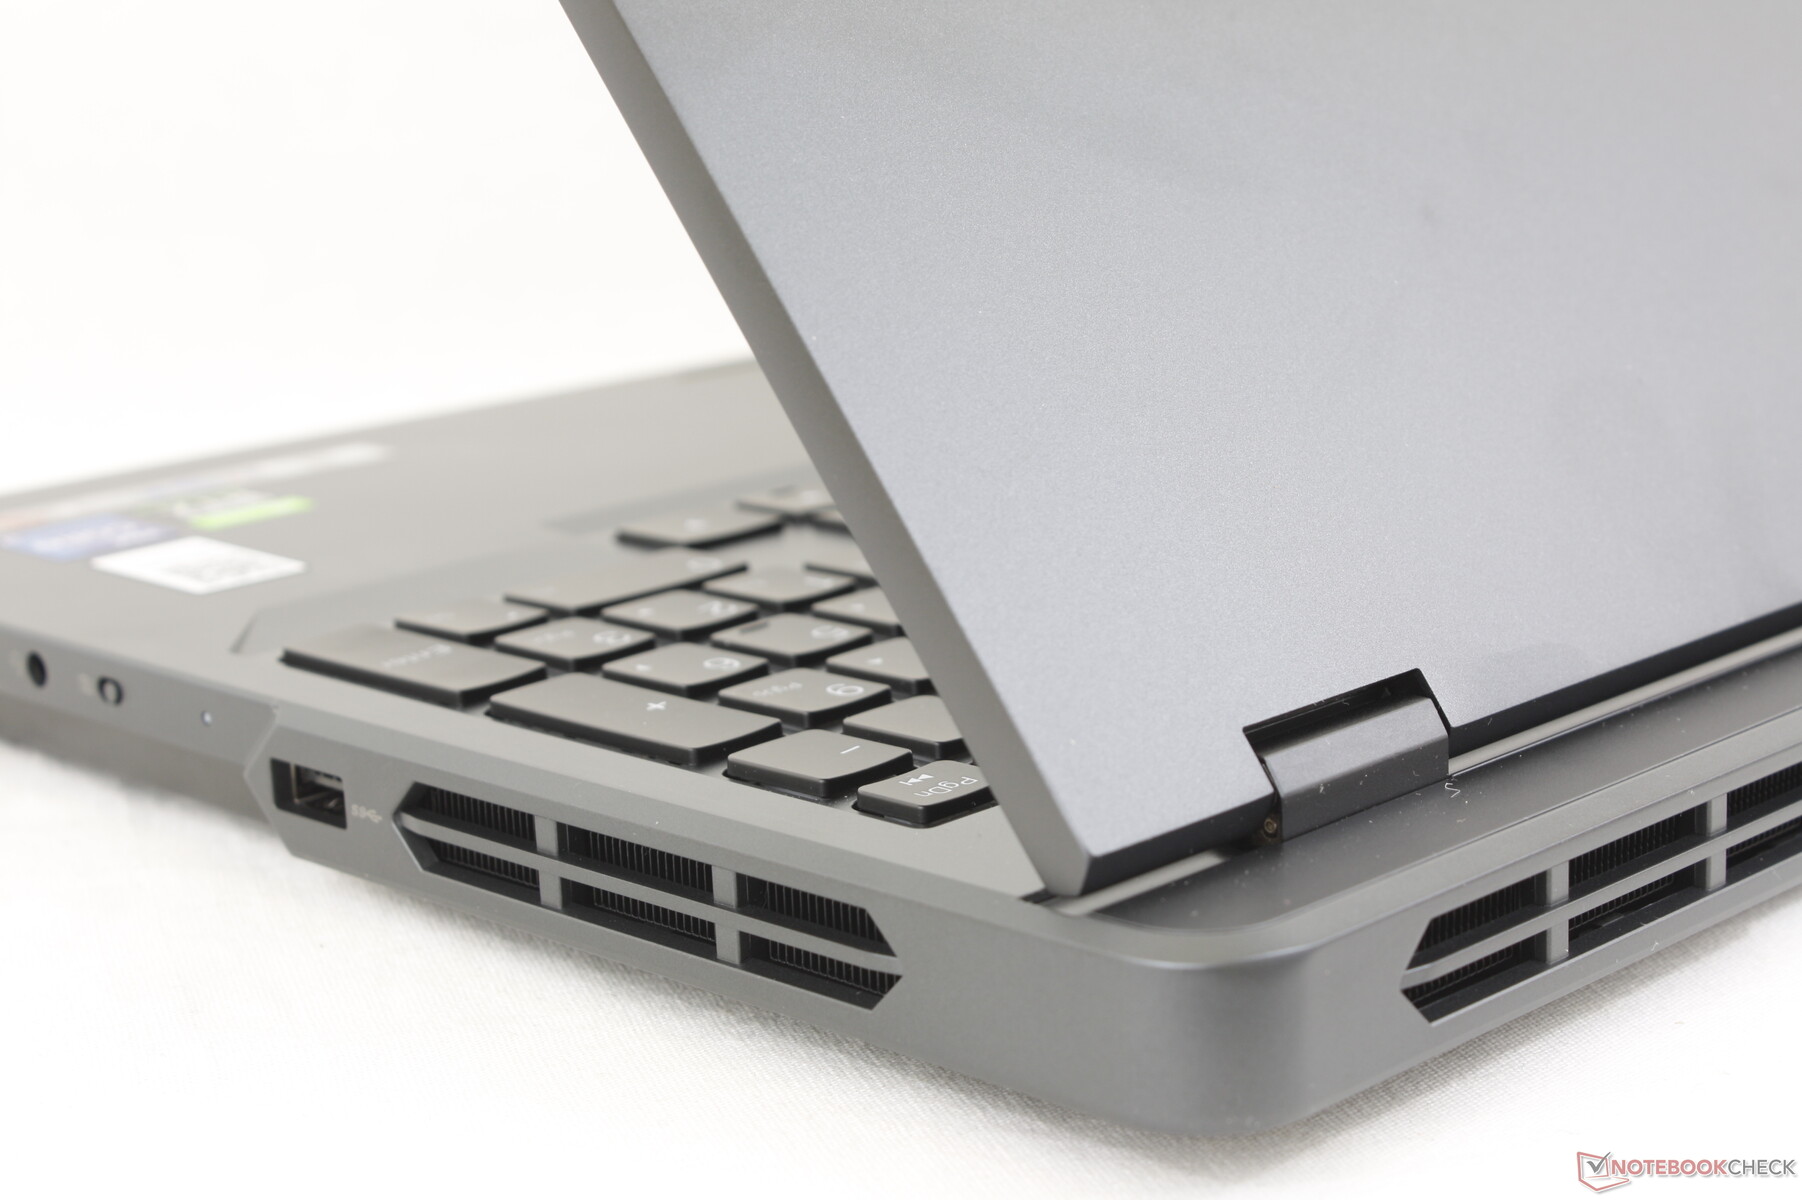
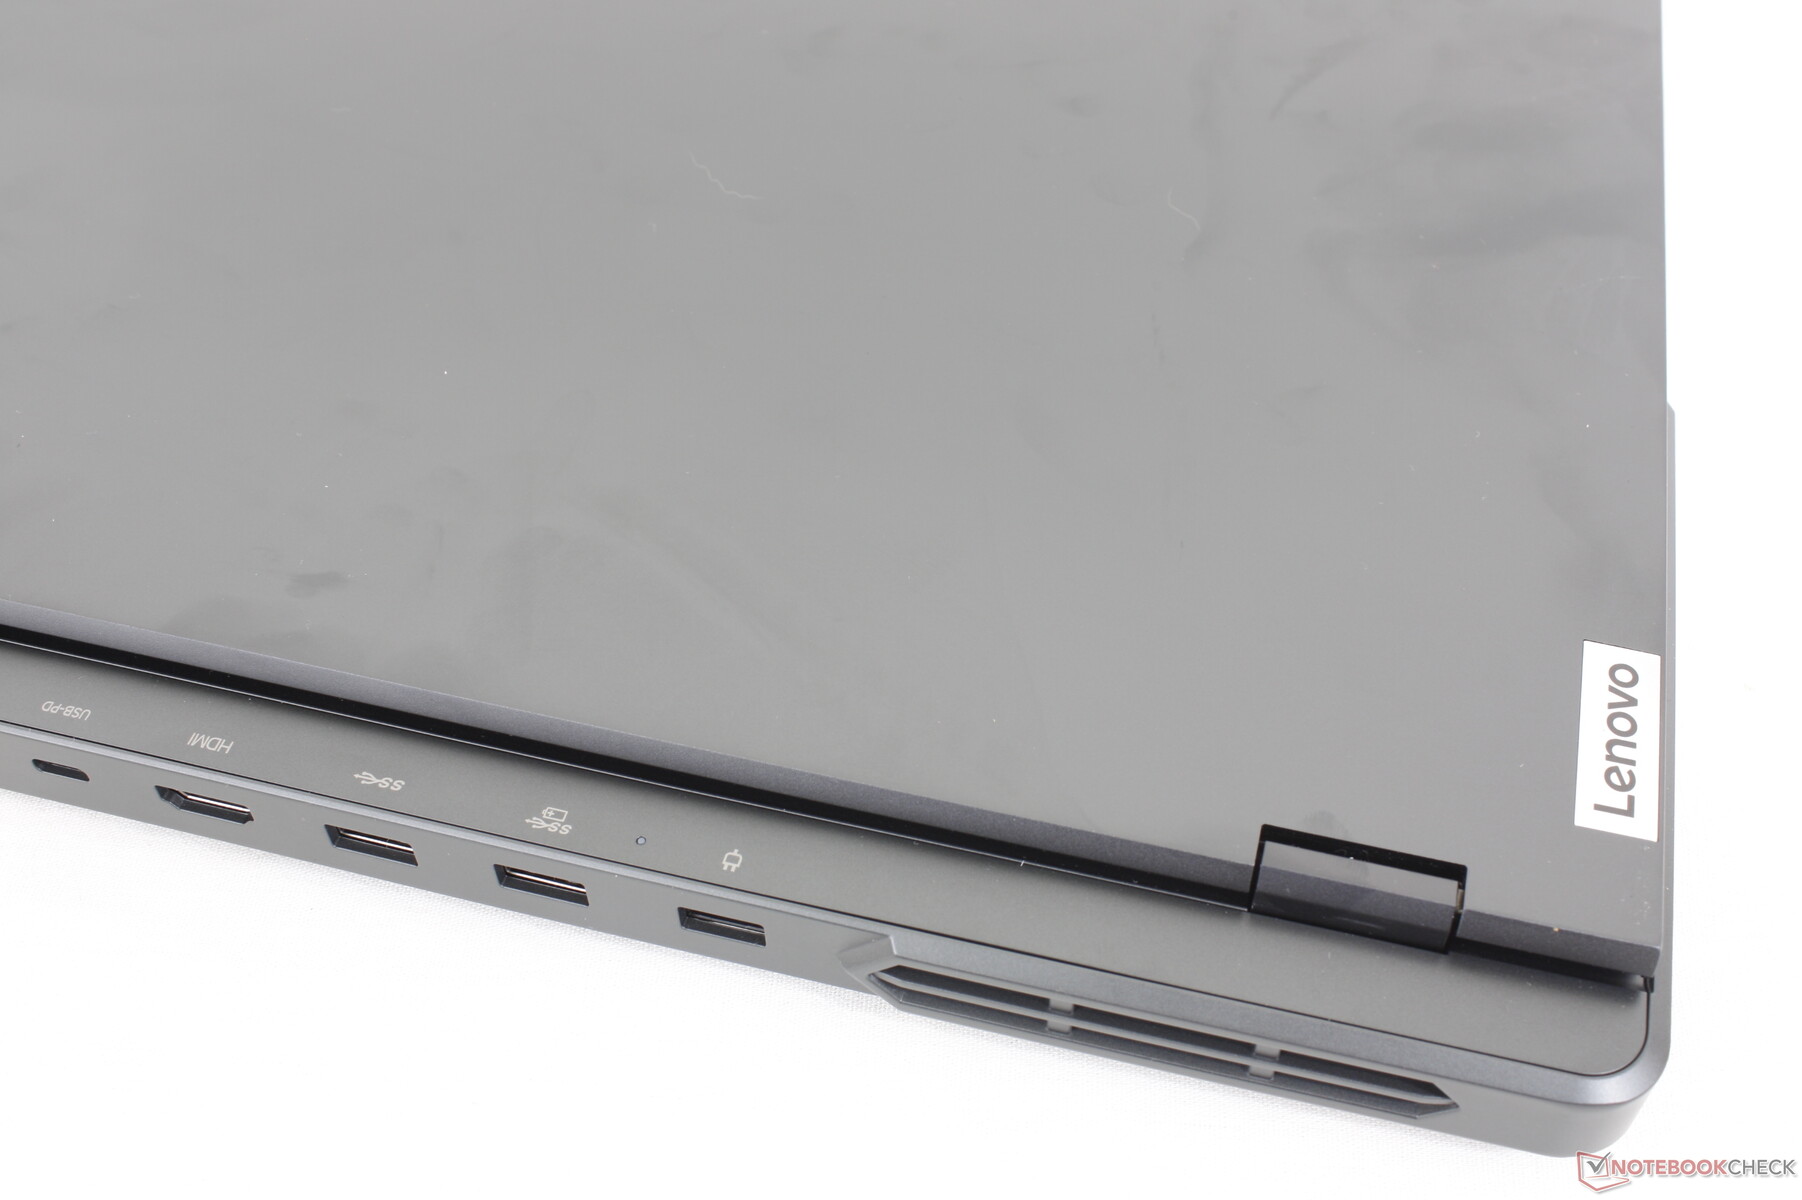
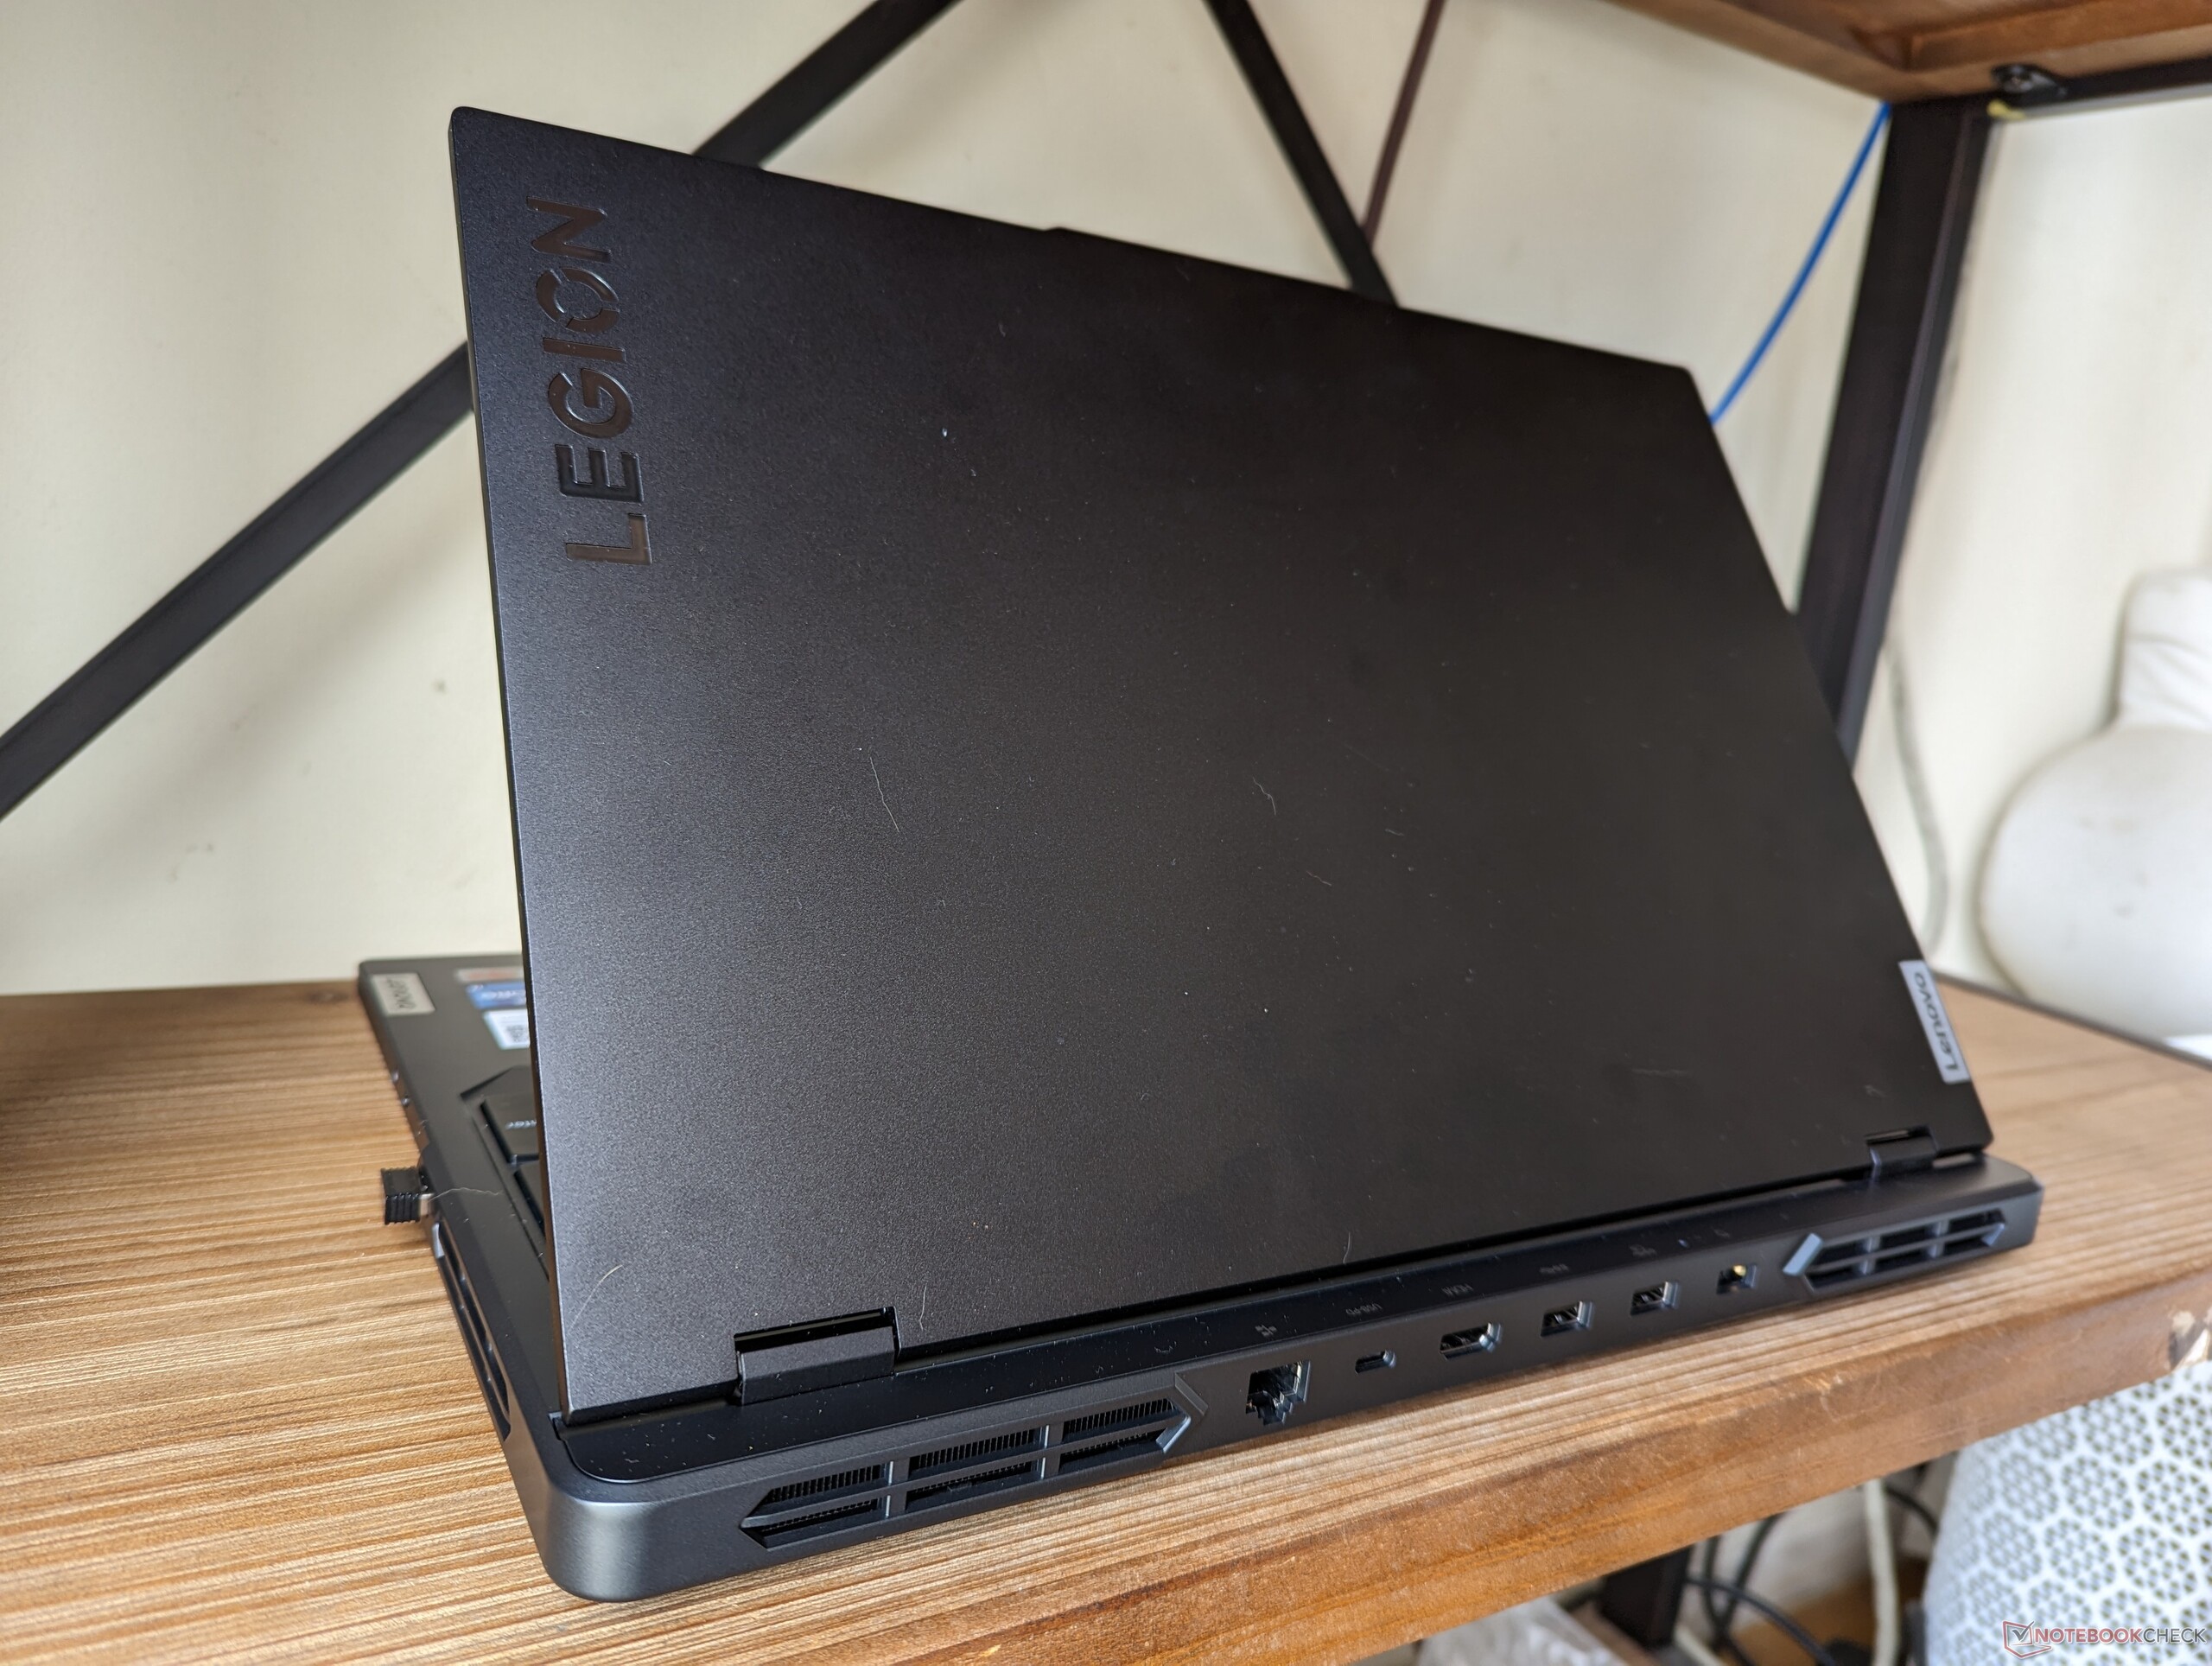
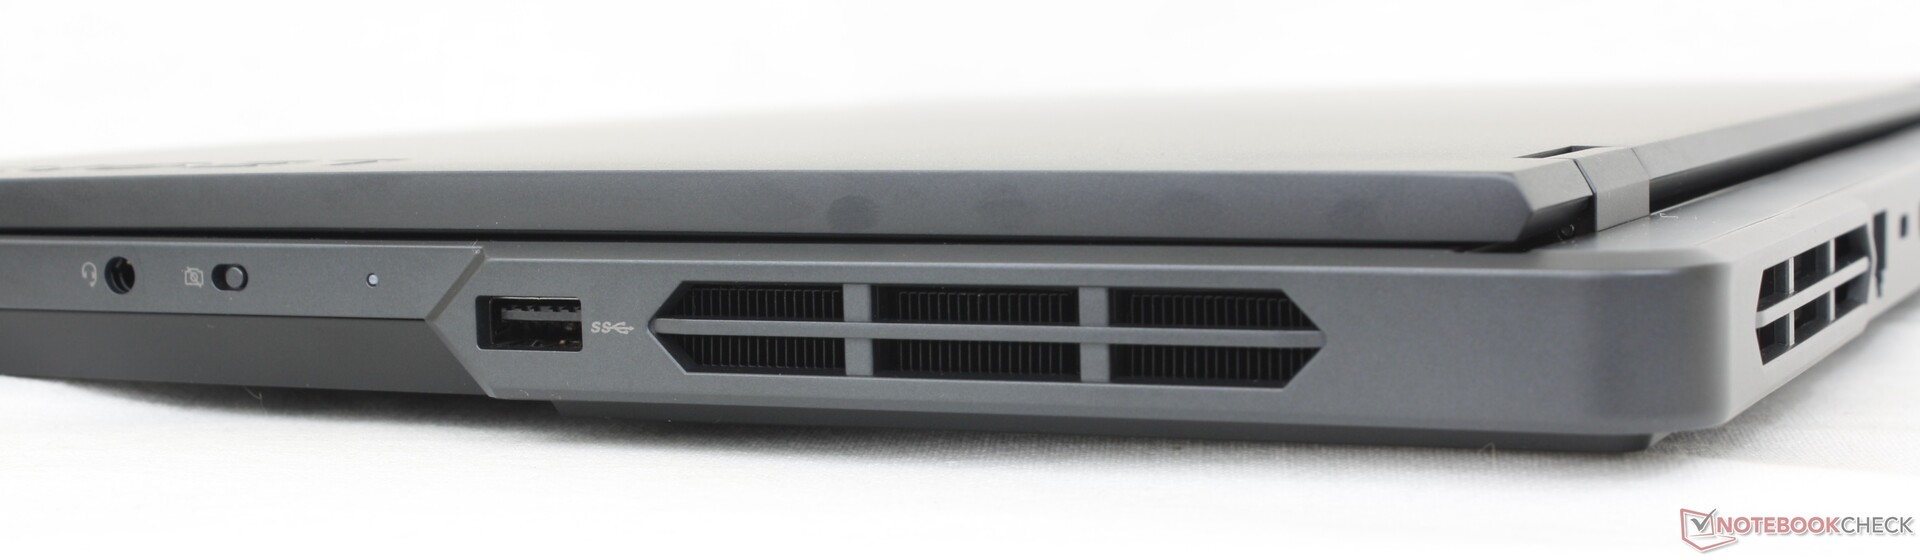
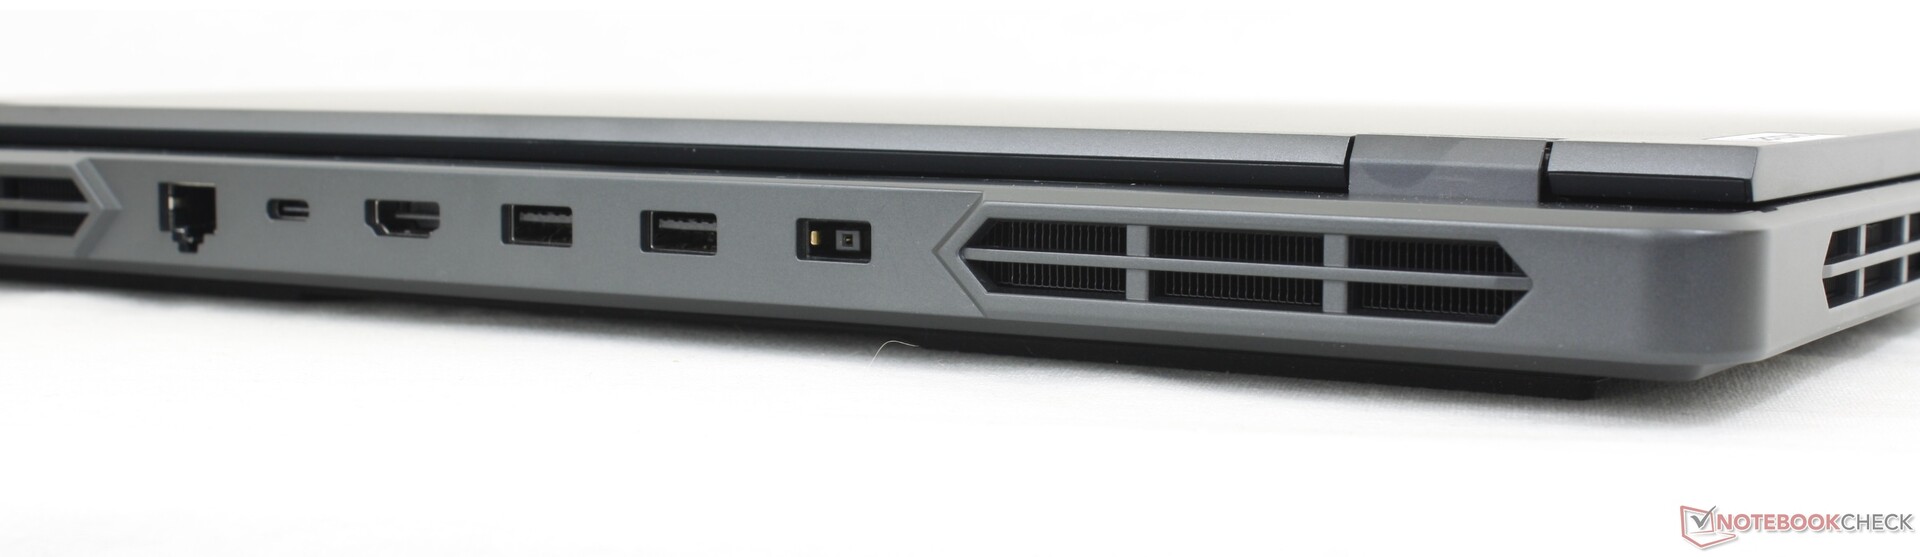
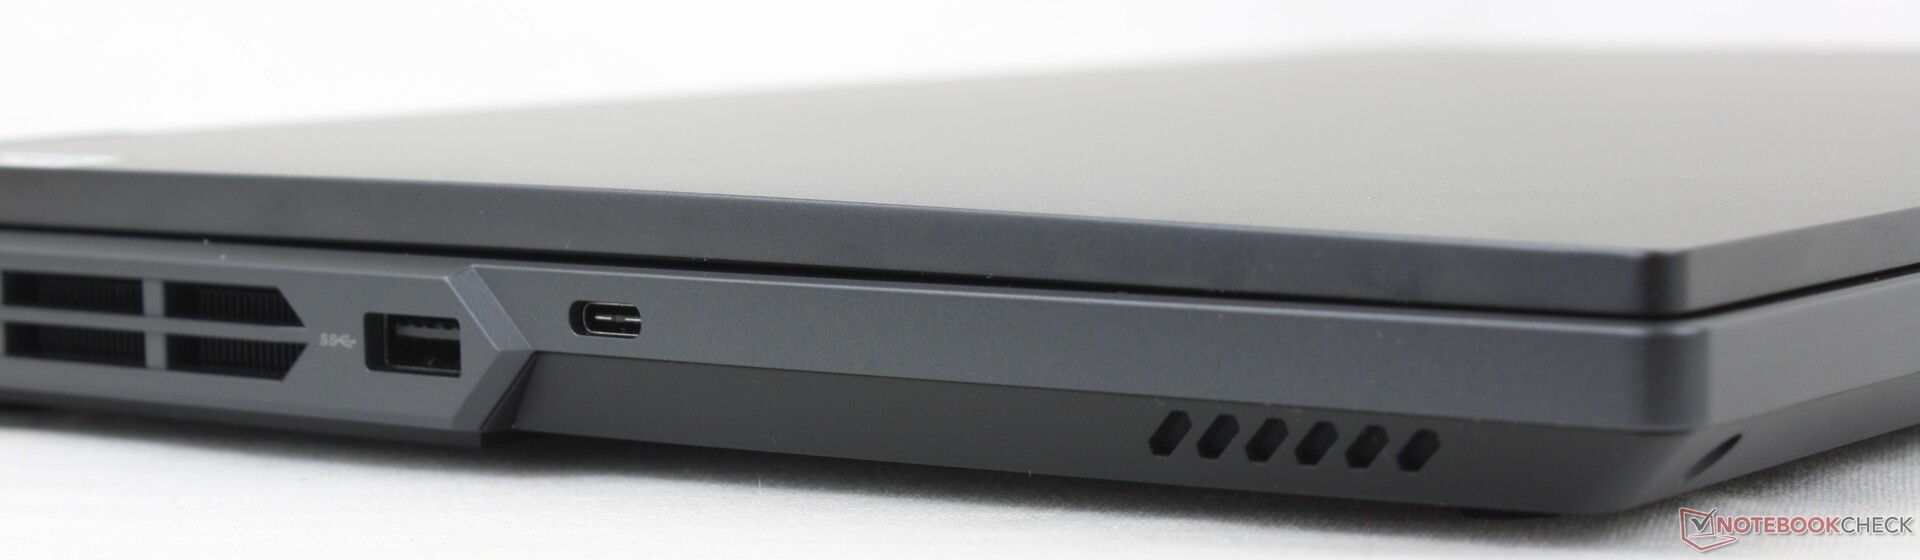
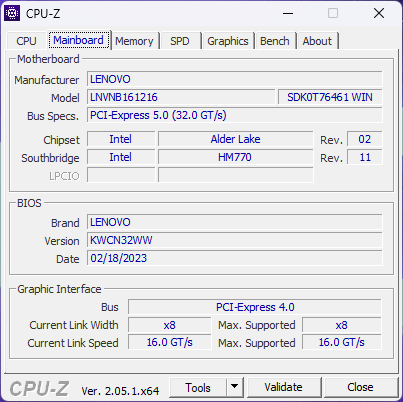
Connectiviteit - Veel poorten maar geen Thunderbolt
Er is een gezonde selectie poorten, waarvan de meeste aan de achterkant zijn geplaatst. In feite deelt het model exact dezelfde poorten en positionering als op de high-endLegion Pro 7 16IRX8H ook al zijn beide modellen visueel verschillend.
Merk op dat het model geen Thunderbolt ondersteunt. Het heeft tenminste een RJ-45 poort, in tegenstelling tot de Blade 16.
De achterste poorten zijn gelabeld met pictogrammen die zichtbaar zijn vanaf de bovenkant van het chassis, zoals de bovenstaande afbeelding laat zien. De pictogrammen maken het gemakkelijker om kabels aan te sluiten in tegenstelling tot de achterste poorten van de Alienware m18, maar ze lichten helaas niet op.
Communicatie
Een Intel AX211 wordt standaard geleverd voor Wi-Fi 6E en Bluetooth 5.2 connectiviteit. We ondervonden stabiele overdrachtssnelheden en geen problemen bij het koppelen aan ons 6 GHz Asus AXE11000 netwerk.
Webcam
De 1080p of 2 MP webcam is standaard geworden op gaming laptops. Op onze Lenovo ging de automatische helderheidsaanpassing echter langzamer dan normaal, wat resulteerde in een donkerder beeld.
Er is een elektronische webcam shutter voor privacy controle, maar geen IR sensor.


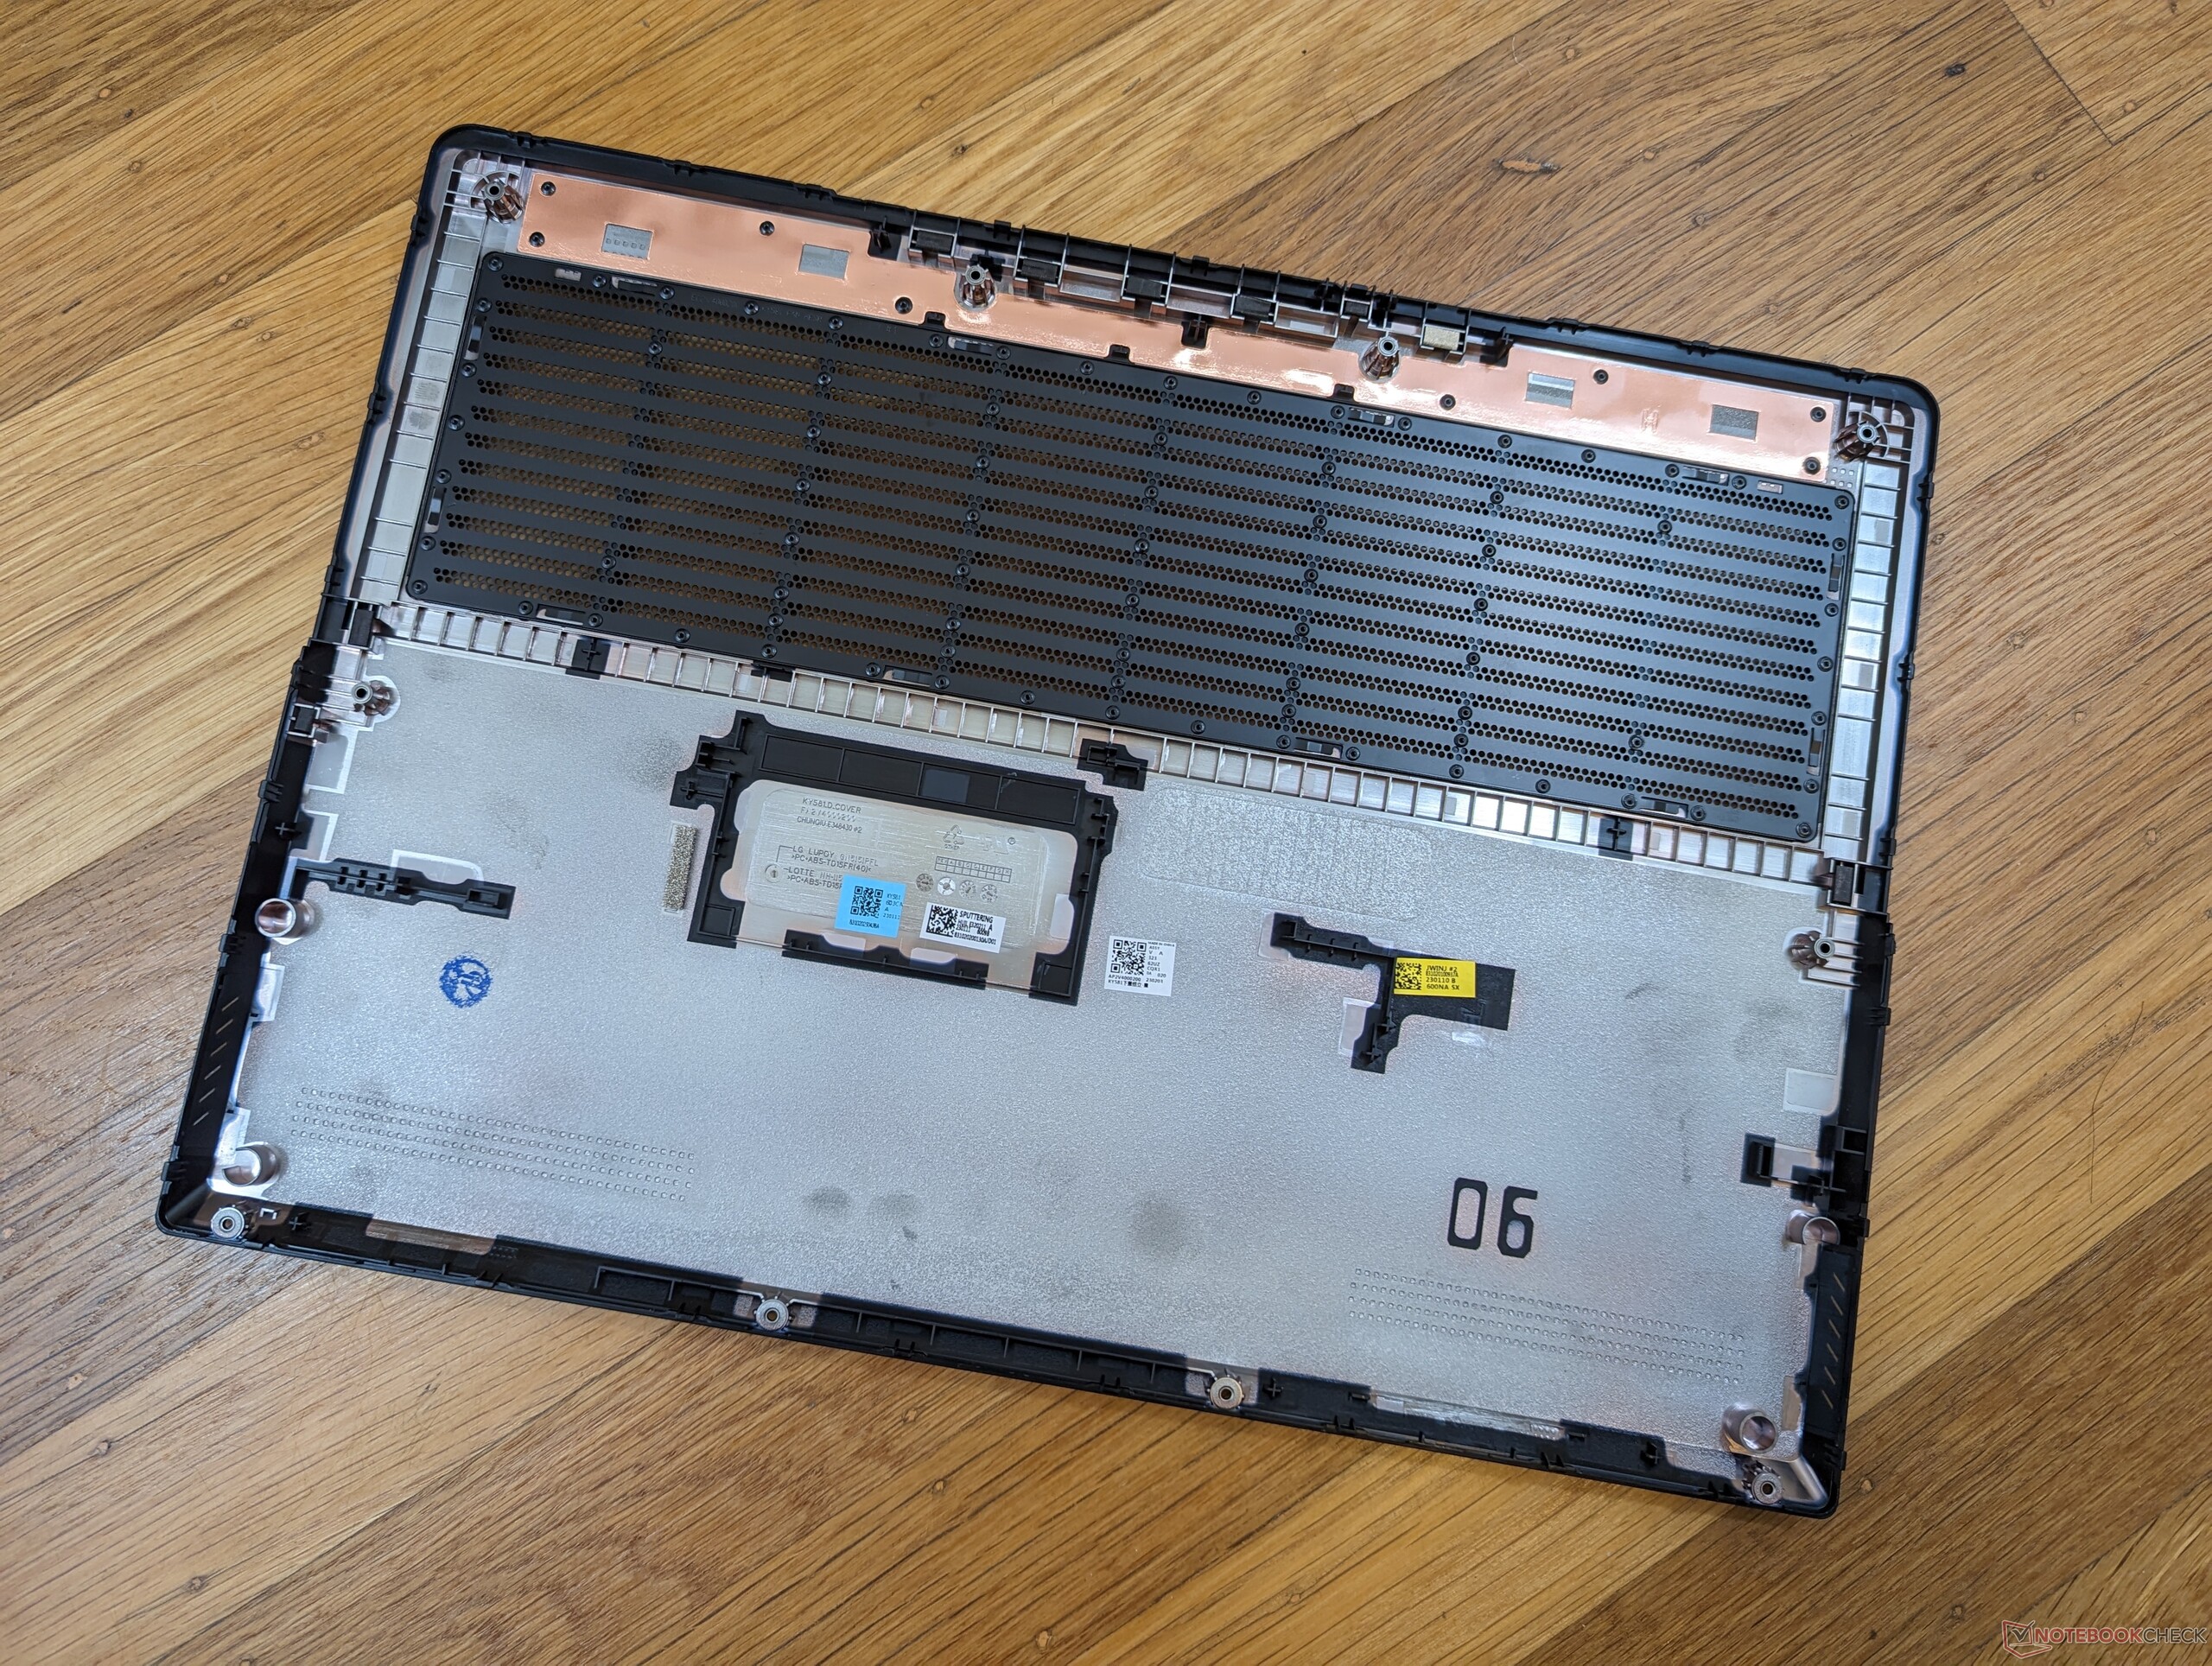
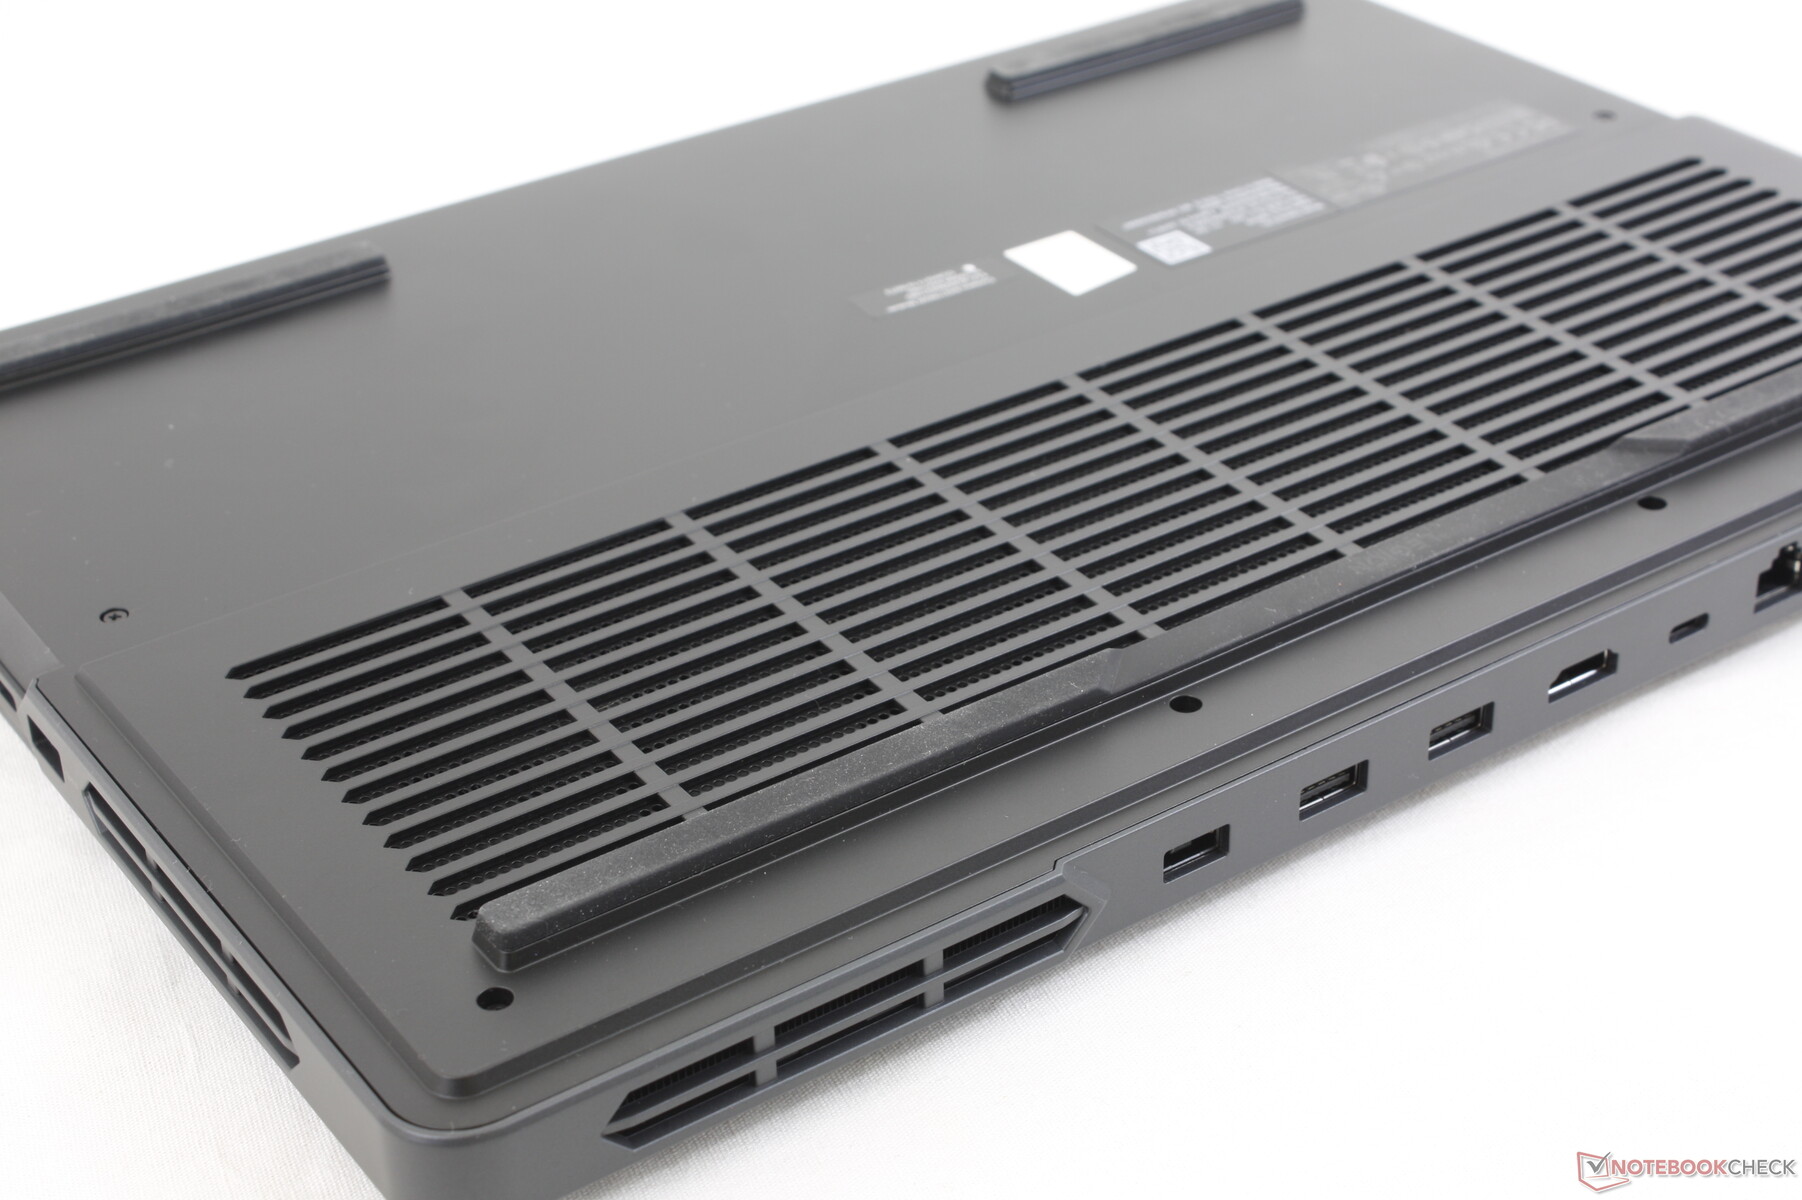
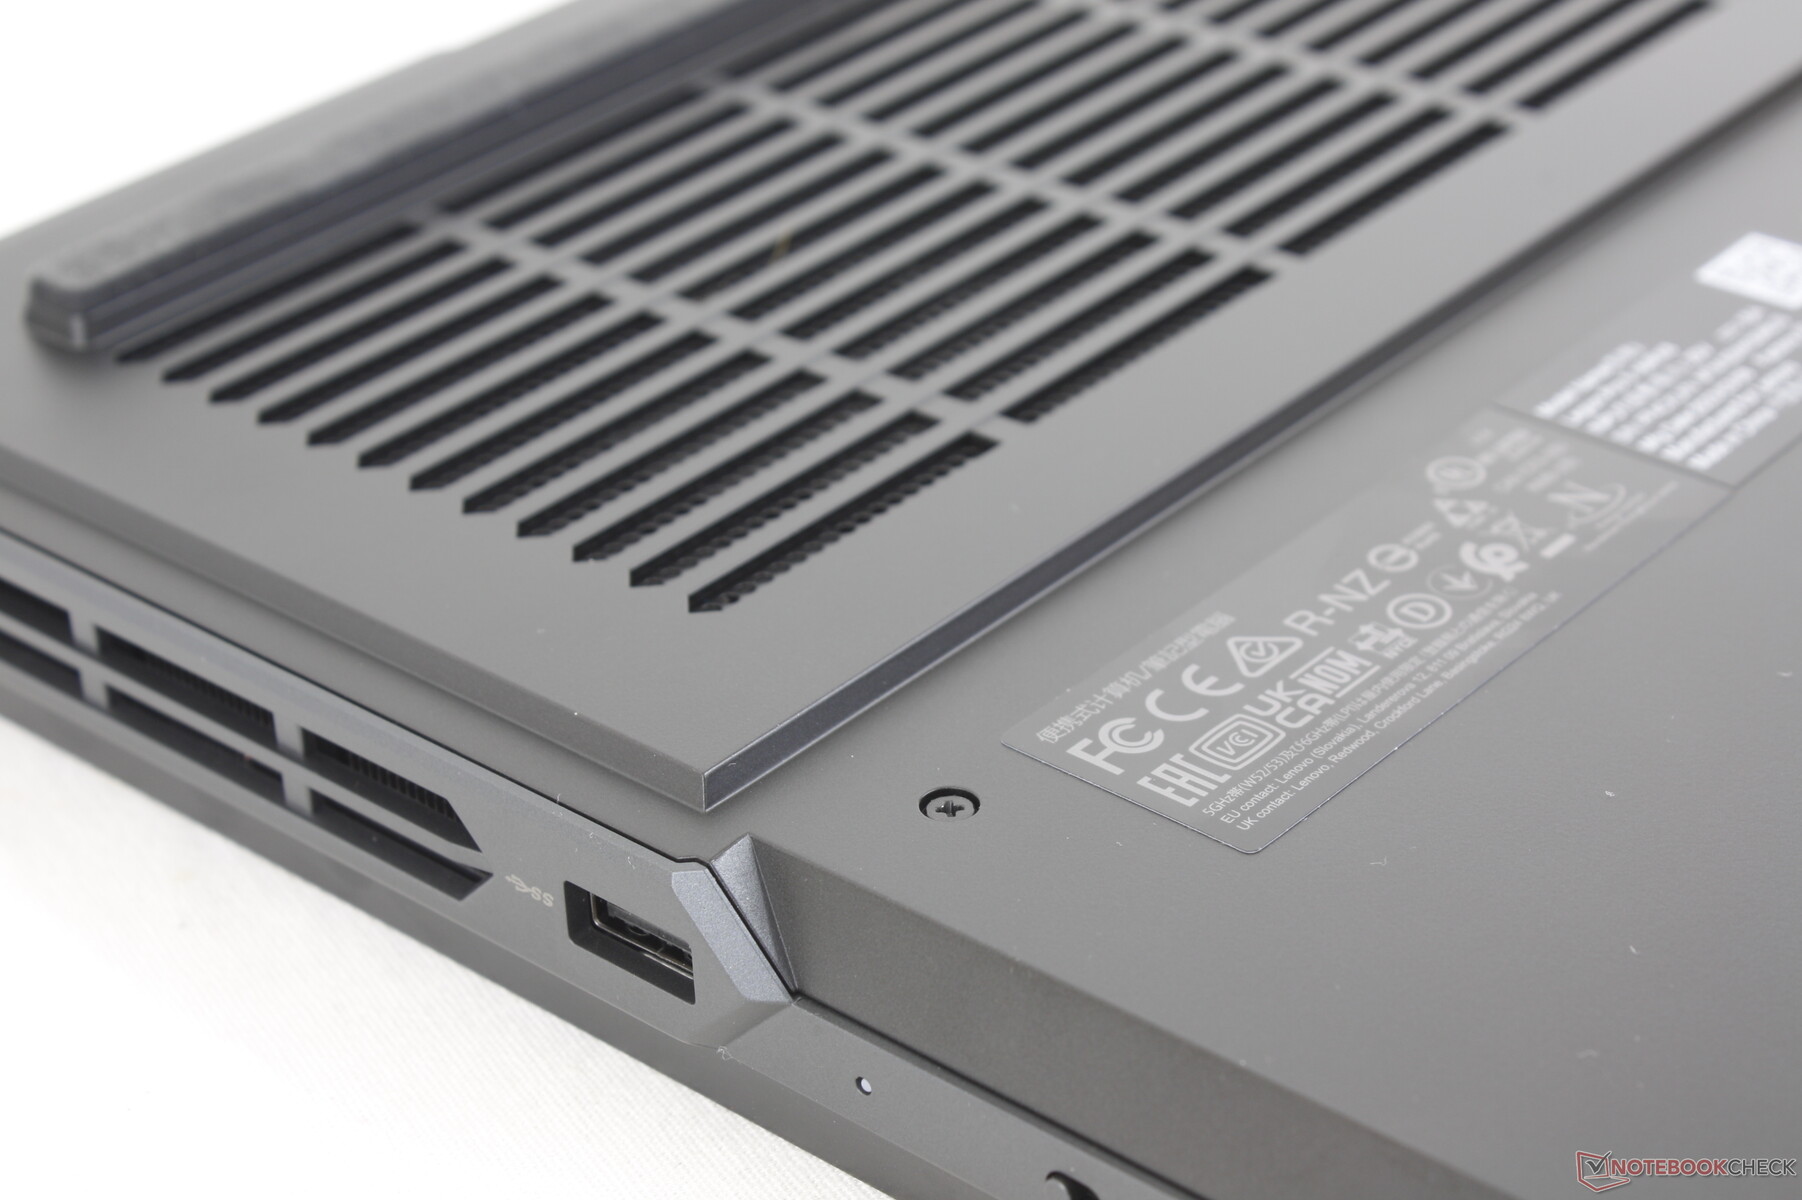
Onderhoud
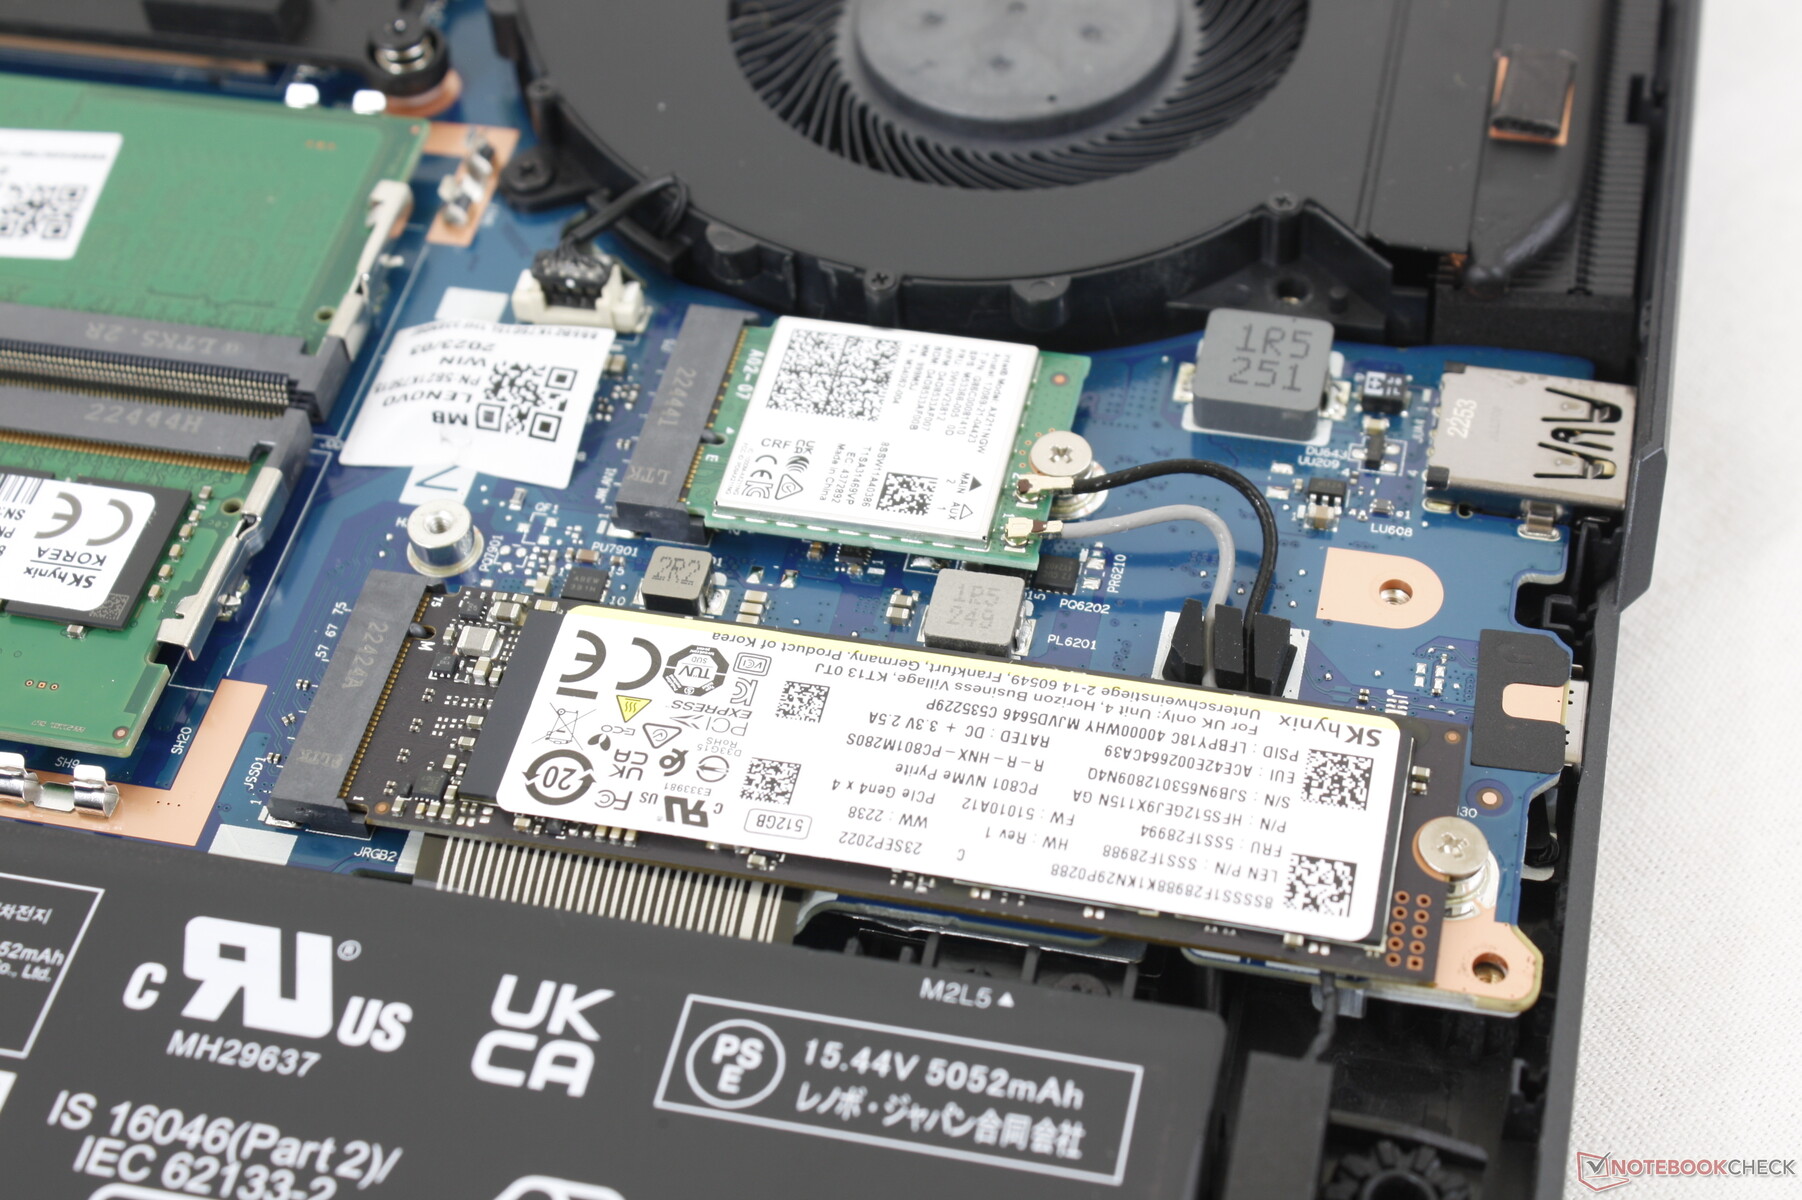
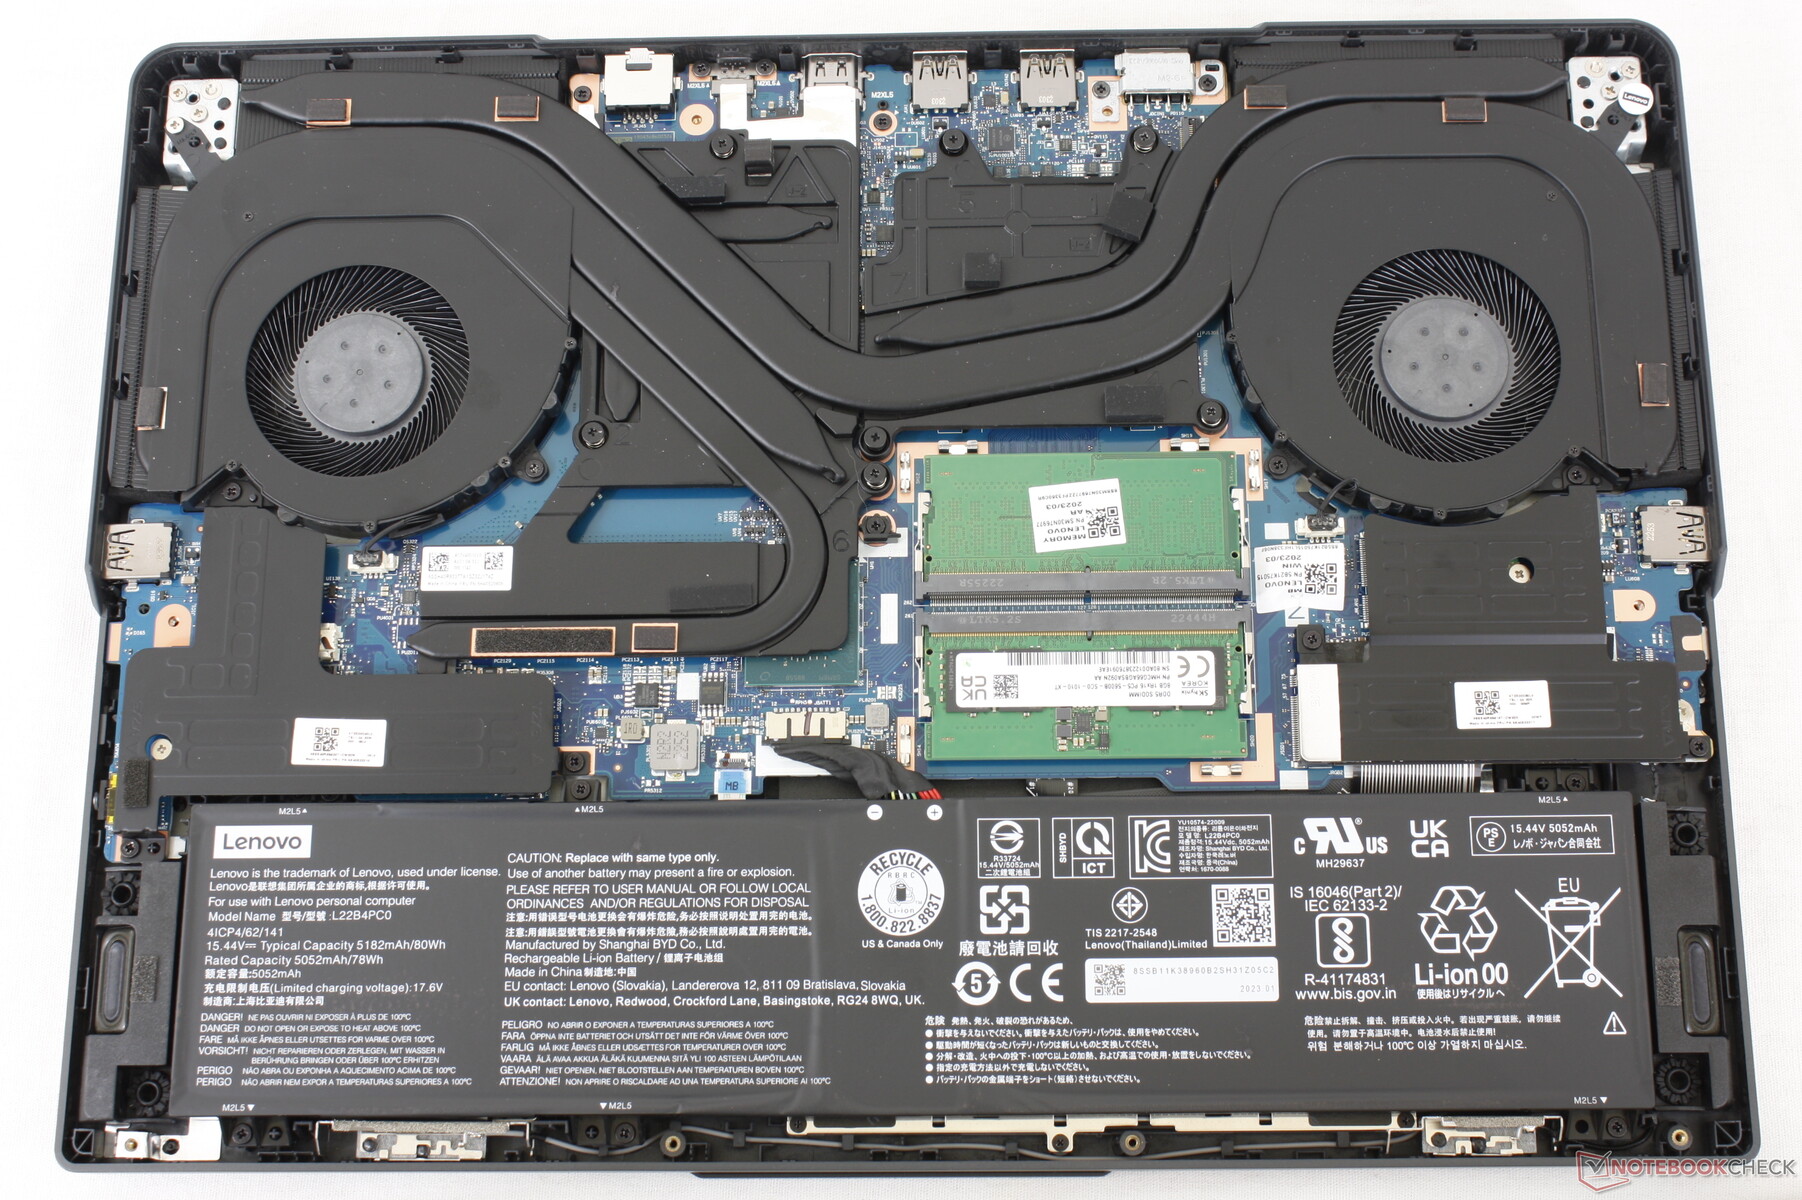
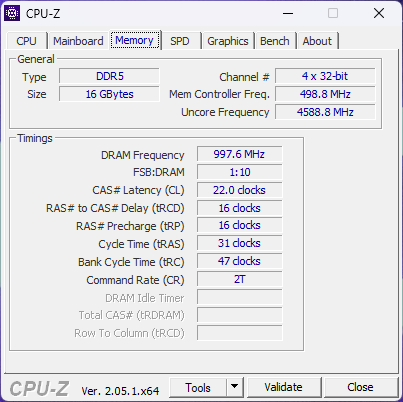
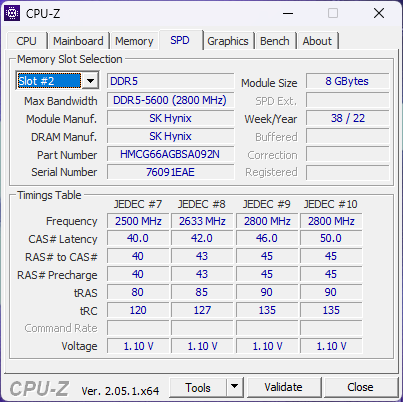
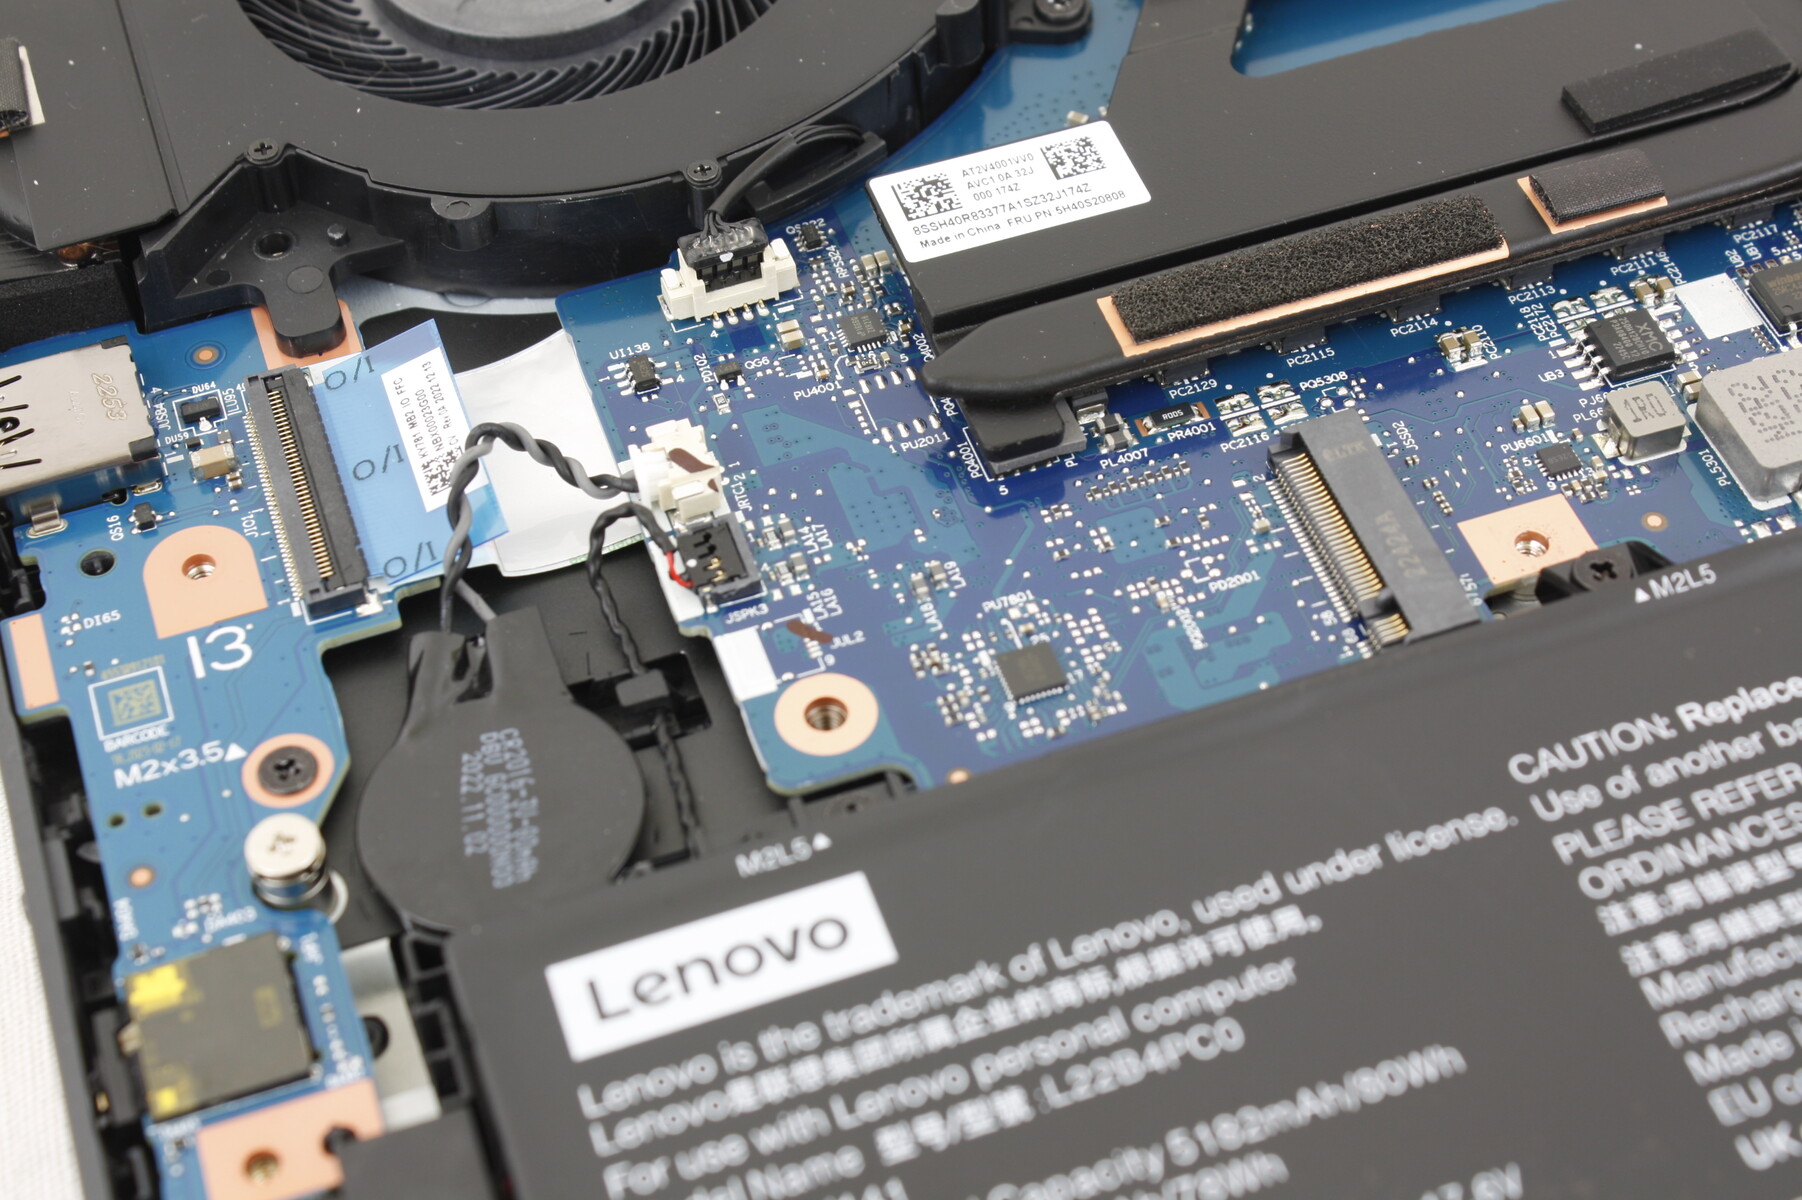
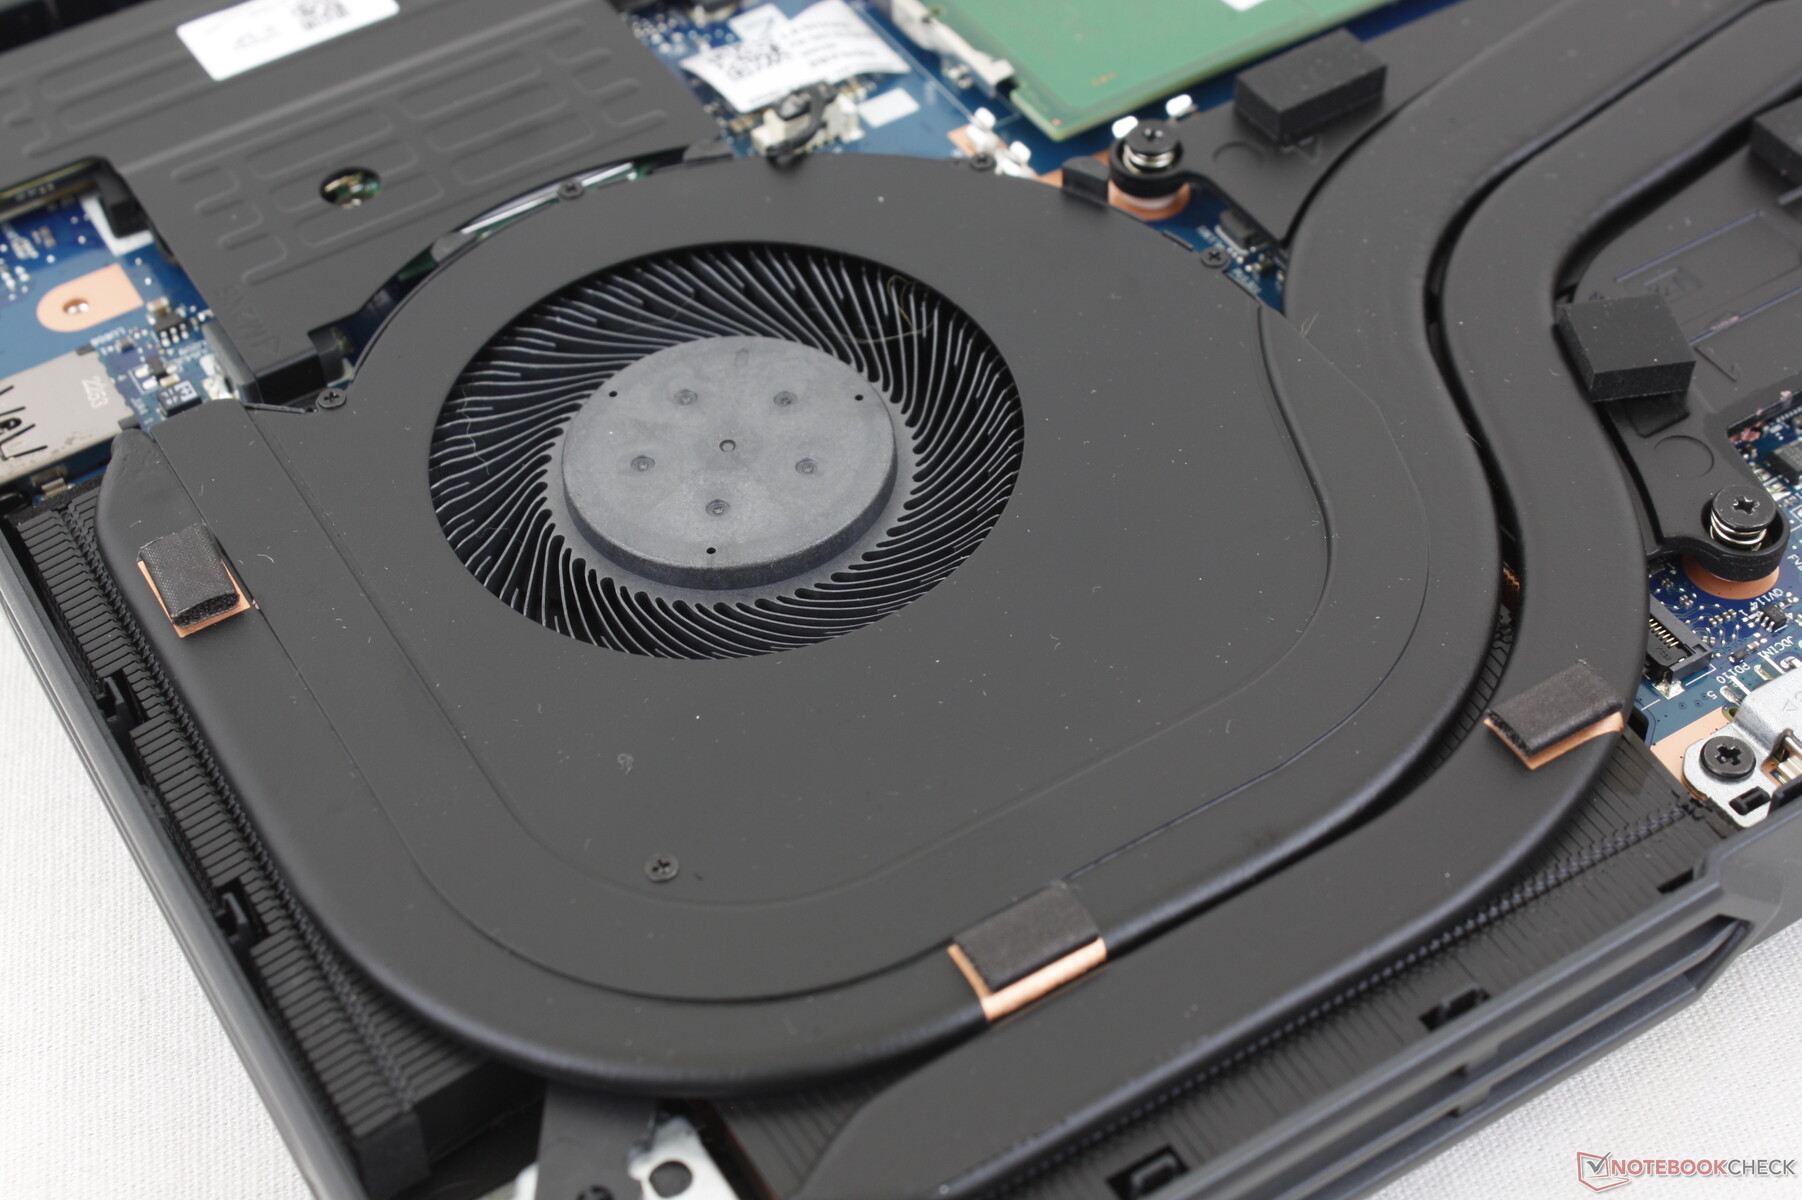
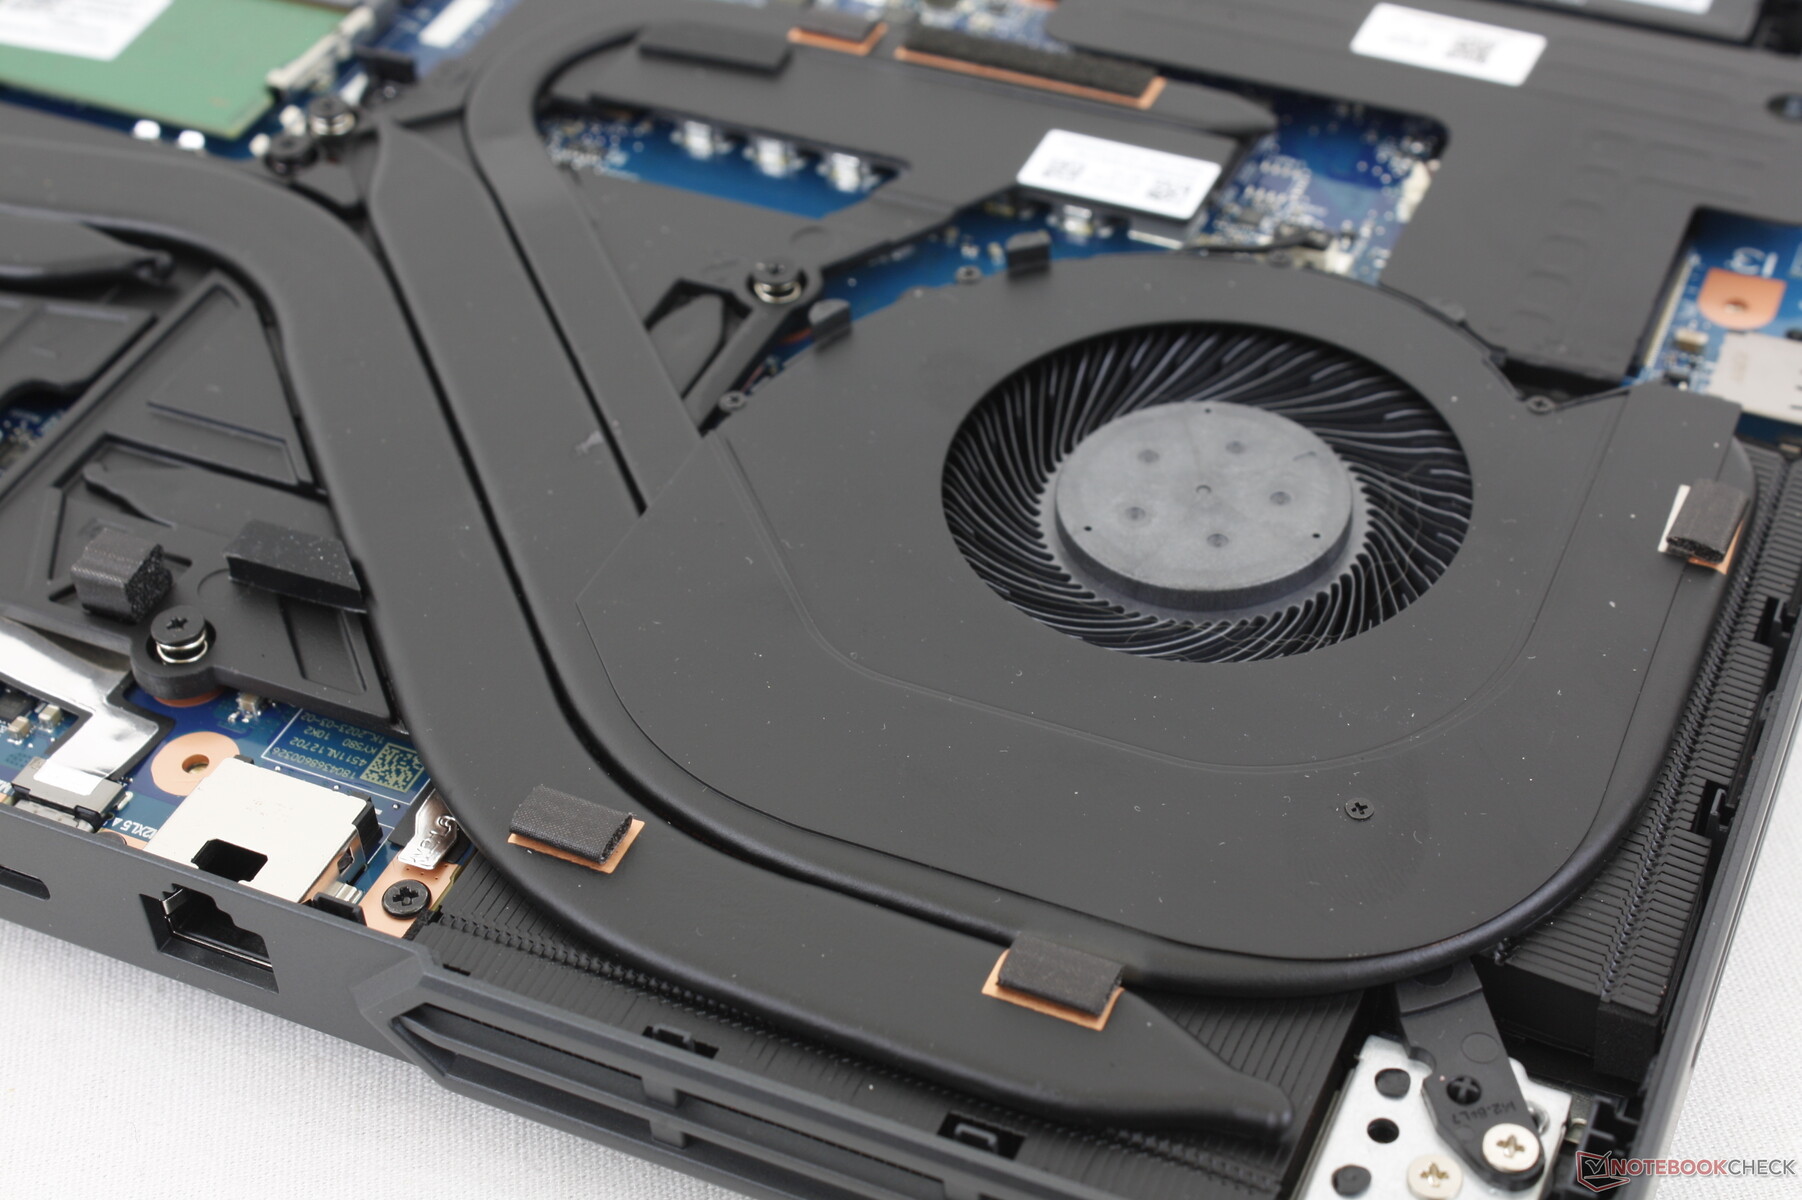
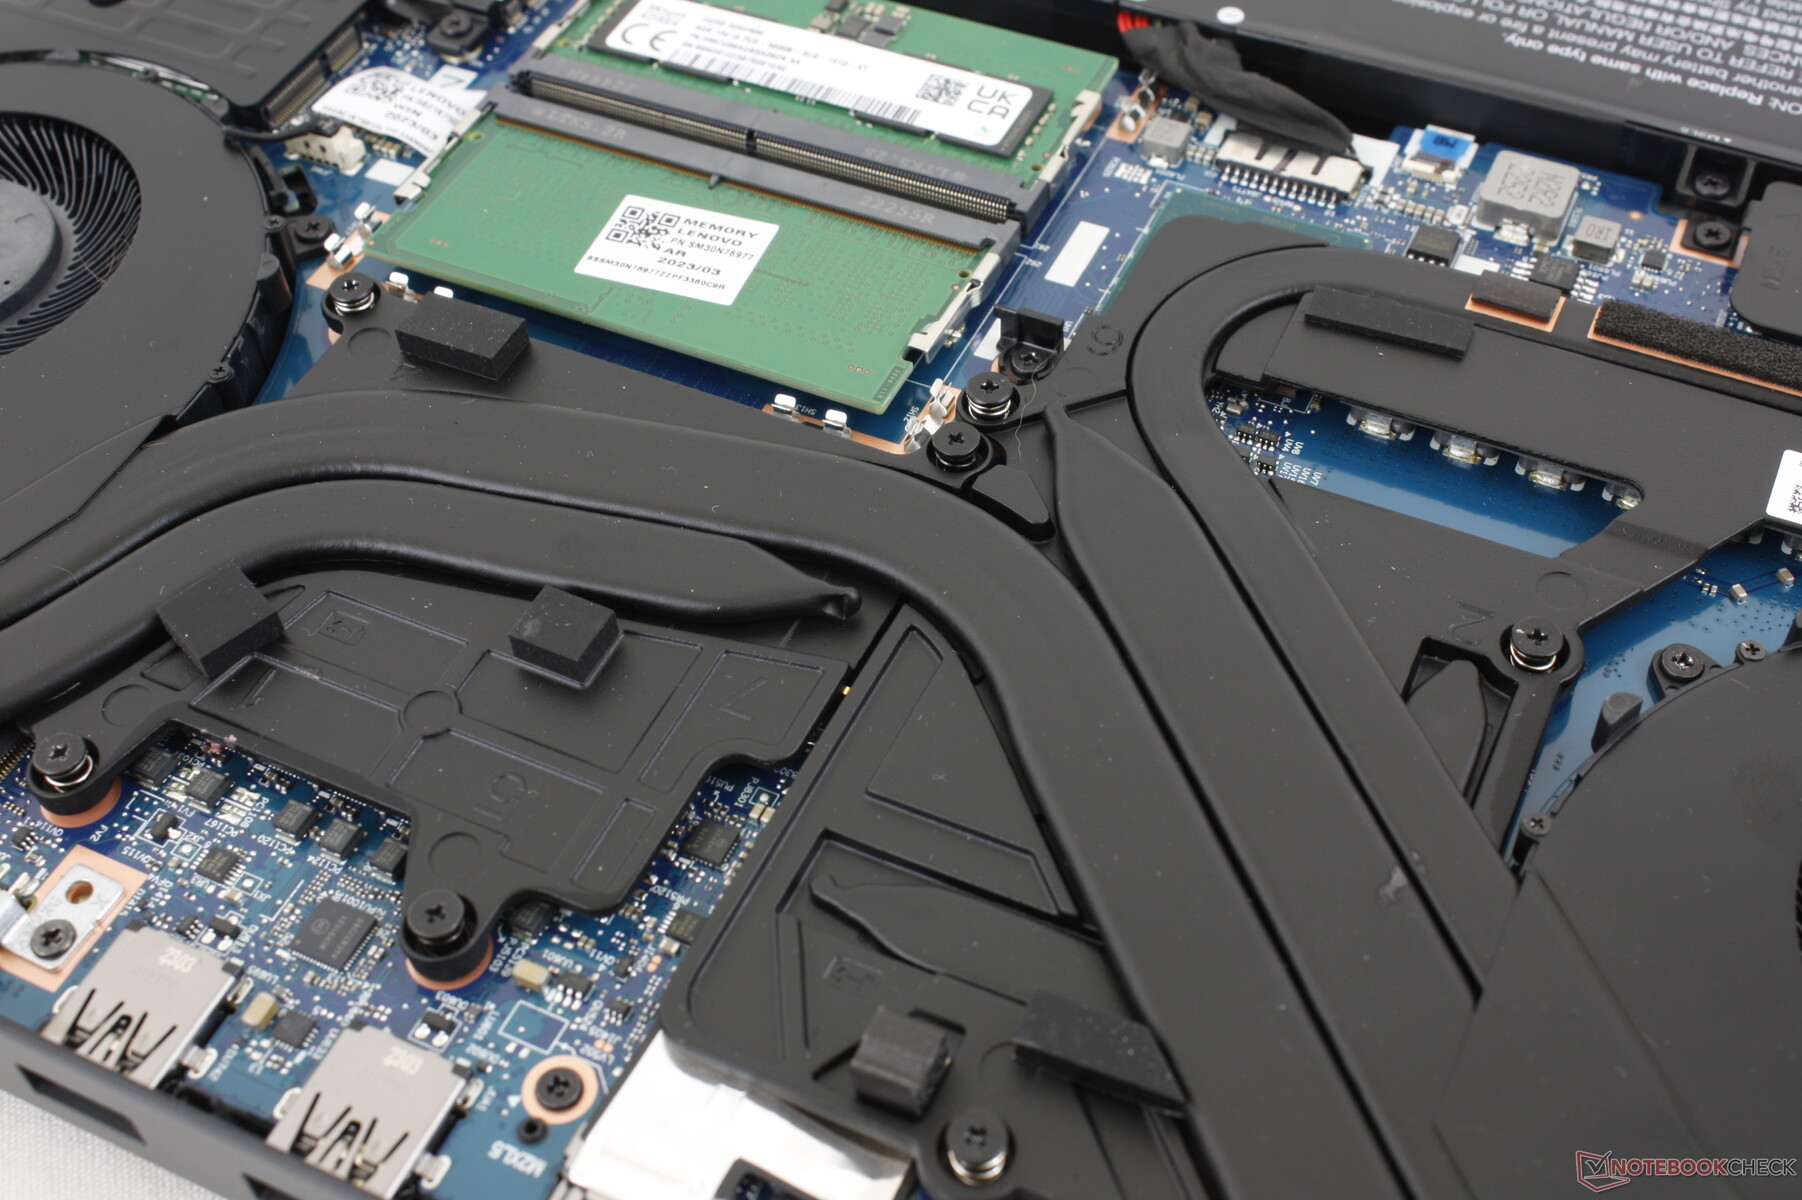
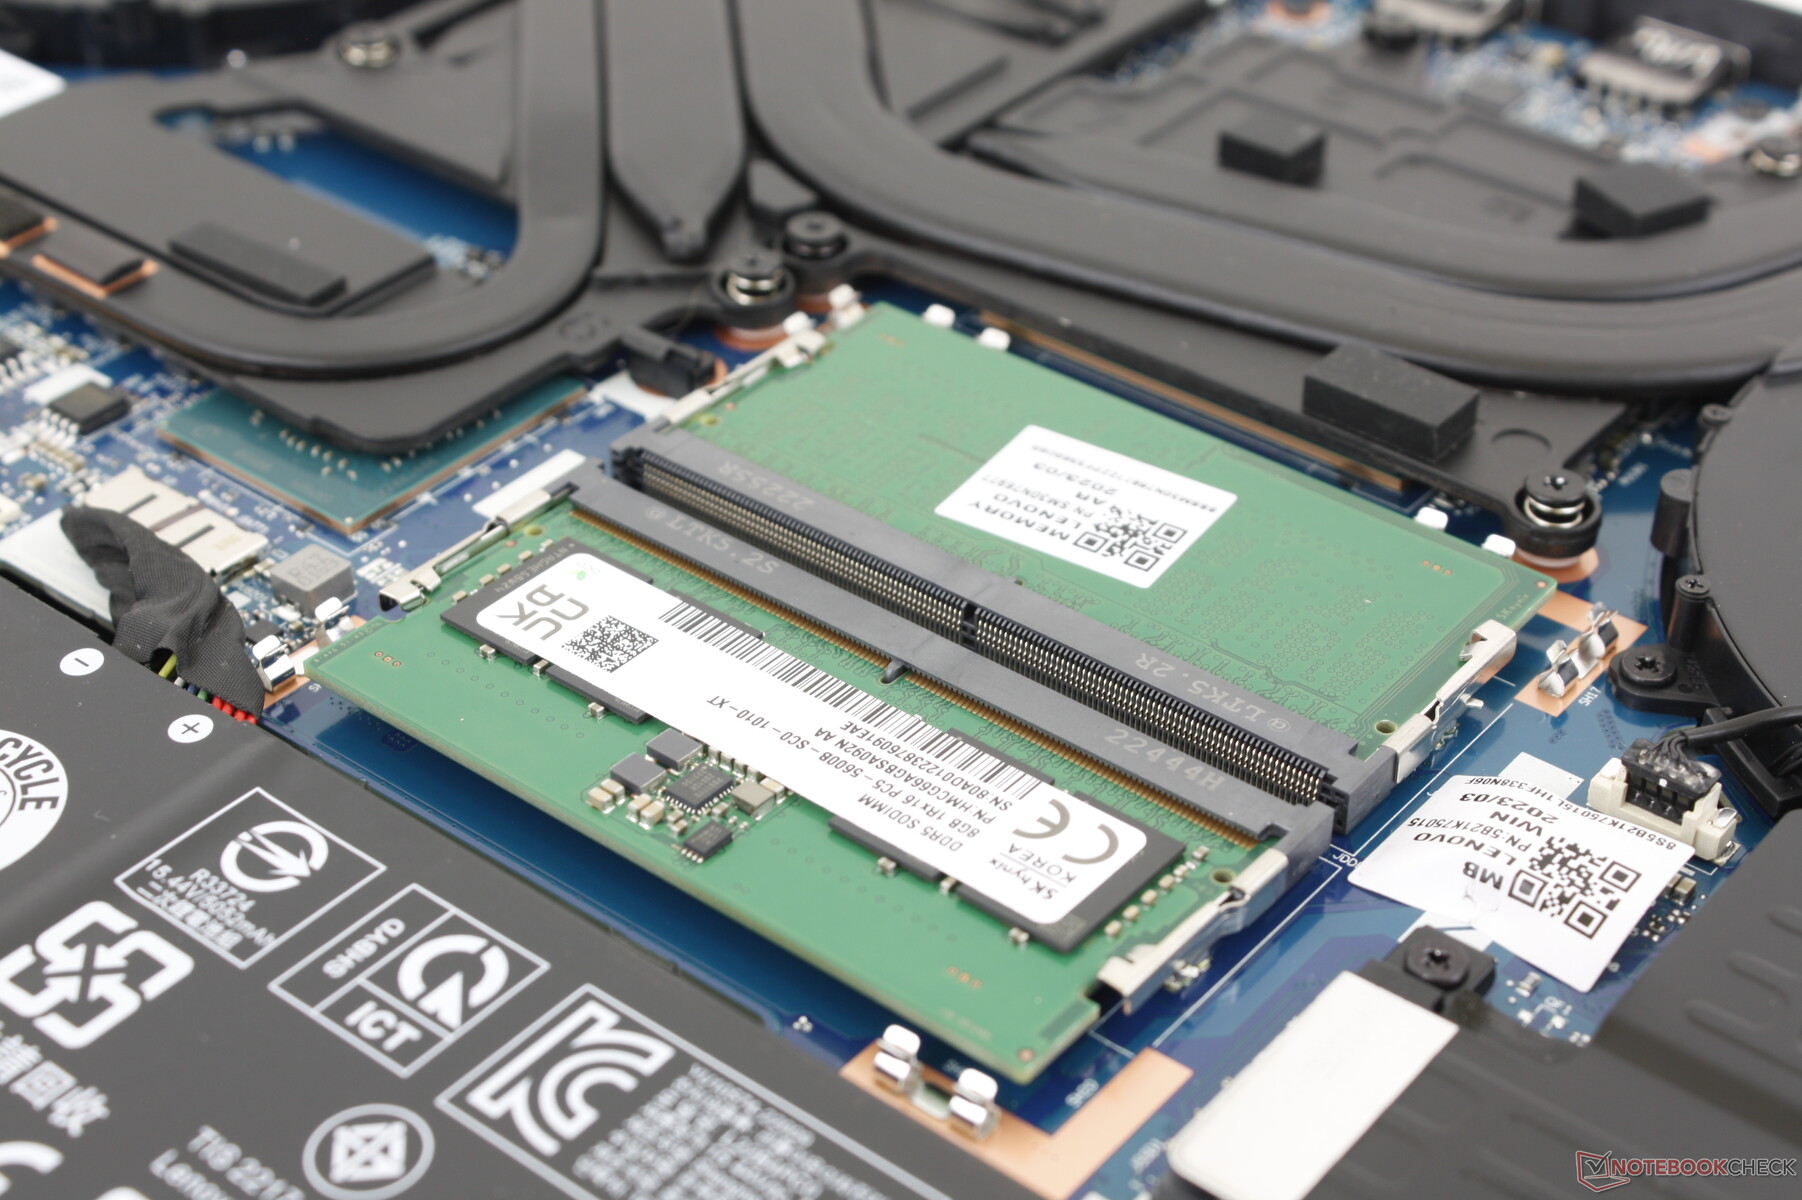
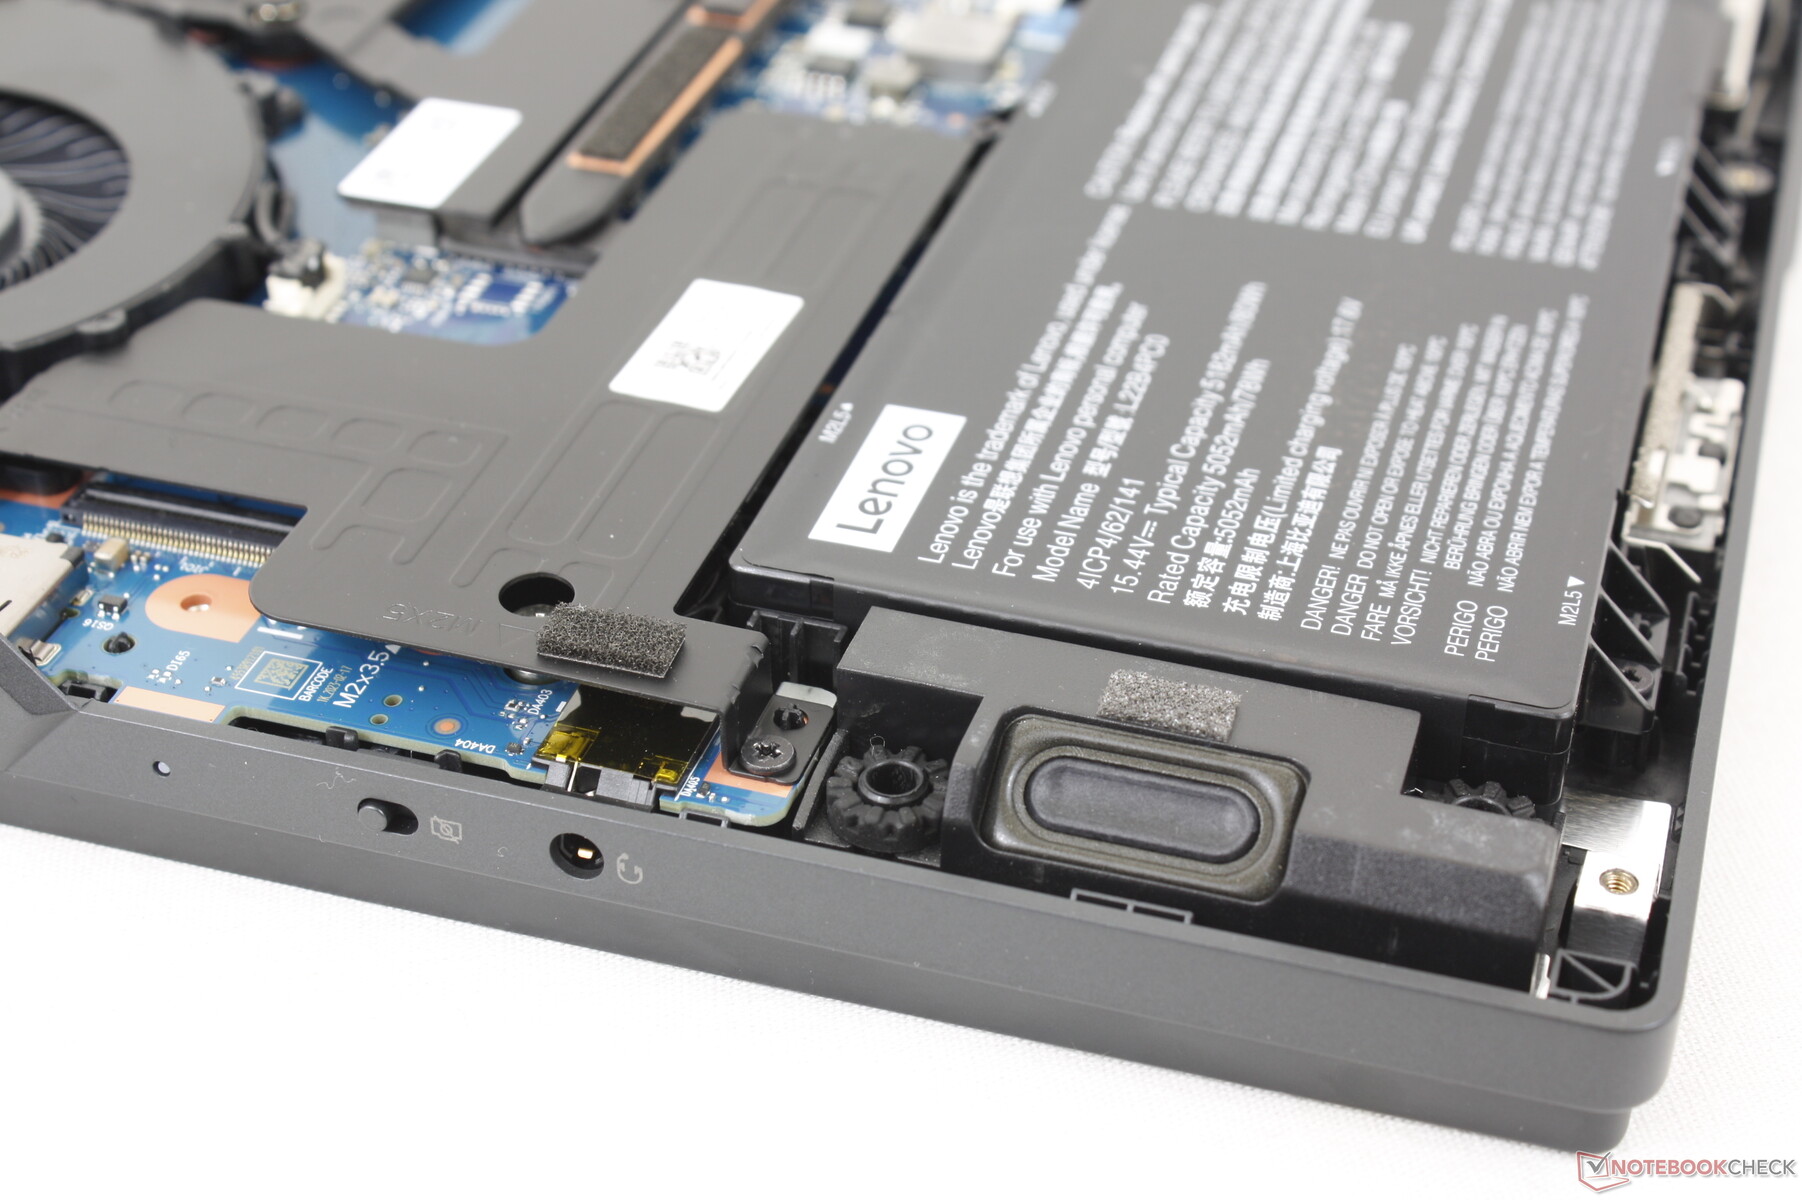
Het bodempaneel kan gemakkelijk worden verwijderd met een Philips schroevendraaier om 2x M.2 2280 PCIe4 x4 bays, 2x SODIMM slots en de verwijderbare WLAN module te onthullen. Merk op dat de bays en het WLAN slot bedekt zijn met aluminium warmte verspreiders.
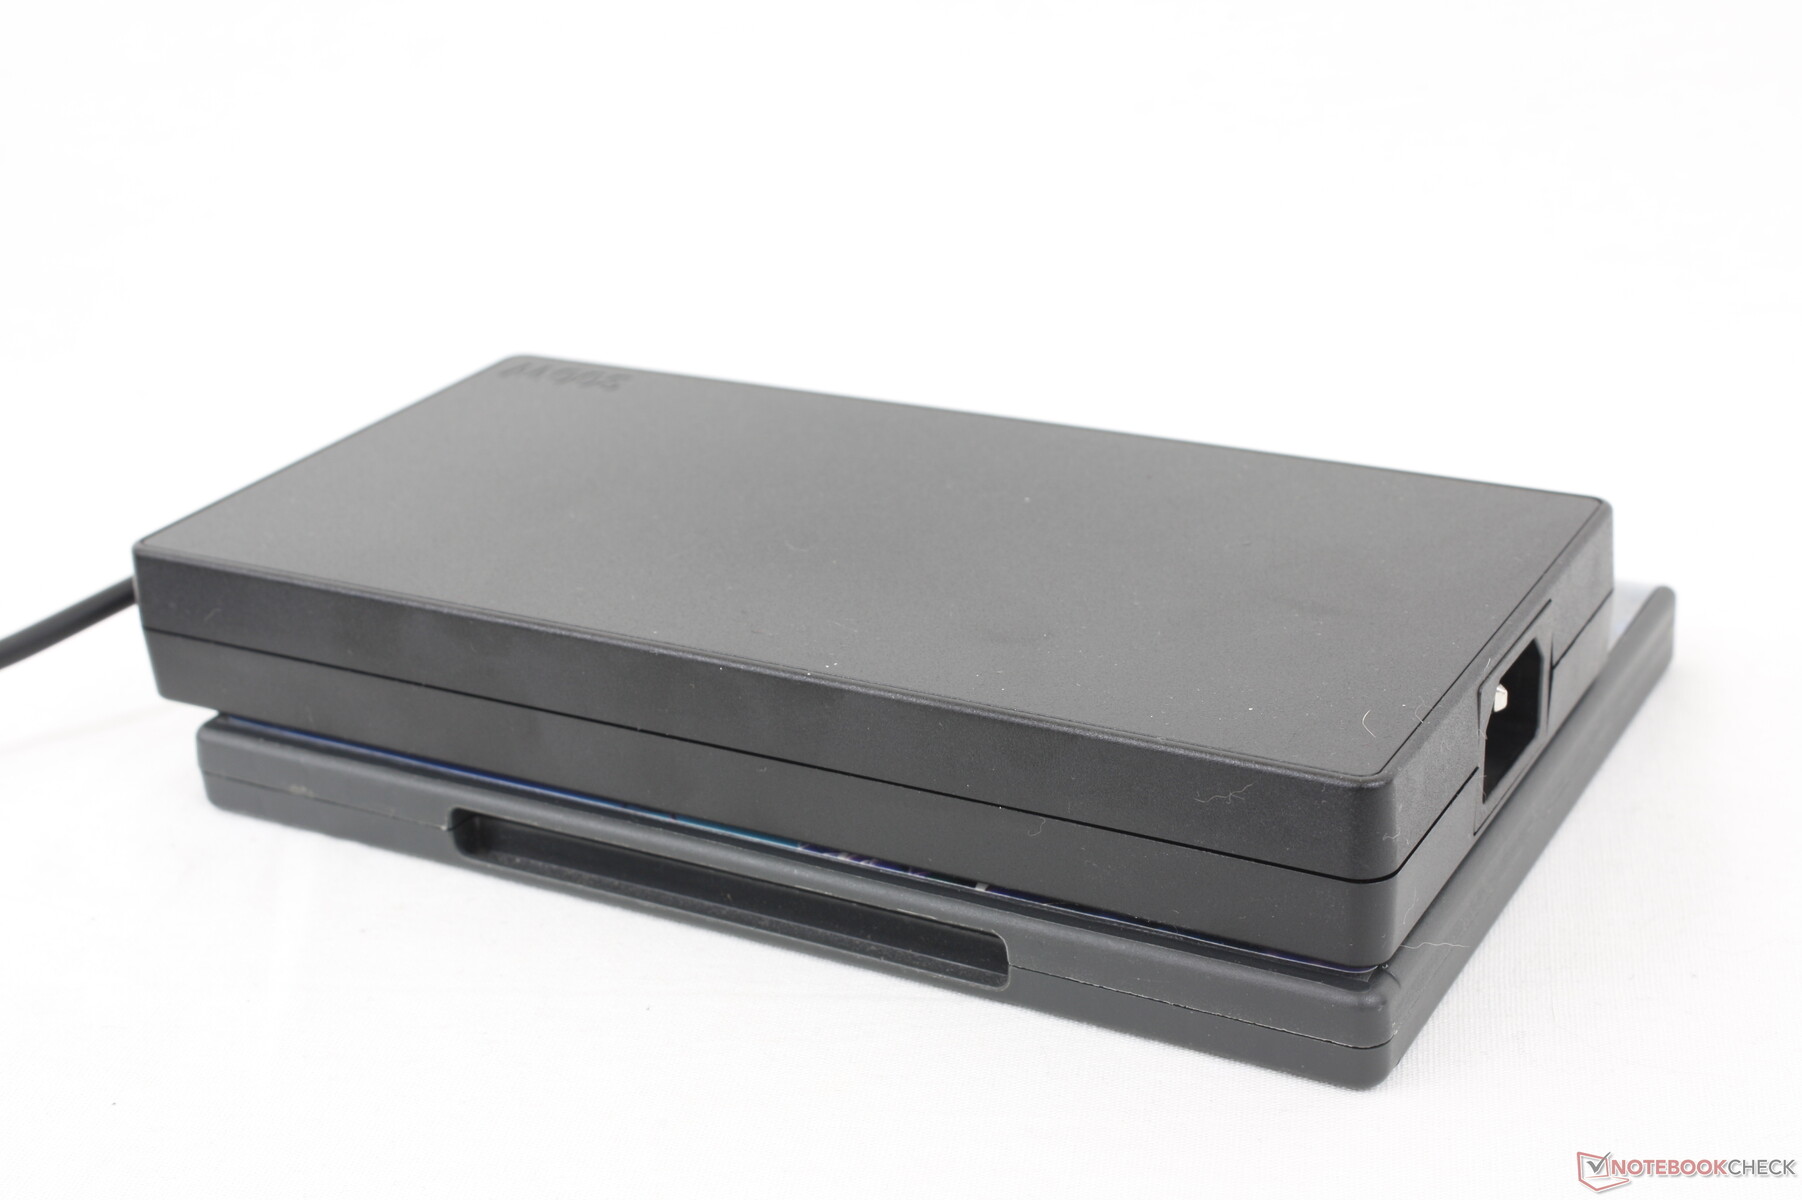
Accessoires en garantie
Er zitten geen extra's in de doos, behalve de wisselstroomadapter en het papierwerk. Bij aankoop in de VS geldt de gebruikelijke eenjarige fabrieksbeperking.
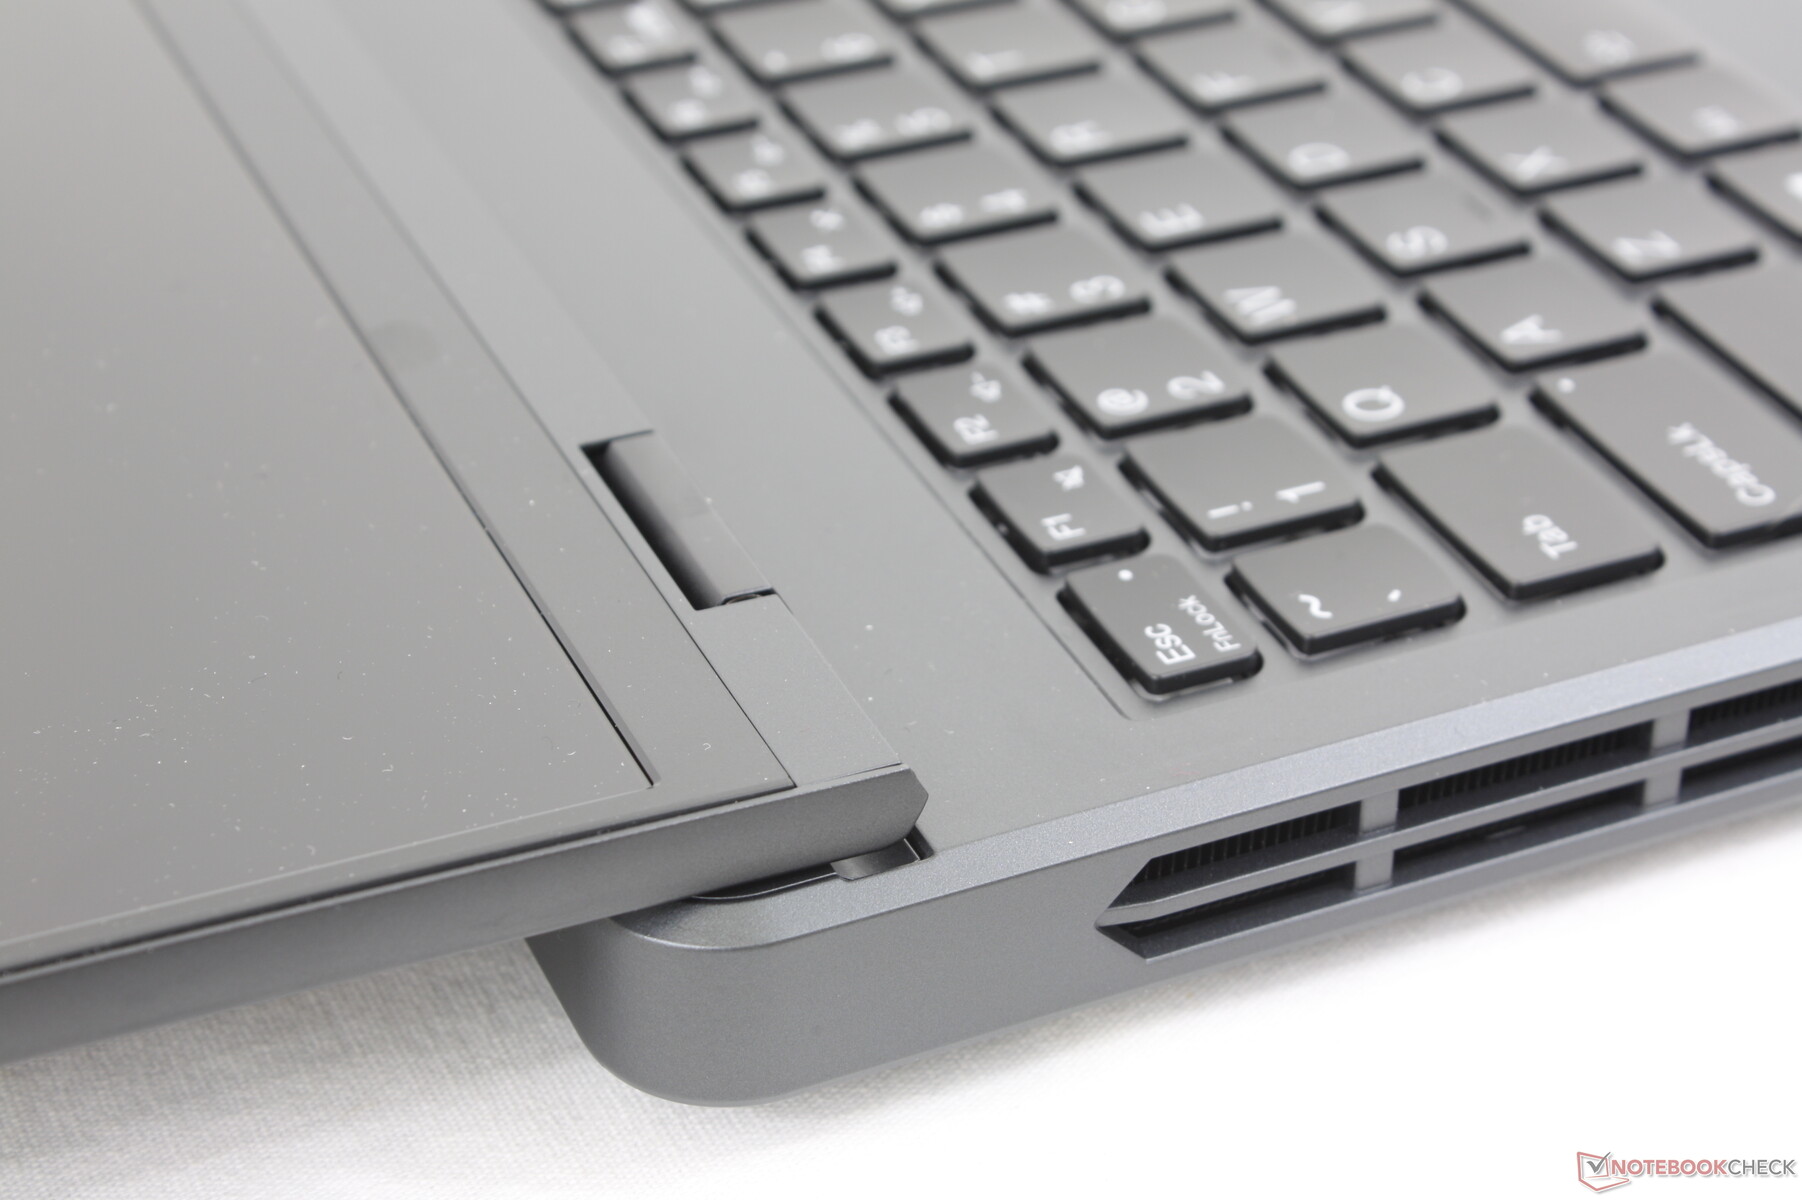
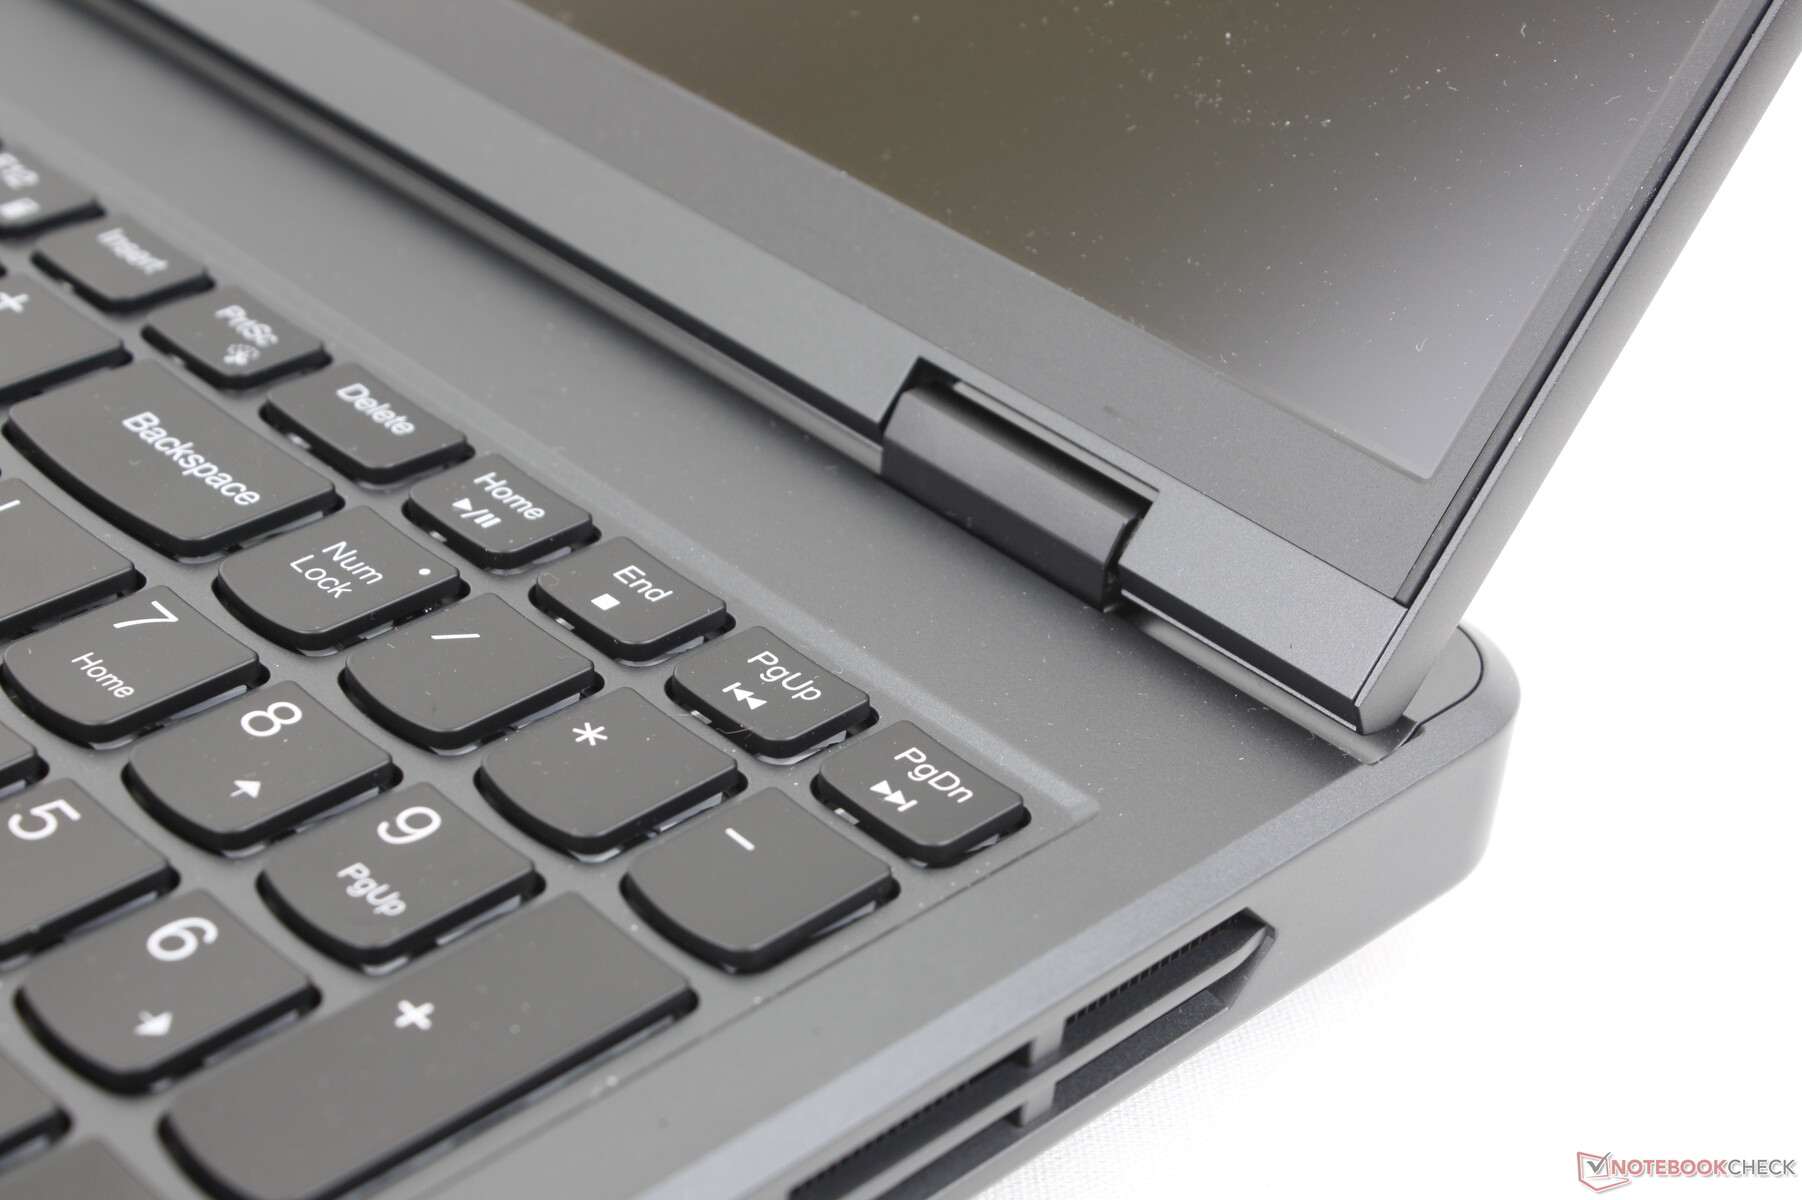
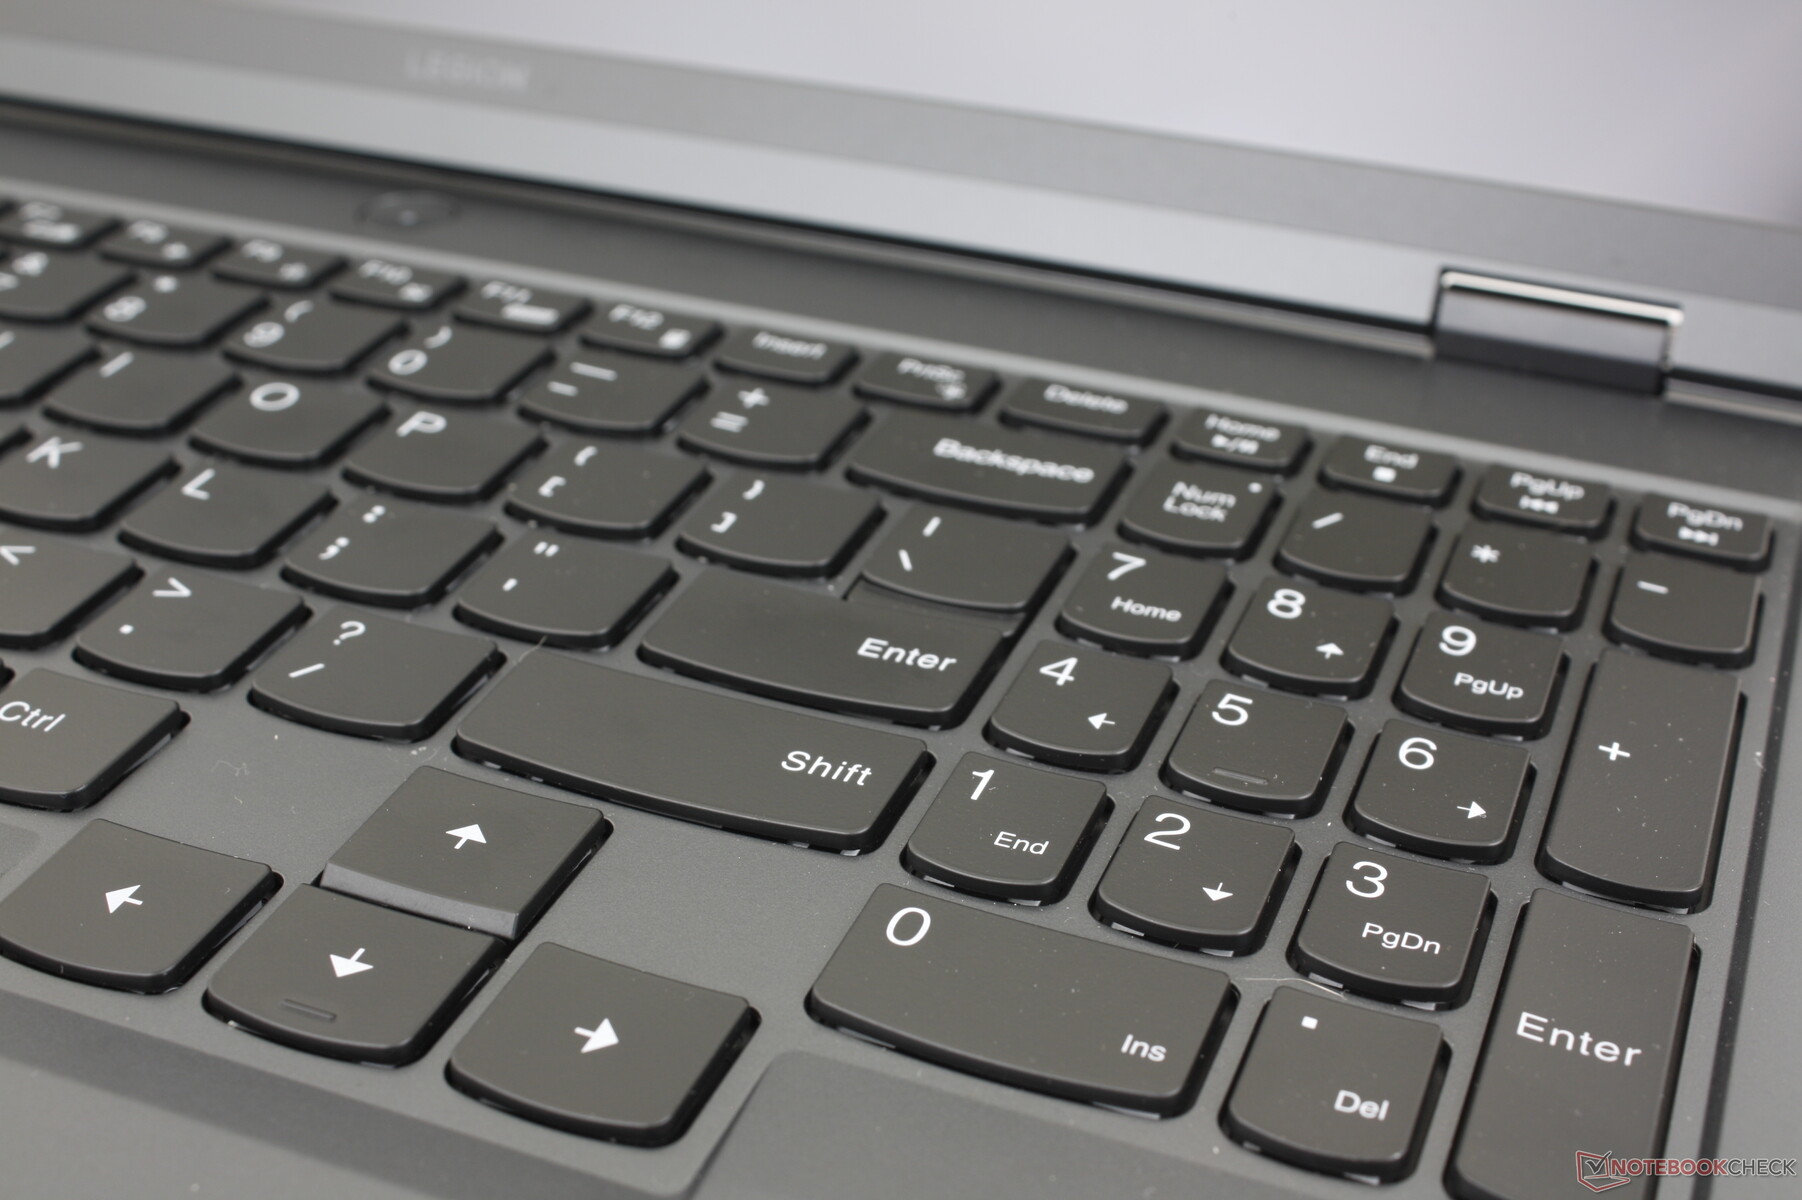
Invoerapparaten - Comfortabel en ruim toetsenbord
Toetsenbord
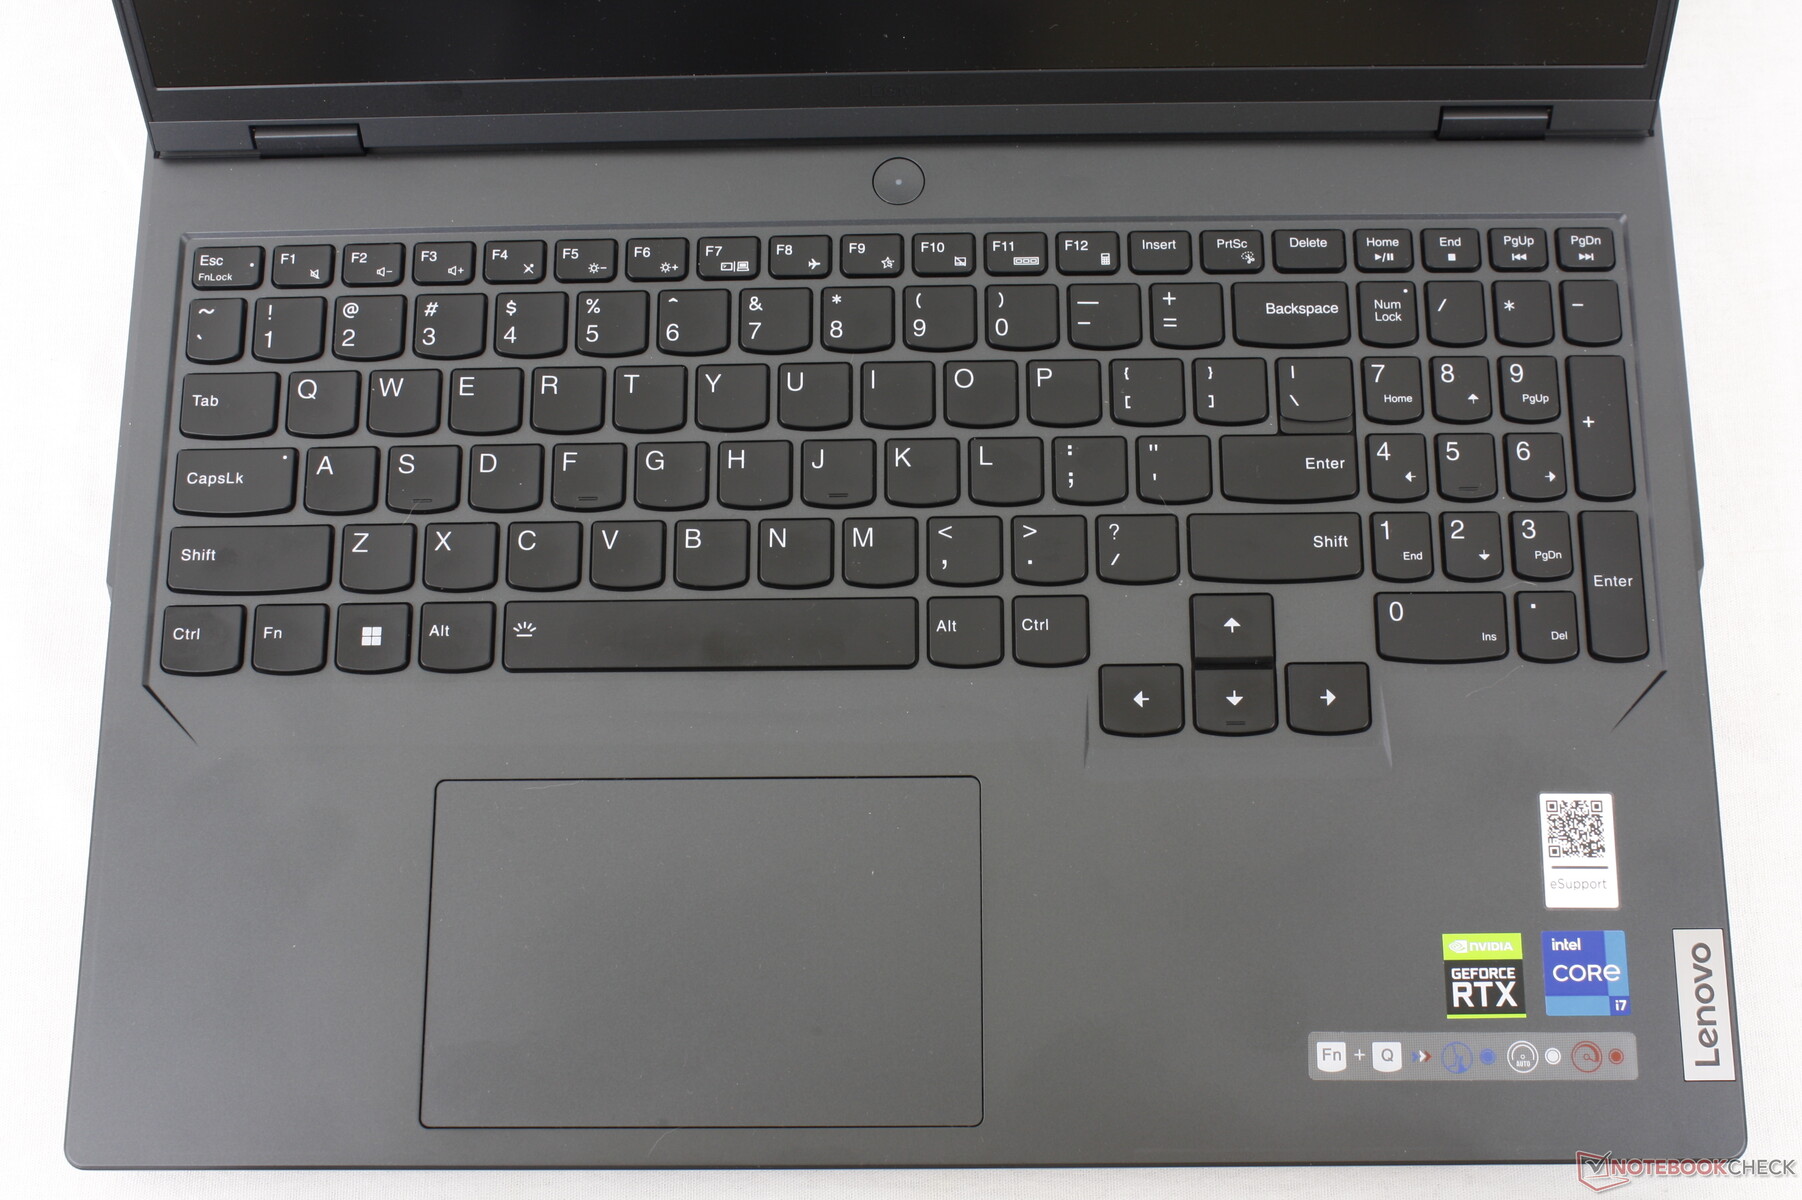
Het toetsenbord biedt 1,5 mm travel, 0,2 mm pitch, en 100 procent anti-ghosting voor gaming doeleinden. De reis en feedback alleen zijn al dieper en sterker, respectievelijk, dan de toetsenborden op de Razer Blade 16 of Asus Zephyrus M16 voor een meer bevredigende type-ervaring dan beide concurrenten.
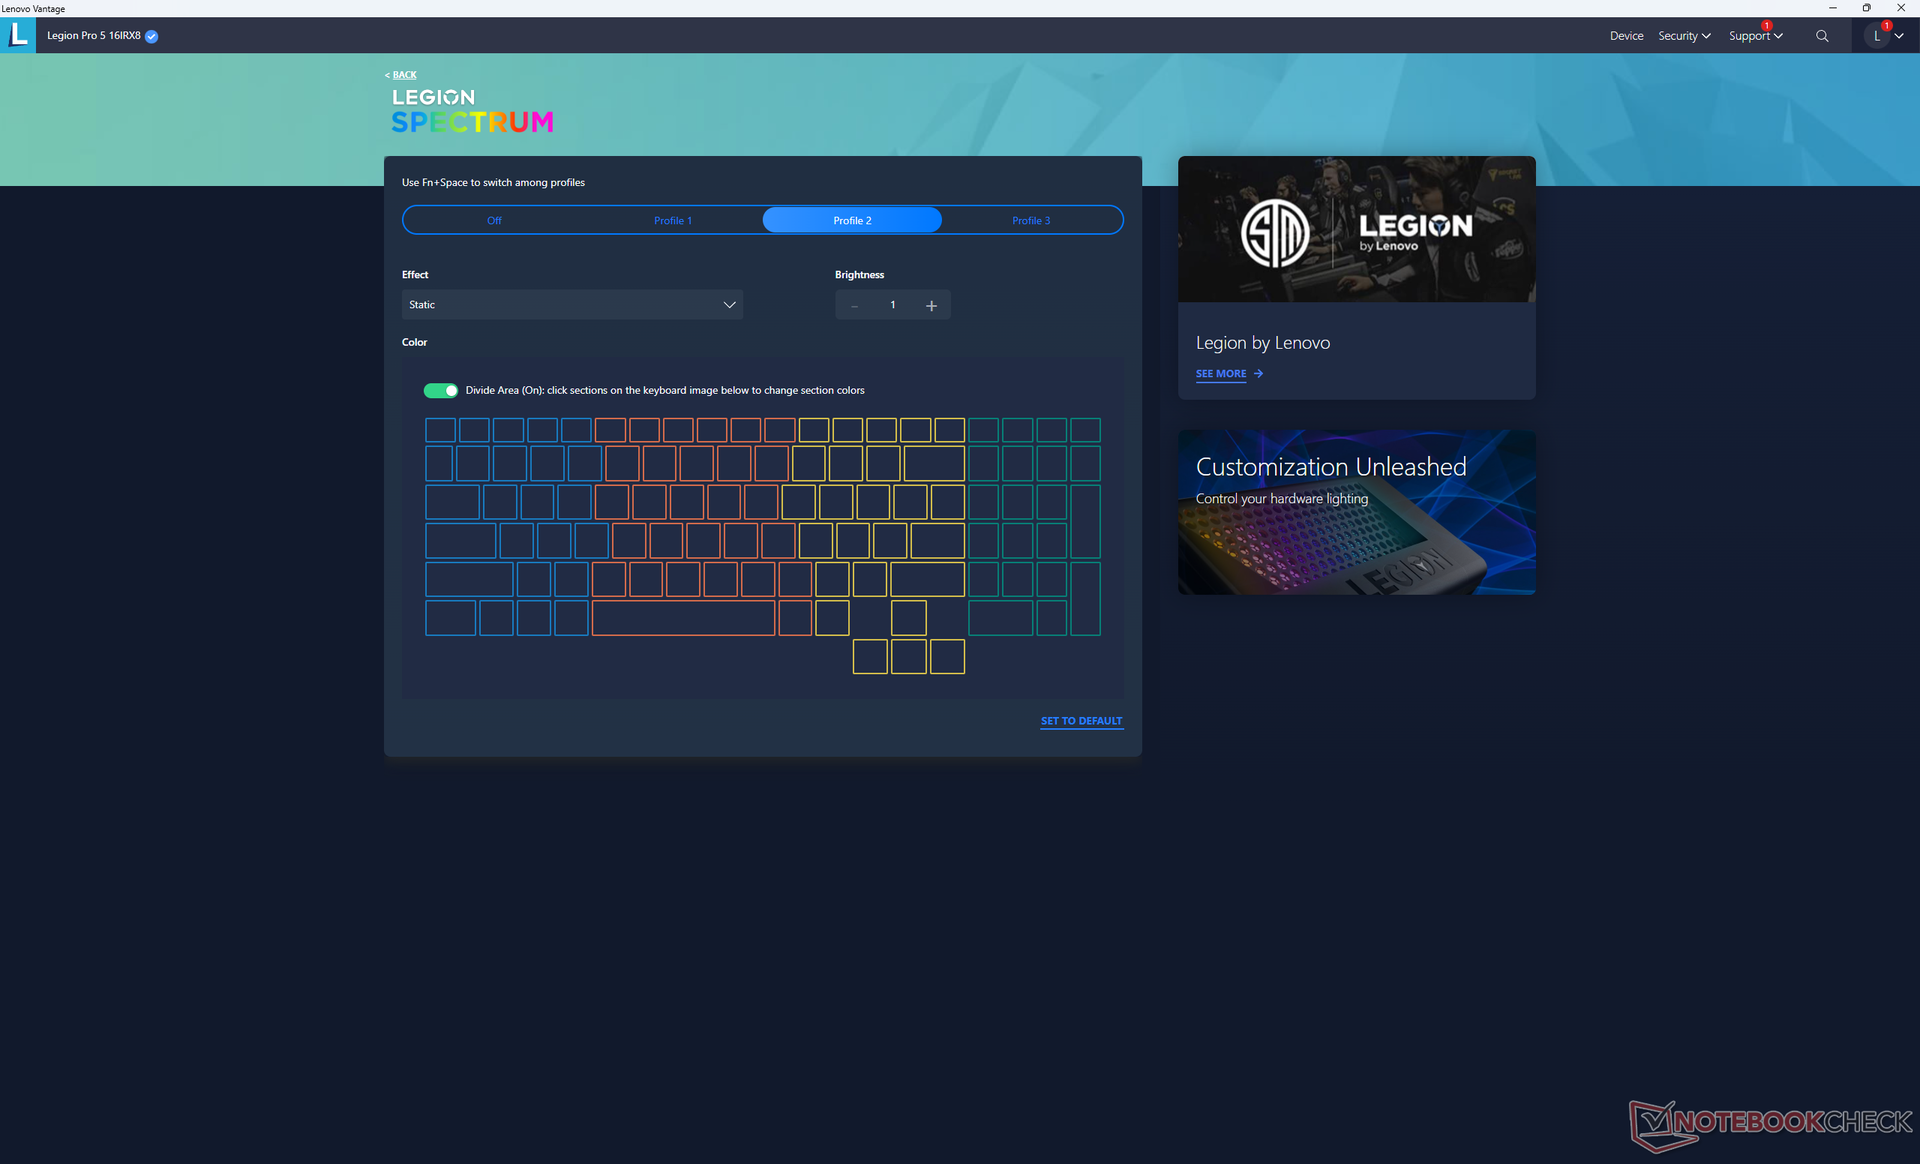
Bepaalde functies blijven exclusief voor de duurdere Legion 7 Pro-serie, zoals het mechanische toetsenbord en per-toets RGB-verlichting. Het eerste is begrijpelijk, maar we vinden het belachelijk dat Lenovo het laatste niet aanbiedt voor onze $1500+ configuratie. Eigenaren moeten in plaats daarvan genoegen nemen met quad-zone RGB-verlichting.
Touchpad
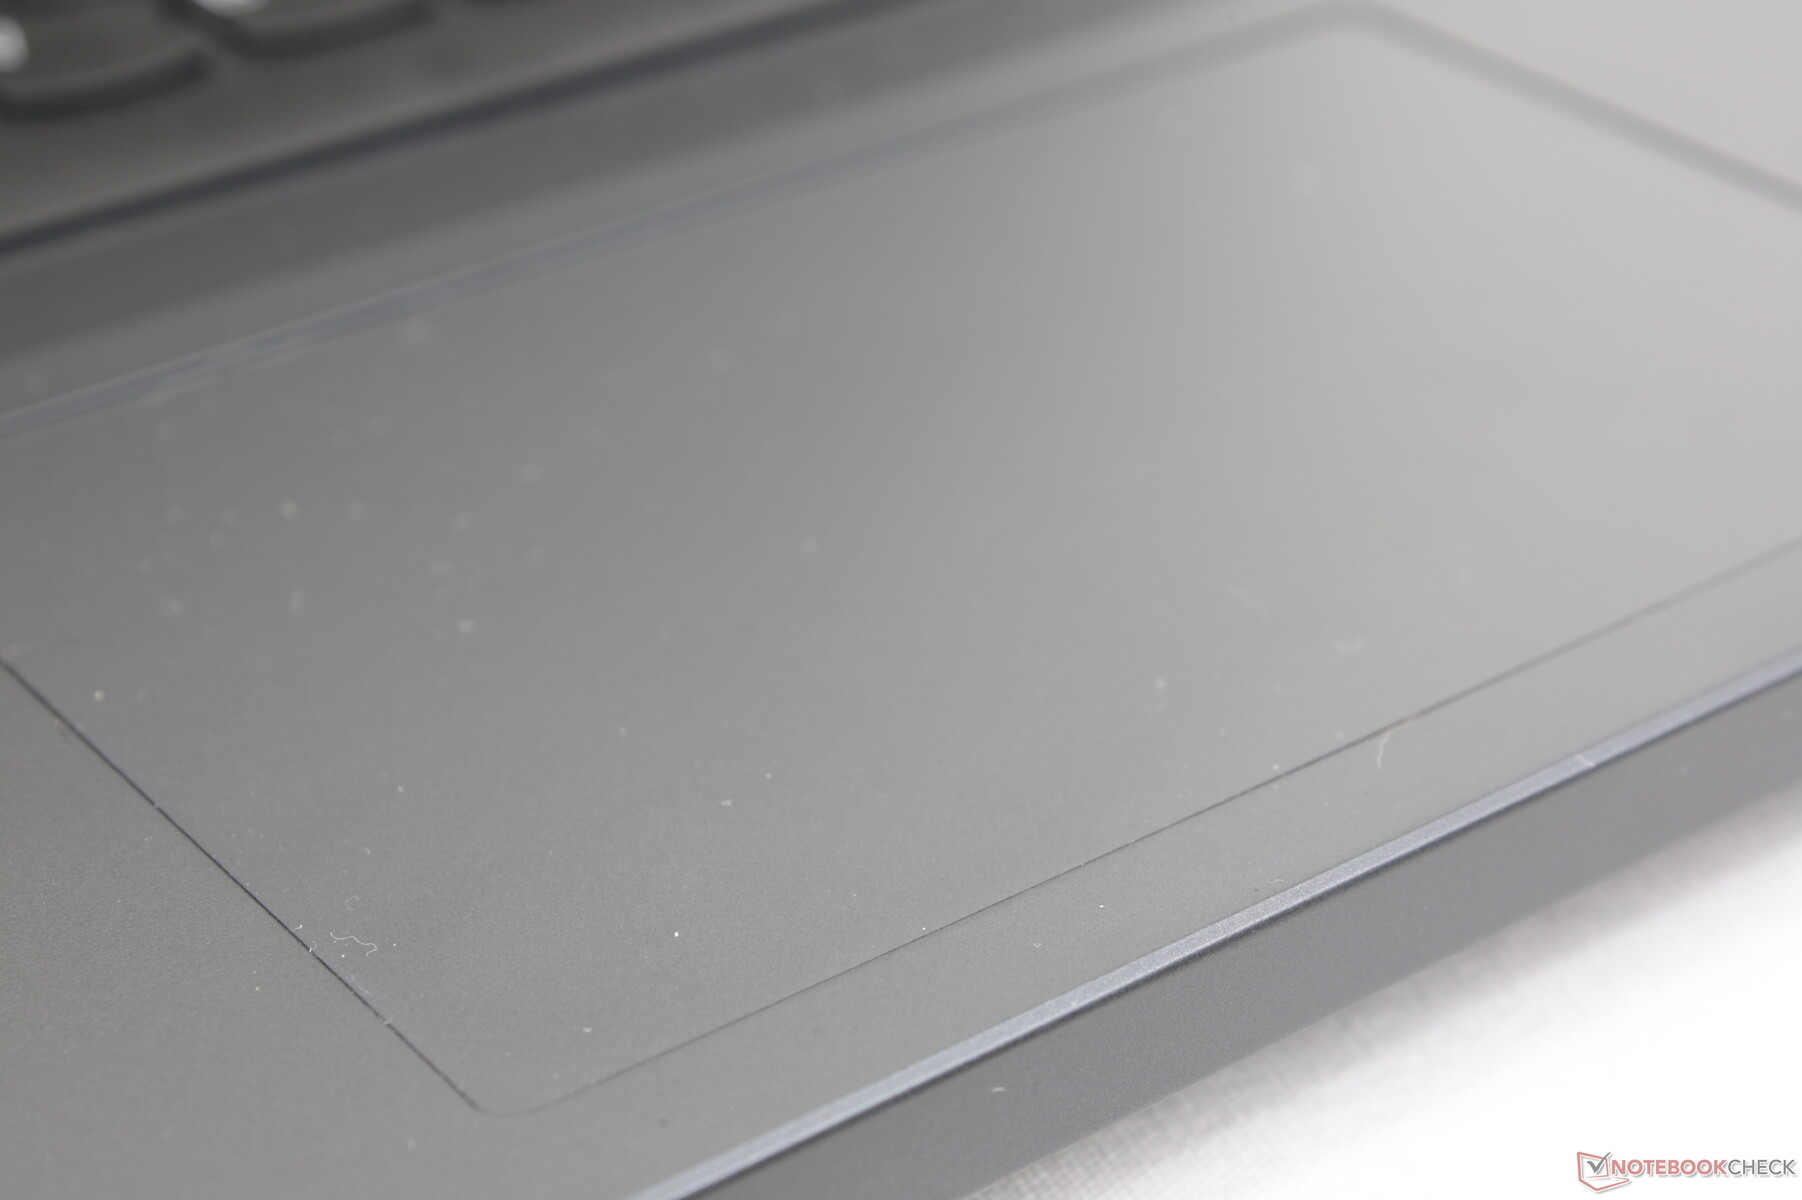
Het clickpad (12 x 7,5 cm) is ongeveer even groot als dat van deInspiron 16 Plus 7620 (11,5 x 8 cm). Glijden is soepel en responsief met slechts een beetje plakken bij lagere snelheden voor nauwkeuriger klikken. De beweging is echter zeer ondiep bij het klikken en de feedback is niet erg sterk. Desalniettemin werkt het clickpad betrouwbaar genoeg voor eenvoudige taken wanneer er geen muis beschikbaar is.

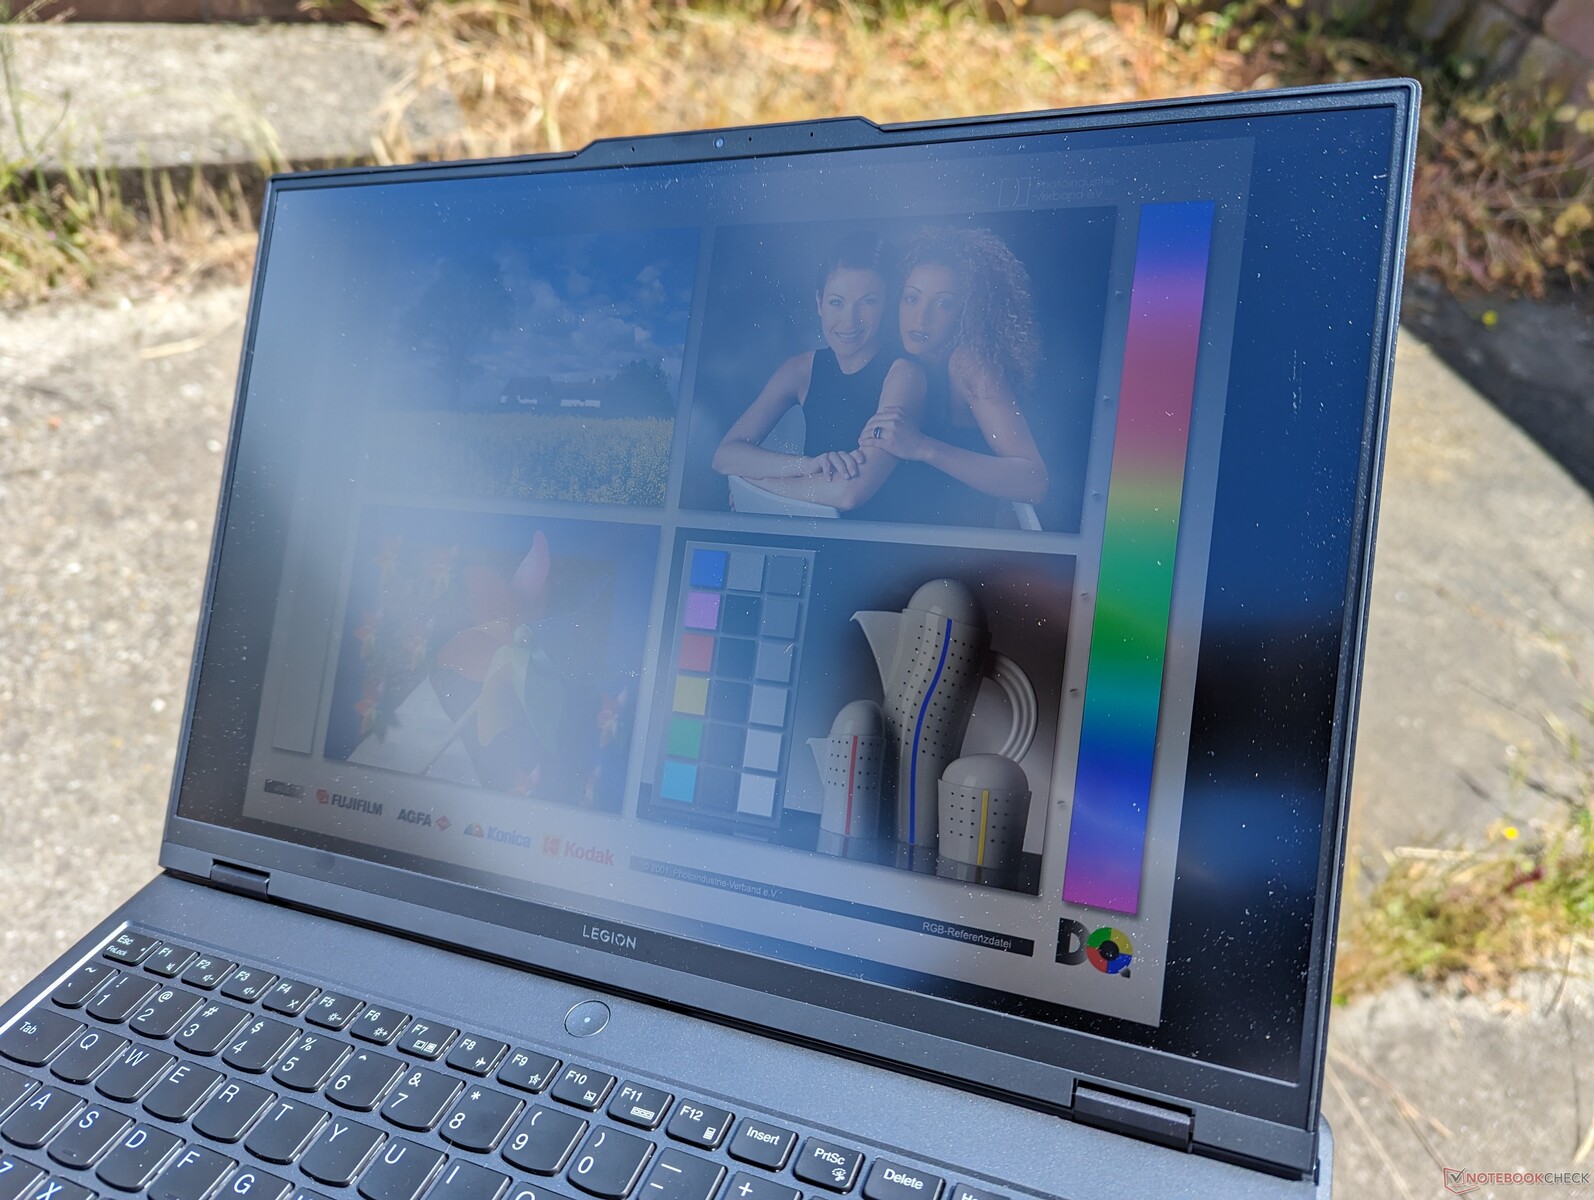
Display - minimaal 165 Hz
Er zijn twee schermopties voor de 2023 Legion Pro 5 16: 165 Hz en 240 Hz. Beide ondersteunen G-Sync, 2560 x 1600 native resolutie en volledige sRGB dekking, terwijl alleen het 240 Hz paneel HDR400 ondersteunt. De basis 165 Hz optie zou meer dan voldoende moeten zijn voor de beoogde midrange gamer. De beeldkwaliteit is uitstekend met verrassend weinig korreligheid voor een mat paneel.
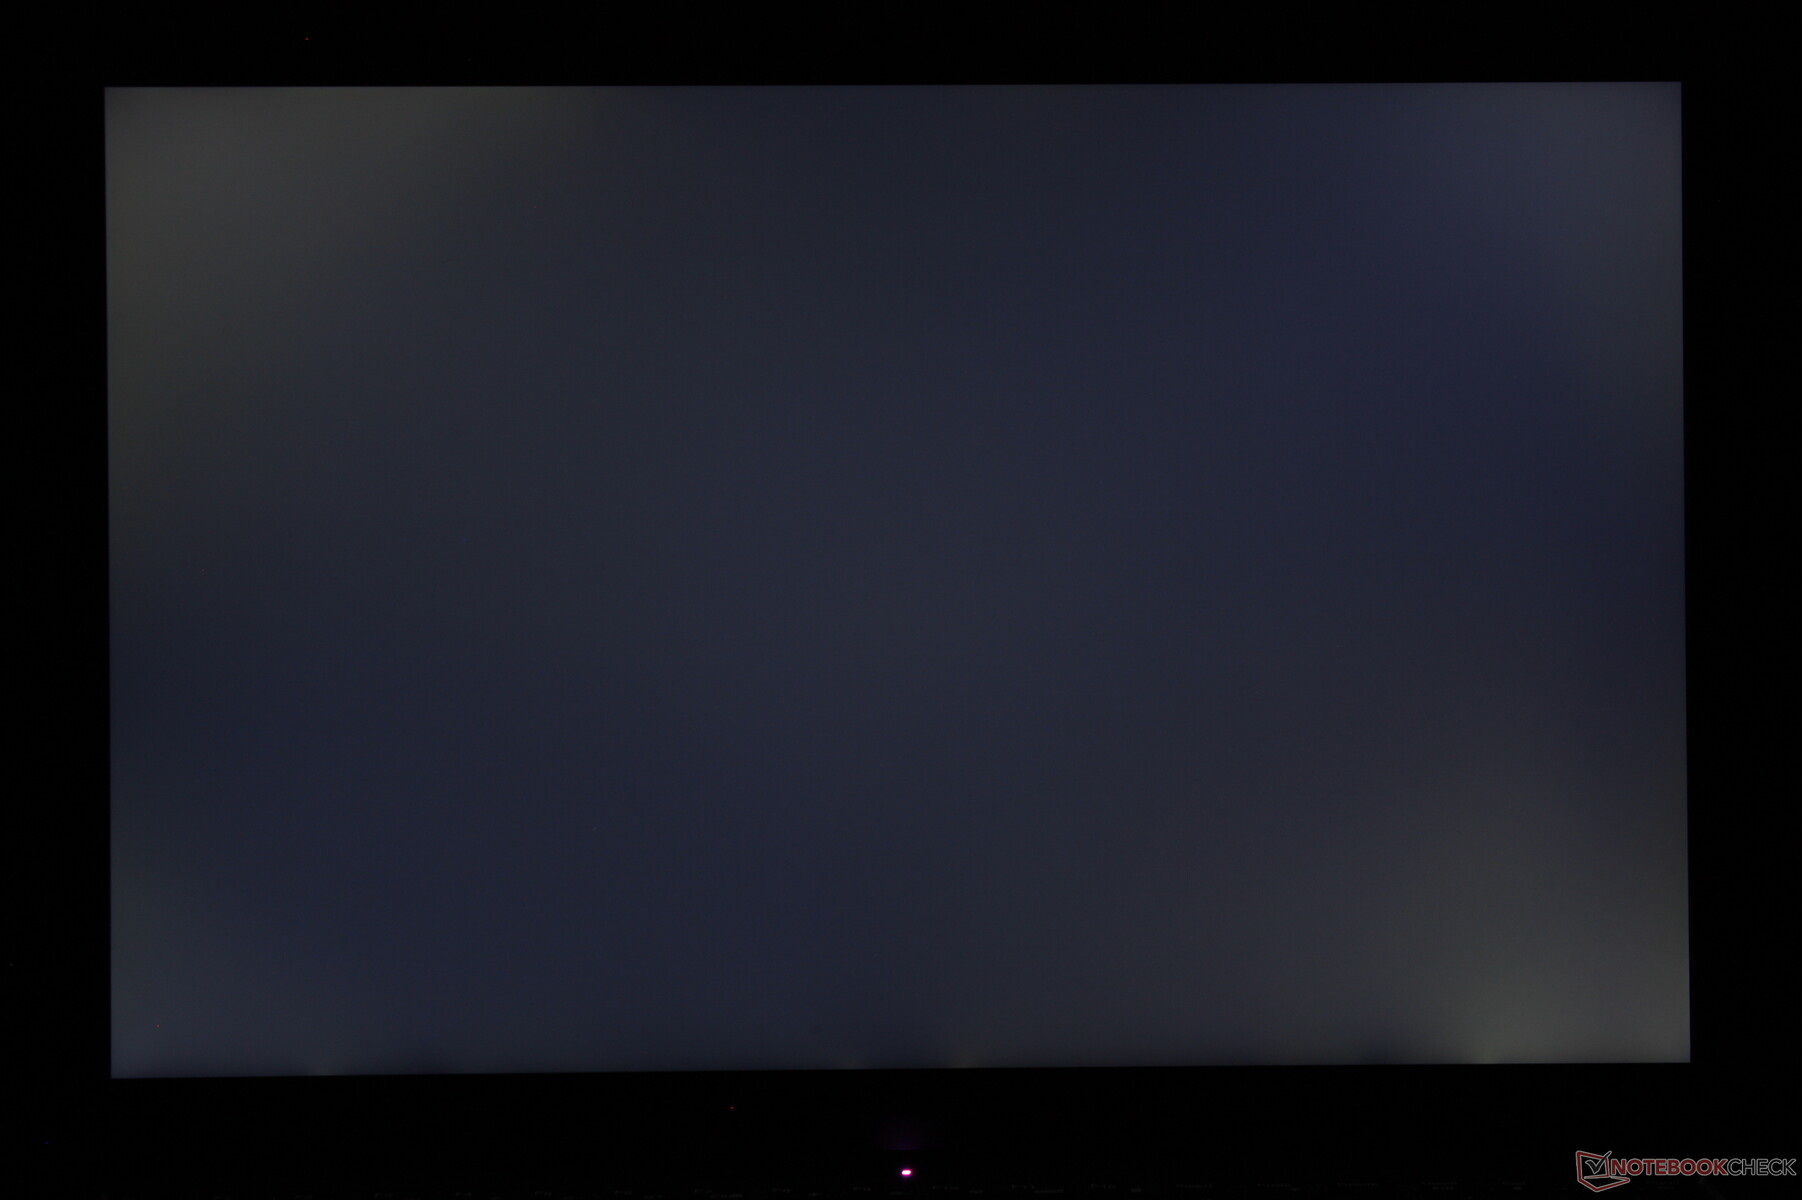
Backlight bleeding is zeker voor verbetering vatbaar. Onze eenheid zou een behoorlijke hoeveelheid licht bloeden vertonen, die we op de grens van onaanvaardbaar vinden op een gaming laptop van deze prijsklasse.
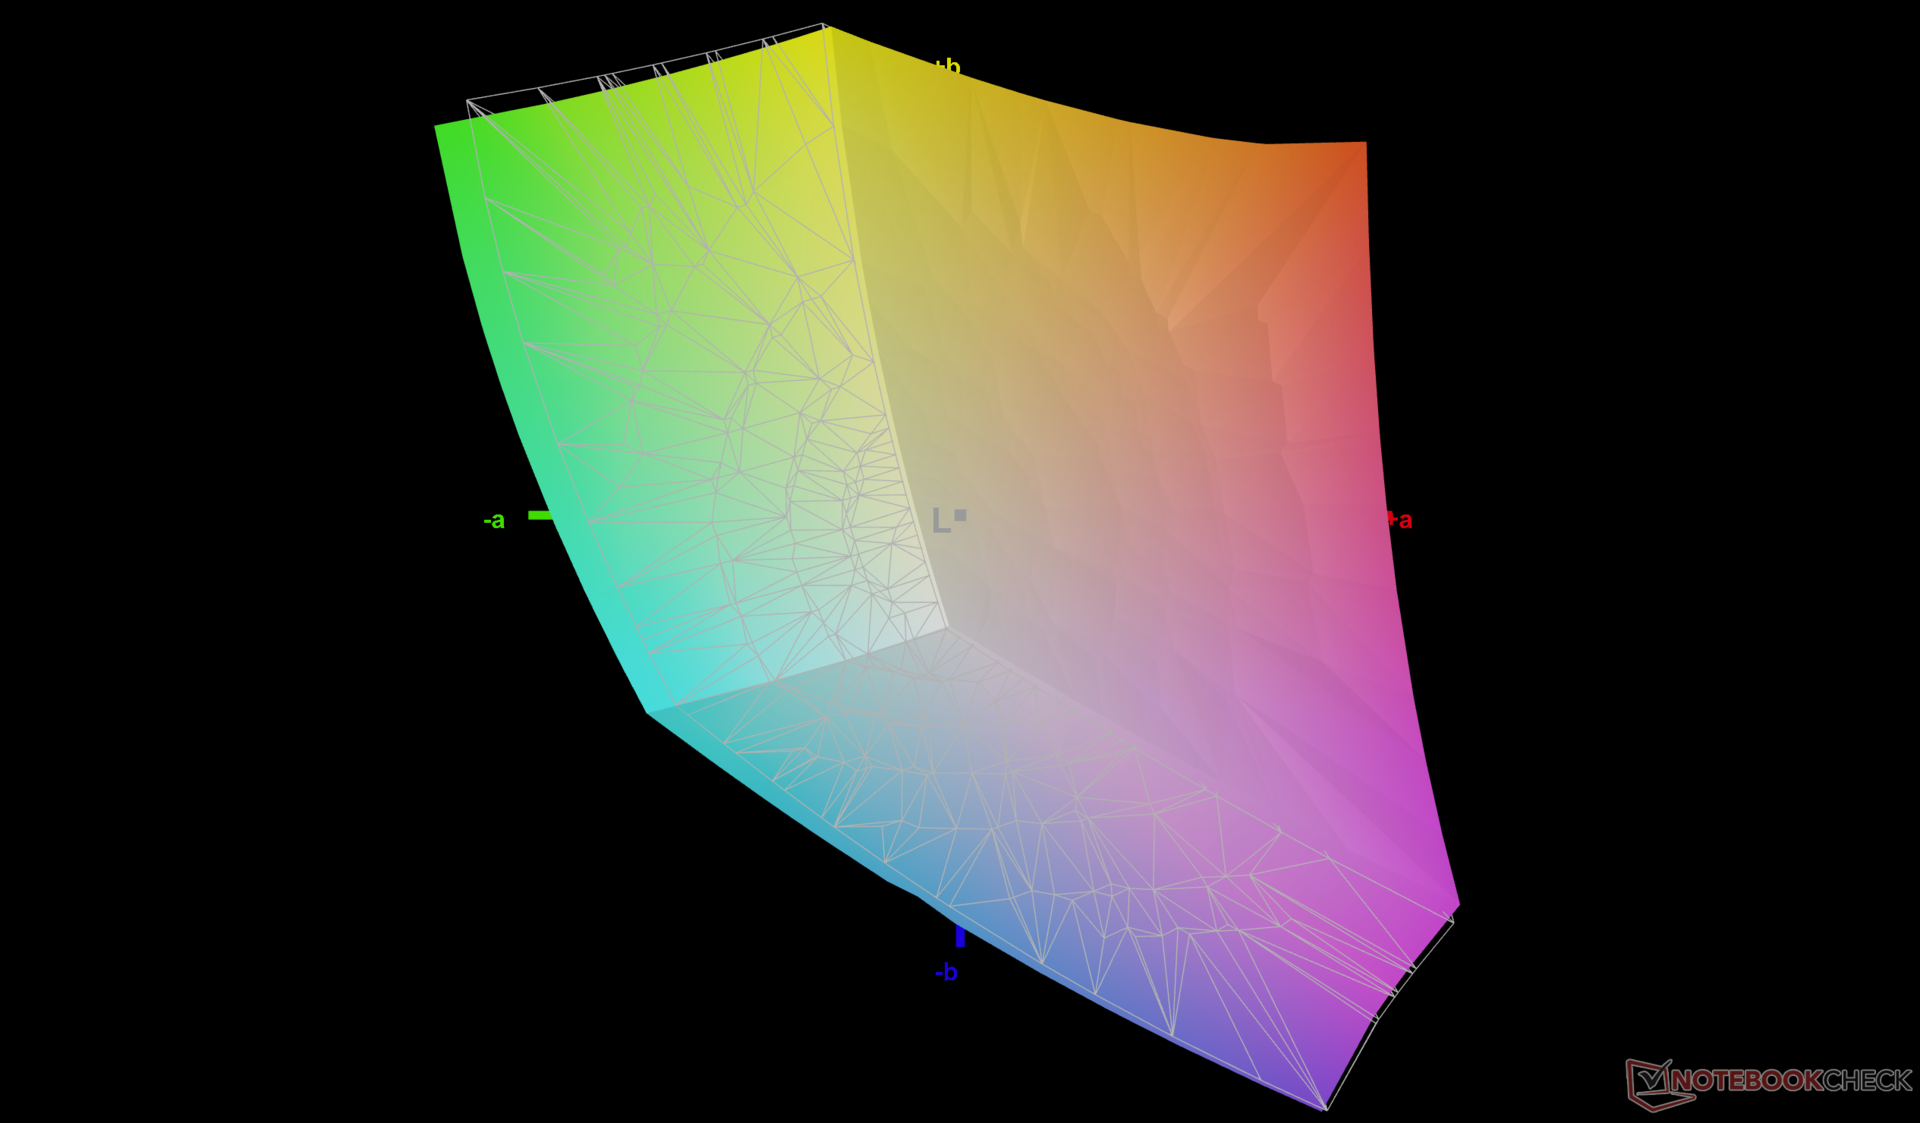
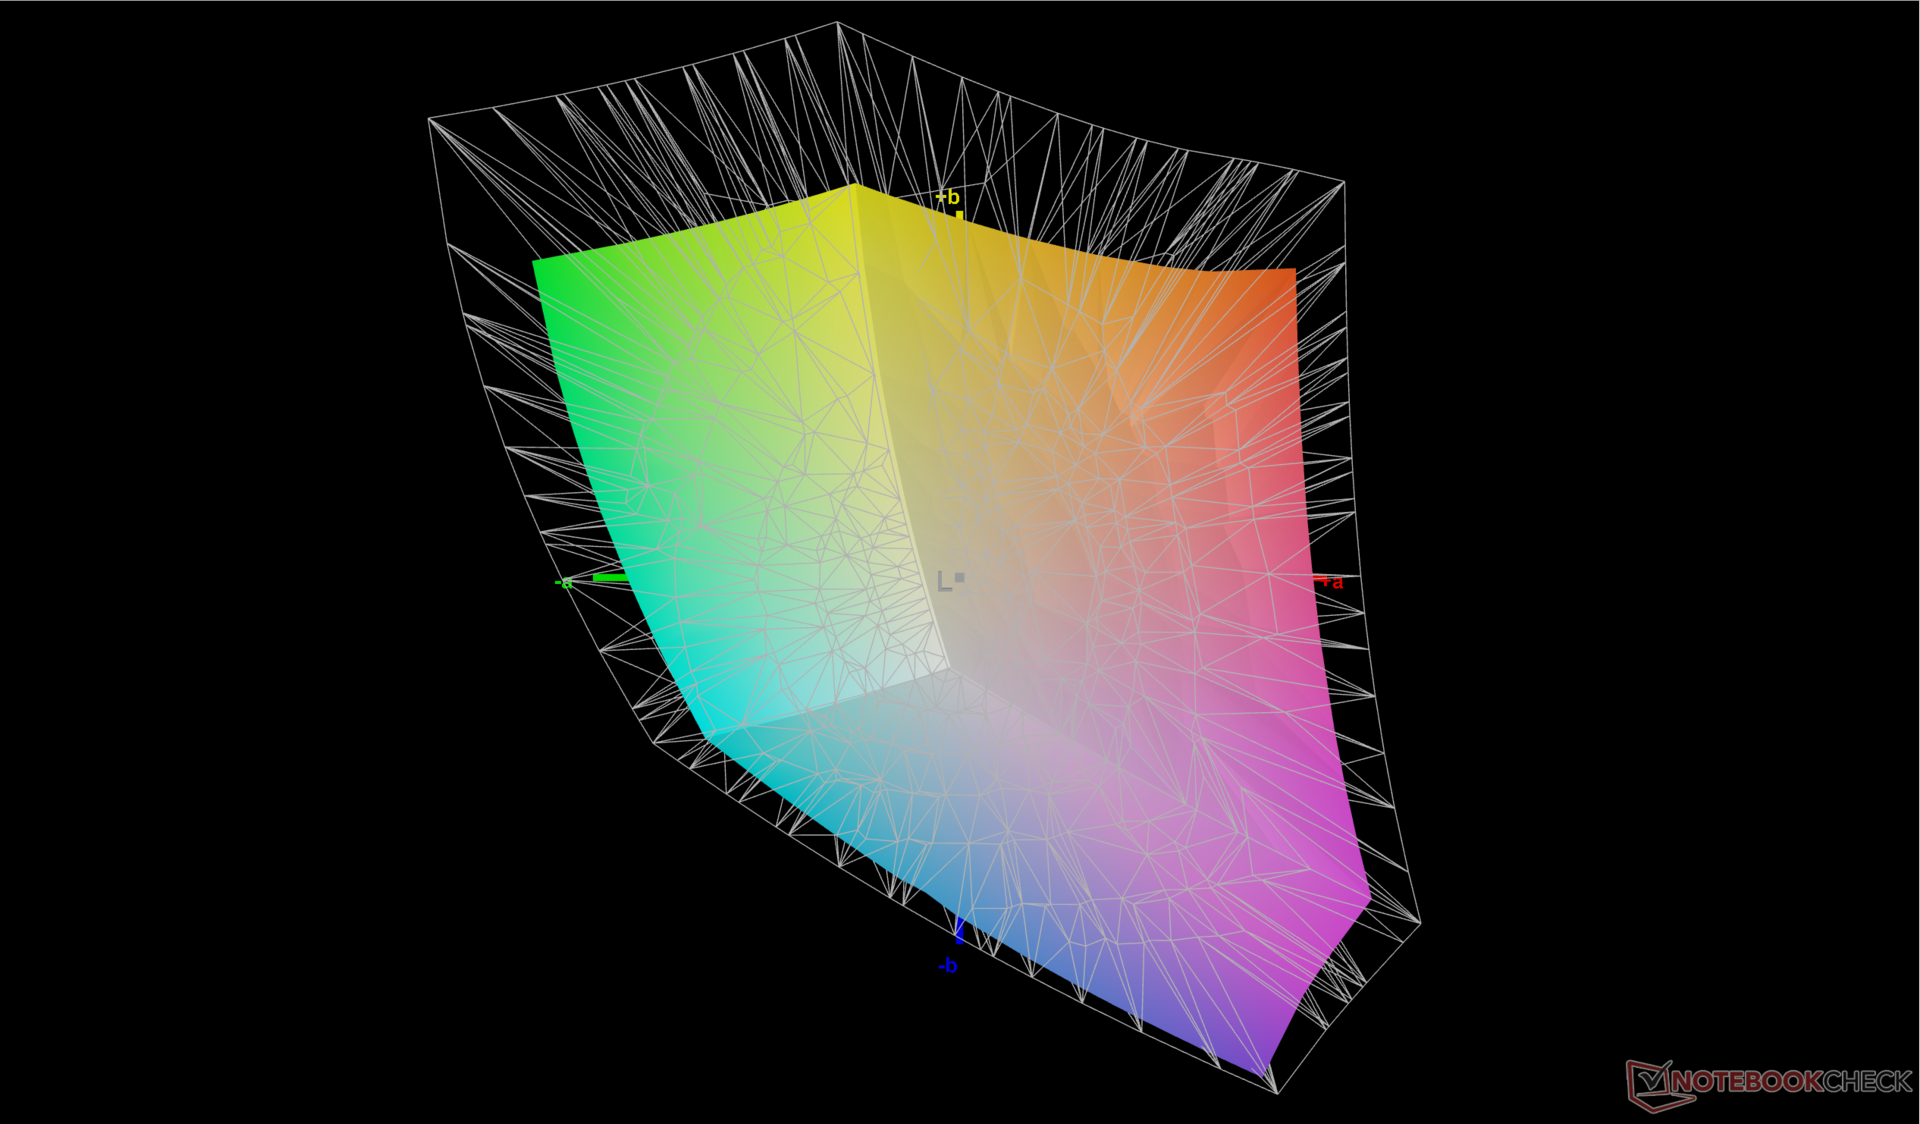
Gebruikers die geïnteresseerd zijn in OLED of bredere AdobeRGB kleuren zullen verder moeten kijken dan de midrange Legion Pro 5 serie.

| |||||||||||||||||||||||||
Helderheidsverdeling: 87 %
Helderheid in Batterij-modus: 405.7 cd/m²
Contrast: 1068:1 (Zwart: 0.38 cd/m²)
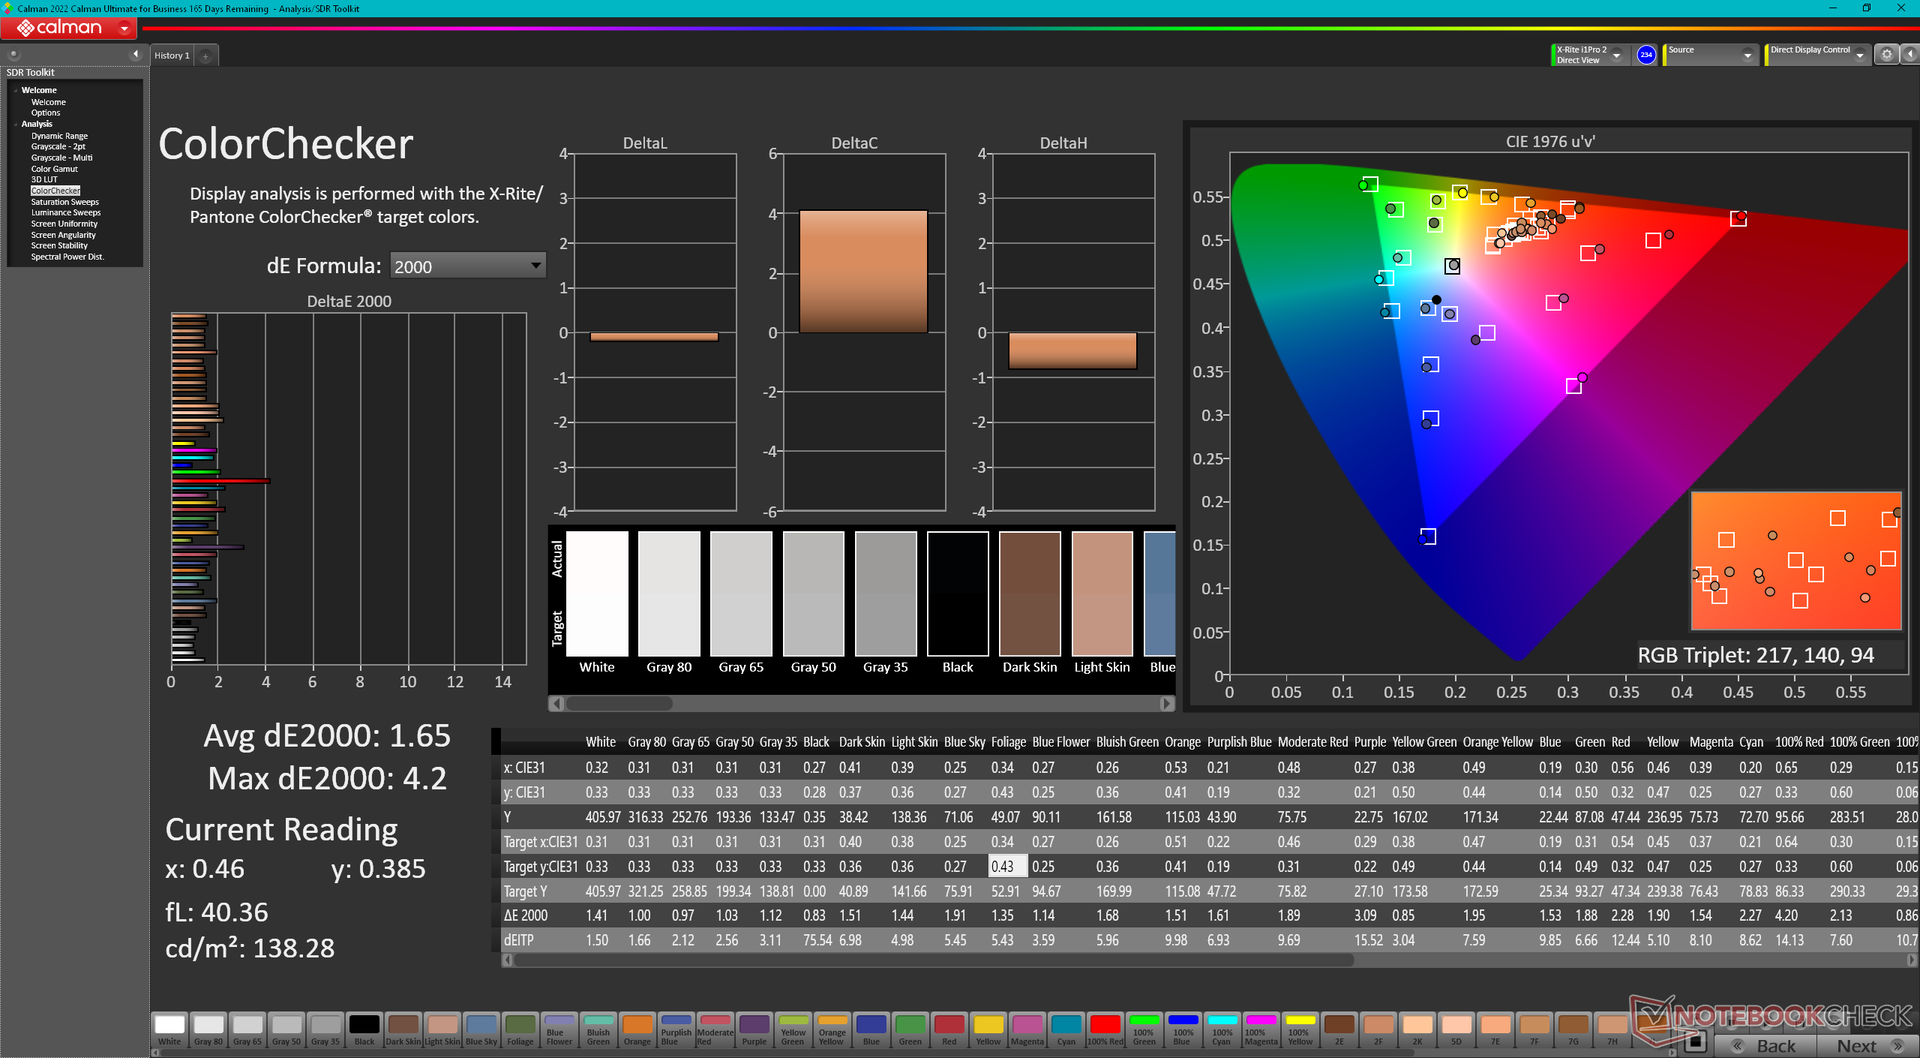
ΔE ColorChecker Calman: 1.65 | ∀{0.5-29.43 Ø4.71}
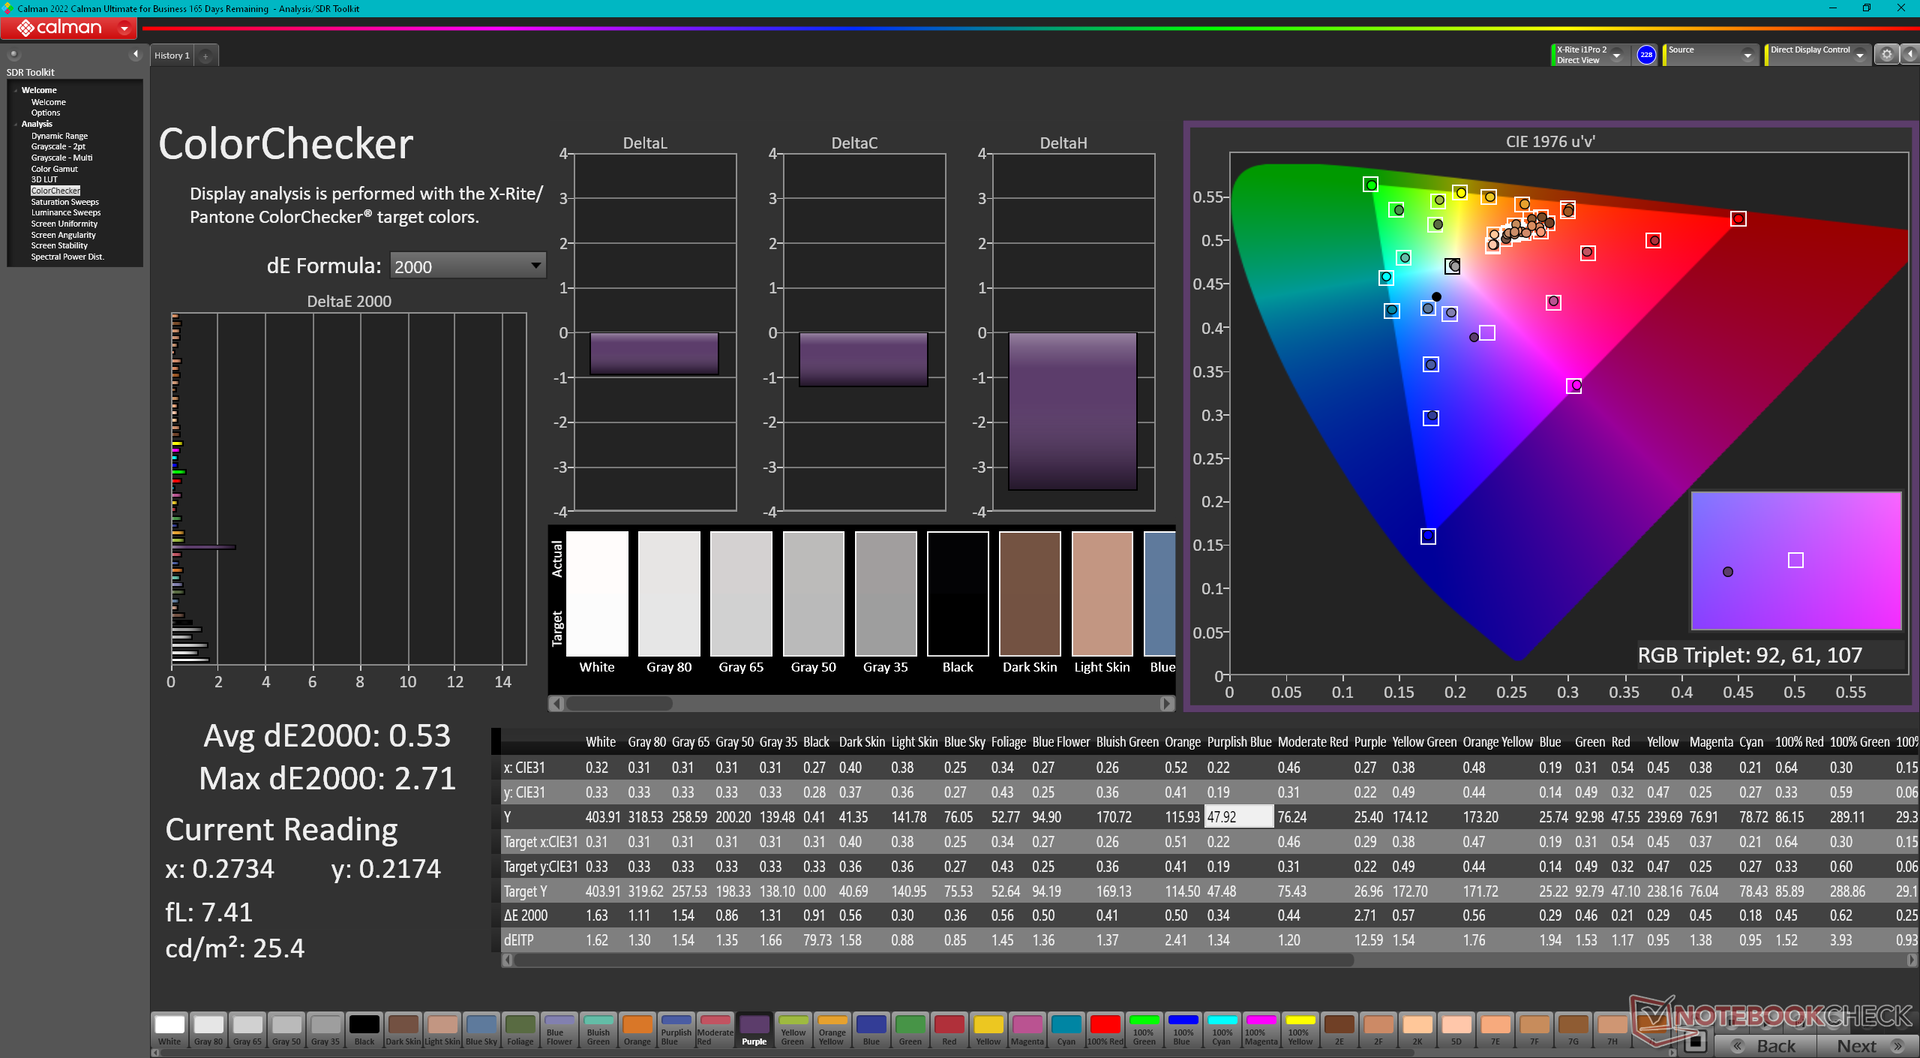
calibrated: 0.53
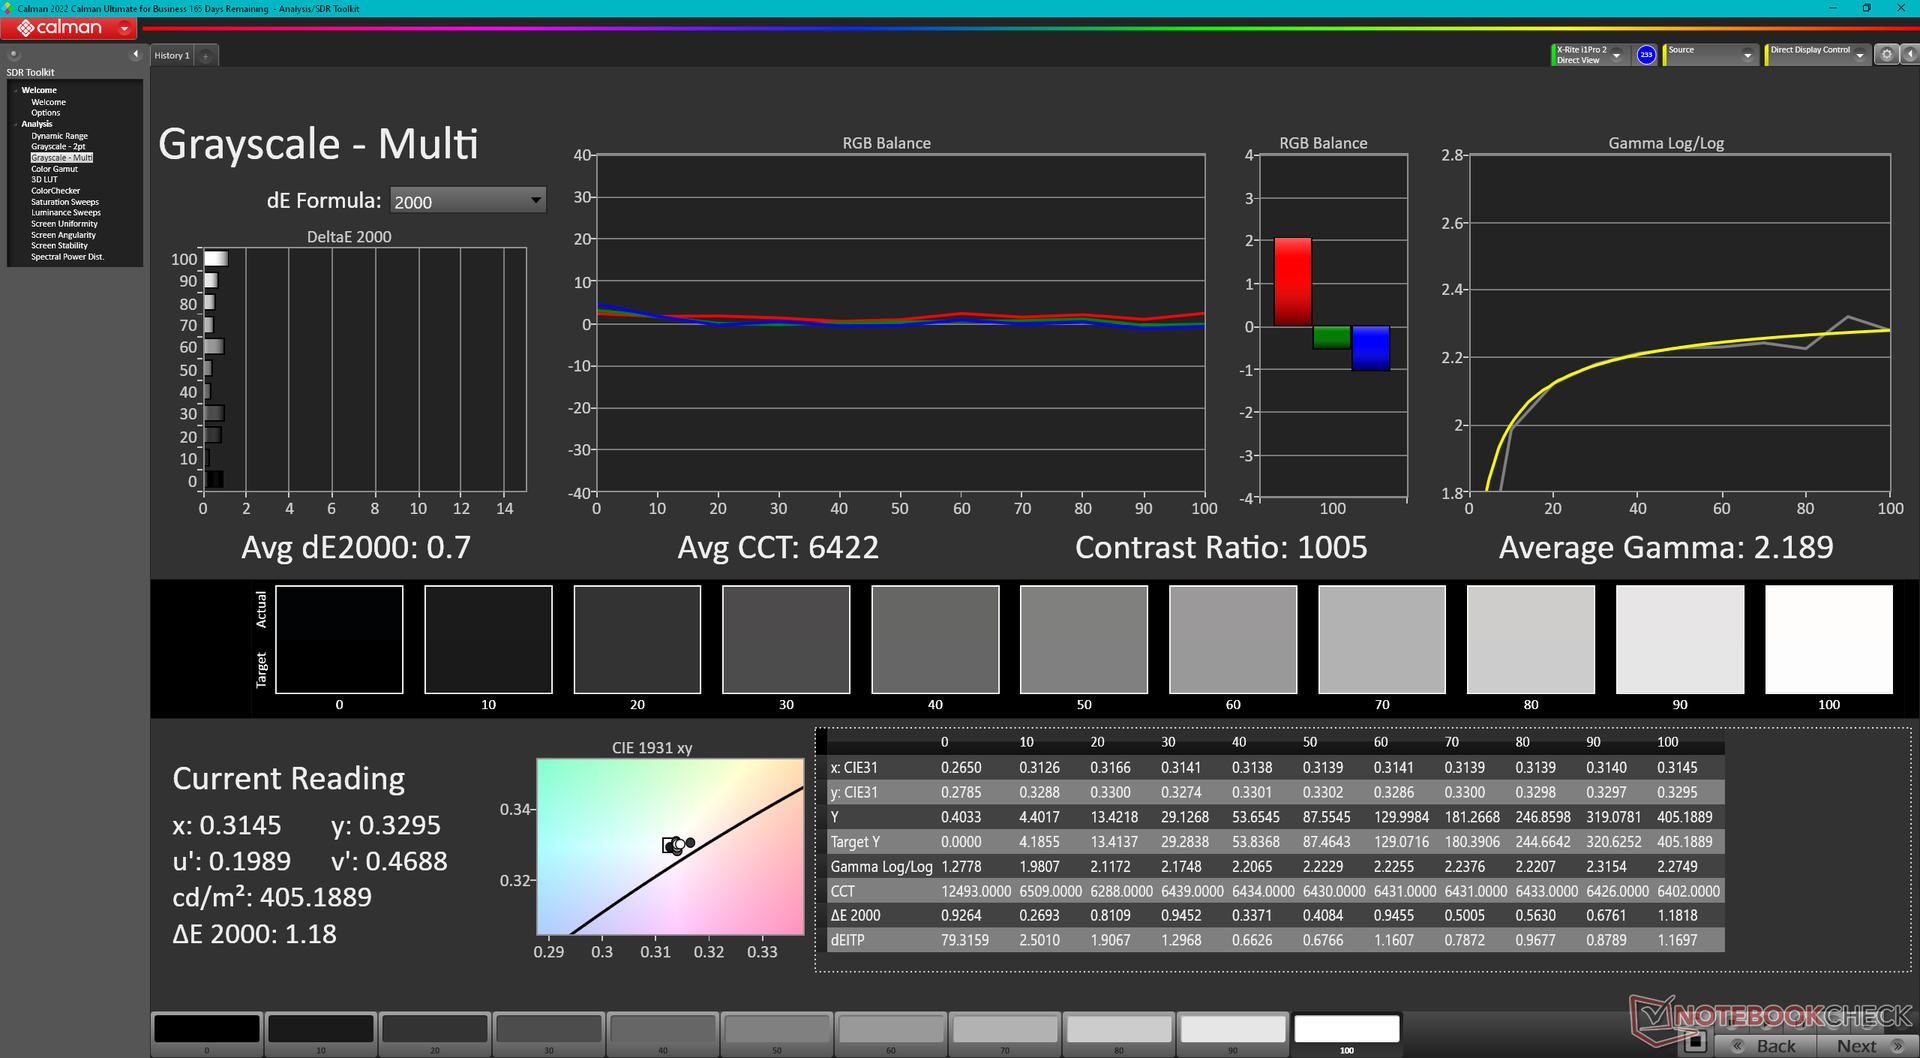
ΔE Greyscale Calman: 1.2 | ∀{0.09-98 Ø4.96}
73.3% AdobeRGB 1998 (Argyll 3D)
98.8% sRGB (Argyll 3D)
71.2% Display P3 (Argyll 3D)
Gamma: 2.3
CCT: 6453 K
| Lenovo Legion Pro 5 16IRX8 AU Optronics B160QAN03.1, IPS, 2560x1600, 16" | Asus ROG Zephyrus M16 GU603Z BOE0A0B (BOE CQ NE160QDM-NY3), IPS, 2560x1600, 16" | Razer Blade 16 Early 2023 CSOT T3 MNG007DA4-1, IPS, 2560x1600, 16" | Lenovo Legion Pro 7 16IRX8H MNG007DA2-3 (CSO1628), IPS, 2560x1600, 16" | Lenovo Legion 5 Pro 16ARH7H RTX 3070 Ti BOE CQ NE160QDM-NY1, IPS, 2560x1600, 16" | Lenovo Legion S7 16ARHA7 BOE CQ NE160QDM-NY1, IPS, 2560x1600, 16" | |
|---|---|---|---|---|---|---|
| Display | 14% | 20% | -2% | -4% | -2% | |
| Display P3 Coverage (%) | 71.2 | 92.8 30% | 98.5 38% | 69.1 -3% | 67.3 -5% | 69.8 -2% |
| sRGB Coverage (%) | 98.8 | 98.5 0% | 100 1% | 99.7 1% | 96.1 -3% | 98.1 -1% |
| AdobeRGB 1998 Coverage (%) | 73.3 | 83.1 13% | 89.7 22% | 71.2 -3% | 69.5 -5% | 71.9 -2% |
| Response Times | 26% | 20% | 29% | -4% | 4% | |
| Response Time Grey 50% / Grey 80% * (ms) | 14.5 ? | 7.6 ? 48% | 6.6 ? 54% | 12.3 ? 15% | 14.4 ? 1% | 10 ? 31% |
| Response Time Black / White * (ms) | 10.4 ? | 10 ? 4% | 12 ? -15% | 5.9 ? 43% | 11.2 ? -8% | 12.8 ? -23% |
| PWM Frequency (Hz) | ||||||
| Screen | -62% | -29% | 15% | -22% | -8% | |
| Brightness middle (cd/m²) | 405.7 | 497 23% | 456.8 13% | 511 26% | 522.8 29% | 492.4 21% |
| Brightness (cd/m²) | 368 | 481 31% | 437 19% | 469 27% | 503 37% | 471 28% |
| Brightness Distribution (%) | 87 | 82 -6% | 83 -5% | 86 -1% | 84 -3% | 90 3% |
| Black Level * (cd/m²) | 0.38 | 0.21 45% | 0.35 8% | 0.4 -5% | 0.41 -8% | 0.4 -5% |
| Contrast (:1) | 1068 | 2367 122% | 1305 22% | 1278 20% | 1275 19% | 1231 15% |
| Colorchecker dE 2000 * | 1.65 | 3.53 -114% | 3.7 -124% | 0.95 42% | 2.47 -50% | 1.9 -15% |
| Colorchecker dE 2000 max. * | 4.2 | 6.15 -46% | 6.42 -53% | 2.07 51% | 6.56 -56% | 3.81 9% |
| Colorchecker dE 2000 calibrated * | 0.53 | 3.53 -566% | 0.66 -25% | 0.91 -72% | 0.61 -15% | 0.99 -87% |
| Greyscale dE 2000 * | 1.2 | 1.74 -45% | 2.6 -117% | 0.6 50% | 3 -150% | 1.7 -42% |
| Gamma | 2.3 96% | 2.2 100% | 2.3 96% | 2.176 101% | 2.27 97% | 2.36 93% |
| CCT | 6453 101% | 6418 101% | 6108 106% | 6545 99% | 6719 97% | 6497 100% |
| Totaal Gemiddelde (Programma / Instellingen) | -7% /
-33% | 4% /
-12% | 14% /
14% | -10% /
-16% | -2% /
-5% |
* ... kleiner is beter
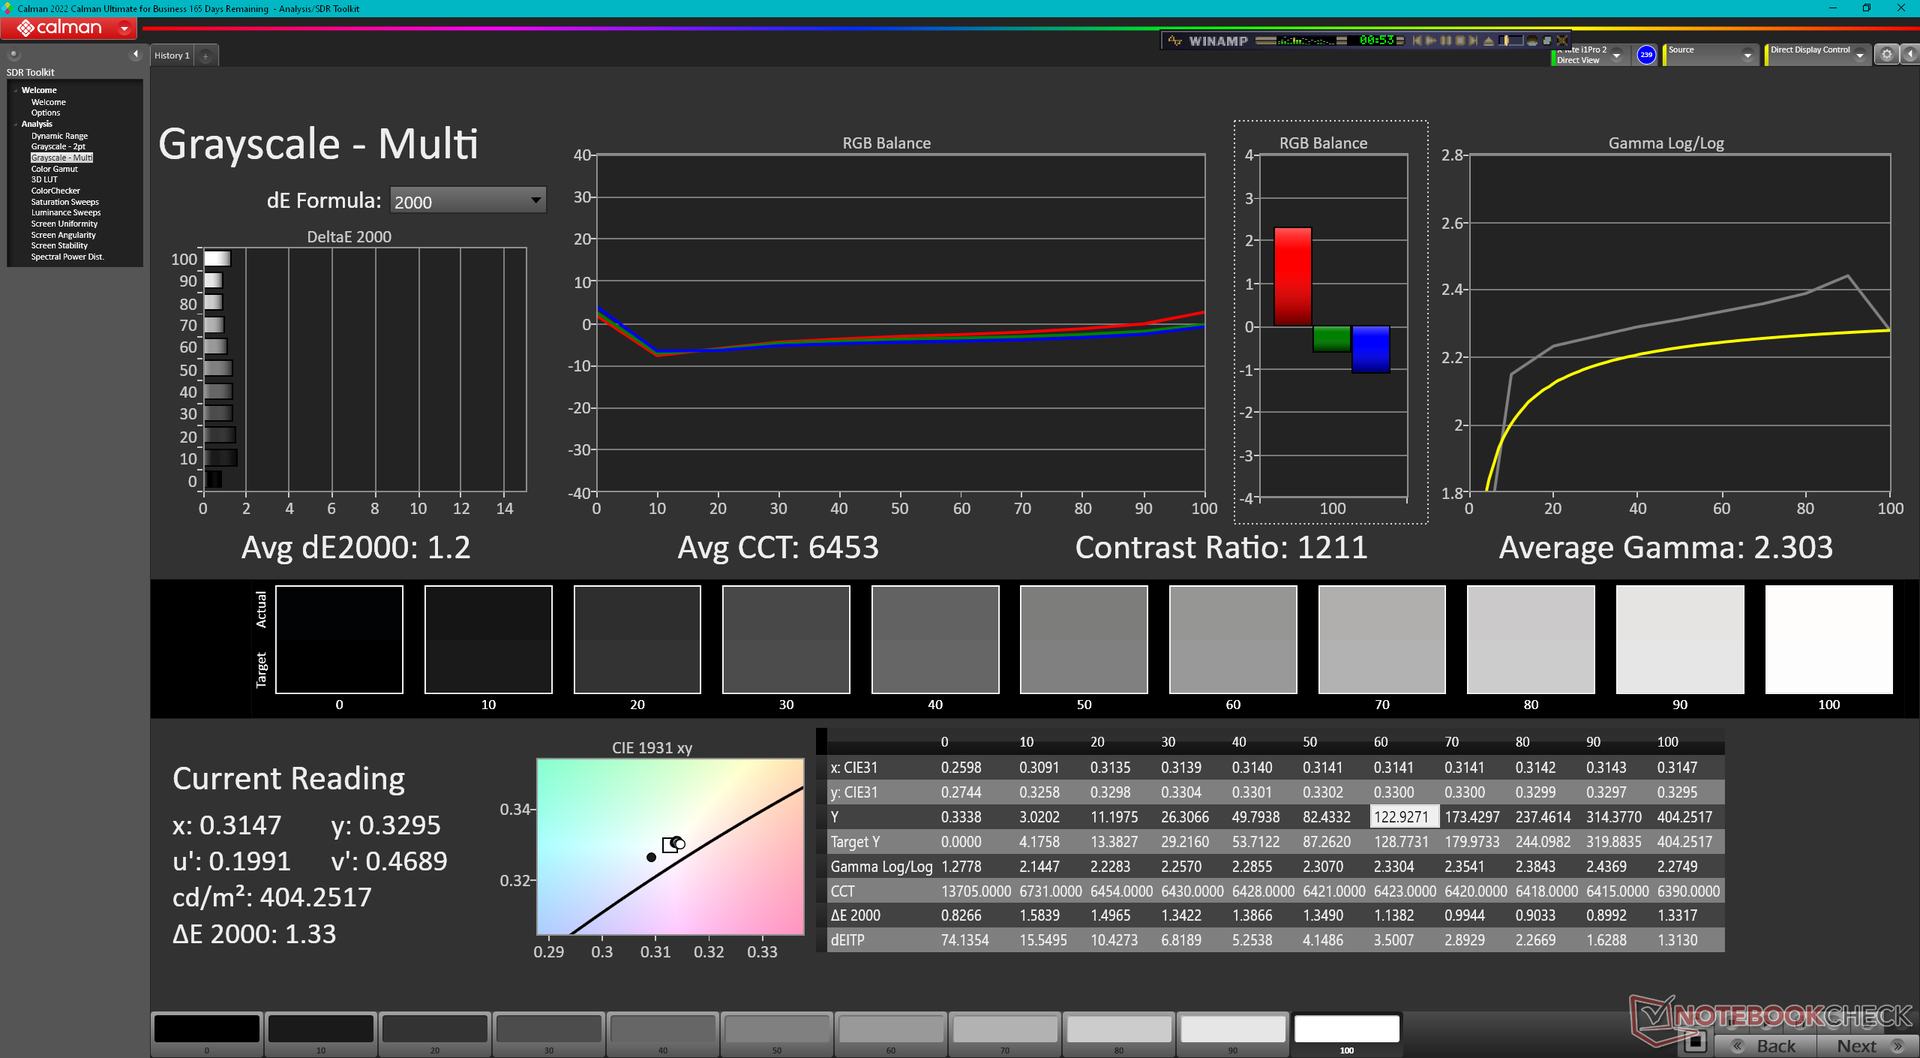
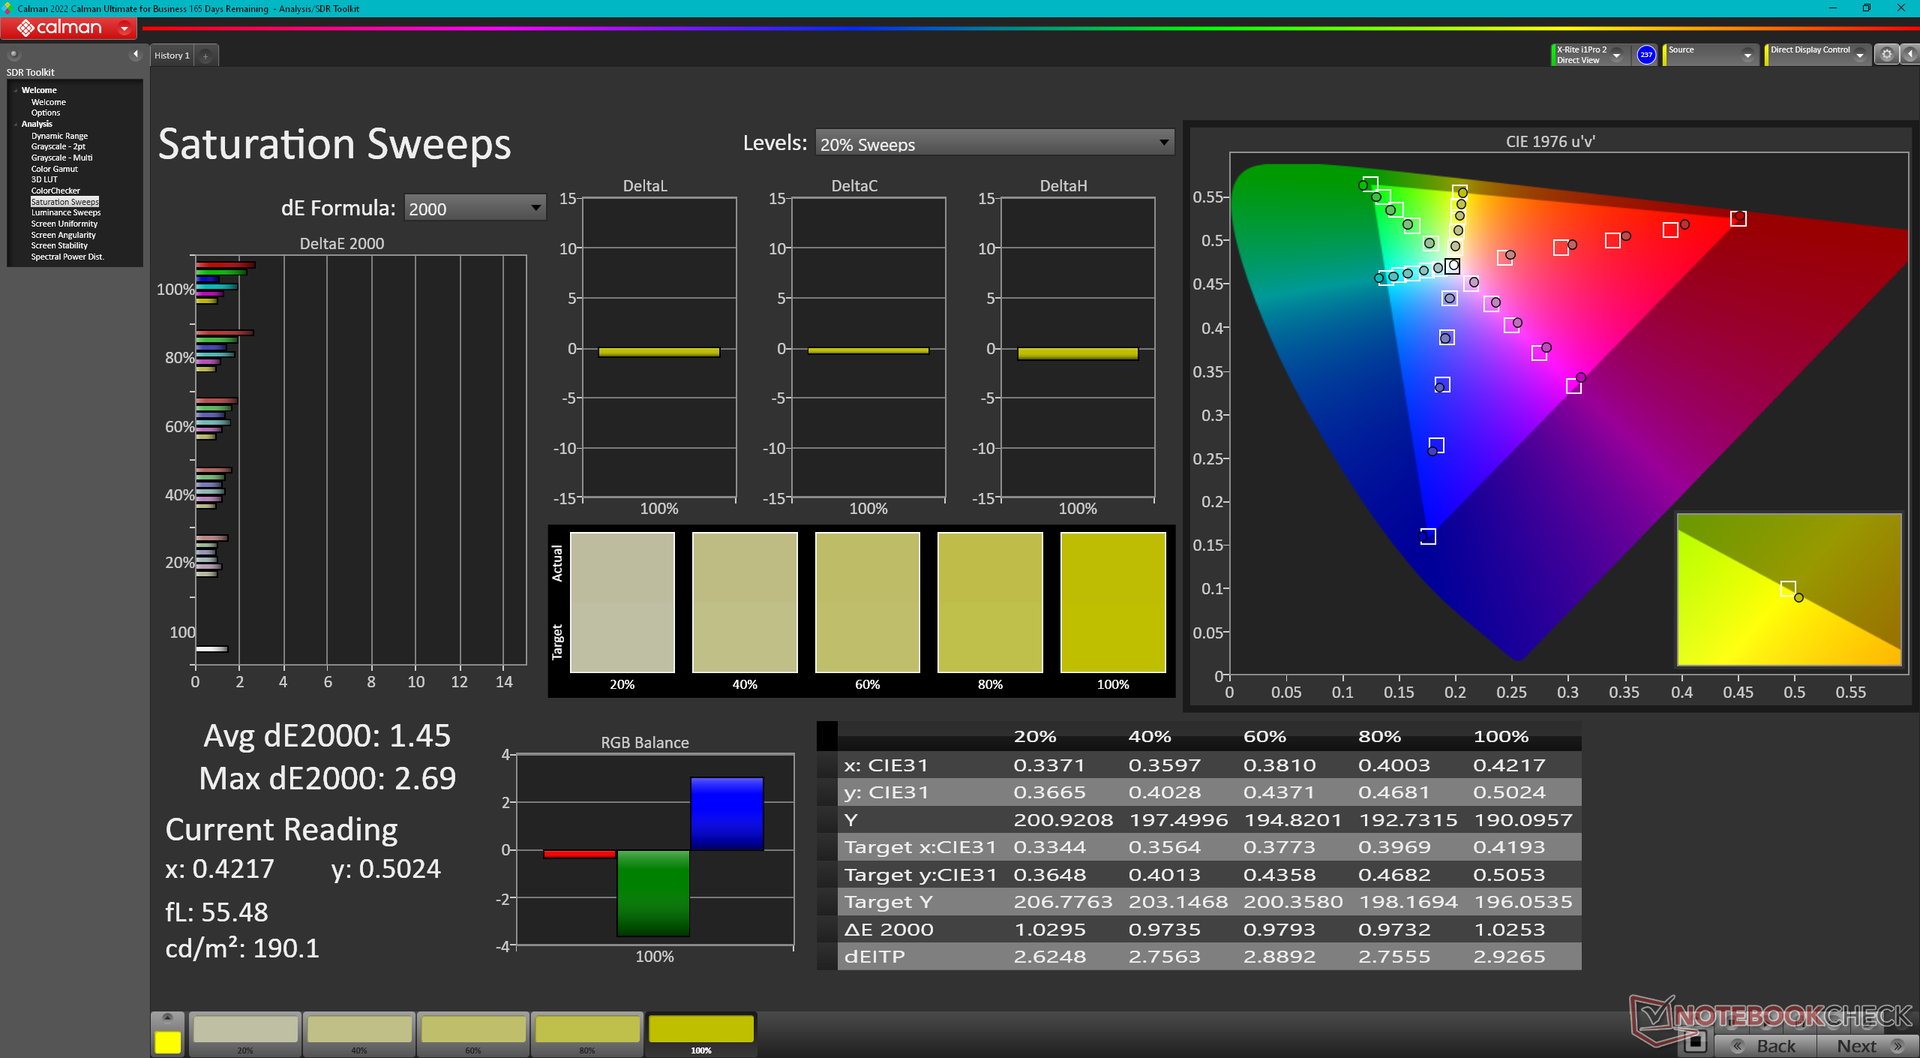
Het display komt goed gekalibreerd uit de doos met gemiddelde grijswaarden- en kleurendeltaE-waarden van respectievelijk slechts 1,2 en 1,65. Dergelijke waarden zijn laag genoeg om een kalibratie door de eindgebruiker niet nodig te maken. Door het paneel toch te kalibreren zou de kleurnauwkeurigheid nog verder verbeteren tot <1, zoals blijkt uit de onderstaande schermafbeeldingen. Van alle geteste kleuren lijkt paars met een deltaE van 2,71 het minst nauwkeurig te worden weergegeven.

Responstijd Scherm
| ↔ Responstijd Zwart naar Wit | ||
|---|---|---|
| 10.4 ms ... stijging ↗ en daling ↘ gecombineerd | ↗ 5.7 ms stijging | 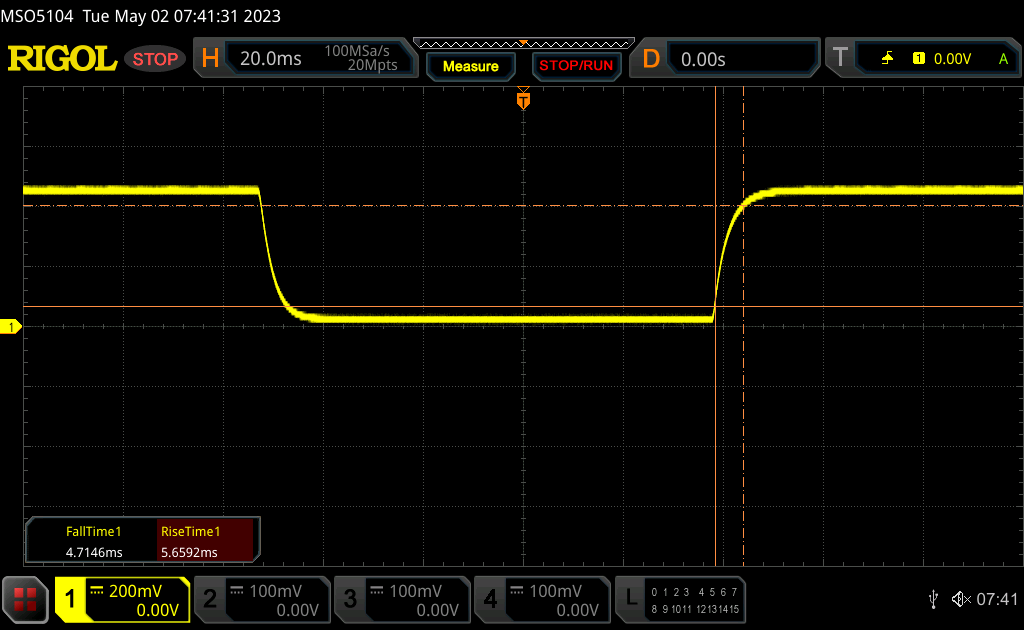 |
| ↘ 4.7 ms daling | ||
| Het scherm vertoonde prima responstijden in onze tests maar is misschien wat te traag voor competitieve games. Ter vergelijking: alle testtoestellen variëren van 0.1 (minimum) tot 240 (maximum) ms. » 28 % van alle toestellen zijn beter. Dit betekent dat de gemeten responstijd beter is dan het gemiddelde (19.8 ms) van alle geteste toestellen. | ||
| ↔ Responstijd 50% Grijs naar 80% Grijs | ||
| 14.5 ms ... stijging ↗ en daling ↘ gecombineerd | ↗ 7 ms stijging | 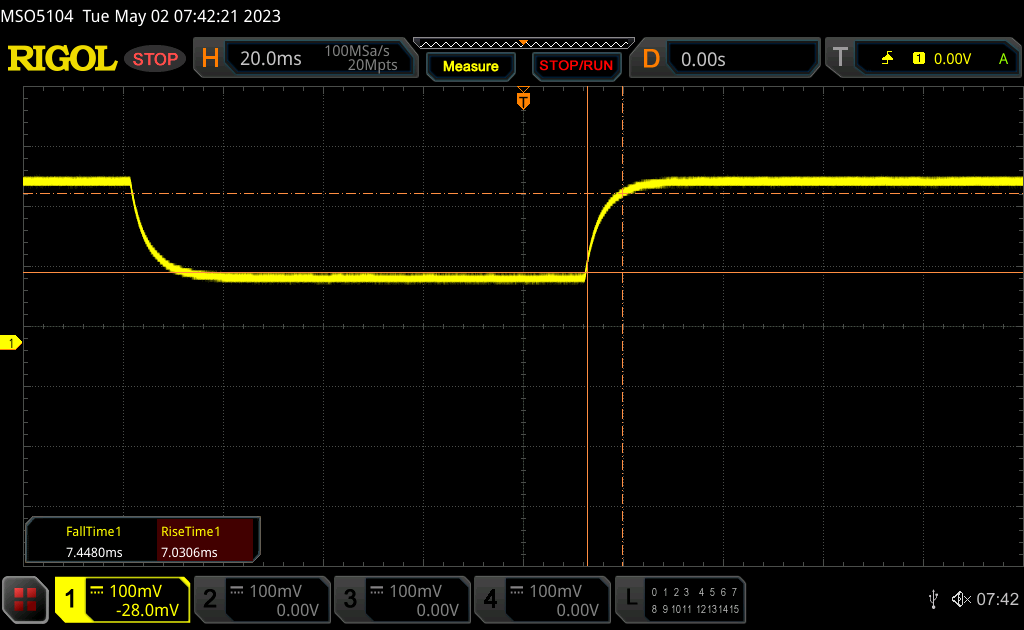 |
| ↘ 7.5 ms daling | ||
| Het scherm vertoonde prima responstijden in onze tests maar is misschien wat te traag voor competitieve games. Ter vergelijking: alle testtoestellen variëren van 0.165 (minimum) tot 636 (maximum) ms. » 29 % van alle toestellen zijn beter. Dit betekent dat de gemeten responstijd beter is dan het gemiddelde (31 ms) van alle geteste toestellen. | ||
Screen Flickering / PWM (Pulse-Width Modulation)
| Screen flickering / PWM niet waargenomen | 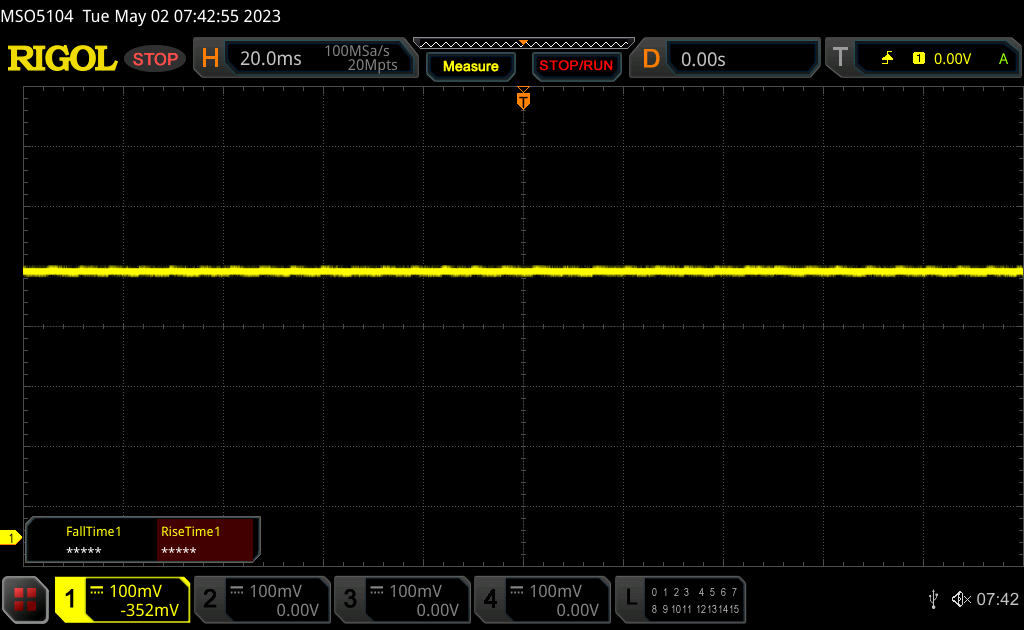 | ||
Ter vergelijking: 52 % van alle geteste toestellen maakten geen gebruik van PWM om de schermhelderheid te verlagen. Als het wel werd gebruikt, werd een gemiddelde van 7757 (minimum: 5 - maximum: 343500) Hz waargenomen. | |||
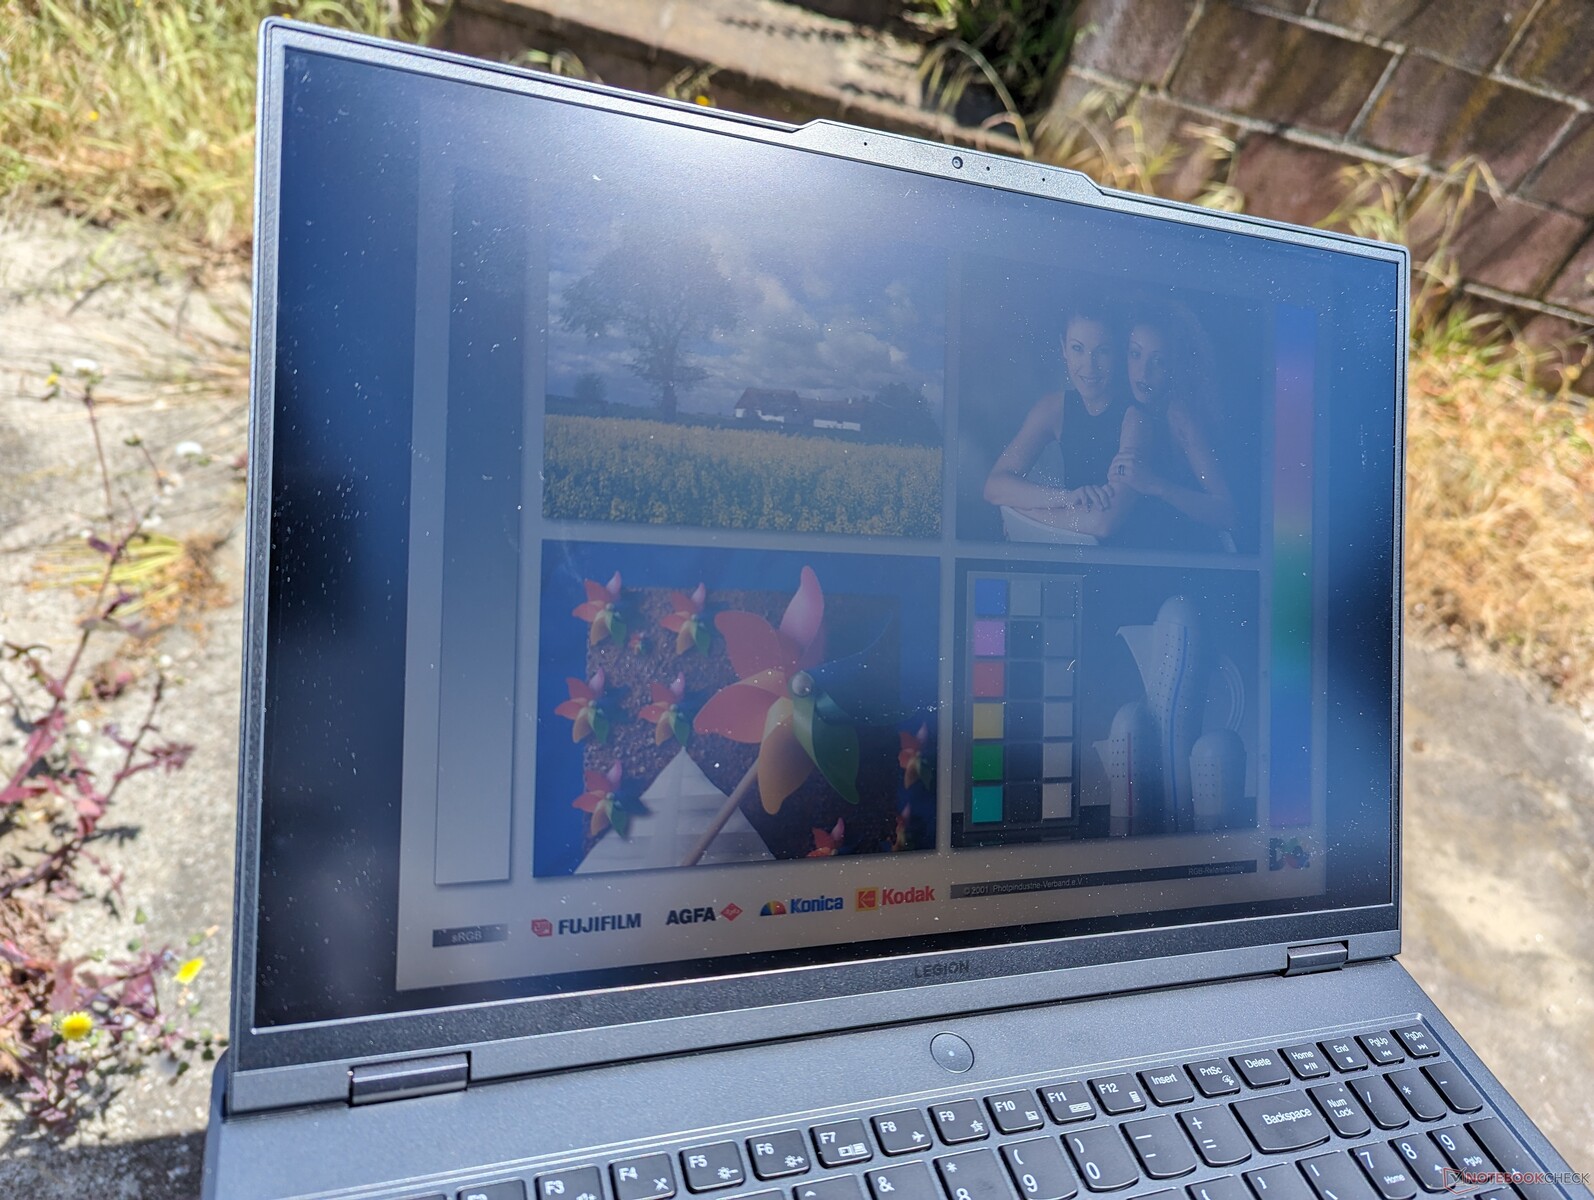
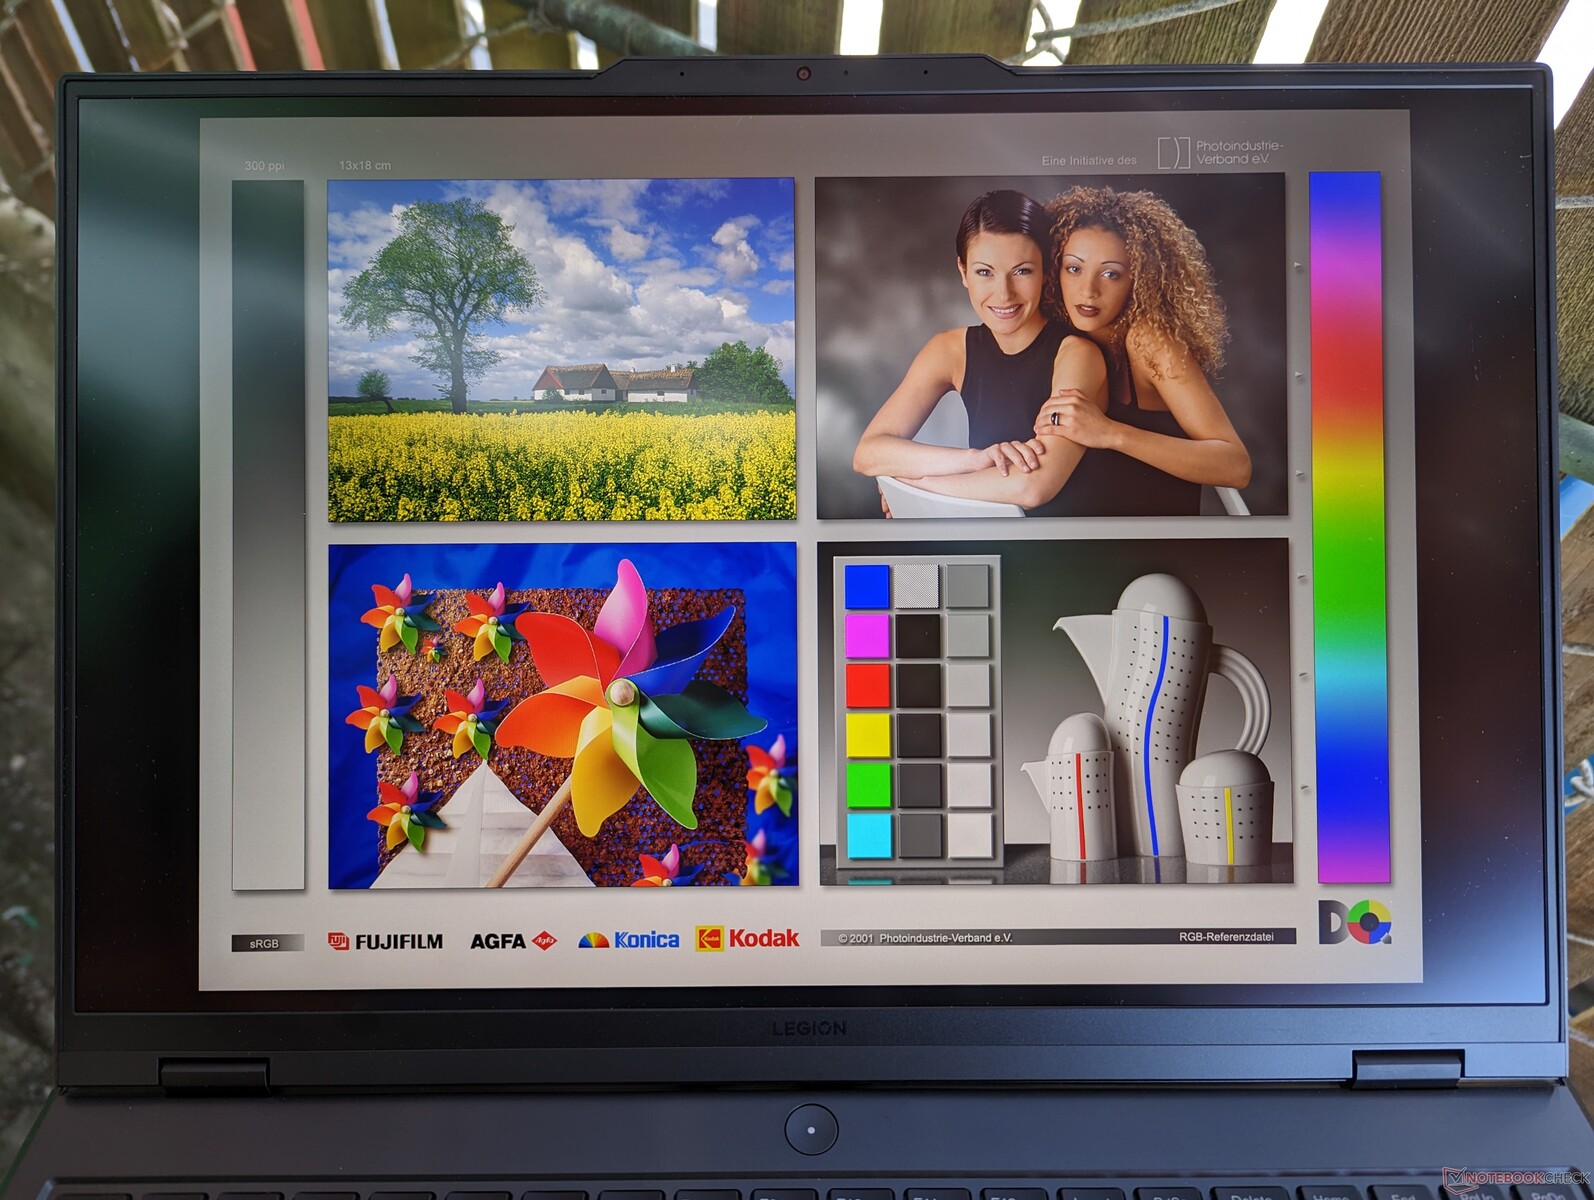
Met 400 nits is het scherm over het algemeen bruikbaar in de schaduw. De 240 Hz paneel optie is iets helderder als buiten zicht een zorg is. De schermen op de meeste 16-inch gaming machines zijn al helderder dan op veel midrange Ultrabooks waar 300 nits gebruikelijk is.
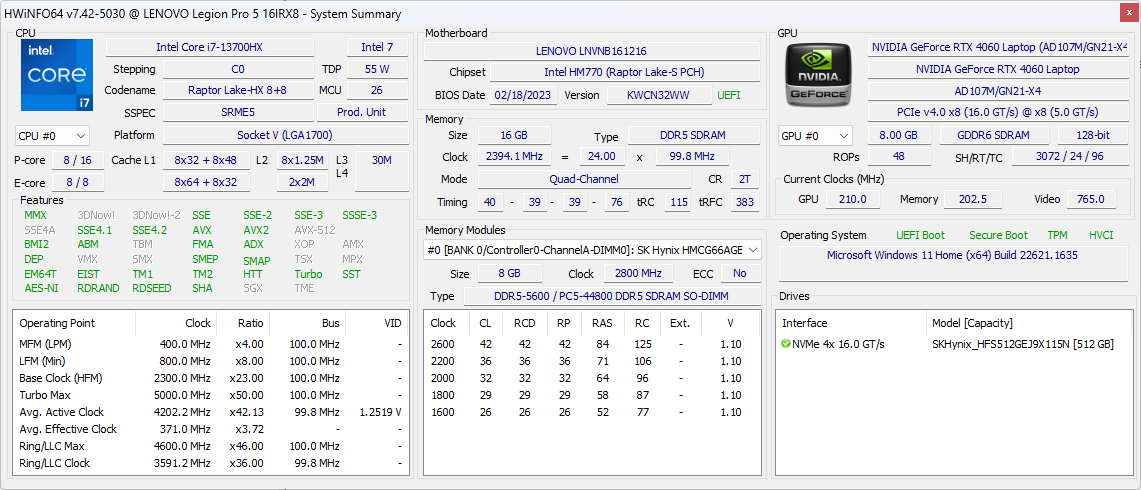
Prestaties - 13e generatie Raptor Lake
Testomstandigheden
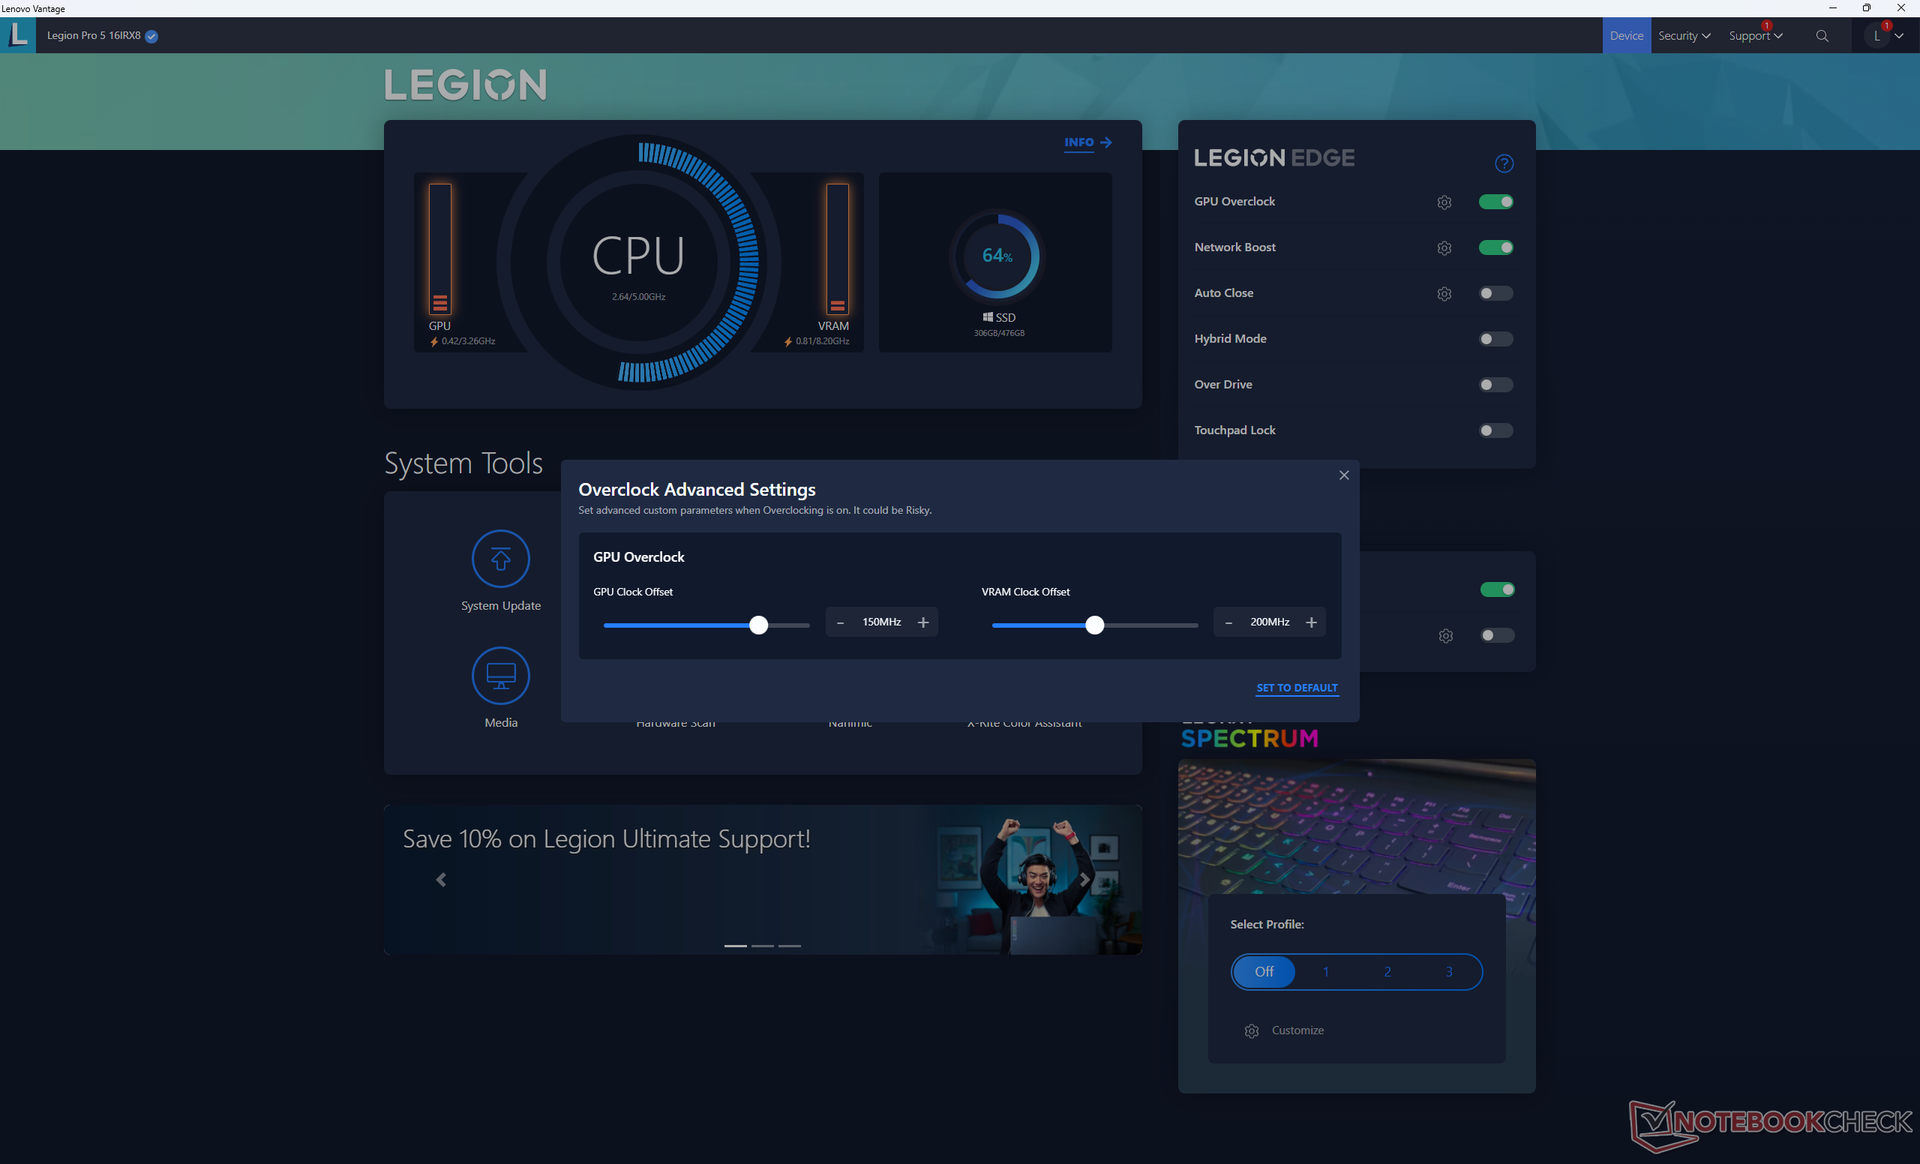
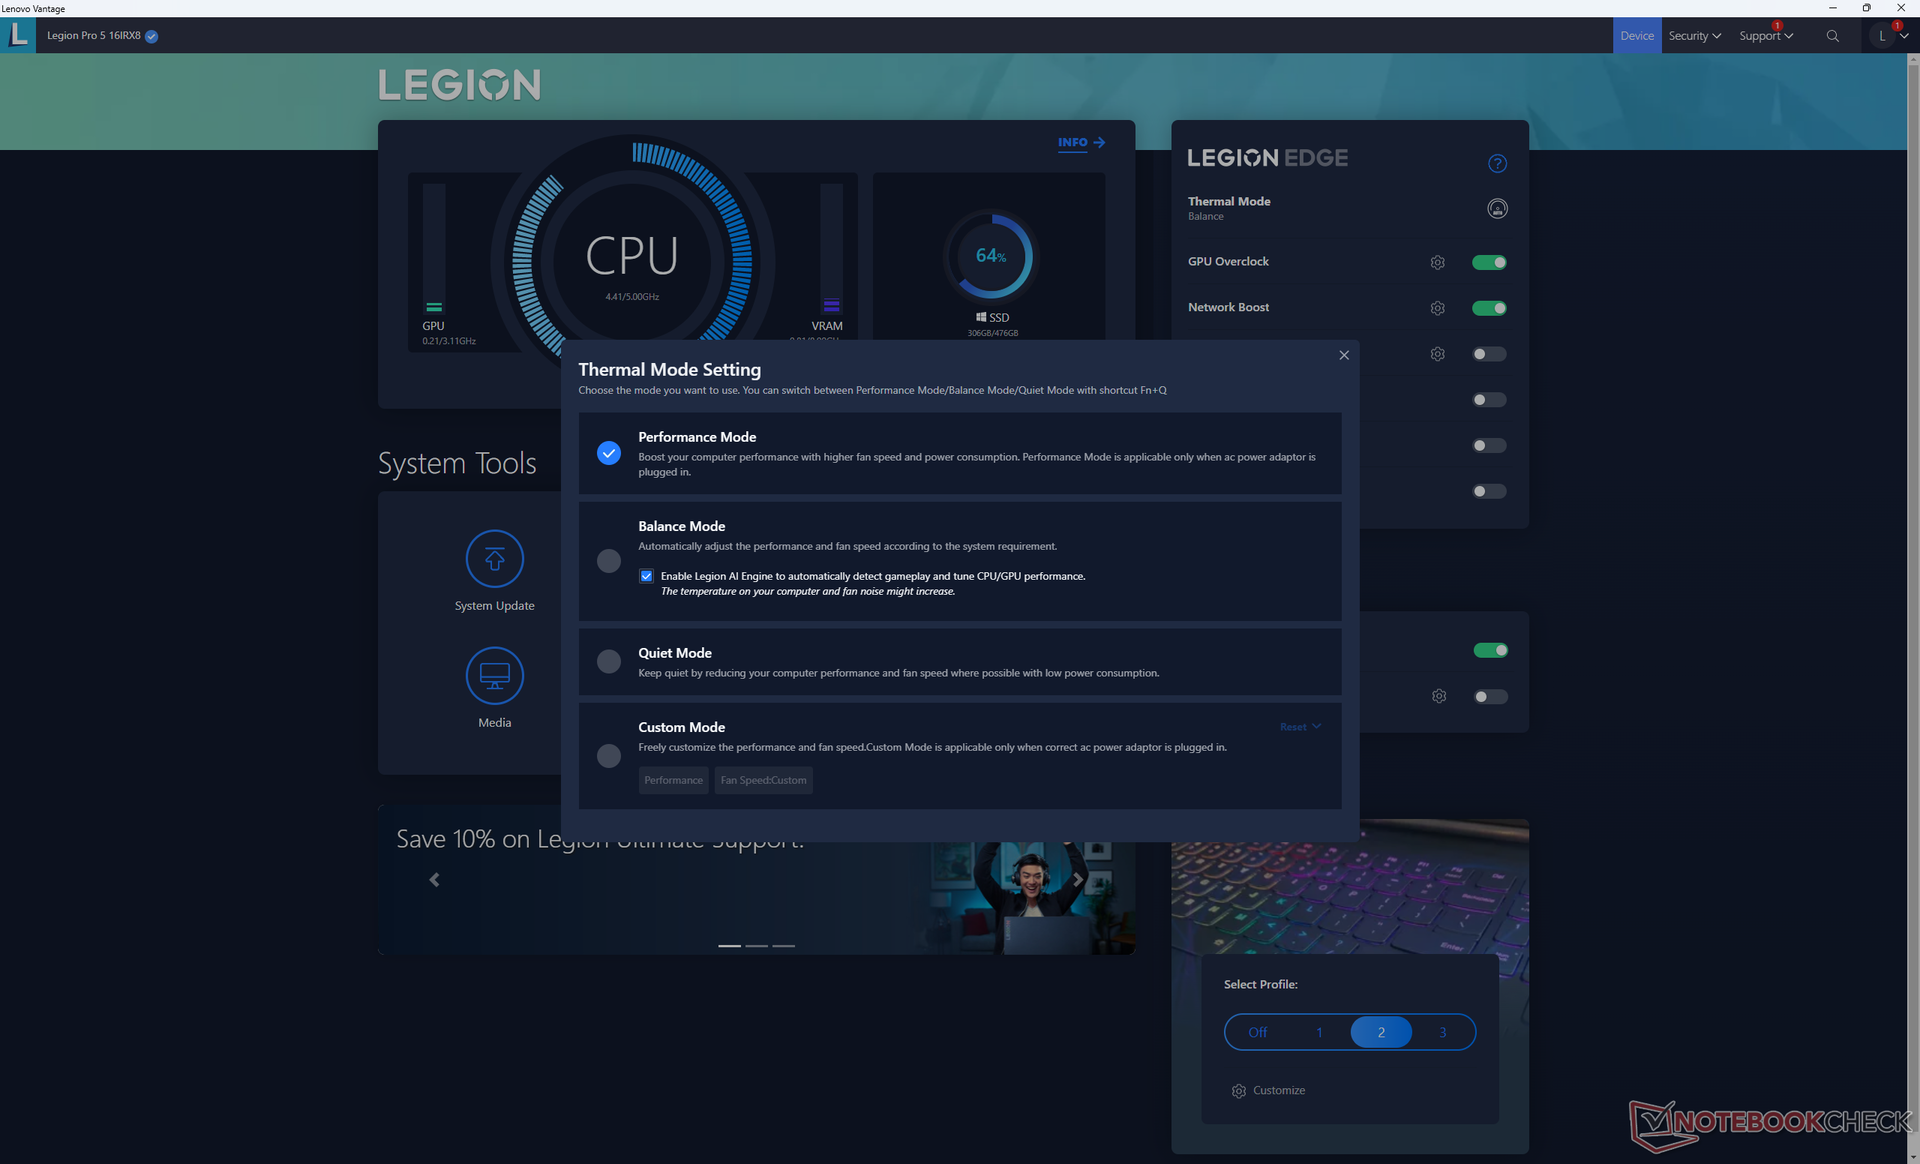
We hebben onze testunit ingesteld op de Performance-modus met GPU Overclock actief en Hybrid-modus uitgeschakeld voordat we de onderstaande benchmarks uitvoerden. Al deze instellingen zijn gelukkig gemakkelijk toegankelijk via het startscherm van de Lenovo Vantage.
Merk op dat terwijl MUX wordt ondersteund voor het schakelen tussen Optimus en discrete GPU-modus alleen, een systeem reboot altijd nodig zou zijn. Advanced Optimus wordt daarom niet ondersteund. G-Sync voor het interne beeldscherm werkt alleen in de dGPU-modus.
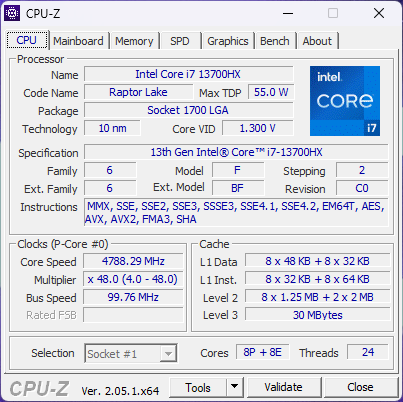
Processor
Onze Core i7-13700HX is slechts ongeveer 5 tot 15 procent sneller in multi-threaded belastingen dan de oudere Core i7-12700H die hij vervangt. De voordelen zijn meetbaar, zij het relatief klein. De algemene prestaties zijn vergelijkbaar met de Core i9-12900H.
De duurzaamheid van de prestaties is uitstekend, zonder noemenswaardige dips in de tijd bij het draaien van CineBench R15 xT in een loop.
Een upgrade naar de Core i9-13900HX SKU zal naar verwachting de multi-thread prestaties aanzienlijk verhogen met 50 tot 70 procent ten opzichte van de Core i7-13700HX. Als u waarde hecht aan processorprestaties, dan kan het de moeite waard zijn om de Core i5-13500H en Core i7-13700HX opties over te slaan voor de Core i9.
Cinebench R15 Multi Loop
Cinebench R23: Multi Core | Single Core
Cinebench R20: CPU (Multi Core) | CPU (Single Core)
Cinebench R15: CPU Multi 64Bit | CPU Single 64Bit
Blender: v2.79 BMW27 CPU
7-Zip 18.03: 7z b 4 | 7z b 4 -mmt1
Geekbench 5.5: Multi-Core | Single-Core
HWBOT x265 Benchmark v2.2: 4k Preset
LibreOffice : 20 Documents To PDF
R Benchmark 2.5: Overall mean
* ... kleiner is beter
AIDA64: FP32 Ray-Trace | FPU Julia | CPU SHA3 | CPU Queen | FPU SinJulia | FPU Mandel | CPU AES | CPU ZLib | FP64 Ray-Trace | CPU PhotoWorxx
| Performance rating | |
| Lenovo Legion Pro 7 16IRX8H | |
| Razer Blade 16 Early 2023 | |
| Lenovo Legion Pro 5 16IRX8 | |
| Gemiddeld Intel Core i7-13700HX | |
| Lenovo Legion 5 Pro 16ARH7H RTX 3070 Ti | |
| Lenovo Legion S7 16ARHA7 | |
| Asus ROG Zephyrus M16 GU603Z | |
Systeemprestaties
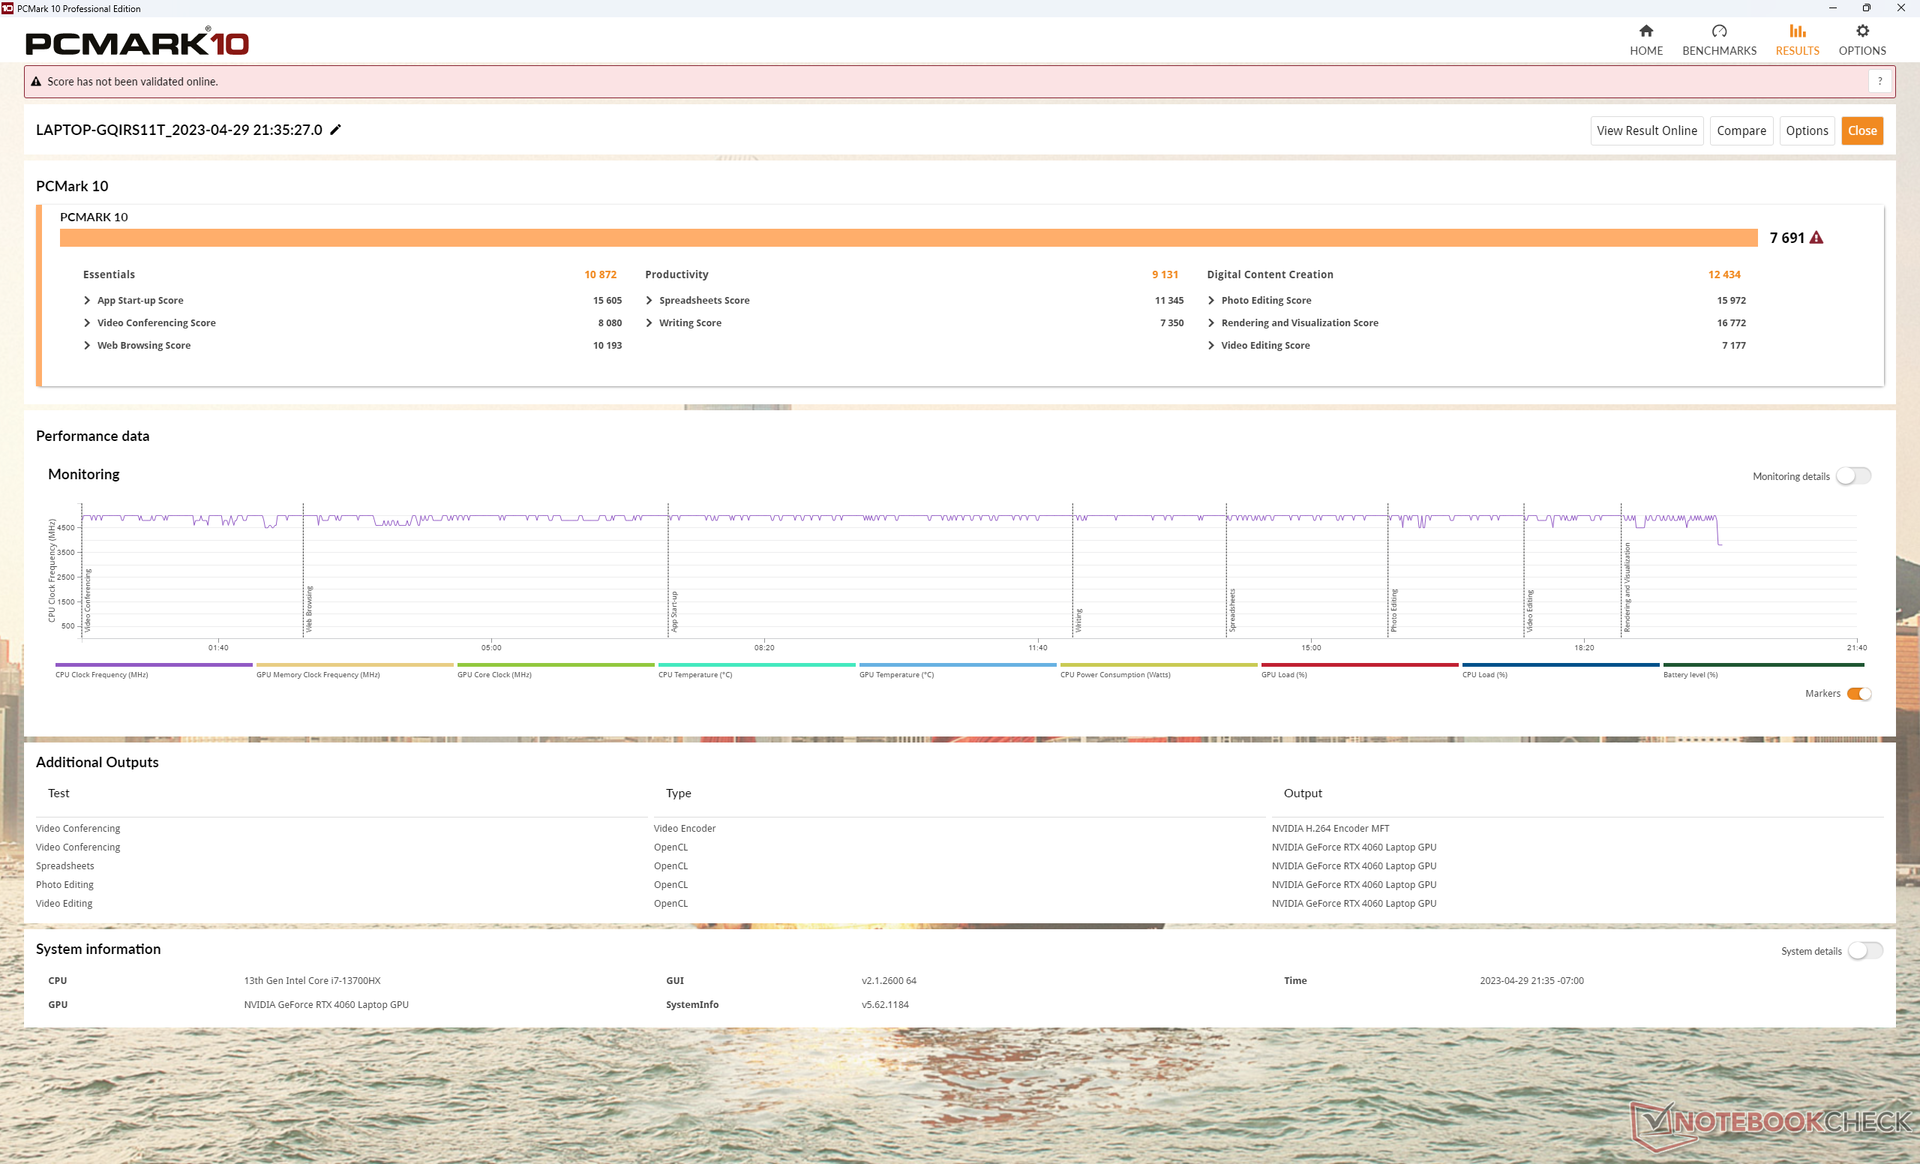
PCMark resultaten zijn vergelijkbaar met andere Legion modellen zoals de 2022 Legion 5 Pro 16, ondanks de nieuwere generatie processoren in onze 2023 unit. Dit suggereert dat hoewel de CPU en GPU deze keer sneller zijn, ze niet noodzakelijkerwijs dagelijkse toepassingen zoals kantoorwerk of browsers merkbaar sneller zullen uitvoeren dan een gaming laptop van vroeger.
CrossMark: Overall | Productivity | Creativity | Responsiveness
| PCMark 10 / Score | |
| Razer Blade 16 Early 2023 | |
| Asus ROG Zephyrus M16 GU603Z | |
| Lenovo Legion Pro 7 16IRX8H | |
| Lenovo Legion Pro 5 16IRX8 | |
| Lenovo Legion S7 16ARHA7 | |
| Lenovo Legion 5 Pro 16ARH7H RTX 3070 Ti | |
| Gemiddeld Intel Core i7-13700HX, NVIDIA GeForce RTX 4060 Laptop GPU (6909 - 7743, n=5) | |
| PCMark 10 / Essentials | |
| Lenovo Legion Pro 7 16IRX8H | |
| Razer Blade 16 Early 2023 | |
| Asus ROG Zephyrus M16 GU603Z | |
| Lenovo Legion Pro 5 16IRX8 | |
| Lenovo Legion S7 16ARHA7 | |
| Gemiddeld Intel Core i7-13700HX, NVIDIA GeForce RTX 4060 Laptop GPU (9760 - 11313, n=5) | |
| Lenovo Legion 5 Pro 16ARH7H RTX 3070 Ti | |
| PCMark 10 / Productivity | |
| Lenovo Legion Pro 7 16IRX8H | |
| Asus ROG Zephyrus M16 GU603Z | |
| Lenovo Legion S7 16ARHA7 | |
| Gemiddeld Intel Core i7-13700HX, NVIDIA GeForce RTX 4060 Laptop GPU (9131 - 11018, n=5) | |
| Lenovo Legion 5 Pro 16ARH7H RTX 3070 Ti | |
| Lenovo Legion Pro 5 16IRX8 | |
| Razer Blade 16 Early 2023 | |
| PCMark 10 / Digital Content Creation | |
| Razer Blade 16 Early 2023 | |
| Lenovo Legion Pro 5 16IRX8 | |
| Asus ROG Zephyrus M16 GU603Z | |
| Lenovo Legion 5 Pro 16ARH7H RTX 3070 Ti | |
| Lenovo Legion S7 16ARHA7 | |
| Gemiddeld Intel Core i7-13700HX, NVIDIA GeForce RTX 4060 Laptop GPU (9393 - 12434, n=5) | |
| Lenovo Legion Pro 7 16IRX8H | |
| CrossMark / Overall | |
| Asus ROG Zephyrus M16 GU603Z | |
| Gemiddeld Intel Core i7-13700HX, NVIDIA GeForce RTX 4060 Laptop GPU (1663 - 2105, n=5) | |
| Lenovo Legion S7 16ARHA7 | |
| Lenovo Legion Pro 5 16IRX8 | |
| Lenovo Legion 5 Pro 16ARH7H RTX 3070 Ti | |
| Razer Blade 16 Early 2023 | |
| CrossMark / Productivity | |
| Asus ROG Zephyrus M16 GU603Z | |
| Gemiddeld Intel Core i7-13700HX, NVIDIA GeForce RTX 4060 Laptop GPU (1618 - 1989, n=5) | |
| Lenovo Legion S7 16ARHA7 | |
| Lenovo Legion Pro 5 16IRX8 | |
| Lenovo Legion 5 Pro 16ARH7H RTX 3070 Ti | |
| Razer Blade 16 Early 2023 | |
| CrossMark / Creativity | |
| Gemiddeld Intel Core i7-13700HX, NVIDIA GeForce RTX 4060 Laptop GPU (1710 - 2274, n=5) | |
| Asus ROG Zephyrus M16 GU603Z | |
| Lenovo Legion S7 16ARHA7 | |
| Razer Blade 16 Early 2023 | |
| Lenovo Legion 5 Pro 16ARH7H RTX 3070 Ti | |
| Lenovo Legion Pro 5 16IRX8 | |
| CrossMark / Responsiveness | |
| Asus ROG Zephyrus M16 GU603Z | |
| Gemiddeld Intel Core i7-13700HX, NVIDIA GeForce RTX 4060 Laptop GPU (1269 - 1983, n=5) | |
| Lenovo Legion Pro 5 16IRX8 | |
| Lenovo Legion S7 16ARHA7 | |
| Lenovo Legion 5 Pro 16ARH7H RTX 3070 Ti | |
| Razer Blade 16 Early 2023 | |
| PCMark 10 Score | 7691 punten | |
Help | ||
* ... kleiner is beter
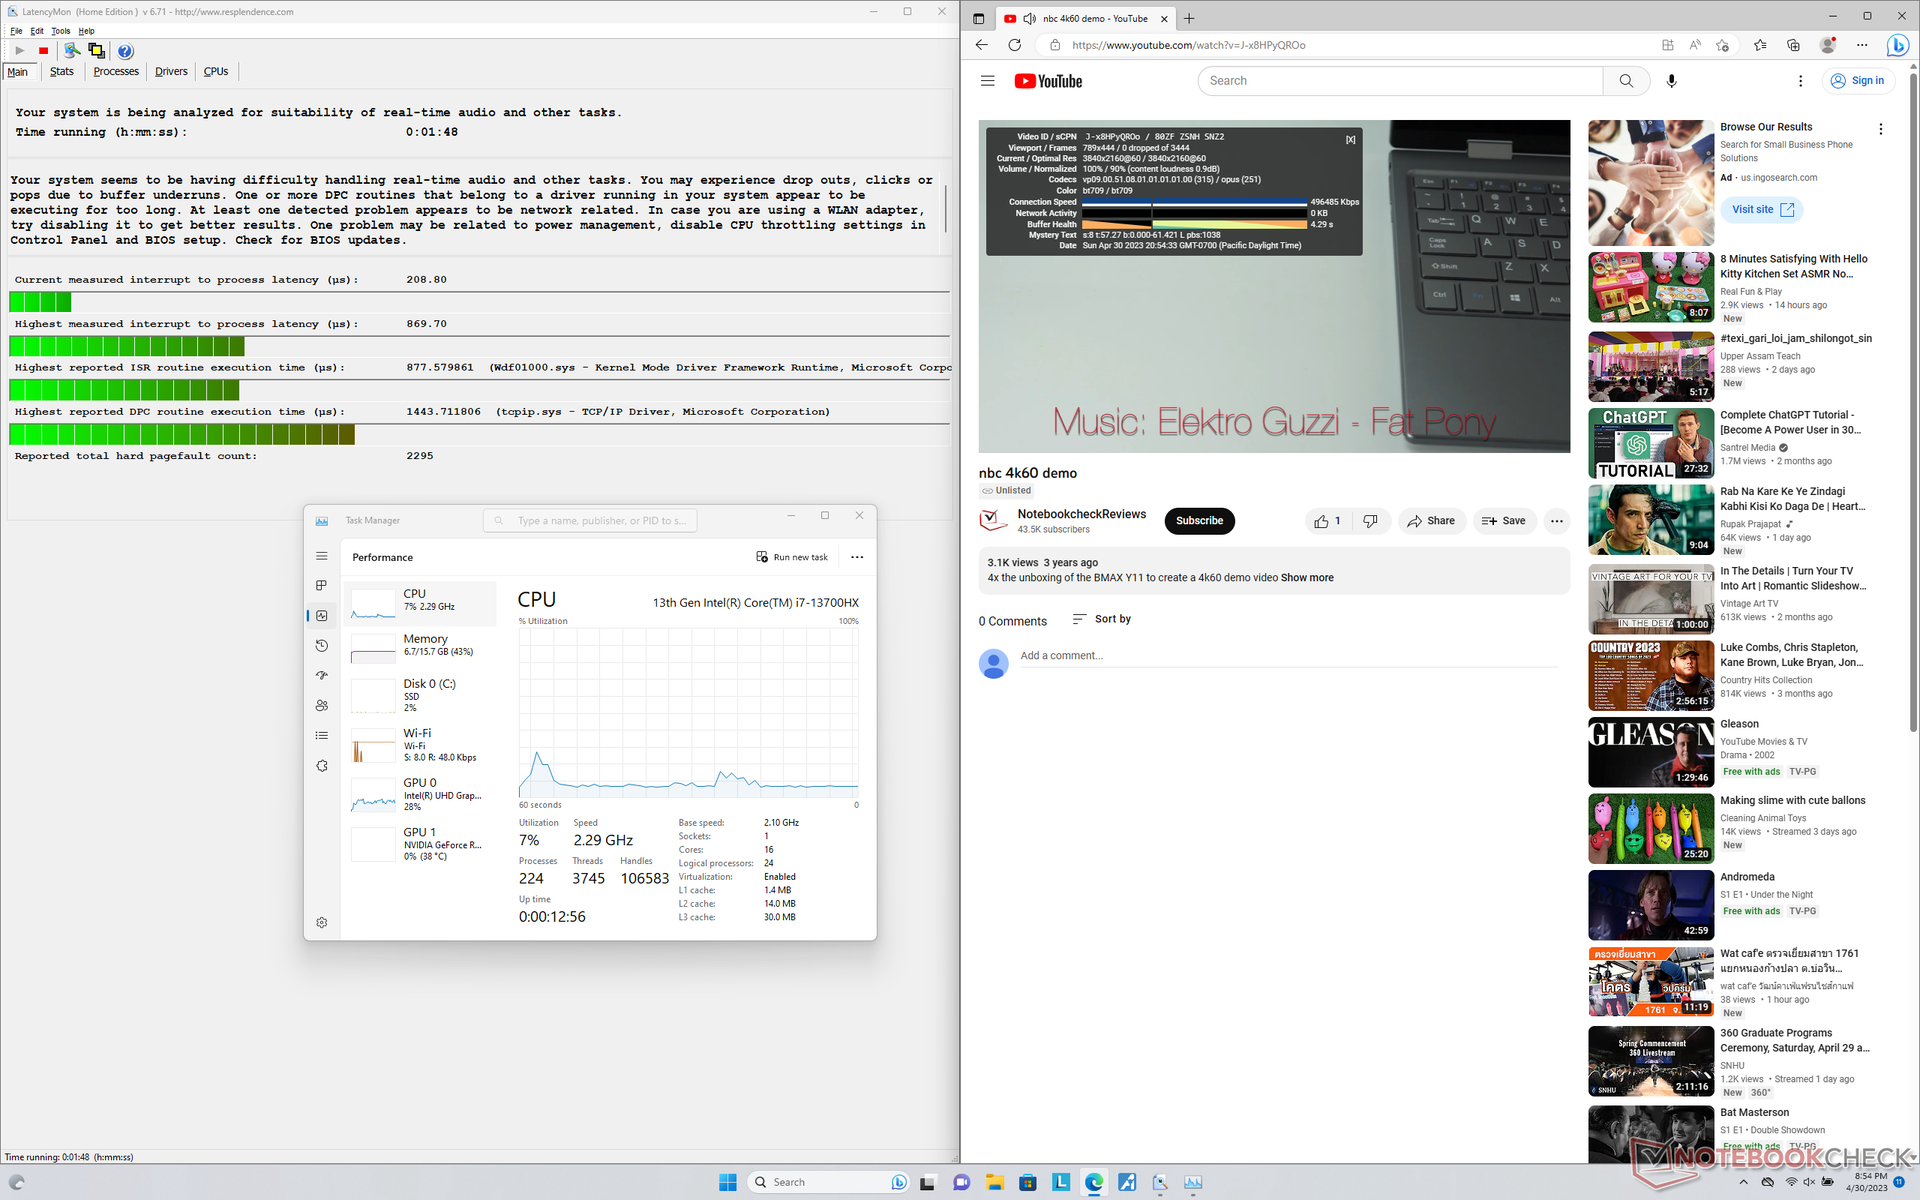
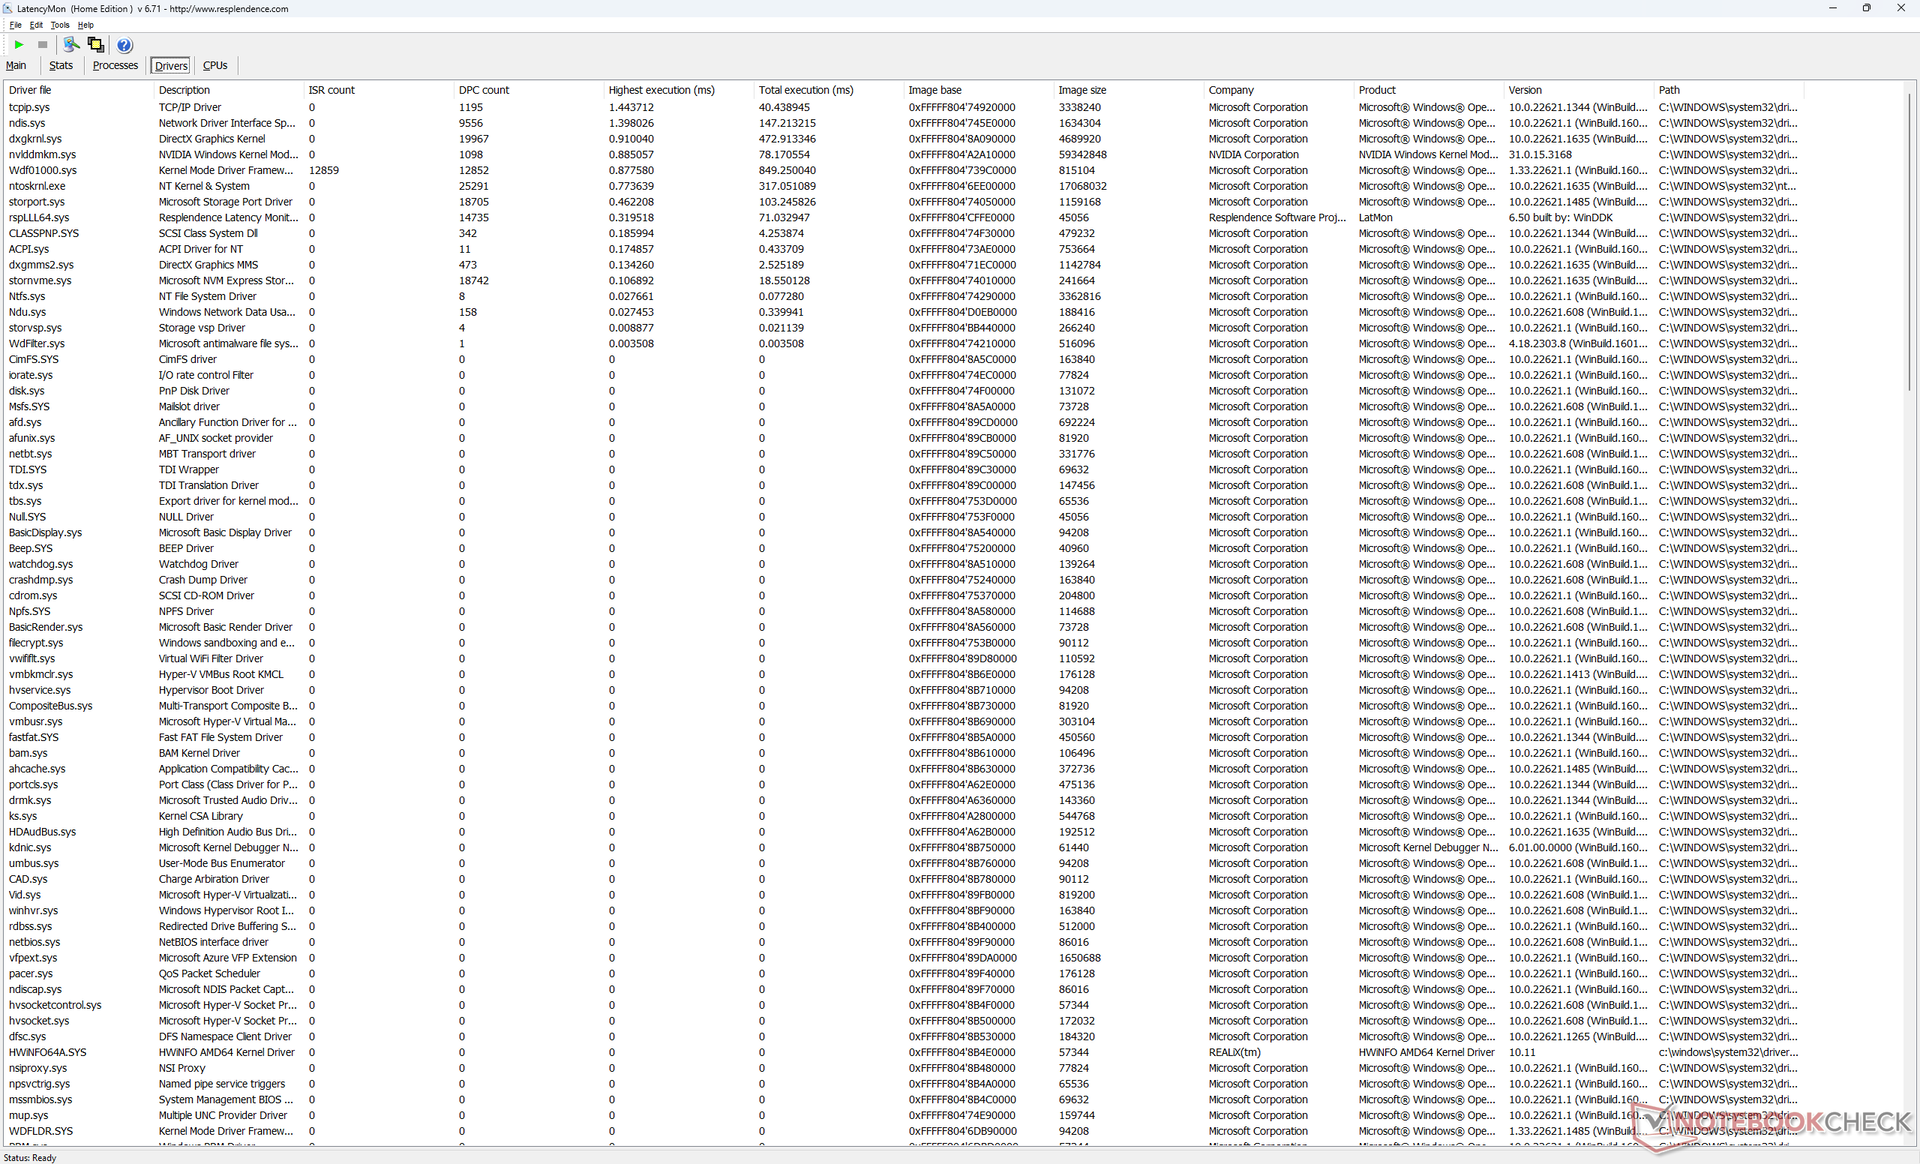
DPC latentie
LatencyMon onthult kleine DPC-problemen bij het openen van meerdere browsertabbladen van onze homepage, zelfs in de iGPU-modus. 4K-videoweergave bij 60 FPS is verder perfect zonder dropped frames.
| DPC Latencies / LatencyMon - interrupt to process latency (max), Web, Youtube, Prime95 | |
| Razer Blade 16 Early 2023 | |
| Asus ROG Zephyrus M16 GU603Z | |
| Lenovo Legion S7 16ARHA7 | |
| Lenovo Legion Pro 5 16IRX8 | |
| Lenovo Legion 5 Pro 16ARH7H RTX 3070 Ti | |
| Lenovo Legion Pro 7 16IRX8H | |
* ... kleiner is beter
Opslagapparaten - Tot twee PCIe4 x4-schijven
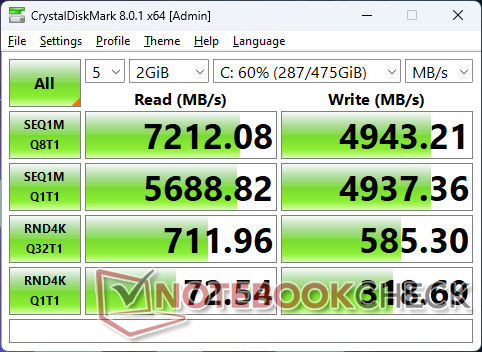
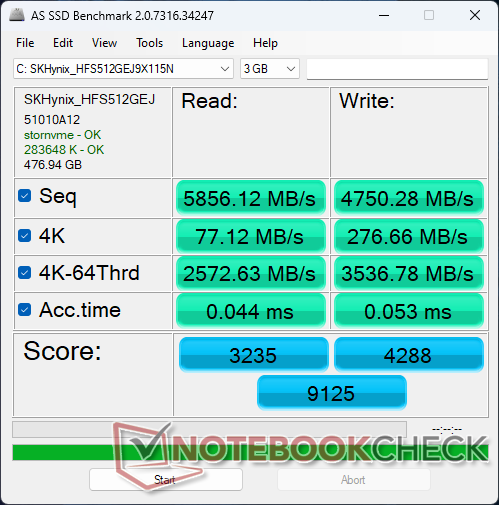
Onze eenheid gebruikt dezelfde PCIe4 x4 512 GB SK Hynix schijf als in de Lenovo Legion S7 16. De prestaties zijn uitstekend met sequentiële lees- en schrijfsnelheden die respectievelijk 7200 MB/s en 5000 MB/s benaderen en daarmee de populaire Samsung PM9A1 evenaren. Toch is er nog ruimte voor verbetering, omdat de overdrachtsnelheden periodiek kunnen afnemen tot 6300 MB/s in plaats van een vast maximum van 7200 MB/s.

* ... kleiner is beter
Disk Throttling: DiskSpd Read Loop, Queue Depth 8
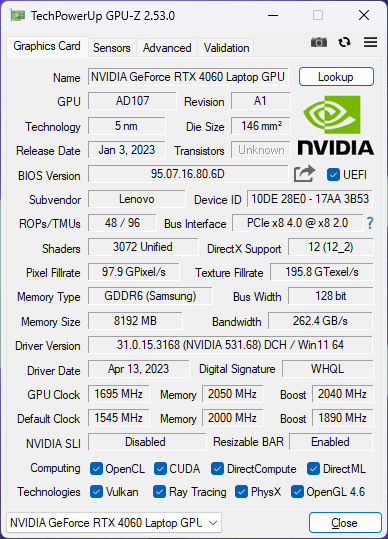
GPU-prestaties - GeForce RTX 4060
De grafische prestaties zijn 10 tot 15 procent sneller dan de gemiddelde laptop in onze database met dezelfde mobiele GeForce RTX 4060 GPU. De Legion Pro 5 16 kan dus een goede optie zijn voor wie de grafische prestaties wil maximaliseren. De MSI Cyborg 15komt bijvoorbeeld met dezelfde GPU, maar mikt op een veel lagere 45 W TGP voor tragere prestaties in het algemeen.
De mobiele RTX 3070 Ti is iets sneller dan onze mobiele RTX 4060 met ongeveer 15 procent. Upgraden van een RTX 3060 laptop naar onze RTX 4060 verbetert de prestaties met ongeveer 20 tot 25 procent, wat niet slecht is voor een middelgrote kaart. Je zou titels moeten spelen die DLSS3 ondersteunen om de RTX 4060 beter te benutten, aangezien deze functie niet beschikbaar is op GeForce 30 GPU's.
Opwaarderen naar de RTX 4070 SKU zal de grafische prestaties met 15 tot 20 procent verbeteren ten opzichte van onze RTX 4060. Voor RTX 4080- of RTX 4090-opties zult u echter de duurdere Legion 7 Pro-serie moeten overwegen.
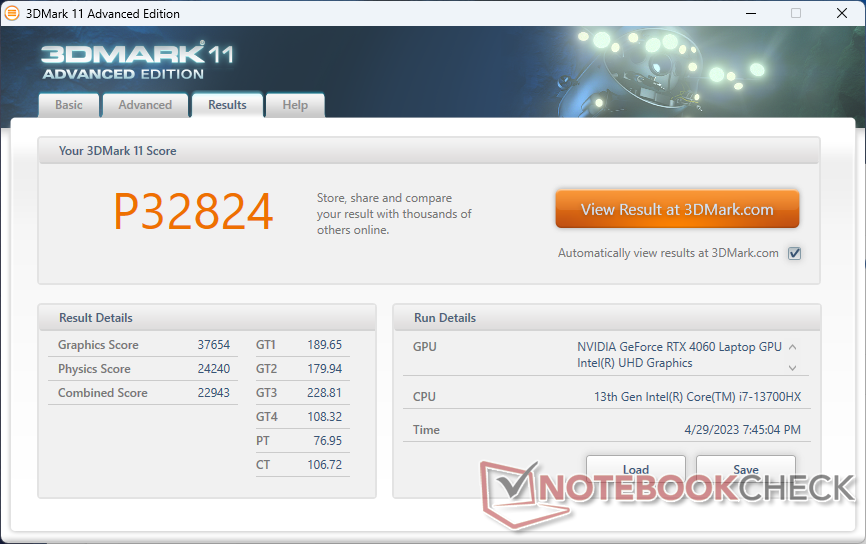
| 3DMark 11 Performance | 32824 punten | |
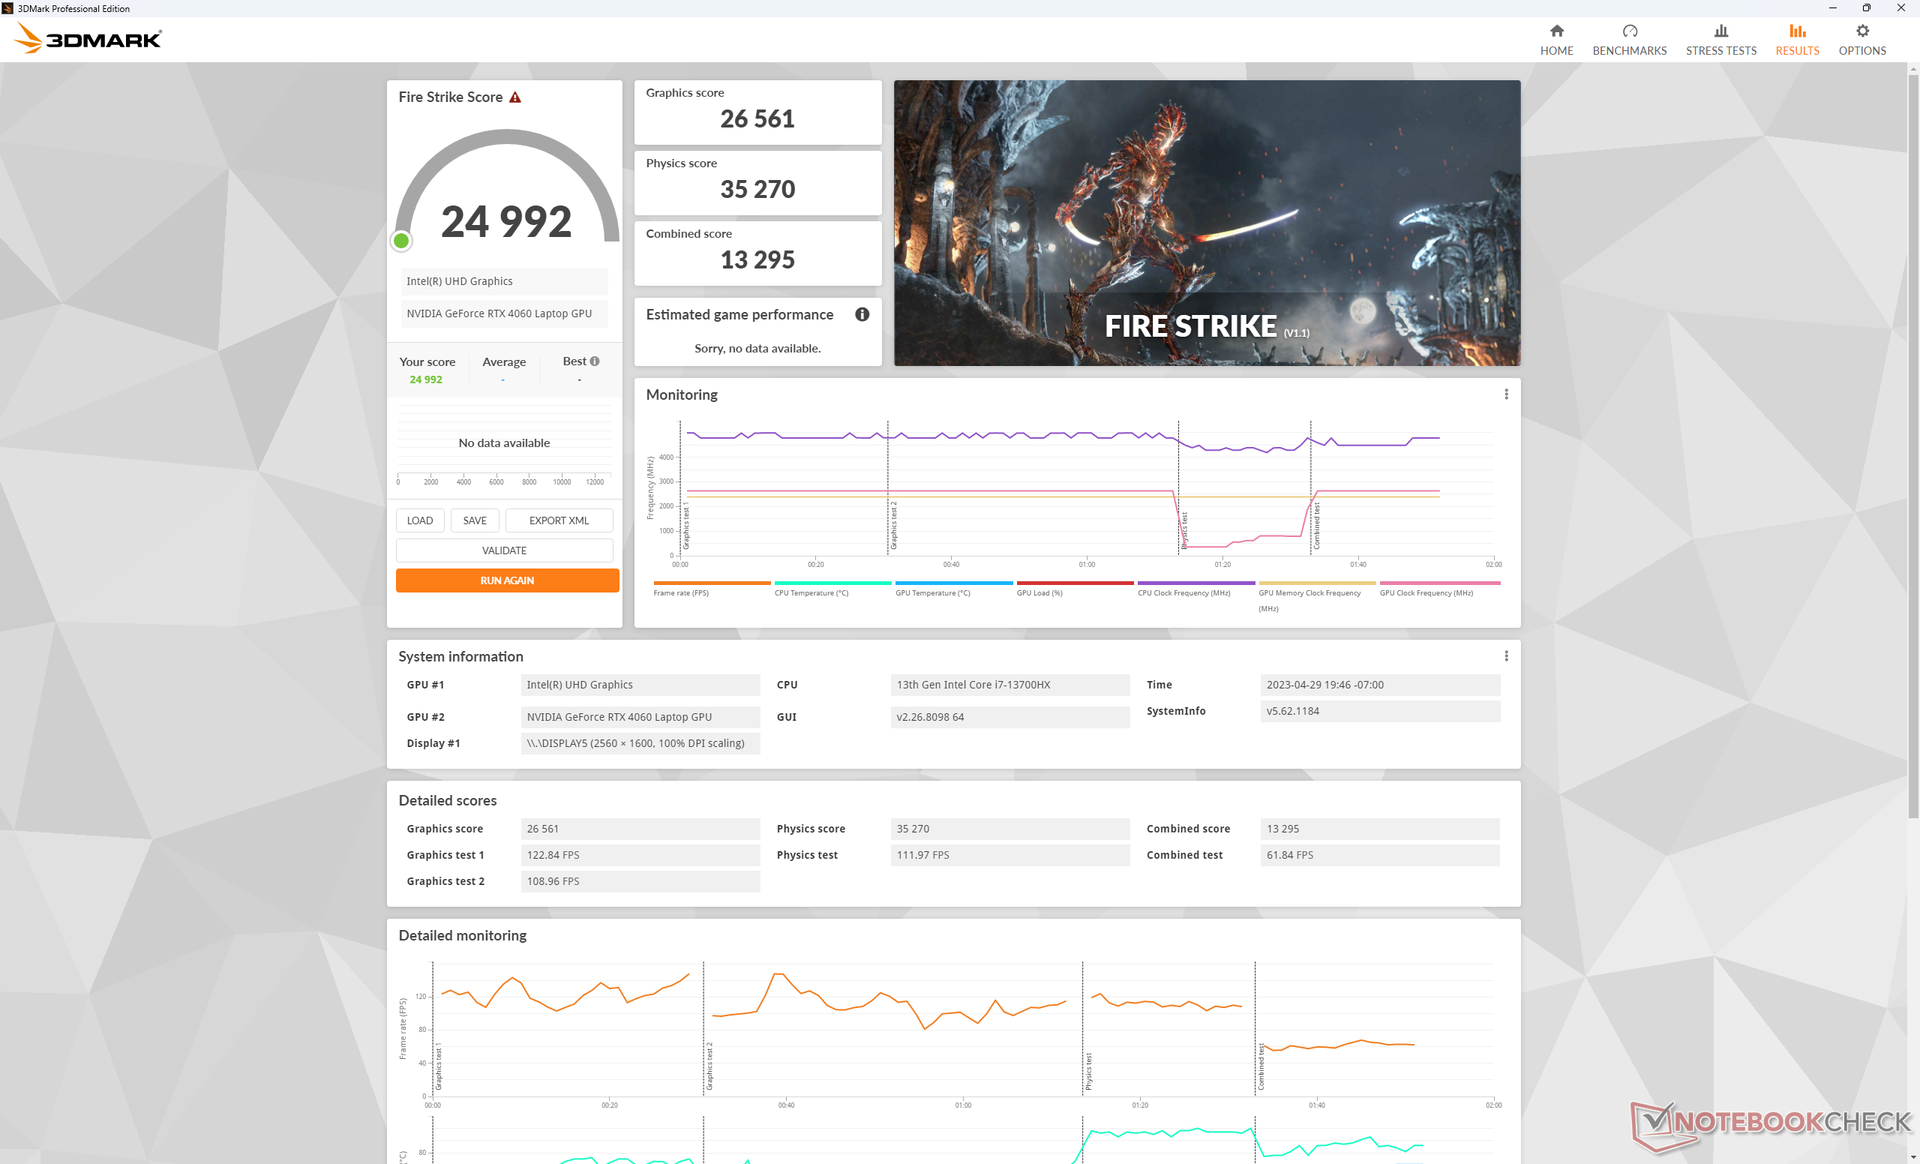
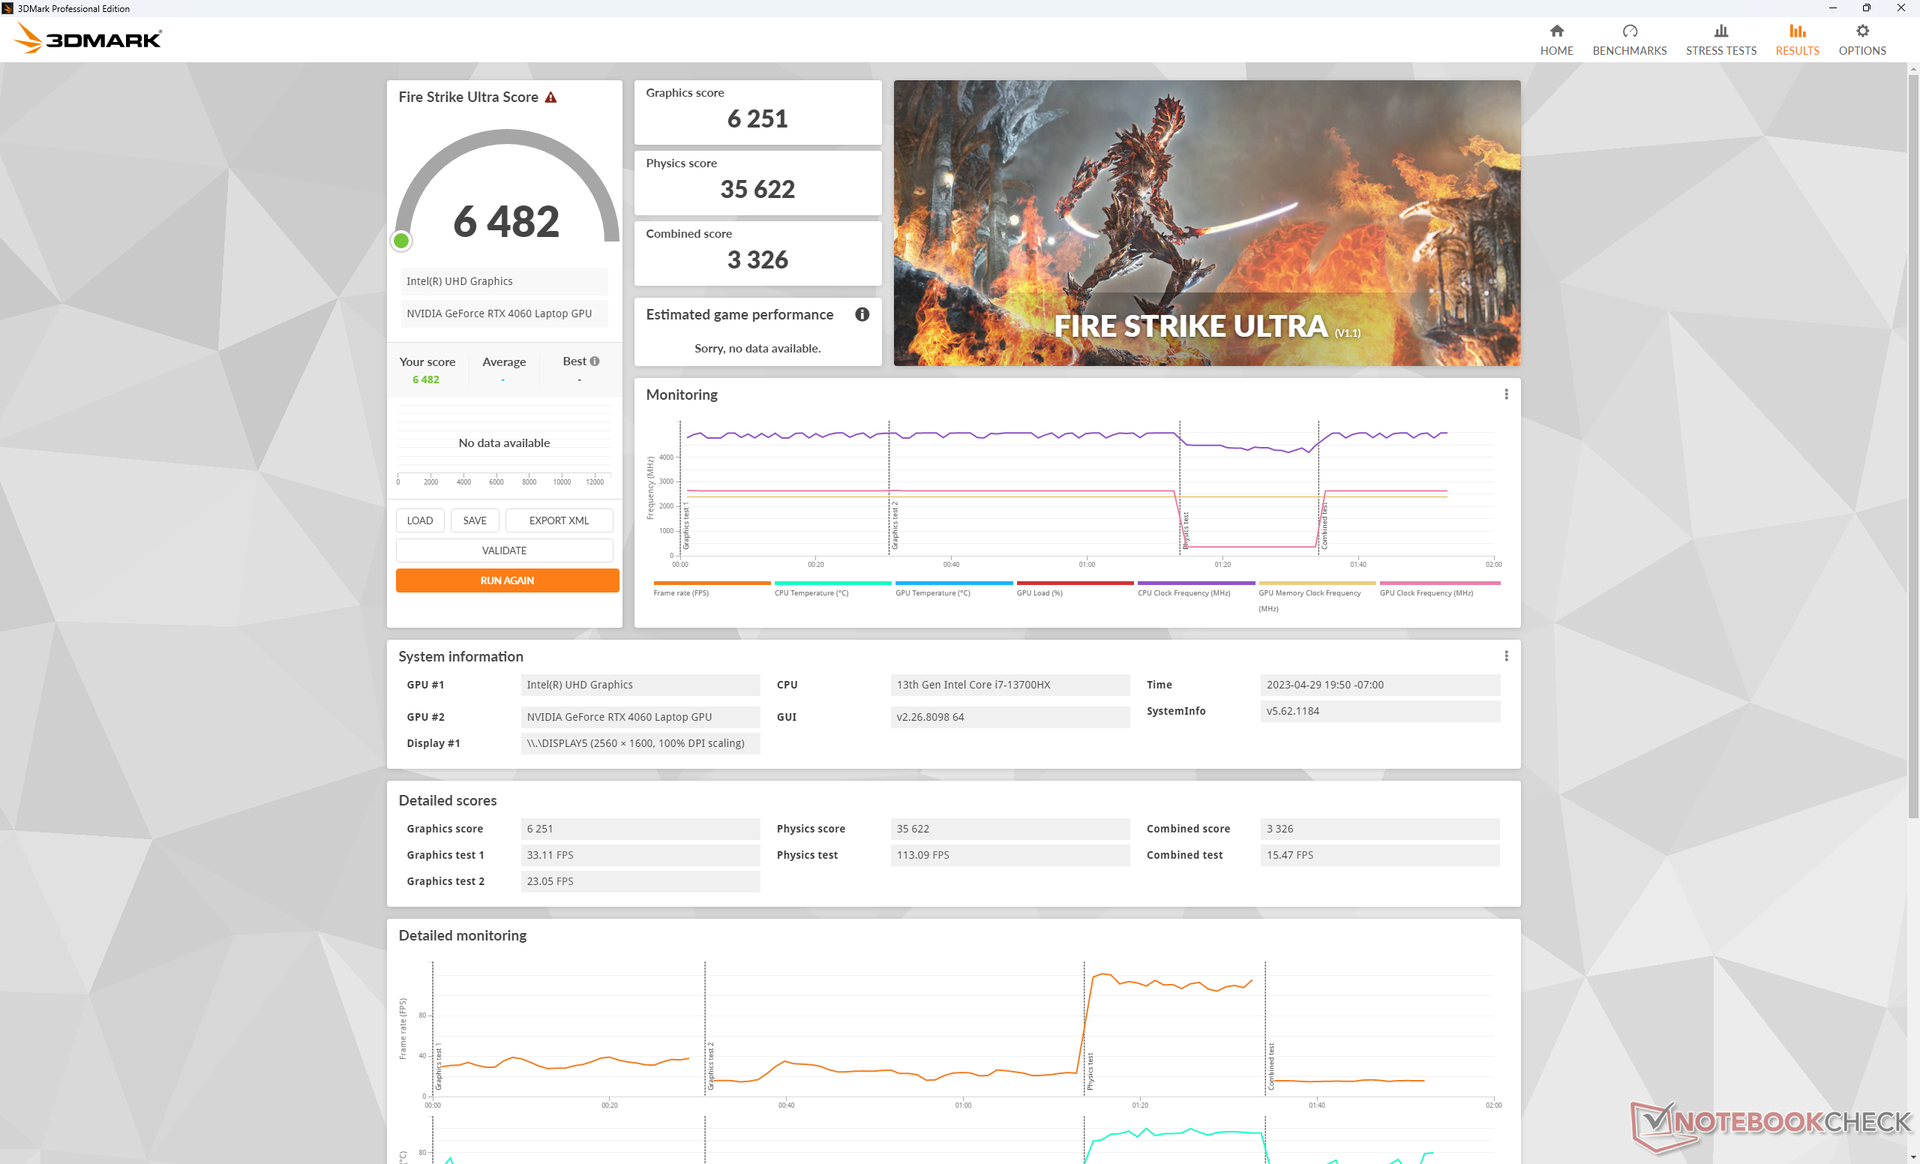
| 3DMark Fire Strike Score | 24992 punten | |
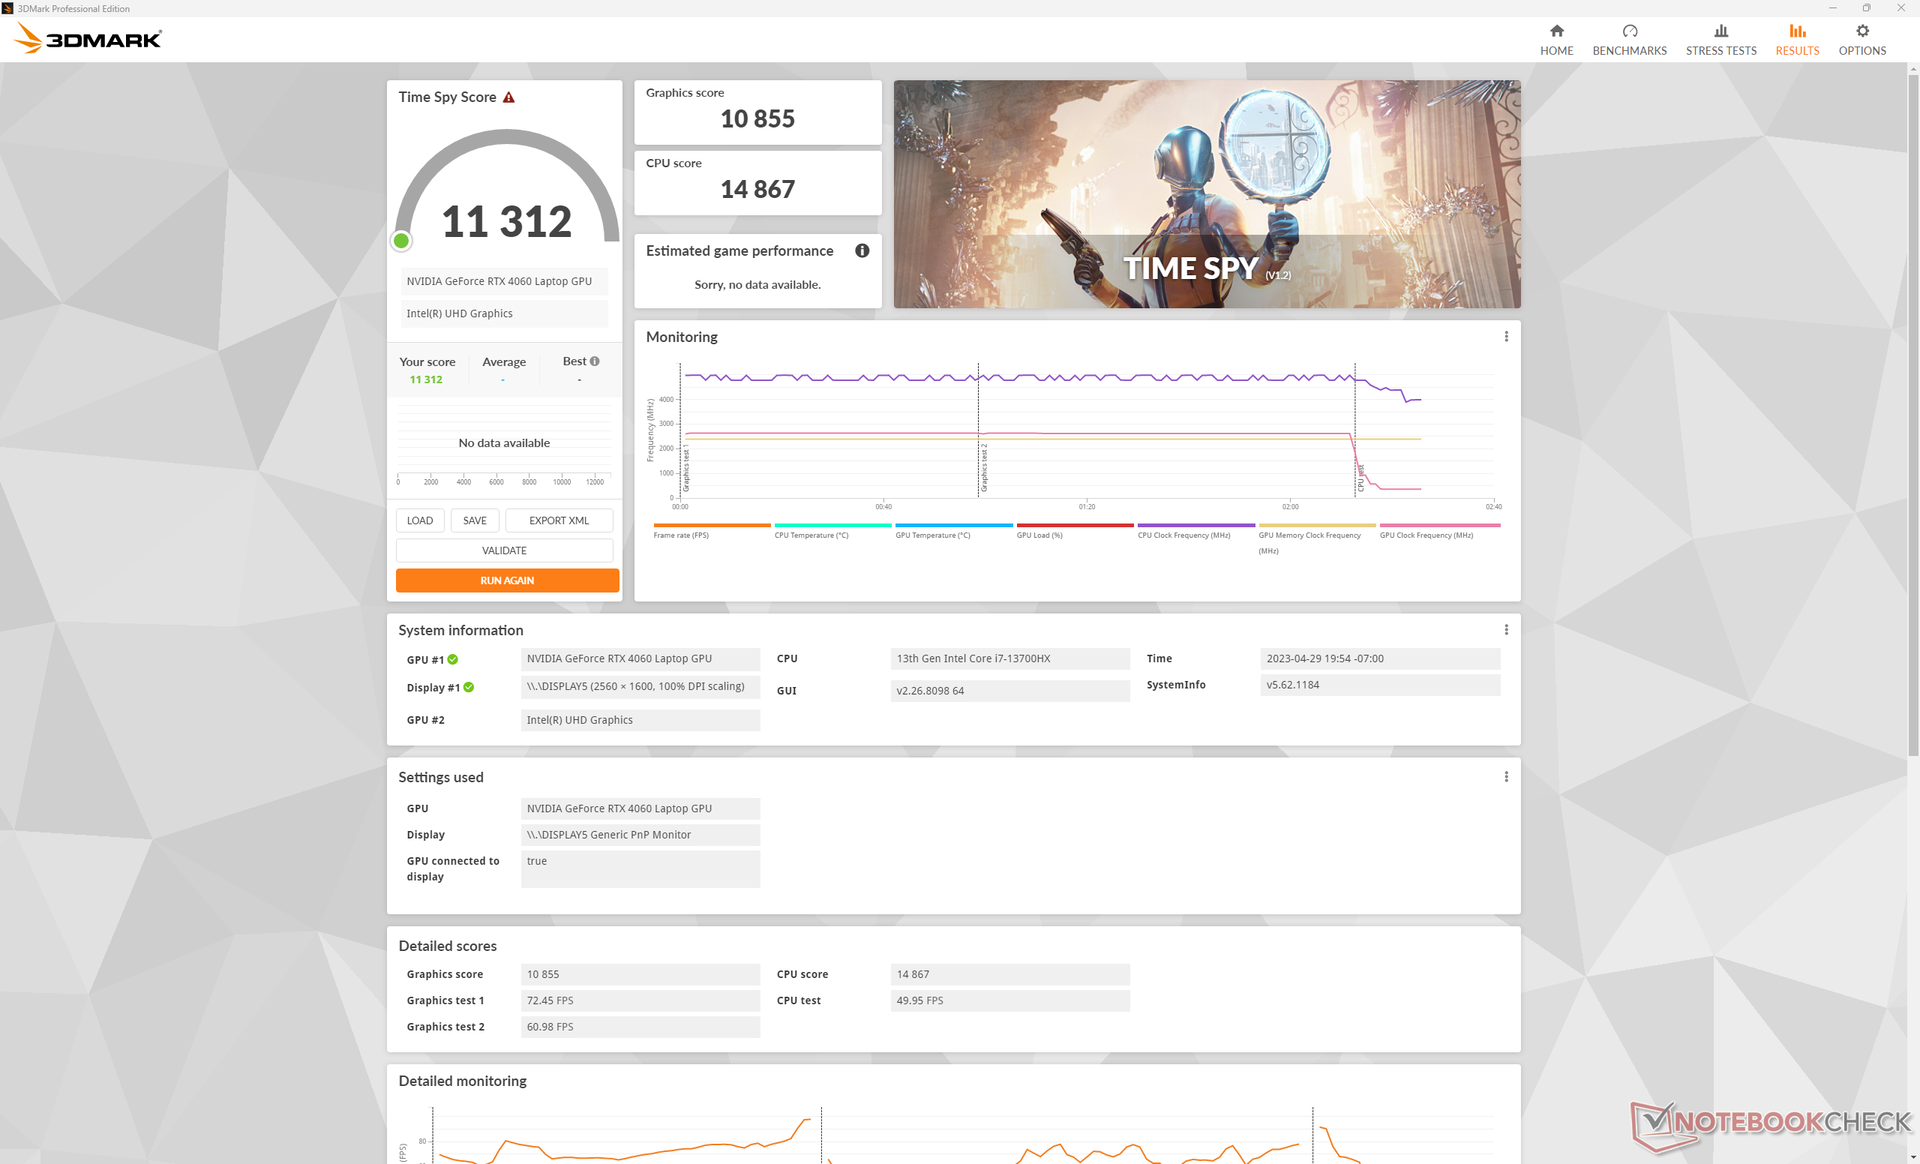
| 3DMark Time Spy Score | 11312 punten | |
Help | ||
* ... kleiner is beter
Spelprestaties
Elke huidige titel kan ruim boven de 60 FPS draaien bij 1080p ultra-instellingen. Draaien op de native QHD+ resolutie vereist echter het afstemmen van sommige instellingen, vooral voor veeleisende titels zoals Returnal of F1 2022. Het bereiken van een stabiele 165 FPS om de 165 Hz verversingssnelheid te evenaren is moeilijk op de meeste titels met de midrange RTX 3060. In plaats daarvan raden we aan te mikken op 50 tot 100 FPS met G-Sync ingeschakeld om schermscheuren te verminderen.
| Returnal | |
| 1920x1080 Low Preset | |
| Gemiddeld NVIDIA GeForce RTX 4060 Laptop GPU (71 - 99, n=5) | |
| Lenovo Legion Pro 5 16IRX8 | |
| 1920x1080 Medium Preset | |
| Gemiddeld NVIDIA GeForce RTX 4060 Laptop GPU (68 - 93, n=5) | |
| Lenovo Legion Pro 5 16IRX8 | |
| 1920x1080 High Preset | |
| Lenovo Legion Pro 5 16IRX8 | |
| Gemiddeld NVIDIA GeForce RTX 4060 Laptop GPU (63 - 87, n=6) | |
| 1920x1080 Epic Preset | |
| Lenovo Legion Pro 5 16IRX8 | |
| Gemiddeld NVIDIA GeForce RTX 4060 Laptop GPU (57 - 75, n=6) | |
| 2560x1440 Epic Preset | |
| Gemiddeld NVIDIA GeForce RTX 4060 Laptop GPU (39 - 59.4, n=5) | |
| Lenovo Legion Pro 5 16IRX8 | |
| 3840x2160 Epic Preset | |
| Gemiddeld NVIDIA GeForce RTX 4060 Laptop GPU (25 - 29, n=2) | |
| Lenovo Legion Pro 5 16IRX8 | |
Witcher 3 FPS Chart
| lage | gem. | hoge | ultra | QHD | 4K | |
|---|---|---|---|---|---|---|
| GTA V (2015) | 186.7 | 184 | 178.9 | 119.6 | 88.9 | 85.5 |
| The Witcher 3 (2015) | 521.8 | 369.3 | 215.8 | 107.6 | 67.2 | |
| Dota 2 Reborn (2015) | 196.6 | 176.5 | 170.3 | 161.8 | 142.9 | |
| Final Fantasy XV Benchmark (2018) | 222 | 161.2 | 109.8 | 79.4 | 45.4 | |
| X-Plane 11.11 (2018) | 177.4 | 156.3 | 121.9 | 104.4 | ||
| Cyberpunk 2077 1.6 (2022) | 150.7 | 136.6 | 106 | 87.4 | 51.7 | 22.9 |
| Tiny Tina's Wonderlands (2022) | 234.6 | 192.3 | 121.2 | 92.7 | 64.2 | 33.6 |
| F1 22 (2022) | 276 | 274 | 208 | 70.1 | 44.8 | 21.5 |
| Returnal (2023) | 81 | 79 | 75 | 70 | 48 | 25 |
Emissies
Systeemgeluid - Gedrag bij constant toerental ventilator
Het geluid van de ventilator tijdens lage belastingen zoals browsen of videostreaming stabiliseert zich op 26,6 dB(A) tegen een stille achtergrond van 23 dB(A). Het is luid genoeg om hoorbaar te zijn, maar niet storend. De ventilatoren zijn gelukkig stabiel in RPM en pulseren niet vaak in deze toestand, zelfs niet in de modus Prestaties.
Het ventilatorgeluid bij gebruik Witcher 3 op Performance zou stabiliseren op 47,6 dB(A) in vergelijking met 55 dB(A) elk op de Legion Pro 5 16 van vorig jaar met RTX 3070 Ti graphics en dit jaar de Legion Pro 7. Als de CPU en GPU aanzienlijk meer worden belast, zoals met benchmarks of met zeer veeleisende games, kan onze Legion Pro 5 16 echter hetzelfde maximum van 55 dB(A) bereiken.
Gamen in gebalanceerde modus is iets stiller met 46 dB(A) tegenover de 47,6 dB(A) hierboven vermeld. Het verschil is zo klein dat er in de meeste gamescenario's weinig reden is om de gebalanceerde modus te gebruiken...
Geluidsniveau
| Onbelast |
| 23.1 / 23.1 / 26.6 dB (A) |
| Belasting |
| 34.7 / 54.8 dB (A) |
 | ||
30 dB stil 40 dB(A) hoorbaar 50 dB(A) luid |
||
min: | ||
| Lenovo Legion Pro 5 16IRX8 GeForce RTX 4060 Laptop GPU, i7-13700HX, SK hynix PC801 HFS512GEJ9X115N | Asus ROG Zephyrus M16 GU603Z GeForce RTX 3070 Ti Laptop GPU, i9-12900H, Micron 3400 1TB MTFDKBA1T0TFH | Razer Blade 16 Early 2023 GeForce RTX 4080 Laptop GPU, i9-13950HX, SSSTC CA6-8D1024 | Lenovo Legion Pro 7 16IRX8H GeForce RTX 4080 Laptop GPU, i9-13900HX, Samsung PM9A1 MZVL21T0HCLR | Lenovo Legion 5 Pro 16ARH7H RTX 3070 Ti GeForce RTX 3070 Ti Laptop GPU, R7 6800H, Samsung PM9A1 MZVL21T0HCLR | Lenovo Legion S7 16ARHA7 Radeon RX 6800S, R9 6900HX, SK Hynix HFS001TEJ9X115N | |
|---|---|---|---|---|---|---|
| Noise | -16% | -0% | -17% | -12% | 3% | |
| uit / omgeving * (dB) | 23 | 23 -0% | 23 -0% | 24 -4% | 23.5 -2% | 23.1 -0% |
| Idle Minimum * (dB) | 23.1 | 23 -0% | 23 -0% | 26 -13% | 23.7 -3% | 23.1 -0% |
| Idle Average * (dB) | 23.1 | 24 -4% | 23 -0% | 28 -21% | 31.1 -35% | 23.1 -0% |
| Idle Maximum * (dB) | 26.6 | 47 -77% | 23.6 11% | 34 -28% | 32.2 -21% | 23.1 13% |
| Load Average * (dB) | 34.7 | 47.91 -38% | 39 -12% | 47 -35% | 38.4 -11% | 31.4 10% |
| Witcher 3 ultra * (dB) | 47.6 | 48.91 -3% | 51.6 -8% | 55 -16% | 54.8 -15% | 51.4 -8% |
| Load Maximum * (dB) | 54.8 | 50.25 8% | 51.3 6% | 56 -2% | 54.8 -0% | 51.2 7% |
* ... kleiner is beter
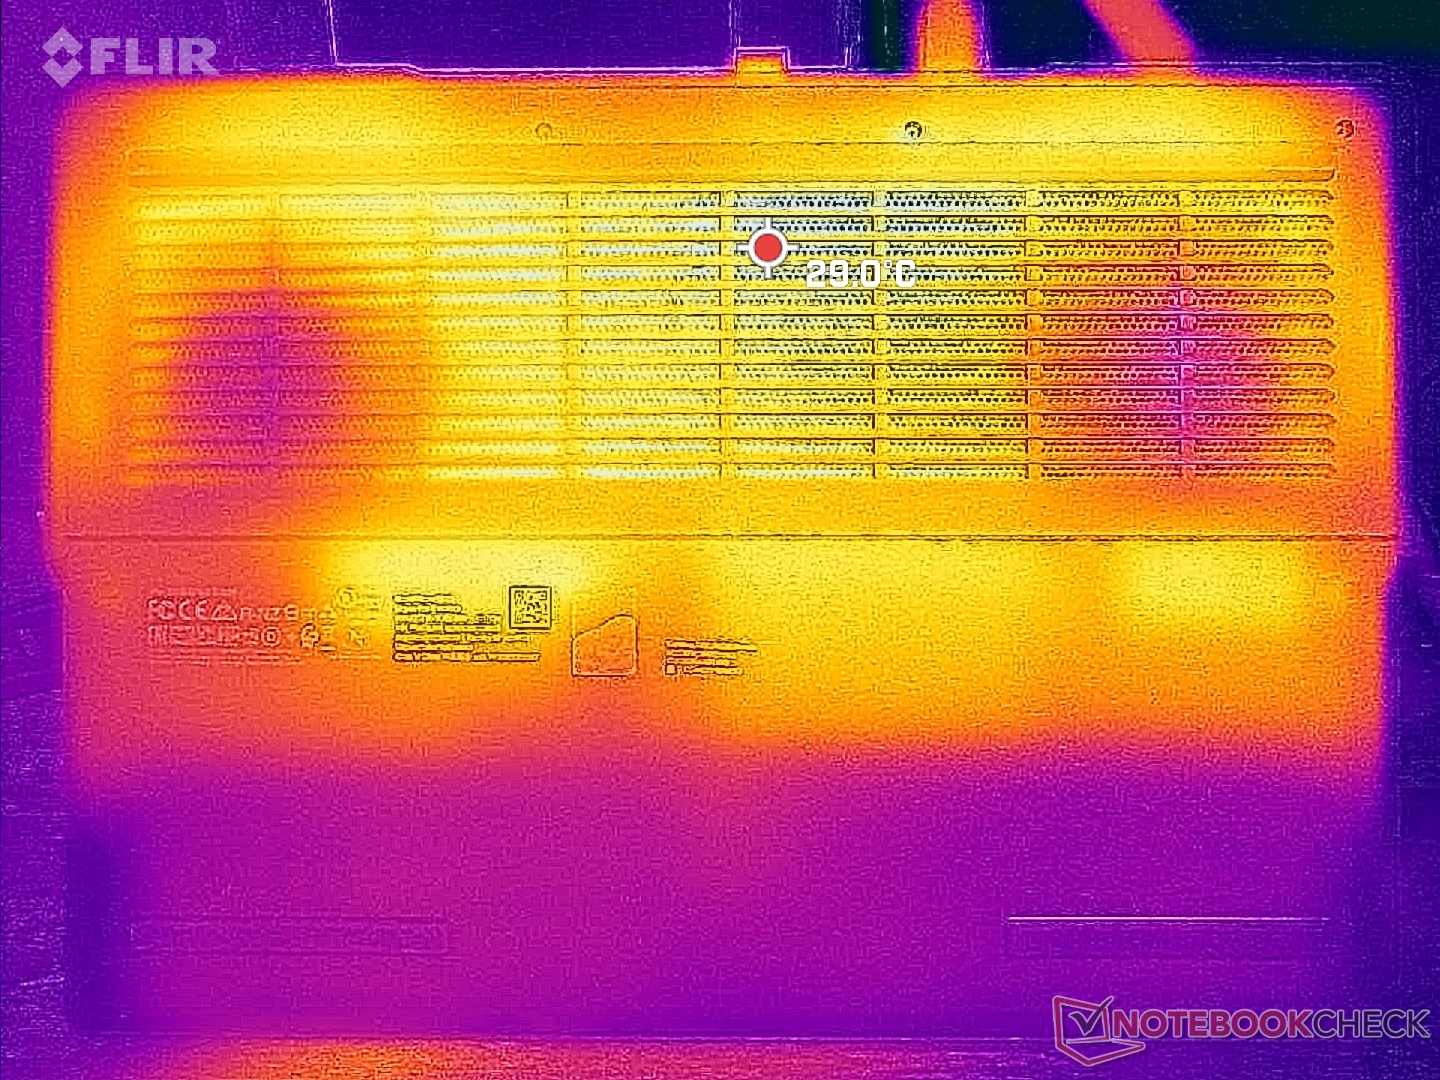
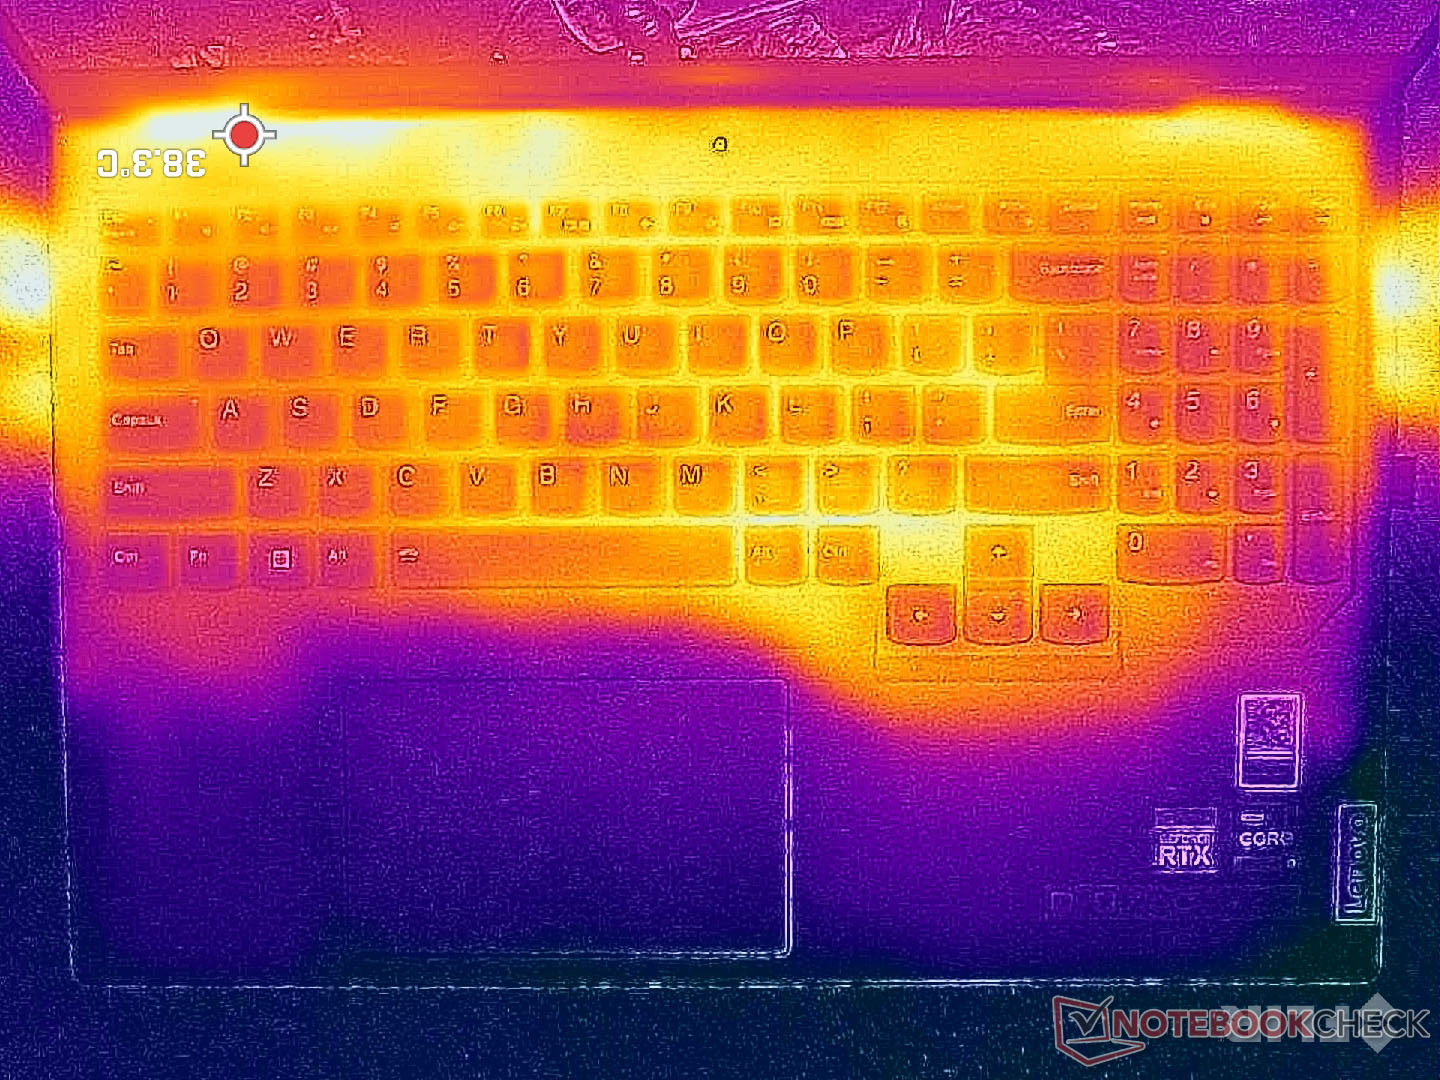
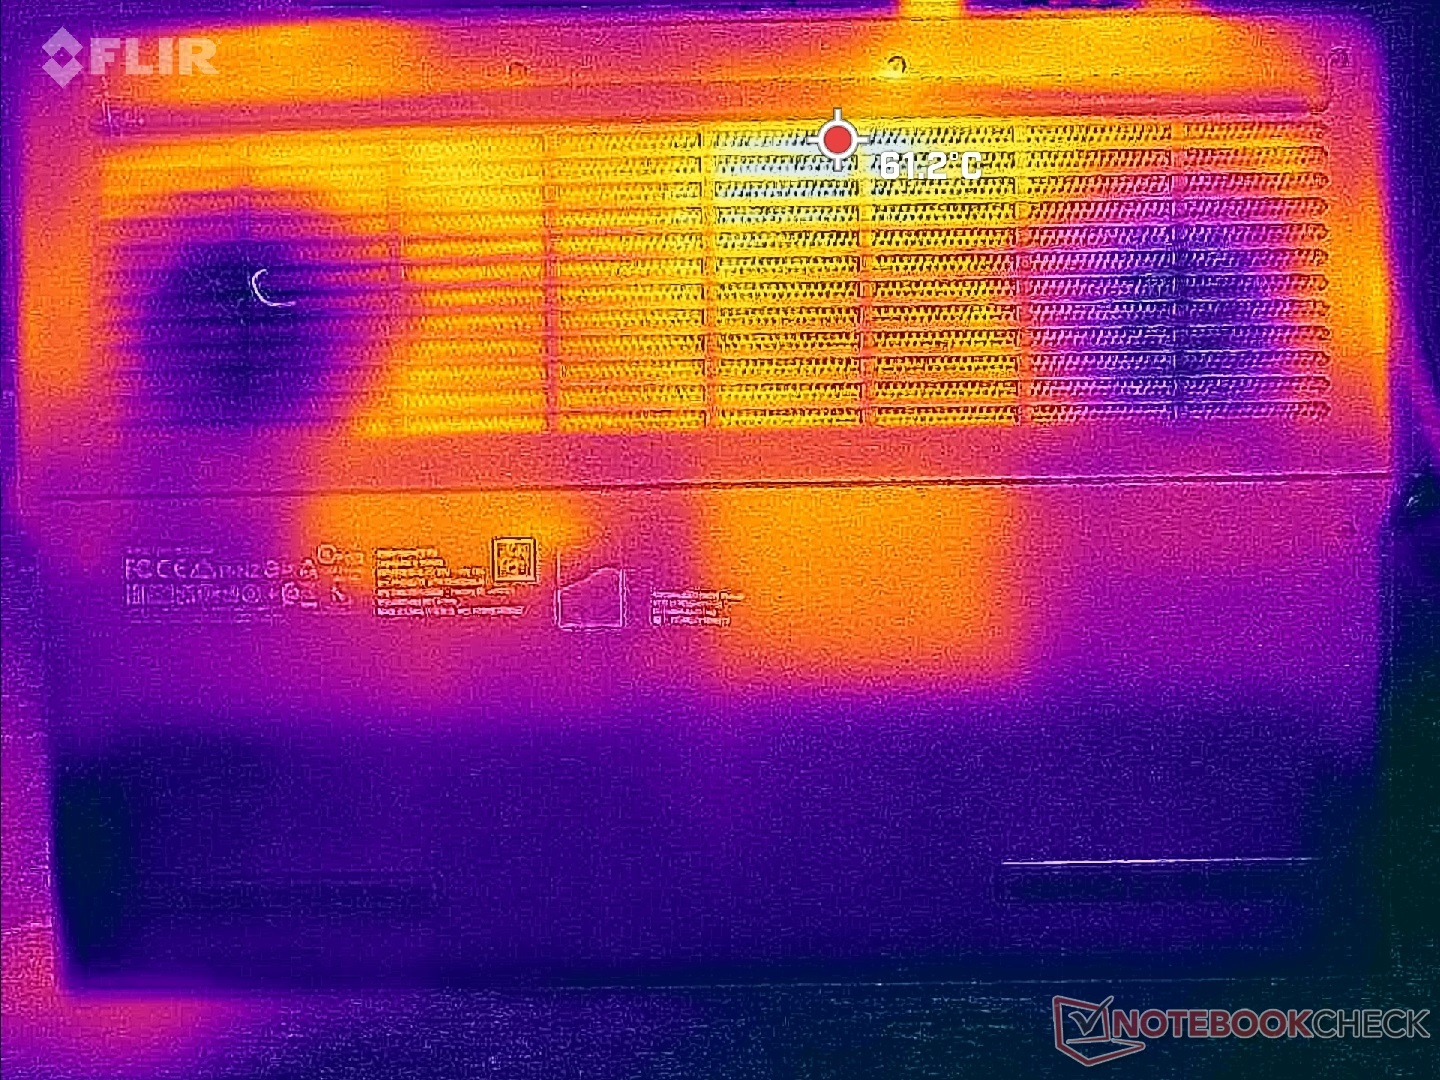
Temperatuur - Koele Palmsteunen
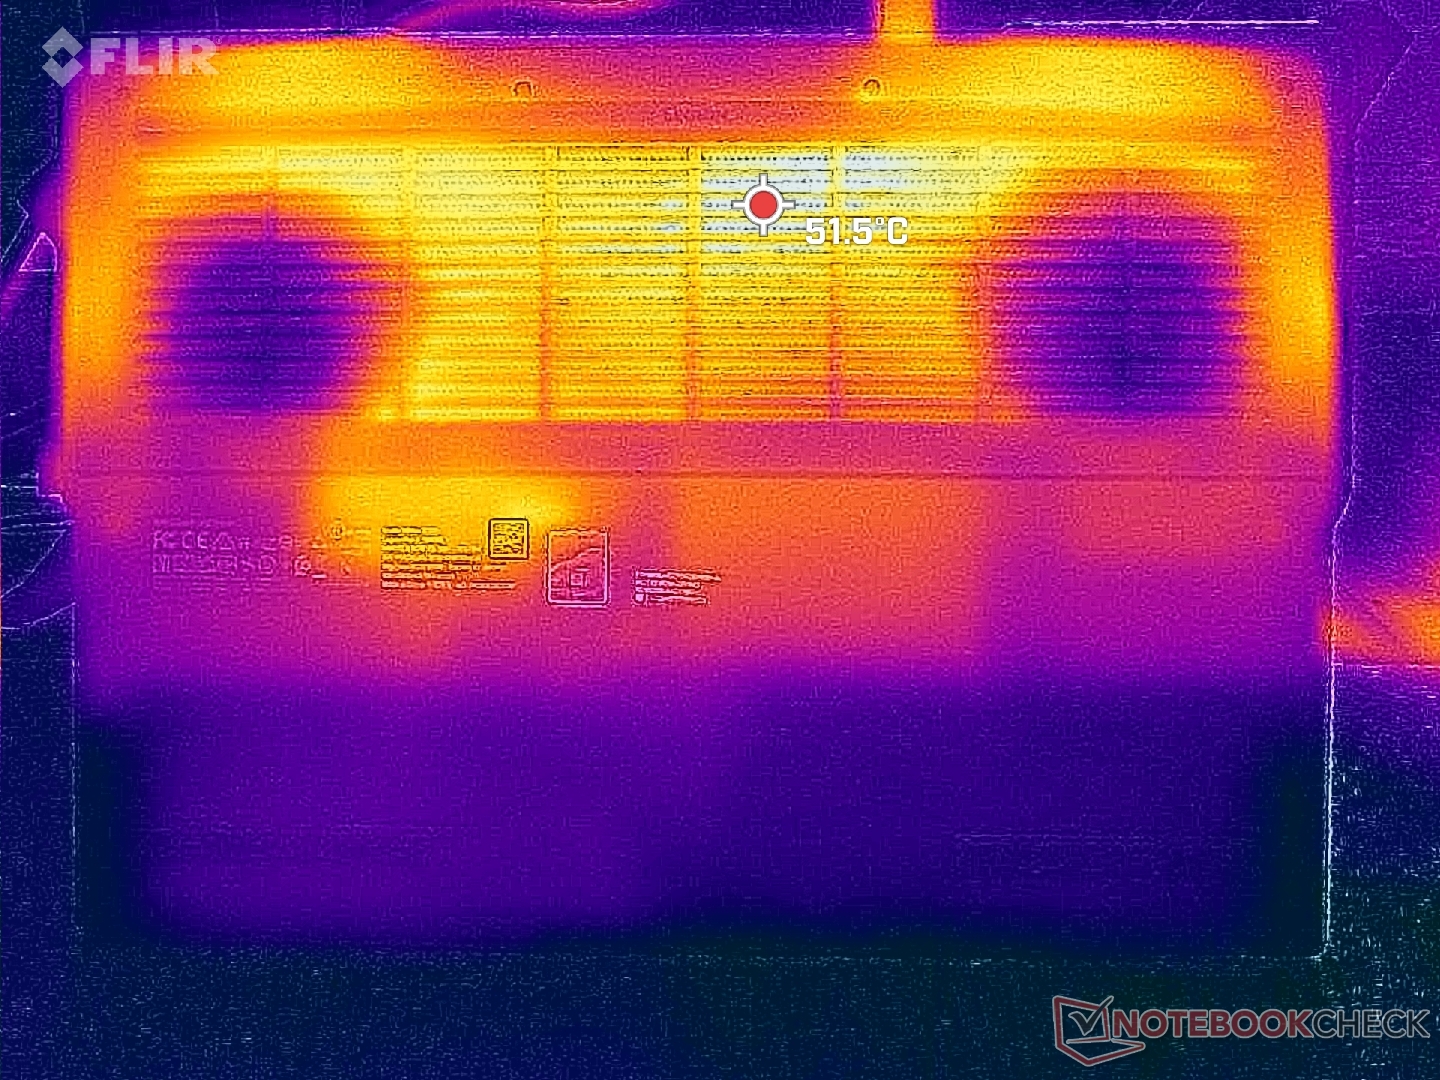
De oppervlaktetemperatuur tijdens het spelen van games kan oplopen tot 43 C à 50 C aan de boven- en onderkant. Deze warme plekken zijn gelukkig geconcentreerd aan de achterkant, waar de huid waarschijnlijk niet wordt aangeraakt. De dunnere ROG Zephyrus M16 kan gemiddeld nog warmer zijn en met grotere hot spots.
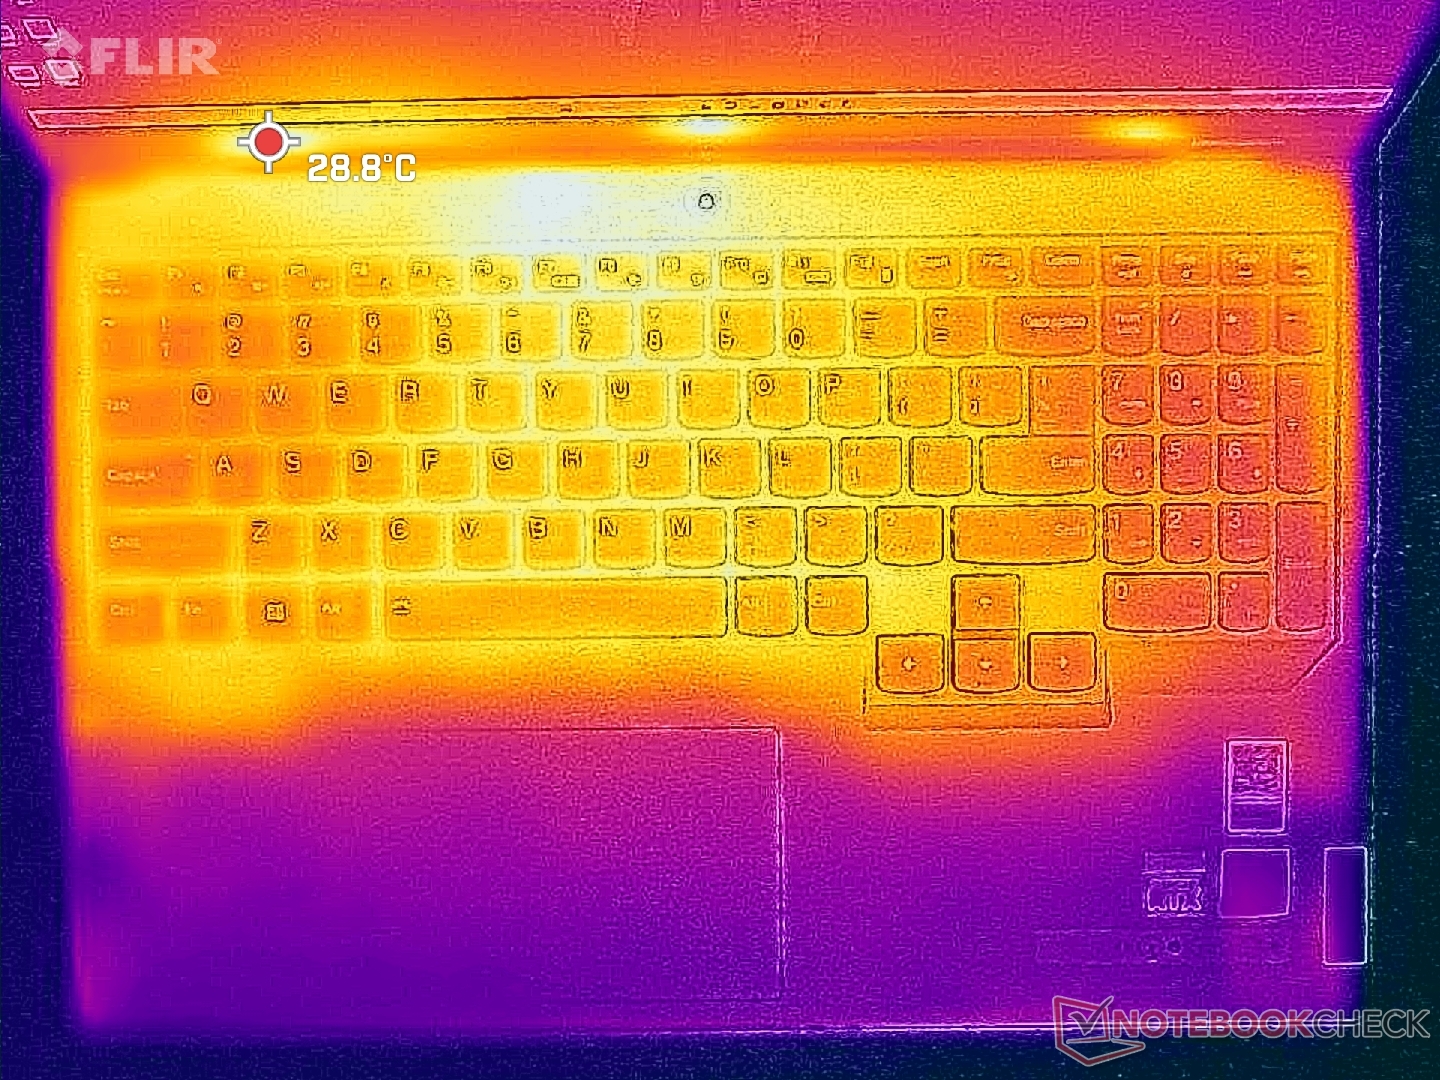
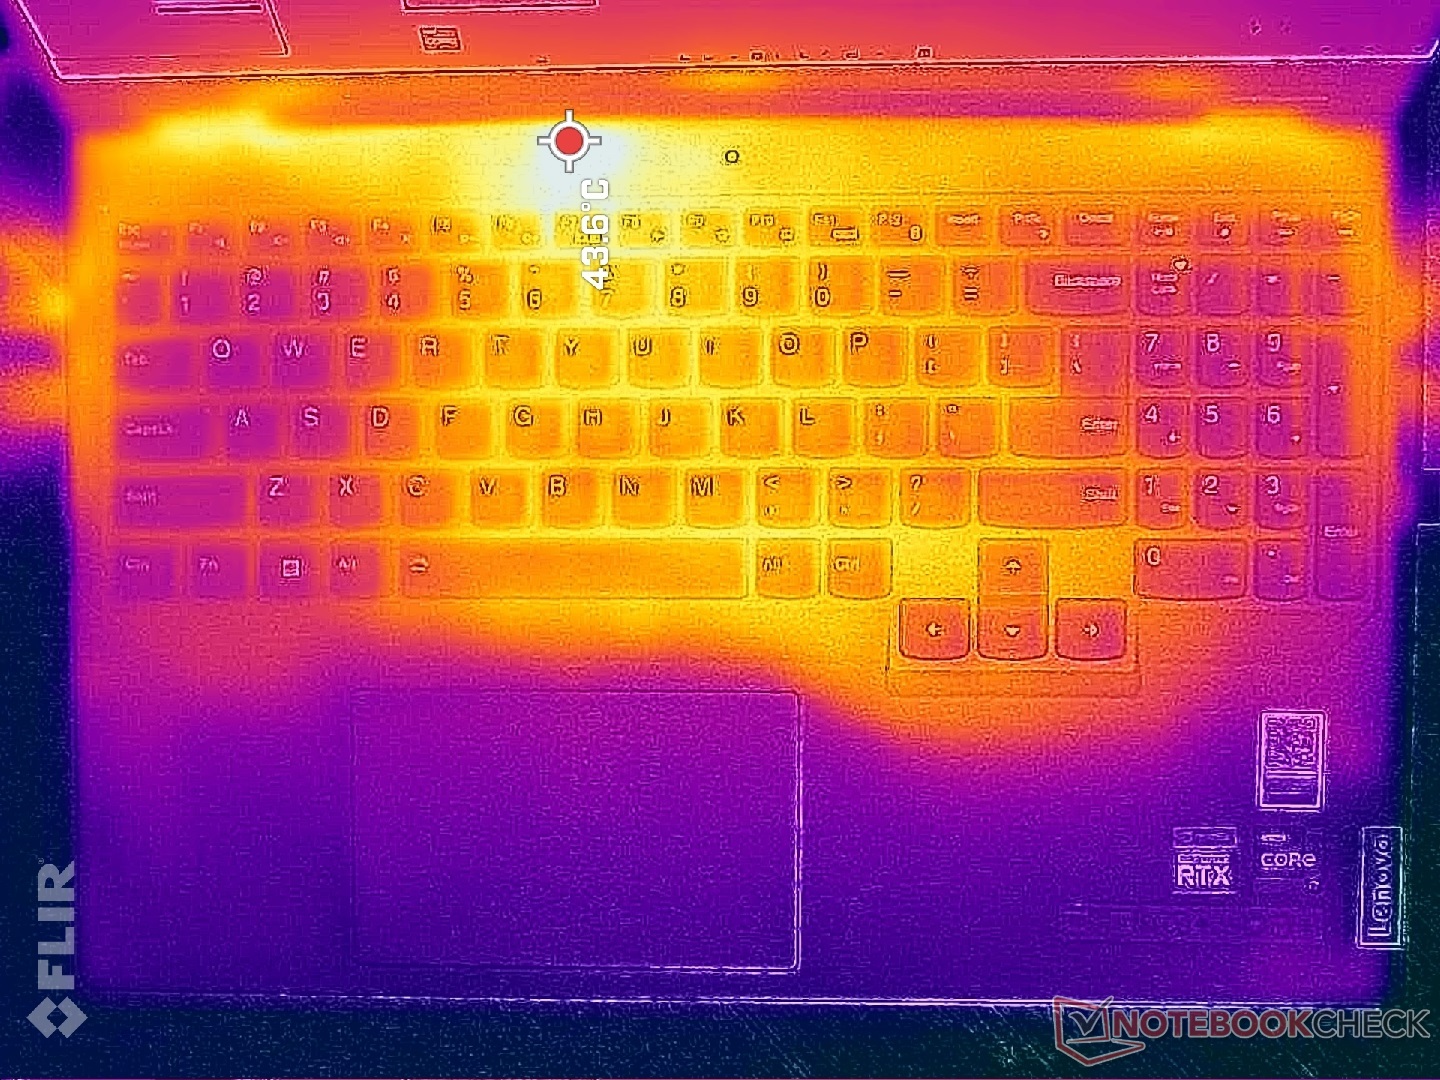
De zijkanten van het toetsenbord zijn over het algemeen enkele graden koeler dan het midden, omdat de ventilatoren er direct onder zijn geplaatst, zoals blijkt uit de onderstaande temperatuurkaarten. Palmen en vingers zullen daarom minder snel oncomfortabel zijn tijdens het gamen.
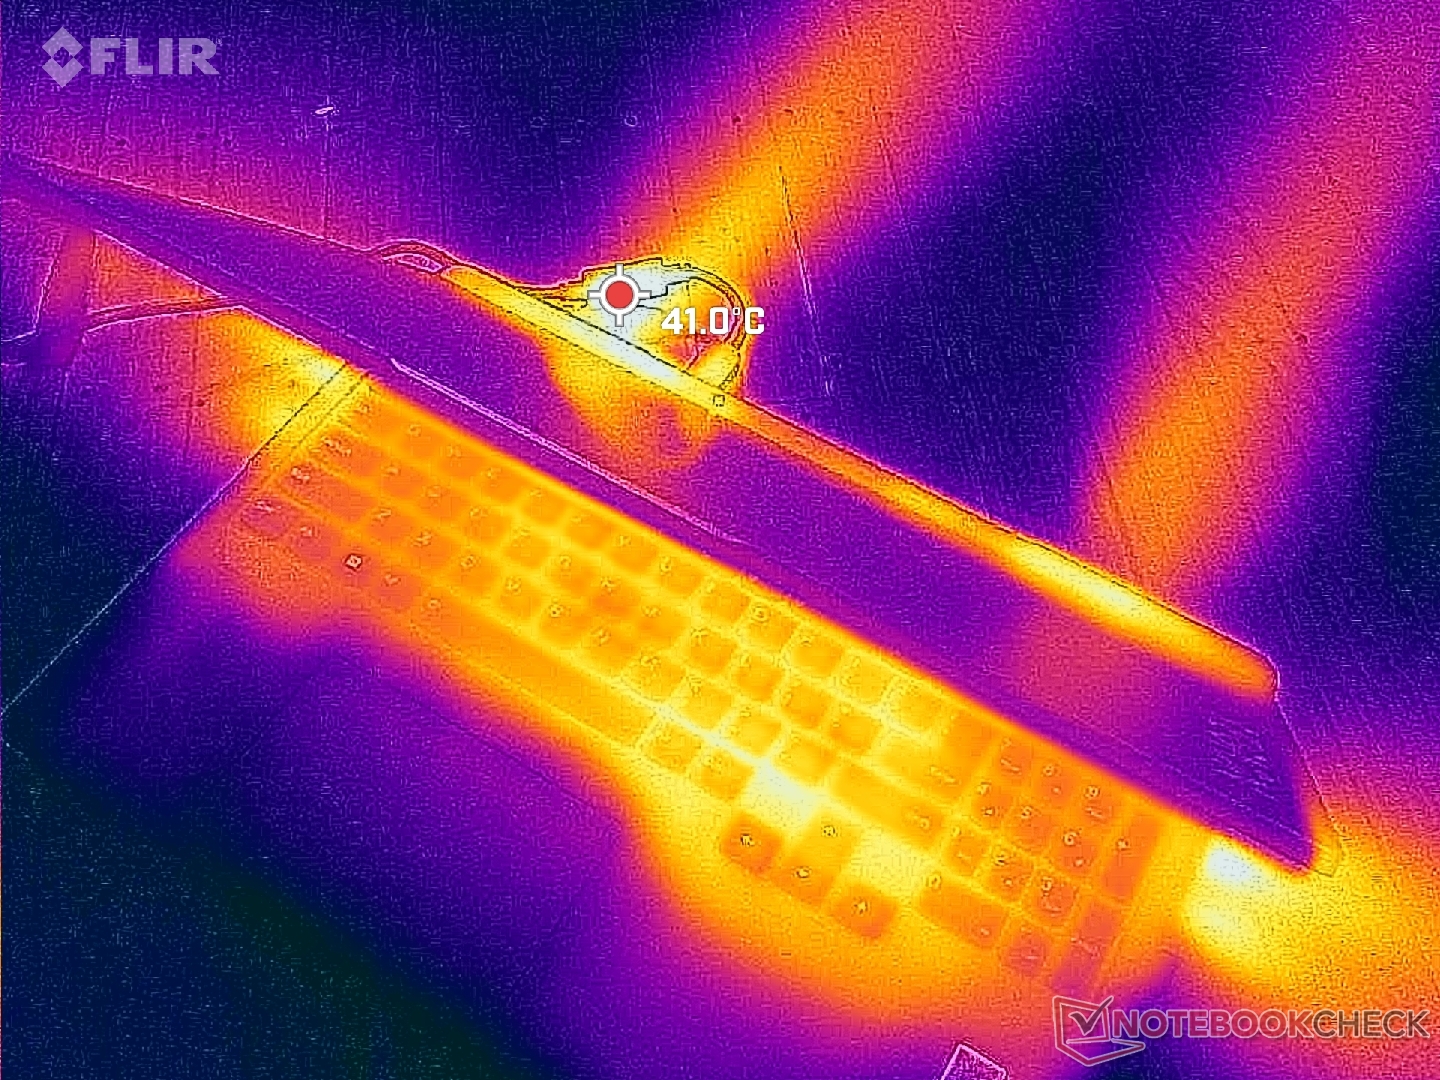
(±) De maximumtemperatuur aan de bovenzijde bedraagt 42.8 °C / 109 F, vergeleken met het gemiddelde van 40.4 °C / 105 F, variërend van 21.2 tot 68.8 °C voor de klasse Gaming.
(-) De bodem warmt op tot een maximum van 50 °C / 122 F, vergeleken met een gemiddelde van 43.2 °C / 110 F
(+) Bij onbelast gebruik bedraagt de gemiddelde temperatuur voor de bovenzijde 27.2 °C / 81 F, vergeleken met het apparaatgemiddelde van 33.9 °C / 93 F.
(±) Bij het spelen van The Witcher 3 is de gemiddelde temperatuur voor de bovenzijde 32.4 °C / 90 F, vergeleken met het apparaatgemiddelde van 33.9 °C / 93 F.
(+) De palmsteunen en het touchpad zijn met een maximum van ###max## °C / 79.2 F koeler dan de huidtemperatuur en voelen daarom koel aan.
(+) De gemiddelde temperatuur van de handpalmsteun van soortgelijke toestellen bedroeg 28.8 °C / 83.8 F (+2.6 °C / 4.6 F).
| Lenovo Legion Pro 5 16IRX8 Intel Core i7-13700HX, NVIDIA GeForce RTX 4060 Laptop GPU | Asus ROG Zephyrus M16 GU603Z Intel Core i9-12900H, NVIDIA GeForce RTX 3070 Ti Laptop GPU | Razer Blade 16 Early 2023 Intel Core i9-13950HX, NVIDIA GeForce RTX 4080 Laptop GPU | Lenovo Legion Pro 7 16IRX8H Intel Core i9-13900HX, NVIDIA GeForce RTX 4080 Laptop GPU | Lenovo Legion 5 Pro 16ARH7H RTX 3070 Ti AMD Ryzen 7 6800H, NVIDIA GeForce RTX 3070 Ti Laptop GPU | Lenovo Legion S7 16ARHA7 AMD Ryzen 9 6900HX, AMD Radeon RX 6800S | |
|---|---|---|---|---|---|---|
| Heat | -5% | 8% | -11% | -1% | 5% | |
| Maximum Upper Side * (°C) | 42.8 | 52 -21% | 40 7% | 48 -12% | 43.8 -2% | 46.6 -9% |
| Maximum Bottom * (°C) | 50 | 51 -2% | 37.6 25% | 49 2% | 53 -6% | 50.8 -2% |
| Idle Upper Side * (°C) | 29.6 | 29 2% | 32.4 -9% | 40 -35% | 30 -1% | 26.4 11% |
| Idle Bottom * (°C) | 34 | 33 3% | 31.4 8% | 33 3% | 31.8 6% | 27.2 20% |
* ... kleiner is beter
Stresstest
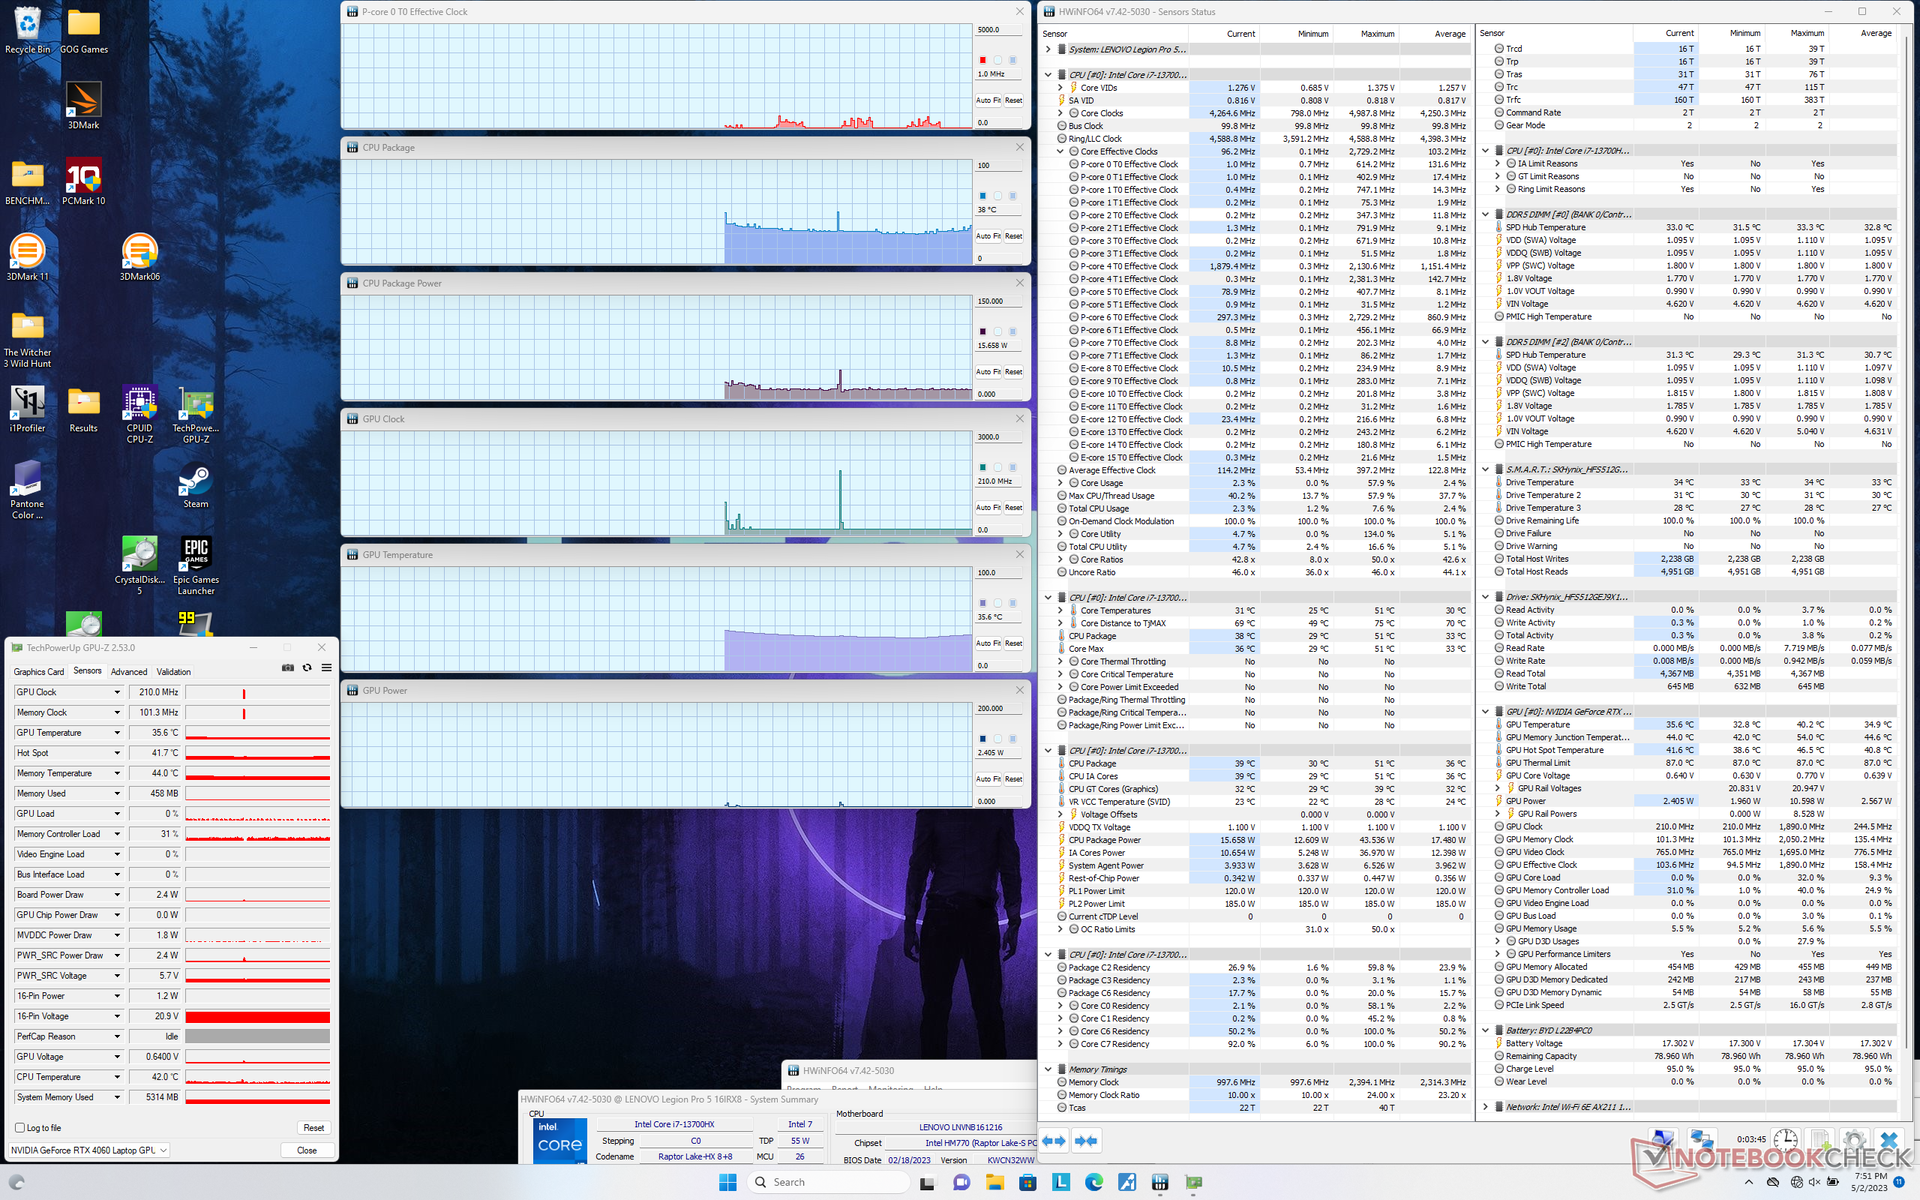
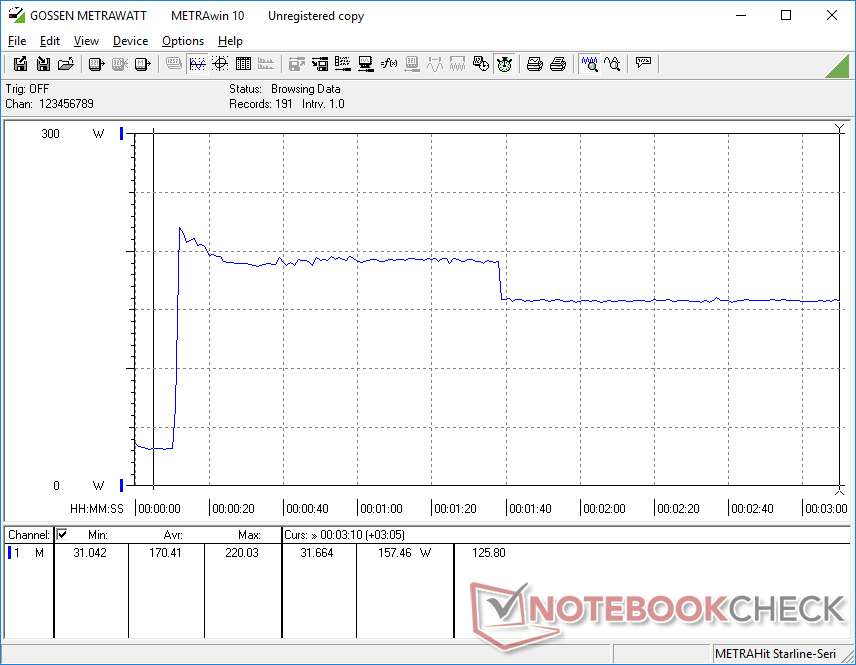
Bij belasting onder Prime95 steeg de CPU tot 4,3 GHz, 157 W en 97 C gedurende ongeveer een minuut. Daarna daalden de kloksnelheden en het opgenomen vermogen tot respectievelijk 3,3 tot 3,6 GHz en 117 W, om een koelere kerntemperatuur van 81 C te handhaven. Maximale Turbo Boost is dus niet duurzaam voor langere perioden. Door deze test te herhalen op de tragere AMD-aangedreven Legion Pro 5 16 zou resulteren in een warmere CPU-temperatuur van 93 C.
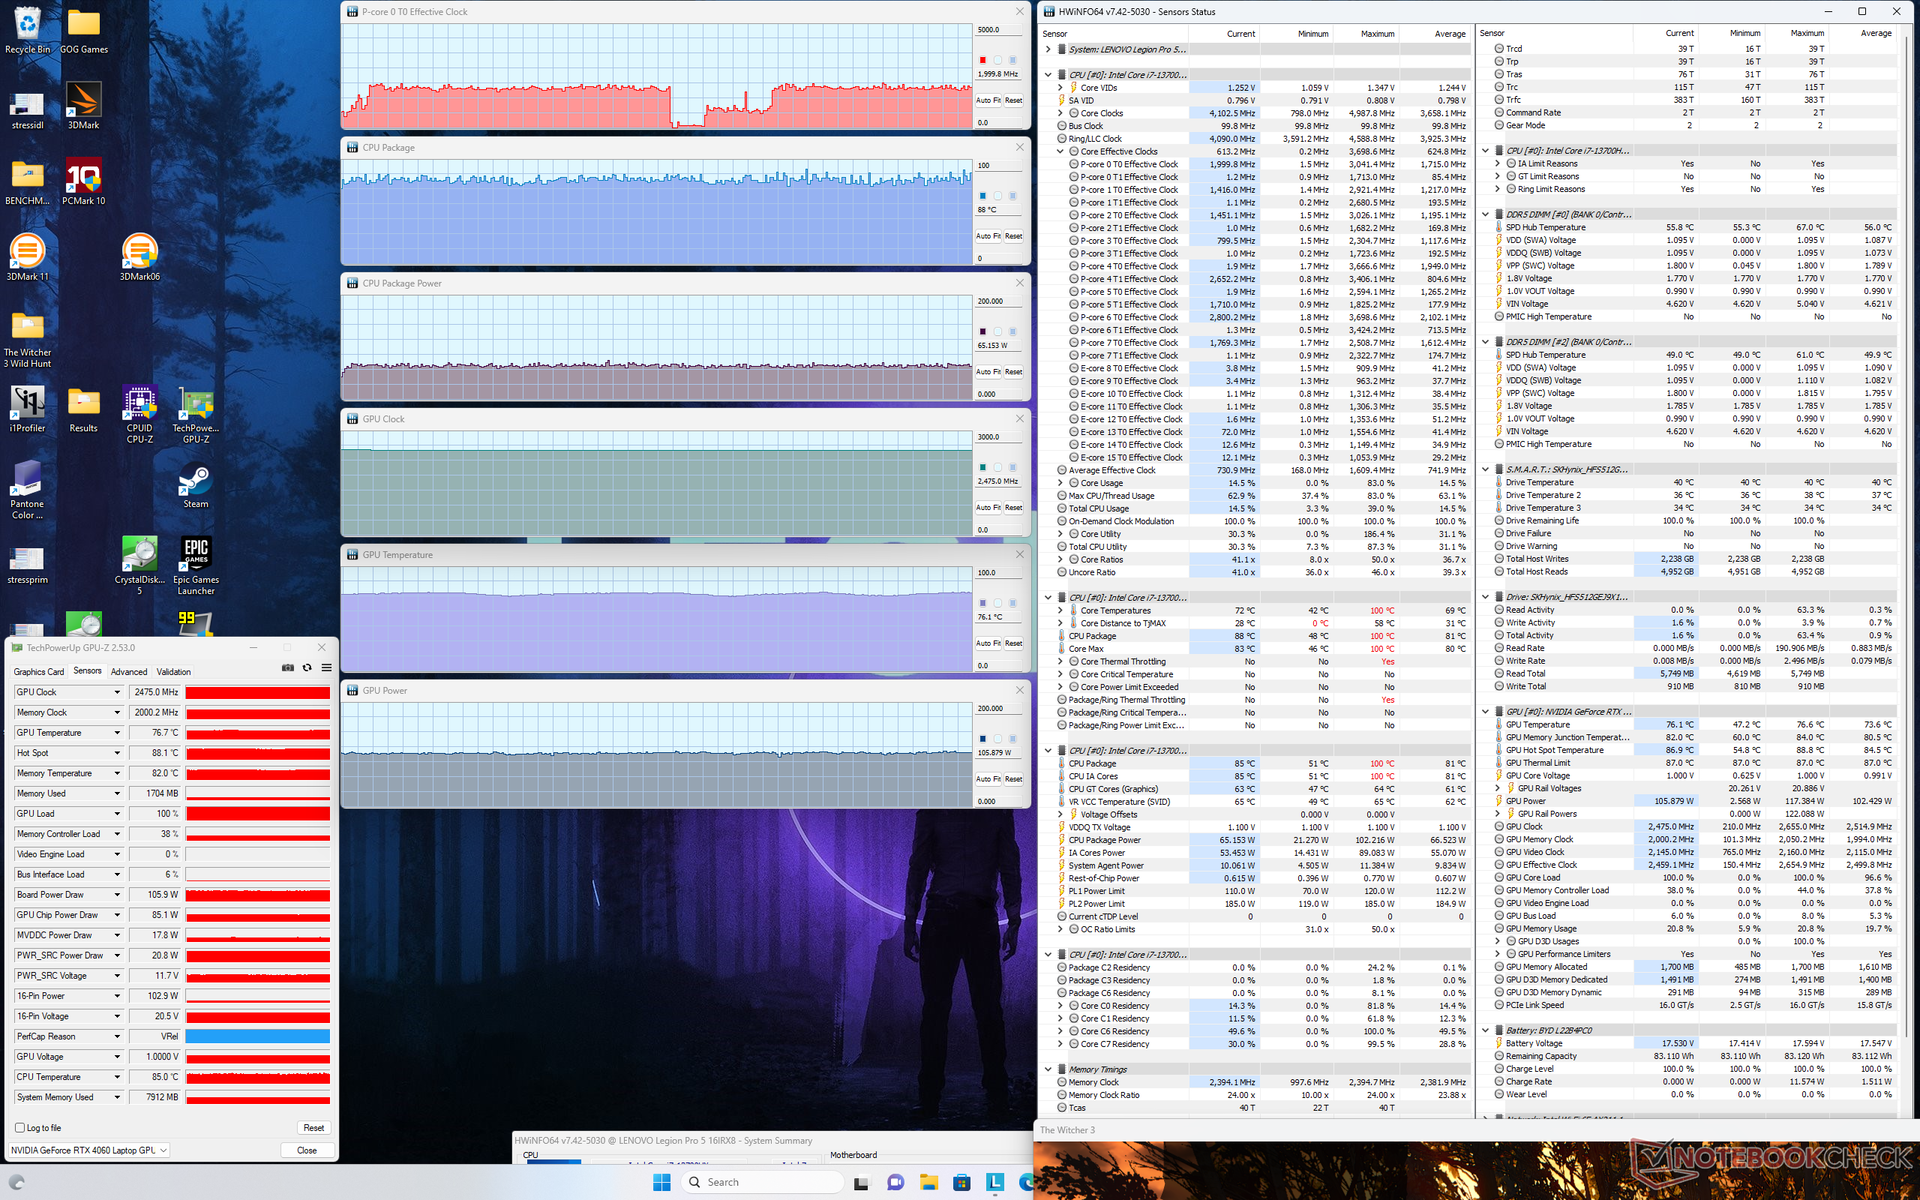
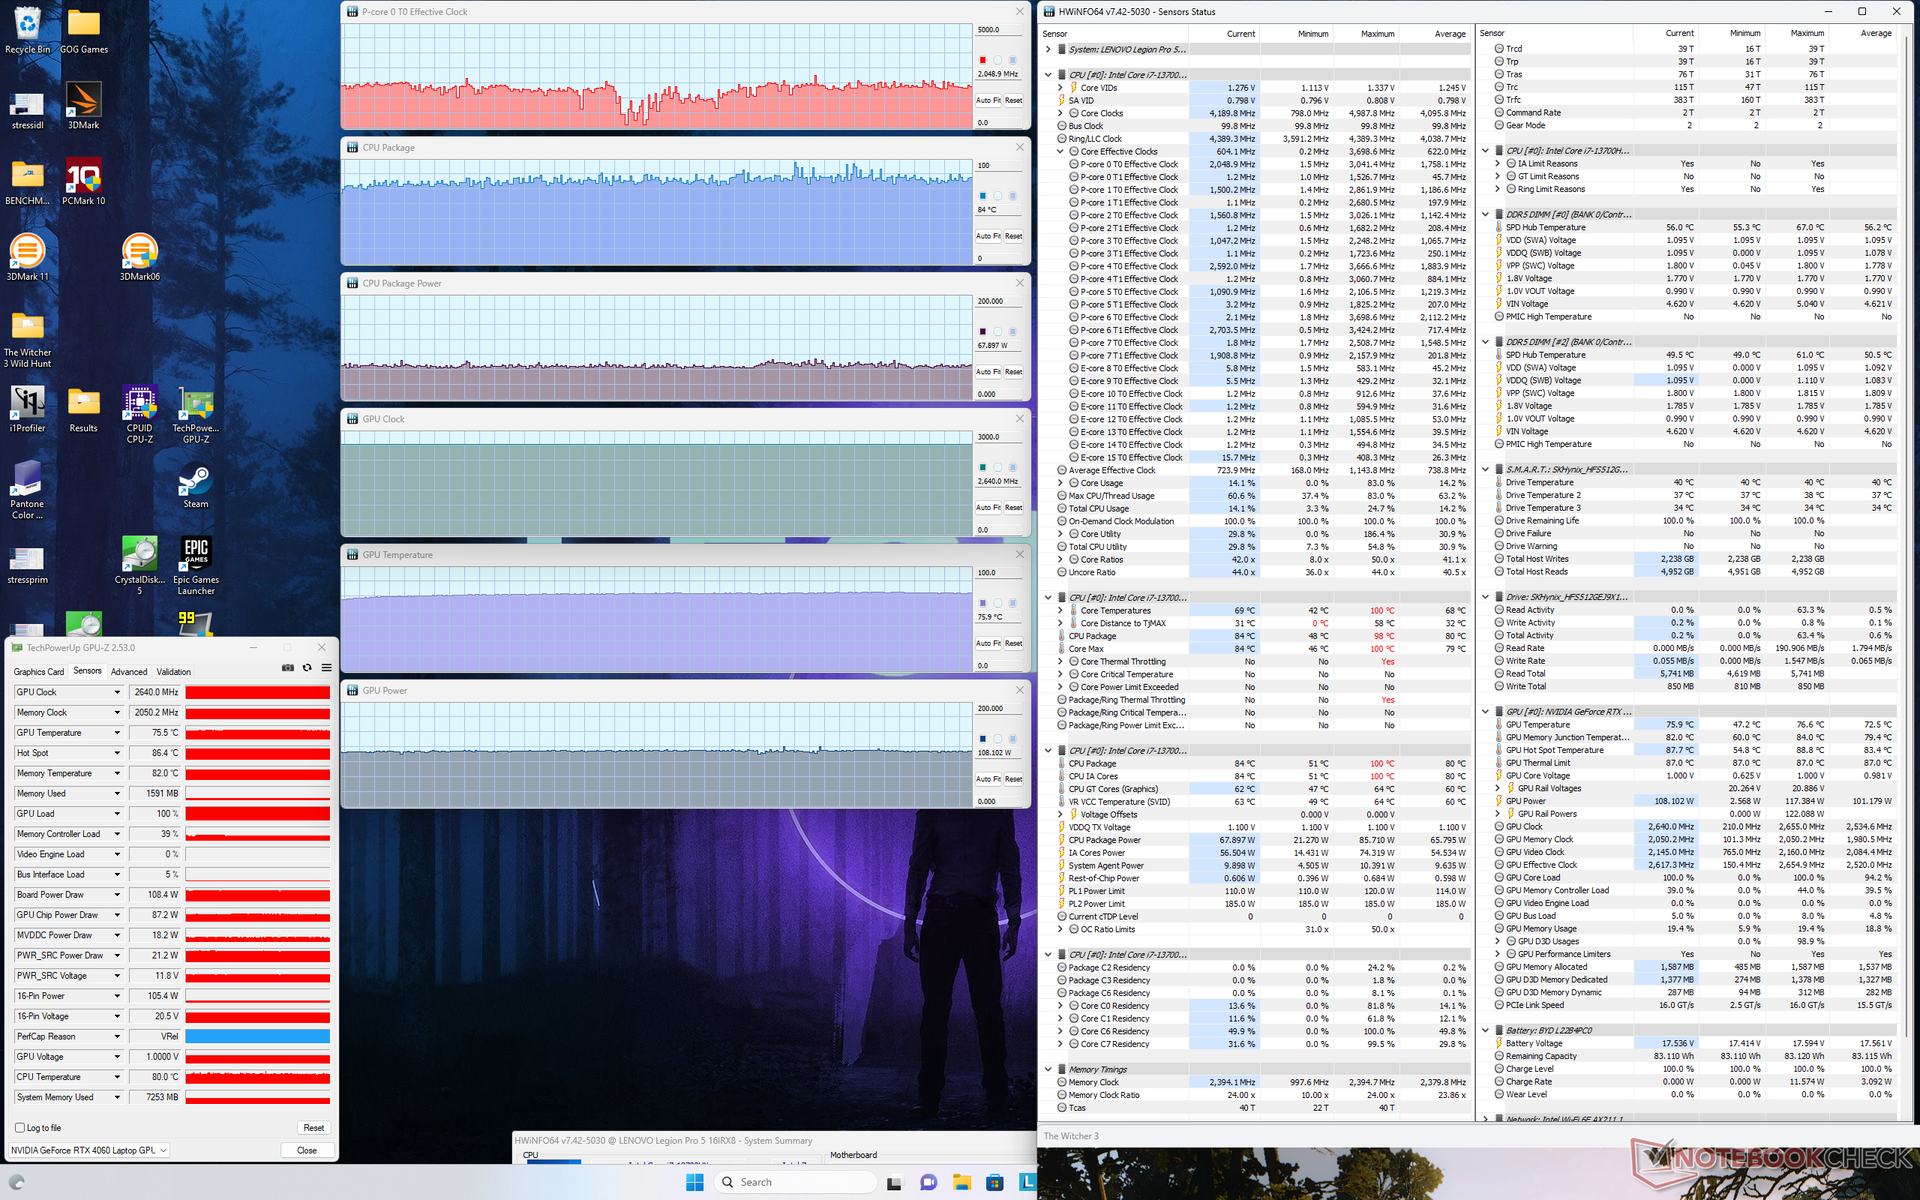
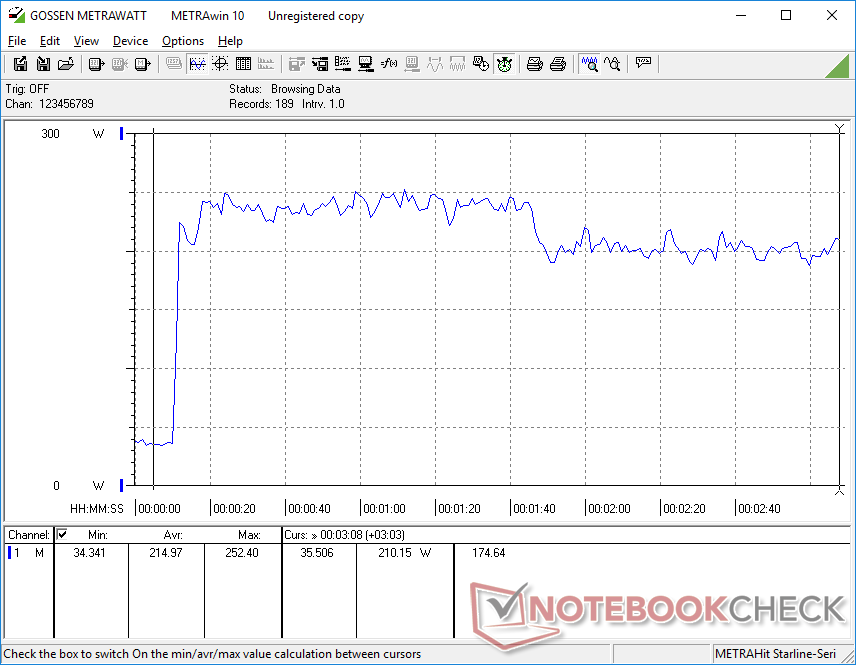
Bij het draaien Witcher 3in de modus Prestaties om typische gamingbelastingen weer te geven, zou onze RTX 4060 GPU zich stabiliseren op 2640 MHz klok, 2050 MHz RAM, 76 C en 109 W, wat duidelijk lager is dan de opgegeven 140 W op het Nvidia Control Panel. In de gebalanceerde modus zou de GPU iets dalen tot 2475 MHz klok, 2000 MHz RAM en 105 W stroomverbruik terwijl de kerntemperatuur hetzelfde zou blijven. U zult het systeem dus op Performance-modus willen zetten om de GPU volledig te benutten. De kerntemperatuur is ongeveer 10 C koeler dan bij het model van vorig jaar met de RTX 3070 Ti, omdat deze laatste een hoger energieverbruik van 149 W zou bereiken.
Werken op batterijen beperkt de prestaties, zoals te verwachten was. Een Fire Strike test op batterijen zou Physics en Graphics scores van respectievelijk 21363 en 12851 punten opleveren, vergeleken met 35270 en 26561 punten wanneer op netstroom.
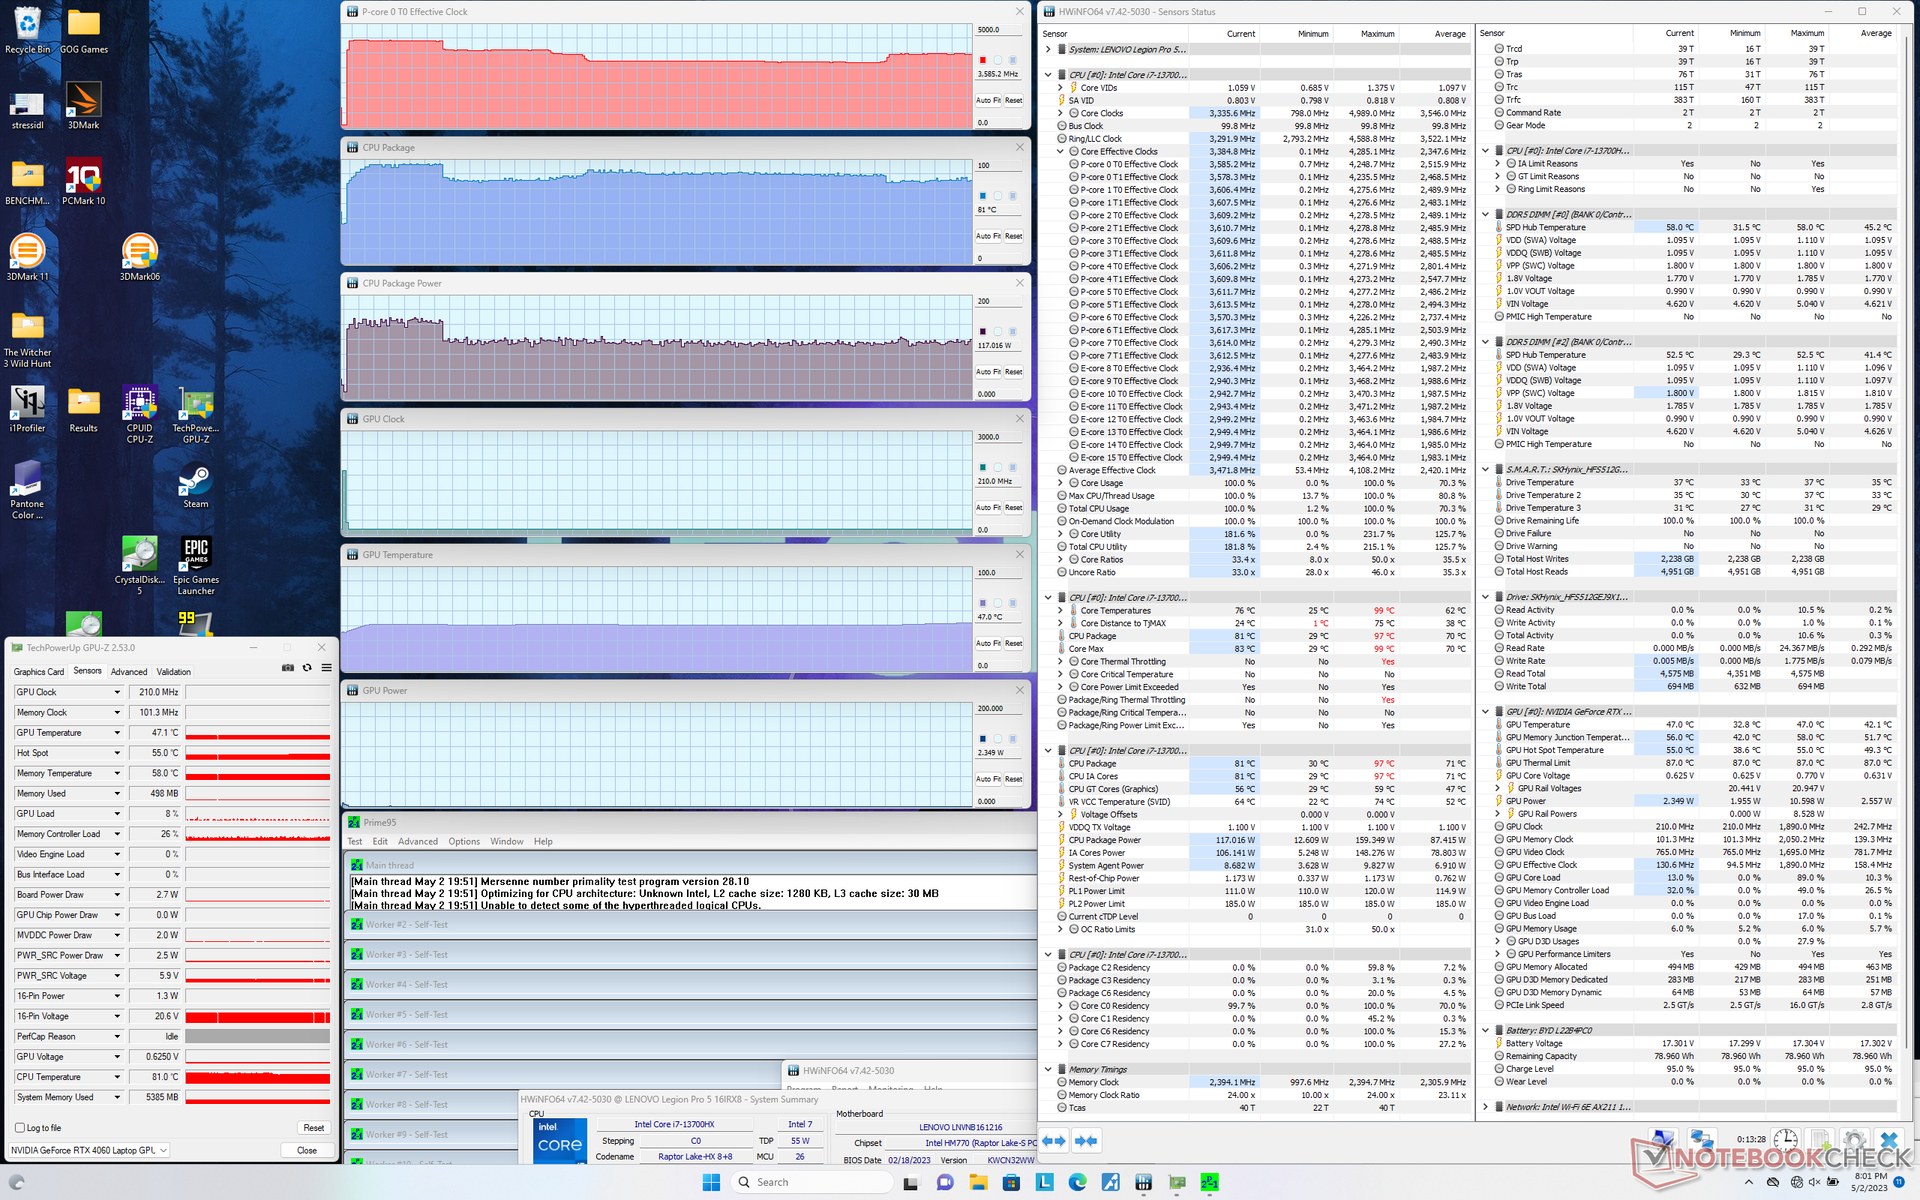
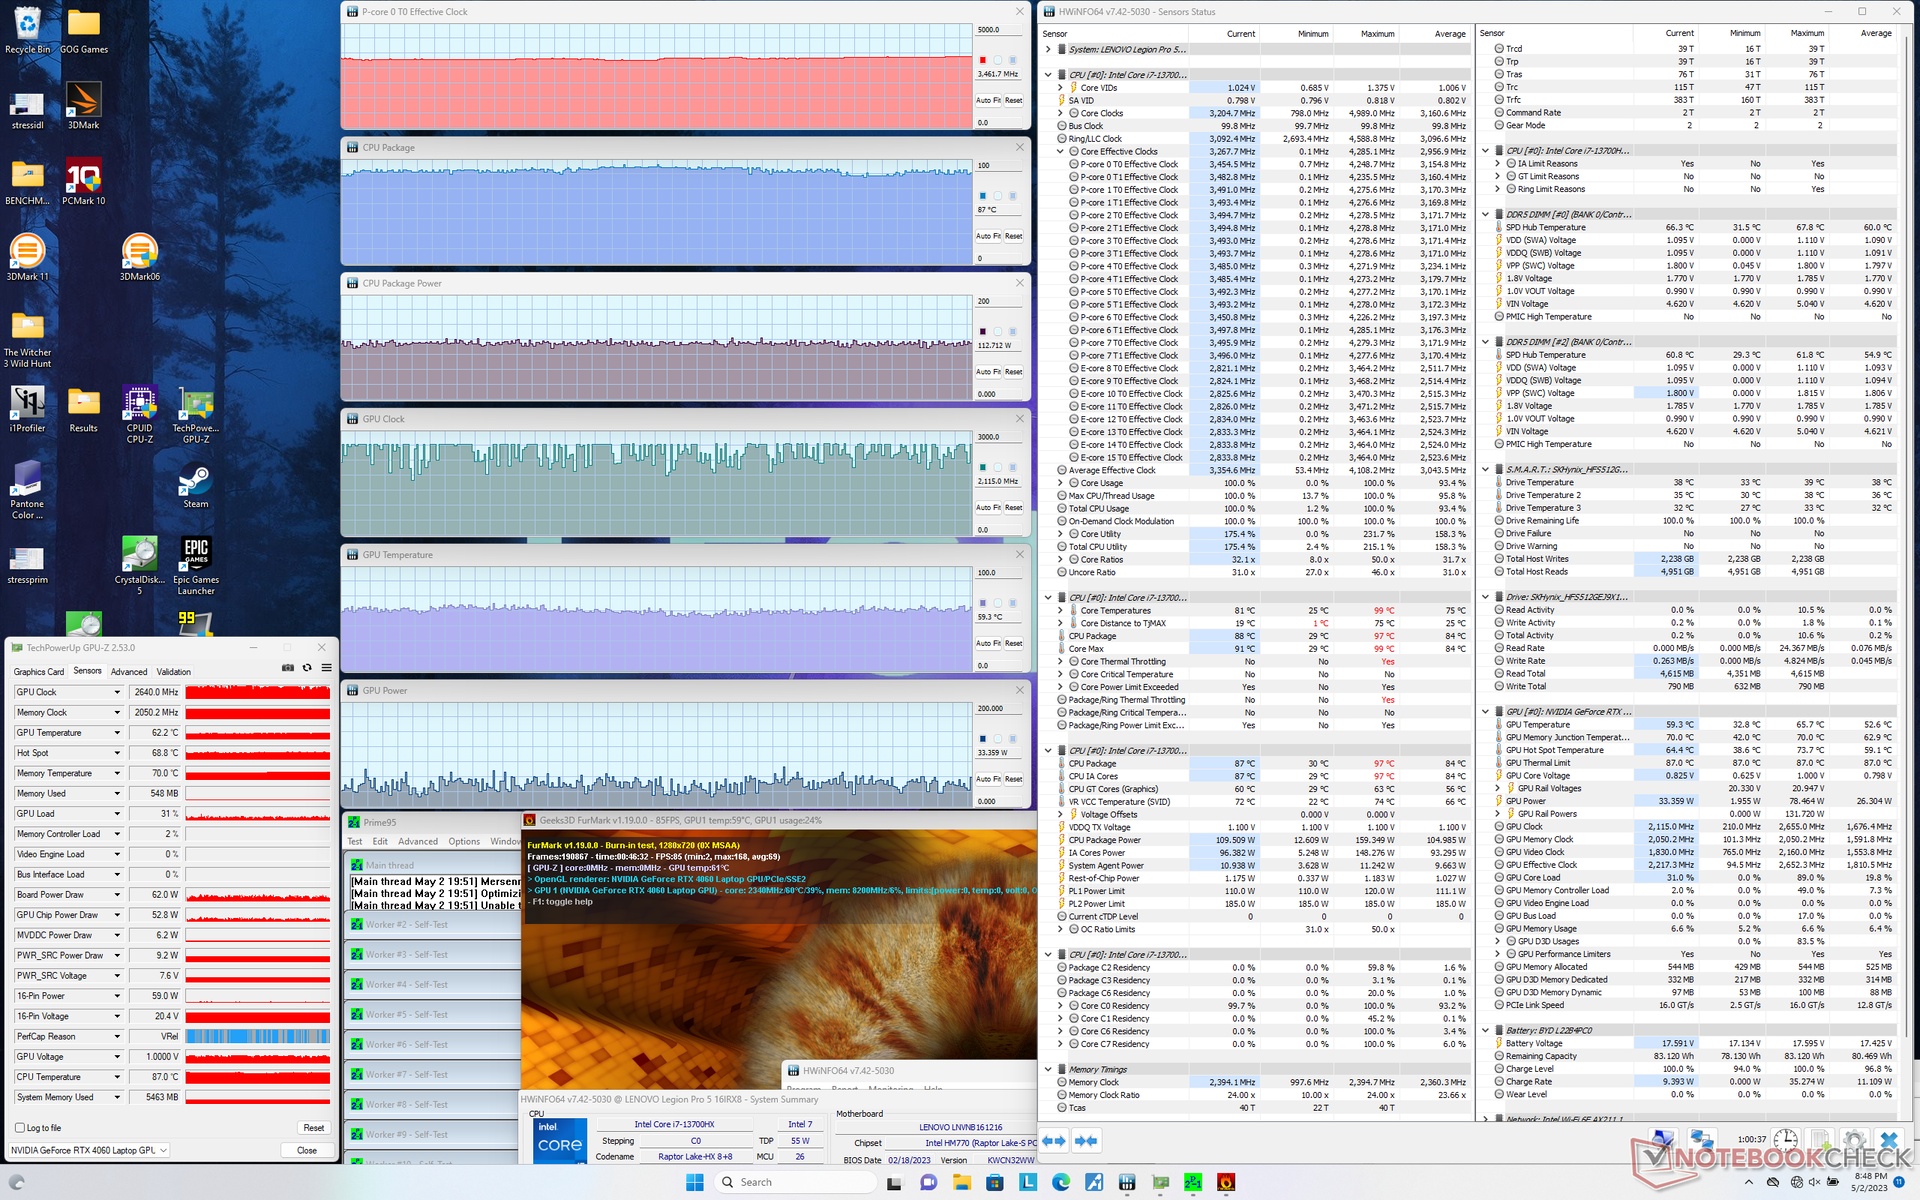
| CPU-klok (GHz) | GPU-klok (MHz) | Gemiddelde CPU-temperatuur (°C) | Gemiddelde GPU-temperatuur (°C) | |
| Systeem Idle | -- | -- | 37 | 36 |
| Prime95 Stress | 3.3 - 3.6 | -- | 81 - 86 | 47 |
| Prime95 + FurMark Stress | 3.5 | 1714 - 2640 | 87 | 59 |
| Witcher 3 Stress (evenwichtige modus) | ~2.0 | 2475 | 88 | 76 |
| Witcher 3 Stress (prestatiemodus) | ~2.0 | 2640 | 84 | 76 |
Luidsprekers
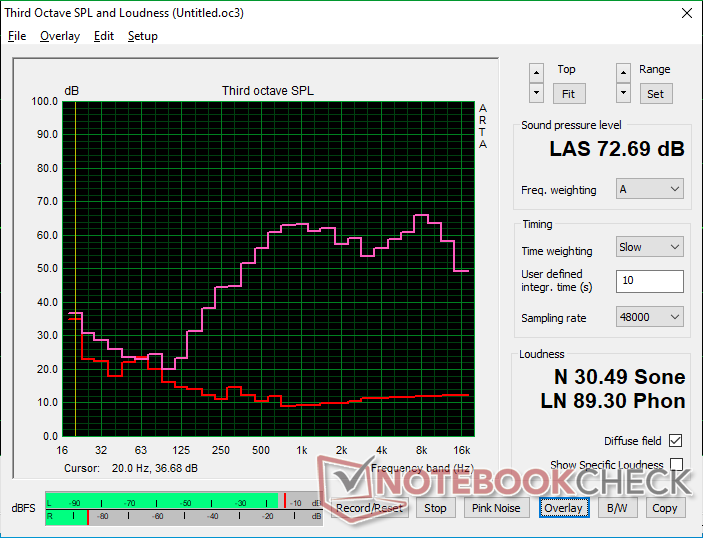
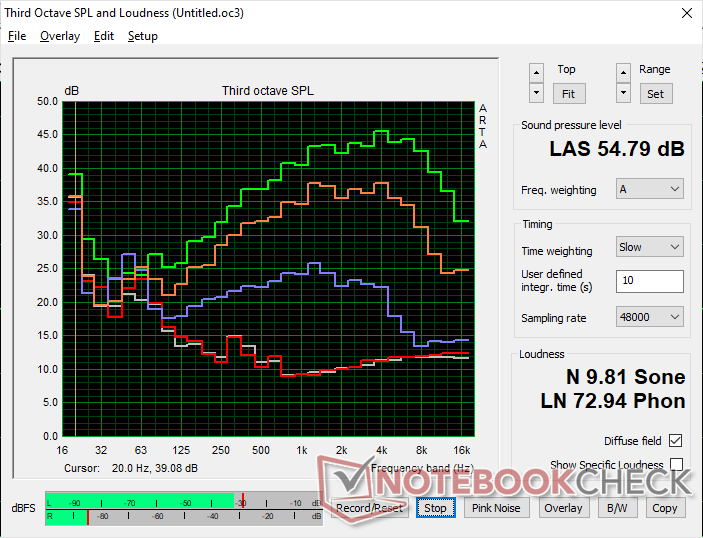
Lenovo Legion Pro 5 16IRX8 audioanalyse
(±) | luidspreker luidheid is gemiddeld maar goed (72.7 dB)
Bas 100 - 315 Hz
(-) | bijna geen lage tonen - gemiddeld 23.7% lager dan de mediaan
(±) | lineariteit van de lage tonen is gemiddeld (10.7% delta ten opzichte van de vorige frequentie)
Midden 400 - 2000 Hz
(+) | evenwichtige middens - slechts 3.8% verwijderd van de mediaan
(±) | lineariteit van de middentonen is gemiddeld (7.1% delta ten opzichte van de vorige frequentie)
Hoog 2 - 16 kHz
(+) | evenwichtige hoogtepunten - slechts 3.7% verwijderd van de mediaan
(+) | de hoge tonen zijn lineair (6.7% delta naar de vorige frequentie)
Algemeen 100 - 16.000 Hz
(±) | lineariteit van het totale geluid is gemiddeld (21.9% verschil met de mediaan)
Vergeleken met dezelfde klasse
» 79% van alle geteste apparaten in deze klasse waren beter, 6% vergelijkbaar, 16% slechter
» De beste had een delta van 6%, het gemiddelde was 18%, de slechtste was 132%
Vergeleken met alle geteste toestellen
» 63% van alle geteste apparaten waren beter, 7% gelijk, 30% slechter
» De beste had een delta van 4%, het gemiddelde was 23%, de slechtste was 134%
Apple MacBook Pro 16 2021 M1 Pro audioanalyse
(+) | luidsprekers kunnen relatief luid spelen (84.7 dB)
Bas 100 - 315 Hz
(+) | goede baars - slechts 3.8% verwijderd van de mediaan
(+) | de lage tonen zijn lineair (5.2% delta naar de vorige frequentie)
Midden 400 - 2000 Hz
(+) | evenwichtige middens - slechts 1.3% verwijderd van de mediaan
(+) | de middentonen zijn lineair (2.1% delta ten opzichte van de vorige frequentie)
Hoog 2 - 16 kHz
(+) | evenwichtige hoogtepunten - slechts 1.9% verwijderd van de mediaan
(+) | de hoge tonen zijn lineair (2.7% delta naar de vorige frequentie)
Algemeen 100 - 16.000 Hz
(+) | het totale geluid is lineair (4.6% verschil met de mediaan)
Vergeleken met dezelfde klasse
» 0% van alle geteste apparaten in deze klasse waren beter, 0% vergelijkbaar, 100% slechter
» De beste had een delta van 5%, het gemiddelde was 17%, de slechtste was 45%
Vergeleken met alle geteste toestellen
» 0% van alle geteste apparaten waren beter, 0% gelijk, 100% slechter
» De beste had een delta van 4%, het gemiddelde was 23%, de slechtste was 134%
Energiebeheer
Stroomverbruik - net zo veeleisend als voorheen
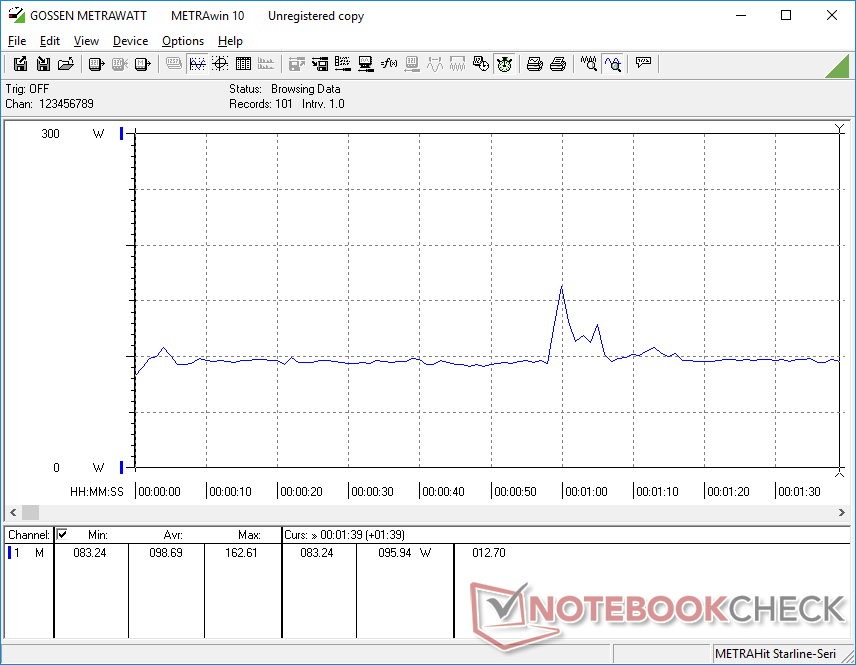
Het systeem is ongewoon veeleisend bij stationair draaien op de desktop, waar we een minimum van 24 W kunnen meten, vergeleken met slechts 10 W tot 15 W bij alternatieven zoals de ROG Zephyrus M16 of Blade 16. We hebben er zelfs voor gezorgd dat het systeem in Power Saver modus werd gezet met de iGPU actief en op de minimale helderheidsinstelling, maar de resultaten zouden niet verbeteren. Het relatief hoge verbruik kan deels verantwoordelijk zijn voor de korter dan verwachte batterijduur, zoals opgemerkt in de volgende sectie.
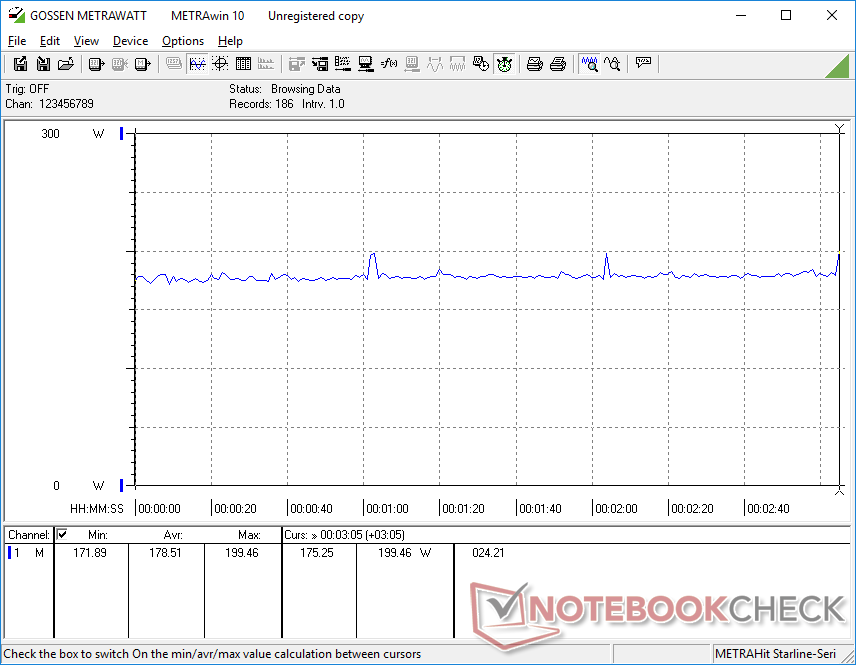
Het draaien van Witcher 3 zou 179 W trekken in vergelijking met 209 W op de Legion 5 Pro 16 van vorig jaar met de RTX 3070 Ti. Die specifieke GPU is ongeveer 15 tot 20 procent sneller dan onze RTX 4060 en met een hogere TGP-doelstelling zoals eerder vermeld, wat correleert met zijn 15 procent hogere stroomverbruik. Performance-per-watt blijft daardoor van jaar tot jaar relatief lineair.
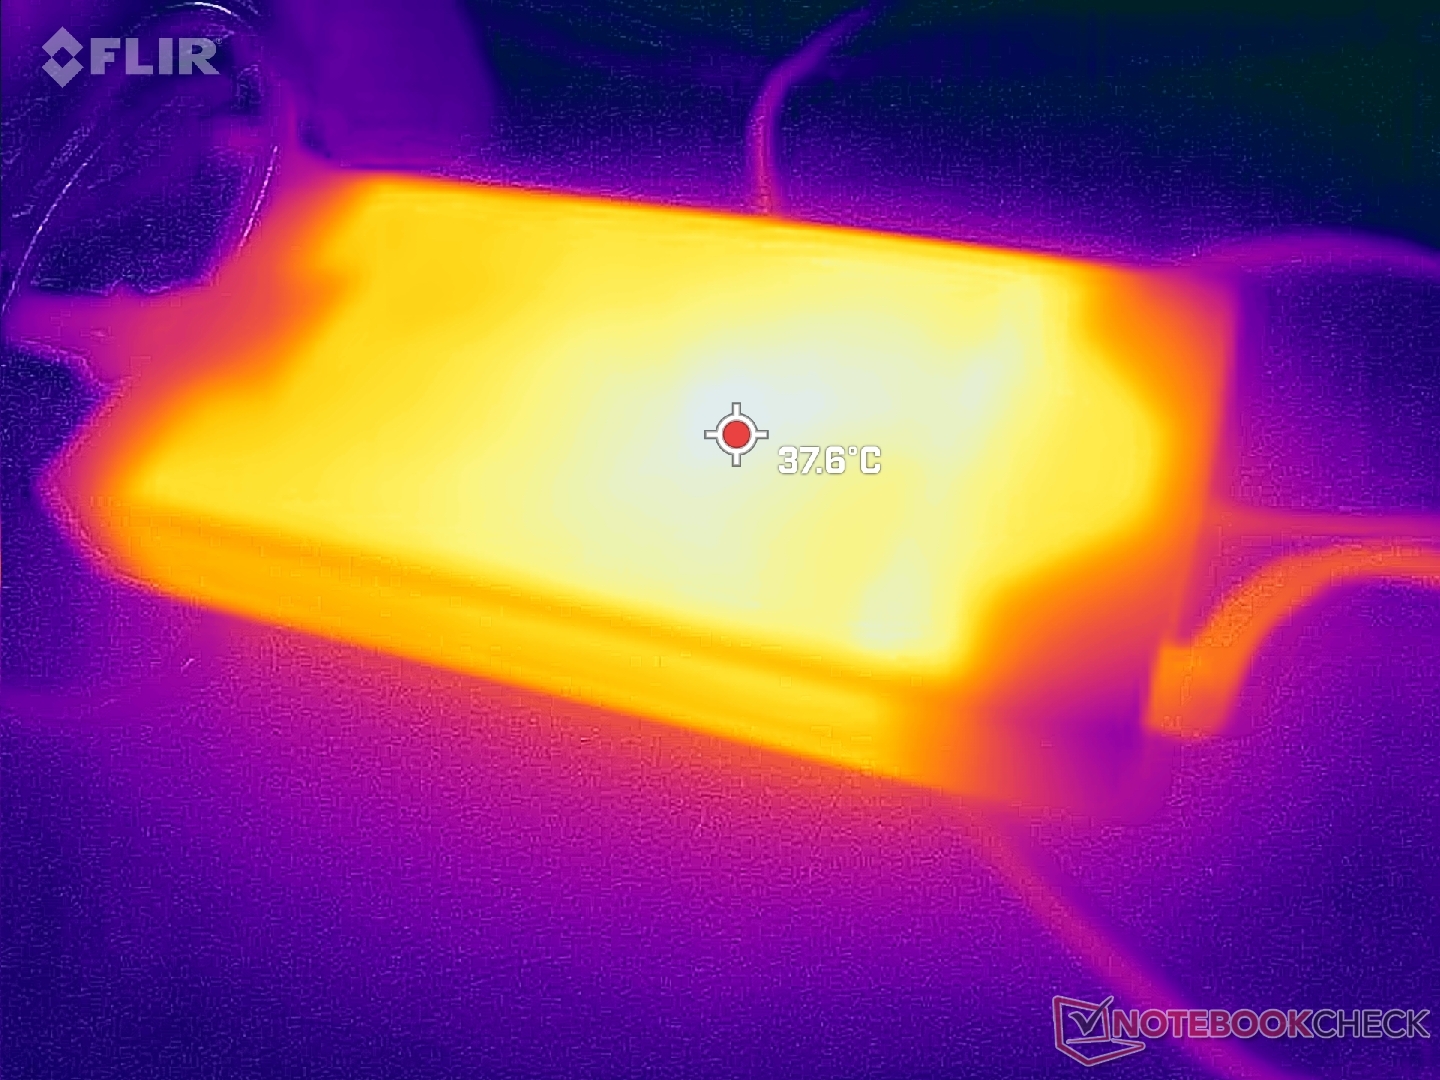
We meten een maximaal stroomverbruik van 250 W uit de grote (~19,9 x 9,9 x 2,6 cm) 300 W AC adapter wanneer zowel de CPU als de GPU op 100 procent gebruik staan. Lenovo gebruikt deze zelfde 300 W adapter ook voor veel van zijn andere Legion modellen.
| Uit / Standby | |
| Inactief | |
| Belasting |
|
Key:
min: | |
| Lenovo Legion Pro 5 16IRX8 i7-13700HX, GeForce RTX 4060 Laptop GPU, SK hynix PC801 HFS512GEJ9X115N, IPS, 2560x1600, 16" | Asus ROG Zephyrus M16 GU603Z i9-12900H, GeForce RTX 3070 Ti Laptop GPU, Micron 3400 1TB MTFDKBA1T0TFH, IPS, 2560x1600, 16" | Razer Blade 16 Early 2023 i9-13950HX, GeForce RTX 4080 Laptop GPU, SSSTC CA6-8D1024, IPS, 2560x1600, 16" | Lenovo Legion Pro 7 16IRX8H i9-13900HX, GeForce RTX 4080 Laptop GPU, Samsung PM9A1 MZVL21T0HCLR, IPS, 2560x1600, 16" | Lenovo Legion 5 Pro 16ARH7H RTX 3070 Ti R7 6800H, GeForce RTX 3070 Ti Laptop GPU, Samsung PM9A1 MZVL21T0HCLR, IPS, 2560x1600, 16" | Lenovo Legion S7 16ARHA7 R9 6900HX, Radeon RX 6800S, SK Hynix HFS001TEJ9X115N, IPS, 2560x1600, 16" | |
|---|---|---|---|---|---|---|
| Power Consumption | 27% | -9% | -9% | 10% | 31% | |
| Idle Minimum * (Watt) | 24.5 | 10.8 56% | 15.2 38% | 18 27% | 9.7 60% | 8.8 64% |
| Idle Average * (Watt) | 29.2 | 17 42% | 22.8 22% | 24 18% | 14.8 49% | 14.7 50% |
| Idle Maximum * (Watt) | 34.3 | 17.8 48% | 49.8 -45% | 32 7% | 45.8 -34% | 19.8 42% |
| Load Average * (Watt) | 98.7 | 116 -18% | 121.2 -23% | 130 -32% | 87.2 12% | 85.3 14% |
| Witcher 3 ultra * (Watt) | 178.6 | 144 19% | 242 -35% | 260 -46% | 209 -17% | 167.5 6% |
| Load Maximum * (Watt) | 249.6 | 220 12% | 273.7 -10% | 320 -28% | 275.3 -10% | 230.7 8% |
* ... kleiner is beter
Power Consumption Witcher 3 / Stresstest
Power Consumption external Monitor
Batterijduur - korter dan andere gaming laptops
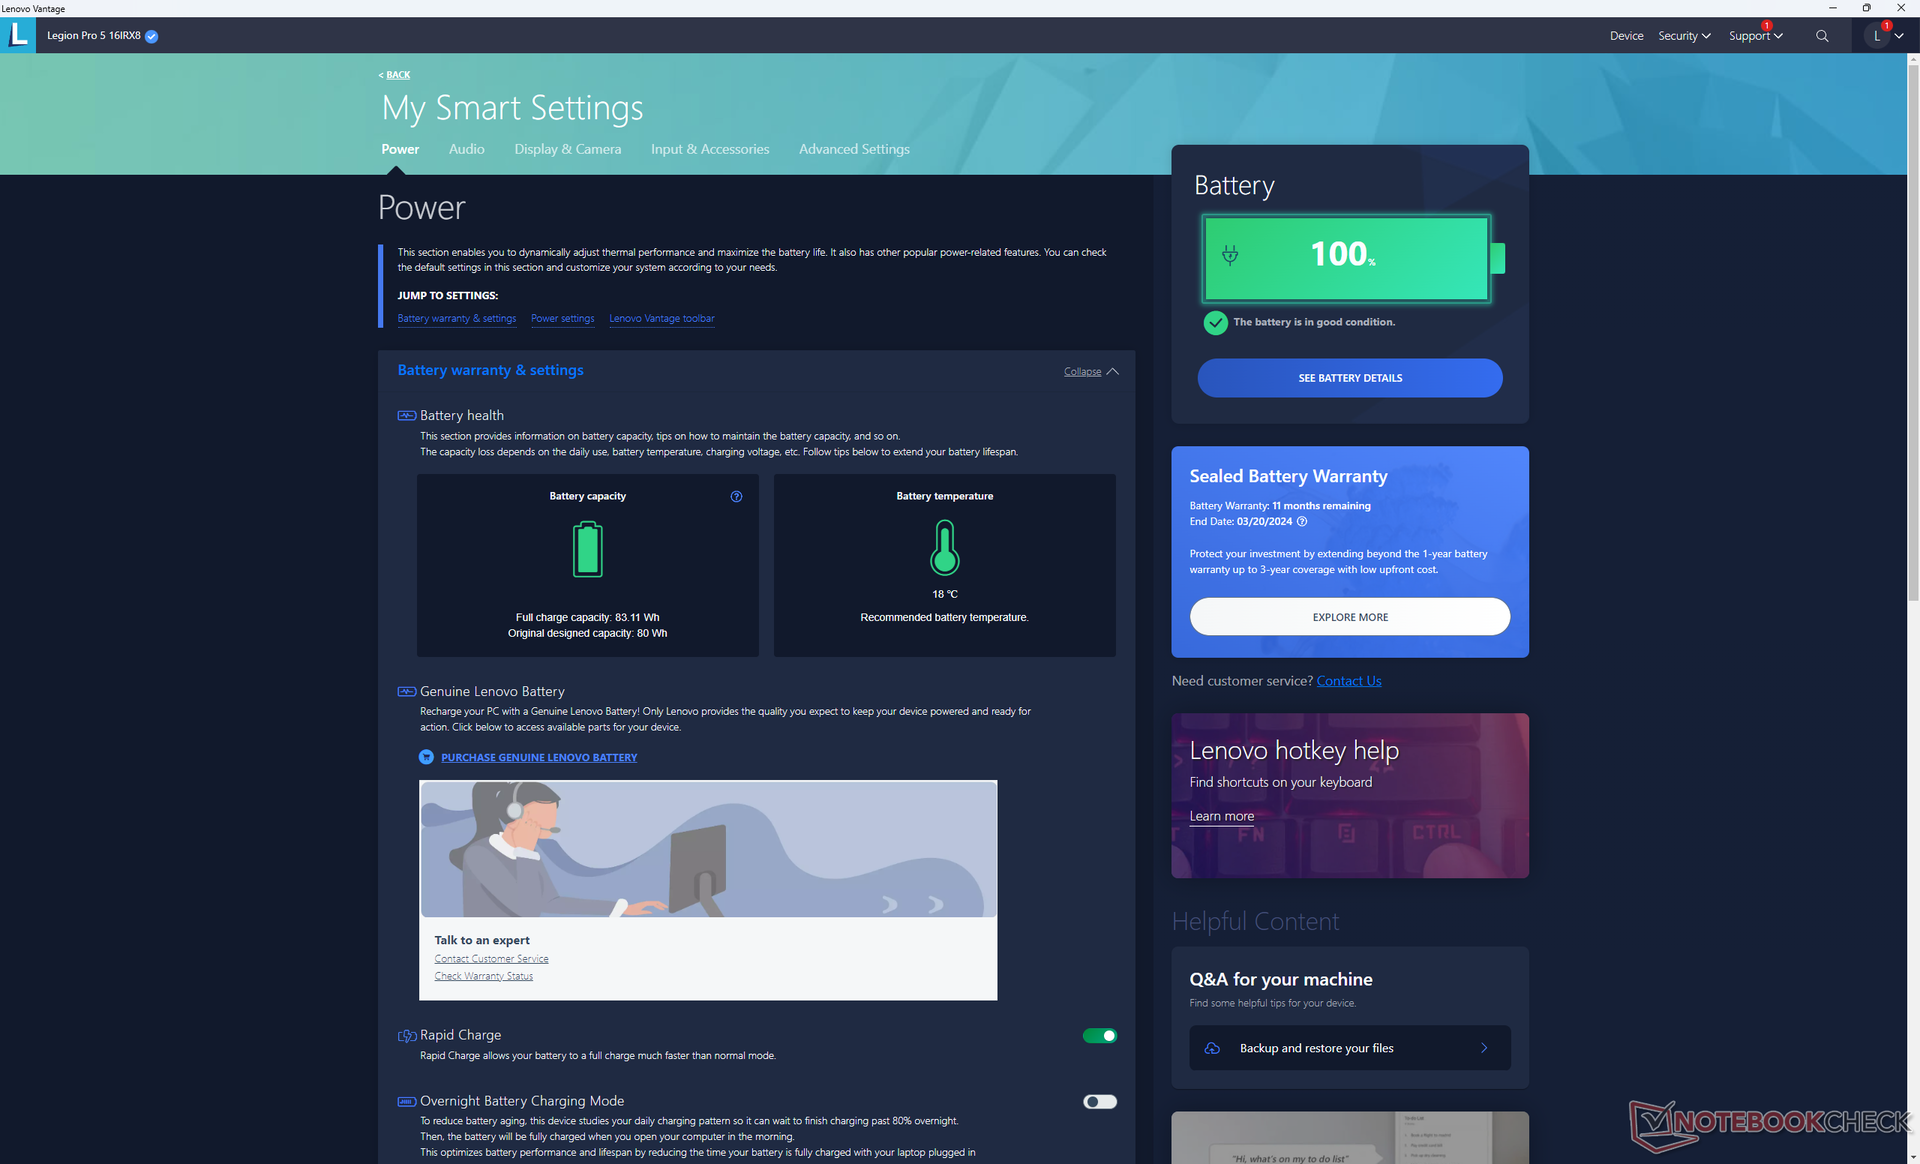
De batterijcapaciteit blijft 80 Wh in vergelijking met 99 Wh op de duurdere Legion 7 Pro serie. De looptijden zijn kort, wat een trend lijkt te zijn onder de Legion modellen; we zijn slechts in staat om een WLAN runtime van minder dan 3,5 uur te noteren, zelfs wanneer deze is ingesteld op iGPU en Balanced profile modes. De Razer Blade 16 en Asus ROG Zephyrus M16 gaan in vergelijking elk enkele uren langer mee.
Opladen van leeg naar vol is relatief snel met minder dan 90 minuten met de meegeleverde AC-adapter. Het systeem kan ook worden opgeladen via kleinere USB-C adapters, zij het in een langzamer tempo en met beperkte prestaties.
| Lenovo Legion Pro 5 16IRX8 i7-13700HX, GeForce RTX 4060 Laptop GPU, 80 Wh | Asus ROG Zephyrus M16 GU603Z i9-12900H, GeForce RTX 3070 Ti Laptop GPU, 90 Wh | Razer Blade 16 Early 2023 i9-13950HX, GeForce RTX 4080 Laptop GPU, 95.2 Wh | Lenovo Legion Pro 7 16IRX8H i9-13900HX, GeForce RTX 4080 Laptop GPU, 99.9 Wh | Lenovo Legion 5 Pro 16ARH7H RTX 3070 Ti R7 6800H, GeForce RTX 3070 Ti Laptop GPU, 80 Wh | Lenovo Legion S7 16ARHA7 R9 6900HX, Radeon RX 6800S, 71 Wh | |
|---|---|---|---|---|---|---|
| Batterijduur | 109% | 71% | 82% | 29% | 82% | |
| Reader / Idle (h) | 6.7 | 8.9 33% | 6.4 -4% | |||
| WiFi v1.3 (h) | 3.4 | 7.4 118% | 6.1 79% | 5.1 50% | 4.4 29% | 6.2 82% |
| Load (h) | 0.7 | 1.4 100% | 1.4 100% | 2.1 200% | ||
| H.264 (h) | 7.3 |
Pro
Contra
Verdict - mist enkele functies voor de prijs
De 2023 Legion Pro 5 16 geconfigureerd met GeForce RTX 4060 graphics is met 1600 USD geen goedkope gaming laptop. Dat is natuurlijk geen probleem, zolang hij vol zit met functies die gamers eigenlijk willen. G-Sync, QHD+ 165 Hz, volledige sRGB-kleuren, eenvoudige onderhoudbaarheid en grote pijltjestoetsen komen allemaal standaard om het model een goed afgeronde gaming-laptop te maken.
We kunnen niettemin enkele bezuinigingen opmerken, zelfs in deze prijsklasse. Het model mist een paar belangrijke functies zoals per-toets RGB verlichting, Thunderbolt ondersteuning, Advanced Optimus, en AdobeRGB paneel opties. Vooral dat laatste betekent dat de Legion Pro 5 16 misschien niet de beste oplossing is voor gebruikers die zowel content creators of digitale artiesten als gamers zijn. Concurrerende modellen zoals deRazer Blade 16, Aero 16, of Asus ROG Zephyrus M16 zijn niet alleen lichter en dunner, maar bieden ook bredere schermopties naast enkele van de eerder genoemde ontbrekende functies.
De opgefriste Legion Pro 5 16 dekt bijna alles wat je zou willen van een midrange gaming laptop. Echter, sommige wenselijke functies zoals AdobeRGB, Thunderbolt, en Advanced Optimus zijn helaas weggelaten.
Wat de prestaties betreft, zullen gebruikers met systemen met 12e generatie Intel CPU's en GeForce RTX 3070 of hogere GPU's niet al te veel voordeel zien bij een upgrade naar 13e generatie Intel met GeForce RTX 4060 of 4070 graphics. Oudere machines die draaien op GeForce RTX 20 GPU's met 11e generatie Intel of AMD Zen 3 CPU's kunnen overwegen de sprong te maken.
Prijs en beschikbaarheid
Lenovo verscheept nu de Legion Pro 5 16IRX8 in onze reviewconfiguratie voor 1600 USD.
Lenovo Legion Pro 5 16IRX8
- 05-05-2023 v7 (old)
Allen Ngo
Transparantie
De selectie van te beoordelen apparaten wordt gemaakt door onze redactie. Het testexemplaar werd ten behoeve van deze beoordeling door de fabrikant of detailhandelaar in bruikleen aan de auteur verstrekt. De kredietverstrekker had geen invloed op deze recensie, noch ontving de fabrikant vóór publicatie een exemplaar van deze recensie. Er bestond geen verplichting om deze recensie te publiceren. Als onafhankelijk mediabedrijf is Notebookcheck niet onderworpen aan het gezag van fabrikanten, detailhandelaren of uitgevers.
[transparency_disclaimer]Dit is hoe Notebookcheck test
Elk jaar beoordeelt Notebookcheck onafhankelijk honderden laptops en smartphones met behulp van gestandaardiseerde procedures om ervoor te zorgen dat alle resultaten vergelijkbaar zijn. We hebben onze testmethoden al zo'n 20 jaar voortdurend ontwikkeld en daarbij de industriestandaard bepaald. In onze testlaboratoria wordt gebruik gemaakt van hoogwaardige meetapparatuur door ervaren technici en redacteuren. Deze tests omvatten een validatieproces in meerdere fasen. Ons complexe beoordelingssysteem is gebaseerd op honderden goed onderbouwde metingen en benchmarks, waardoor de objectiviteit behouden blijft. Meer informatie over onze testmethoden kunt u hier vinden.
Price comparison

