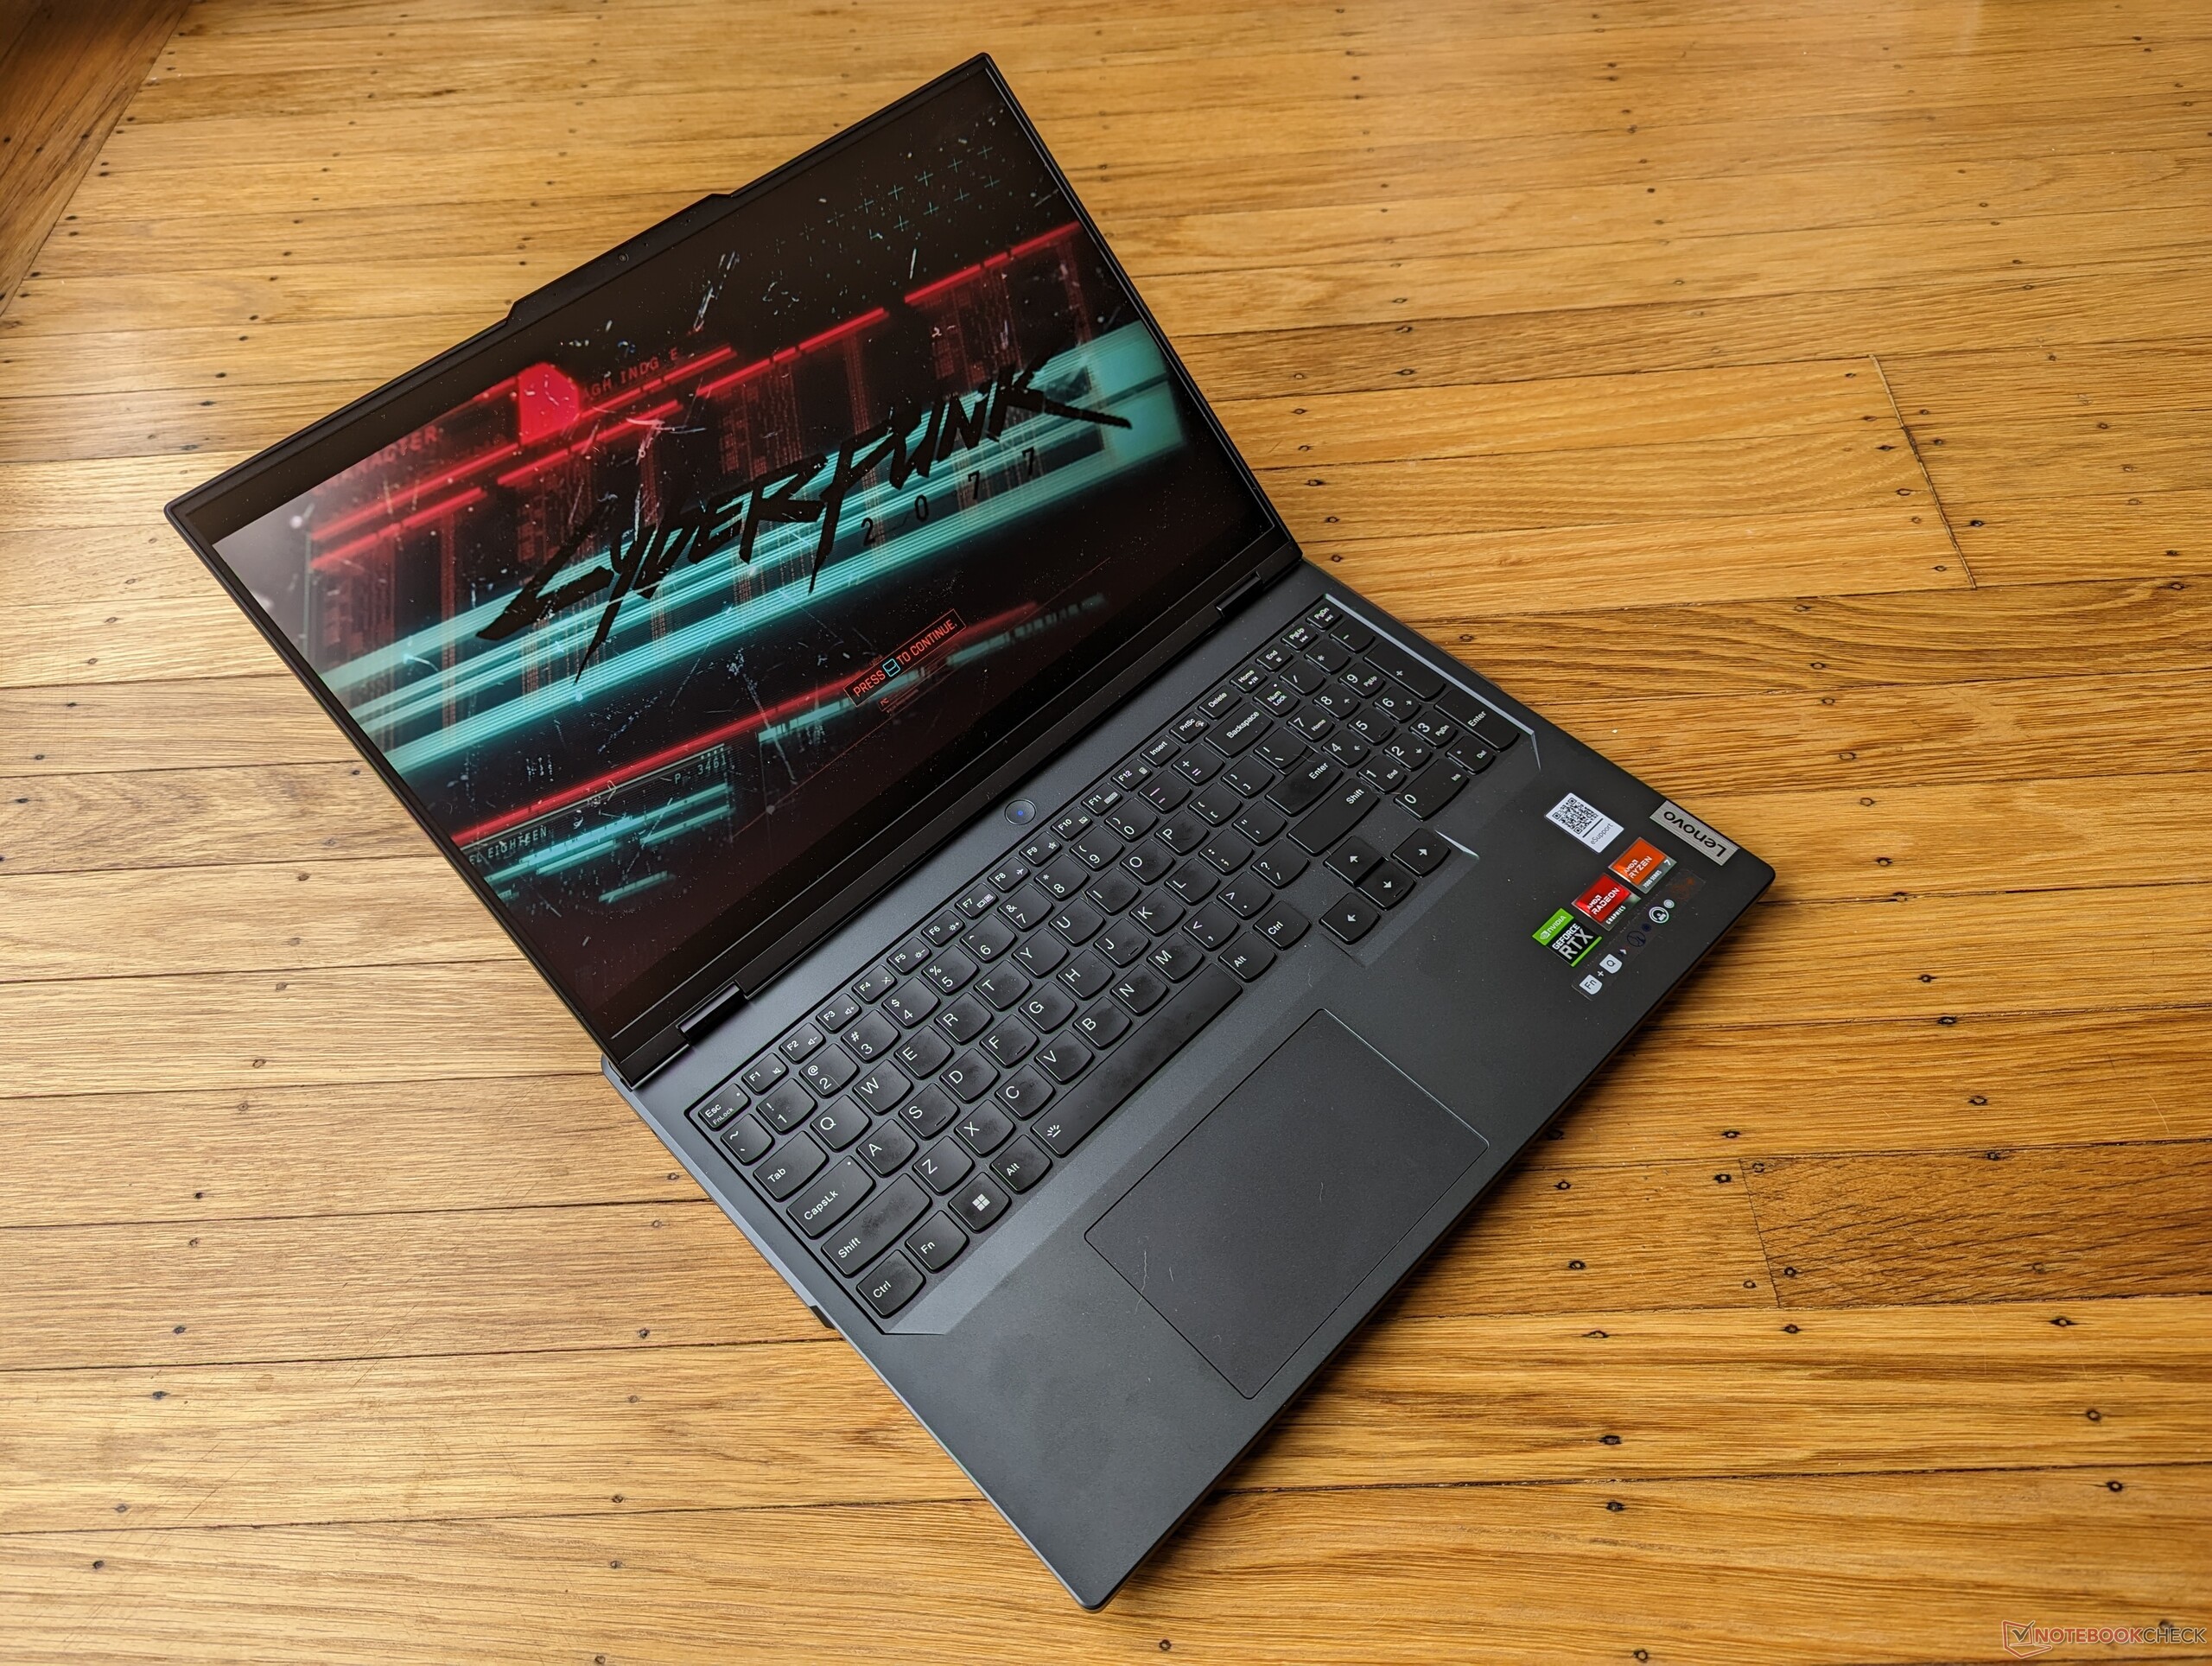
Ryzen 7 7745HX prestatiedebuut: Lenovo Legion Pro 5 16 Gen 8 laptop review

De Lenovo Legion Pro 5 16ARX8 is de AMD-versie van de Intel Legion Pro 5 16IRX8. Beide modellen maken gebruik van hetzelfde Legion Pro 5 16 Gen 8 chassis en zijn verder visueel identiek. We raden aan om onze bestaande review over de Legion Pro 5 16IRX8 voor meer informatie over de fysieke kenmerken van het model, aangezien veel van onze opmerkingen nog steeds van toepassing zijn op de Legion Pro 5 16ARX8.
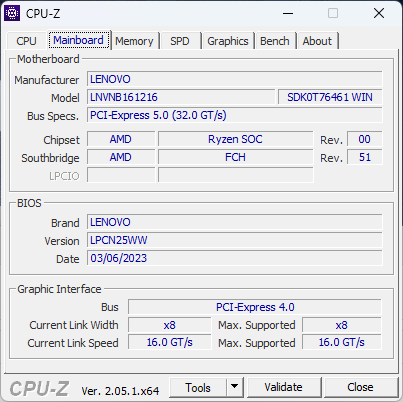
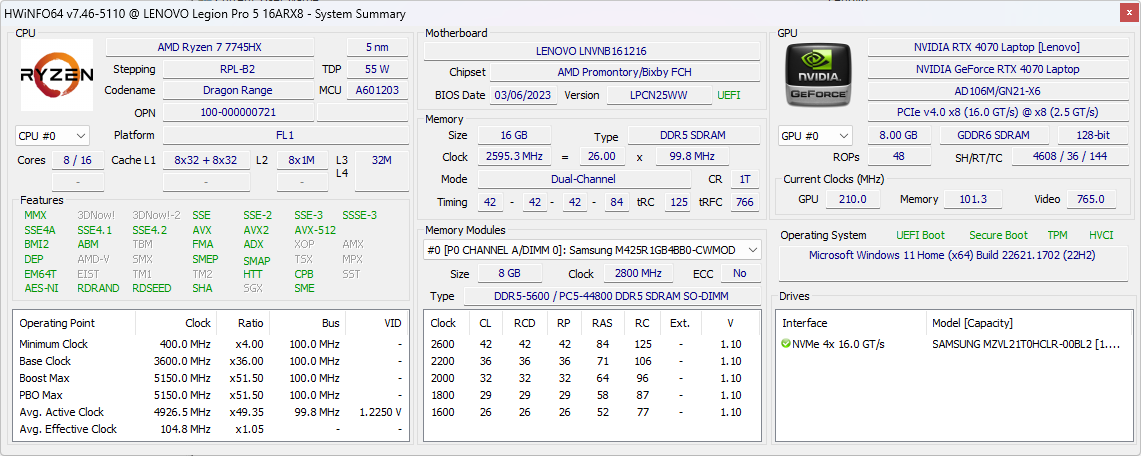
Onze testunit is een high-end configuratie met de Zen 4 Ryzen 7 7745HX CPU, 140 W GeForce RTX 4070 GPU, en 165 Hz 1600p IPS-scherm dat wordt verkocht voor ongeveer 1600 USD. Andere SKU's kunnen de Ryzen 5 7645HX, GeForce RTX 4050, of 240 Hz IPS-scherm omvatten. Dit specifieke model is een van de eerste die wordt geleverd met de midrange Ryzen 7 7745HX, terwijl eerdere Zen 4 laptops alleen beschikbaar waren met de duurdere Ryzen 9 7945HX.
Concurrenten in deze ruimte zijn andere midrange tot high-end gaming laptops zoals de Asus ROG Strix G16, Razer Blade 16, Uniwill GM6PX7Xof MSI Pulse GL76. De Legion 7 serie is een stap boven onze Legion Pro 5 met veel snellere CPU en GPU opties om uit te kiezen.
Meer Lenovo beoordelingen:
Potentiële concurrenten in vergelijking
Evaluatie | Datum | Model | Gewicht | Hoogte | Formaat | Resolutie | Beste prijs |
|---|---|---|---|---|---|---|---|
| 88.4 % v7 (old) | 05-2023 | Lenovo Legion Pro 5 16ARX8 R7 7745HX, GeForce RTX 4070 Laptop GPU | 2.5 kg | 26.8 mm | 16.00" | 2560x1600 | |
| 87.9 % v7 (old) | 05-2023 | Lenovo Legion Pro 5 16IRX8 i7-13700HX, GeForce RTX 4060 Laptop GPU | 2.5 kg | 26.8 mm | 16.00" | 2560x1600 | |
| 88.2 % v7 (old) | 03-2023 | Uniwill GM6PX7X RTX 4070 i7-13700HX, GeForce RTX 4070 Laptop GPU | 2.2 kg | 22 mm | 16.00" | 2560x1600 | |
| 87.7 % v7 (old) | 04-2023 | Schenker XMG Neo 16 E23 i9-13900HX, GeForce RTX 4090 Laptop GPU | 2.5 kg | 29.9 mm | 16.00" | 2560x1600 | |
| 88.4 % v7 (old) | 03-2023 | Asus ROG Strix G16 G614JZ i9-13980HX, GeForce RTX 4080 Laptop GPU | 2.4 kg | 30.4 mm | 16.00" | 2560x1600 | |
| 88 % v7 (old) | 04-2023 | Asus Zephyrus Duo 16 GX650PY-NM006W R9 7945HX, GeForce RTX 4090 Laptop GPU | 2.7 kg | 29.7 mm | 16.00" | 2560x1600 |
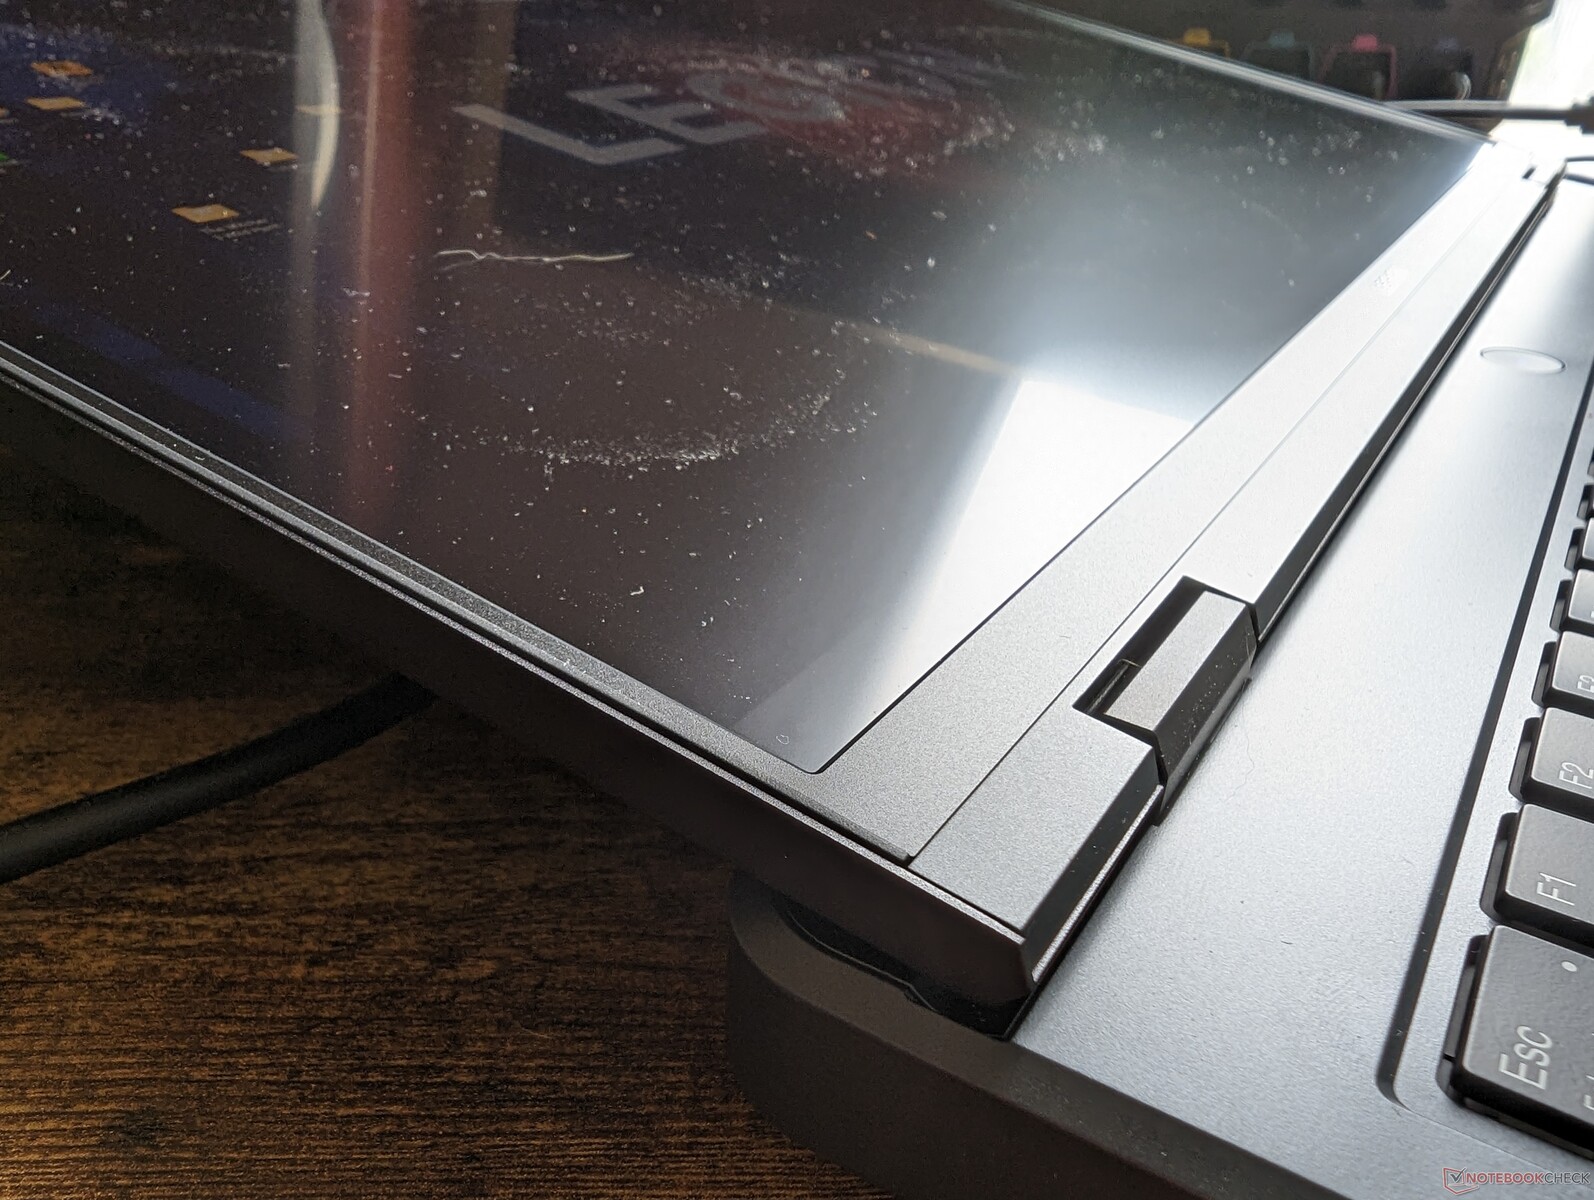
Zaak - Zelfde uiterlijk met identieke poorten
De AMD Legion Pro 5 16ARX8 deelt hetzelfde chassis als de Intel Legion Pro 5 16IRX8. Terwijl er meestal een paar poortverschillen zijn tussen de meeste AMD en Intel varianten, zijn er eigenlijk geen tussen deze twee modellen, aangezien Lenovo ervoor heeft gekozen om zowel USB 4 als Thunderbolt ondersteuning uit te sluiten op alle Legion 5 Pro SKU's, ongeacht de CPU optie. Dit kan gezien worden als een manier om gebruikers te dwingen om in plaats daarvan de duurdere Legion 7-serie te overwegen, die standaard Thunderbolt-ondersteuning bevat.
Communicatie
Het AMD-model vervangt de gebruikelijke Intel AX211 door de minder gebruikelijke MediaTek MT7922. De prestaties zijn verder stabiel en betrouwbaar wanneer gekoppeld aan ons 6 GHz netwerk.
| Networking | |
| iperf3 transmit AXE11000 | |
| Schenker XMG Neo 16 E23 | |
| Asus ROG Strix G16 G614JZ | |
| Lenovo Legion Pro 5 16ARX8 | |
| Uniwill GM6PX7X RTX 4070 | |
| Lenovo Legion Pro 5 16IRX8 | |
| iperf3 receive AXE11000 | |
| Schenker XMG Neo 16 E23 | |
| Asus ROG Strix G16 G614JZ | |
| Lenovo Legion Pro 5 16ARX8 | |
| Uniwill GM6PX7X RTX 4070 | |
| Lenovo Legion Pro 5 16IRX8 | |
| iperf3 transmit AXE11000 6GHz | |
| Asus Zephyrus Duo 16 GX650PY-NM006W | |
| Lenovo Legion Pro 5 16ARX8 | |
| Lenovo Legion Pro 5 16IRX8 | |
| iperf3 receive AXE11000 6GHz | |
| Asus Zephyrus Duo 16 GX650PY-NM006W | |
| Lenovo Legion Pro 5 16ARX8 | |
| Lenovo Legion Pro 5 16IRX8 | |
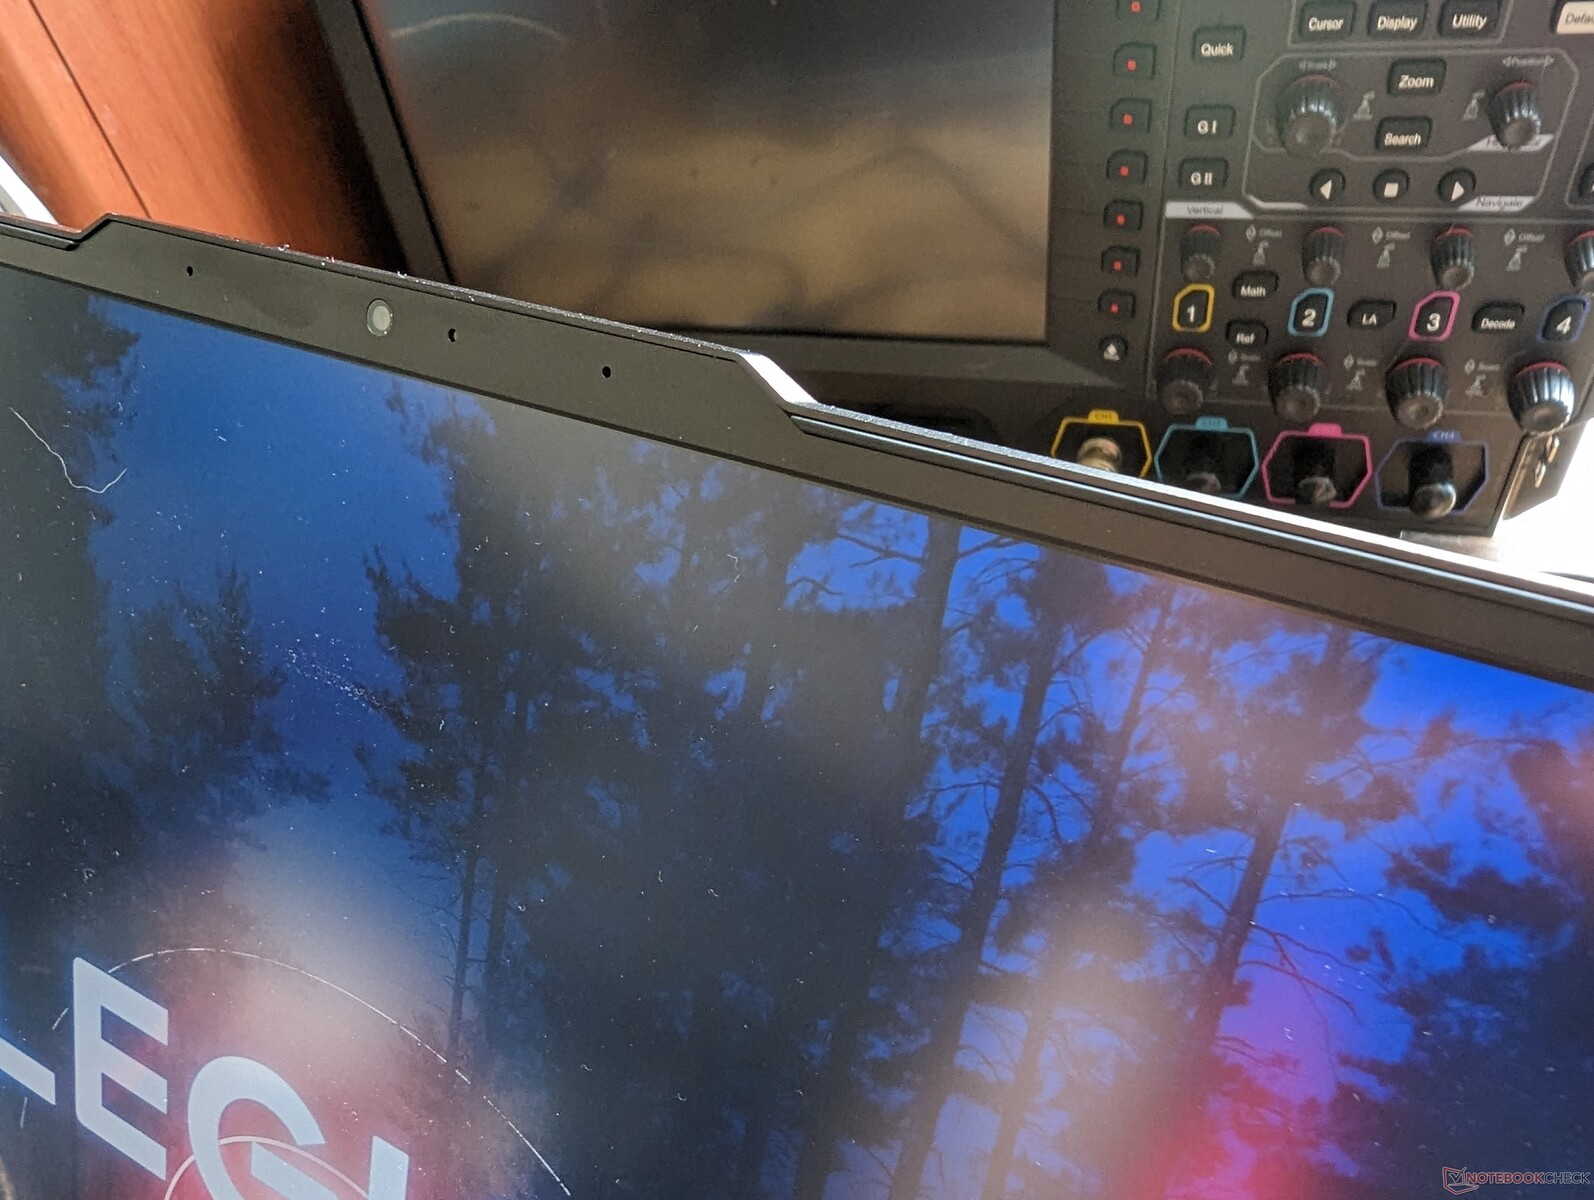
Webcam


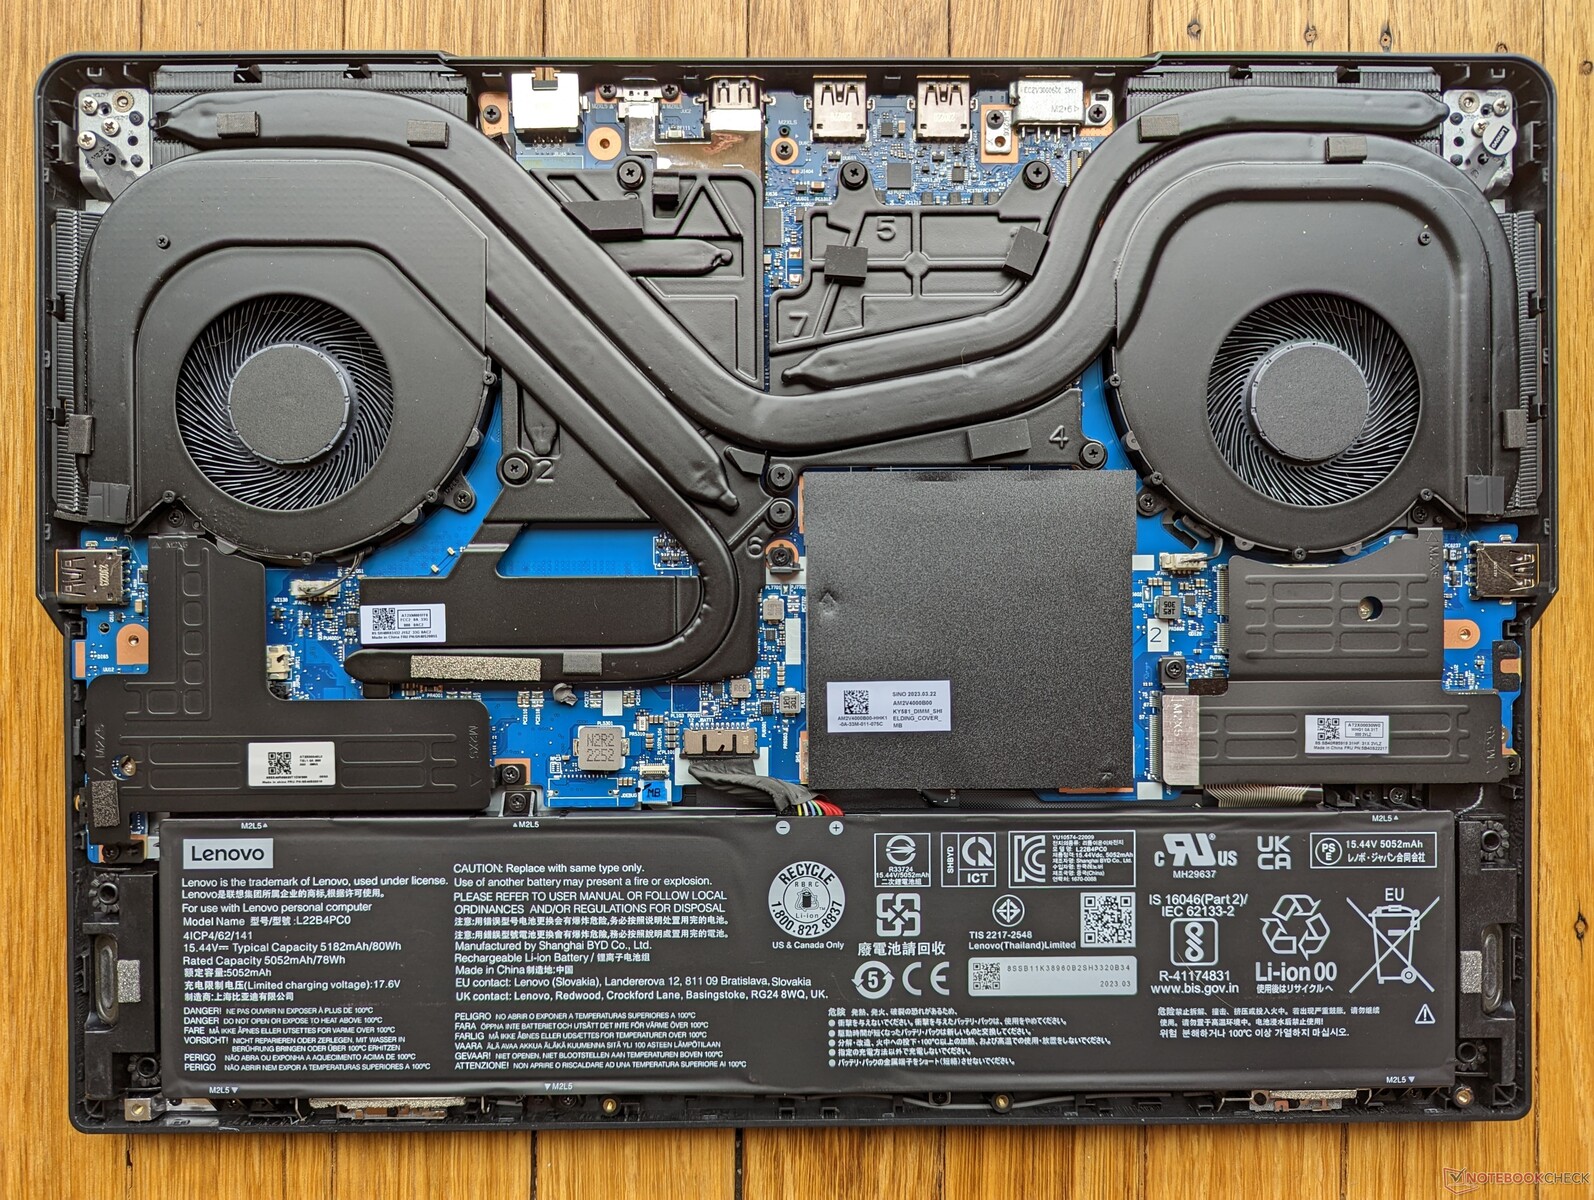
Onderhoud
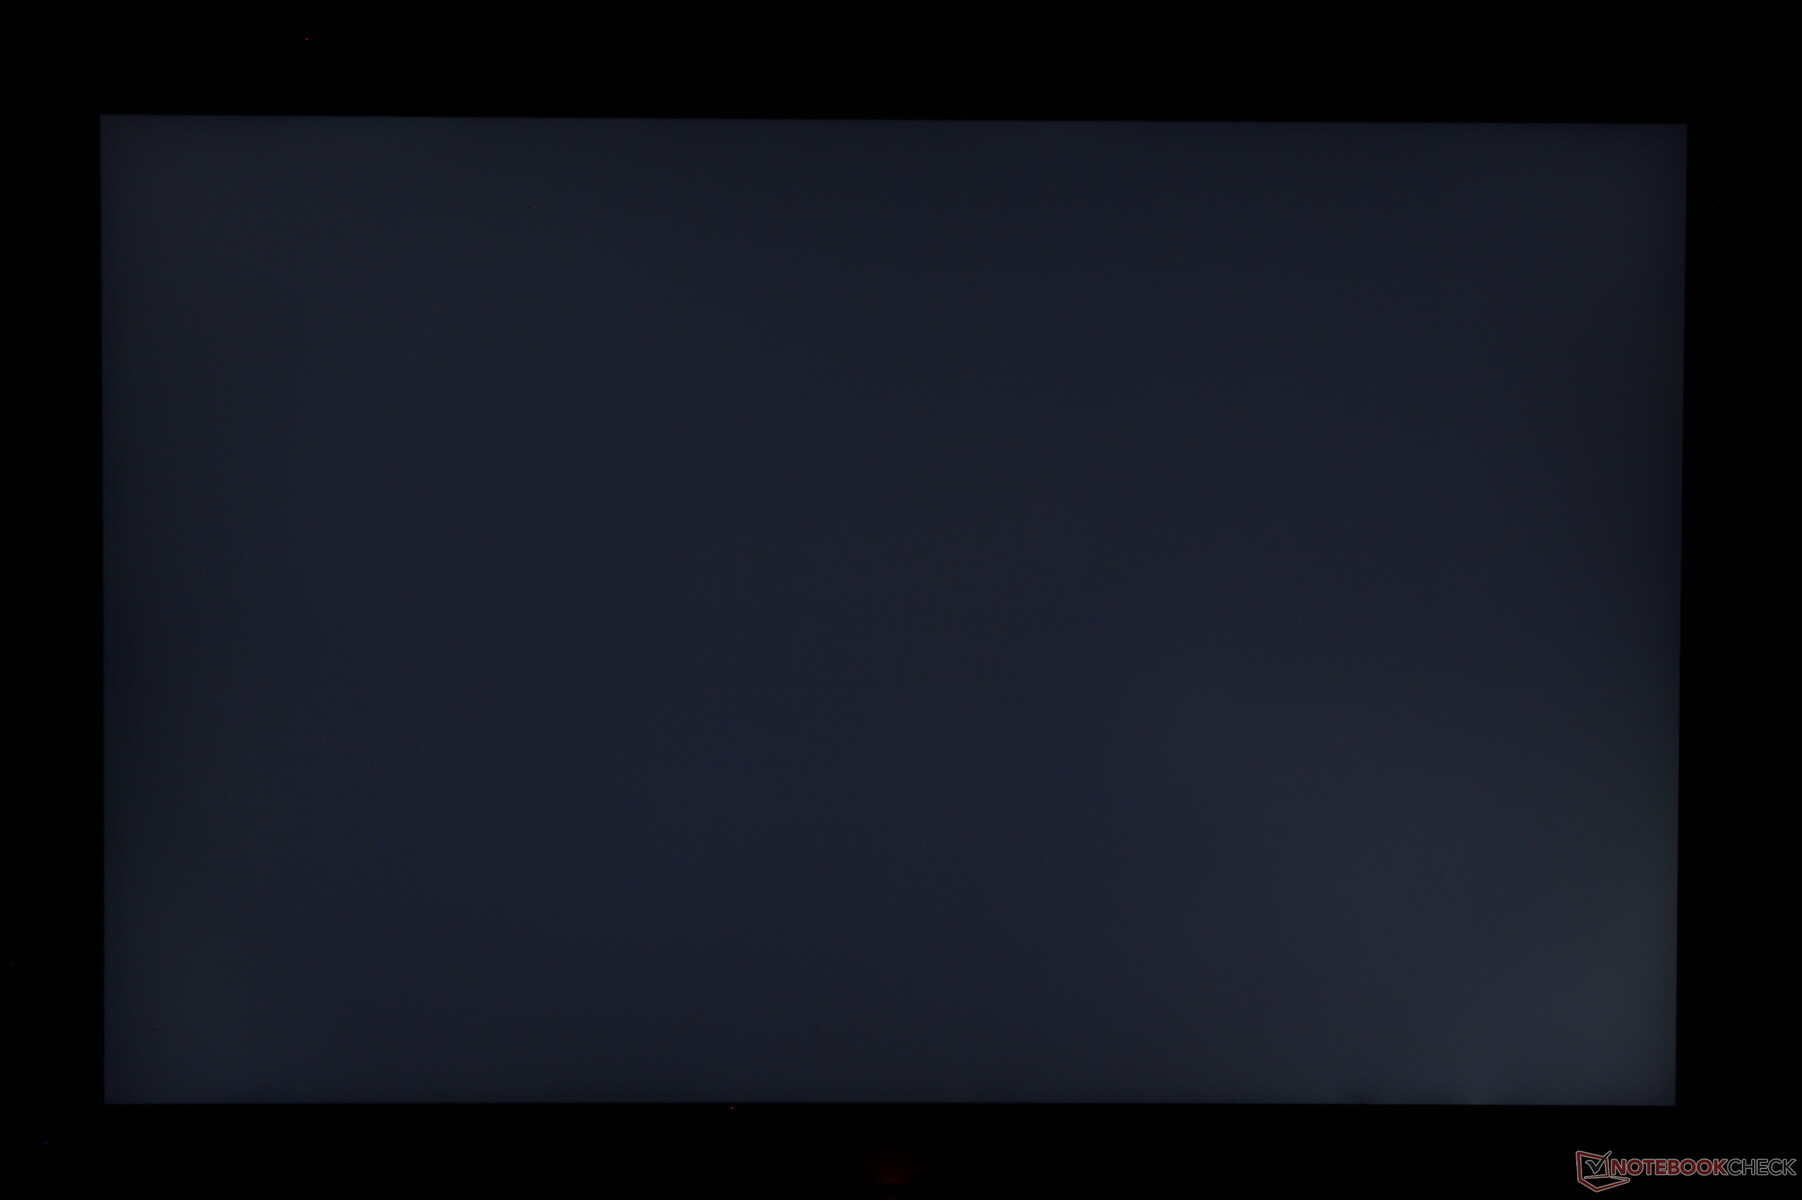
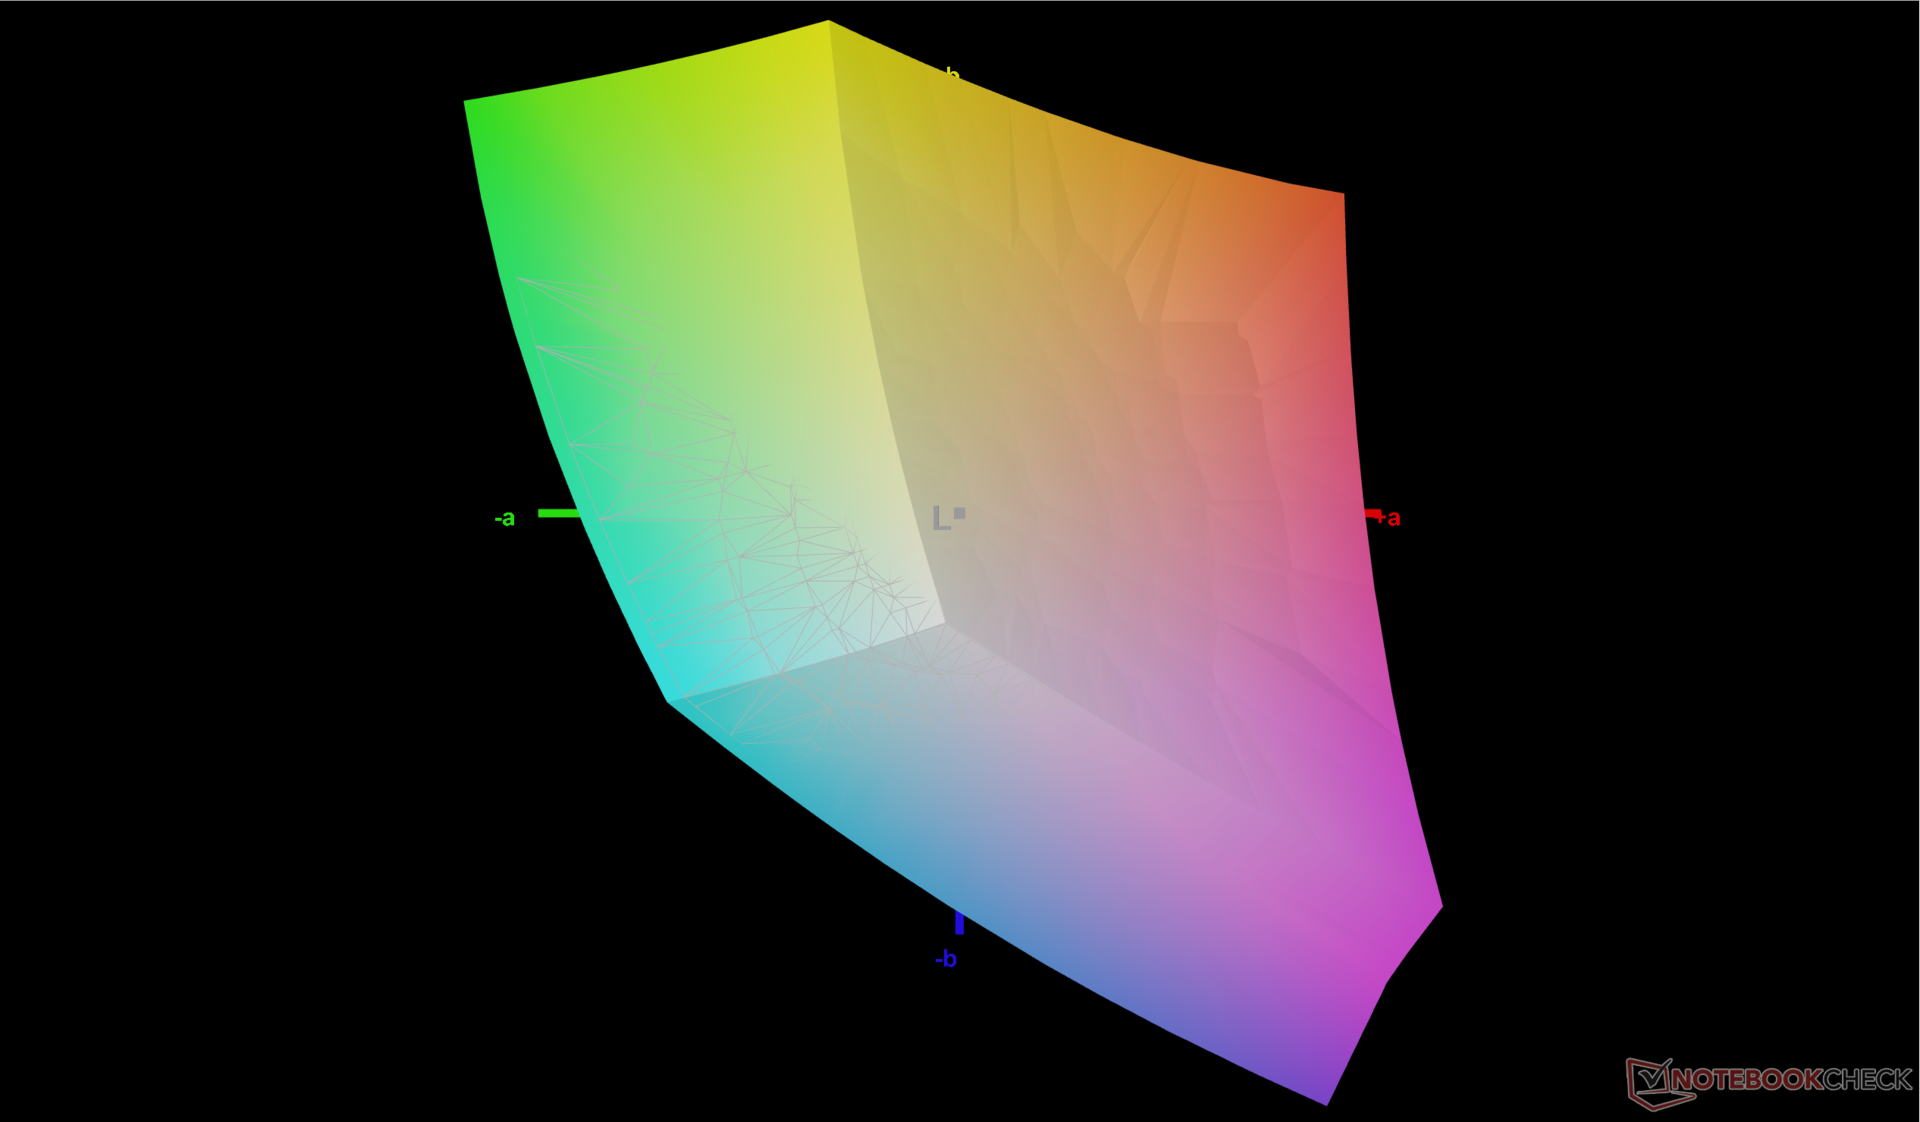
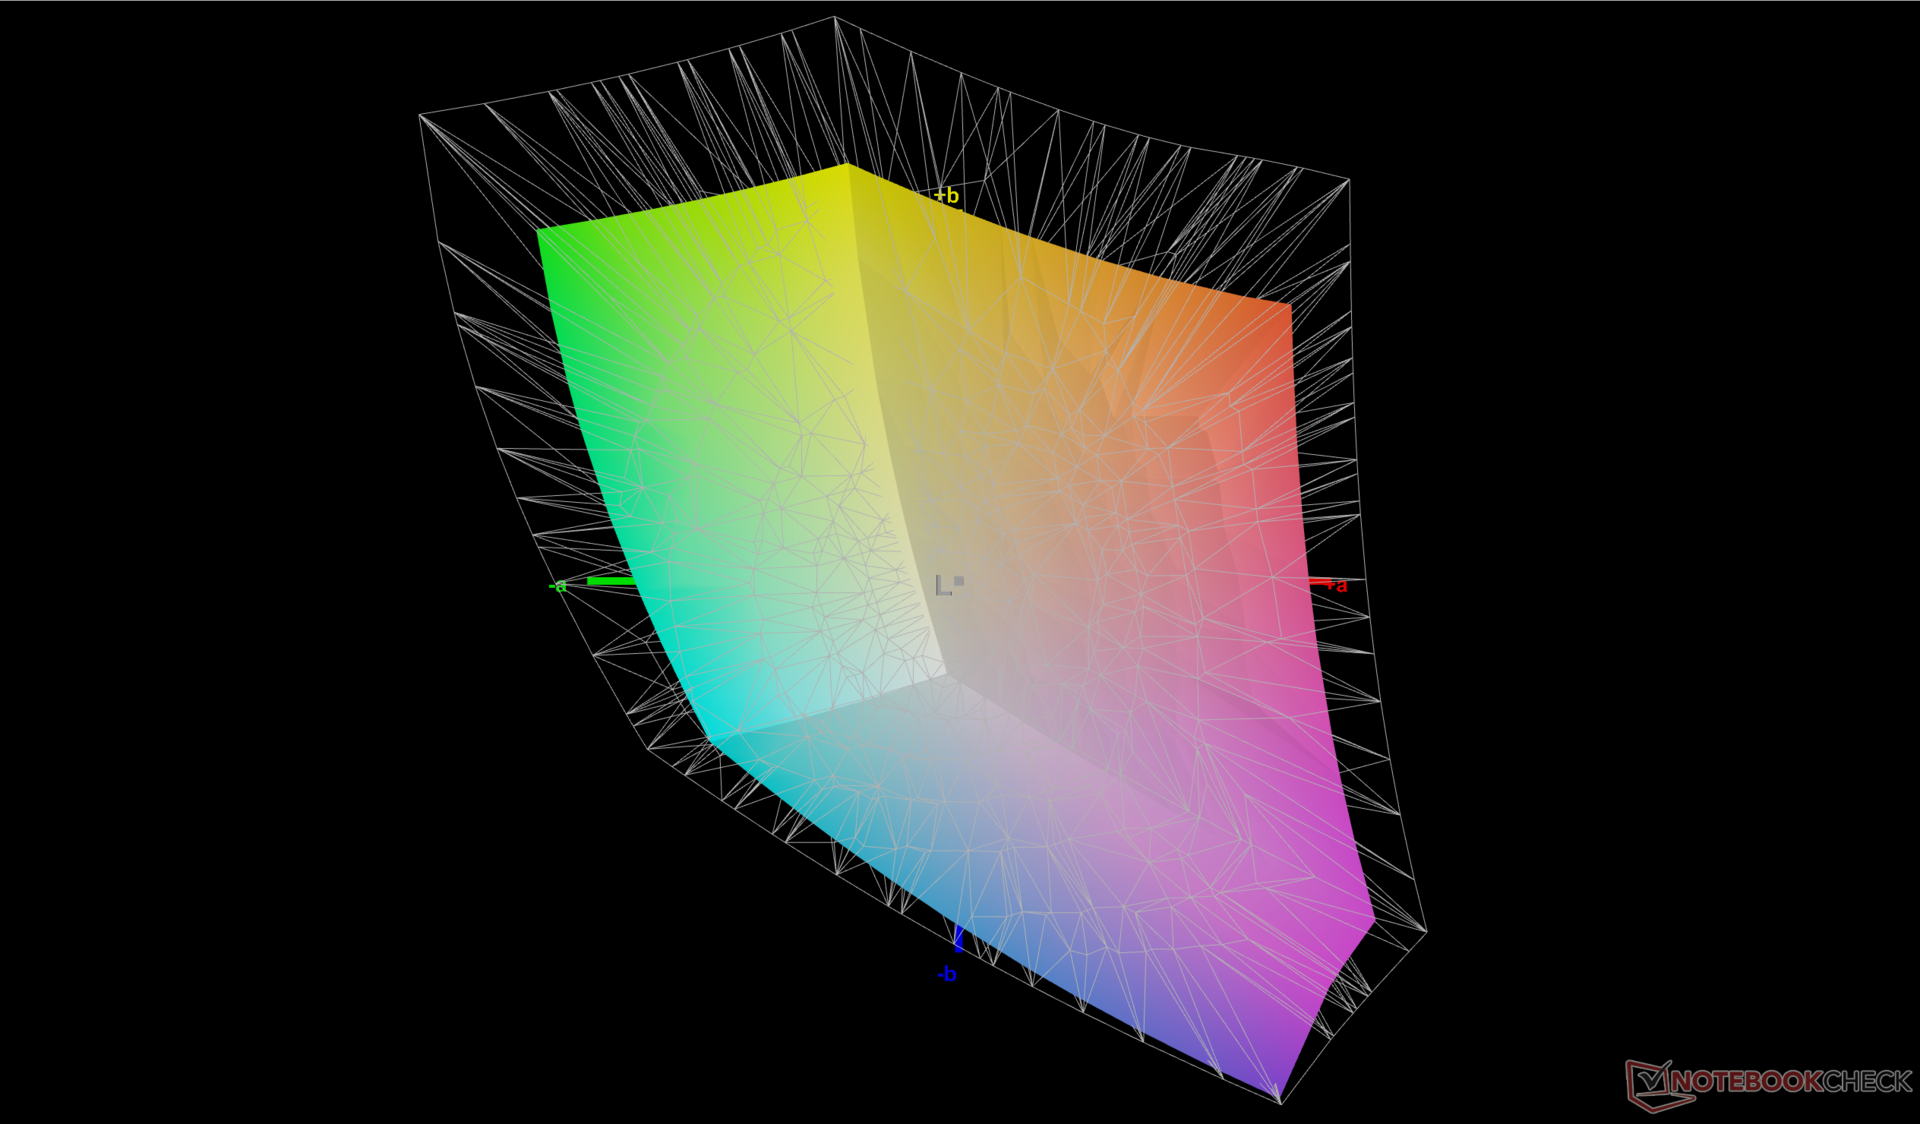
Beeldscherm - 165 Hz, 1600p en Full sRGB
Interessant is dat onze AMD-aangedreven Legion Pro 5 16ARX8 een ander IPS-paneel gebruikt dan de Intel-aangedreven Legion Pro 5 16IRX8 (CSOT MNG007DA1-Q vs AU Optronics B160QAN03.1), ook al hebben beide panelen een vergelijkbare 165 Hz eigen verversingssnelheid, 1600p eigen resolutie, ~1000:1 contrast ratio, en volledige 100% sRGB dekking. Het CSOT paneel heeft iets snellere zwart-wit en grijs-grijs reactietijden, maar de verschillen zijn op zijn best marginaal voor een in wezen identieke kijkervaring.
Er is een tweede paneel beschikbaar dat een nog helderder 500-nit achtergrondverlichting en een snellere 240 Hz verversingssnelheid belooft. Onze metingen hieronder hebben alleen betrekking op het basispaneel met 165 Hz.

| |||||||||||||||||||||||||
Helderheidsverdeling: 91 %
Helderheid in Batterij-modus: 355.3 cd/m²
Contrast: 1110:1 (Zwart: 0.32 cd/m²)
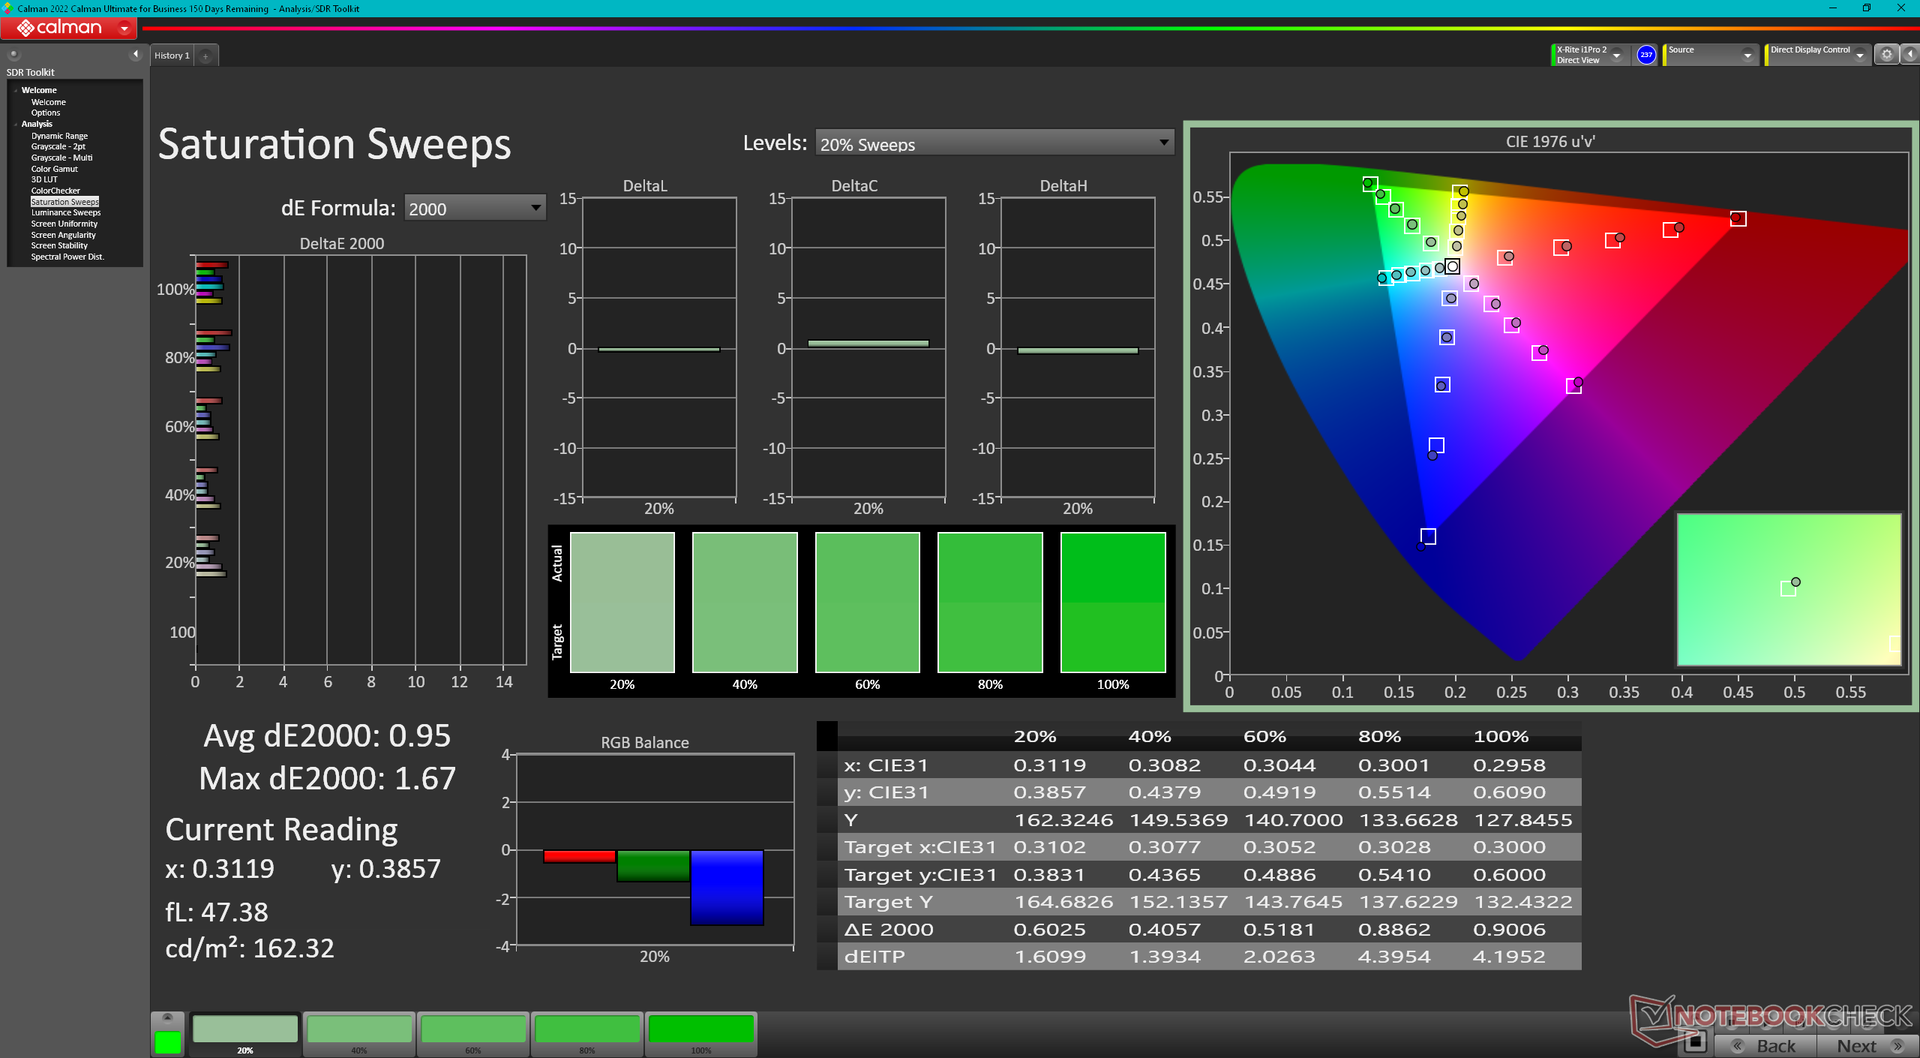
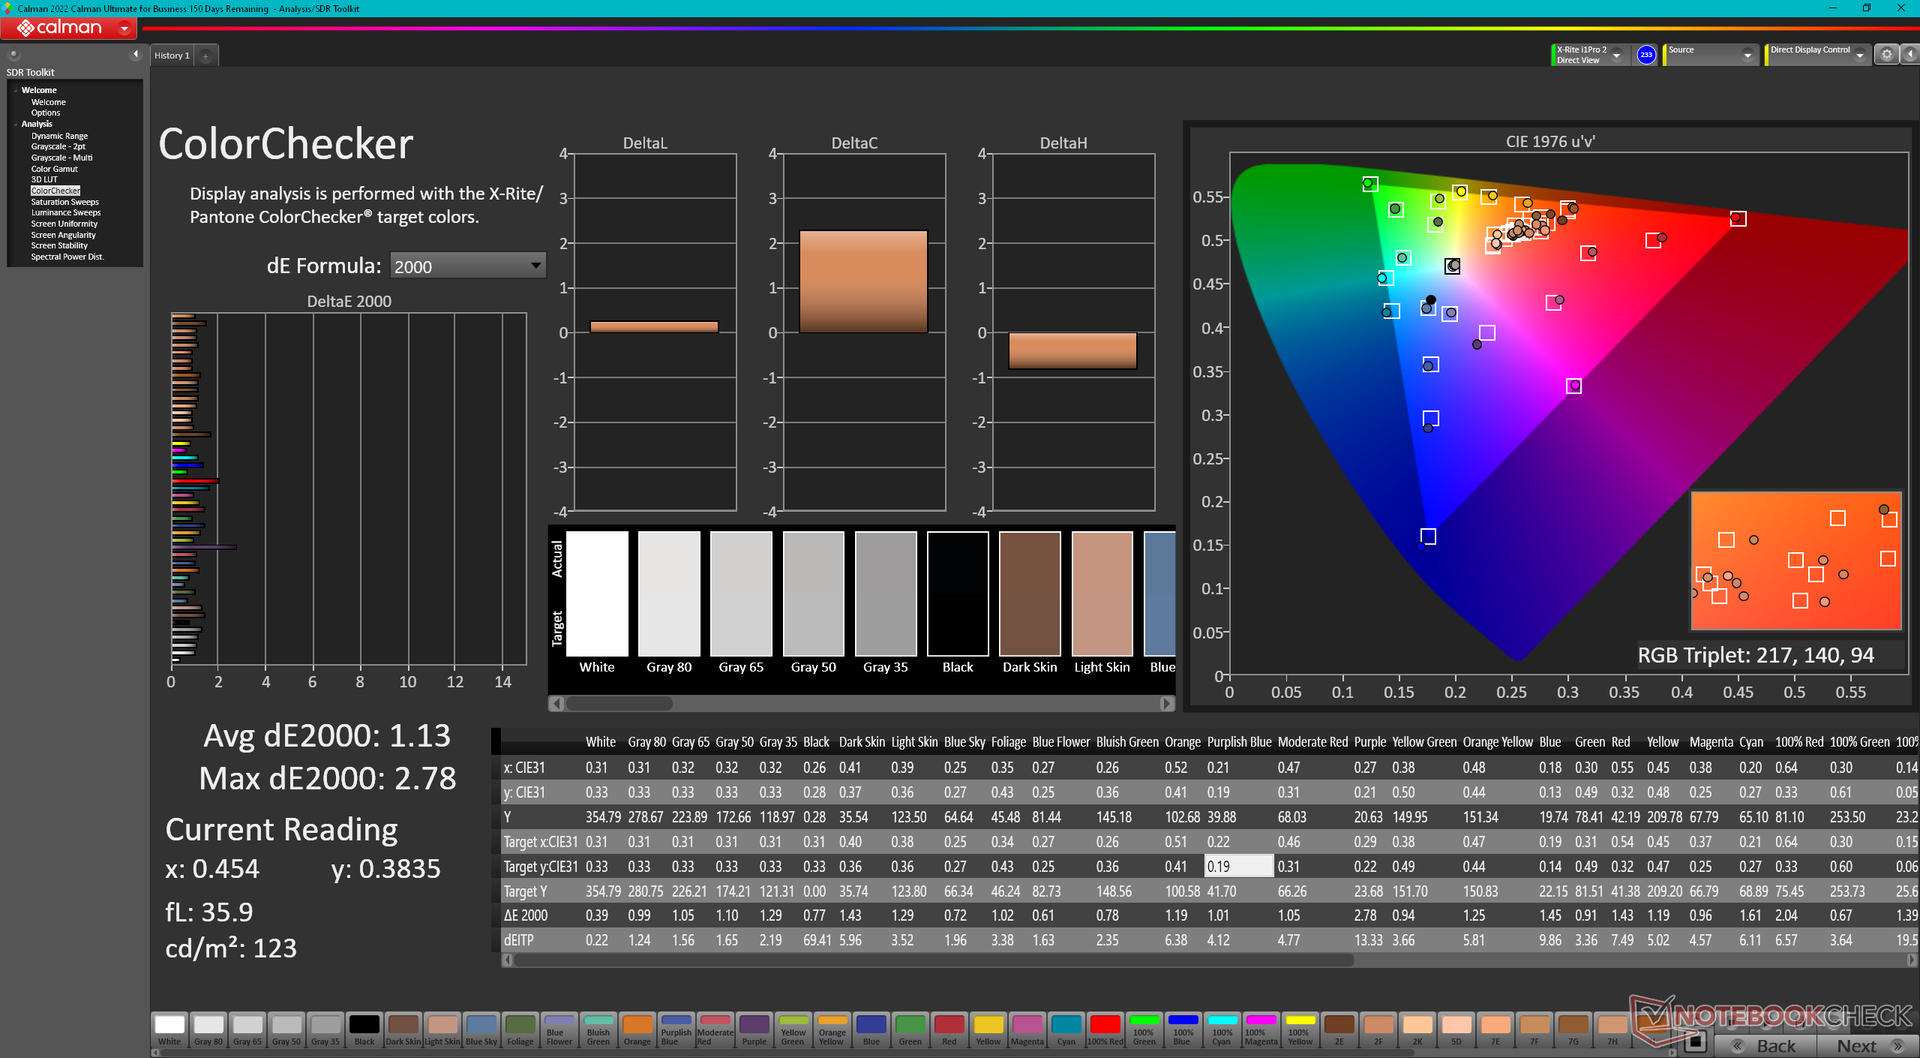
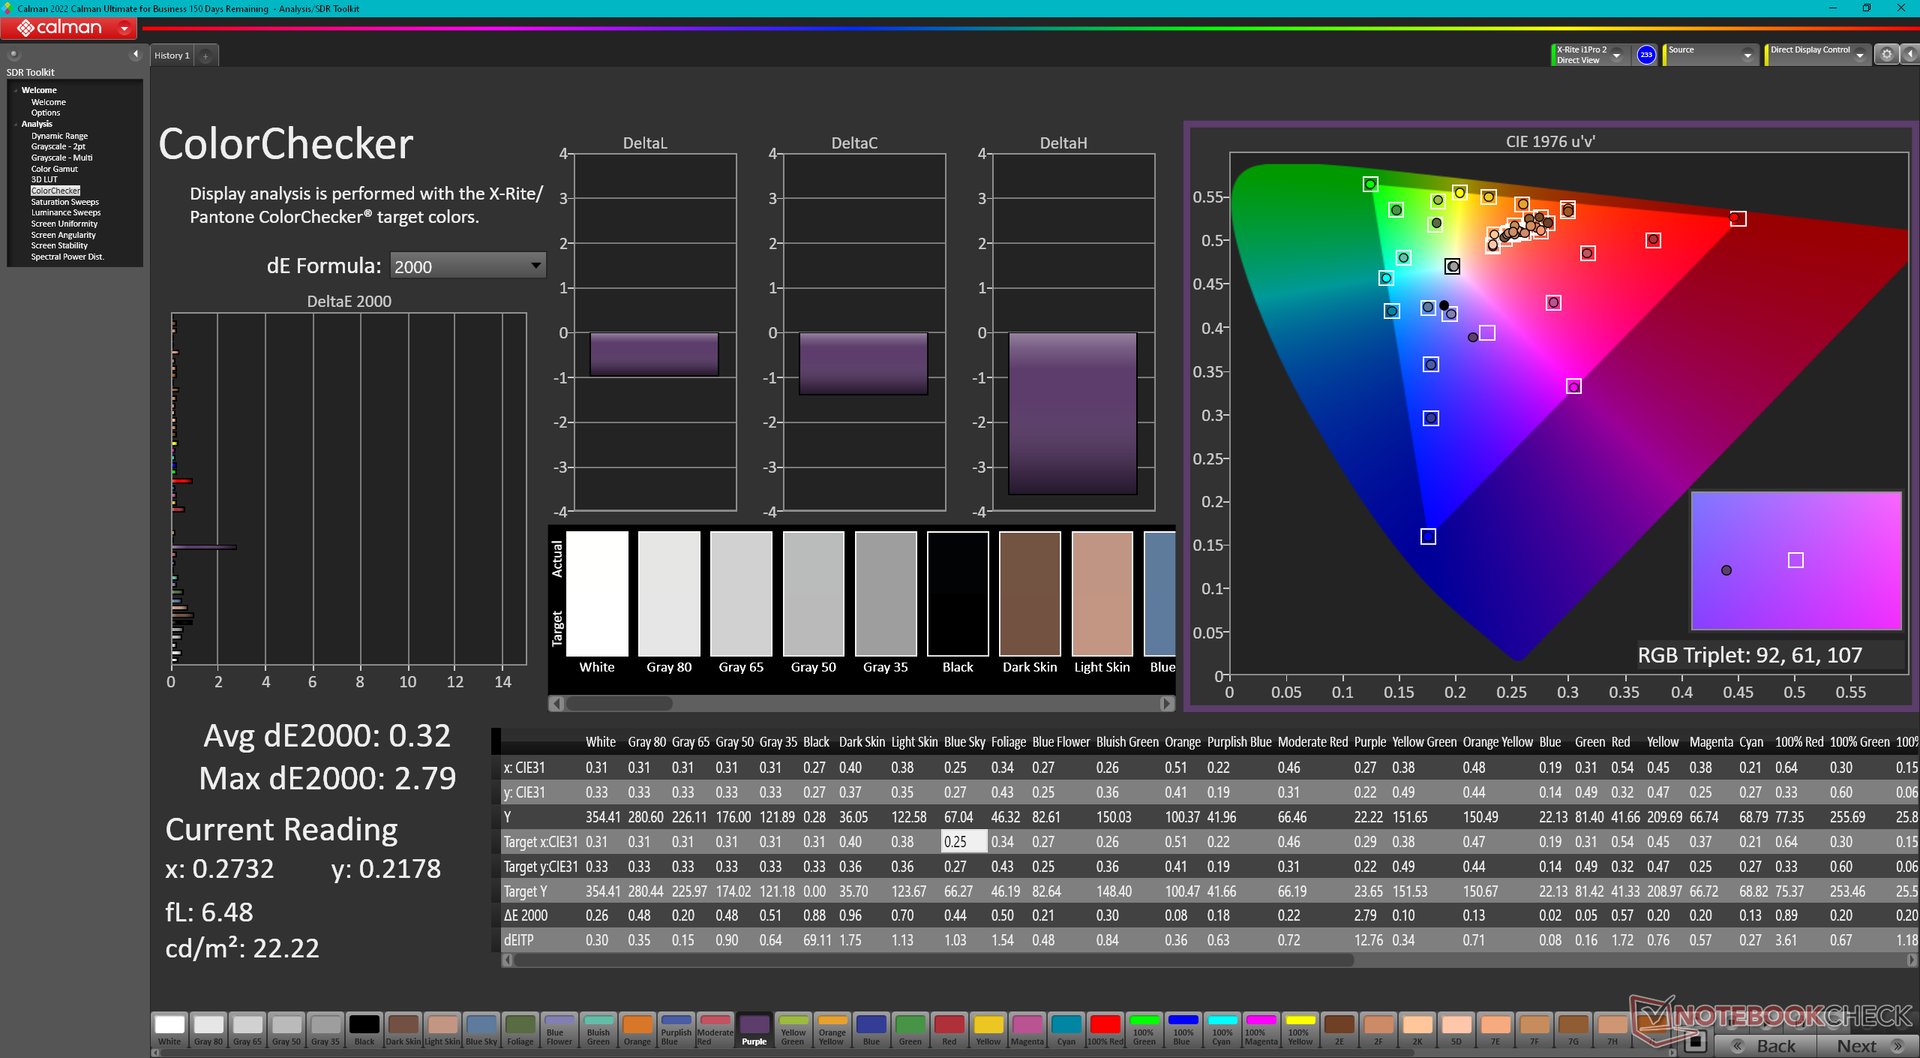
ΔE ColorChecker Calman: 1.13 | ∀{0.5-29.43 Ø4.72}
calibrated: 0.32
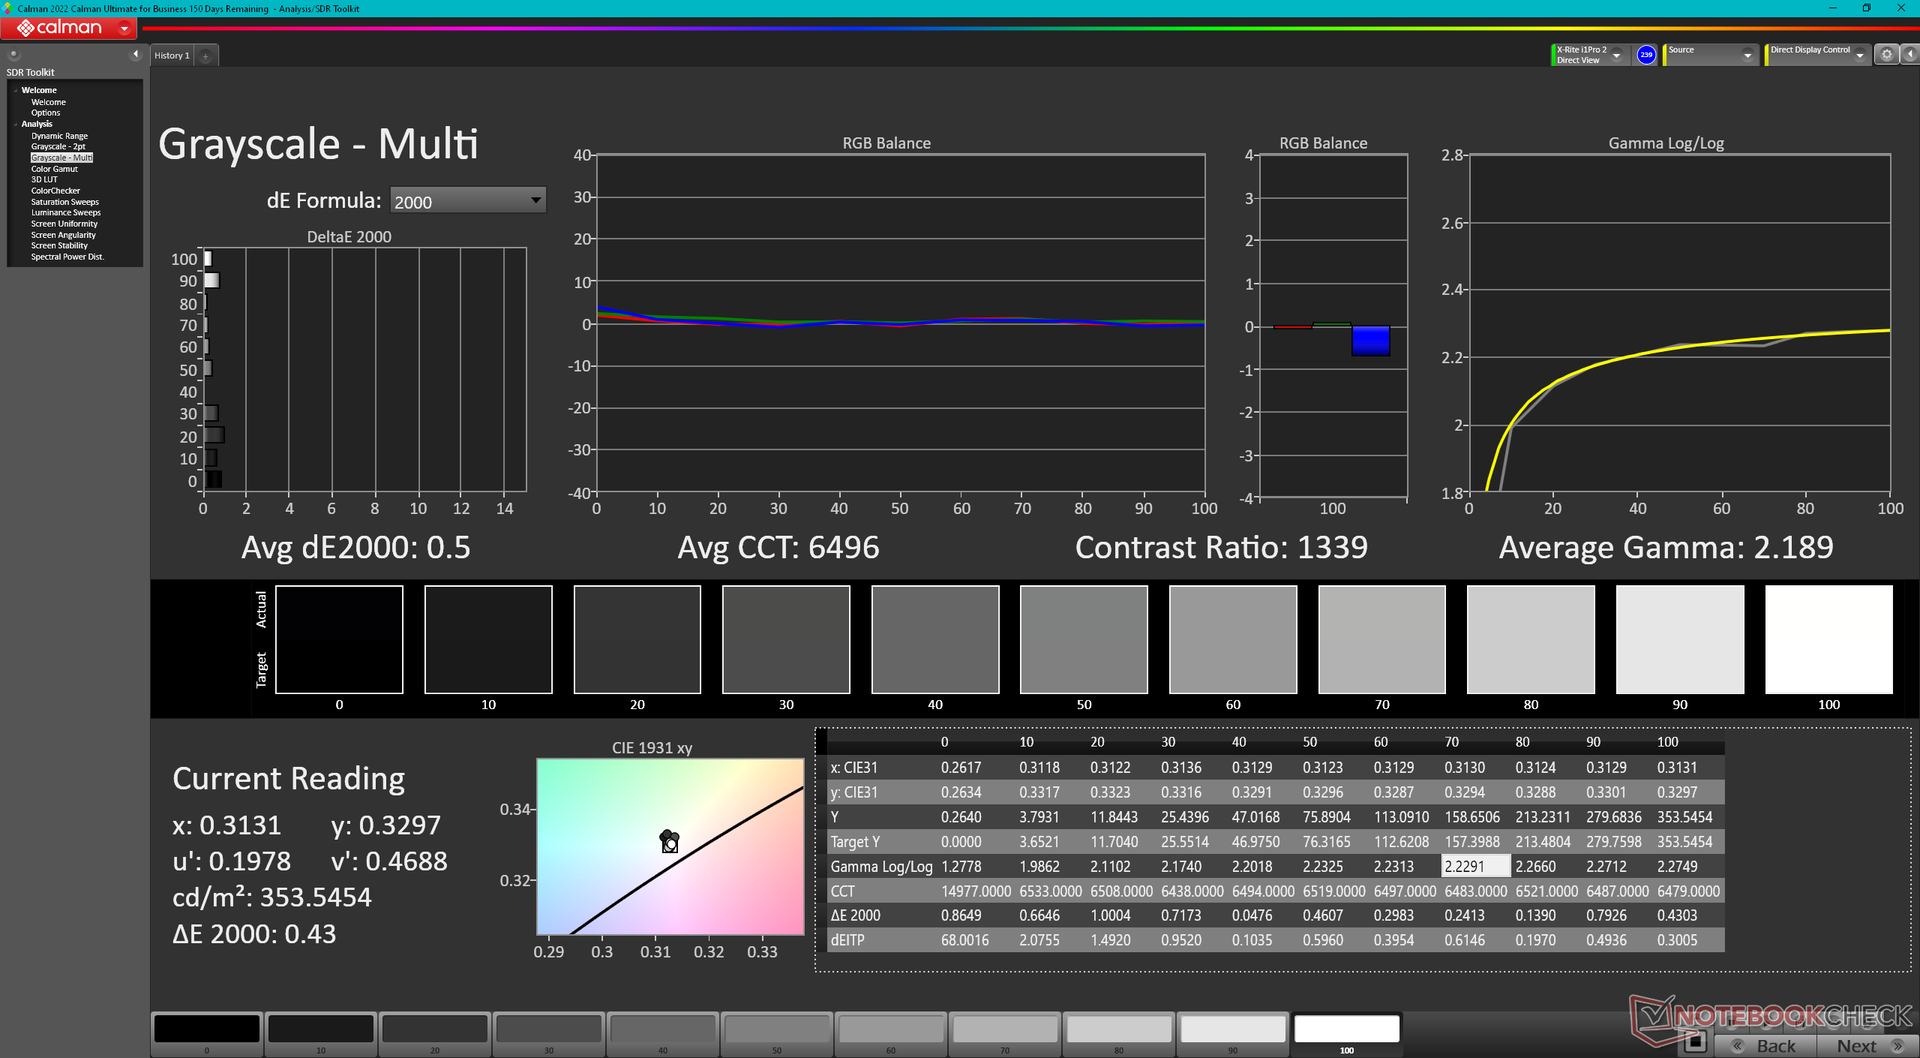
ΔE Greyscale Calman: 1.4 | ∀{0.09-98 Ø4.97}
72.6% AdobeRGB 1998 (Argyll 3D)
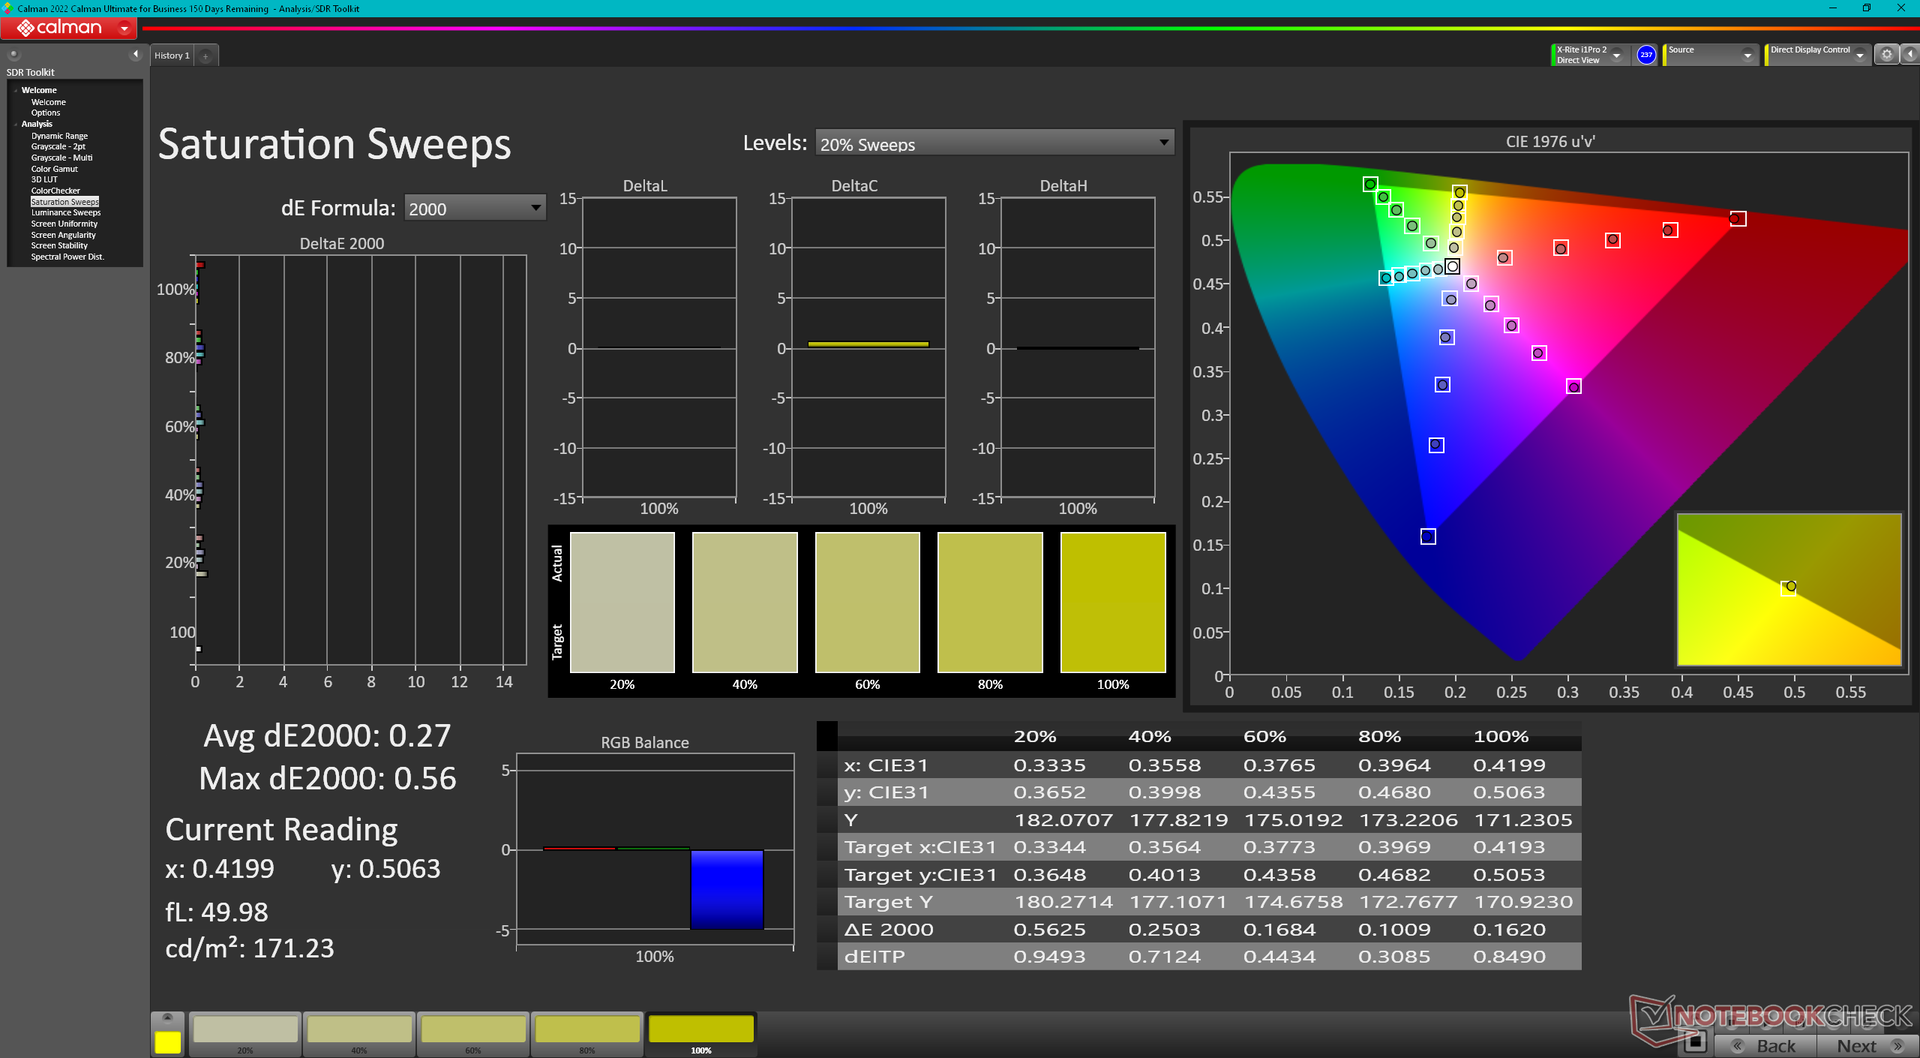
99.6% sRGB (Argyll 3D)
70.4% Display P3 (Argyll 3D)
Gamma: 2.24
CCT: 6372 K
| Lenovo Legion Pro 5 16ARX8 CSOT T3 MNG007DA1-Q, IPS, 2560x1600, 16" | Lenovo Legion Pro 5 16IRX8 AU Optronics B160QAN03.1, IPS, 2560x1600, 16" | Uniwill GM6PX7X RTX 4070 BOE CQ NE160QDM-NZ1, IPS, 2560x1600, 16" | Schenker XMG Neo 16 E23 BOE0AF0 NE160QDM-NZ1, IPS, 2560x1600, 16" | Asus ROG Strix G16 G614JZ TL160ADMP03-0, IPS, 2560x1600, 16" | Asus Zephyrus Duo 16 GX650PY-NM006W NE160QDM-NM4, MiniLED, 2560x1600, 16" | |
|---|---|---|---|---|---|---|
| Display | 0% | -4% | -4% | 18% | 22% | |
| Display P3 Coverage (%) | 70.4 | 71.2 1% | 67.5 -4% | 67.3 -4% | 97 38% | 99.4 41% |
| sRGB Coverage (%) | 99.6 | 98.8 -1% | 96.4 -3% | 96.7 -3% | 99.9 0% | 100 0% |
| AdobeRGB 1998 Coverage (%) | 72.6 | 73.3 1% | 68.6 -6% | 68.9 -5% | 84.9 17% | 90.8 25% |
| Response Times | -61% | -44% | -51% | 27% | -113% | |
| Response Time Grey 50% / Grey 80% * (ms) | 7 ? | 14.5 ? -107% | 12.6 ? -80% | 14.5 ? -107% | 5.1 ? 27% | 15.2 ? -117% |
| Response Time Black / White * (ms) | 9.1 ? | 10.4 ? -14% | 9.8 ? -8% | 8.6 ? 5% | 6.6 ? 27% | 19 ? -109% |
| PWM Frequency (Hz) | 12000 ? | |||||
| Screen | -17% | -69% | -54% | -39% | 71% | |
| Brightness middle (cd/m²) | 355.3 | 405.7 14% | 338.6 -5% | 372 5% | 470 32% | 712 100% |
| Brightness (cd/m²) | 340 | 368 8% | 328 -4% | 349 3% | 459 35% | 703 107% |
| Brightness Distribution (%) | 91 | 87 -4% | 89 -2% | 88 -3% | 93 2% | 95 4% |
| Black Level * (cd/m²) | 0.32 | 0.38 -19% | 0.32 -0% | 0.32 -0% | 0.42 -31% | 0.07 78% |
| Contrast (:1) | 1110 | 1068 -4% | 1058 -5% | 1163 5% | 1119 1% | 10171 816% |
| Colorchecker dE 2000 * | 1.13 | 1.65 -46% | 2.18 -93% | 2.06 -82% | 1.86 -65% | 1.7 -50% |
| Colorchecker dE 2000 max. * | 2.78 | 4.2 -51% | 7.14 -157% | 3 -8% | 3.87 -39% | 4 -44% |
| Colorchecker dE 2000 calibrated * | 0.32 | 0.53 -66% | 0.93 -191% | 1.5 -369% | 0.93 -191% | 1.2 -275% |
| Greyscale dE 2000 * | 1.4 | 1.2 14% | 3.7 -164% | 1.9 -36% | 2.7 -93% | 2.8 -100% |
| Gamma | 2.24 98% | 2.3 96% | 2.18 101% | 2.312 95% | 2.246 98% | 2.21 100% |
| CCT | 6372 102% | 6453 101% | 7245 90% | 6747 96% | 6711 97% | 6978 93% |
| Totaal Gemiddelde (Programma / Instellingen) | -26% /
-20% | -39% /
-52% | -36% /
-43% | 2% /
-17% | -7% /
34% |
* ... kleiner is beter
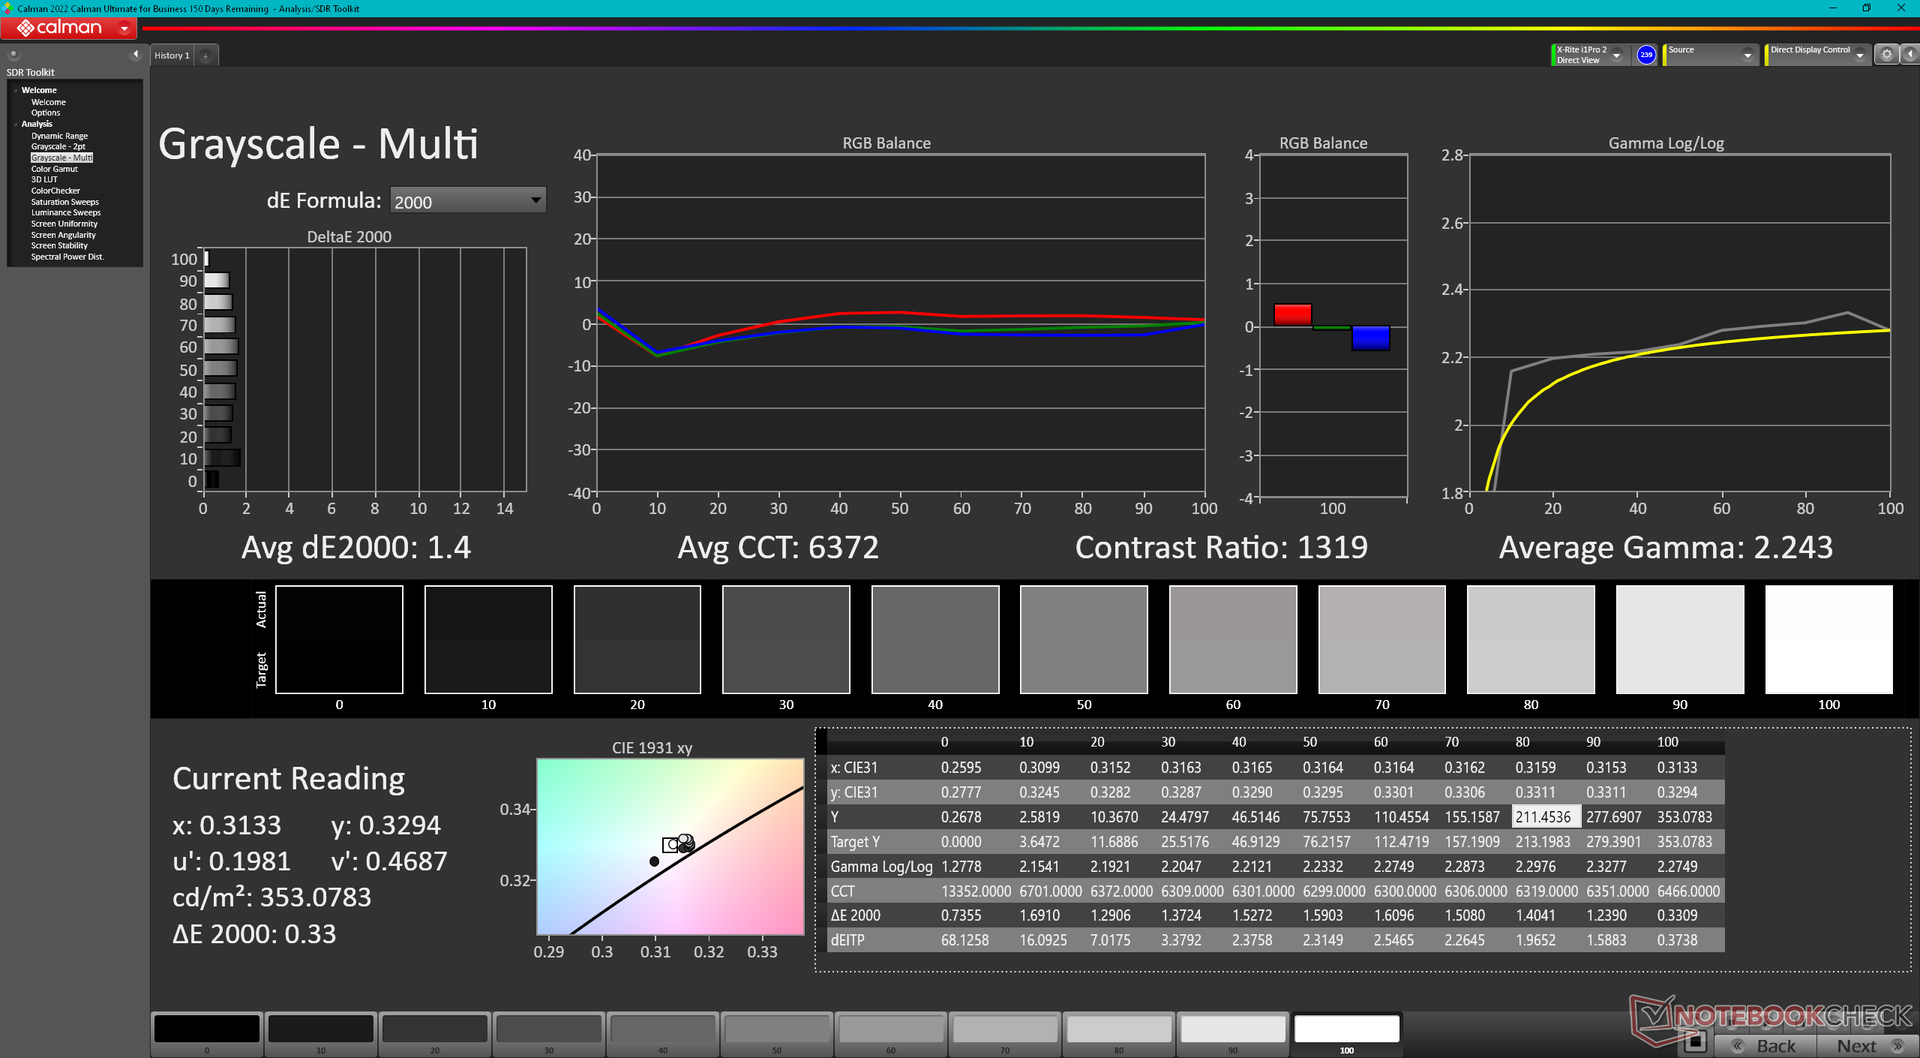
Het beeldscherm komt voorgekalibreerd uit de doos met uitstekende gemiddelde grijswaarden- en kleurendeltawaarden van respectievelijk slechts 1,4 en 1,13. Pogingen om het scherm nog verder te kalibreren met onze X-Rite colorimeter zouden de deltaE-waarden voor grijswaarden en kleuren verbeteren tot slechts <0,5 elk. Toch is een kalibratie door de eindgebruiker meestal niet nodig als de deltaE-waarden al <2 zijn.
Responstijd Scherm
| ↔ Responstijd Zwart naar Wit | ||
|---|---|---|
| 9.1 ms ... stijging ↗ en daling ↘ gecombineerd | ↗ 4.9 ms stijging | 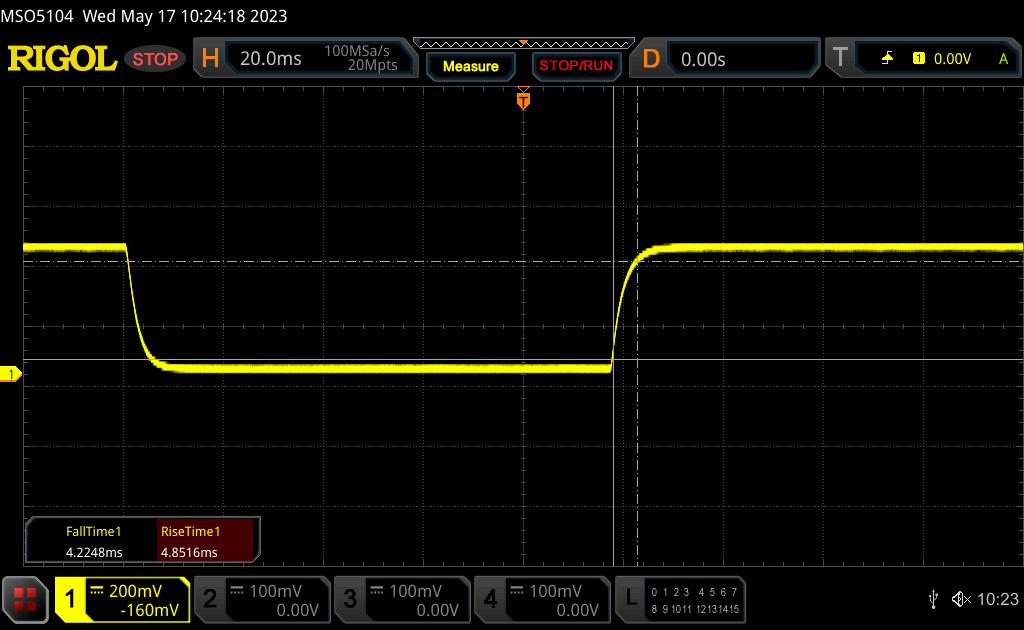 |
| ↘ 4.2 ms daling | ||
| Het scherm vertoonde snelle responstijden in onze tests en zou geschikt moeten zijn voor games. Ter vergelijking: alle testtoestellen variëren van 0.1 (minimum) tot 240 (maximum) ms. » 26 % van alle toestellen zijn beter. Dit betekent dat de gemeten responstijd beter is dan het gemiddelde (19.8 ms) van alle geteste toestellen. | ||
| ↔ Responstijd 50% Grijs naar 80% Grijs | ||
| 7 ms ... stijging ↗ en daling ↘ gecombineerd | ↗ 3.2 ms stijging | 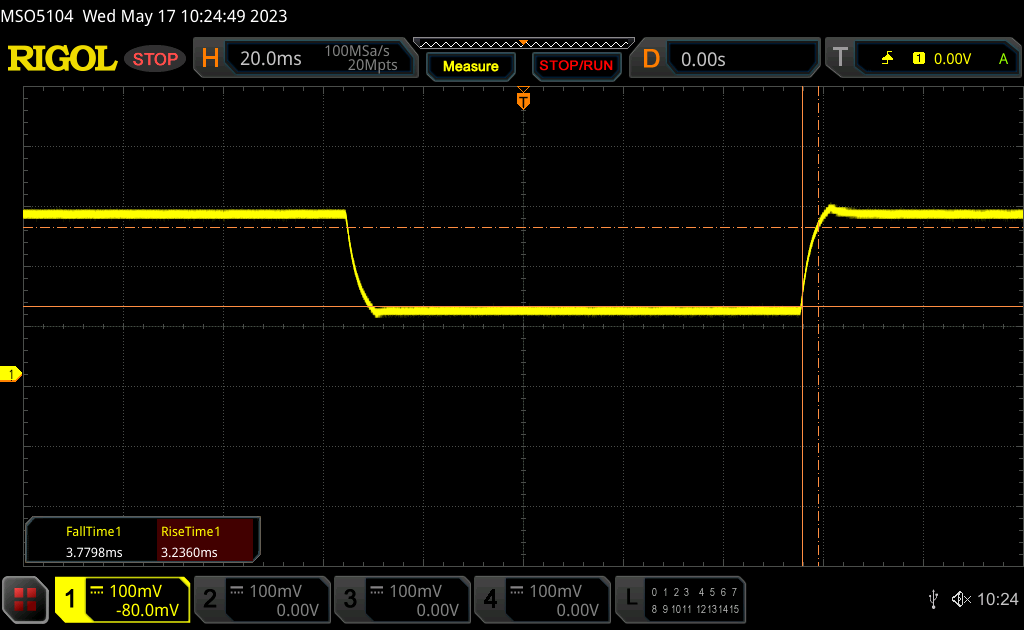 |
| ↘ 3.8 ms daling | ||
| Het scherm vertoonde erg snelle responstijden in onze tests en zou zeer geschikt moeten zijn voor snelle games. Ter vergelijking: alle testtoestellen variëren van 0.165 (minimum) tot 636 (maximum) ms. » 20 % van alle toestellen zijn beter. Dit betekent dat de gemeten responstijd beter is dan het gemiddelde (31 ms) van alle geteste toestellen. | ||
Screen Flickering / PWM (Pulse-Width Modulation)
| Screen flickering / PWM niet waargenomen | 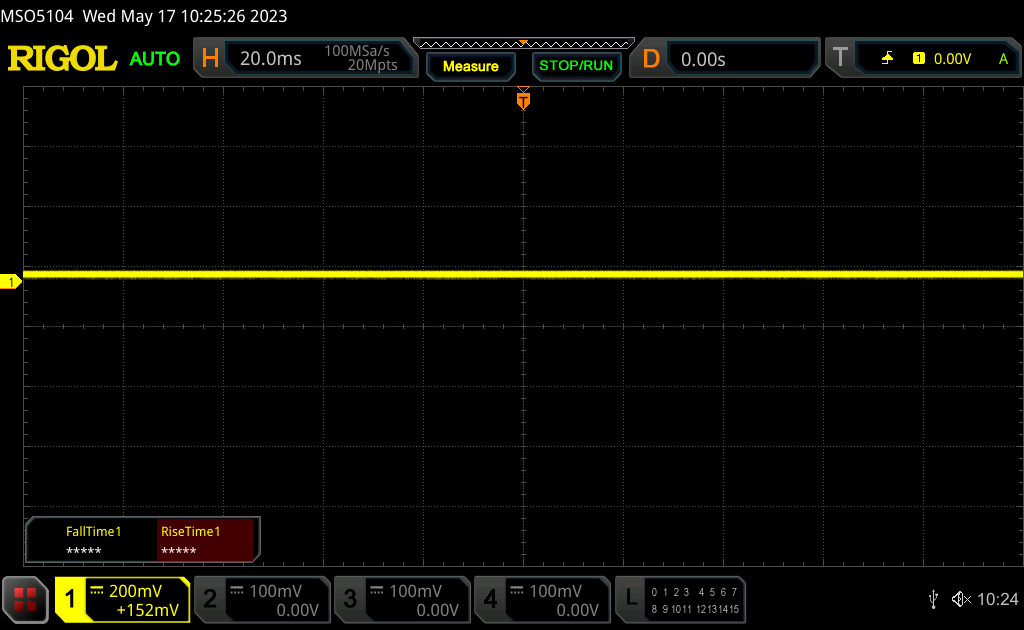 | ||
Ter vergelijking: 52 % van alle geteste toestellen maakten geen gebruik van PWM om de schermhelderheid te verlagen. Als het wel werd gebruikt, werd een gemiddelde van 7769 (minimum: 5 - maximum: 343500) Hz waargenomen. | |||
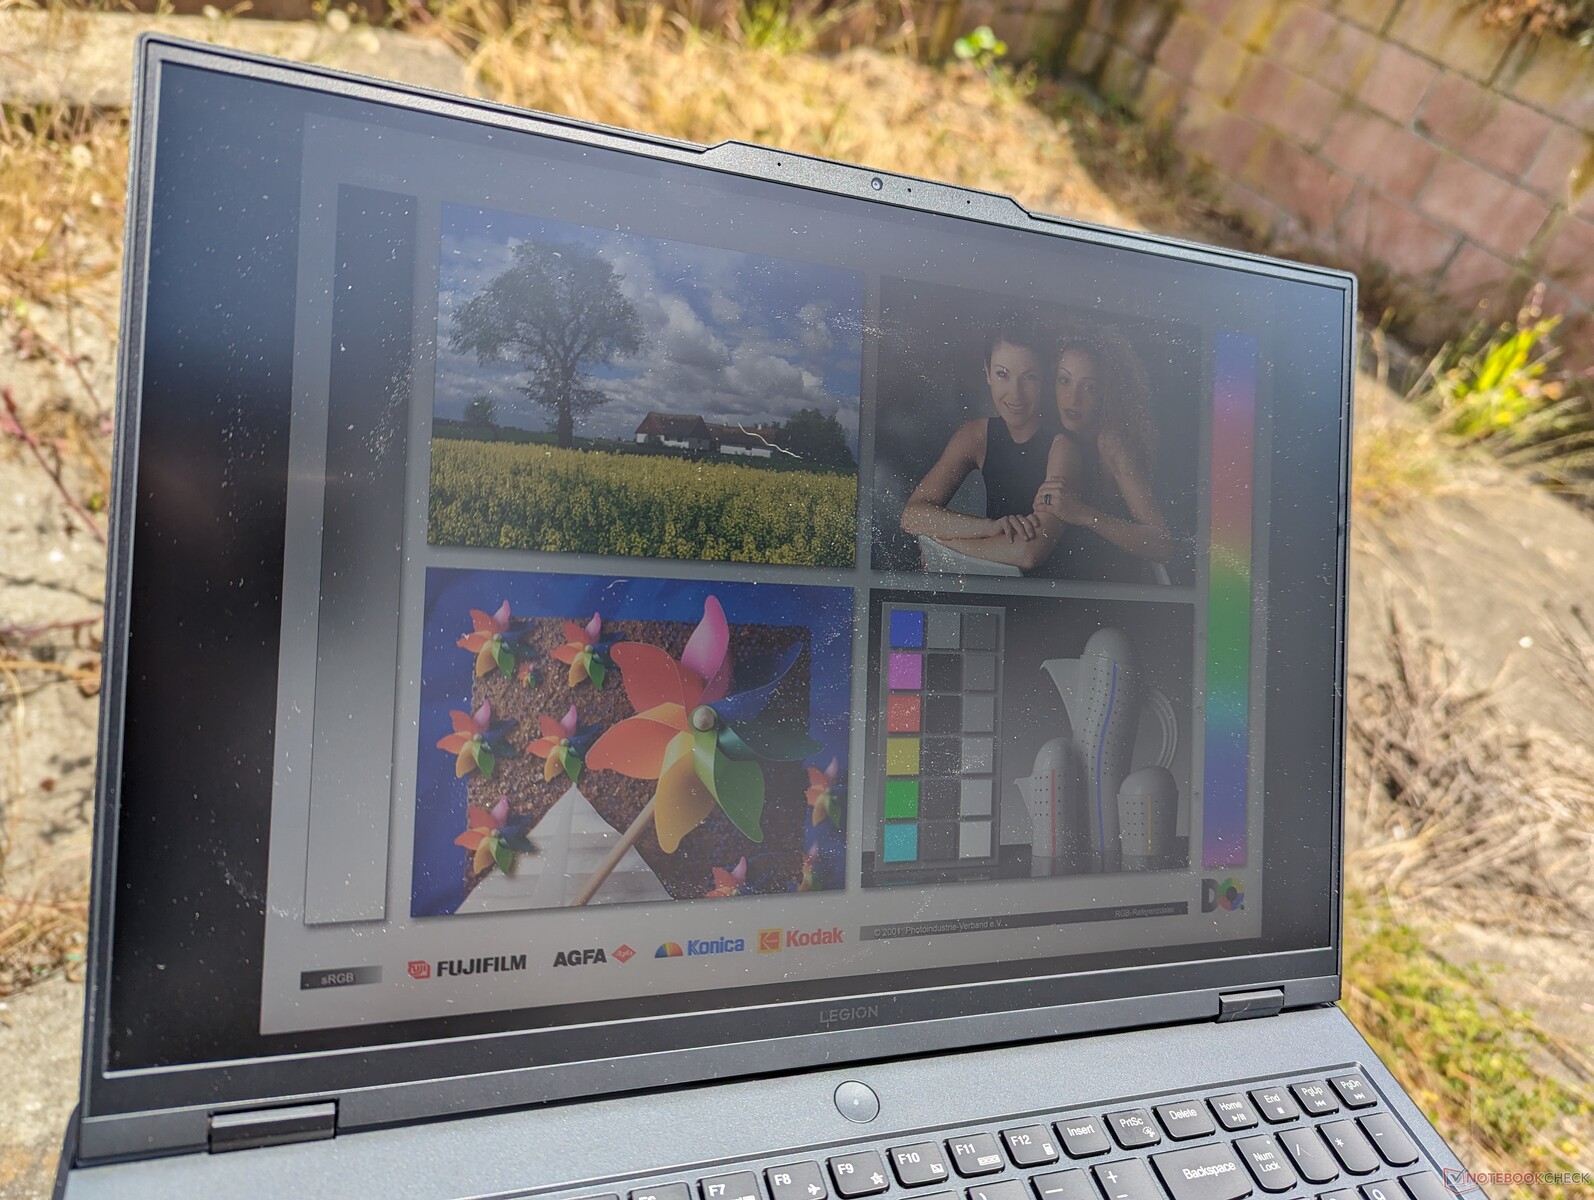
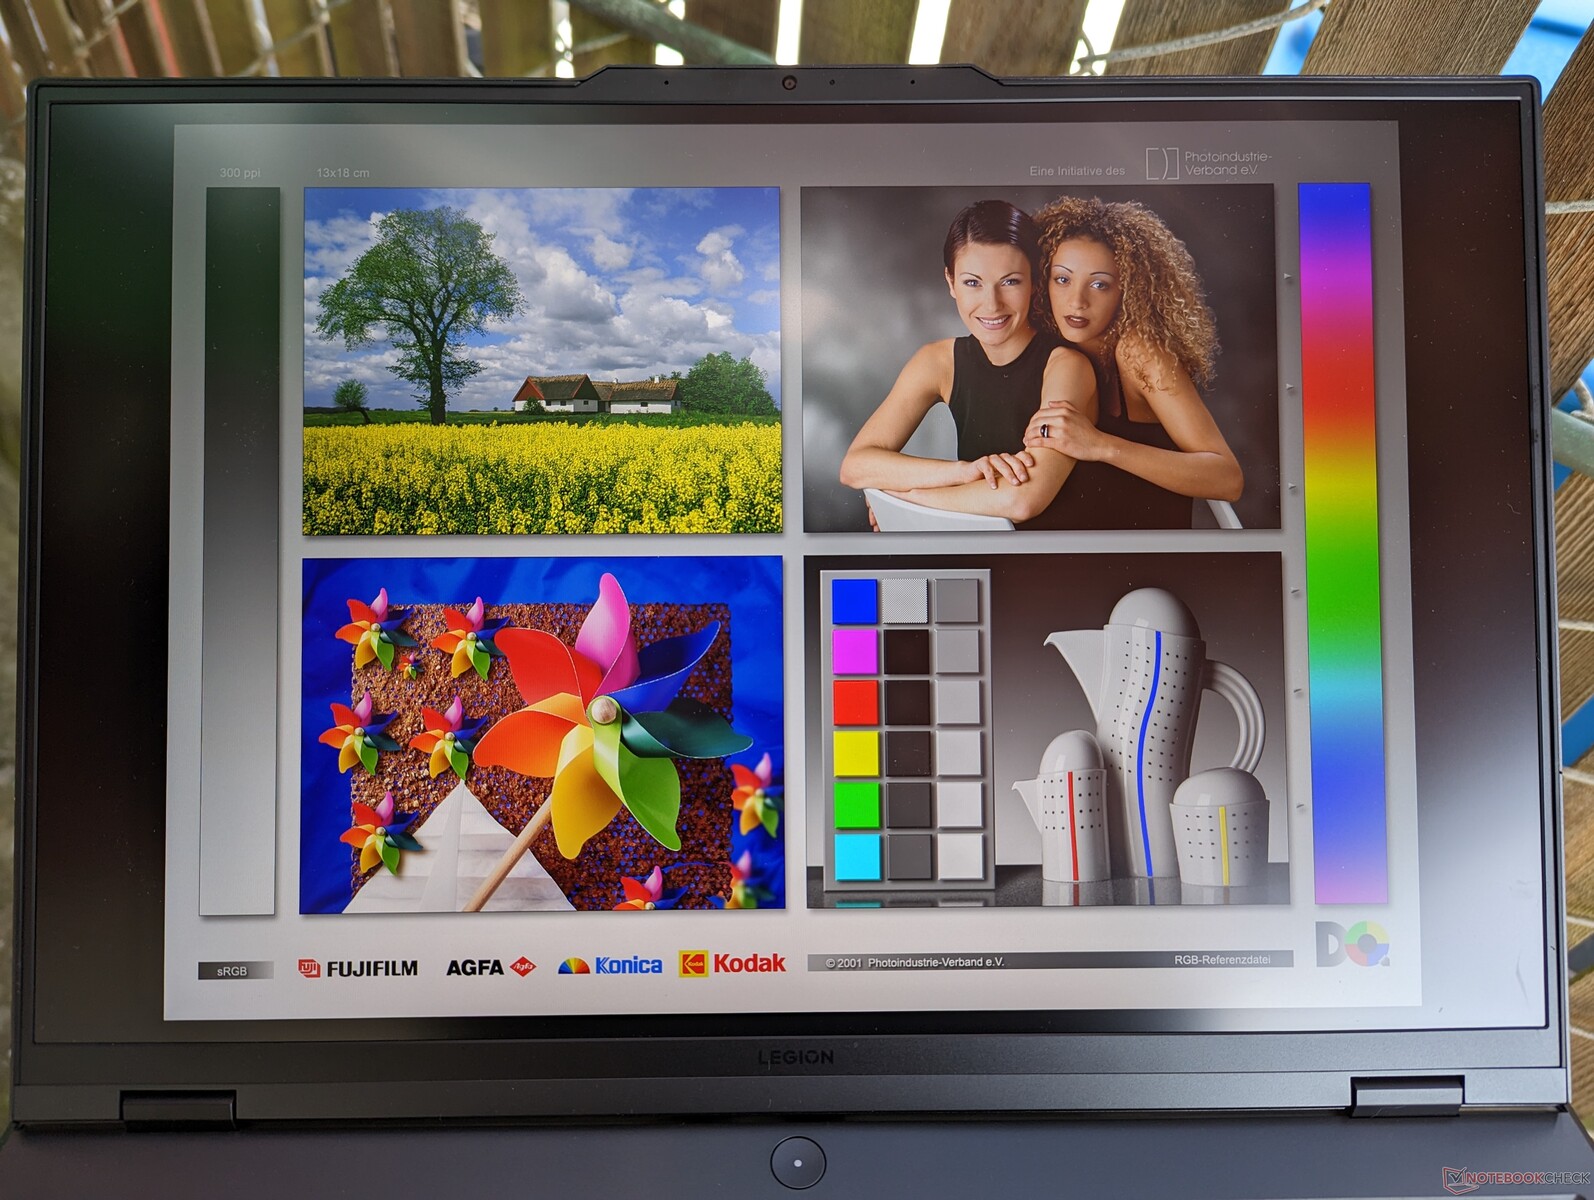
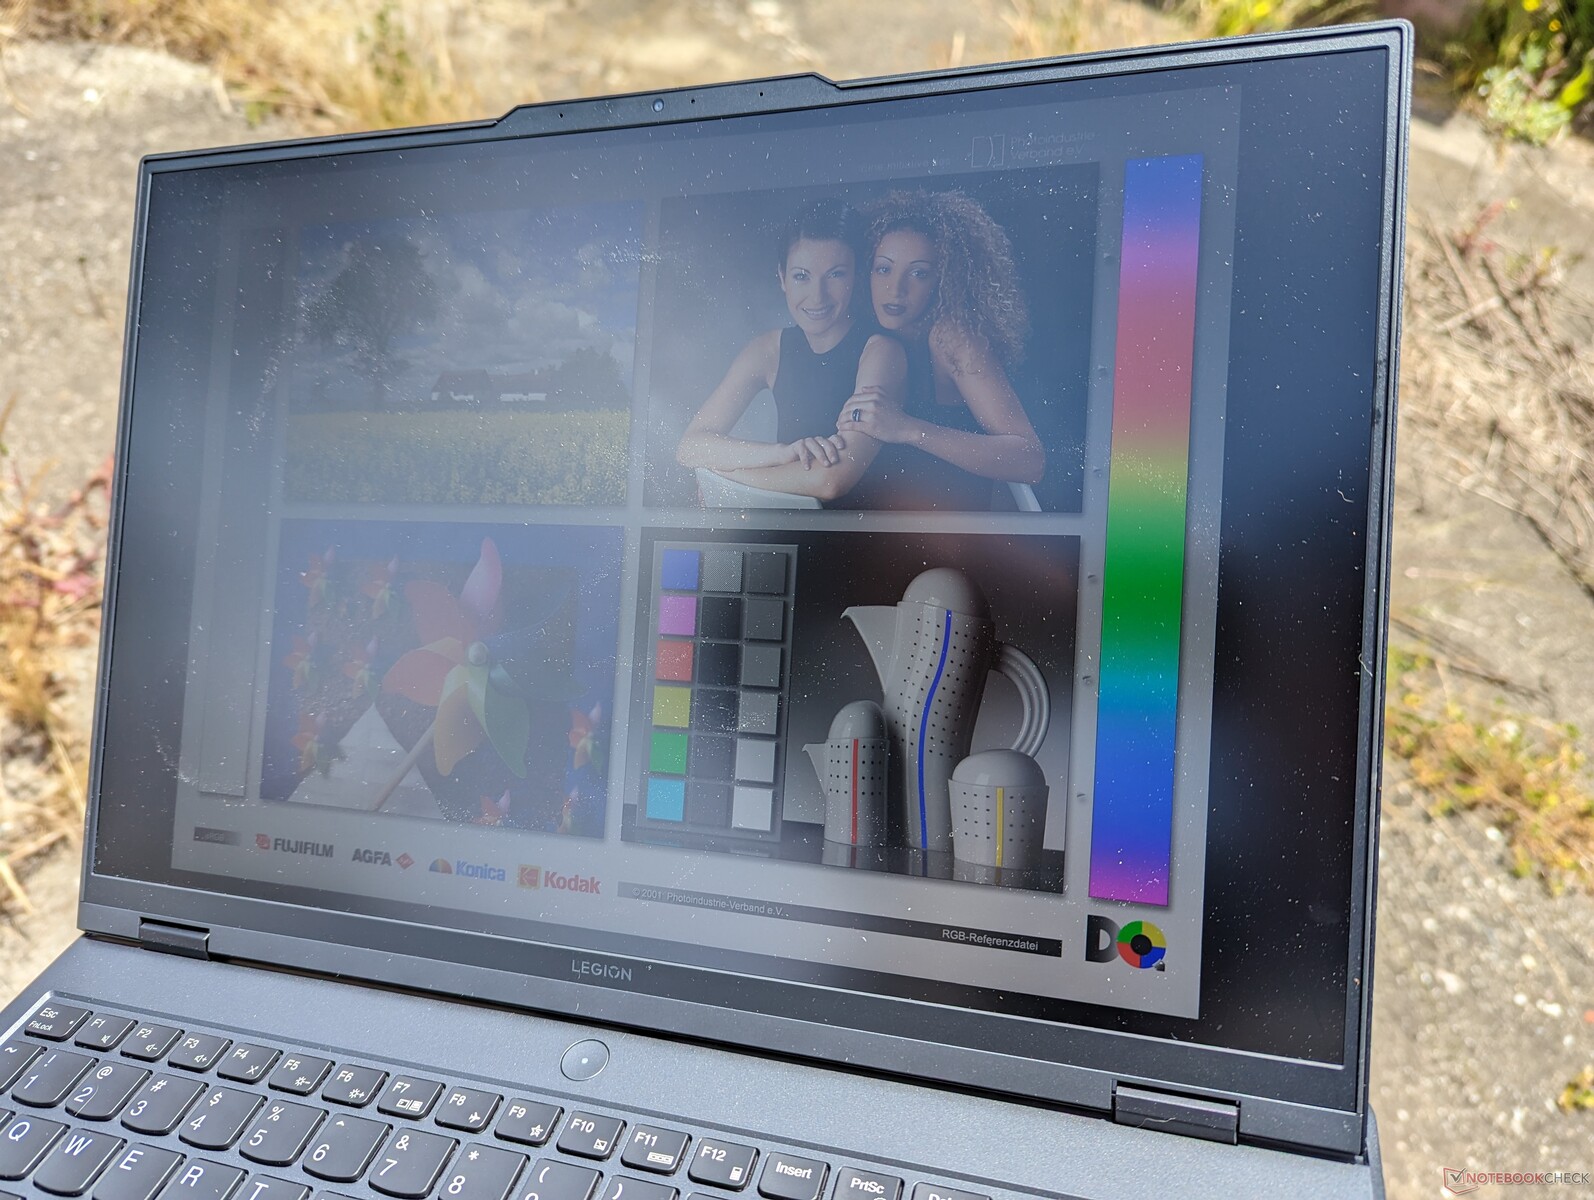
De zichtbaarheid buiten is gemiddeld voor deze categorie, aangezien de schermen op de meeste gaming laptops meestal tussen 300 en 400 nits liggen. De 240 Hz paneeloptie belooft 500 nits te zijn, of ongeveer 200 nits helderder dan ons 165 Hz paneel, wat de zichtbaarheid buiten zou moeten verbeteren als het een zorg is. Hoe dan ook, je zult waar mogelijk in de schaduw willen werken om schittering te minimaliseren en kleuren te behouden.

Prestaties - Midrange Zen 4 Ryzen 7
Testomstandigheden
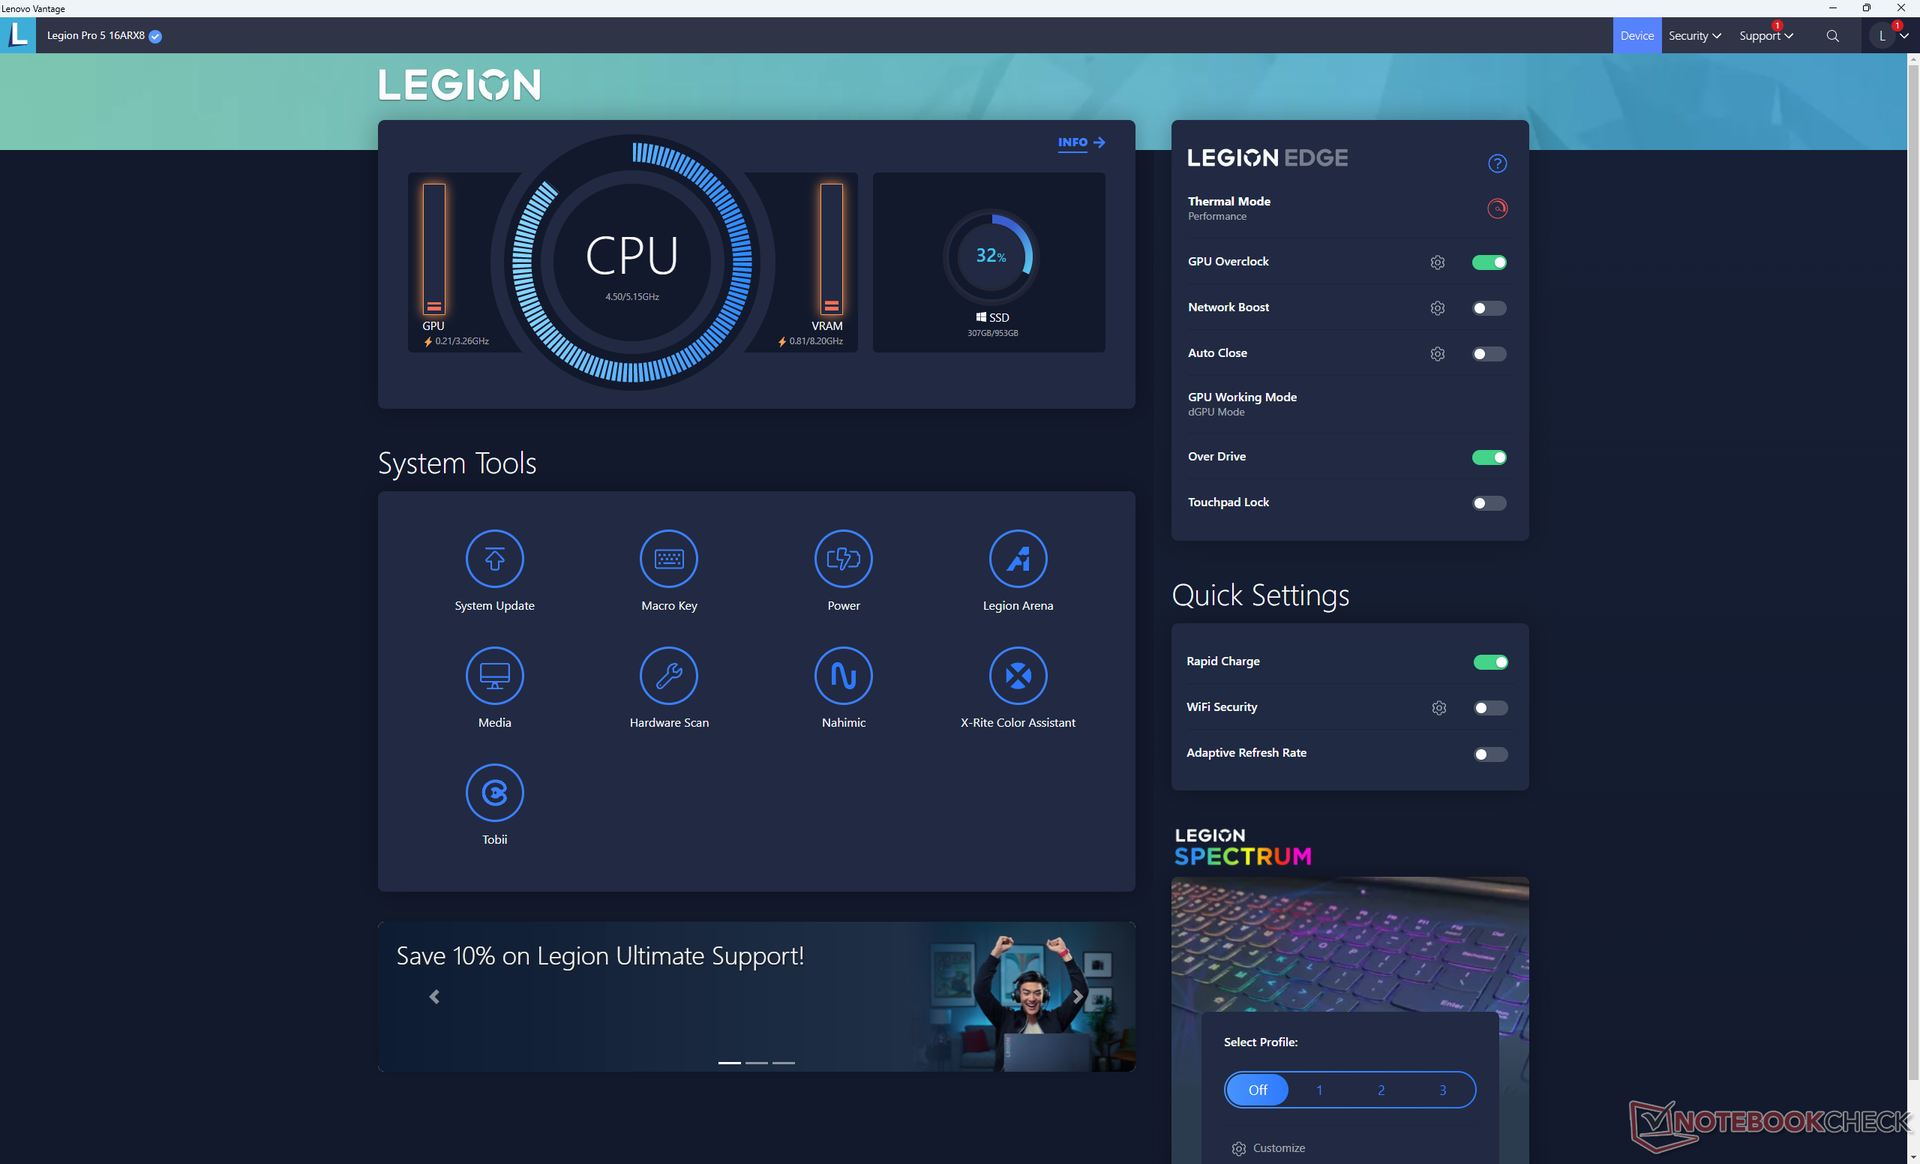
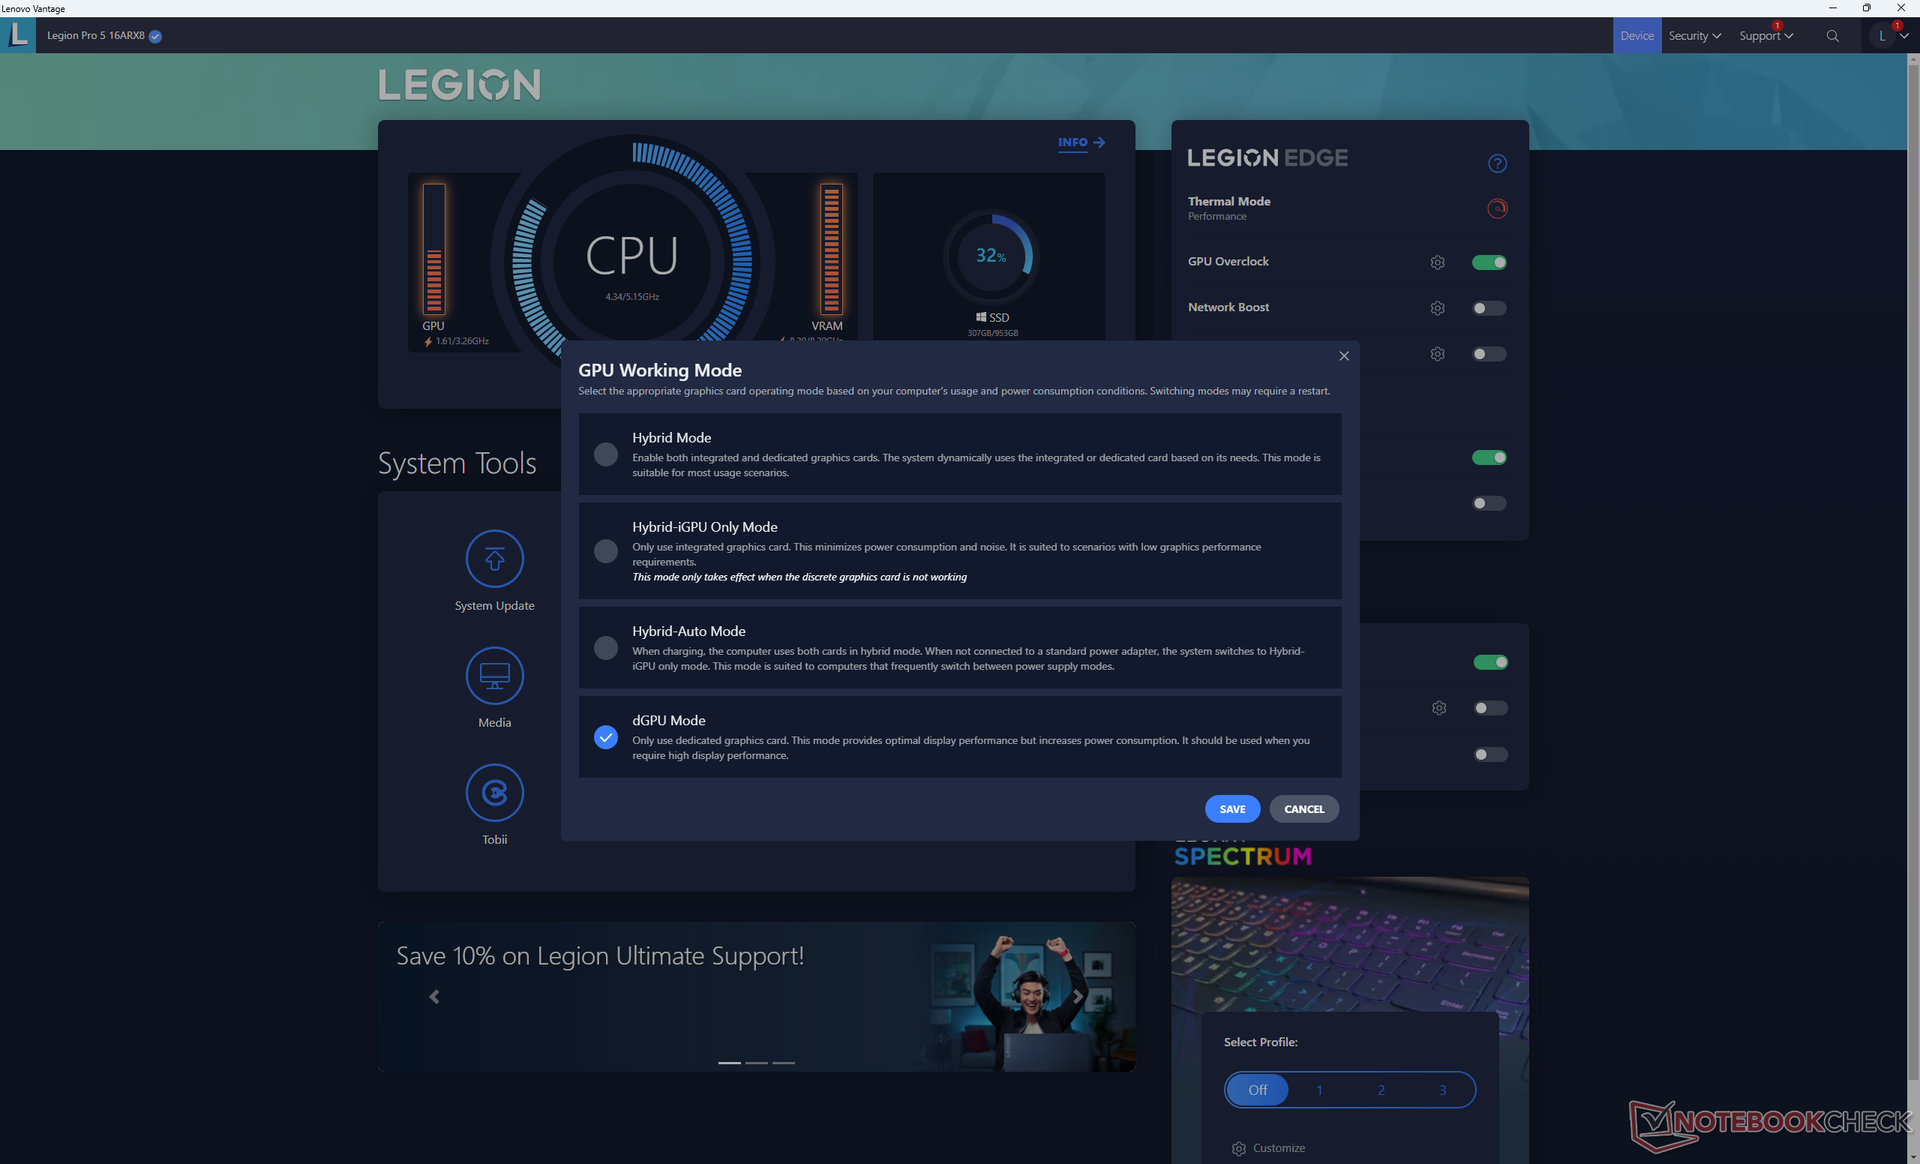
We hebben ons toestel via zowel Windows als de Lenovo Vantage software in de Performance modus gezet alvorens onderstaande benchmarks uit te voeren. We hebben er ook voor gezorgd dat de graphics in de dGPU modus staan met de vooraf ingestelde GPU Overclock functie actief. Het is aanbevolen om vertrouwd te raken met Vantage, omdat het de belangrijkste interface is voor het regelen van toetsenbordverlichting, Lenovo-specifieke updates, GPU-gedrag en meer.
MUX wordt ondersteund voor het schakelen tussen Optimus (iGPU + dGPU) of alleen dGPU. G-Sync wordt alleen ondersteund op het interne beeldscherm in de dGPU-modus. Een herstart is vereist bij het schakelen tussen de Optimus- en dGPU-modus, aangezien Advanced Optimus niet wordt ondersteund. Vervelend genoeg duurt het herstarten bij het schakelen tussen grafische modi veel langer dan een gewone herstart.
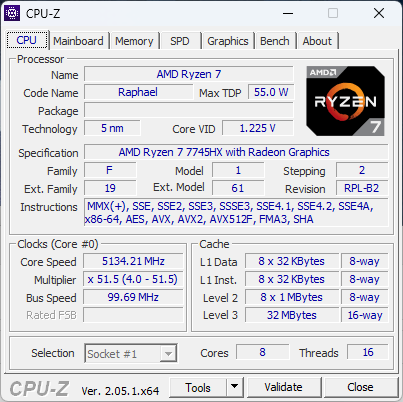
Processor
Na het ervaren van de ongelooflijke Zen 4Ryzen 9 7945HX om vervolgens teleurgesteld te worden door de teleurstellende Zen 3Ryzen 7 7735HSwisten we niet zeker wat we moesten verwachten van de Zen 4Ryzen 7 7745HX. Gelukkig zijn de resultaten uitstekend voor een midrange CPU met single- en multi-thread prestatiescores die respectievelijk 15 en 30 procent hoger zijn dan de Ryzen 7 7735HS. De Ryzen 7 7745HX ligt daarmee binnen het bereik van de concurrerende Core i7-13700HX met slechts 5 tot 15 procent in de meeste benchmarks, waaronder LibreOffice en HWBOT x265 4K. Het is zeker een redelijke upgrade ten opzichte van deRyzen 7 6800H of Ryzen 9 6900HX in vergelijking met de Ryzen 7 7735HX.
Lenovo biedt een langzamere Ryzen 5 7645HX optie met minder kernen dan de Ryzen 7 7745HX (6 vs. 8). We moeten de Ryzen 5 7645HX echter nog persoonlijk testen, dus de prestatieverschillen tussen de twee opties zijn vooralsnog onbekend.
Cinebench R15 Multi Loop
Cinebench R23: Multi Core | Single Core
Cinebench R20: CPU (Multi Core) | CPU (Single Core)
Cinebench R15: CPU Multi 64Bit | CPU Single 64Bit
Blender: v2.79 BMW27 CPU
7-Zip 18.03: 7z b 4 | 7z b 4 -mmt1
Geekbench 5.5: Multi-Core | Single-Core
HWBOT x265 Benchmark v2.2: 4k Preset
LibreOffice : 20 Documents To PDF
R Benchmark 2.5: Overall mean
| CPU Performance rating | |
| Schenker XMG SECTOR, i9 13900K, RTX 4090 | |
| Alienware m18 R1 | |
| Schenker XMG Neo 16 E23 | |
| Gemiddeld AMD Ryzen 7 7745HX | |
| Lenovo Legion Pro 5 16ARX8 | |
| MSI GE67 HX 12UGS | |
| Lenovo Legion Pro 5 16IRX8 | |
| MSI Pulse GL76 12UGK | |
| Asus TUF Gaming A16 FA617 | |
| Schenker XMG Core 15 (M22) | |
| Asus ROG Strix G15 G513RW | |
| MSI Alpha 15 B5EEK-008 | |
| Cinebench R23 / Multi Core | |
| Schenker XMG SECTOR, i9 13900K, RTX 4090 | |
| Alienware m18 R1 | |
| Schenker XMG Neo 16 E23 | |
| MSI GE67 HX 12UGS | |
| Lenovo Legion Pro 5 16IRX8 | |
| Gemiddeld AMD Ryzen 7 7745HX (18060 - 18845, n=2) | |
| Lenovo Legion Pro 5 16ARX8 | |
| MSI Pulse GL76 12UGK | |
| Schenker XMG Core 15 (M22) | |
| Asus TUF Gaming A16 FA617 | |
| Asus ROG Strix G15 G513RW | |
| MSI Alpha 15 B5EEK-008 | |
| Cinebench R23 / Single Core | |
| Schenker XMG SECTOR, i9 13900K, RTX 4090 | |
| Alienware m18 R1 | |
| Schenker XMG Neo 16 E23 | |
| Gemiddeld AMD Ryzen 7 7745HX (1846 - 1854, n=2) | |
| Lenovo Legion Pro 5 16ARX8 | |
| MSI GE67 HX 12UGS | |
| MSI Pulse GL76 12UGK | |
| Lenovo Legion Pro 5 16IRX8 | |
| Asus TUF Gaming A16 FA617 | |
| Schenker XMG Core 15 (M22) | |
| Asus ROG Strix G15 G513RW | |
| MSI Alpha 15 B5EEK-008 | |
| Cinebench R20 / CPU (Multi Core) | |
| Schenker XMG SECTOR, i9 13900K, RTX 4090 | |
| Alienware m18 R1 | |
| Schenker XMG Neo 16 E23 | |
| MSI GE67 HX 12UGS | |
| Gemiddeld AMD Ryzen 7 7745HX (7072 - 7399, n=2) | |
| Lenovo Legion Pro 5 16ARX8 | |
| Lenovo Legion Pro 5 16IRX8 | |
| MSI Pulse GL76 12UGK | |
| Schenker XMG Core 15 (M22) | |
| Asus TUF Gaming A16 FA617 | |
| Asus ROG Strix G15 G513RW | |
| MSI Alpha 15 B5EEK-008 | |
| Cinebench R20 / CPU (Single Core) | |
| Schenker XMG SECTOR, i9 13900K, RTX 4090 | |
| Alienware m18 R1 | |
| Schenker XMG Neo 16 E23 | |
| Gemiddeld AMD Ryzen 7 7745HX (717 - 719, n=2) | |
| Lenovo Legion Pro 5 16ARX8 | |
| MSI GE67 HX 12UGS | |
| MSI Pulse GL76 12UGK | |
| Lenovo Legion Pro 5 16IRX8 | |
| Asus TUF Gaming A16 FA617 | |
| Schenker XMG Core 15 (M22) | |
| Asus ROG Strix G15 G513RW | |
| MSI Alpha 15 B5EEK-008 | |
| Cinebench R15 / CPU Multi 64Bit | |
| Schenker XMG SECTOR, i9 13900K, RTX 4090 | |
| Alienware m18 R1 | |
| Schenker XMG Neo 16 E23 | |
| MSI GE67 HX 12UGS | |
| Lenovo Legion Pro 5 16IRX8 | |
| Gemiddeld AMD Ryzen 7 7745HX (2978 - 2994, n=2) | |
| Lenovo Legion Pro 5 16ARX8 | |
| MSI Pulse GL76 12UGK | |
| Schenker XMG Core 15 (M22) | |
| Asus TUF Gaming A16 FA617 | |
| Asus ROG Strix G15 G513RW | |
| MSI Alpha 15 B5EEK-008 | |
| Cinebench R15 / CPU Single 64Bit | |
| Schenker XMG SECTOR, i9 13900K, RTX 4090 | |
| Alienware m18 R1 | |
| Schenker XMG Neo 16 E23 | |
| Gemiddeld AMD Ryzen 7 7745HX (294 - 295, n=2) | |
| Lenovo Legion Pro 5 16ARX8 | |
| Lenovo Legion Pro 5 16IRX8 | |
| MSI GE67 HX 12UGS | |
| MSI Pulse GL76 12UGK | |
| Schenker XMG Core 15 (M22) | |
| Asus TUF Gaming A16 FA617 | |
| Asus ROG Strix G15 G513RW | |
| MSI Alpha 15 B5EEK-008 | |
| Blender / v2.79 BMW27 CPU | |
| MSI Alpha 15 B5EEK-008 | |
| Asus ROG Strix G15 G513RW | |
| Asus TUF Gaming A16 FA617 | |
| Schenker XMG Core 15 (M22) | |
| MSI Pulse GL76 12UGK | |
| Lenovo Legion Pro 5 16ARX8 | |
| Gemiddeld AMD Ryzen 7 7745HX (169 - 174, n=2) | |
| MSI GE67 HX 12UGS | |
| Lenovo Legion Pro 5 16IRX8 | |
| Schenker XMG Neo 16 E23 | |
| Alienware m18 R1 | |
| Schenker XMG SECTOR, i9 13900K, RTX 4090 | |
| 7-Zip 18.03 / 7z b 4 | |
| Schenker XMG SECTOR, i9 13900K, RTX 4090 | |
| Alienware m18 R1 | |
| Schenker XMG Neo 16 E23 | |
| Gemiddeld AMD Ryzen 7 7745HX (75557 - 83268, n=2) | |
| Lenovo Legion Pro 5 16IRX8 | |
| MSI GE67 HX 12UGS | |
| Lenovo Legion Pro 5 16ARX8 | |
| MSI Pulse GL76 12UGK | |
| Schenker XMG Core 15 (M22) | |
| Asus TUF Gaming A16 FA617 | |
| Asus ROG Strix G15 G513RW | |
| MSI Alpha 15 B5EEK-008 | |
| 7-Zip 18.03 / 7z b 4 -mmt1 | |
| Gemiddeld AMD Ryzen 7 7745HX (7244 - 7275, n=2) | |
| Lenovo Legion Pro 5 16ARX8 | |
| Schenker XMG SECTOR, i9 13900K, RTX 4090 | |
| Schenker XMG Neo 16 E23 | |
| Alienware m18 R1 | |
| Asus ROG Strix G15 G513RW | |
| Schenker XMG Core 15 (M22) | |
| Asus TUF Gaming A16 FA617 | |
| Lenovo Legion Pro 5 16IRX8 | |
| MSI Pulse GL76 12UGK | |
| MSI GE67 HX 12UGS | |
| MSI Alpha 15 B5EEK-008 | |
| Geekbench 5.5 / Multi-Core | |
| Schenker XMG SECTOR, i9 13900K, RTX 4090 | |
| Alienware m18 R1 | |
| Schenker XMG Neo 16 E23 | |
| MSI GE67 HX 12UGS | |
| Lenovo Legion Pro 5 16IRX8 | |
| Gemiddeld AMD Ryzen 7 7745HX (12378 - 13462, n=2) | |
| Lenovo Legion Pro 5 16ARX8 | |
| MSI Pulse GL76 12UGK | |
| Schenker XMG Core 15 (M22) | |
| Asus TUF Gaming A16 FA617 | |
| Asus ROG Strix G15 G513RW | |
| MSI Alpha 15 B5EEK-008 | |
| Geekbench 5.5 / Single-Core | |
| Schenker XMG SECTOR, i9 13900K, RTX 4090 | |
| Alienware m18 R1 | |
| Gemiddeld AMD Ryzen 7 7745HX (2040 - 2067, n=2) | |
| Schenker XMG Neo 16 E23 | |
| Lenovo Legion Pro 5 16ARX8 | |
| Lenovo Legion Pro 5 16IRX8 | |
| MSI GE67 HX 12UGS | |
| MSI Pulse GL76 12UGK | |
| Asus ROG Strix G15 G513RW | |
| Asus TUF Gaming A16 FA617 | |
| Schenker XMG Core 15 (M22) | |
| MSI Alpha 15 B5EEK-008 | |
| HWBOT x265 Benchmark v2.2 / 4k Preset | |
| Schenker XMG SECTOR, i9 13900K, RTX 4090 | |
| Alienware m18 R1 | |
| Schenker XMG Neo 16 E23 | |
| MSI GE67 HX 12UGS | |
| Lenovo Legion Pro 5 16IRX8 | |
| Gemiddeld AMD Ryzen 7 7745HX (23.2 - 24.1, n=2) | |
| Lenovo Legion Pro 5 16ARX8 | |
| MSI Pulse GL76 12UGK | |
| Schenker XMG Core 15 (M22) | |
| Asus TUF Gaming A16 FA617 | |
| Asus ROG Strix G15 G513RW | |
| MSI Alpha 15 B5EEK-008 | |
| LibreOffice / 20 Documents To PDF | |
| Schenker XMG Core 15 (M22) | |
| Asus ROG Strix G15 G513RW | |
| Asus TUF Gaming A16 FA617 | |
| MSI Alpha 15 B5EEK-008 | |
| Alienware m18 R1 | |
| MSI Pulse GL76 12UGK | |
| MSI GE67 HX 12UGS | |
| Gemiddeld AMD Ryzen 7 7745HX (37.9 - 41.4, n=2) | |
| Lenovo Legion Pro 5 16ARX8 | |
| Schenker XMG Neo 16 E23 | |
| Schenker XMG SECTOR, i9 13900K, RTX 4090 | |
| Lenovo Legion Pro 5 16IRX8 | |
| R Benchmark 2.5 / Overall mean | |
| MSI Alpha 15 B5EEK-008 | |
| Asus TUF Gaming A16 FA617 | |
| Asus ROG Strix G15 G513RW | |
| Schenker XMG Core 15 (M22) | |
| Lenovo Legion Pro 5 16IRX8 | |
| MSI Pulse GL76 12UGK | |
| MSI GE67 HX 12UGS | |
| Lenovo Legion Pro 5 16ARX8 | |
| Gemiddeld AMD Ryzen 7 7745HX (0.4141 - 0.421, n=2) | |
| Alienware m18 R1 | |
| Schenker XMG Neo 16 E23 | |
| Schenker XMG SECTOR, i9 13900K, RTX 4090 | |
* ... kleiner is beter
AIDA64: FP32 Ray-Trace | FPU Julia | CPU SHA3 | CPU Queen | FPU SinJulia | FPU Mandel | CPU AES | CPU ZLib | FP64 Ray-Trace | CPU PhotoWorxx
| Performance rating | |
| Asus ROG Strix G16 G614JZ | |
| Schenker XMG Neo 16 E23 | |
| Gemiddeld AMD Ryzen 7 7745HX | |
| Lenovo Legion Pro 5 16ARX8 | |
| Uniwill GM6PX7X RTX 4070 | |
| Lenovo Legion Pro 5 16IRX8 | |
| AIDA64 / FP32 Ray-Trace | |
| Lenovo Legion Pro 5 16ARX8 | |
| Gemiddeld AMD Ryzen 7 7745HX (29066 - 29656, n=2) | |
| Asus ROG Strix G16 G614JZ | |
| Schenker XMG Neo 16 E23 | |
| Uniwill GM6PX7X RTX 4070 | |
| Lenovo Legion Pro 5 16IRX8 | |
| AIDA64 / FPU Julia | |
| Asus ROG Strix G16 G614JZ | |
| Gemiddeld AMD Ryzen 7 7745HX (120974 - 123689, n=2) | |
| Lenovo Legion Pro 5 16ARX8 | |
| Schenker XMG Neo 16 E23 | |
| Uniwill GM6PX7X RTX 4070 | |
| Lenovo Legion Pro 5 16IRX8 | |
| AIDA64 / CPU SHA3 | |
| Asus ROG Strix G16 G614JZ | |
| Schenker XMG Neo 16 E23 | |
| Gemiddeld AMD Ryzen 7 7745HX (4974 - 5204, n=2) | |
| Lenovo Legion Pro 5 16ARX8 | |
| Uniwill GM6PX7X RTX 4070 | |
| Lenovo Legion Pro 5 16IRX8 | |
| AIDA64 / CPU Queen | |
| Asus ROG Strix G16 G614JZ | |
| Schenker XMG Neo 16 E23 | |
| Gemiddeld AMD Ryzen 7 7745HX (126954 - 128143, n=2) | |
| Lenovo Legion Pro 5 16ARX8 | |
| Lenovo Legion Pro 5 16IRX8 | |
| Uniwill GM6PX7X RTX 4070 | |
| AIDA64 / FPU SinJulia | |
| Asus ROG Strix G16 G614JZ | |
| Gemiddeld AMD Ryzen 7 7745HX (15887 - 16221, n=2) | |
| Lenovo Legion Pro 5 16ARX8 | |
| Schenker XMG Neo 16 E23 | |
| Lenovo Legion Pro 5 16IRX8 | |
| Uniwill GM6PX7X RTX 4070 | |
| AIDA64 / FPU Mandel | |
| Asus ROG Strix G16 G614JZ | |
| Gemiddeld AMD Ryzen 7 7745HX (64255 - 64969, n=2) | |
| Lenovo Legion Pro 5 16ARX8 | |
| Schenker XMG Neo 16 E23 | |
| Uniwill GM6PX7X RTX 4070 | |
| Lenovo Legion Pro 5 16IRX8 | |
| AIDA64 / CPU AES | |
| Schenker XMG Neo 16 E23 | |
| Uniwill GM6PX7X RTX 4070 | |
| Asus ROG Strix G16 G614JZ | |
| Lenovo Legion Pro 5 16IRX8 | |
| Gemiddeld AMD Ryzen 7 7745HX (71191 - 95481, n=2) | |
| Lenovo Legion Pro 5 16ARX8 | |
| AIDA64 / CPU ZLib | |
| Asus ROG Strix G16 G614JZ | |
| Schenker XMG Neo 16 E23 | |
| Uniwill GM6PX7X RTX 4070 | |
| Lenovo Legion Pro 5 16IRX8 | |
| Gemiddeld AMD Ryzen 7 7745HX (1147 - 1176, n=2) | |
| Lenovo Legion Pro 5 16ARX8 | |
| AIDA64 / FP64 Ray-Trace | |
| Gemiddeld AMD Ryzen 7 7745HX (15975 - 16358, n=2) | |
| Lenovo Legion Pro 5 16ARX8 | |
| Asus ROG Strix G16 G614JZ | |
| Schenker XMG Neo 16 E23 | |
| Lenovo Legion Pro 5 16IRX8 | |
| Uniwill GM6PX7X RTX 4070 | |
| AIDA64 / CPU PhotoWorxx | |
| Schenker XMG Neo 16 E23 | |
| Uniwill GM6PX7X RTX 4070 | |
| Asus ROG Strix G16 G614JZ | |
| Lenovo Legion Pro 5 16IRX8 | |
| Gemiddeld AMD Ryzen 7 7745HX (28499 - 33304, n=2) | |
| Lenovo Legion Pro 5 16ARX8 | |
Systeemprestaties
CrossMark: Overall | Productivity | Creativity | Responsiveness
| PCMark 10 / Score | |
| Asus Zephyrus Duo 16 GX650PY-NM006W | |
| Uniwill GM6PX7X RTX 4070 | |
| Schenker XMG Neo 16 E23 | |
| Lenovo Legion Pro 5 16ARX8 | |
| Lenovo Legion Pro 5 16IRX8 | |
| Asus ROG Strix G16 G614JZ | |
| PCMark 10 / Essentials | |
| Asus Zephyrus Duo 16 GX650PY-NM006W | |
| Asus ROG Strix G16 G614JZ | |
| Uniwill GM6PX7X RTX 4070 | |
| Lenovo Legion Pro 5 16ARX8 | |
| Schenker XMG Neo 16 E23 | |
| Lenovo Legion Pro 5 16IRX8 | |
| PCMark 10 / Productivity | |
| Asus Zephyrus Duo 16 GX650PY-NM006W | |
| Uniwill GM6PX7X RTX 4070 | |
| Lenovo Legion Pro 5 16ARX8 | |
| Schenker XMG Neo 16 E23 | |
| Lenovo Legion Pro 5 16IRX8 | |
| Asus ROG Strix G16 G614JZ | |
| PCMark 10 / Digital Content Creation | |
| Schenker XMG Neo 16 E23 | |
| Asus Zephyrus Duo 16 GX650PY-NM006W | |
| Uniwill GM6PX7X RTX 4070 | |
| Lenovo Legion Pro 5 16ARX8 | |
| Lenovo Legion Pro 5 16IRX8 | |
| Asus ROG Strix G16 G614JZ | |
| CrossMark / Overall | |
| Asus ROG Strix G16 G614JZ | |
| Schenker XMG Neo 16 E23 | |
| Asus Zephyrus Duo 16 GX650PY-NM006W | |
| Lenovo Legion Pro 5 16ARX8 | |
| Uniwill GM6PX7X RTX 4070 | |
| Lenovo Legion Pro 5 16IRX8 | |
| CrossMark / Productivity | |
| Asus ROG Strix G16 G614JZ | |
| Schenker XMG Neo 16 E23 | |
| Asus Zephyrus Duo 16 GX650PY-NM006W | |
| Lenovo Legion Pro 5 16ARX8 | |
| Uniwill GM6PX7X RTX 4070 | |
| Lenovo Legion Pro 5 16IRX8 | |
| CrossMark / Creativity | |
| Schenker XMG Neo 16 E23 | |
| Asus ROG Strix G16 G614JZ | |
| Asus Zephyrus Duo 16 GX650PY-NM006W | |
| Lenovo Legion Pro 5 16ARX8 | |
| Uniwill GM6PX7X RTX 4070 | |
| Lenovo Legion Pro 5 16IRX8 | |
| CrossMark / Responsiveness | |
| Asus ROG Strix G16 G614JZ | |
| Lenovo Legion Pro 5 16ARX8 | |
| Uniwill GM6PX7X RTX 4070 | |
| Schenker XMG Neo 16 E23 | |
| Asus Zephyrus Duo 16 GX650PY-NM006W | |
| Lenovo Legion Pro 5 16IRX8 | |
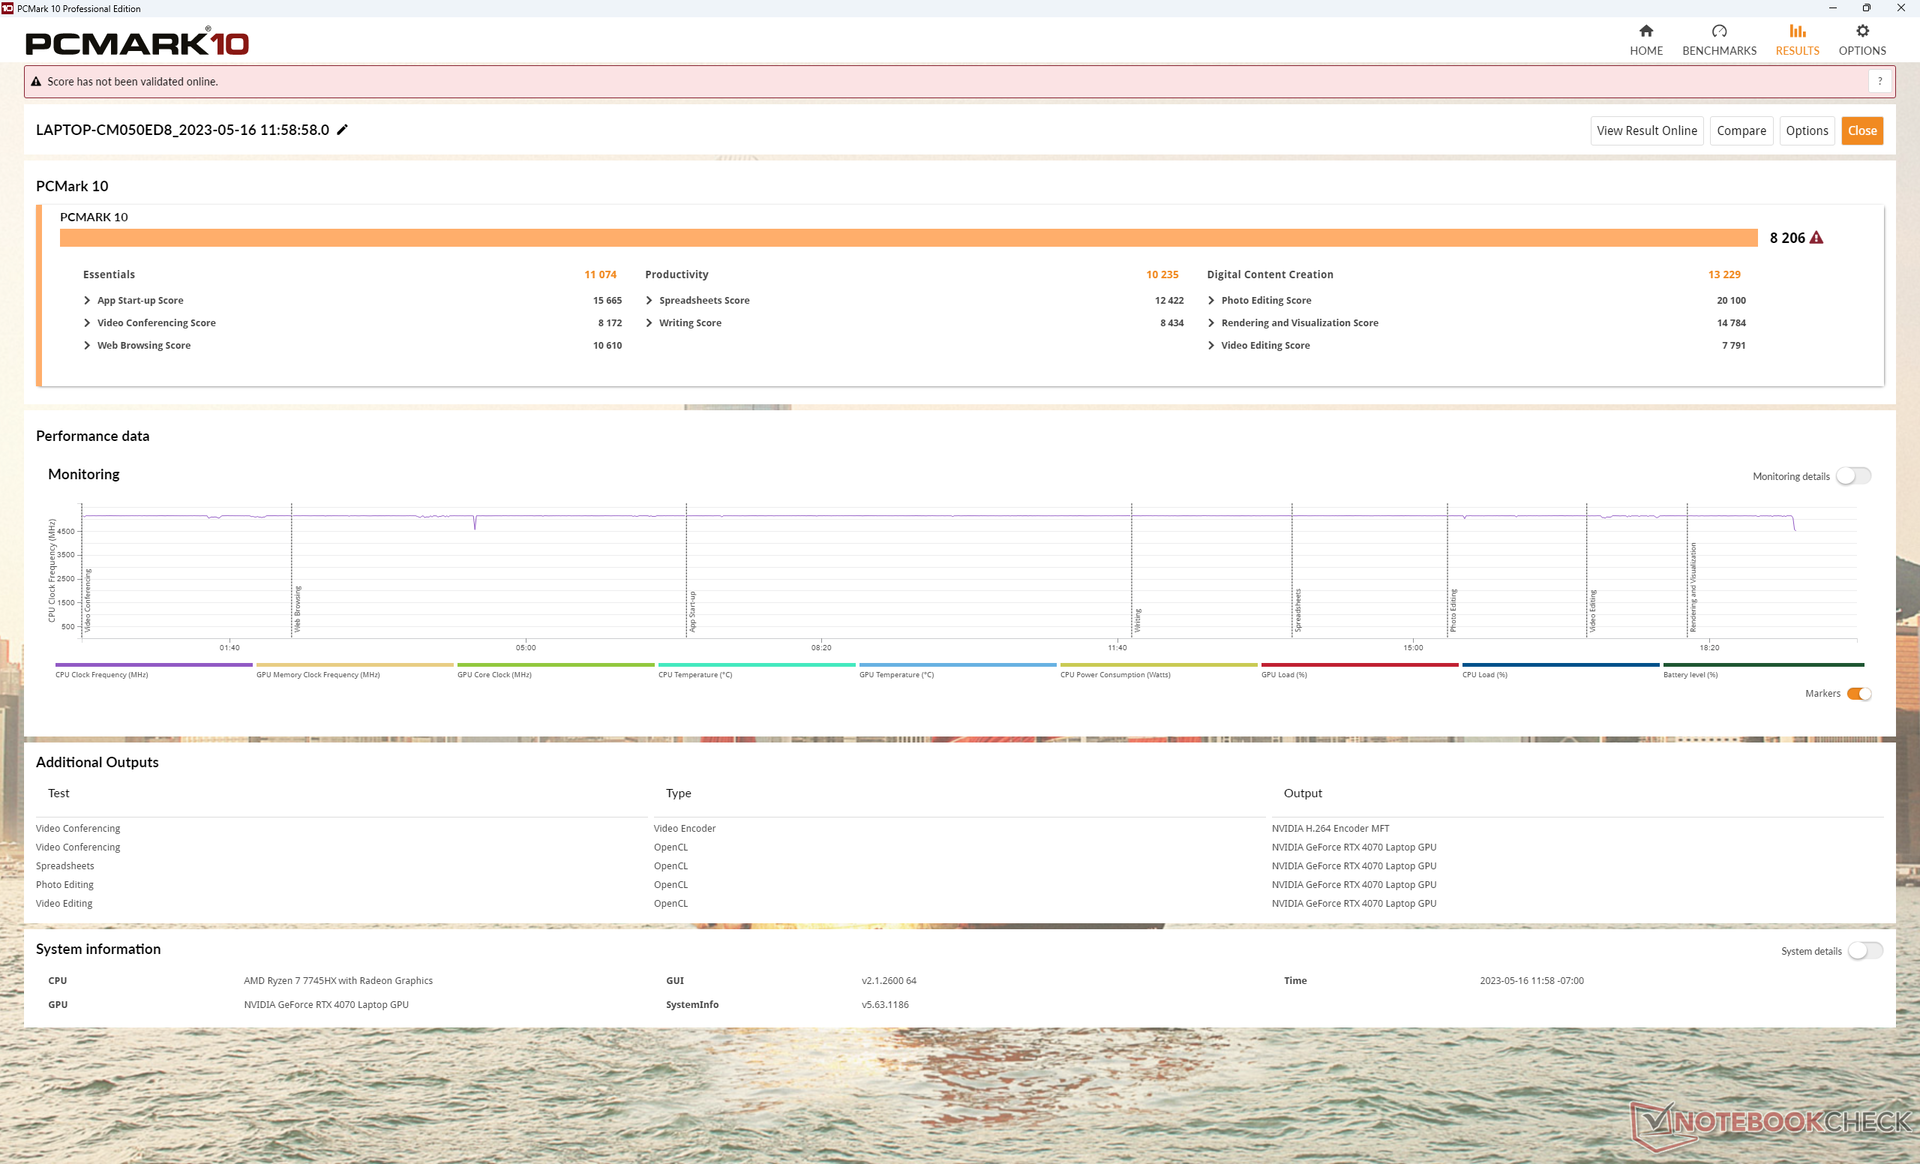
| PCMark 10 Score | 8206 punten | |
Help | ||
| AIDA64 / Memory Copy | |
| Schenker XMG Neo 16 E23 | |
| Uniwill GM6PX7X RTX 4070 | |
| Asus ROG Strix G16 G614JZ | |
| Lenovo Legion Pro 5 16IRX8 | |
| Gemiddeld AMD Ryzen 7 7745HX (50007 - 53867, n=2) | |
| Lenovo Legion Pro 5 16ARX8 | |
| AIDA64 / Memory Read | |
| Schenker XMG Neo 16 E23 | |
| Asus ROG Strix G16 G614JZ | |
| Uniwill GM6PX7X RTX 4070 | |
| Lenovo Legion Pro 5 16IRX8 | |
| Gemiddeld AMD Ryzen 7 7745HX (50703 - 54278, n=2) | |
| Lenovo Legion Pro 5 16ARX8 | |
| AIDA64 / Memory Write | |
| Schenker XMG Neo 16 E23 | |
| Lenovo Legion Pro 5 16IRX8 | |
| Uniwill GM6PX7X RTX 4070 | |
| Gemiddeld AMD Ryzen 7 7745HX (54587 - 70803, n=2) | |
| Asus ROG Strix G16 G614JZ | |
| Lenovo Legion Pro 5 16ARX8 | |
| AIDA64 / Memory Latency | |
| Asus ROG Strix G16 G614JZ | |
| Uniwill GM6PX7X RTX 4070 | |
| Lenovo Legion Pro 5 16ARX8 | |
| Schenker XMG Neo 16 E23 | |
| Gemiddeld AMD Ryzen 7 7745HX (80.7 - 86.5, n=2) | |
| Lenovo Legion Pro 5 16IRX8 | |
* ... kleiner is beter
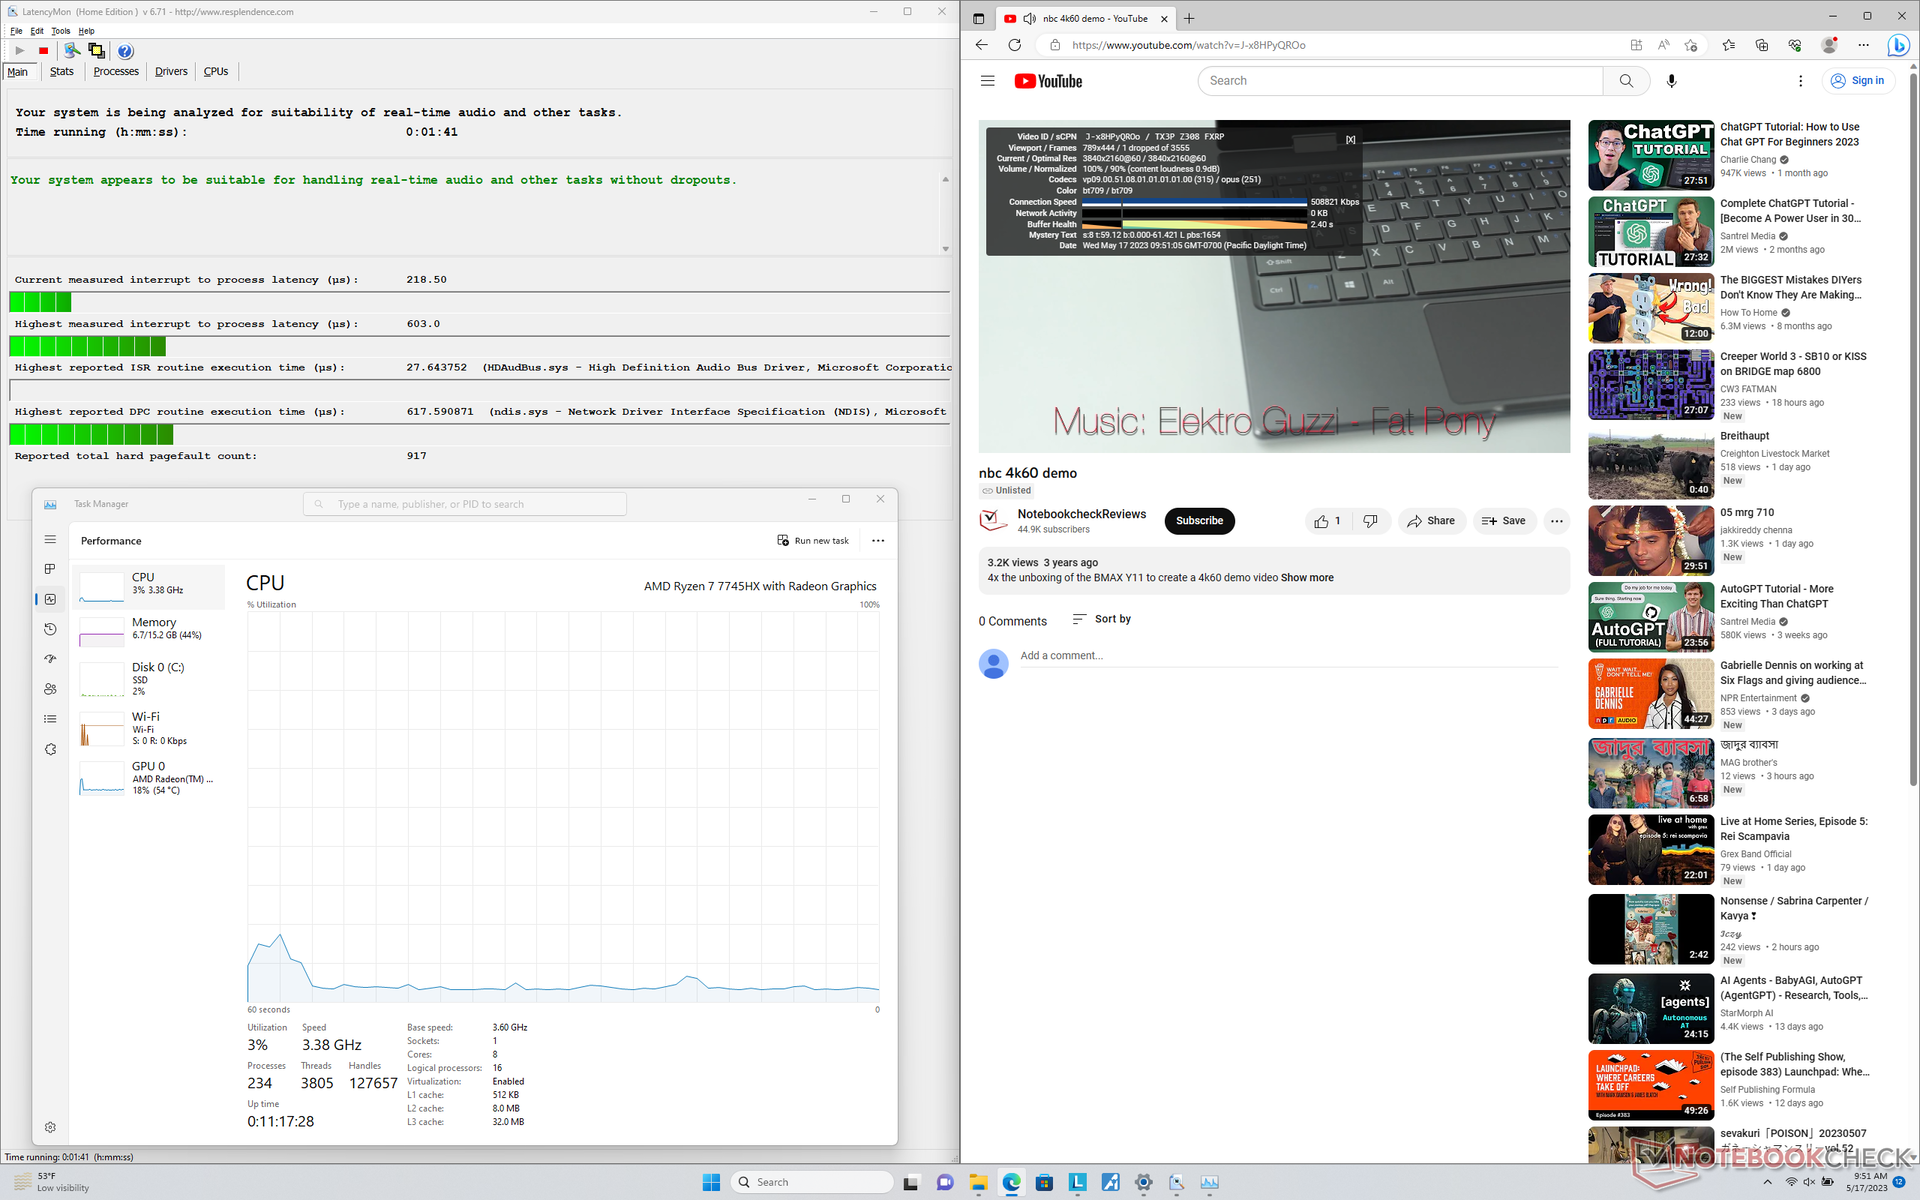
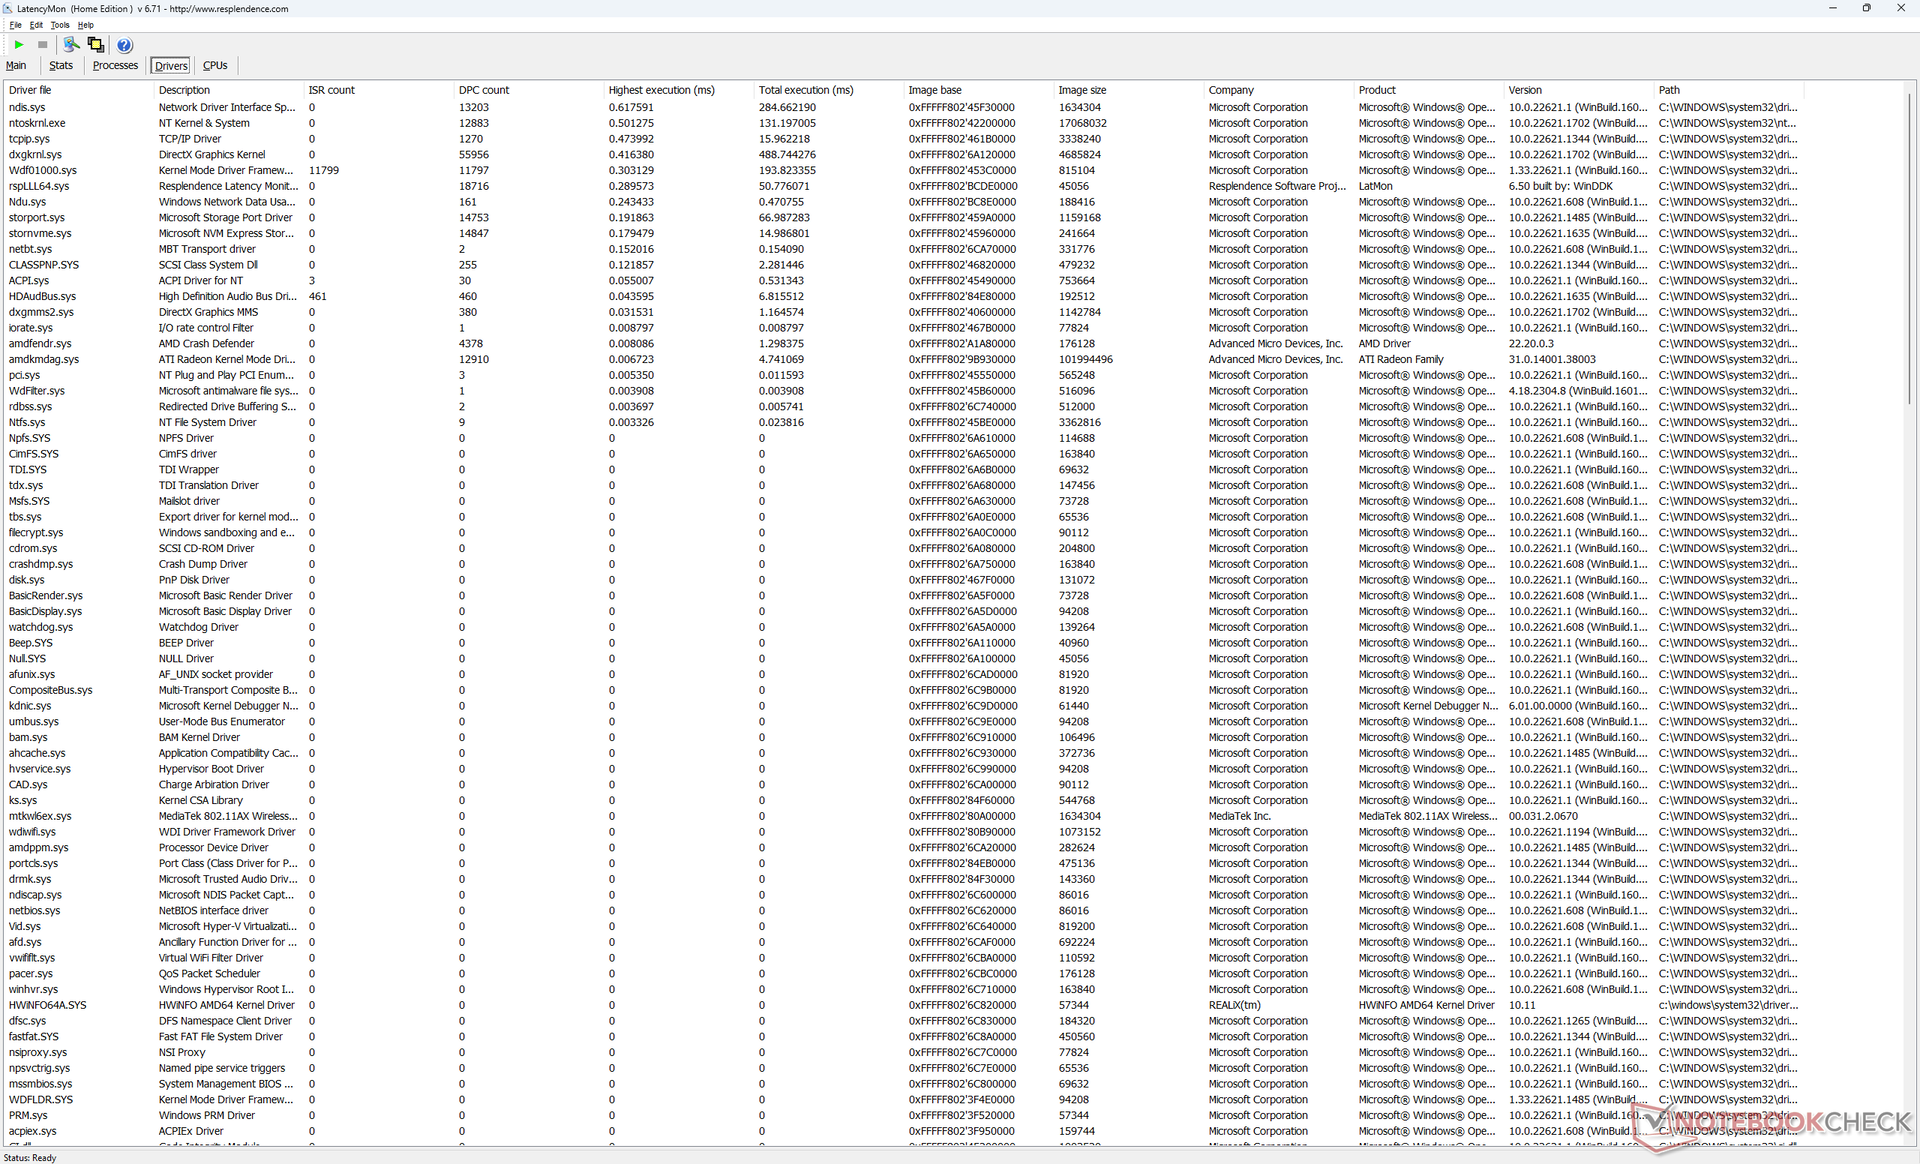
DPC latentie
LatencyMon onthult geen grote DPC-problemen bij het openen van meerdere browsertabbladen van onze homepage of bij het uitvoeren van Prime95 stress. 4K videoweergave bij 60 FPS is uitstekend .met slechts één dropped frame tijdens onze testvideo.
| DPC Latencies / LatencyMon - interrupt to process latency (max), Web, Youtube, Prime95 | |
| Asus Zephyrus Duo 16 GX650PY-NM006W | |
| Schenker XMG Neo 16 E23 | |
| Asus ROG Strix G16 G614JZ | |
| Uniwill GM6PX7X RTX 4070 | |
| Lenovo Legion Pro 5 16IRX8 | |
| Lenovo Legion Pro 5 16ARX8 | |
* ... kleiner is beter
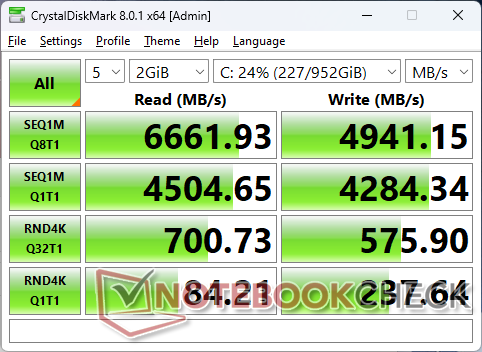
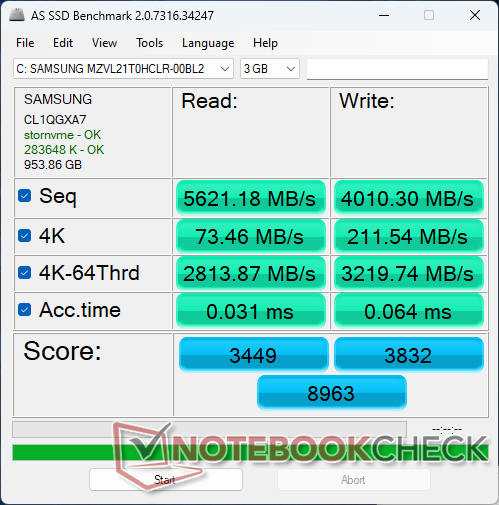
Opslagapparaten - Tot twee PCIe4 x4-schijven
Ons toestel wordt geleverd met een 1 TB Samsung PM9A1 NVMe SSD die een van de snelste PCIe4 x4 SSD's voor consumenten is. De maximale overdrachtsnelheid bedraagt ongeveer 6600 MB/s, maar de prestaties worden al na enkele minuten van onze stresstest teruggebracht tot 3300 MB/s, zoals blijkt uit onderstaande grafiek. De resultaten suggereren dat de SSD in de Lenovo niet goed gekoeld wordt zoals dezelfde SSD in andere laptops zoals de Uniwill GM6PX7X hogere overdrachtssnelheden gedurende veel langere periodes kunnen aanhouden.

| Drive Performance rating - Percent | |
| Lenovo Legion Pro 5 16ARX8 | |
| Lenovo Legion Pro 5 16IRX8 | |
| Uniwill GM6PX7X RTX 4070 | |
| Asus Zephyrus Duo 16 GX650PY-NM006W | |
| Asus ROG Strix G16 G614JZ | |
| Schenker XMG Neo 16 E23 | |
* ... kleiner is beter
Disk Throttling: DiskSpd Read Loop, Queue Depth 8
GPU-prestaties - Een grafische kaart voor het hogere middensegment
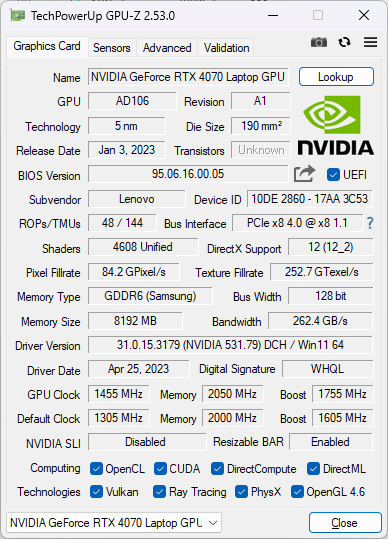
De ruwe grafische prestaties zijn vergelijkbaar met de mobiele eForce RTX 3070 Ti. Met de 140 W TGP-doelstelling kan de mobiele RTX 4070 in de Lenovo marginaal beter presteren dan de meeste andere laptops met dezelfde GPU.
Downgraden naar de mobiele RTX 4060 of mobiele RTX 4050 SKU's zal naar verwachting de prestaties met respectievelijk 15 en 20 procent verminderen. Er is helaas geen mobiele RTX 4080 optie die de prestaties aanzienlijk zou hebben verhoogd met 40 tot 50 procent ten opzichte van onze mobiele RTX 4070. In plaats daarvan zijn dergelijke high-end GPU-opties voorbehouden aan Lenovo's top-end Legion 7-serie.
Door de dGPU op het gebalanceerde stroomprofiel zonder overklokken te laten draaien, zouden de grafische prestaties volgens 3DMark Time Spy met ongeveer 13 procent afnemen.
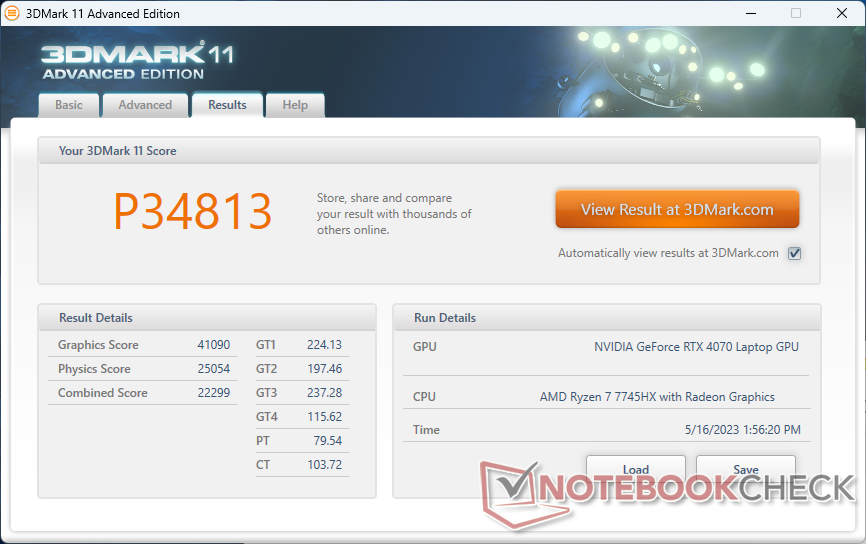
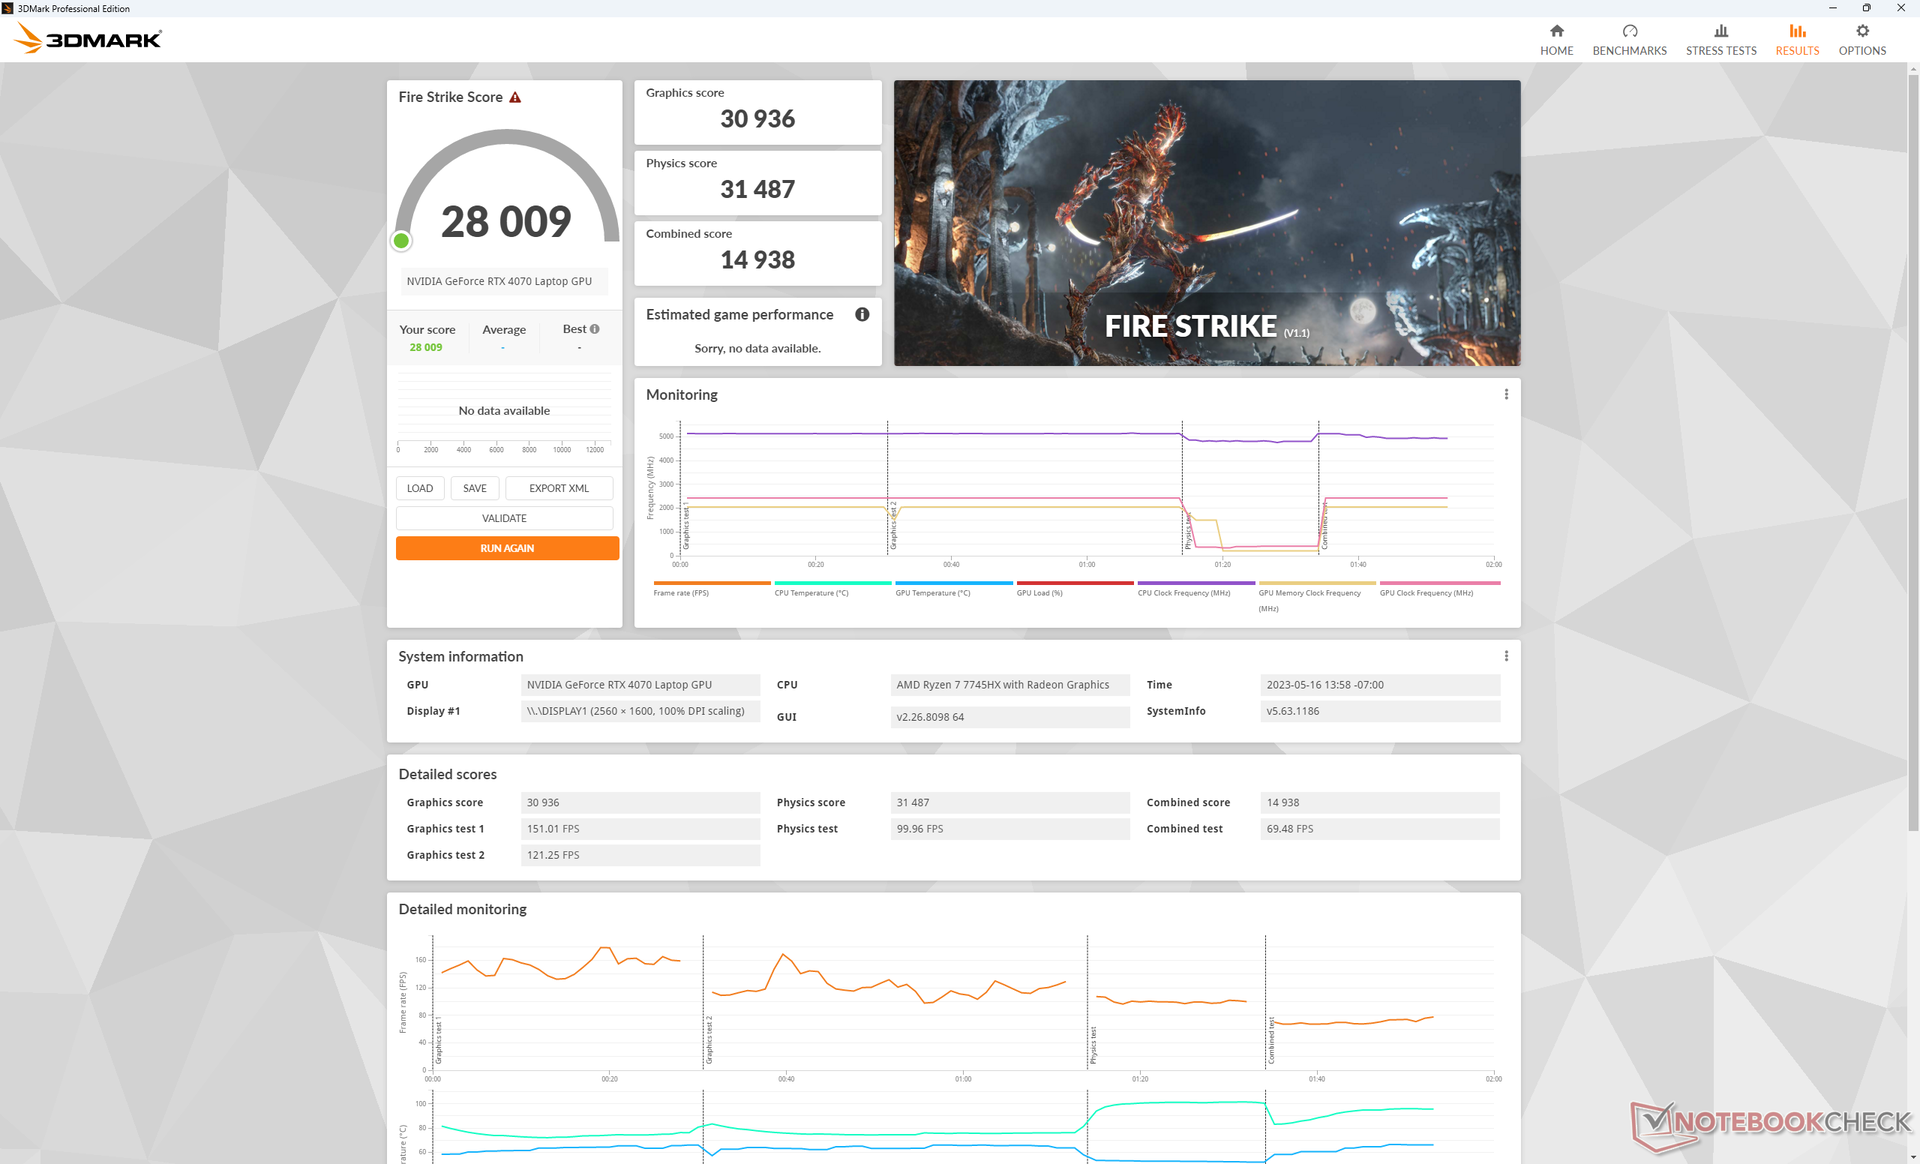
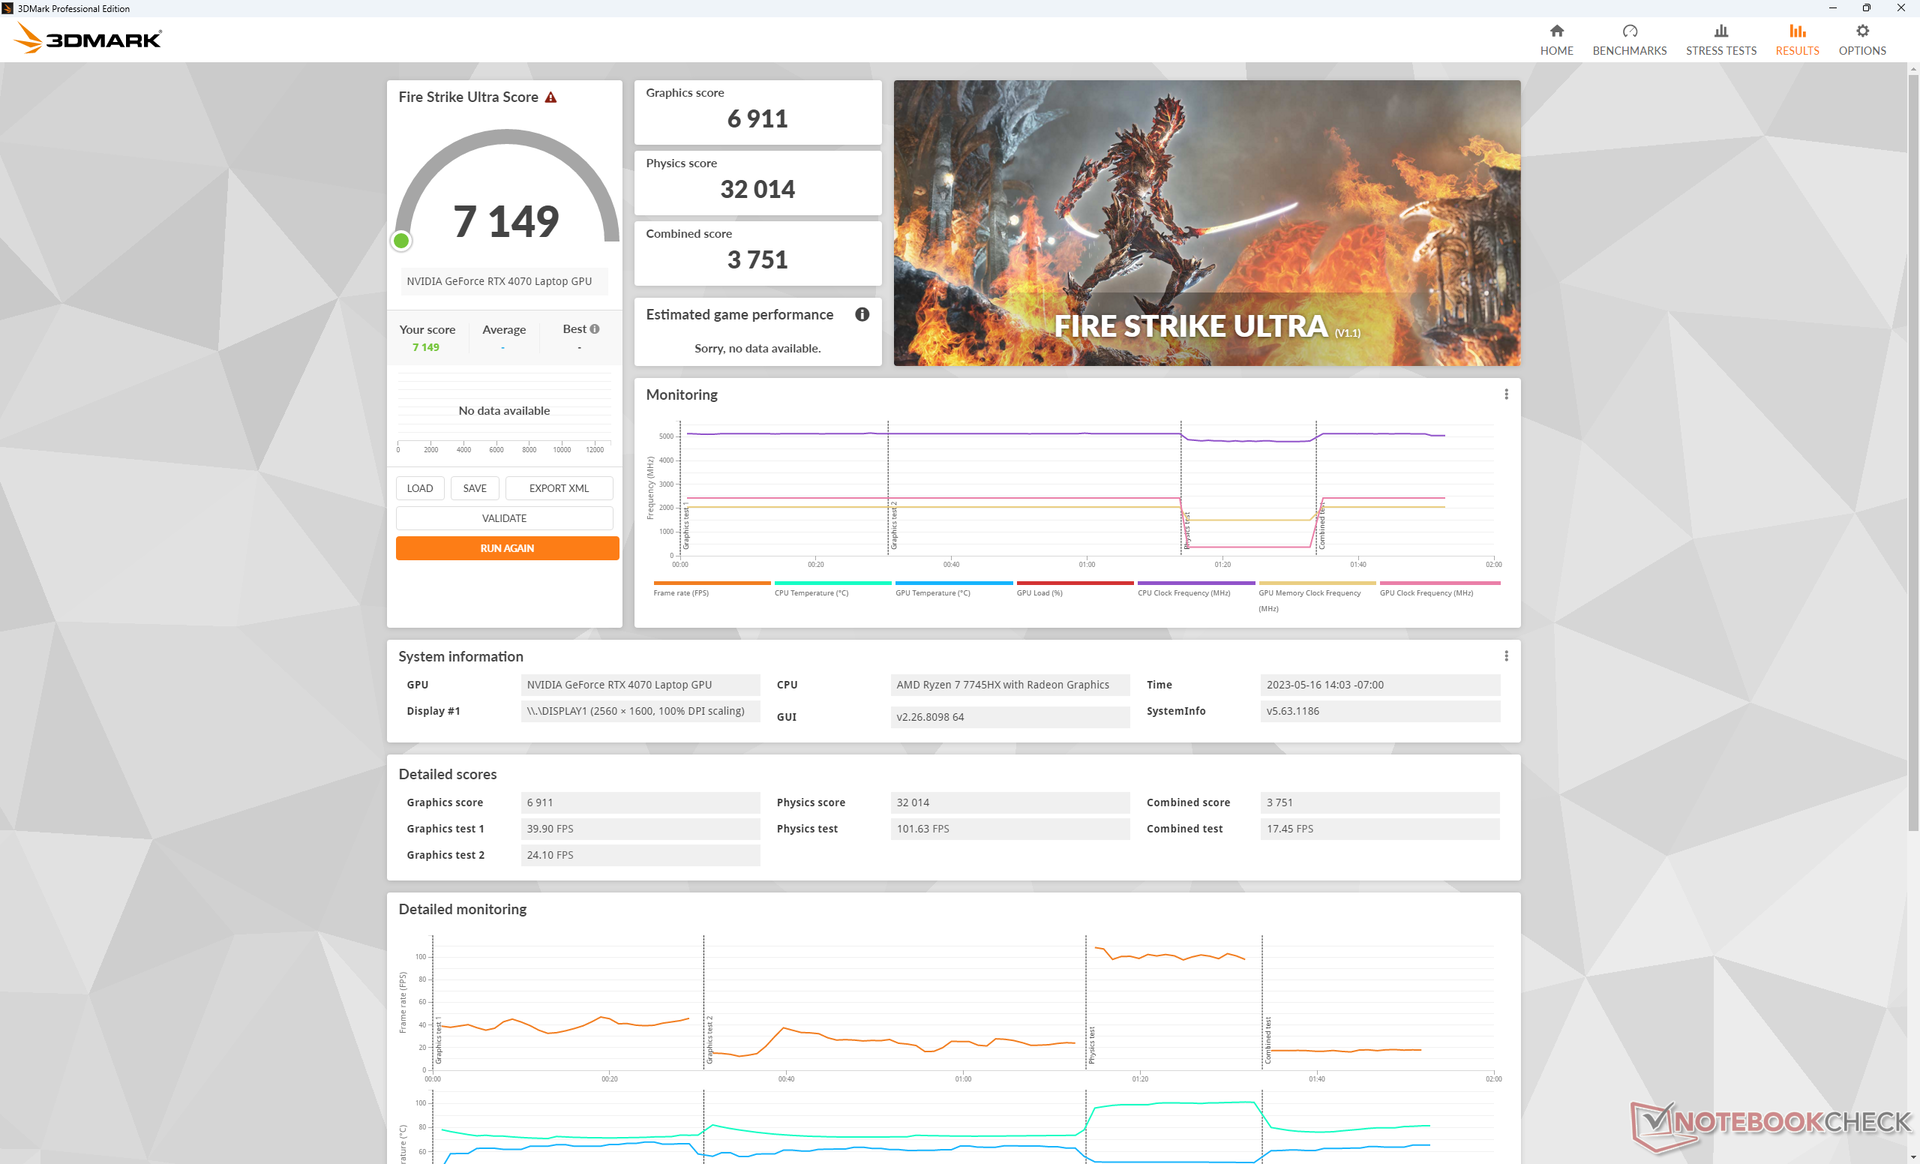
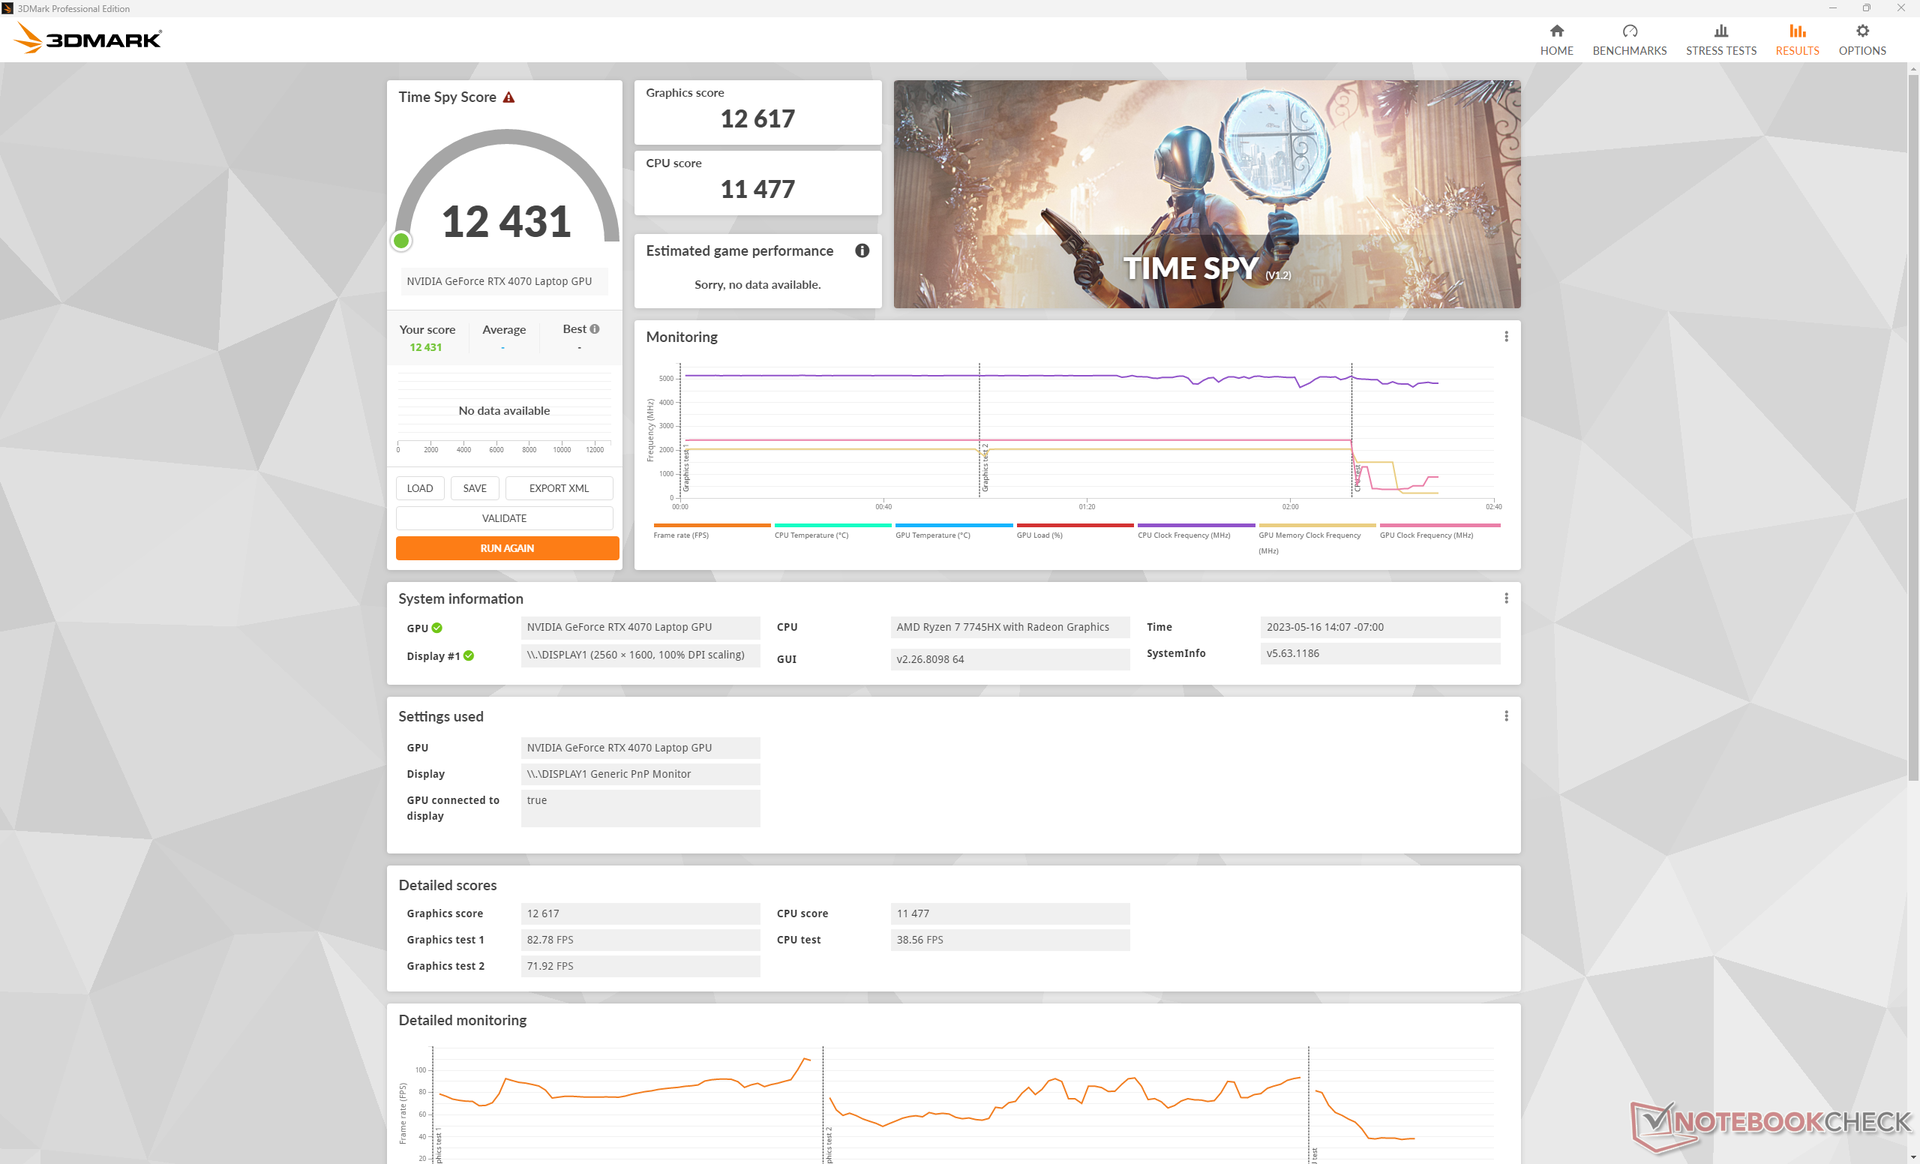
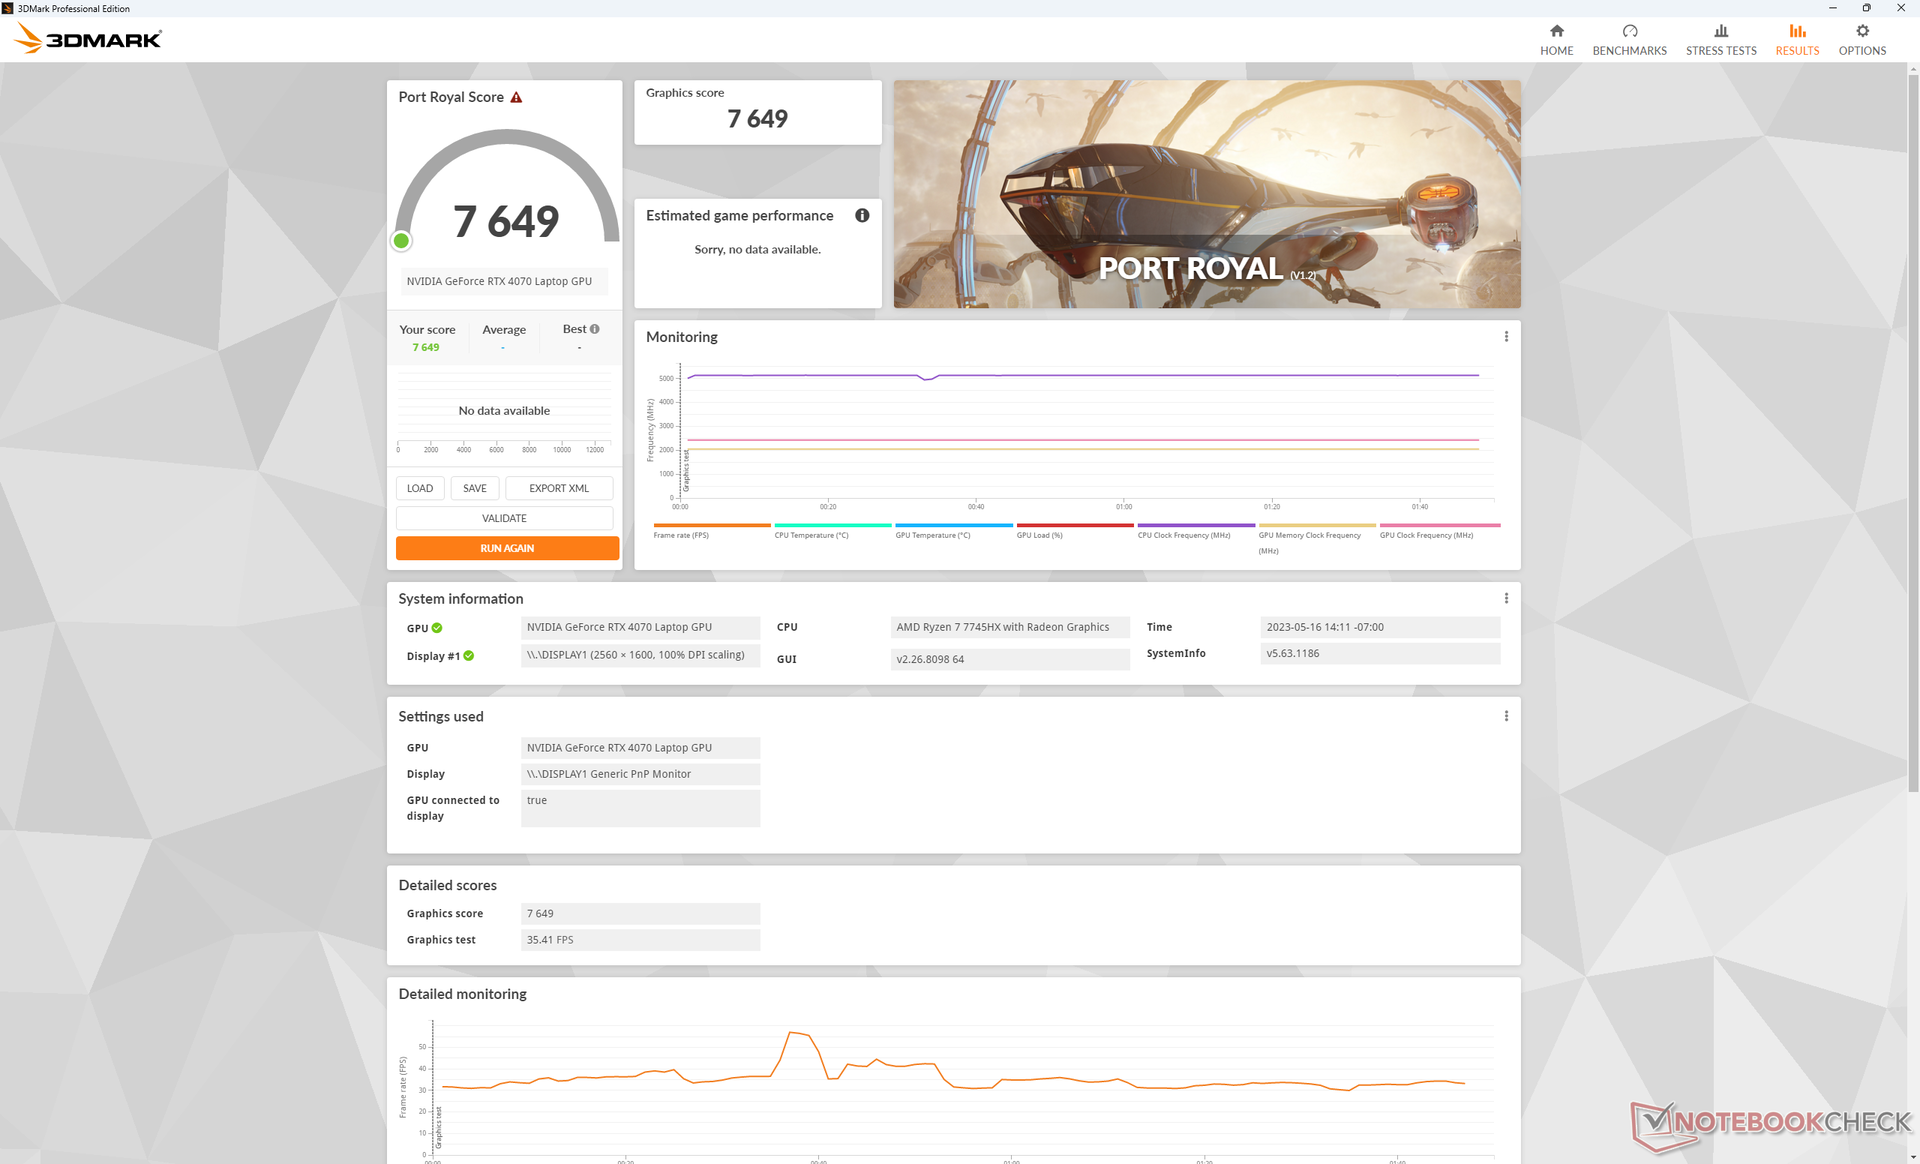
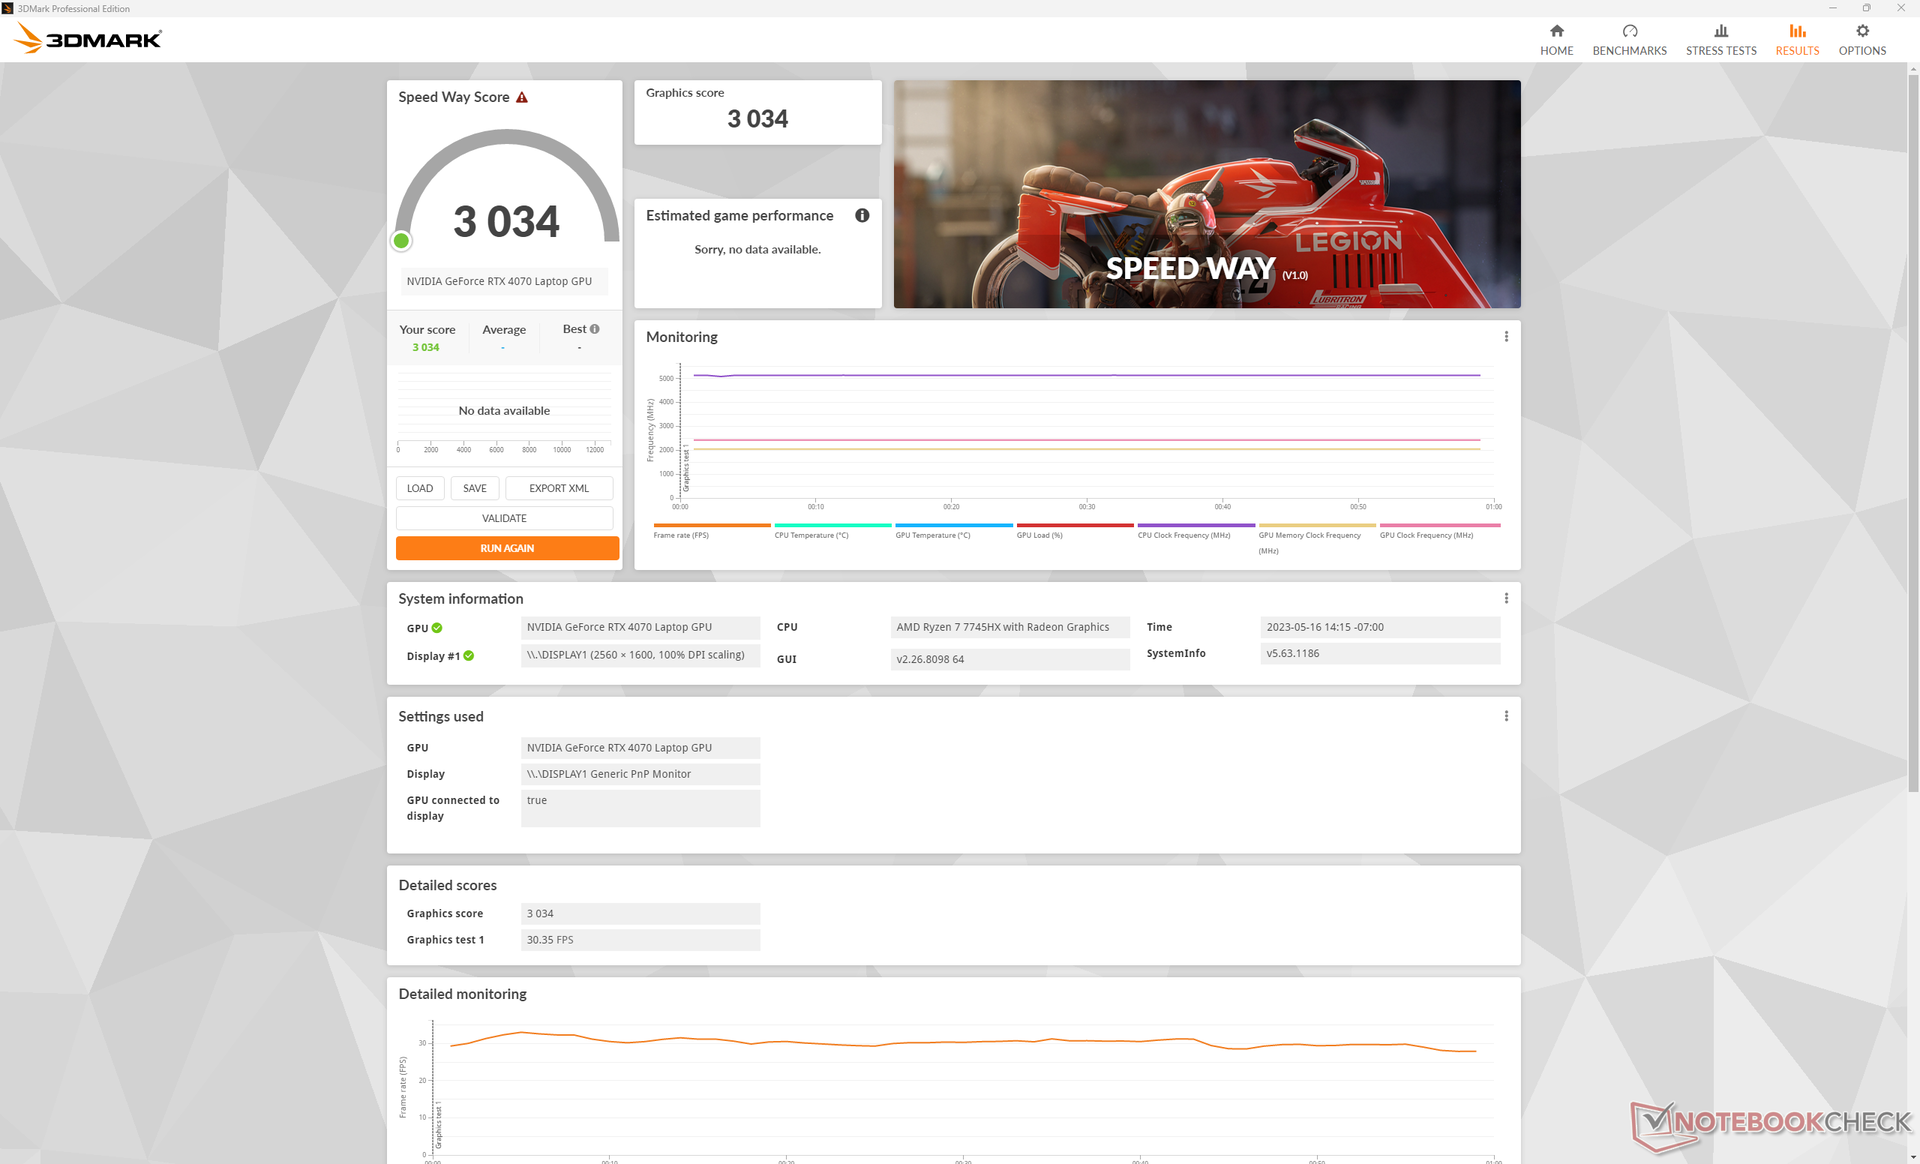
| 3DMark 11 Performance | 34813 punten | |
| 3DMark Fire Strike Score | 28009 punten | |
| 3DMark Time Spy Score | 12431 punten | |
Help | ||
* ... kleiner is beter
Spelprestaties
Ons AMD-aangedreven RTX 4070-model zou in het slechtste geval ongeveer hetzelfde presteren als het Intel-aangedreven RTX 4060-model en in het beste geval tot 20 procent sneller. Zoals te verwachten is, wordt het prestatieverschil tussen de twee GPU's groter bij het spelen van veeleisendere titels op hogere resoluties en instellingen. Bijvoorbeeld, F1 22 en Returnal draaien ongeveer 15 tot 20 procent sneller op ons AMD Legion model, terwijl oudere titels zoals GTA V kleinere framerate voordelen van slechts 5 tot 10 procent laten zien. Je zult dus meer nieuwere titels willen spelen om de mobiele RTX 4070 beter te benutten.
In het algemeen paart de mobiele RTX 4070 goed met het native 2560 x 1600 resolutie beeldscherm, vooral omdat G-Sync wordt ondersteund. Hoewel de mobiele versie veel zwakker is dan de desktop versie met ongeveer 30 procent, is het nog steeds krachtig genoeg om de nieuwste games te draaien op 1600p en 60+ FPS op hoge instellingen. Gamers die zich niet storen aan de nadelen van frame generatie kunnen DLSS3 inschakelen op ondersteunde titels voor nog hogere framerates.
Witcher 3 FPS Chart
| lage | gem. | hoge | ultra | QHD | 4K | |
|---|---|---|---|---|---|---|
| GTA V (2015) | 185.8 | 185.1 | 178.6 | 119.9 | 93.2 | 93.7 |
| The Witcher 3 (2015) | 597 | 415.1 | 257.3 | 119.8 | 76.2 | |
| Dota 2 Reborn (2015) | 238 | 203 | 191.8 | 182 | 151.5 | |
| Final Fantasy XV Benchmark (2018) | 229 | 172.5 | 119.9 | 119.9 | 49.2 | |
| X-Plane 11.11 (2018) | 186.3 | 155.2 | 117.8 | 99.5 | ||
| Strange Brigade (2018) | 636 | 334 | 260 | 223 | 146.4 | 76.8 |
| Shadow of the Tomb Raider (2018) | 168 | 110 | 53 | |||
| Far Cry 6 (2021) | 110 | 88 | 43 | |||
| Cyberpunk 2077 1.6 (2022) | 185.8 | 157.6 | 121.3 | 98.9 | 58.1 | 24.7 |
| Tiny Tina's Wonderlands (2022) | 263.6 | 217.3 | 144.5 | 112.1 | 76.9 | 39.7 |
| F1 22 (2022) | 311 | 300 | 235 | 84.1 | 54.8 | 26.4 |
| Call of Duty Modern Warfare 2 2022 (2022) | 108 | 77 | 44 | |||
| Returnal (2023) | 93 | 90 | 85 | 77 | 55 | 29 |
| Star Wars Jedi Survivor (2023) | 77.9 | 50.4 | 24.2 |
Emissies
Systeemgeluid - ongeveer 50 dB(A) bij gamen
Het ventilatorgeluid tijdens het gamen is met ongeveer 48 dB(A) ongeveer gelijk tussen de AMD- en Intel-modellen. Wordt de CPU echter aanzienlijk meer belast, dan kan het ventilatorgeluid oplopen tot maximaal 54 dB(A). Het lage 50 dB(A) bereik is typisch voor de meeste gaming laptops, waaronder deAsus ROG Strix G16 ofRazer Blade 16.
Interessant is dat het geluid van de ventilator iets stiller is en minder vaak pulseert bij niet-veeleisende belastingen zoals kantoorwerk of videoweergave. De AMD CPU trekt minder stroom dan de Intel CPU tijdens het boosten, wat kan bijdragen aan het stabielere ventilatorgeluid.
Geluidsniveau
| Onbelast |
| 23.2 / 23.2 / 26.2 dB (A) |
| Belasting |
| 31.4 / 53.8 dB (A) |
 | ||
30 dB stil 40 dB(A) hoorbaar 50 dB(A) luid |
||
min: | ||
| Lenovo Legion Pro 5 16ARX8 GeForce RTX 4070 Laptop GPU, R7 7745HX, Samsung PM9A1 MZVL21T0HCLR | Lenovo Legion Pro 5 16IRX8 GeForce RTX 4060 Laptop GPU, i7-13700HX, SK hynix PC801 HFS512GEJ9X115N | Uniwill GM6PX7X RTX 4070 GeForce RTX 4070 Laptop GPU, i7-13700HX, Samsung PM9A1 MZVL2512HCJQ | Schenker XMG Neo 16 E23 GeForce RTX 4090 Laptop GPU, i9-13900HX, Crucial P5 Plus 1TB CT1000P5PSSD8 | Asus ROG Strix G16 G614JZ GeForce RTX 4080 Laptop GPU, i9-13980HX, WD PC SN560 SDDPNQE-1T00 | Asus Zephyrus Duo 16 GX650PY-NM006W GeForce RTX 4090 Laptop GPU, R9 7945HX, SK hynix PC801 HFS002TEJ9X101N | |
|---|---|---|---|---|---|---|
| Noise | -2% | -9% | -37% | -15% | -19% | |
| uit / omgeving * (dB) | 23.2 | 23 1% | 22.4 3% | 25 -8% | 25 -8% | 23.9 -3% |
| Idle Minimum * (dB) | 23.2 | 23.1 -0% | 22.9 1% | 31 -34% | 26 -12% | 23.9 -3% |
| Idle Average * (dB) | 23.2 | 23.1 -0% | 29 -25% | 33 -42% | 28 -21% | 32.9 -42% |
| Idle Maximum * (dB) | 26.2 | 26.6 -2% | 29 -11% | 42 -60% | 30 -15% | 36.5 -39% |
| Load Average * (dB) | 31.4 | 34.7 -11% | 40.2 -28% | 58 -85% | 48 -53% | 42.9 -37% |
| Witcher 3 ultra * (dB) | 48.4 | 47.6 2% | 48.7 -1% | 57 -18% | 49 -1% | 51.2 -6% |
| Load Maximum * (dB) | 53.8 | 54.8 -2% | 55 -2% | 59 -10% | 52 3% | 56 -4% |
* ... kleiner is beter
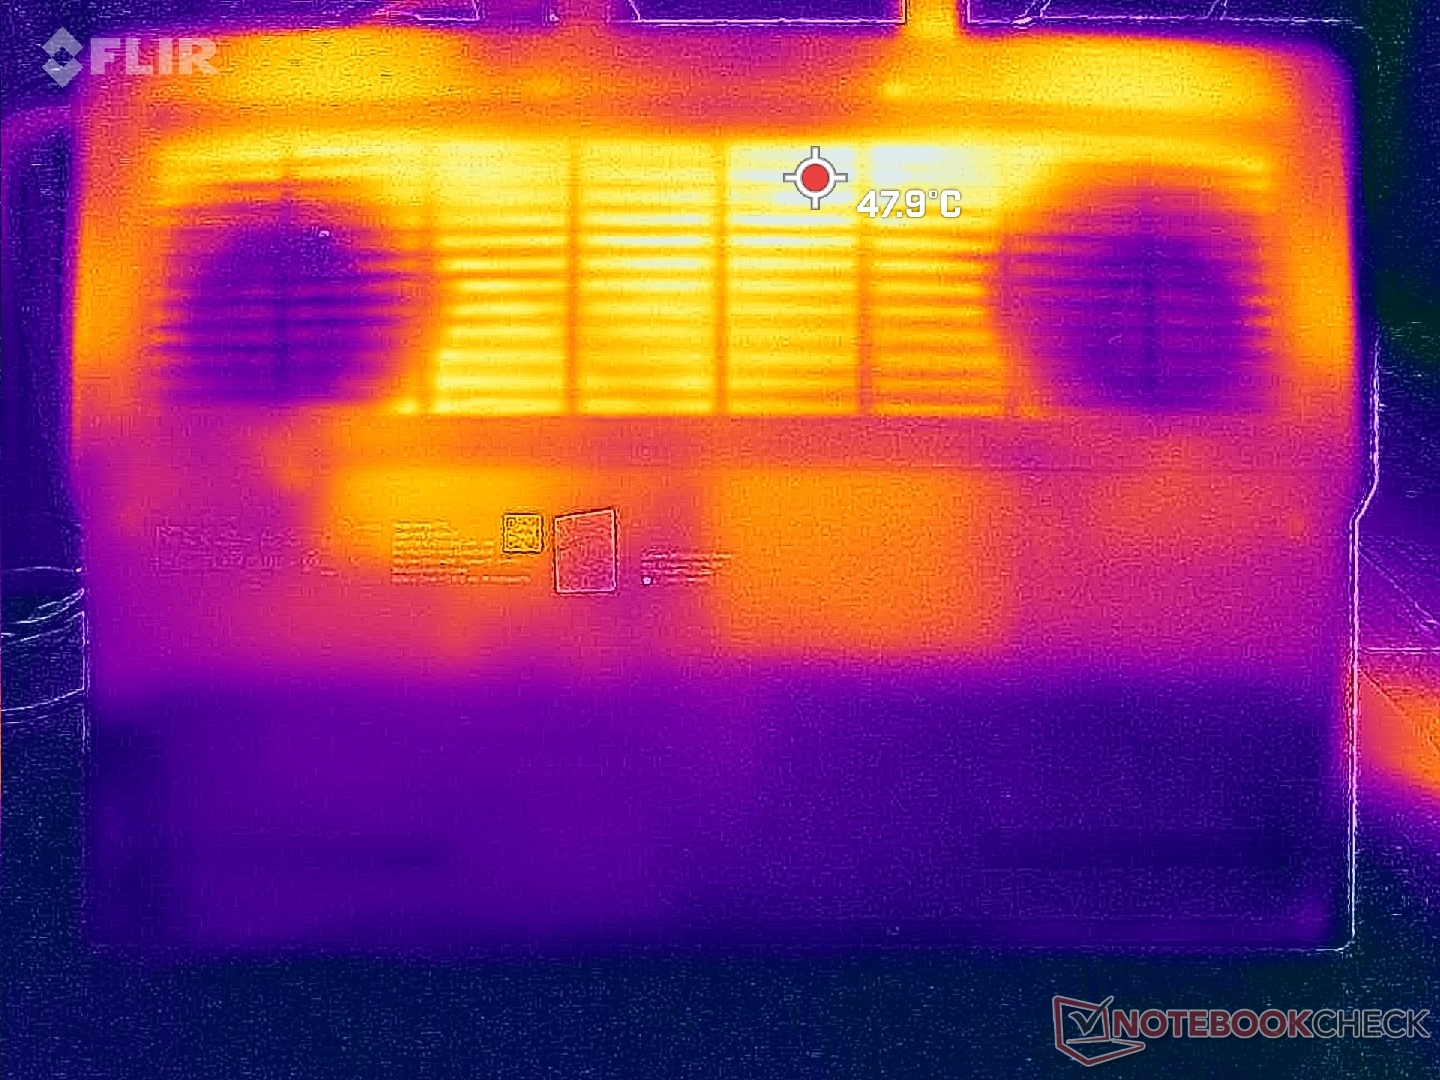
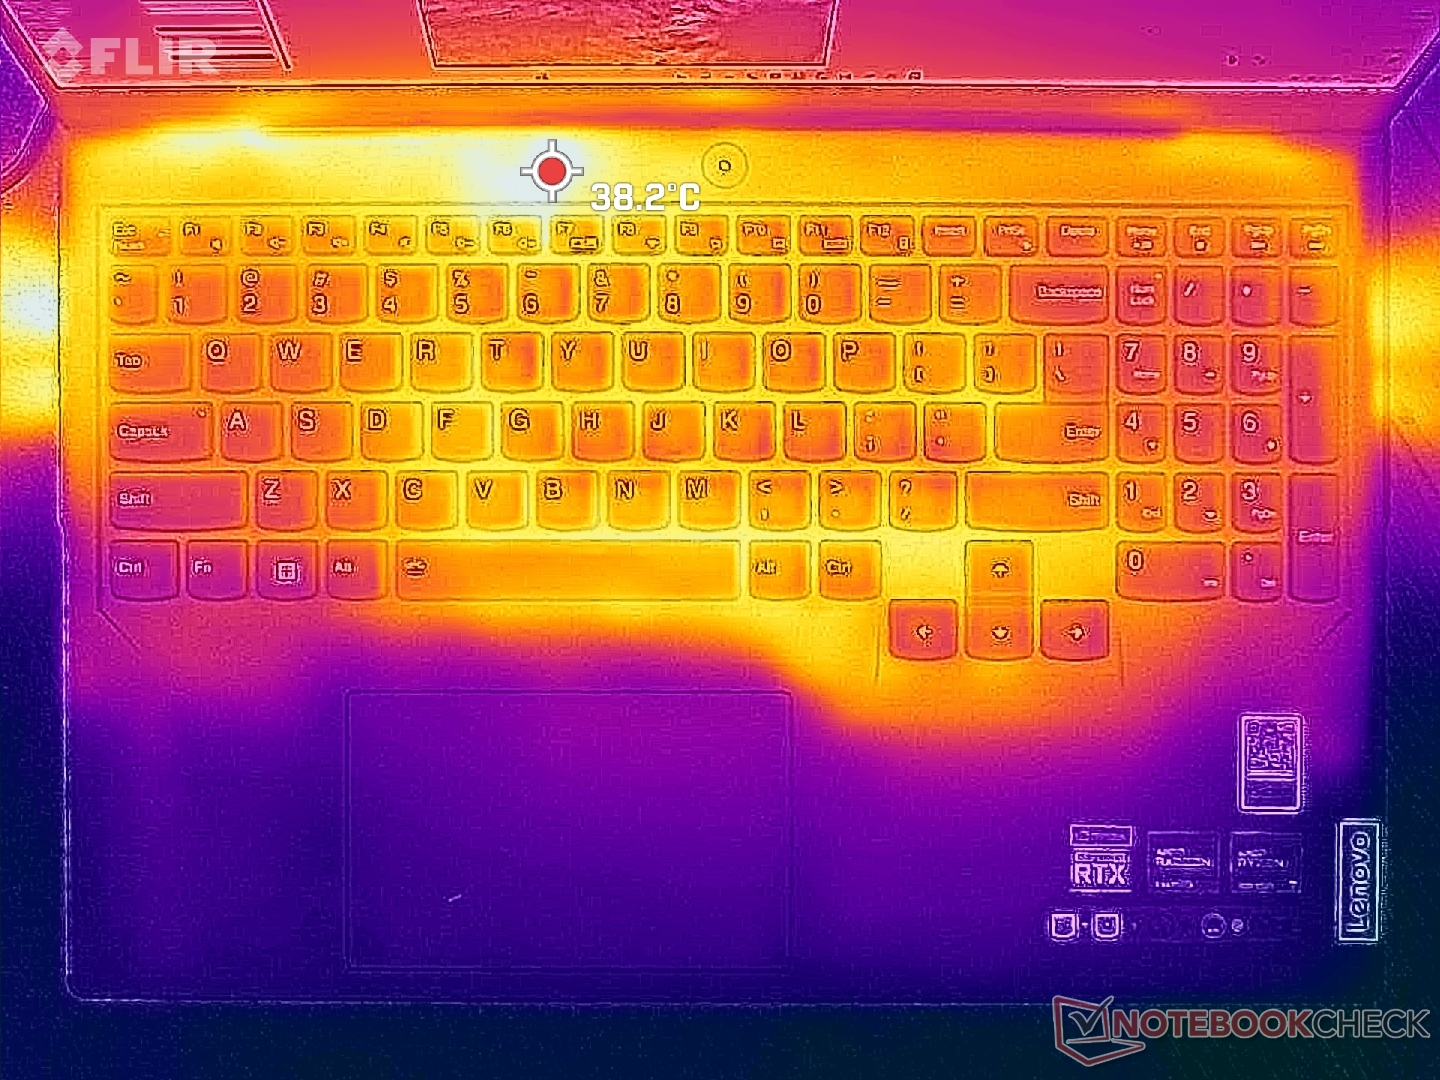
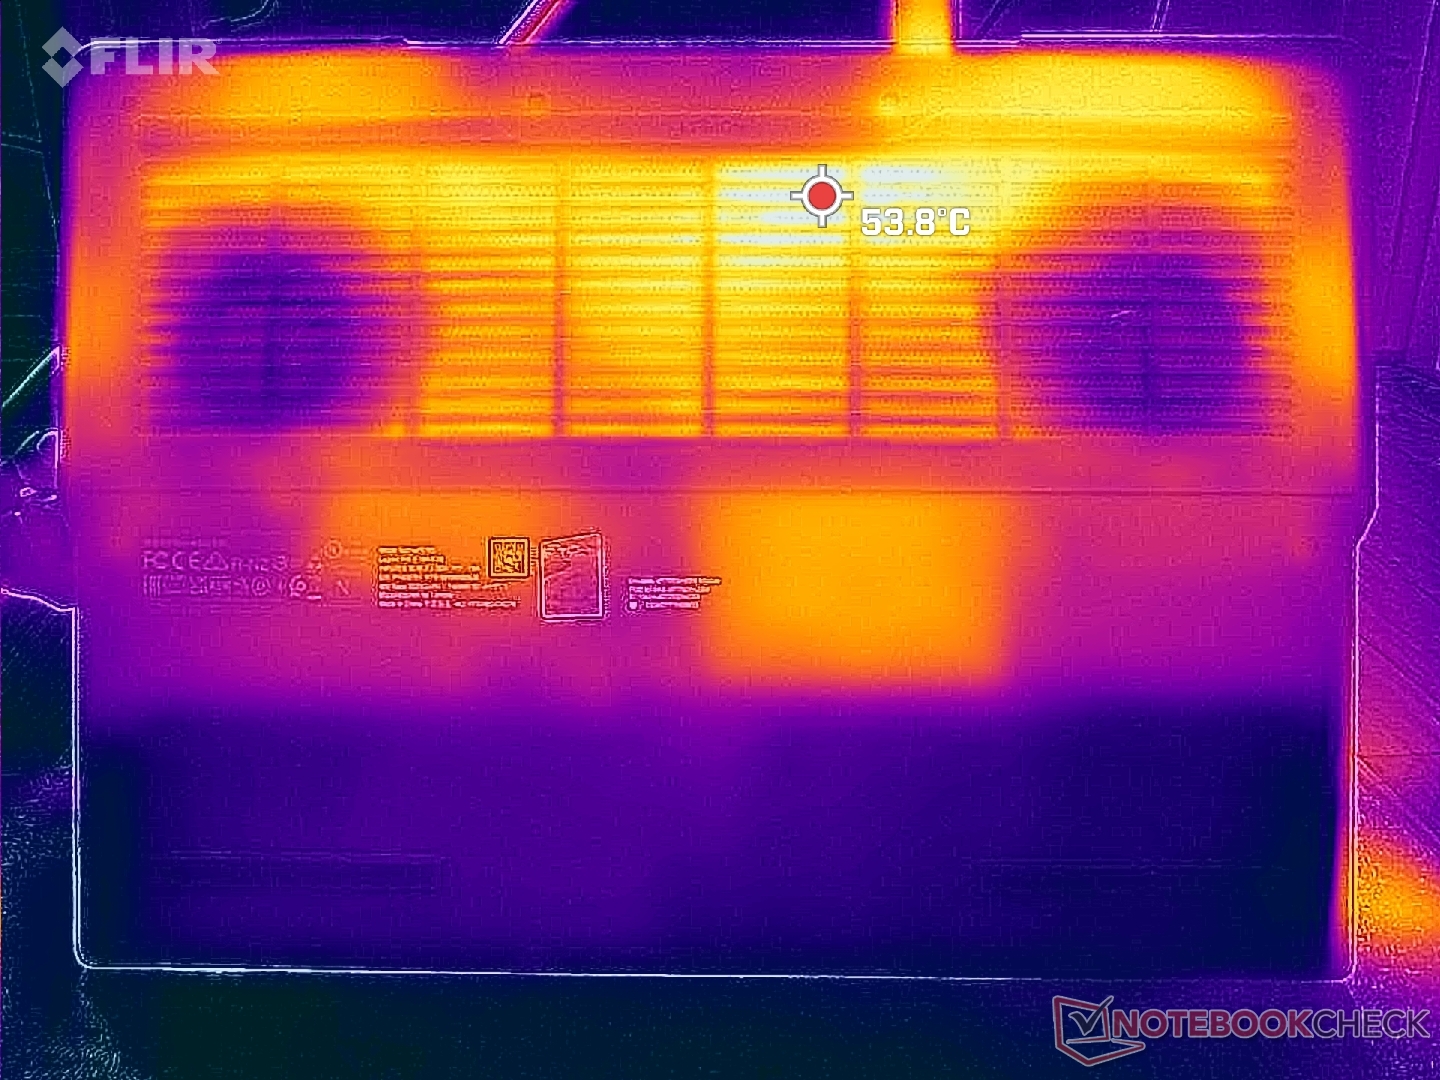
Temperatuur
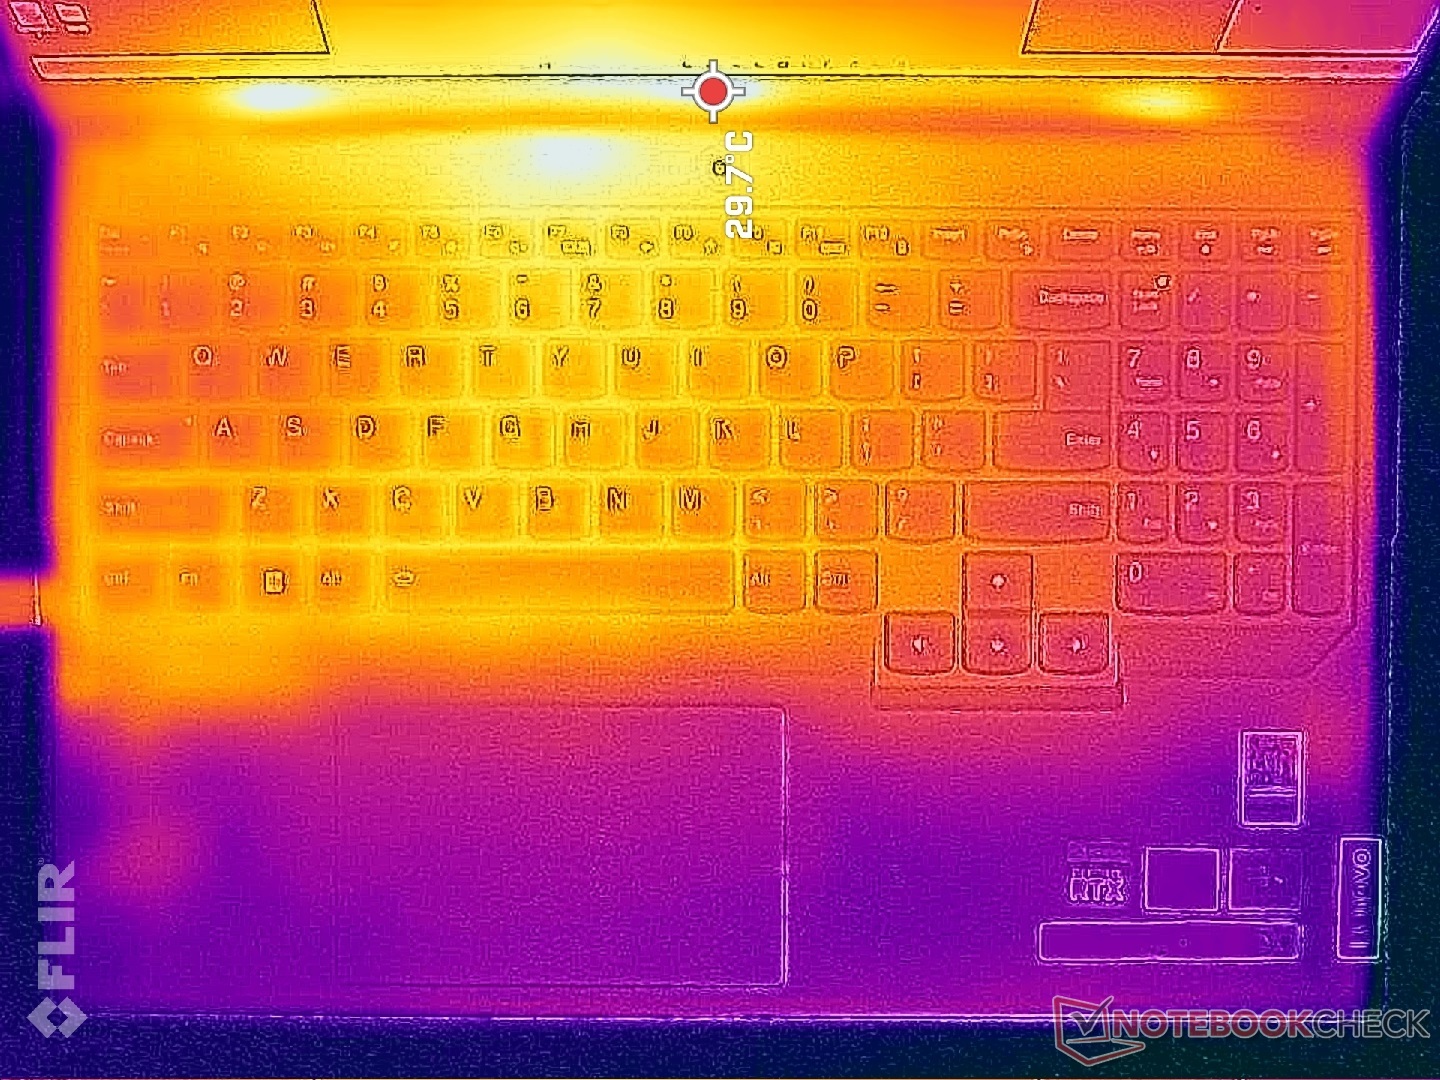
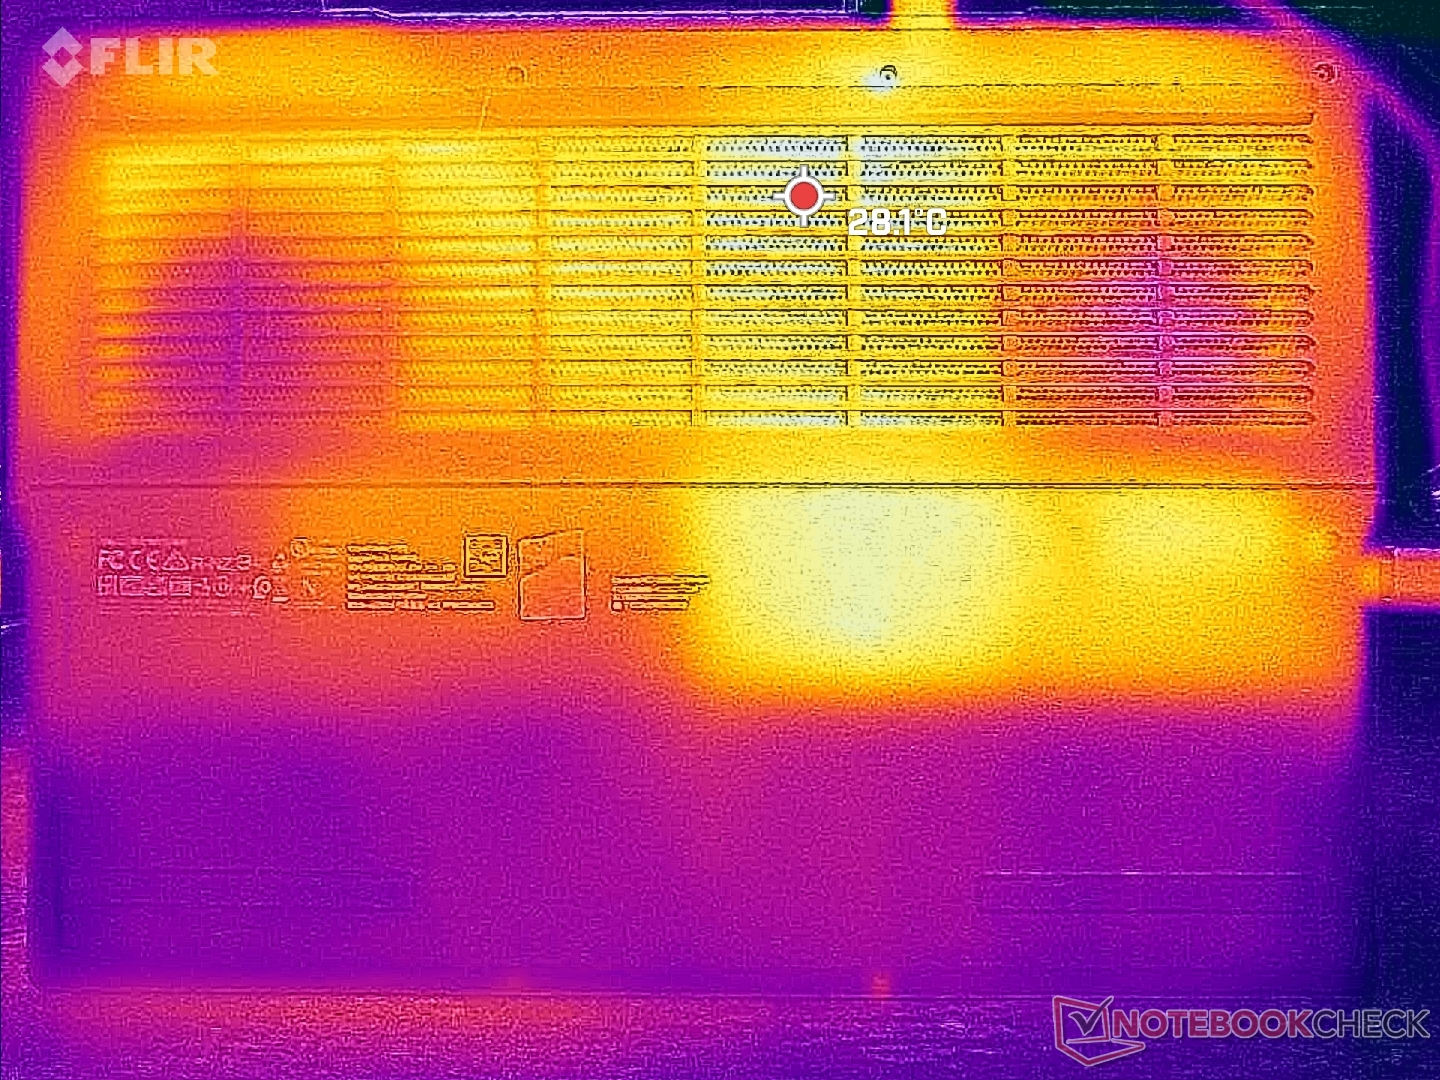
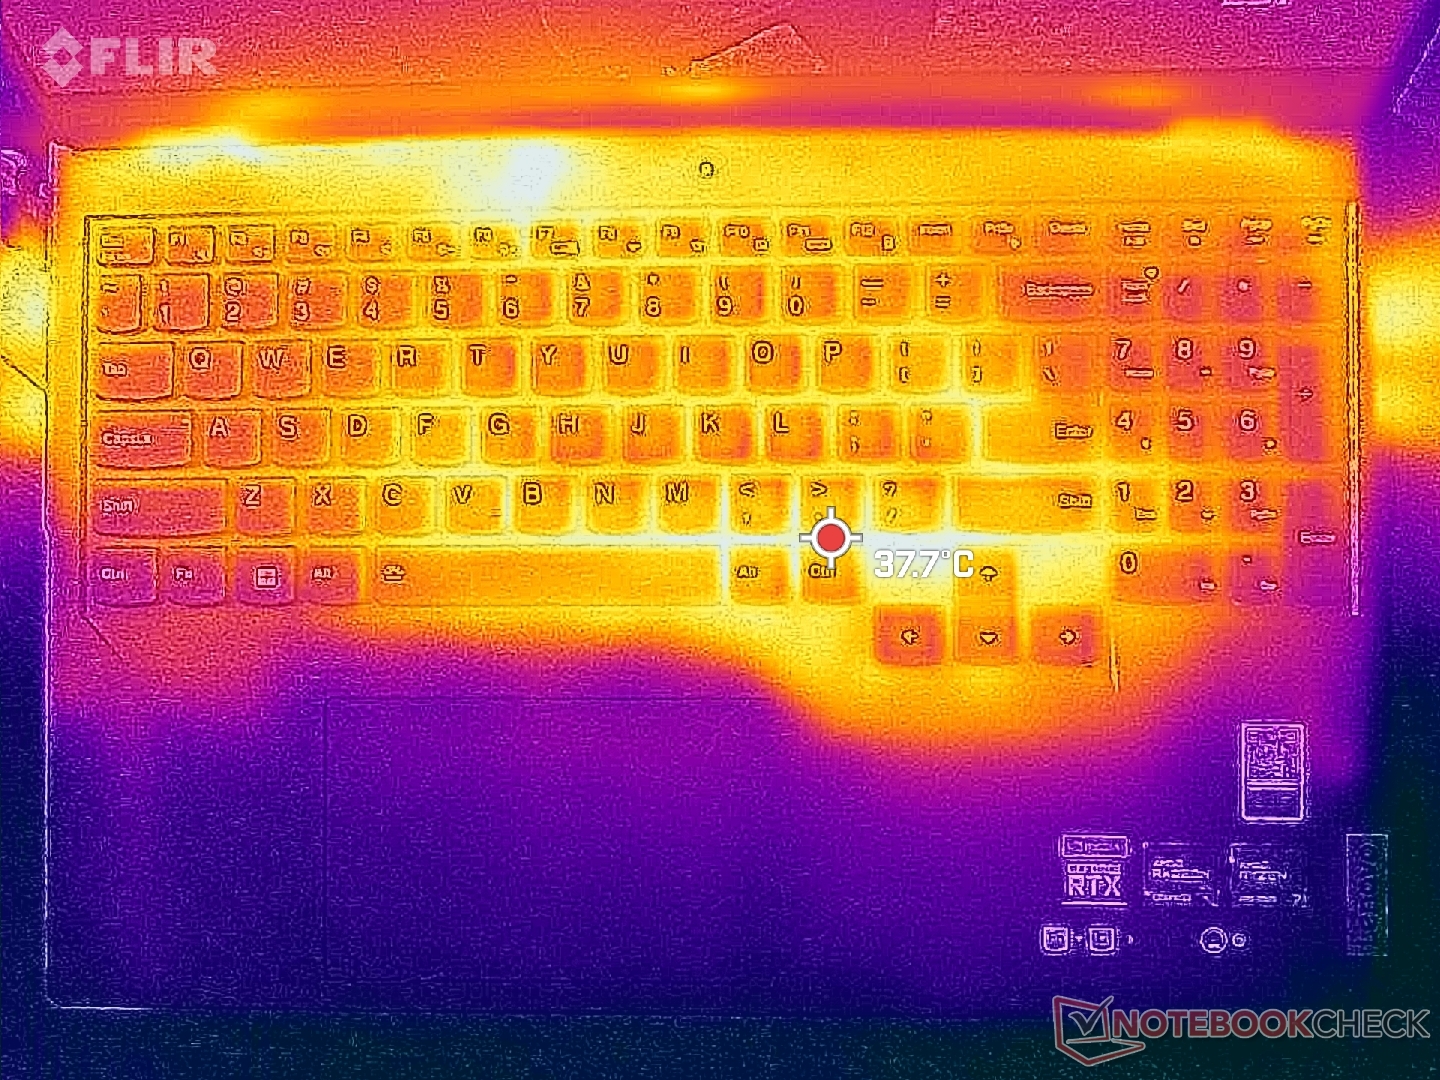
De oppervlaktetemperaturen zijn het warmst in het midden en aan de achterkant van het chassis, waar hete plekken tijdens het gamen iets meer dan 40 C kunnen bereiken. Concurrerende modellen zoals deAsus ROG Zephyrus M16 zouden zelfs warmer worden met iets meer dan 50 C onder vergelijkbare testomstandigheden. Het lijdt geen twijfel dat de relatief grotere ventilatieroosters op het Legion ontwerp deels verantwoordelijk zijn voor de betere temperaturen.
De palmsteunen warmen nauwelijks op, ongeacht de belasting van het scherm, zodat de handen comfortabel blijven tijdens het gamen.
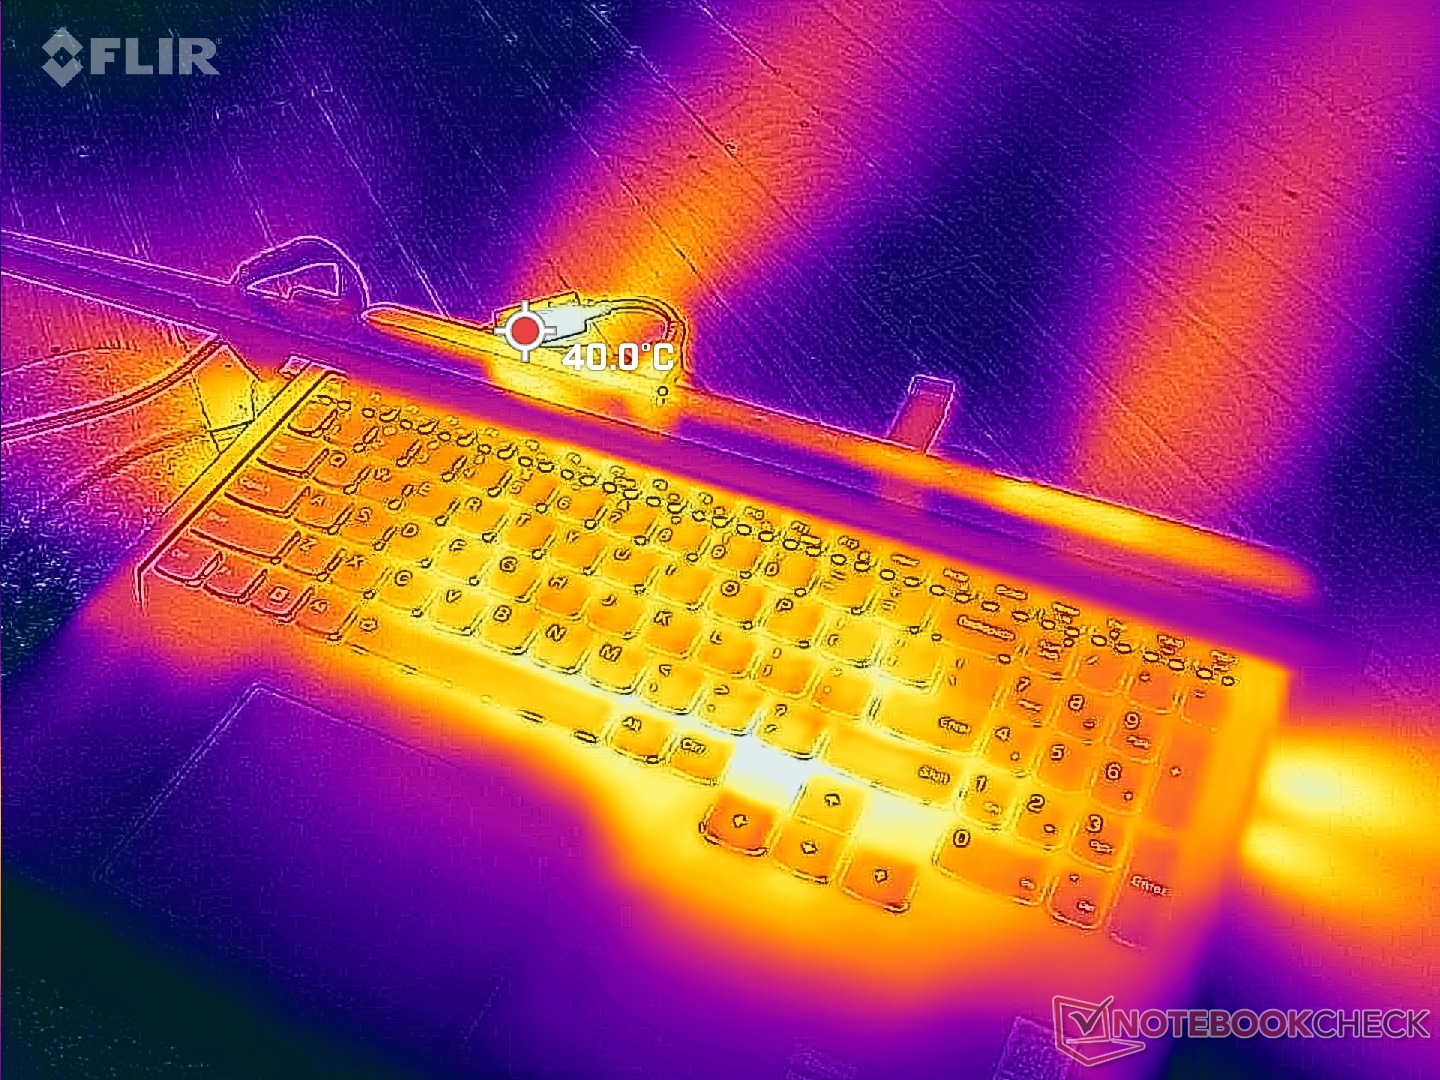
(±) De maximumtemperatuur aan de bovenzijde bedraagt 41.8 °C / 107 F, vergeleken met het gemiddelde van 40.4 °C / 105 F, variërend van 21.2 tot 68.8 °C voor de klasse Gaming.
(±) De bodem warmt op tot een maximum van 41.4 °C / 107 F, vergeleken met een gemiddelde van 43.2 °C / 110 F
(+) Bij onbelast gebruik bedraagt de gemiddelde temperatuur voor de bovenzijde 26.2 °C / 79 F, vergeleken met het apparaatgemiddelde van 33.9 °C / 93 F.
(±) Bij het spelen van The Witcher 3 is de gemiddelde temperatuur voor de bovenzijde 34.2 °C / 94 F, vergeleken met het apparaatgemiddelde van 33.9 °C / 93 F.
(+) De palmsteunen en het touchpad zijn met een maximum van ###max## °C / 86.7 F koeler dan de huidtemperatuur en voelen daarom koel aan.
(±) De gemiddelde temperatuur van de handpalmsteun van soortgelijke toestellen bedroeg 28.8 °C / 83.8 F (-1.6 °C / -2.9 F).
| Lenovo Legion Pro 5 16ARX8 AMD Ryzen 7 7745HX, NVIDIA GeForce RTX 4070 Laptop GPU | Lenovo Legion Pro 5 16IRX8 Intel Core i7-13700HX, NVIDIA GeForce RTX 4060 Laptop GPU | Uniwill GM6PX7X RTX 4070 Intel Core i7-13700HX, NVIDIA GeForce RTX 4070 Laptop GPU | Schenker XMG Neo 16 E23 Intel Core i9-13900HX, NVIDIA GeForce RTX 4090 Laptop GPU | Asus ROG Strix G16 G614JZ Intel Core i9-13980HX, NVIDIA GeForce RTX 4080 Laptop GPU | Asus Zephyrus Duo 16 GX650PY-NM006W AMD Ryzen 9 7945HX, NVIDIA GeForce RTX 4090 Laptop GPU | |
|---|---|---|---|---|---|---|
| Heat | -9% | -12% | -7% | -18% | -5% | |
| Maximum Upper Side * (°C) | 41.8 | 42.8 -2% | 38.2 9% | 50 -20% | 54 -29% | 44.2 -6% |
| Maximum Bottom * (°C) | 41.4 | 50 -21% | 45 -9% | 51 -23% | 55 -33% | 46.8 -13% |
| Idle Upper Side * (°C) | 29 | 29.6 -2% | 33.6 -16% | 28 3% | 29 -0% | 29.2 -1% |
| Idle Bottom * (°C) | 30.4 | 34 -12% | 39.6 -30% | 26 14% | 33 -9% | 30.2 1% |
* ... kleiner is beter
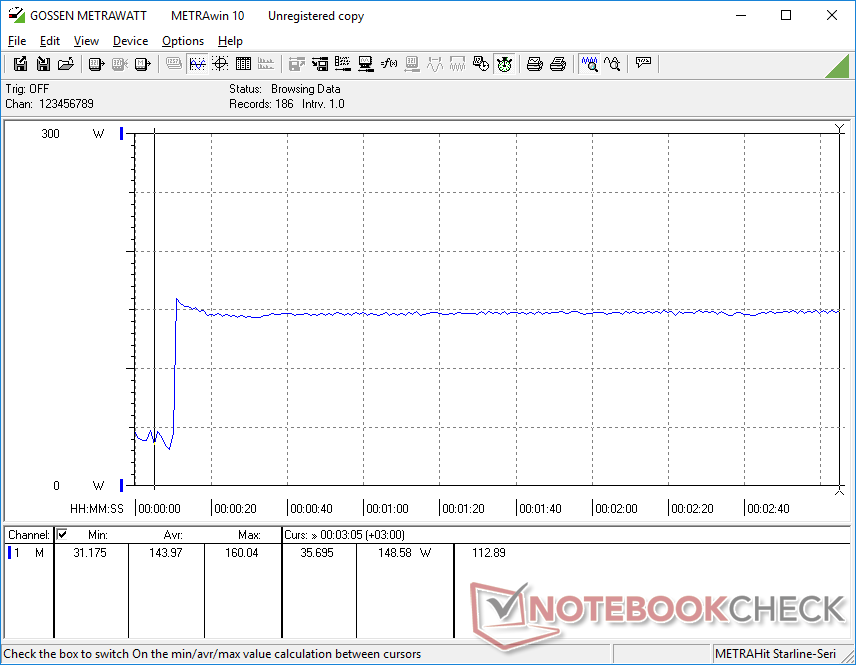
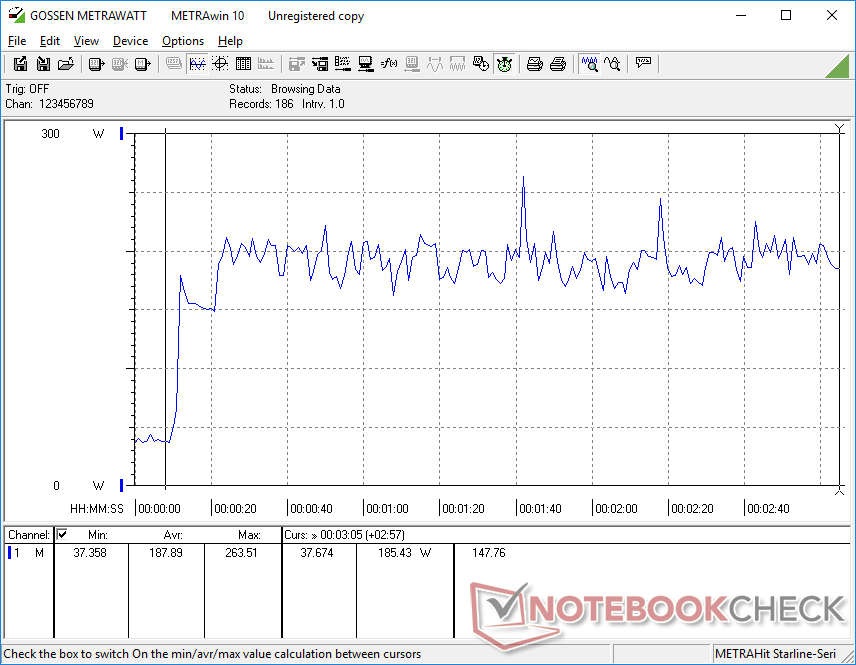
Stresstest - Een warme CPU
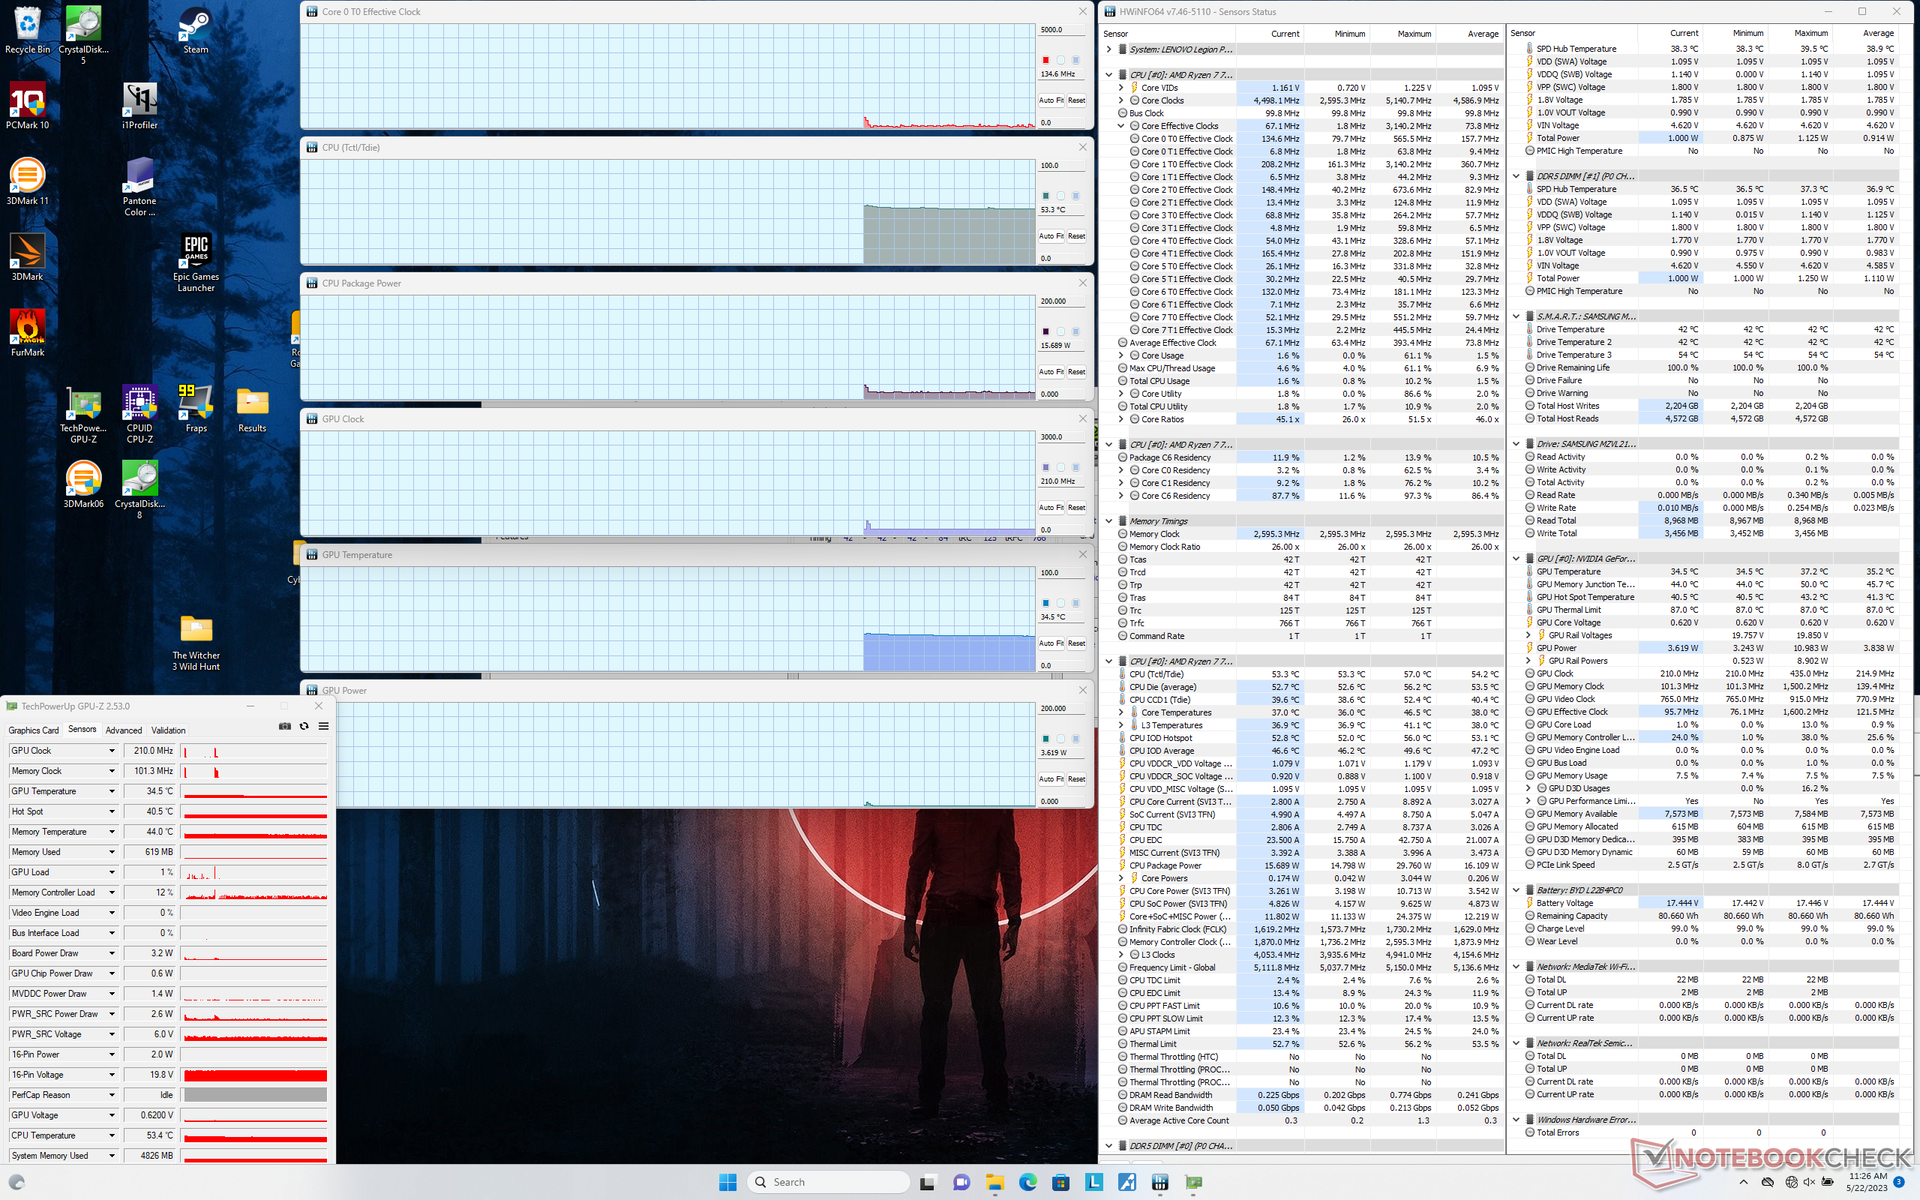
Bij het draaien van Prime95 om de CPU te belasten, piekten de kloksnelheden en het opgenomen vermogen op het bord tot respectievelijk 4,9 GHz en 110 W, voordat ze een paar seconden later snel daalden tot 4,6 GHz en 90 W. De kerntemperatuur stabiliseerde zich in het zeer hoge bereik van 90 C tot 100 C, wat nog een paar graden warmer is dan de al warme Core i7-13700HX in het alternatieve Intel Legion model. Het is duidelijk dat de Ryzen 7 CPU de grenzen van de koeling van het chassis opzoekt en dat een snellere Ryzen 9 oplossing compromissen nodig zou hebben gemaakt.
De dGPU zou zich stabiliseren op 2430 MHz core, 2050 MHz geheugen, 67 C en 105 W tegen een TGP van 140 W als hij in de Performance-modus draait Witcher 3 in de prestatiemodus. De RTX 4060 in het Intel Legion model zou zich ook stabiliseren tussen 105 W en 110 W, aangezien beide GPU's ondanks hun prestatieverschillen onder vergelijkbare vermogensgrenzen vallen. Gamen in Balanced modus met de GPU Overclock functie uitgeschakeld zou resulteren in een tragere GPU klok van 1965 MHz en een veel lagere stroomafname van slechts 80 W. Het prestatieverschil tussen Balanced en Performance modus is ongeveer 10 tot 15 procent zoals hierboven vermeld.
Werken op batterijen vermindert de prestaties. Een Fire Strike test op batterijen zou Physics en Graphics scores opleveren van respectievelijk 10865 en 9334 punten, vergeleken met 11477 en 12617 punten op netstroom.
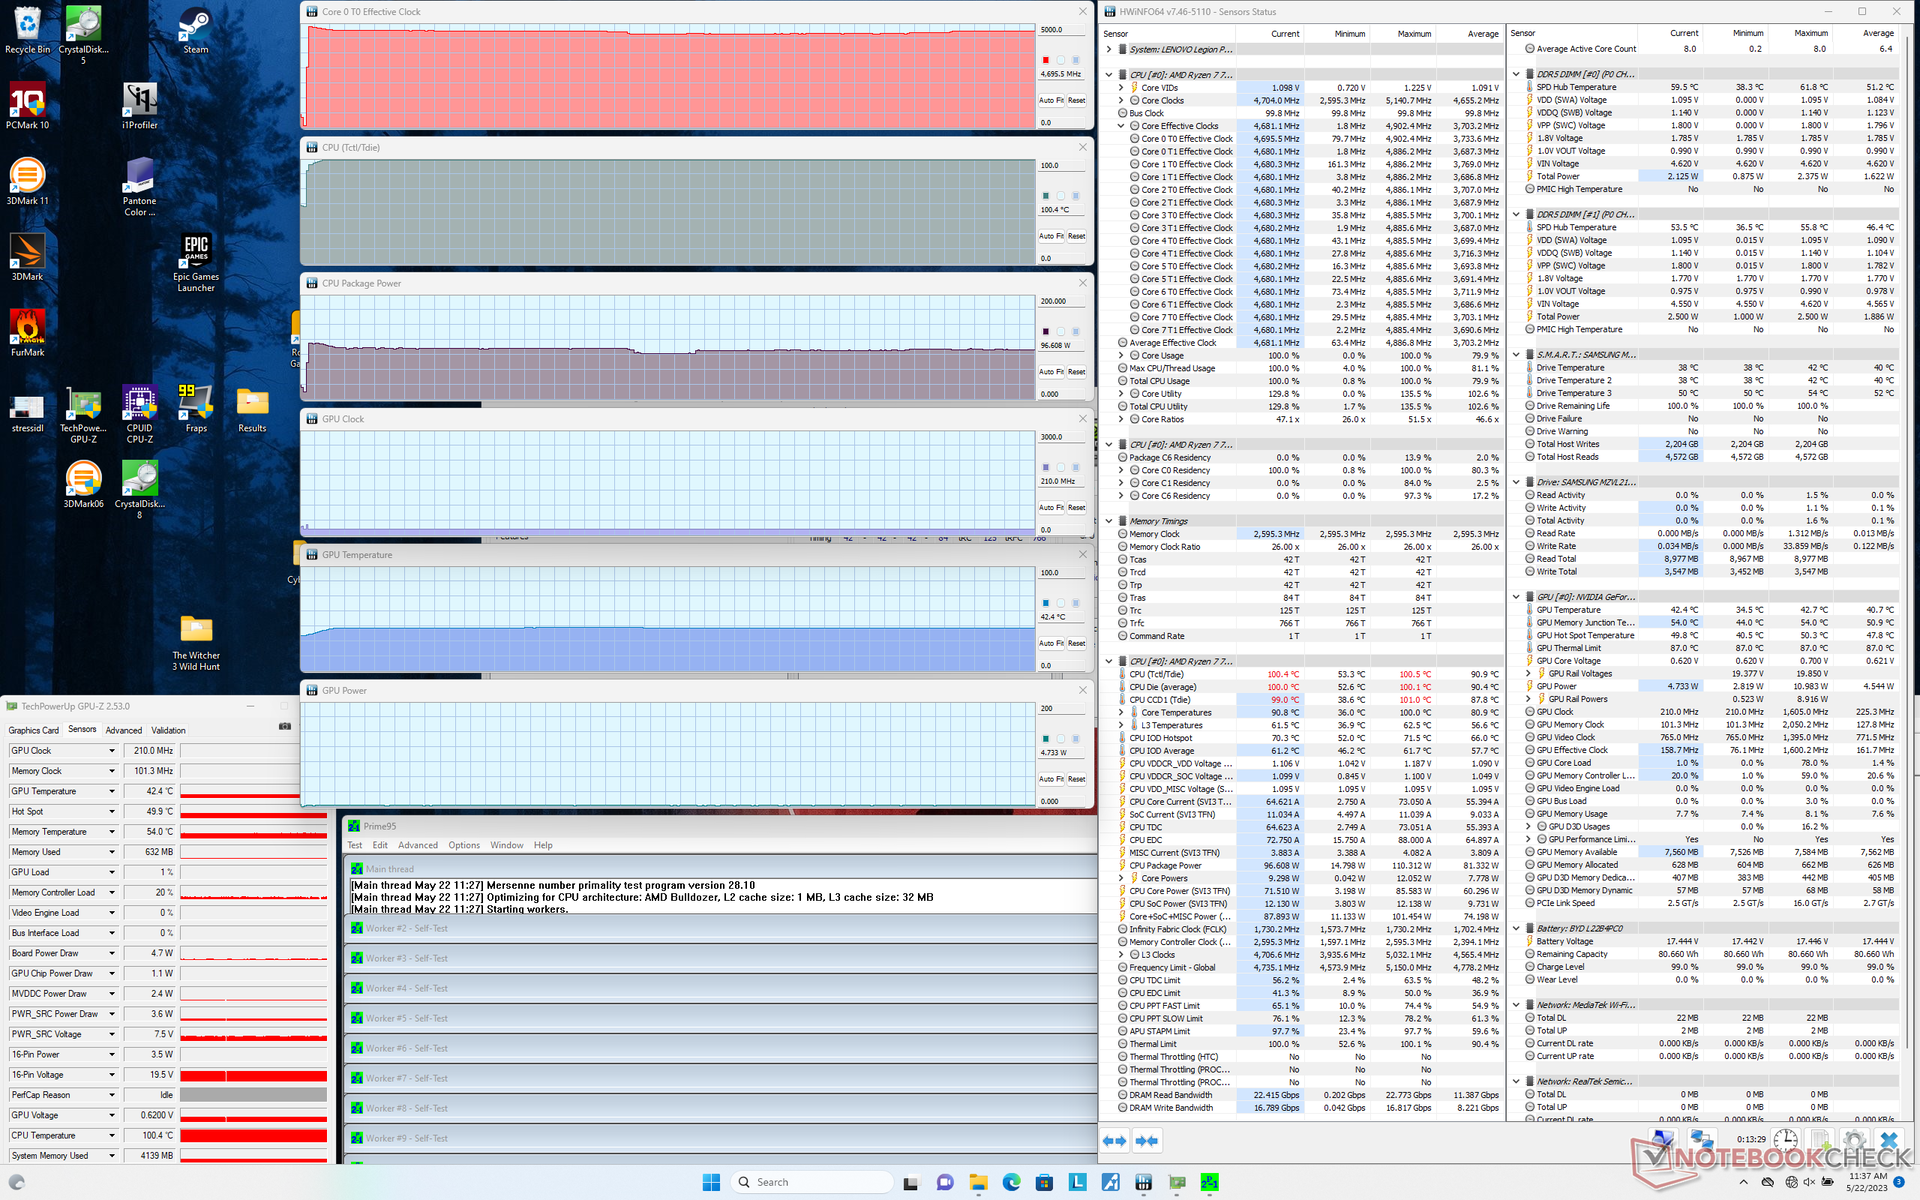
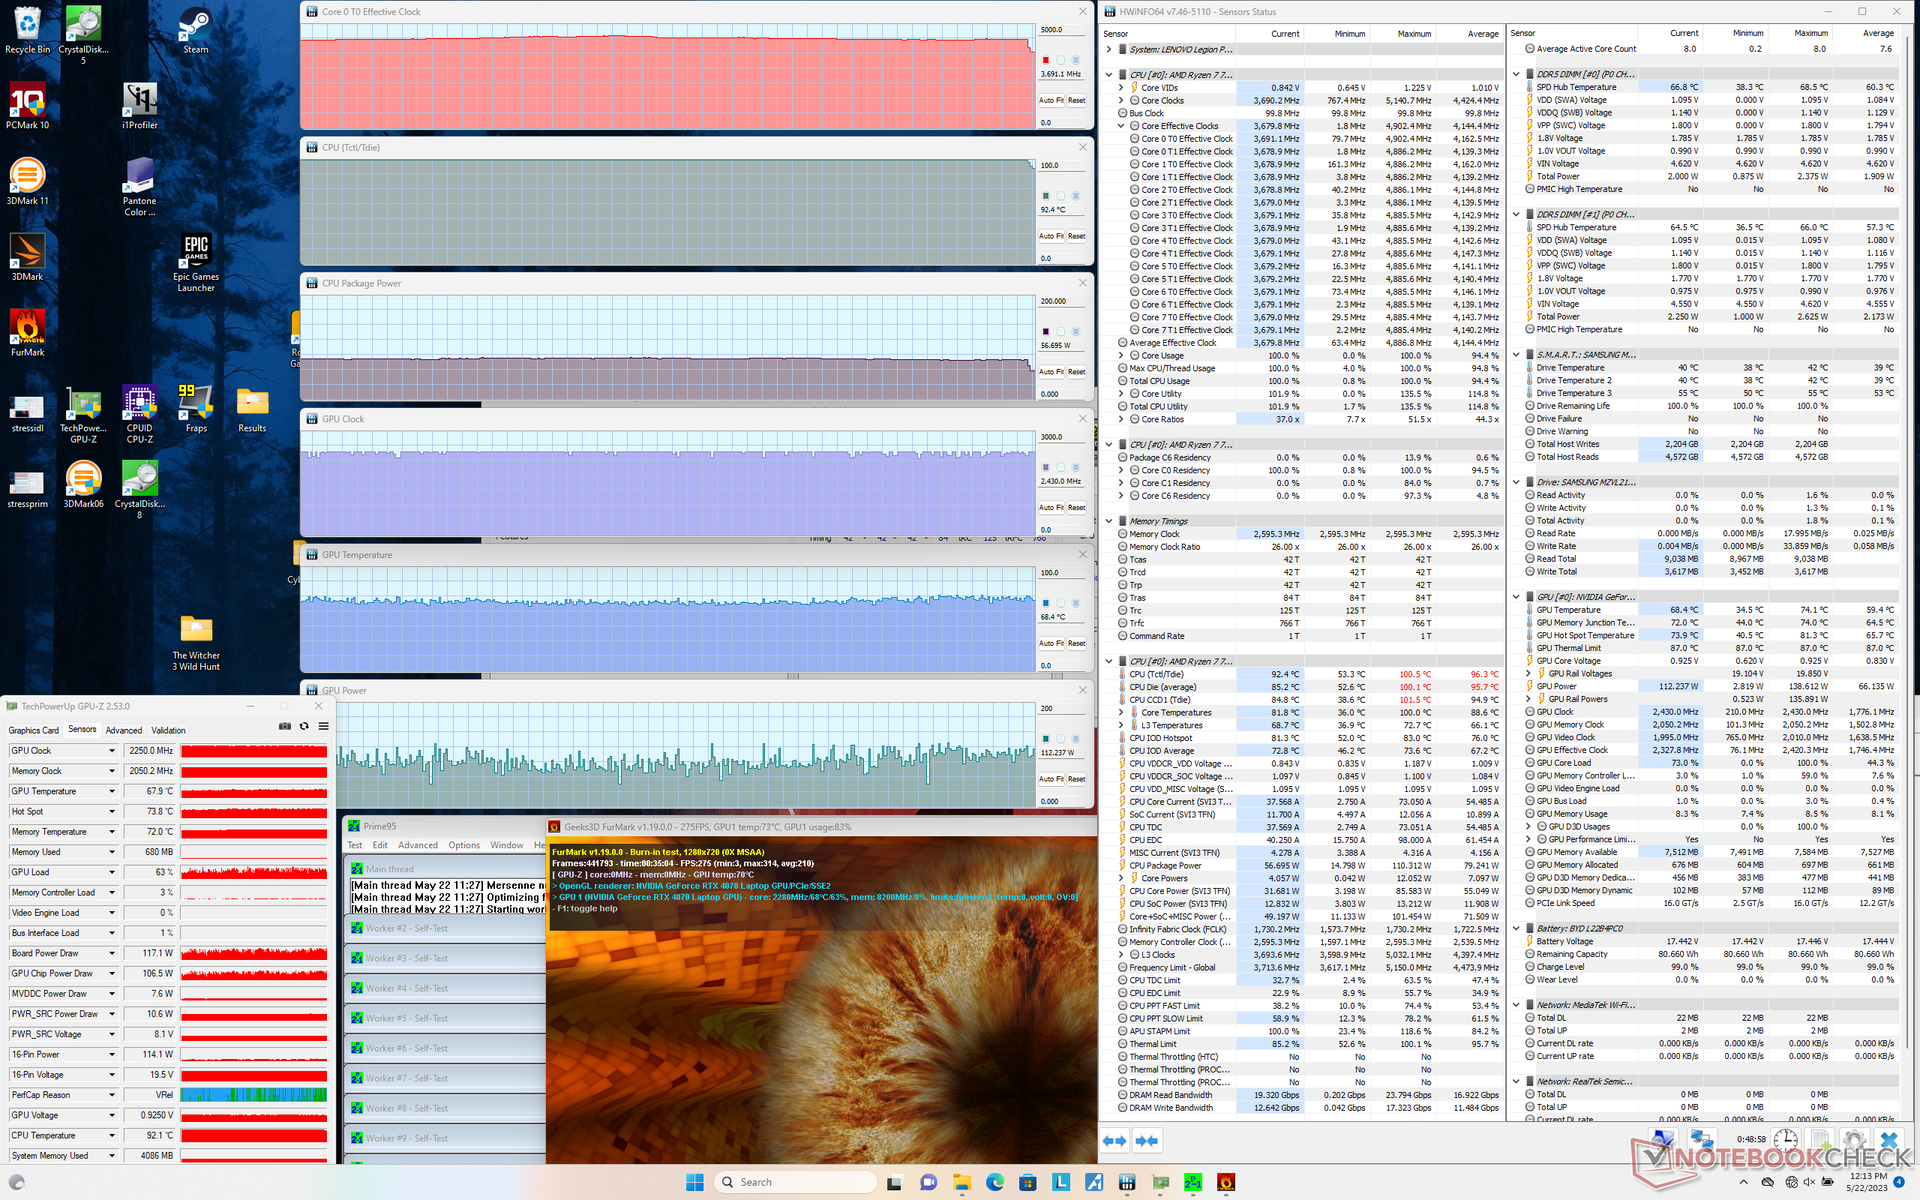
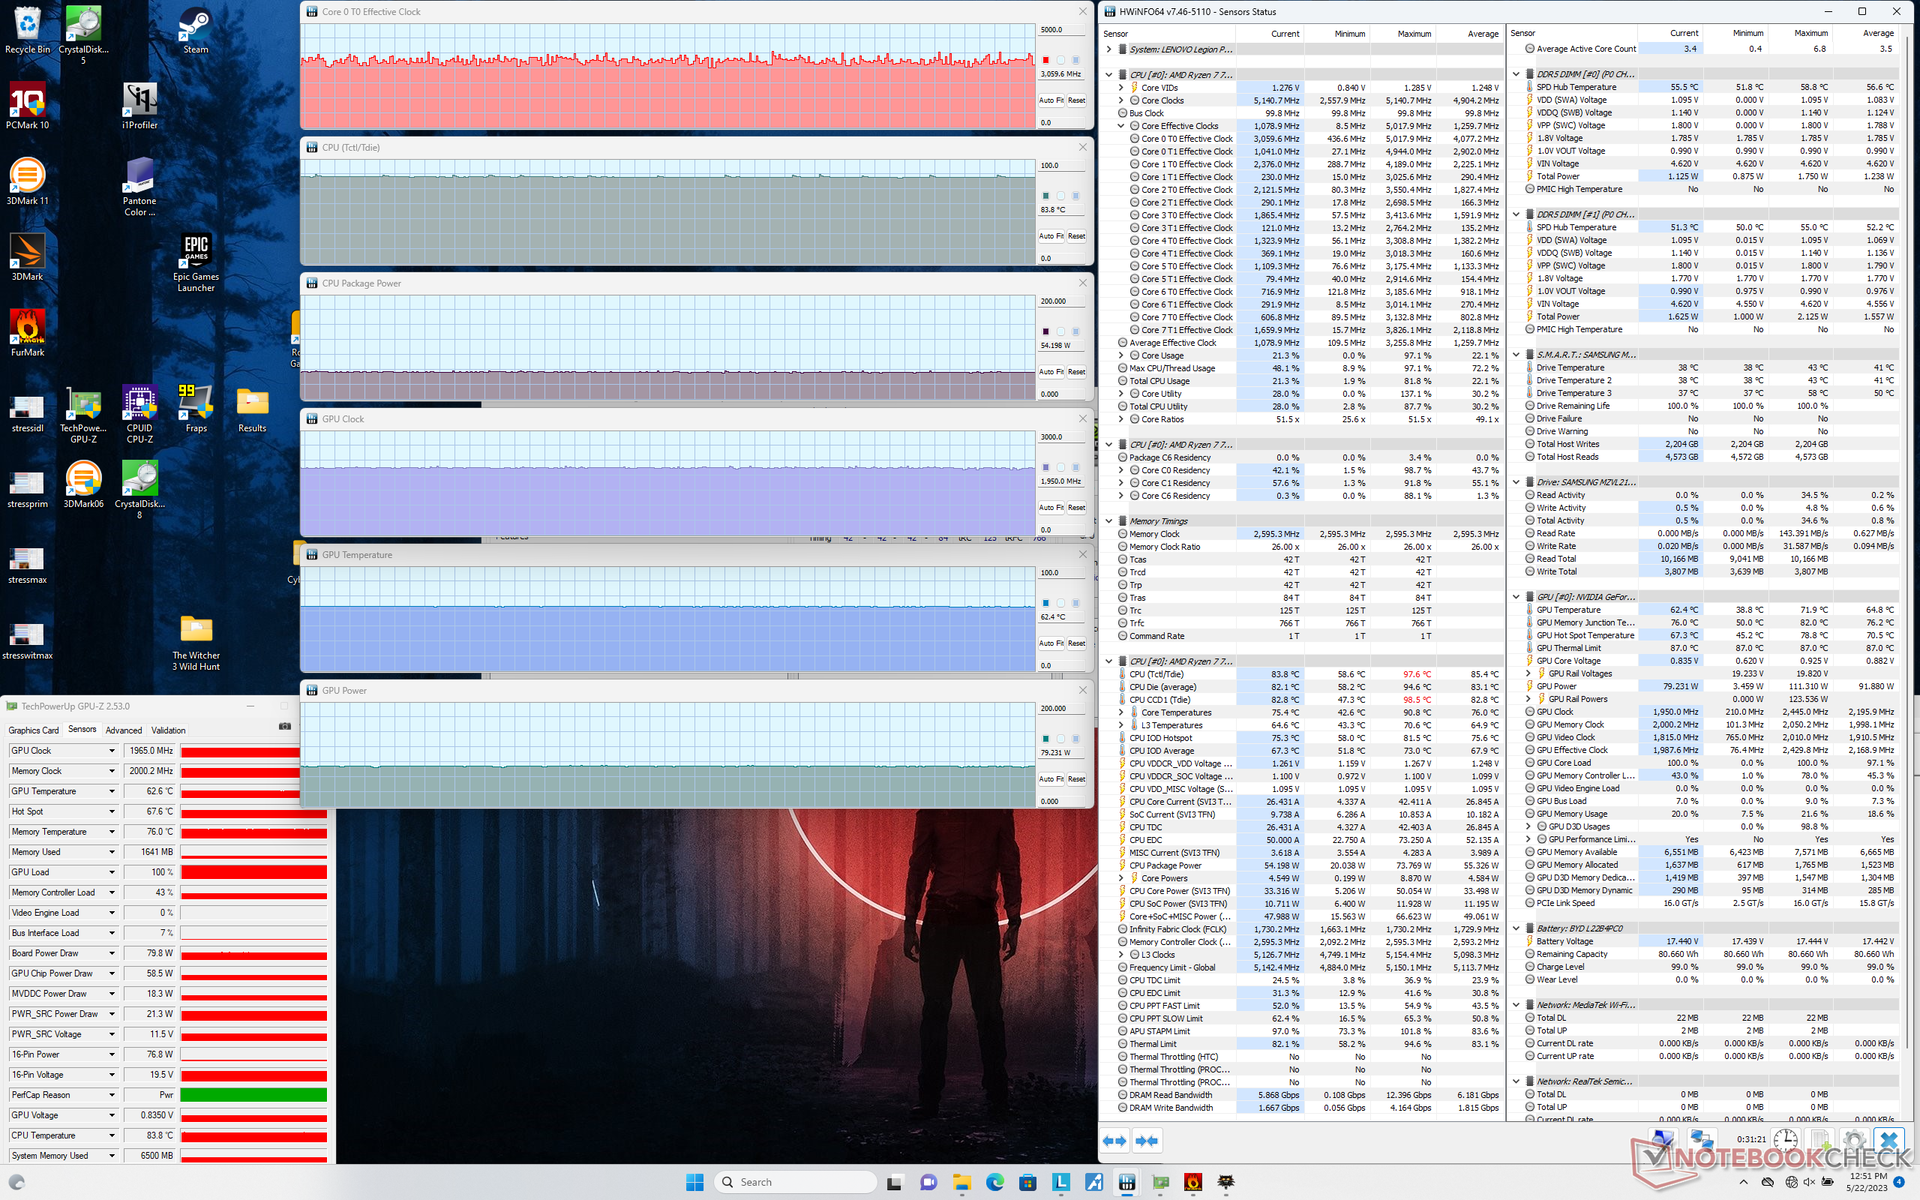
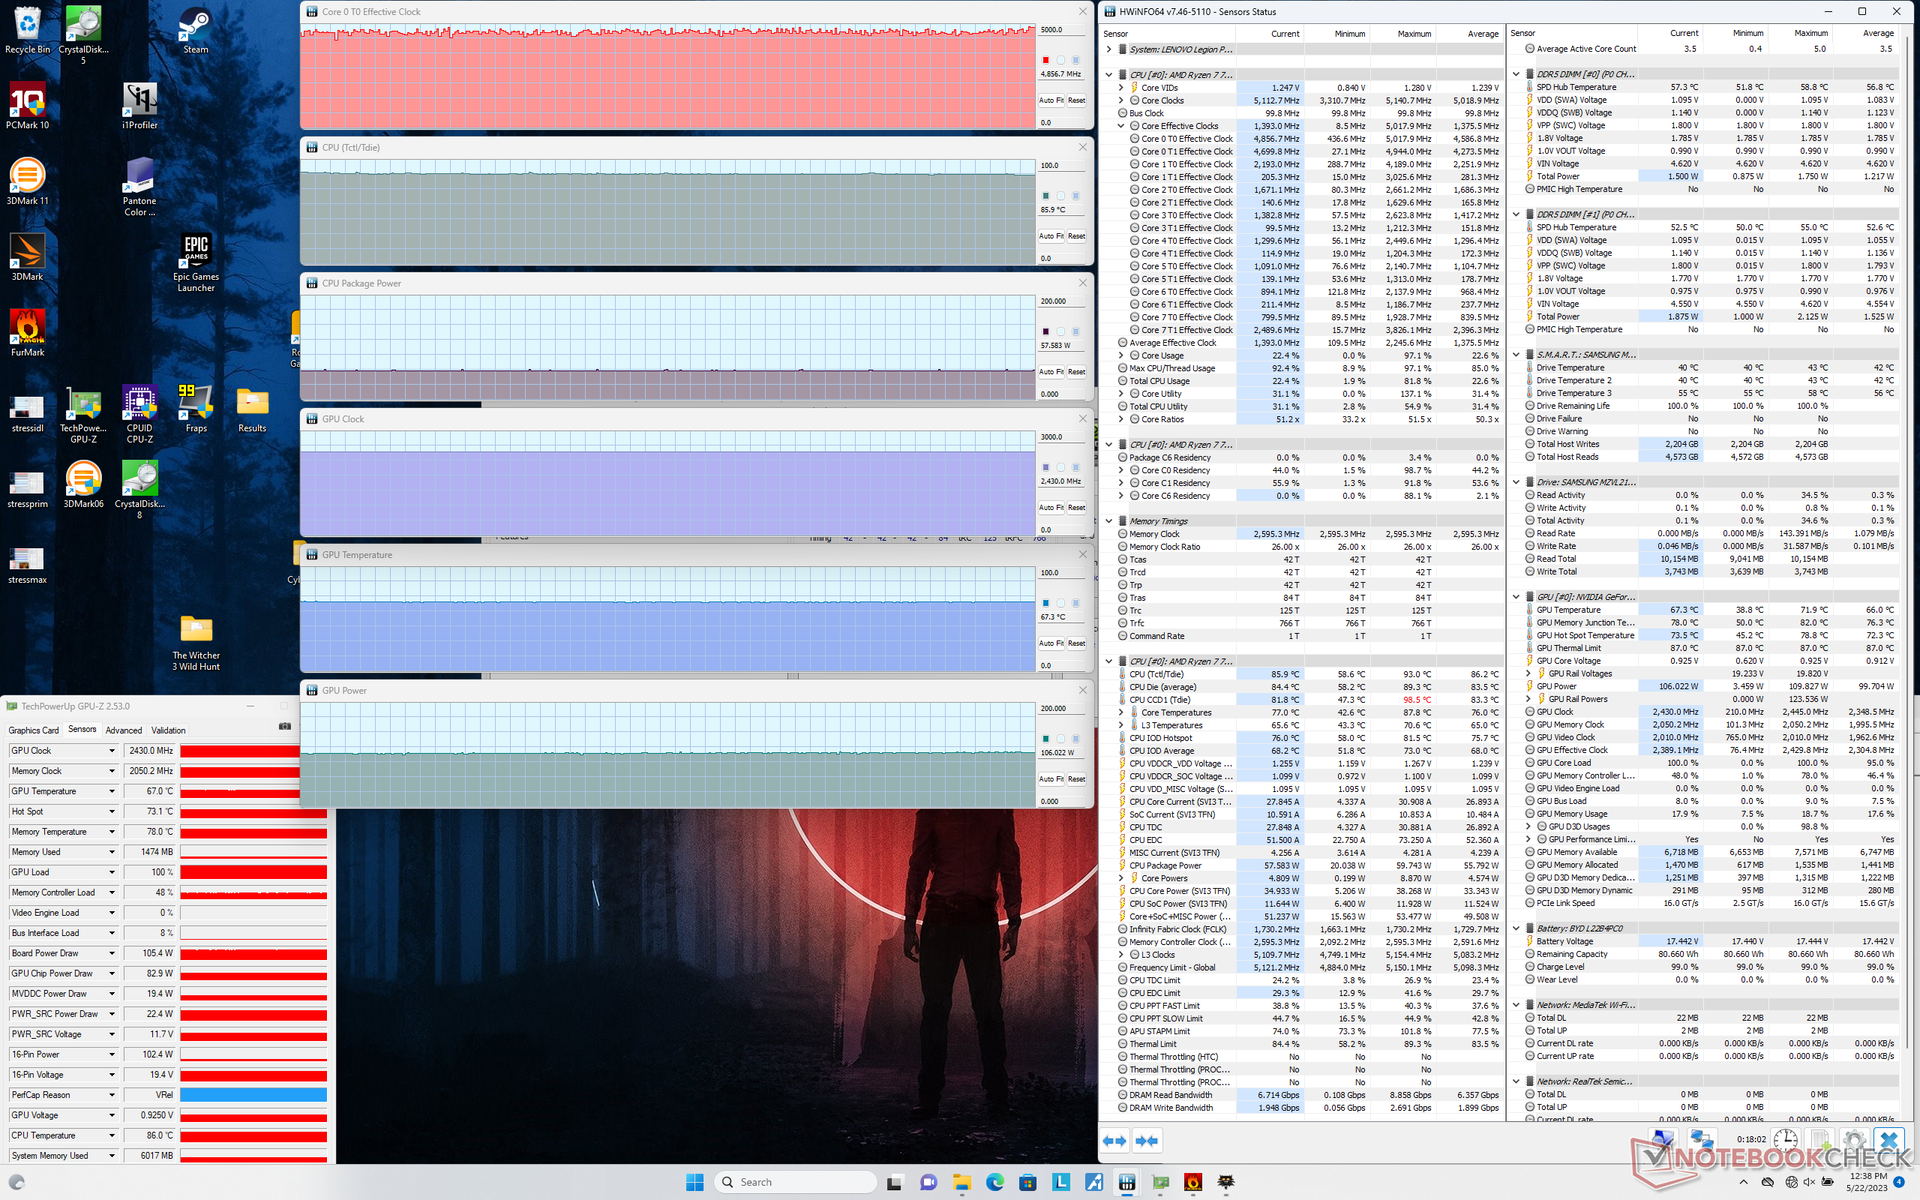
| CPU-klok (GHz) | GPU-klok (MHz) | Gemiddelde CPU-temperatuur (°C) | Gemiddelde GPU-temperatuur (°C) | |
| Systeem Idle | -- | -- | 53 | 35 |
| Prime95 Stress | 4.6 - 4.7 | -- | 100 | 42 |
| Prime95 + FurMark Stress | 3.7 - 4.3 | 2250 | 92 - 100 | 69 |
| Witcher 3 Stress (prestatiemodus) | 4,9 | 2430 | 86 | 67 |
| Witcher 3 Stress (evenwichtige modus) | 3.1 | 1965 | 84 | 62 |
Luidsprekers
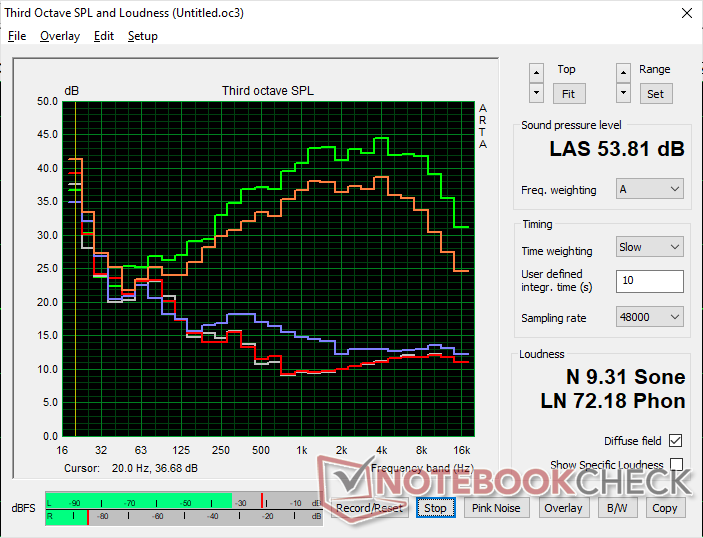
Lenovo Legion Pro 5 16ARX8 audioanalyse
(±) | luidspreker luidheid is gemiddeld maar goed (80.9 dB)
Bas 100 - 315 Hz
(-) | bijna geen lage tonen - gemiddeld 24% lager dan de mediaan
(±) | lineariteit van de lage tonen is gemiddeld (13.4% delta ten opzichte van de vorige frequentie)
Midden 400 - 2000 Hz
(+) | evenwichtige middens - slechts 4.7% verwijderd van de mediaan
(+) | de middentonen zijn lineair (6.2% delta ten opzichte van de vorige frequentie)
Hoog 2 - 16 kHz
(+) | evenwichtige hoogtepunten - slechts 2.5% verwijderd van de mediaan
(+) | de hoge tonen zijn lineair (6.2% delta naar de vorige frequentie)
Algemeen 100 - 16.000 Hz
(±) | lineariteit van het totale geluid is gemiddeld (21.9% verschil met de mediaan)
Vergeleken met dezelfde klasse
» 79% van alle geteste apparaten in deze klasse waren beter, 6% vergelijkbaar, 16% slechter
» De beste had een delta van 6%, het gemiddelde was 18%, de slechtste was 132%
Vergeleken met alle geteste toestellen
» 63% van alle geteste apparaten waren beter, 7% gelijk, 31% slechter
» De beste had een delta van 4%, het gemiddelde was 24%, de slechtste was 134%
Apple MacBook Pro 16 2021 M1 Pro audioanalyse
(+) | luidsprekers kunnen relatief luid spelen (84.7 dB)
Bas 100 - 315 Hz
(+) | goede baars - slechts 3.8% verwijderd van de mediaan
(+) | de lage tonen zijn lineair (5.2% delta naar de vorige frequentie)
Midden 400 - 2000 Hz
(+) | evenwichtige middens - slechts 1.3% verwijderd van de mediaan
(+) | de middentonen zijn lineair (2.1% delta ten opzichte van de vorige frequentie)
Hoog 2 - 16 kHz
(+) | evenwichtige hoogtepunten - slechts 1.9% verwijderd van de mediaan
(+) | de hoge tonen zijn lineair (2.7% delta naar de vorige frequentie)
Algemeen 100 - 16.000 Hz
(+) | het totale geluid is lineair (4.6% verschil met de mediaan)
Vergeleken met dezelfde klasse
» 0% van alle geteste apparaten in deze klasse waren beter, 0% vergelijkbaar, 100% slechter
» De beste had een delta van 5%, het gemiddelde was 17%, de slechtste was 45%
Vergeleken met alle geteste toestellen
» 0% van alle geteste apparaten waren beter, 0% gelijk, 100% slechter
» De beste had een delta van 4%, het gemiddelde was 24%, de slechtste was 134%
Energiebeheer
Energieverbruik - Lagere CPU-boost dan de Core i7-13700HX
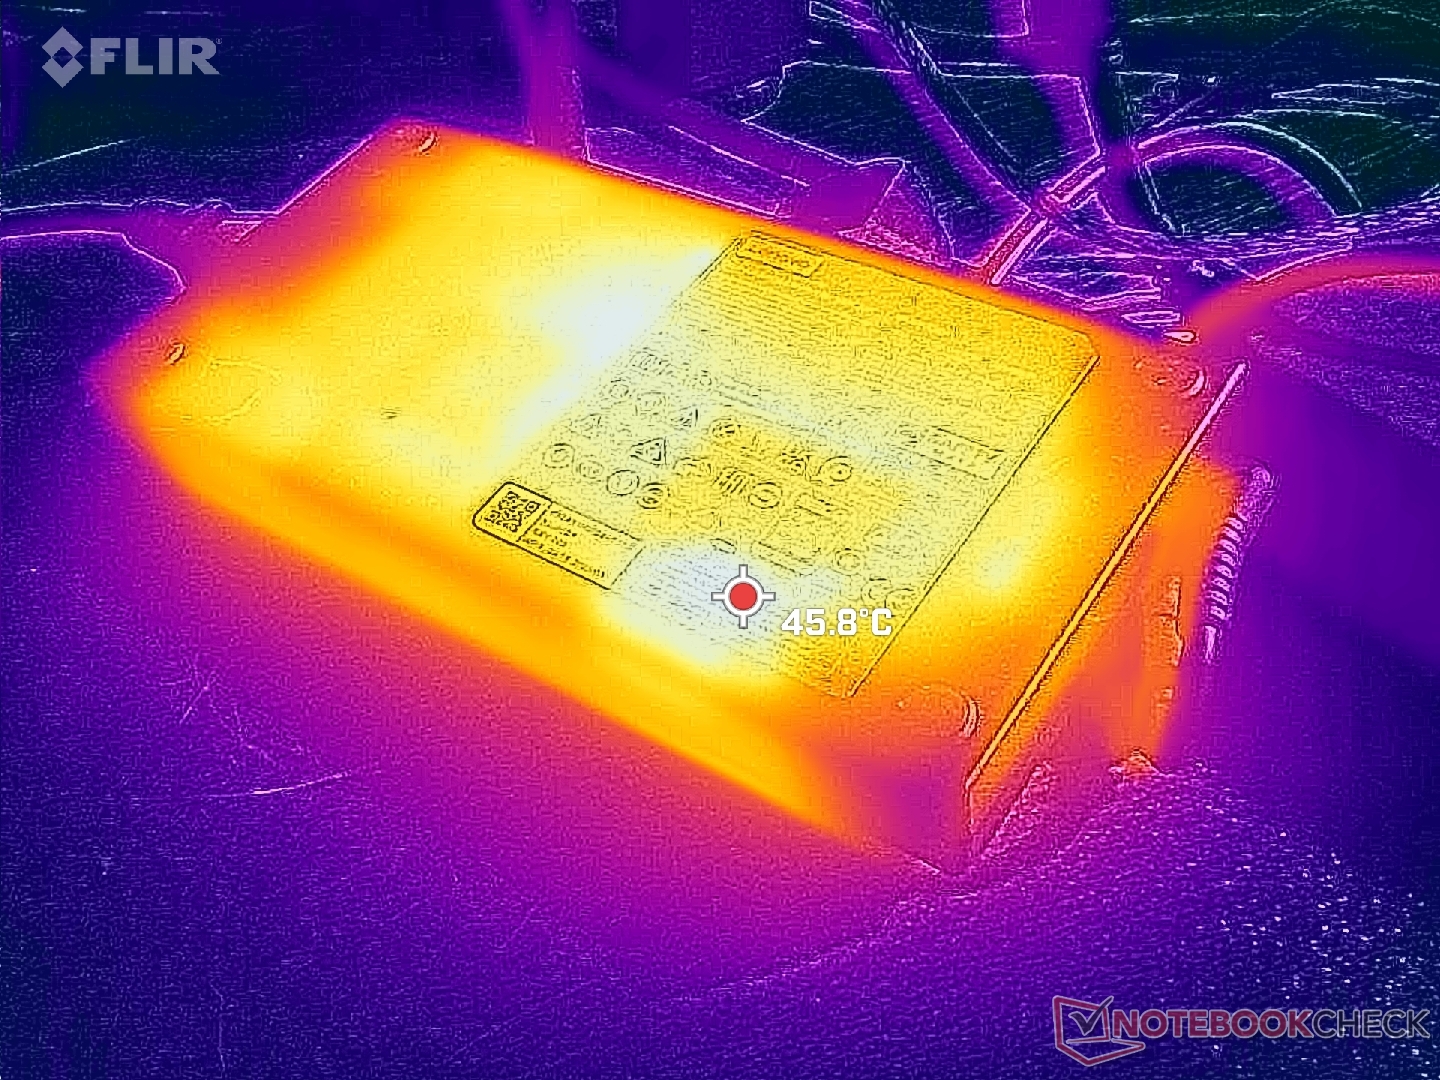
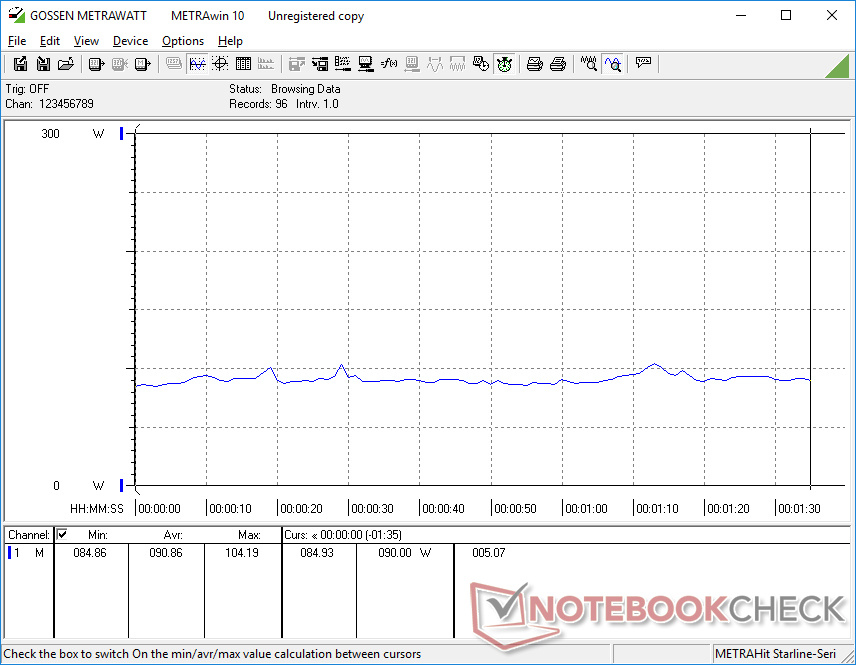
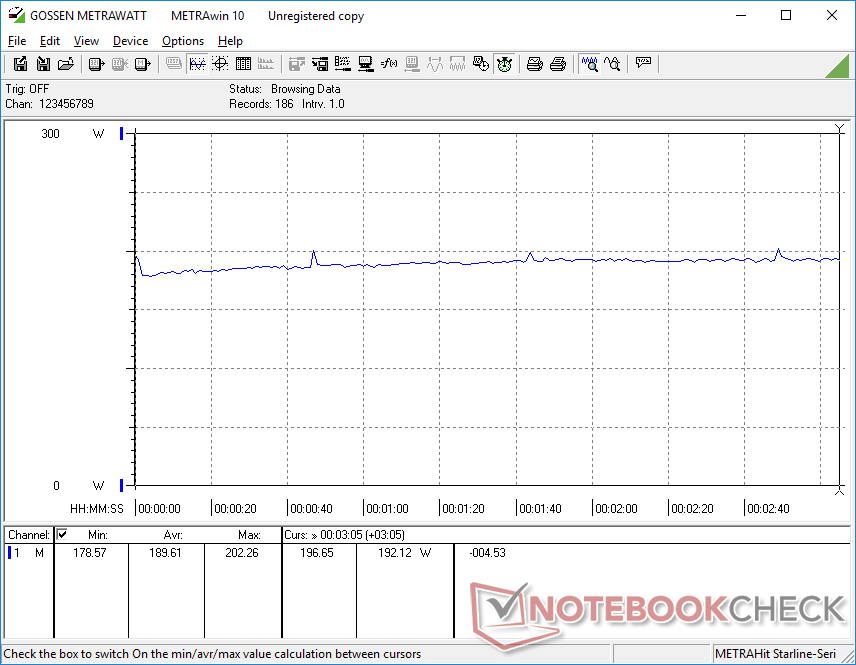
Het AMD-model is energiezuiniger dan het Intel-model bij stationair draaien op de desktop. Verder vragen beide modellen ongeveer evenveel stroom bij hogere belastingen zoals games. Beide modellen worden ook geleverd met dezelfde 300 W AC-adapter die meer dan genoeg ruimte biedt voor de ~140 W GPU en ~100 W CPU.
Opmerkelijk is dat de Core i7-13700HX in het Intel-model een vermogen van 159 W kan opnemen, vergeleken met slechts 110 W op onze Ryzen 7 7745HX, wat deels het prestatievoordeel ten opzichte van de AMD CPU verklaart. Wanneer Turbo Boost kloksnelheden tot rust komen na een paar minuten van stress, zou het stroomverbruik tussen de twee modellen echter veel dichter bij elkaar komen te liggen, zoals blijkt uit de onderstaande vergelijkingsgrafieken. Zo stabiliseren de Intel- en AMD-modellen zich bij Prime95 gedurende een paar minuten op respectievelijk 158 W en 149 W, hoewel het Intel-model in het begin van de test tot 220 W kan opvoeren.
| Uit / Standby | |
| Inactief | |
| Belasting |
|
Key:
min: | |
| Lenovo Legion Pro 5 16ARX8 R7 7745HX, GeForce RTX 4070 Laptop GPU, Samsung PM9A1 MZVL21T0HCLR, IPS, 2560x1600, 16" | Lenovo Legion Pro 5 16IRX8 i7-13700HX, GeForce RTX 4060 Laptop GPU, SK hynix PC801 HFS512GEJ9X115N, IPS, 2560x1600, 16" | Uniwill GM6PX7X RTX 4070 i7-13700HX, GeForce RTX 4070 Laptop GPU, Samsung PM9A1 MZVL2512HCJQ, IPS, 2560x1600, 16" | Schenker XMG Neo 16 E23 i9-13900HX, GeForce RTX 4090 Laptop GPU, Crucial P5 Plus 1TB CT1000P5PSSD8, IPS, 2560x1600, 16" | Asus ROG Strix G16 G614JZ i9-13980HX, GeForce RTX 4080 Laptop GPU, WD PC SN560 SDDPNQE-1T00, IPS, 2560x1600, 16" | Asus Zephyrus Duo 16 GX650PY-NM006W R9 7945HX, GeForce RTX 4090 Laptop GPU, SK hynix PC801 HFS002TEJ9X101N, MiniLED, 2560x1600, 16" | |
|---|---|---|---|---|---|---|
| Power Consumption | -46% | -13% | -23% | -17% | -51% | |
| Idle Minimum * (Watt) | 8.1 | 24.5 -202% | 12.6 -56% | 8 1% | 10 -23% | 19.2 -137% |
| Idle Average * (Watt) | 15.9 | 29.2 -84% | 17.7 -11% | 18 -13% | 16 -1% | 29.7 -87% |
| Idle Maximum * (Watt) | 37.2 | 34.3 8% | 31.8 15% | 28 25% | 27 27% | 30.8 17% |
| Load Average * (Watt) | 90.9 | 98.7 -9% | 101.4 -12% | 133 -46% | 129 -42% | 126 -39% |
| Witcher 3 ultra * (Watt) | 189.6 | 178.6 6% | 185.3 2% | 294 -55% | 247 -30% | 258 -36% |
| Load Maximum * (Watt) | 263.5 | 249.6 5% | 298 -13% | 399 -51% | 342 -30% | 330 -25% |
* ... kleiner is beter
Power Consumption Witcher 3 / Stresstest
Power Consumption external Monitor
Levensduur van de batterij
De WLAN runtime is net iets langer dan de Intel versie met ongeveer 30 minuten wanneer ingesteld op het Balanced power profiel met de iGPU actief. Hoewel niet slecht voor een gaming laptop, alternatieven zoals de Schenker XMG Neo 16 ofAsus ROG Strix G16 hebben accu's met een grotere capaciteit en een langere looptijd van elk meer dan twee uur.
Opladen van leeg naar volledige capaciteit met de meegeleverde AC-adapter gaat snel met ongeveer 1 tot 1,5 uur. Rapid Charge is standaard ingeschakeld, in tegenstelling tot oudere Legion of Yoga-modellen waar het kan worden uitgeschakeld. Opladen met USB-C adapters van derden wordt alleen ondersteund op de USB-C poort aan de achterzijde.
| Lenovo Legion Pro 5 16ARX8 R7 7745HX, GeForce RTX 4070 Laptop GPU, 80 Wh | Lenovo Legion Pro 5 16IRX8 i7-13700HX, GeForce RTX 4060 Laptop GPU, 80 Wh | Uniwill GM6PX7X RTX 4070 i7-13700HX, GeForce RTX 4070 Laptop GPU, 62 Wh | Schenker XMG Neo 16 E23 i9-13900HX, GeForce RTX 4090 Laptop GPU, 99 Wh | Asus ROG Strix G16 G614JZ i9-13980HX, GeForce RTX 4080 Laptop GPU, 90 Wh | Asus Zephyrus Duo 16 GX650PY-NM006W R9 7945HX, GeForce RTX 4090 Laptop GPU, 90 Wh | |
|---|---|---|---|---|---|---|
| Batterijduur | -14% | 0% | 68% | 76% | 0% | |
| Reader / Idle (h) | 6.5 | 6.7 3% | ||||
| WiFi v1.3 (h) | 4 | 3.4 -15% | 4 0% | 6.7 68% | 9.7 142% | 4 0% |
| Load (h) | 1 | 0.7 -30% | 1.1 10% | 1 0% | ||
| H.264 (h) | 5.8 | 3.8 | ||||
| Witcher 3 ultra (h) | 1.4 |
Pro
Contra
Verdict - AMD is de betere optie voor gamers
Lenovo heeft hier twee zeer interessante opties: De Intel Core i7-13700HX Legion Pro 5 16 met RTX 4060 graphics voor $1600 USD of de AMD Ryzen 7 7745HX Legion Pro 5 16 met RTX 4070 graphics - ook voor $1600 USD. De eerste biedt ongeveer 10 procent snellere CPU-prestaties ten koste van 15 procent tragere GPU-prestaties, terwijl de laatste het tegenovergestelde is. Bijna al het andere aan de twee opties is identiek, omdat ze allebei hetzelfde chassisontwerp delen. Gebruikers die de CPU-prestaties belangrijker vinden dan de GPU zullen dus wellicht de Intel-optie kiezen, terwijl gebruikers die de GPU belangrijker vinden de AMD-optie zullen kiezen.
Aangezien de Legion Pro 5 16 eerst en vooral een gaming laptop is, zullen de meeste gebruikers de AMD optie willen kiezen voor de snellere RTX 4070 graphics. Bijna alle nieuwste games zijn GPU gebonden en dus zouden eventuele extra CPU prestatievoordelen boven de Ryzen 7 7745HX slechts een minimale impact hebben op de gaming ervaring. In dit scenario is de relatief hoge vraagprijs van 1600 dollar beter gerechtvaardigd, omdat gebruikers een RTX 4070 krijgen in plaats van de langzamere RTX 4060.
Prijs en beschikbaarheid
Lenovo verscheept momenteel zijn Legion Pro 5 16 Gen 8 vanaf 1280 USD voor de basis Ryzen 5/RTX 4050 configuratie tot 1600 USD voor onze Ryzen 7/RTX 4070 configuratie. Het model is vanaf dit schrijven nog niet algemeen verkrijgbaar via grote resellers zoals Best Buy of Amazon.
Lenovo Legion Pro 5 16ARX8
- 24-05-2023 v7 (old)
Allen Ngo
Transparantie
De selectie van te beoordelen apparaten wordt gemaakt door onze redactie. Het testexemplaar werd ten behoeve van deze beoordeling door de fabrikant of detailhandelaar in bruikleen aan de auteur verstrekt. De kredietverstrekker had geen invloed op deze recensie, noch ontving de fabrikant vóór publicatie een exemplaar van deze recensie. Er bestond geen verplichting om deze recensie te publiceren. Als onafhankelijk mediabedrijf is Notebookcheck niet onderworpen aan het gezag van fabrikanten, detailhandelaren of uitgevers.
[transparency_disclaimer]Dit is hoe Notebookcheck test
Elk jaar beoordeelt Notebookcheck onafhankelijk honderden laptops en smartphones met behulp van gestandaardiseerde procedures om ervoor te zorgen dat alle resultaten vergelijkbaar zijn. We hebben onze testmethoden al zo'n 20 jaar voortdurend ontwikkeld en daarbij de industriestandaard bepaald. In onze testlaboratoria wordt gebruik gemaakt van hoogwaardige meetapparatuur door ervaren technici en redacteuren. Deze tests omvatten een validatieproces in meerdere fasen. Ons complexe beoordelingssysteem is gebaseerd op honderden goed onderbouwde metingen en benchmarks, waardoor de objectiviteit behouden blijft. Meer informatie over onze testmethoden kunt u hier vinden.
Price comparison

