Core i7-13700HX prestatiedebuut: Uniwill GM6PX7X IDX laptop review

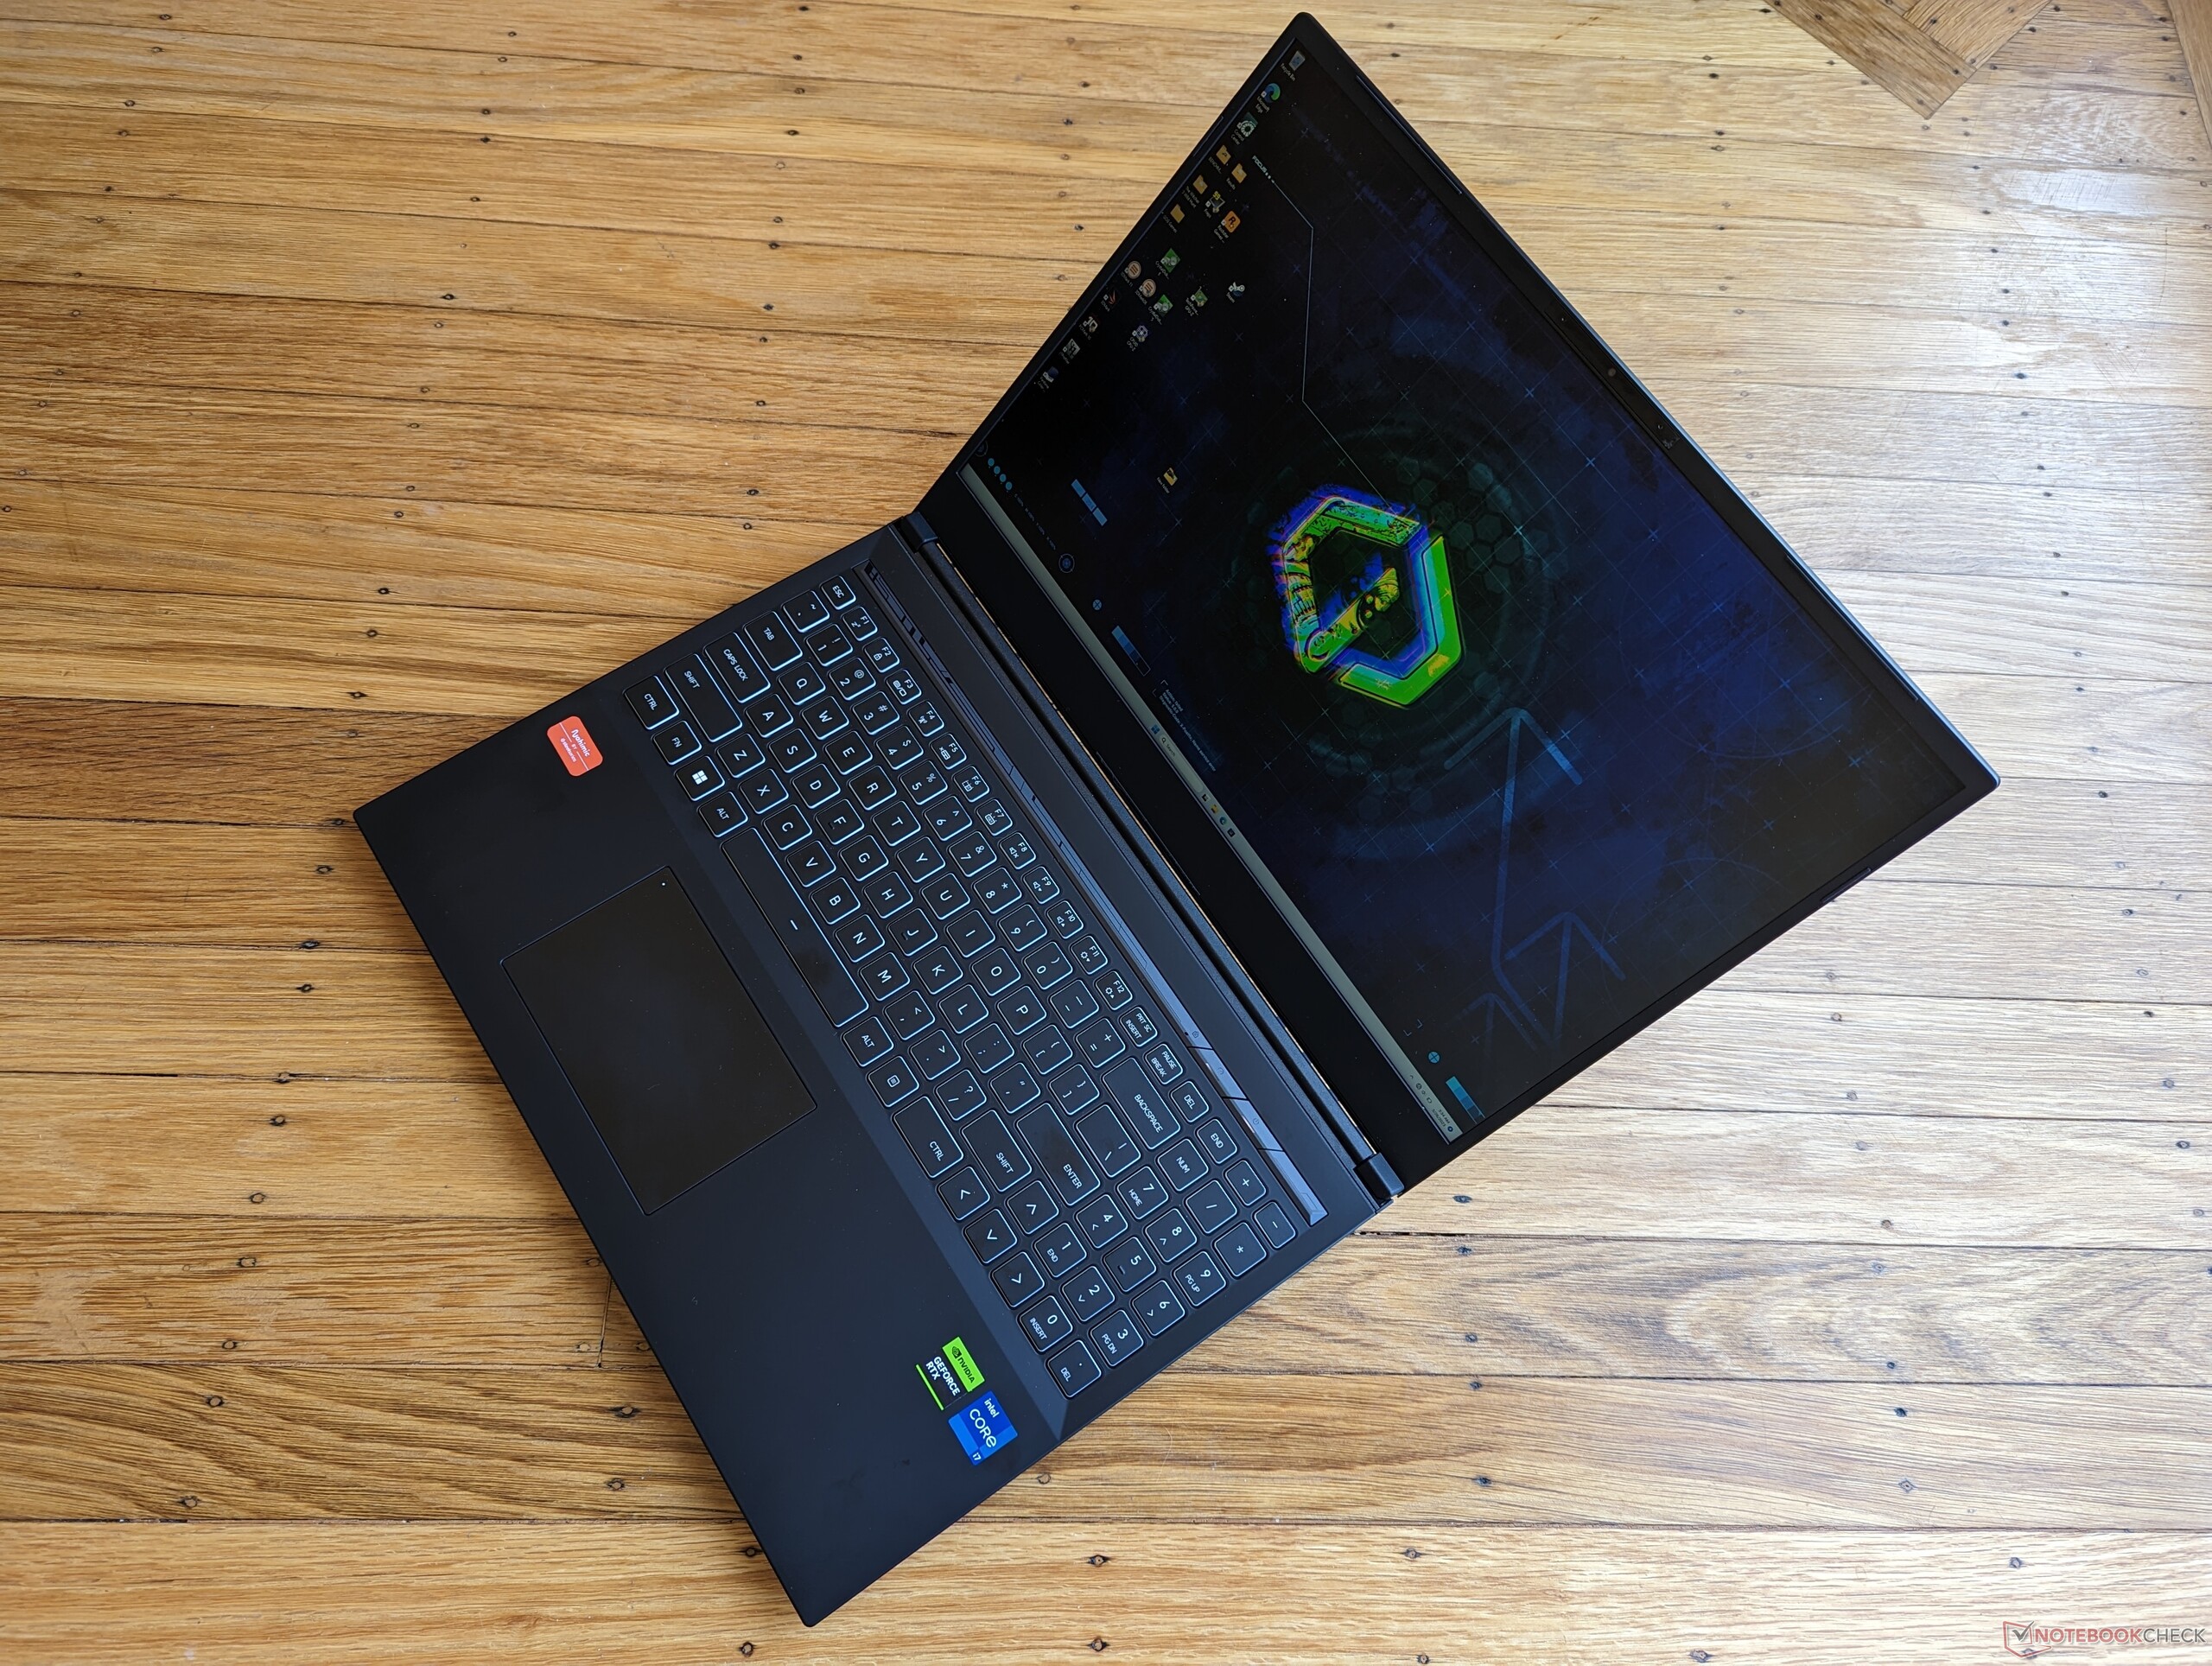
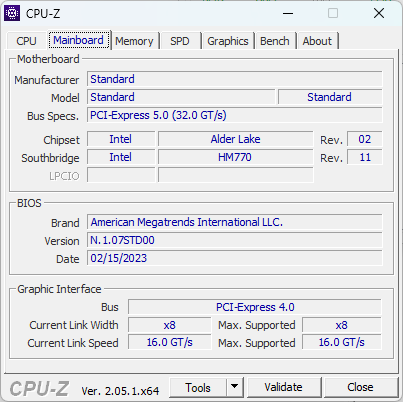
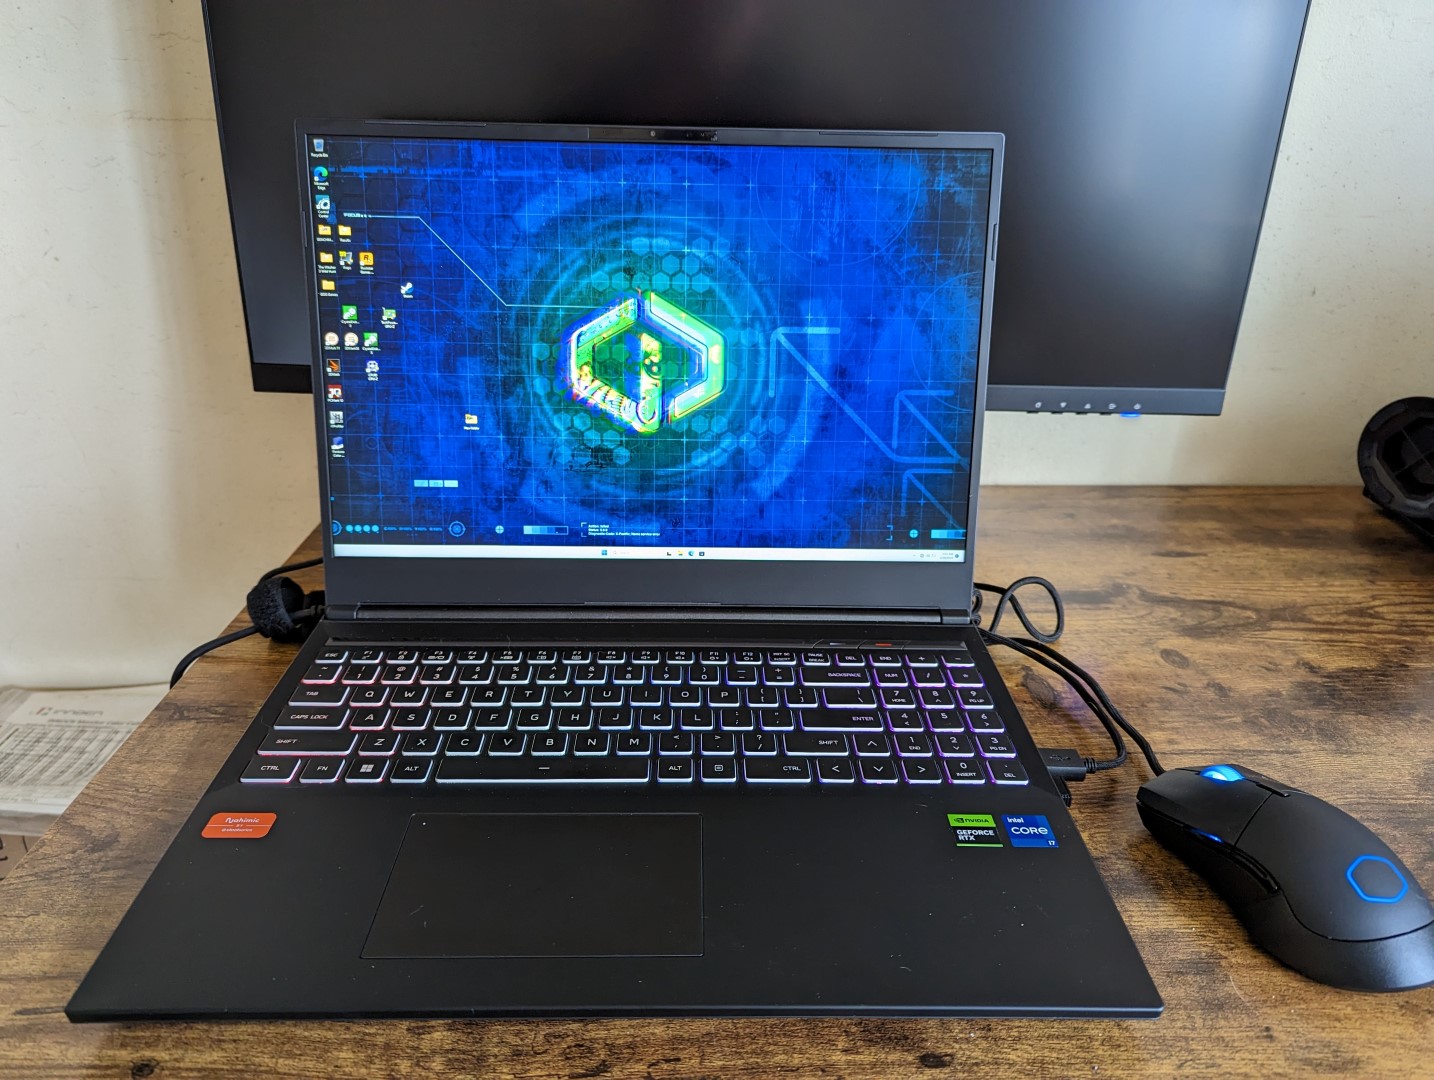
De Uniwill GM6PX7X is een 16-inch white label gaming laptop ontwerp dat in sommige markten bekend staat als de Schenker XMG Neo 16 E23. Het is een nieuwer model onthuld op CES 2023 naast de mobiele 13e gen Raptor Lake-H serie en mobiele Ada Lovelace GeForce RTX 40 serie.
Net als de meeste andere modellen van Uniwill of Schenker is de GM6PX7X zeer configureerbaar met CPU-opties tot de Core i9-13900HX en GPU-opties variërend van tot de mobiele GeForce RTX 4060 tot de 4090. Onze specifieke review unit is een midrange configuratie uitgerust met de Core i7-13700HX en RTX 4070.
Zie onze volledige review van de RTX 4090-aangedreven Schenker XMG Neo 16 E23 voor meer informatie over het chassis en aangezien onze RTX 4070-aangedreven Uniwill GM6PX7X gebruik maakt van hetzelfde ontwerp. Er zijn echter verschillende fysieke verschillen tussen hen die we hieronder zullen opmerken.
Meer Uniwill/Schenker reviews:
Potentiële concurrenten in vergelijking
Evaluatie | Datum | Model | Gewicht | Hoogte | Formaat | Resolutie | Beste prijs |
|---|---|---|---|---|---|---|---|
| 88.2 % v7 (old) | 03-2023 | Uniwill GM6PX7X RTX 4070 i7-13700HX, GeForce RTX 4070 Laptop GPU | 2.2 kg | 22 mm | 16.00" | 2560x1600 | |
| 87.7 % v7 (old) | 04-2023 | Schenker XMG Neo 16 E23 i9-13900HX, GeForce RTX 4090 Laptop GPU | 2.5 kg | 29.9 mm | 16.00" | 2560x1600 | |
| 88.4 % v7 (old) | 03-2023 | Asus ROG Strix G16 G614JZ i9-13980HX, GeForce RTX 4080 Laptop GPU | 2.4 kg | 30.4 mm | 16.00" | 2560x1600 | |
| 89.4 % v7 (old) | 02-2023 | Lenovo Legion Pro 7 16IRX8H i9-13900HX, GeForce RTX 4080 Laptop GPU | 2.7 kg | 26 mm | 16.00" | 2560x1600 | |
| 86.2 % v7 (old) | 03-2023 | Gigabyte AERO 16 OLED BSF i9-13900H, GeForce RTX 4070 Laptop GPU | 2.1 kg | 18 mm | 16.00" | 3840x2400 | |
| 91.2 % v7 (old) | 02-2023 | Razer Blade 16 Early 2023 i9-13950HX, GeForce RTX 4080 Laptop GPU | 2.4 kg | 21.99 mm | 16.00" | 2560x1600 |
Zaak
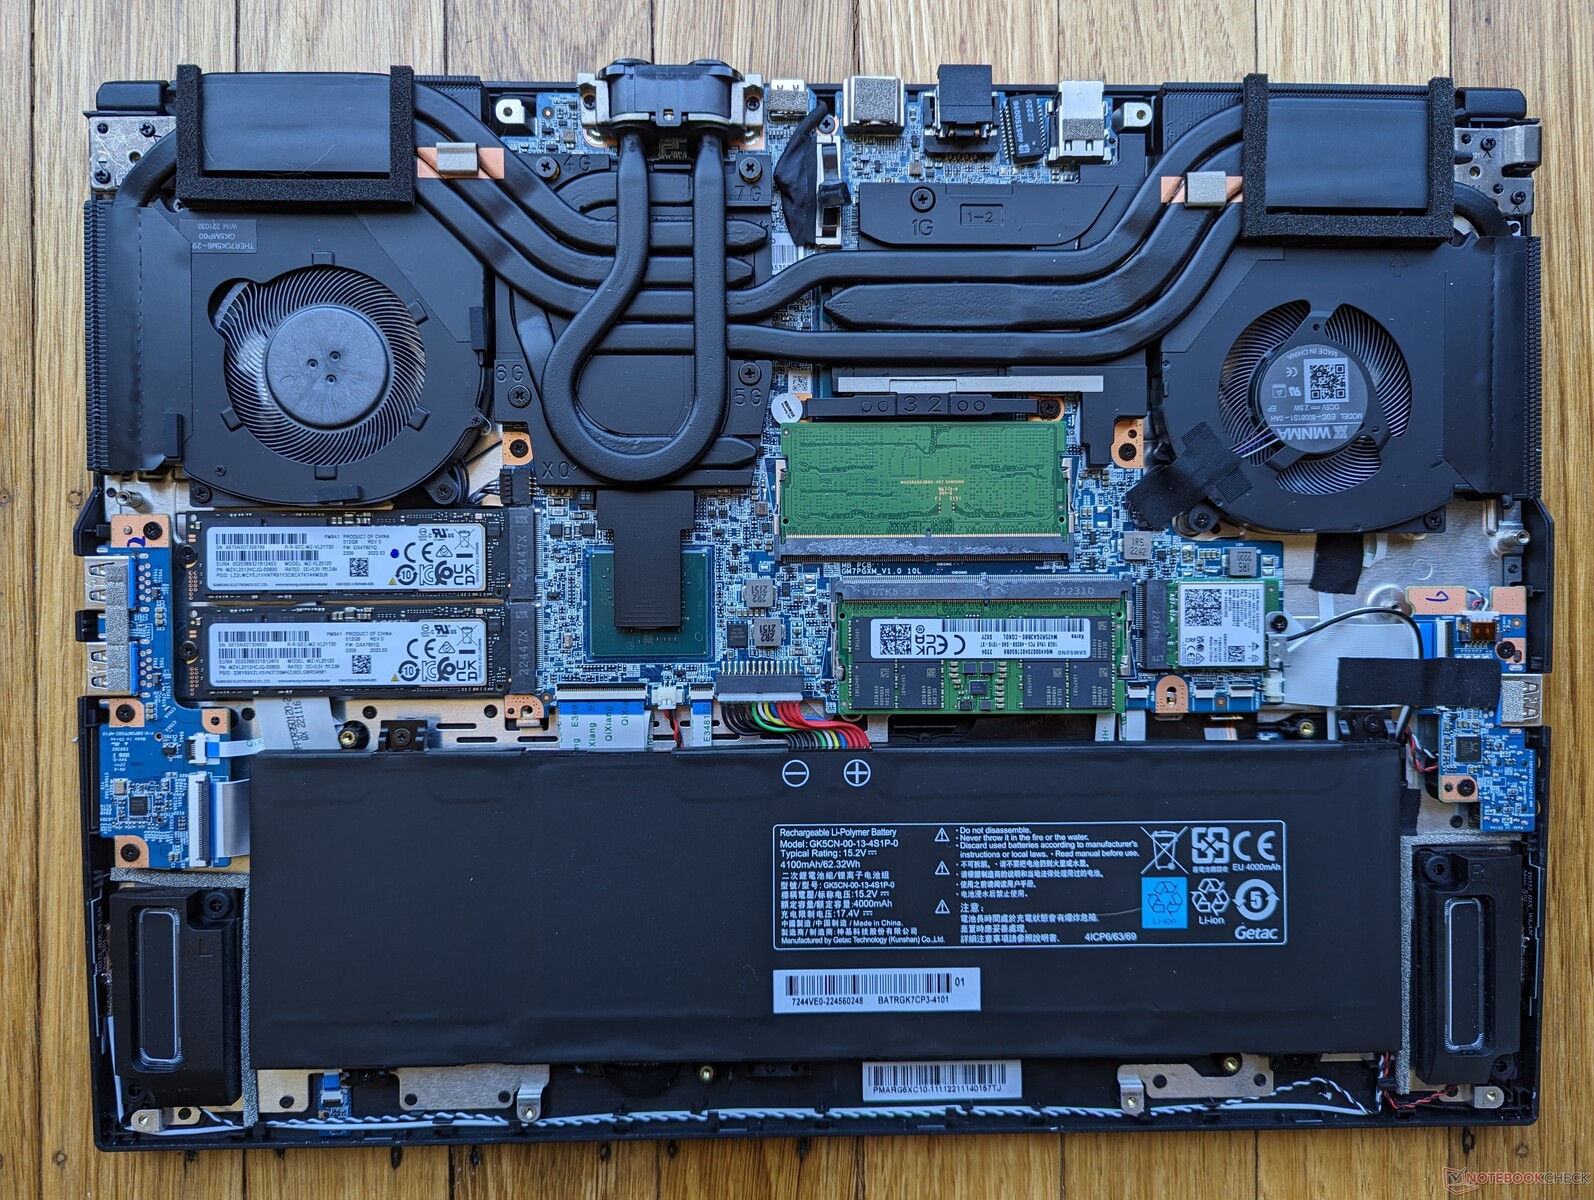
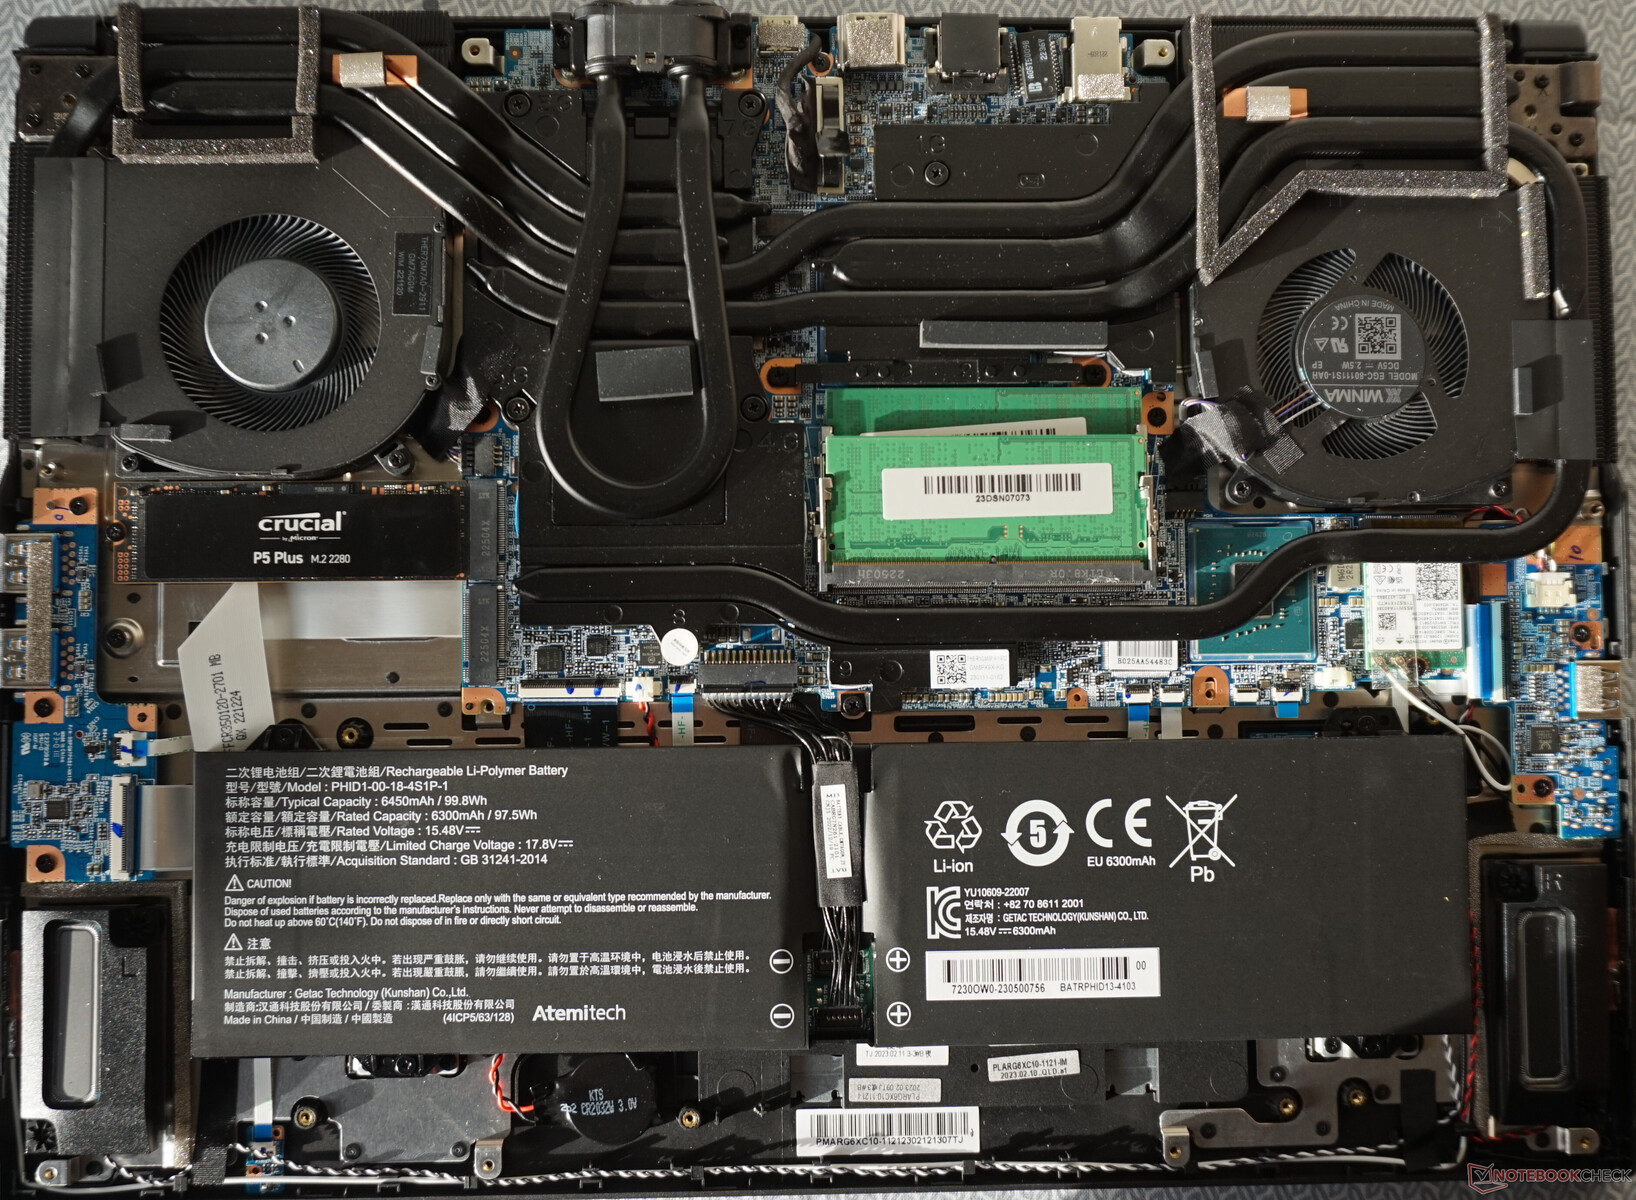
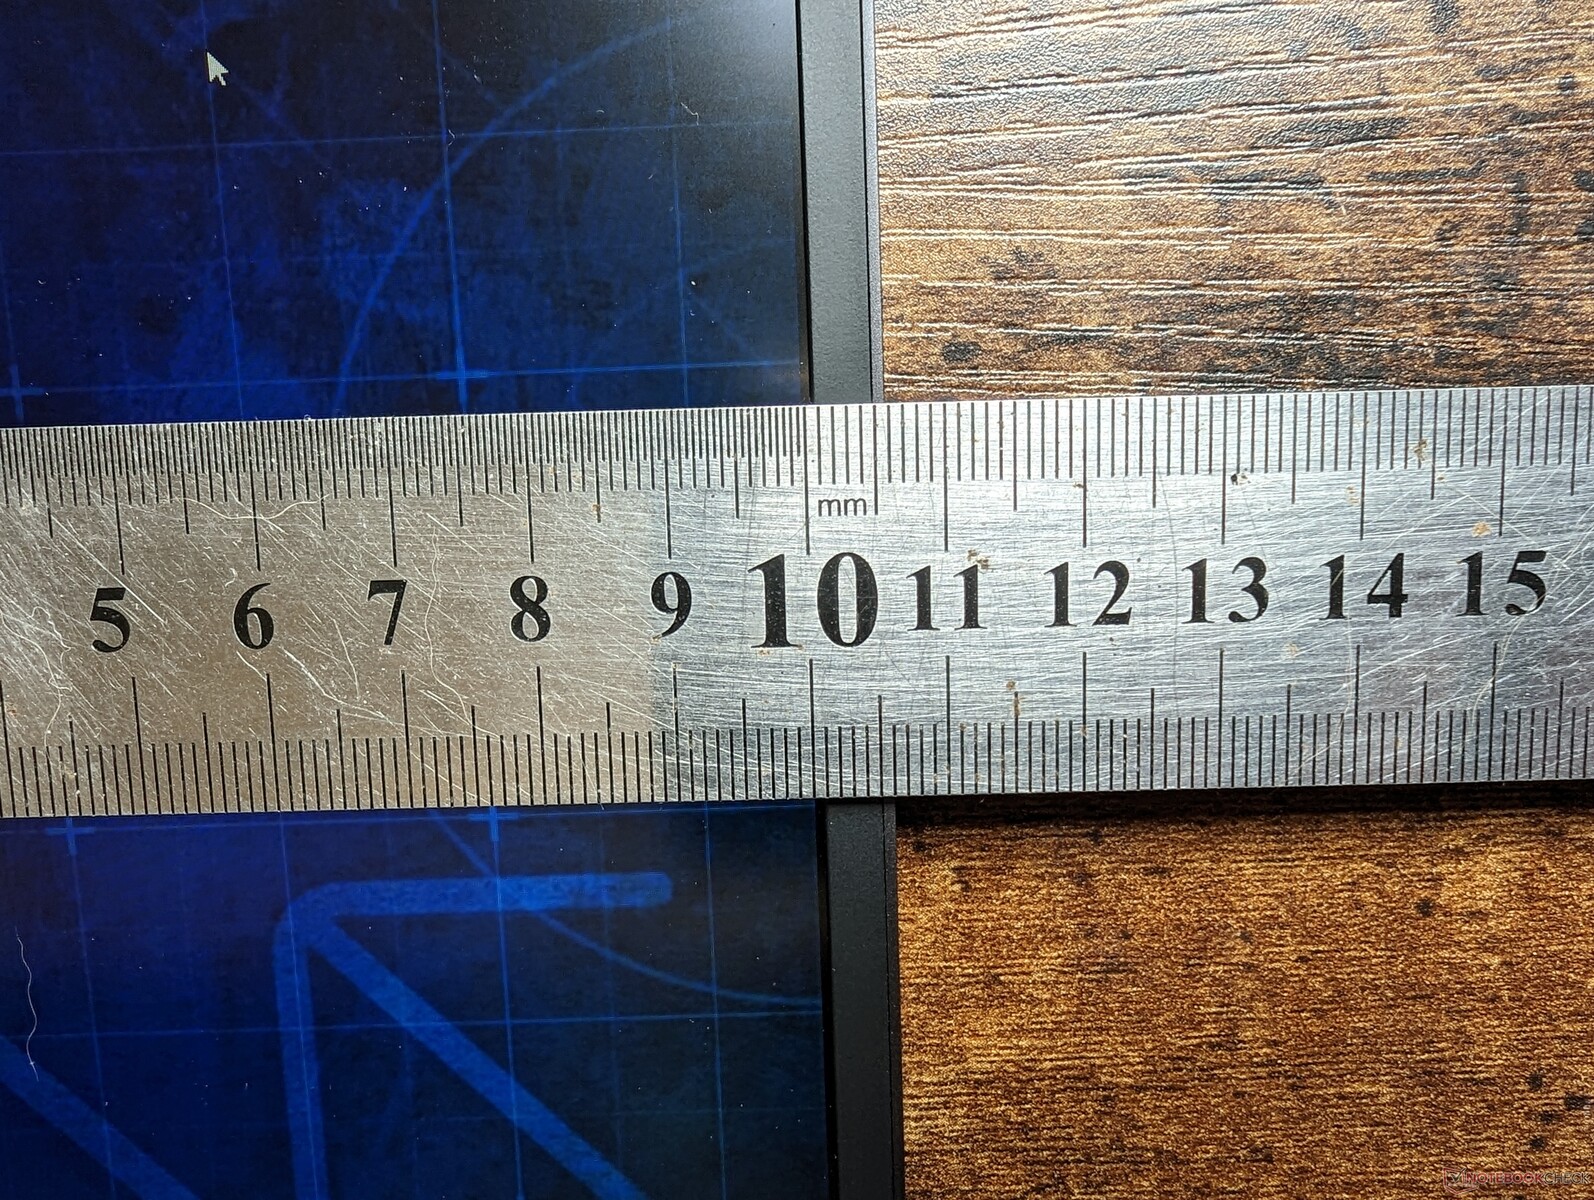
Er zijn twee chassisversies van de Schenker XMG Neo 16: een dunnere uitvoering voor alle RTX 4060- en 4070-configuraties en een dikkere uitvoering voor alle RTX 4080- en 4090-configuraties. De mobiele RTX 4080/4090 GPU's zijn krachtiger dan de mobiele RTX 4060/4070 en vragen dus om een groter chassisformaat. Belangrijke verschillen tussen de twee versies zijn:
- Dikte: 22 mm vs. 26,1 mm
- Gewicht: 2,2 kg vs. 2,5 kg
- Batterijcapaciteit: 62 Wh vs. 99 Wh
- Webcam: 1 MP vs. 2 MP
- AC-adapter: 280 W vs. 330 W
Beide uitvoeringen hebben verder dezelfde toetsenbordopties (membraan of Cherry MX mechanisch), clickpad, poorten, scherm en materialen van het chassis.
SD-kaartlezer
| SD Card Reader | |
| average JPG Copy Test (av. of 3 runs) | |
| Gigabyte AERO 16 OLED BSF | |
| Razer Blade 16 Early 2023 (AV PRO microSD 128 GB V60) | |
| Schenker XMG Neo 16 E23 (AV PRO microSD 128 GB V60) | |
| Uniwill GM6PX7X RTX 4070 (AV PRO microSD 128 GB V60) | |
| maximum AS SSD Seq Read Test (1GB) | |
| Razer Blade 16 Early 2023 (AV PRO microSD 128 GB V60) | |
| Gigabyte AERO 16 OLED BSF | |
| Uniwill GM6PX7X RTX 4070 (AV PRO microSD 128 GB V60) | |
| Schenker XMG Neo 16 E23 (AV PRO microSD 128 GB V60) | |
Communicatie
| Networking | |
| iperf3 transmit AXE11000 | |
| Schenker XMG Neo 16 E23 | |
| Lenovo Legion Pro 7 16IRX8H | |
| Asus ROG Strix G16 G614JZ | |
| Razer Blade 16 Early 2023 | |
| Uniwill GM6PX7X RTX 4070 | |
| iperf3 receive AXE11000 | |
| Schenker XMG Neo 16 E23 | |
| Lenovo Legion Pro 7 16IRX8H | |
| Asus ROG Strix G16 G614JZ | |
| Razer Blade 16 Early 2023 | |
| Uniwill GM6PX7X RTX 4070 | |
| iperf3 transmit AXE11000 6GHz | |
| Gigabyte AERO 16 OLED BSF | |
| Razer Blade 16 Early 2023 | |
| iperf3 receive AXE11000 6GHz | |
| Gigabyte AERO 16 OLED BSF | |
| Razer Blade 16 Early 2023 | |
Webcam


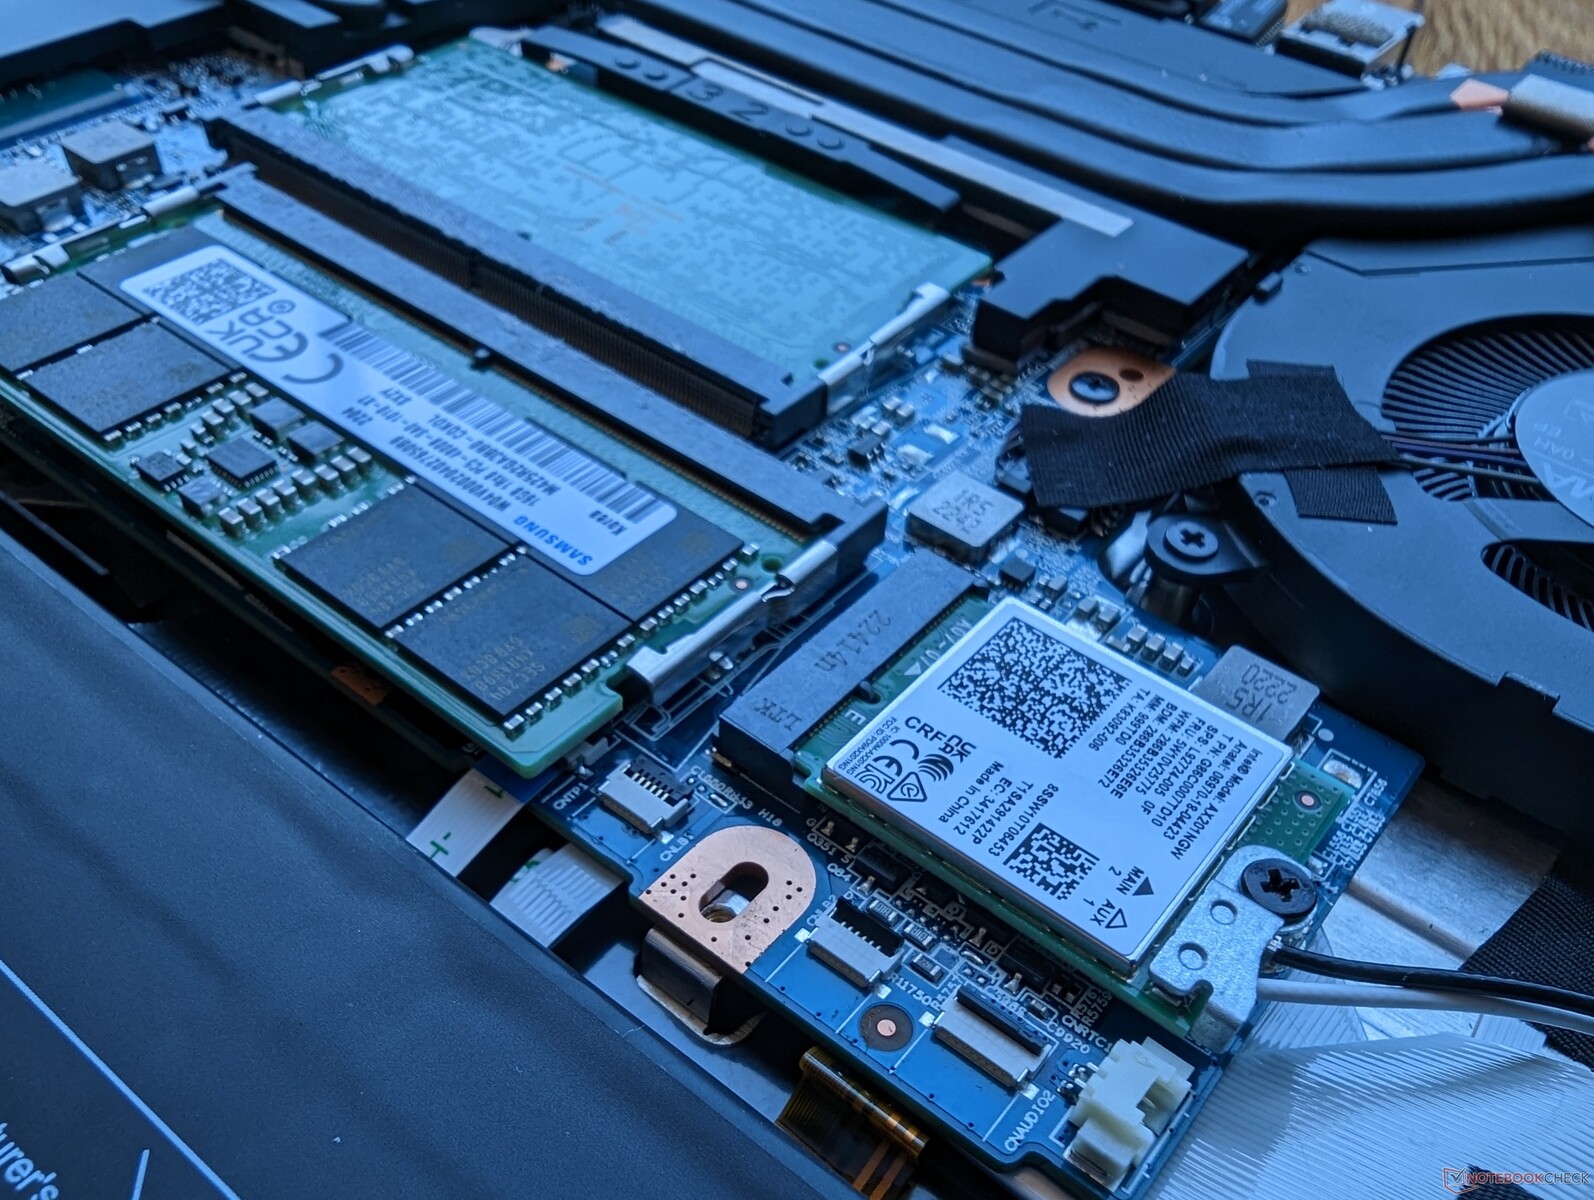
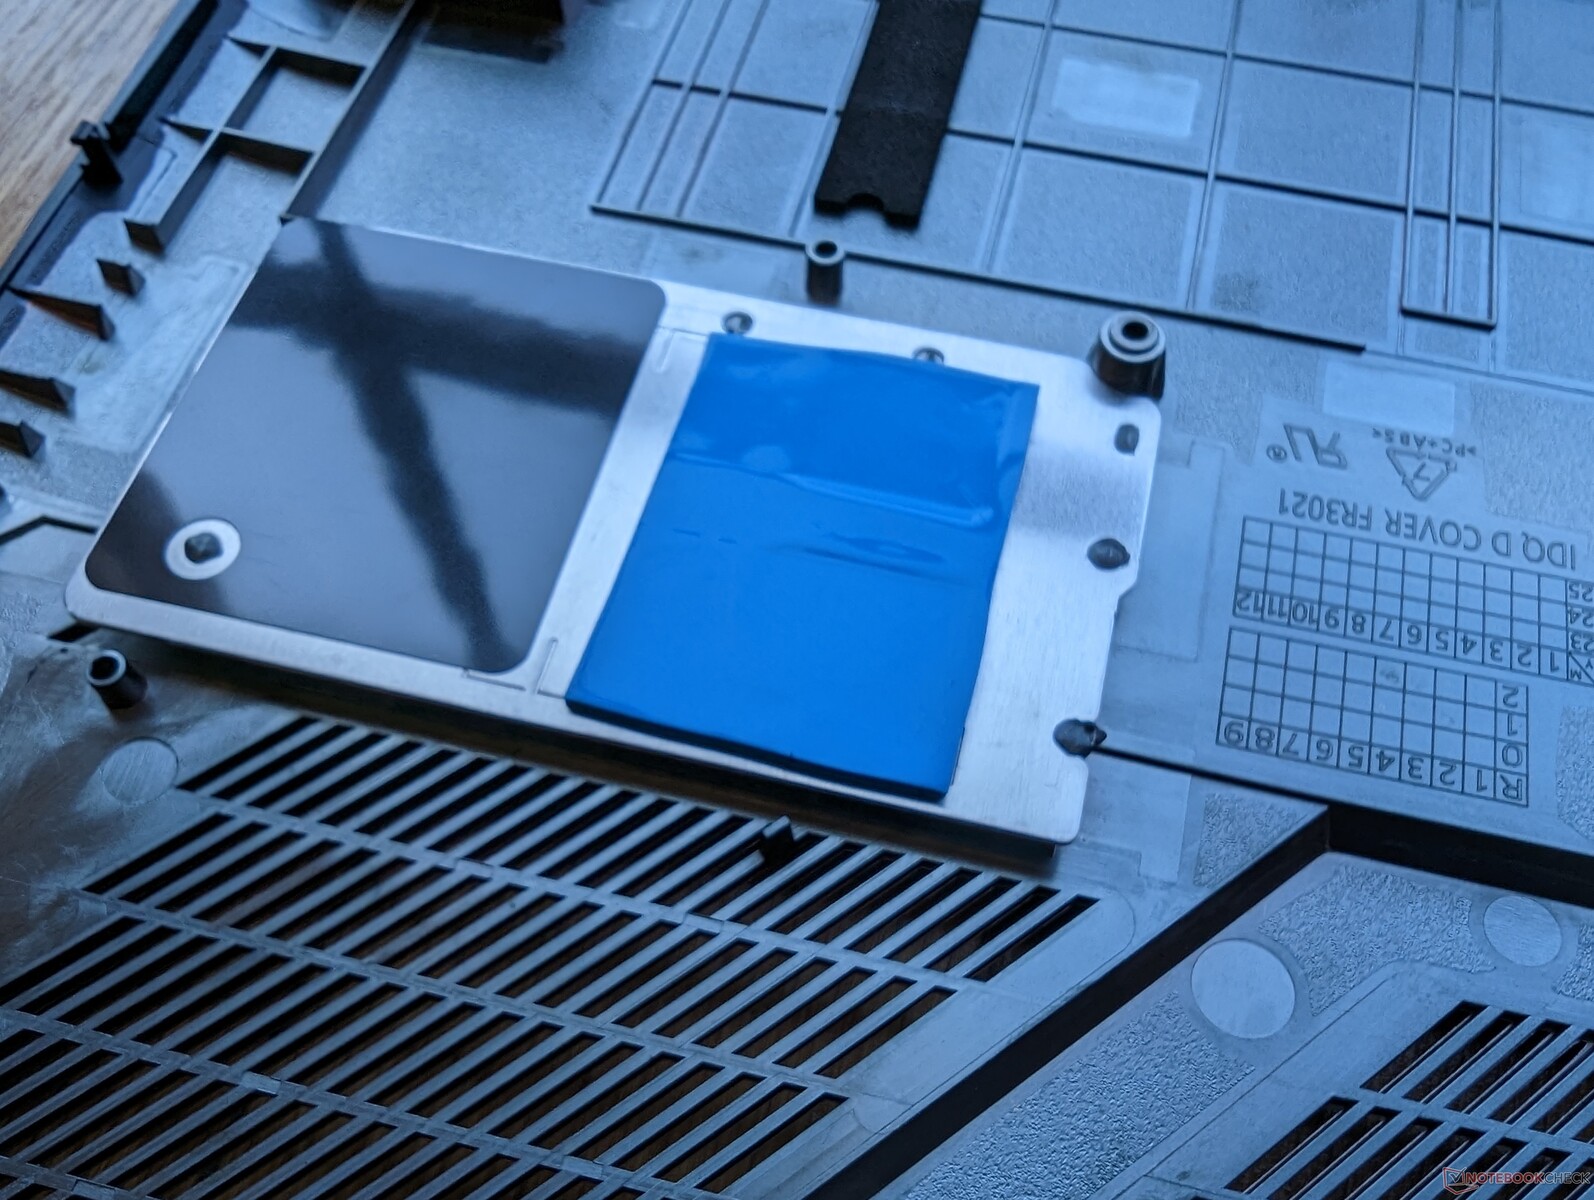
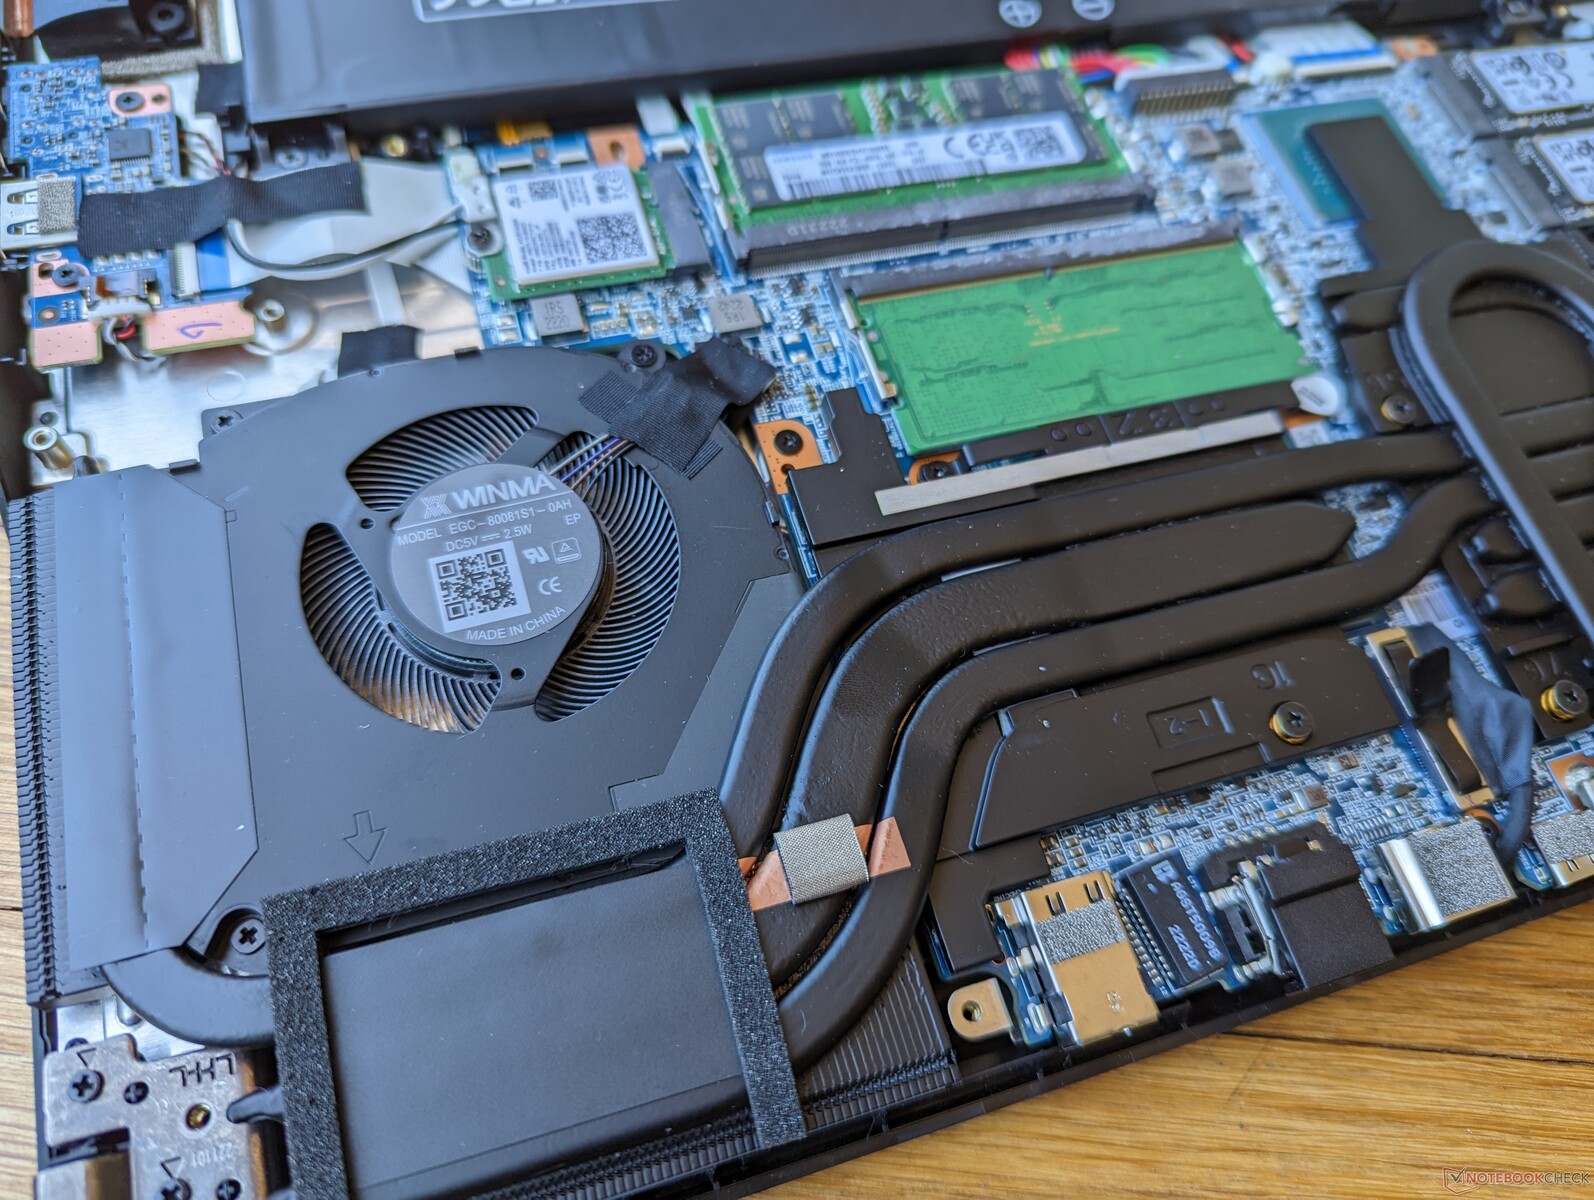
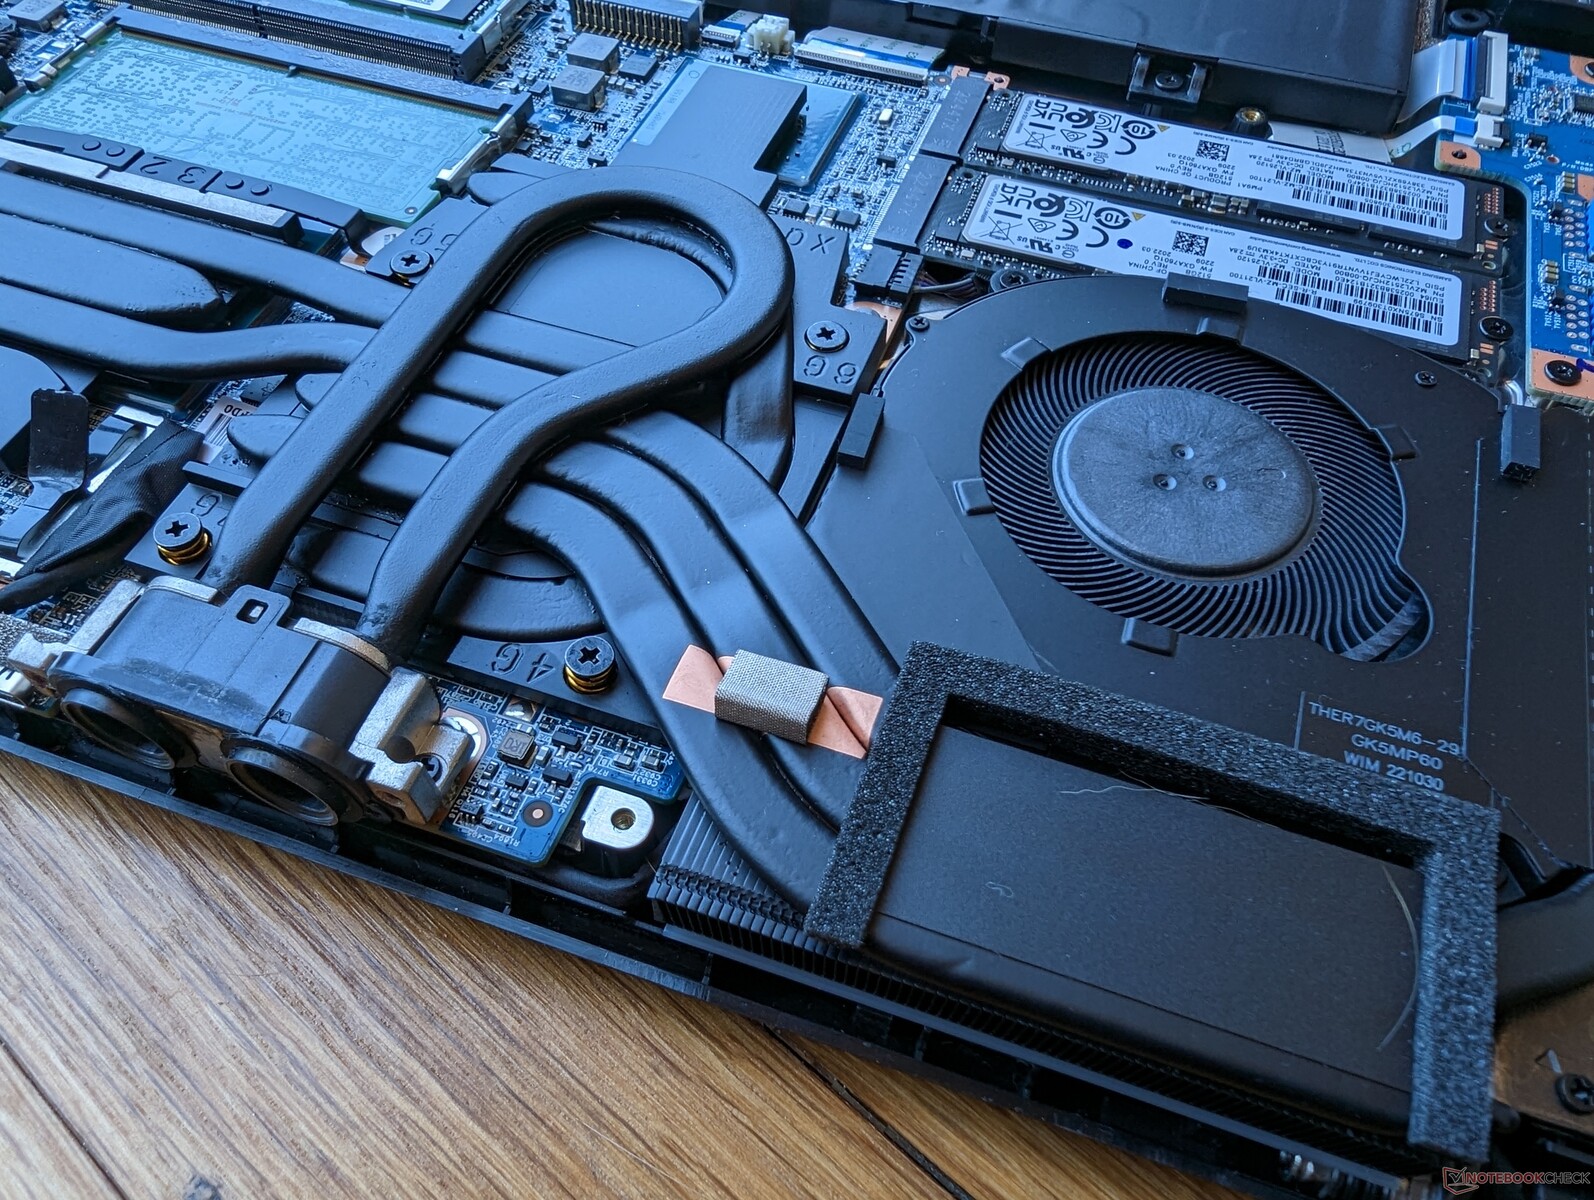
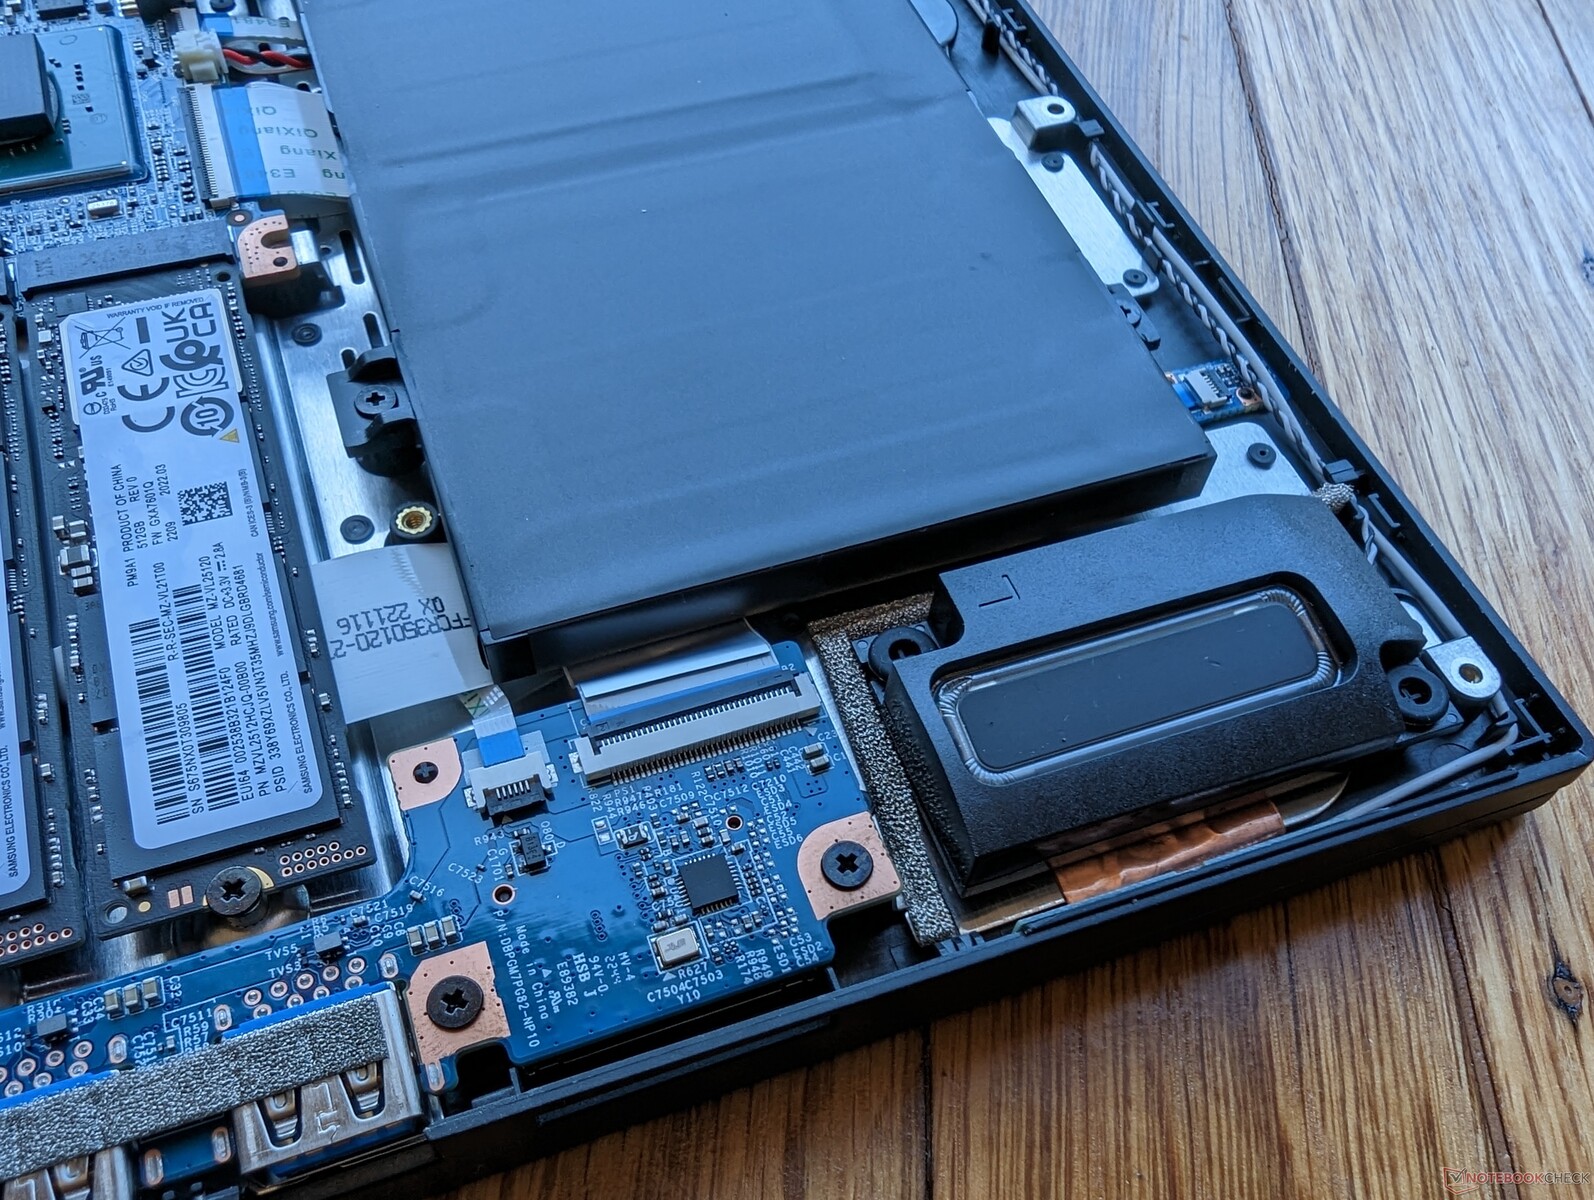
Onderhoud
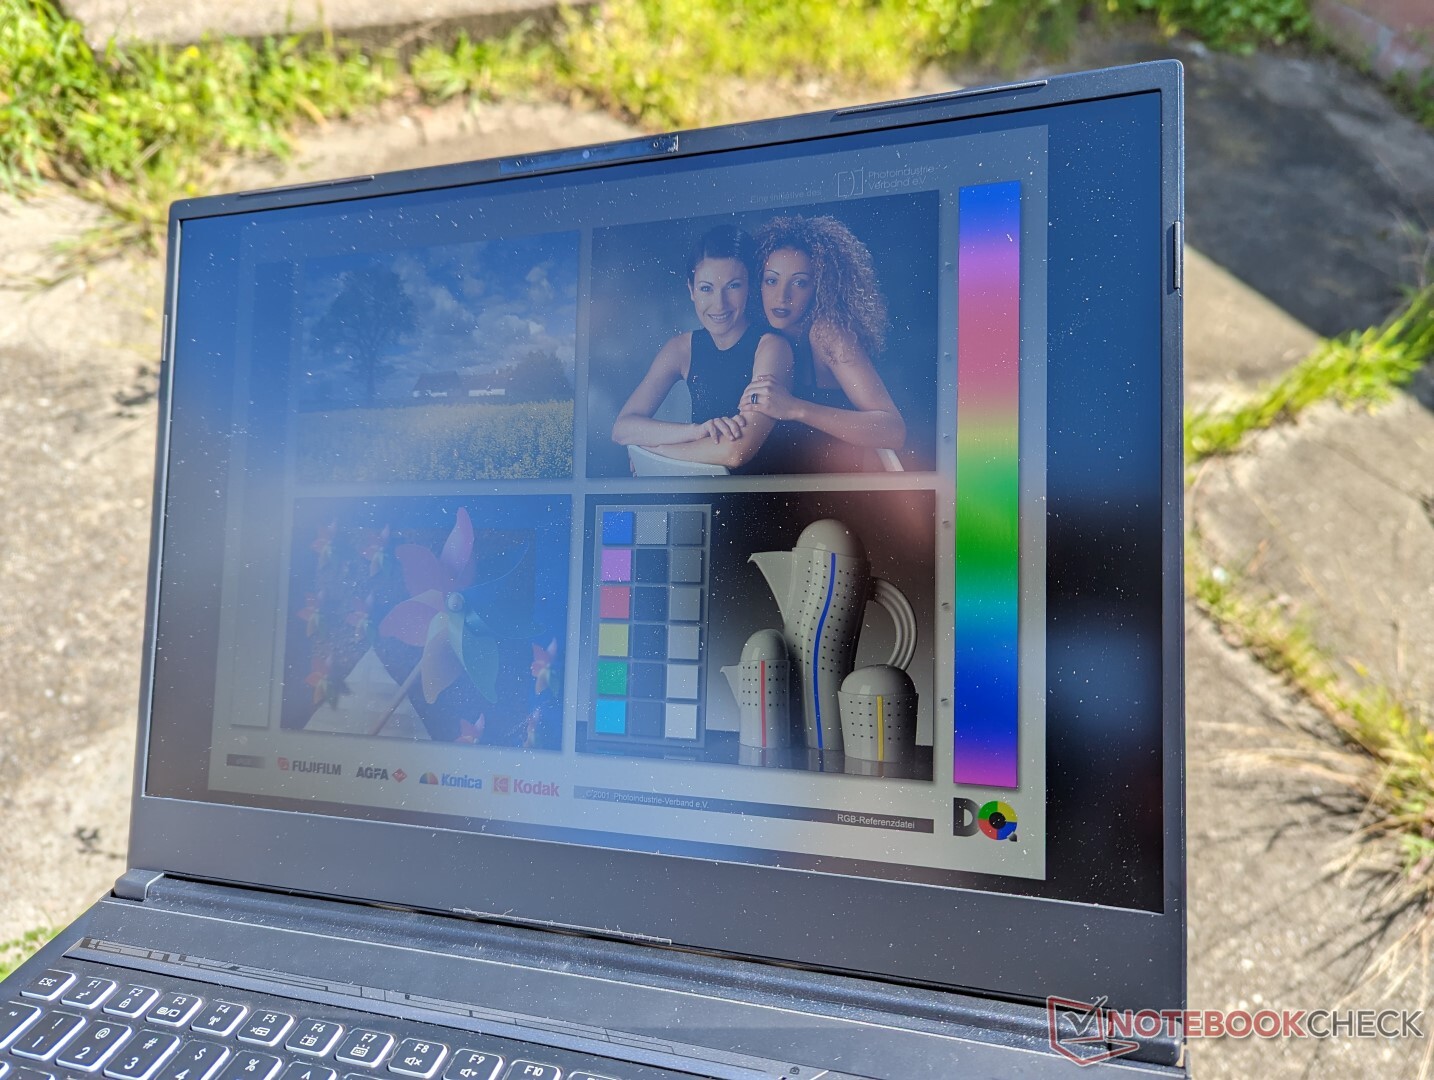
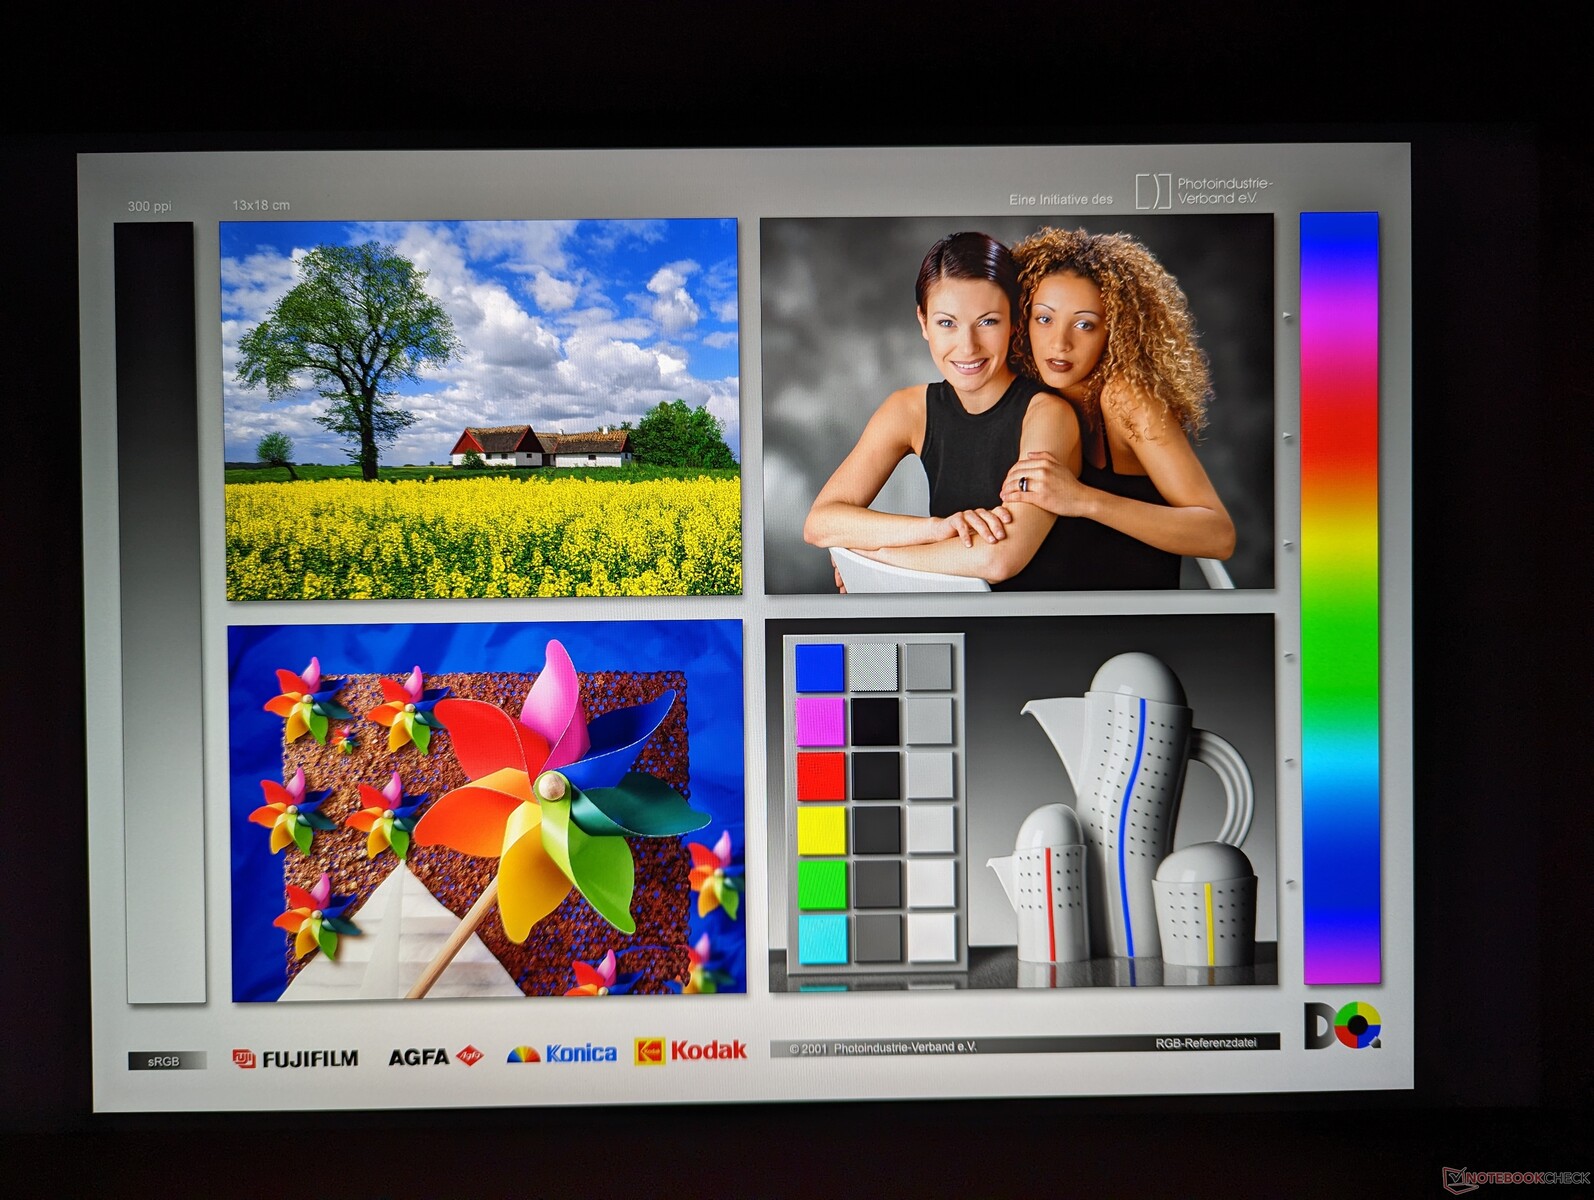
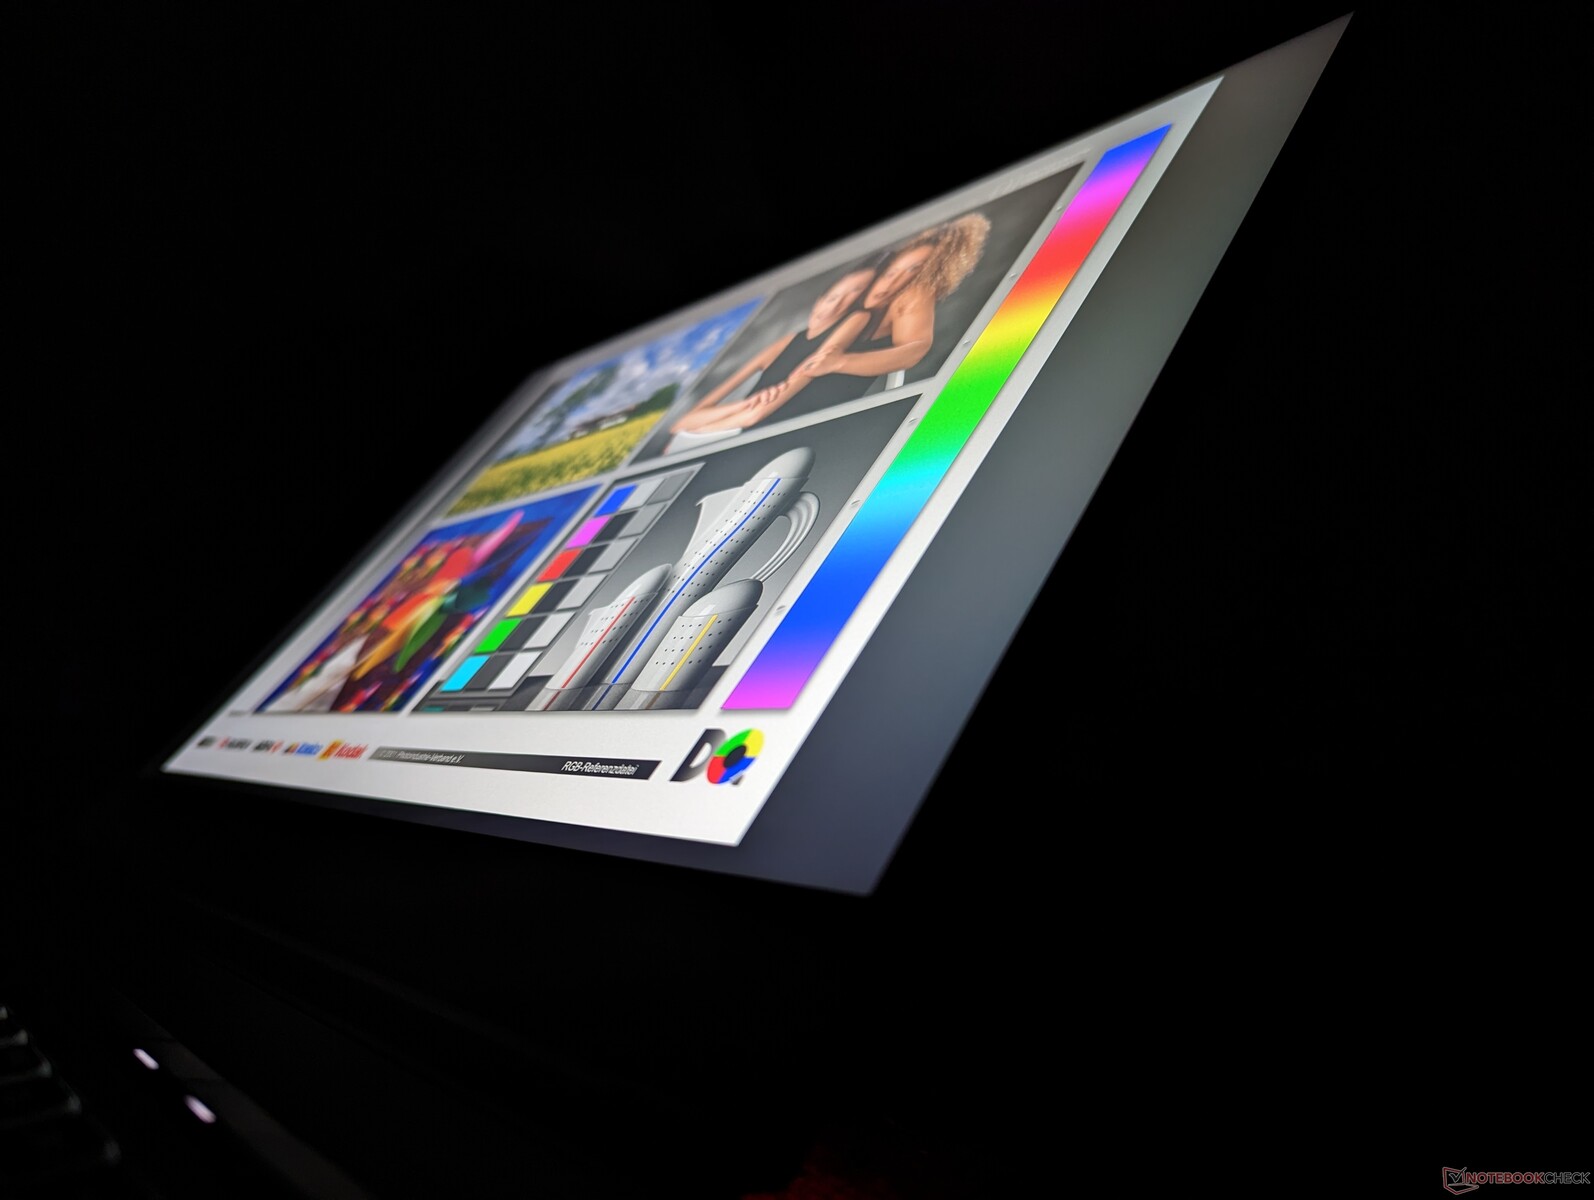
Display
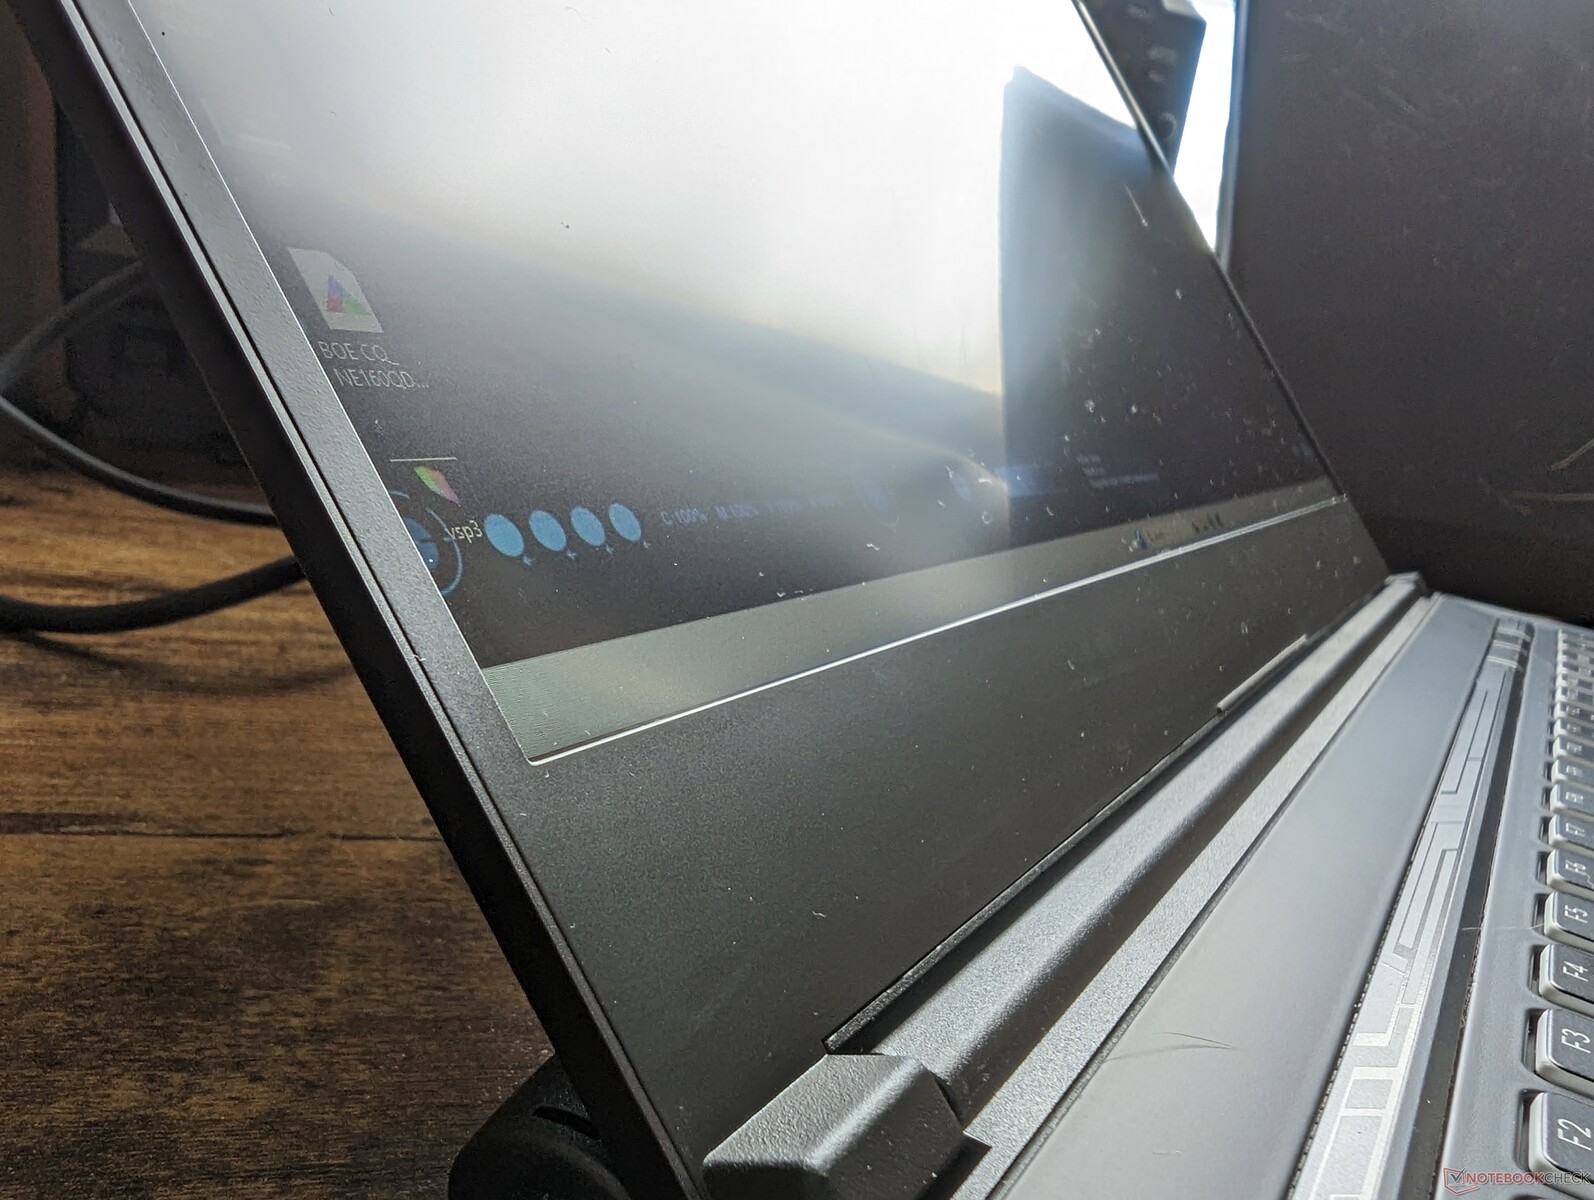
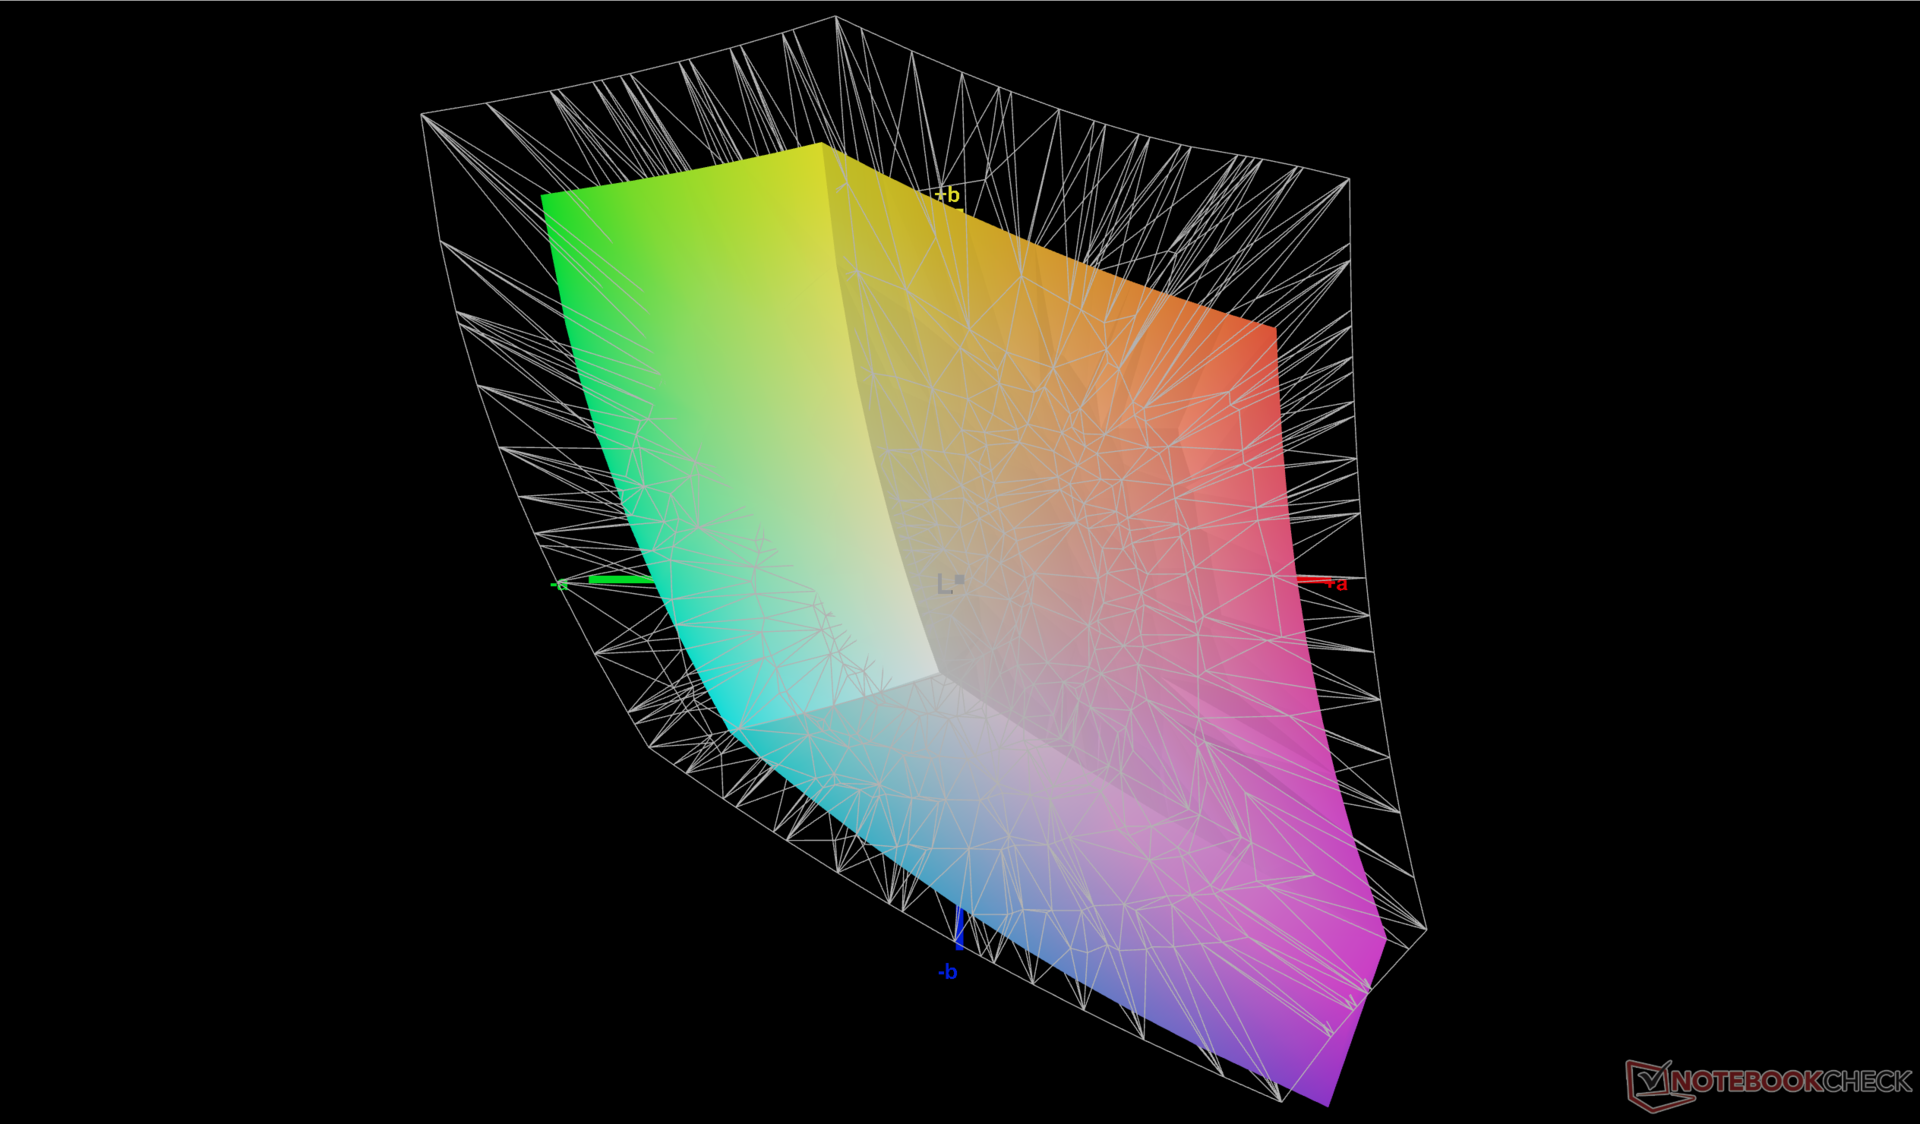
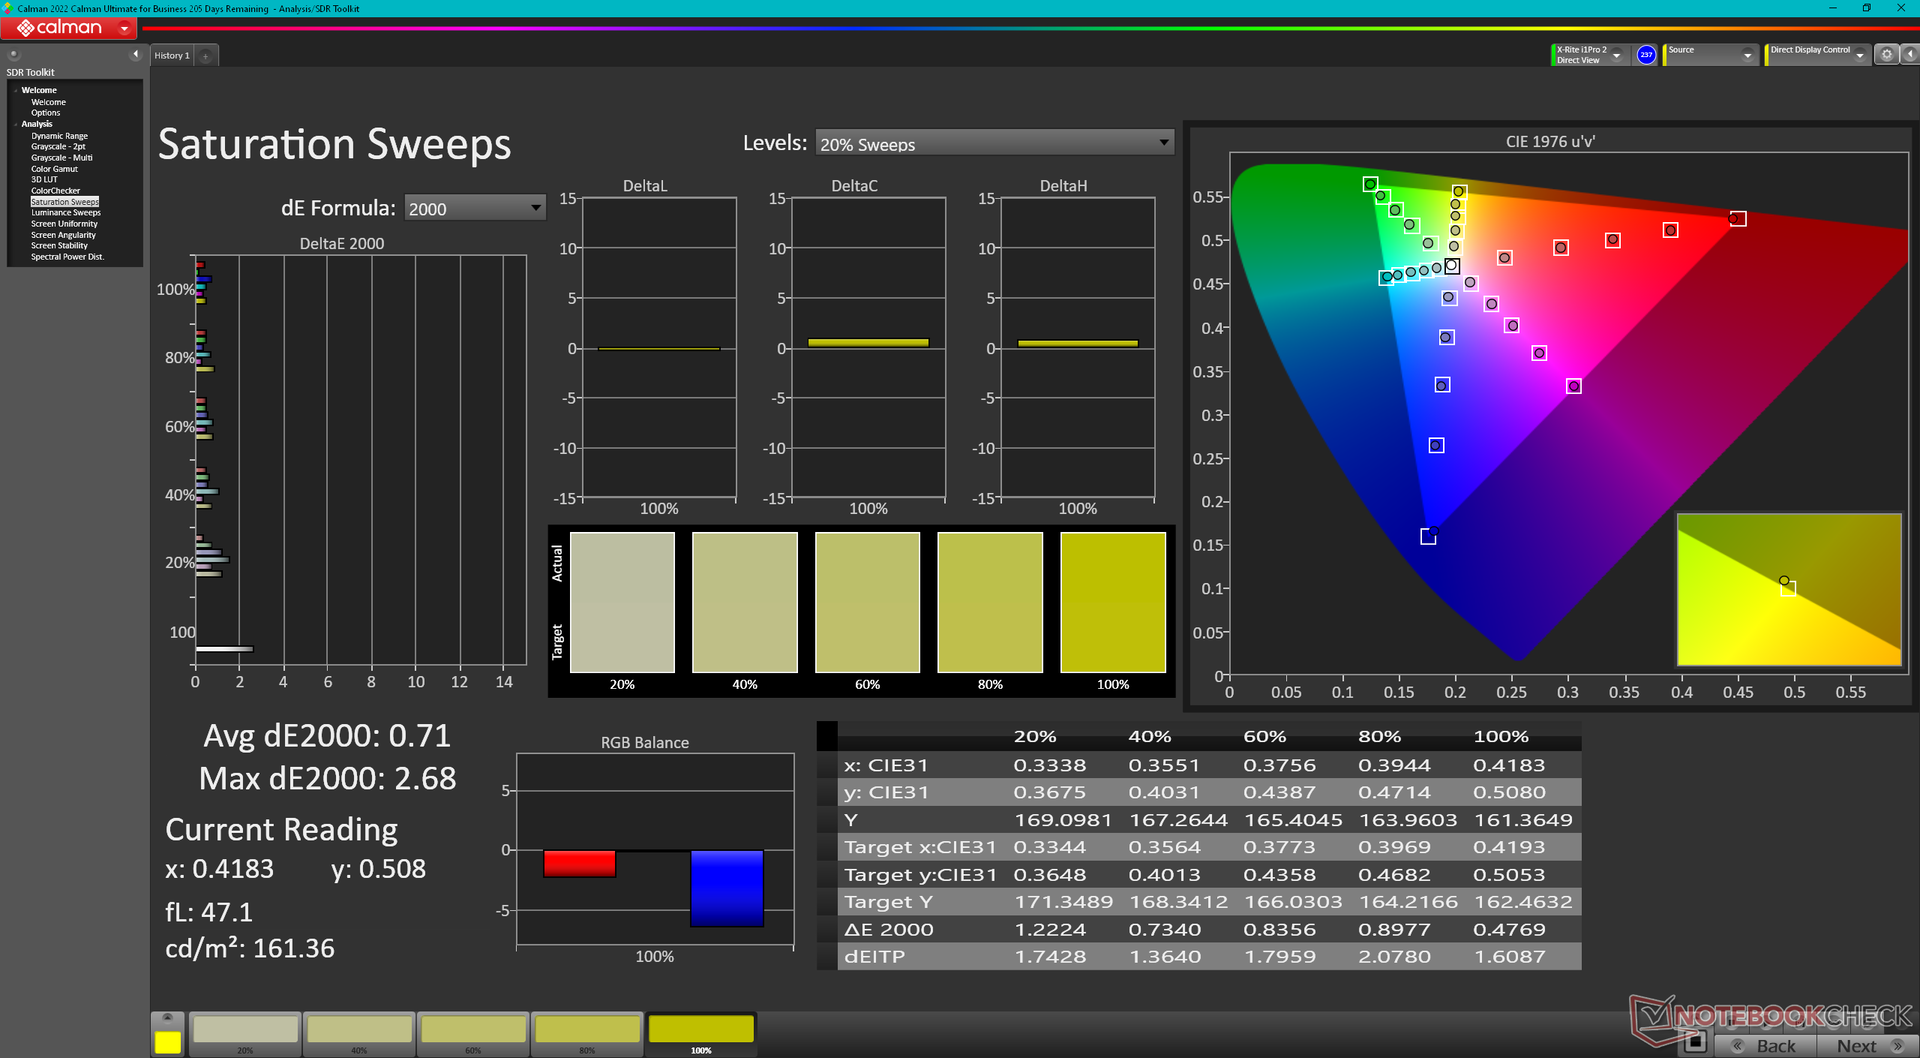
Er zijn geen tweede schermopties voor dit specifieke chassisontwerp en dus gebruikt onze Uniwill hetzelfde BOE NE160QDM-NZ1 IPS-paneel als dat van de RTX 4090-aangedreven Schenker Neo 16. Het paneel valt op door zijn snelle 240 Hz verversingssnelheid en >95 procent sRGB dekking. Concurrerende laptops zoals deAsus ROG Strix G16 ofGigabyte AERO 16 OLED bieden nog diepere kleuren en snellere reactietijden die hardcore gamers of grafische bewerkers kunnen waarderen.

| |||||||||||||||||||||||||
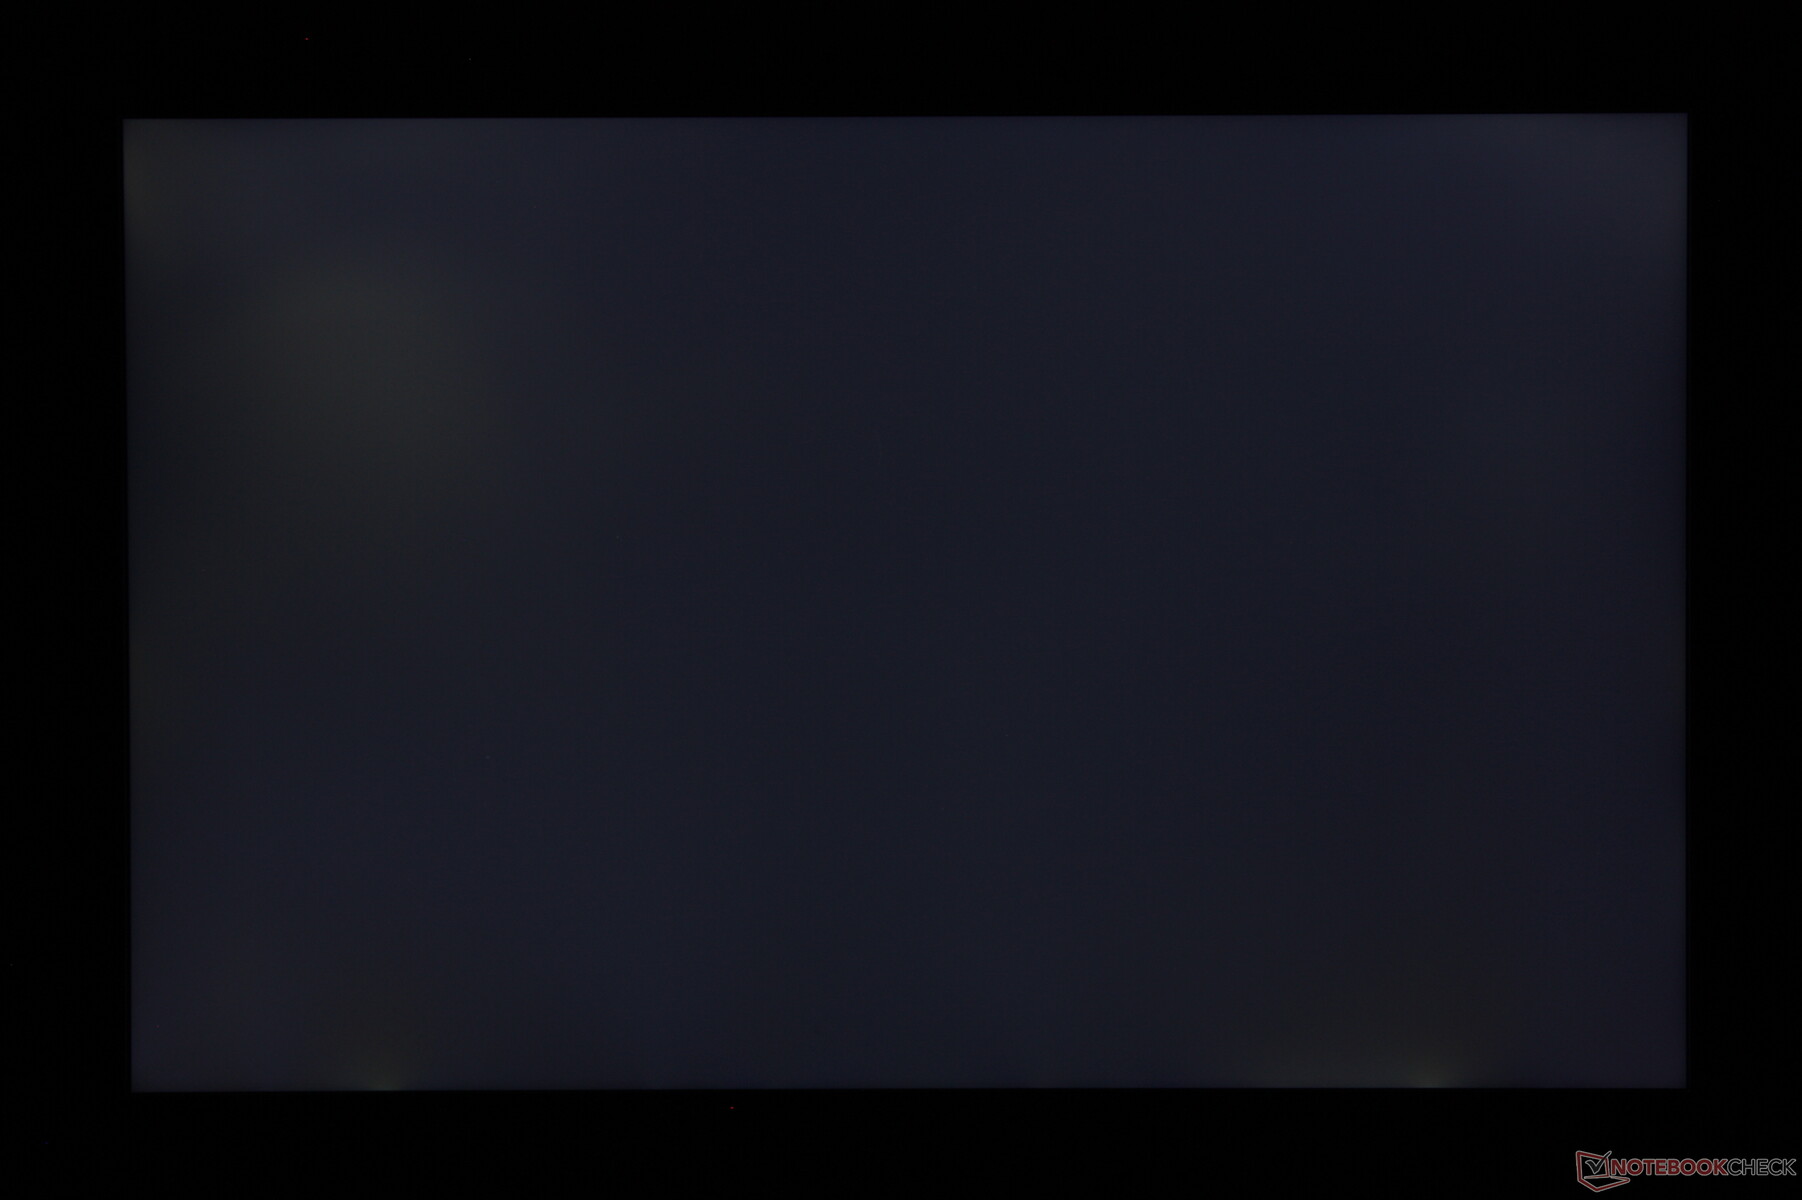
Helderheidsverdeling: 89 %
Helderheid in Batterij-modus: 338.6 cd/m²
Contrast: 1058:1 (Zwart: 0.32 cd/m²)
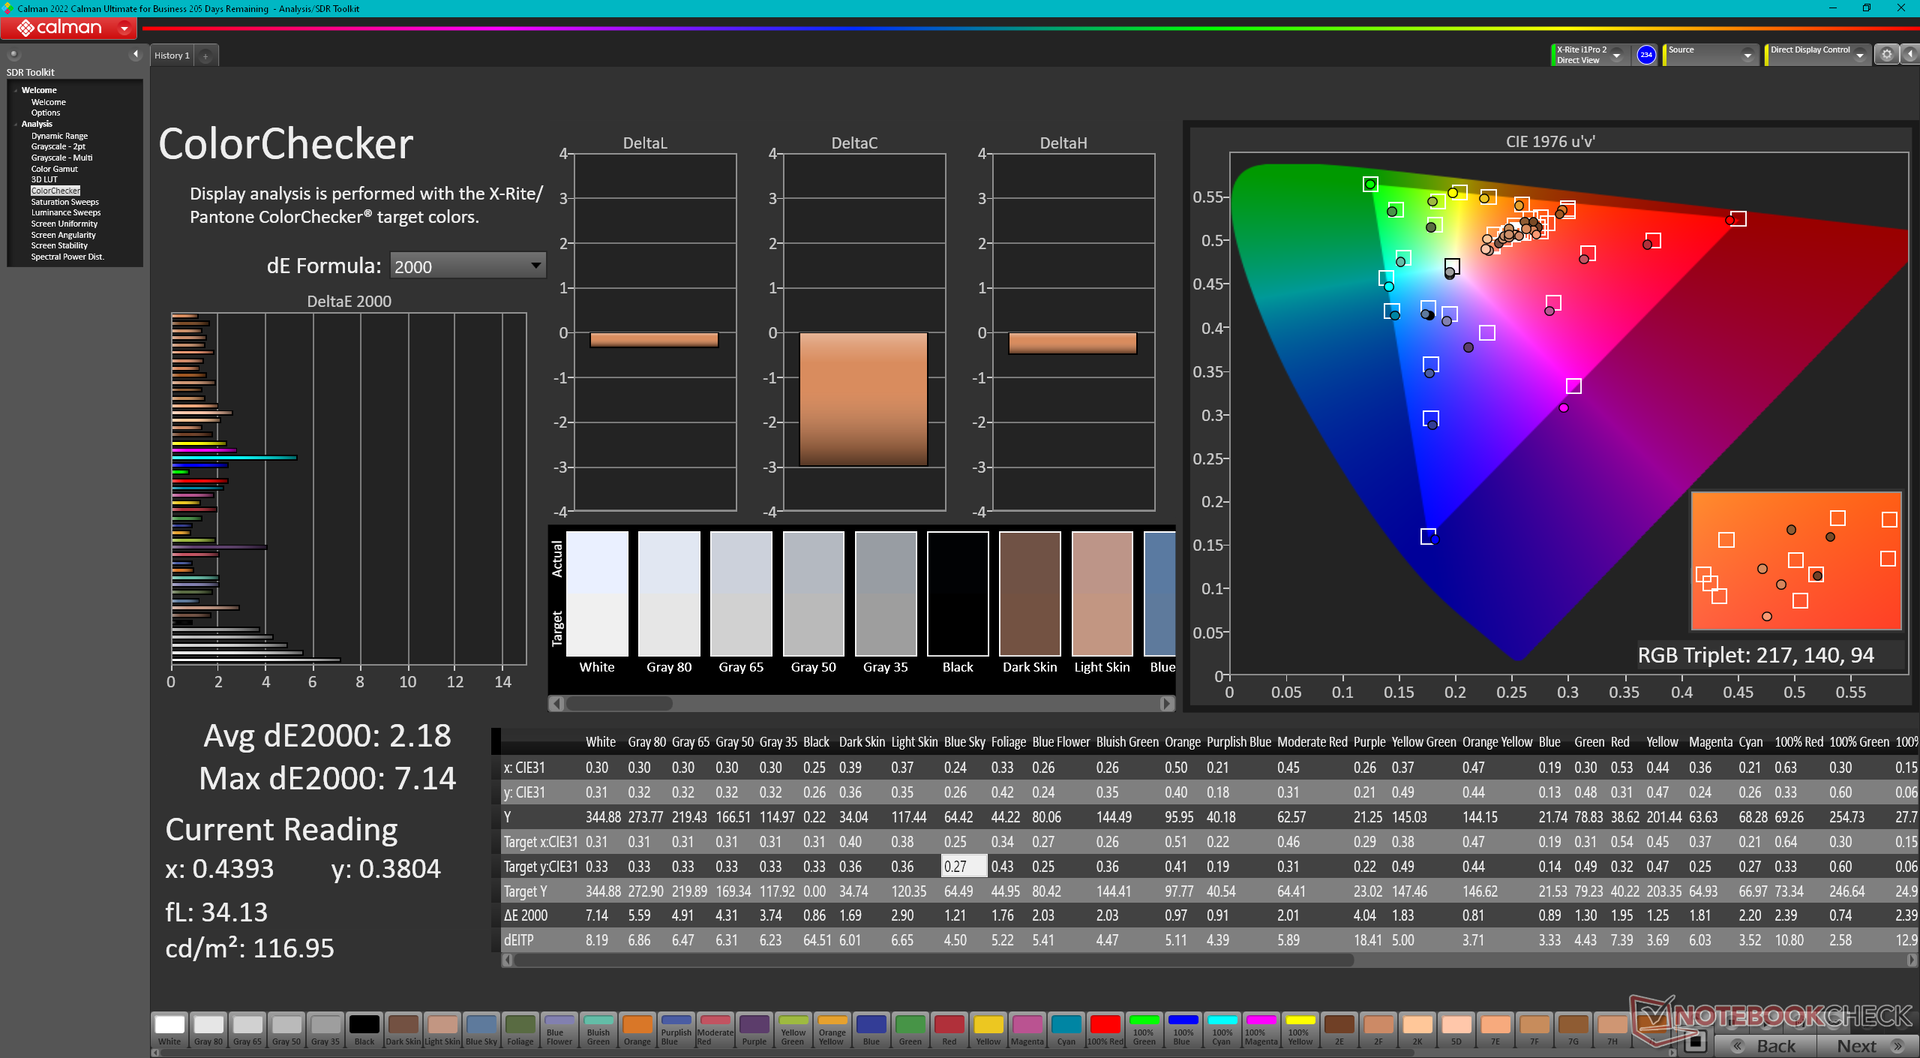
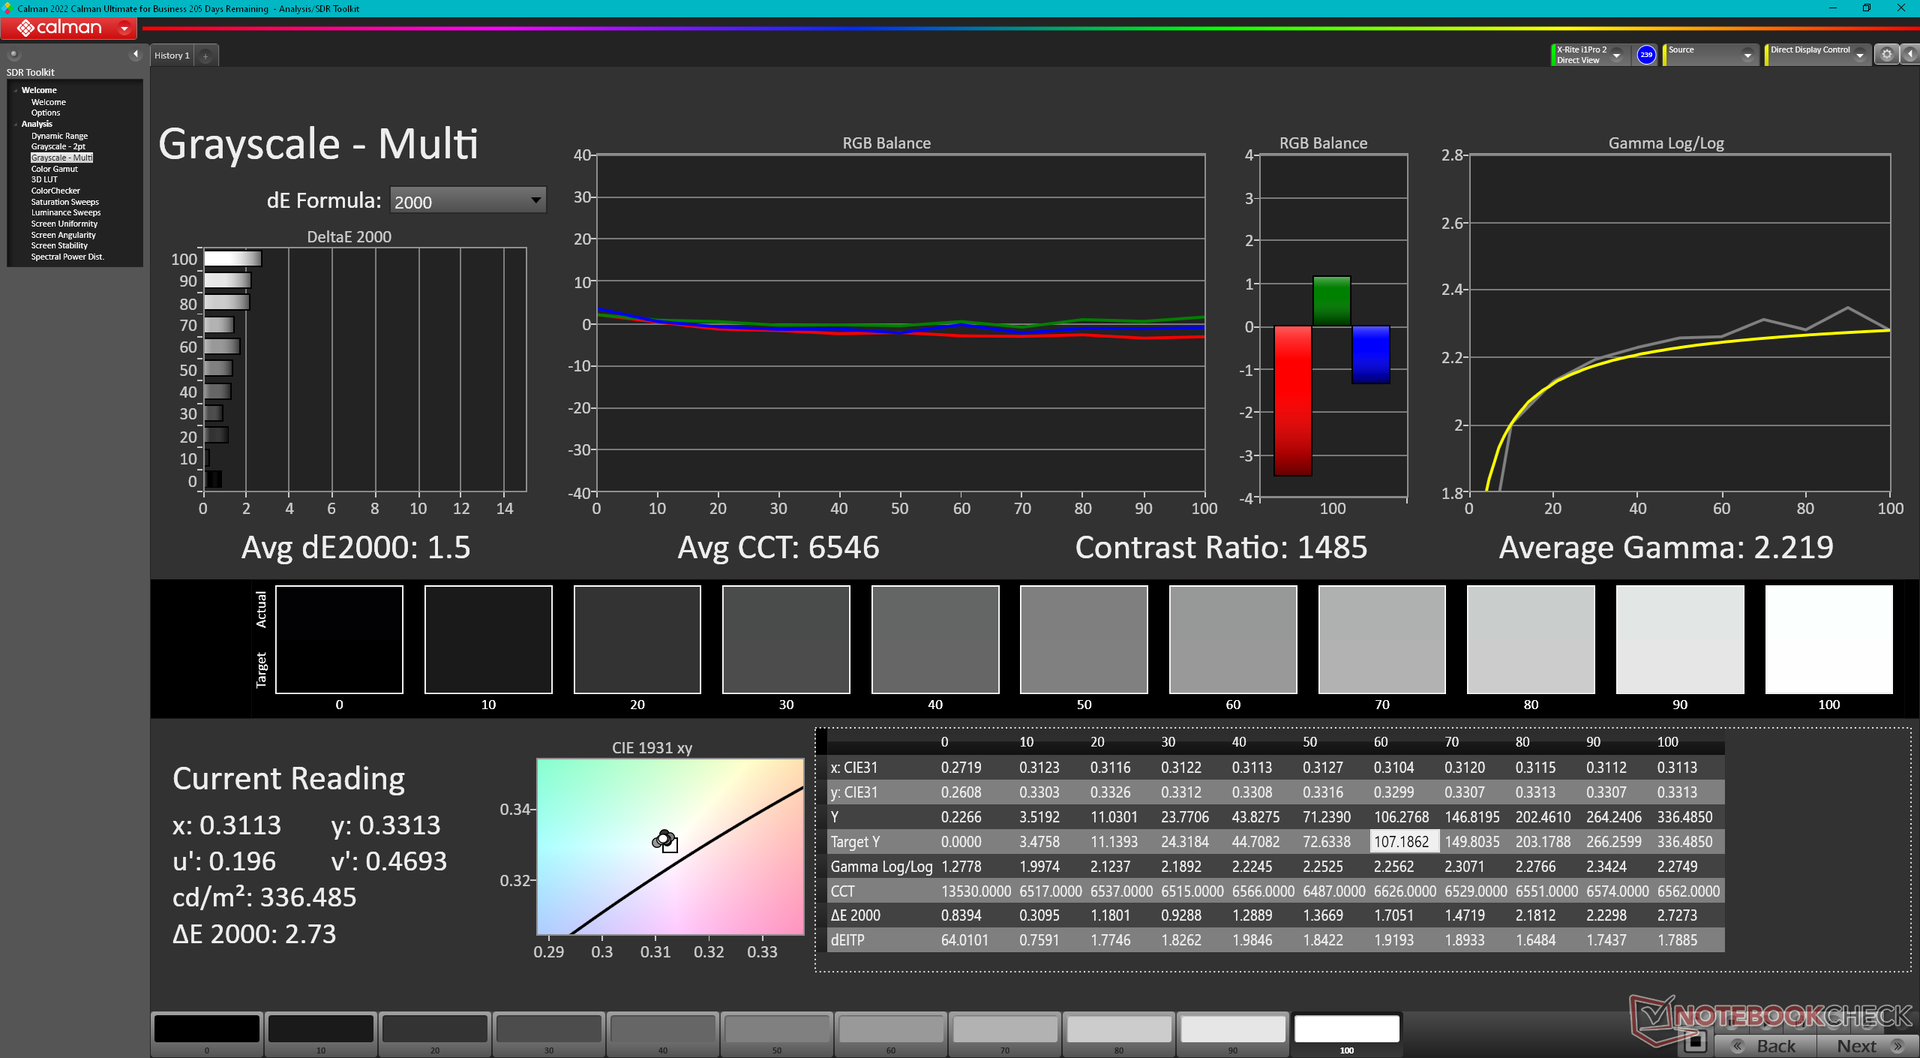
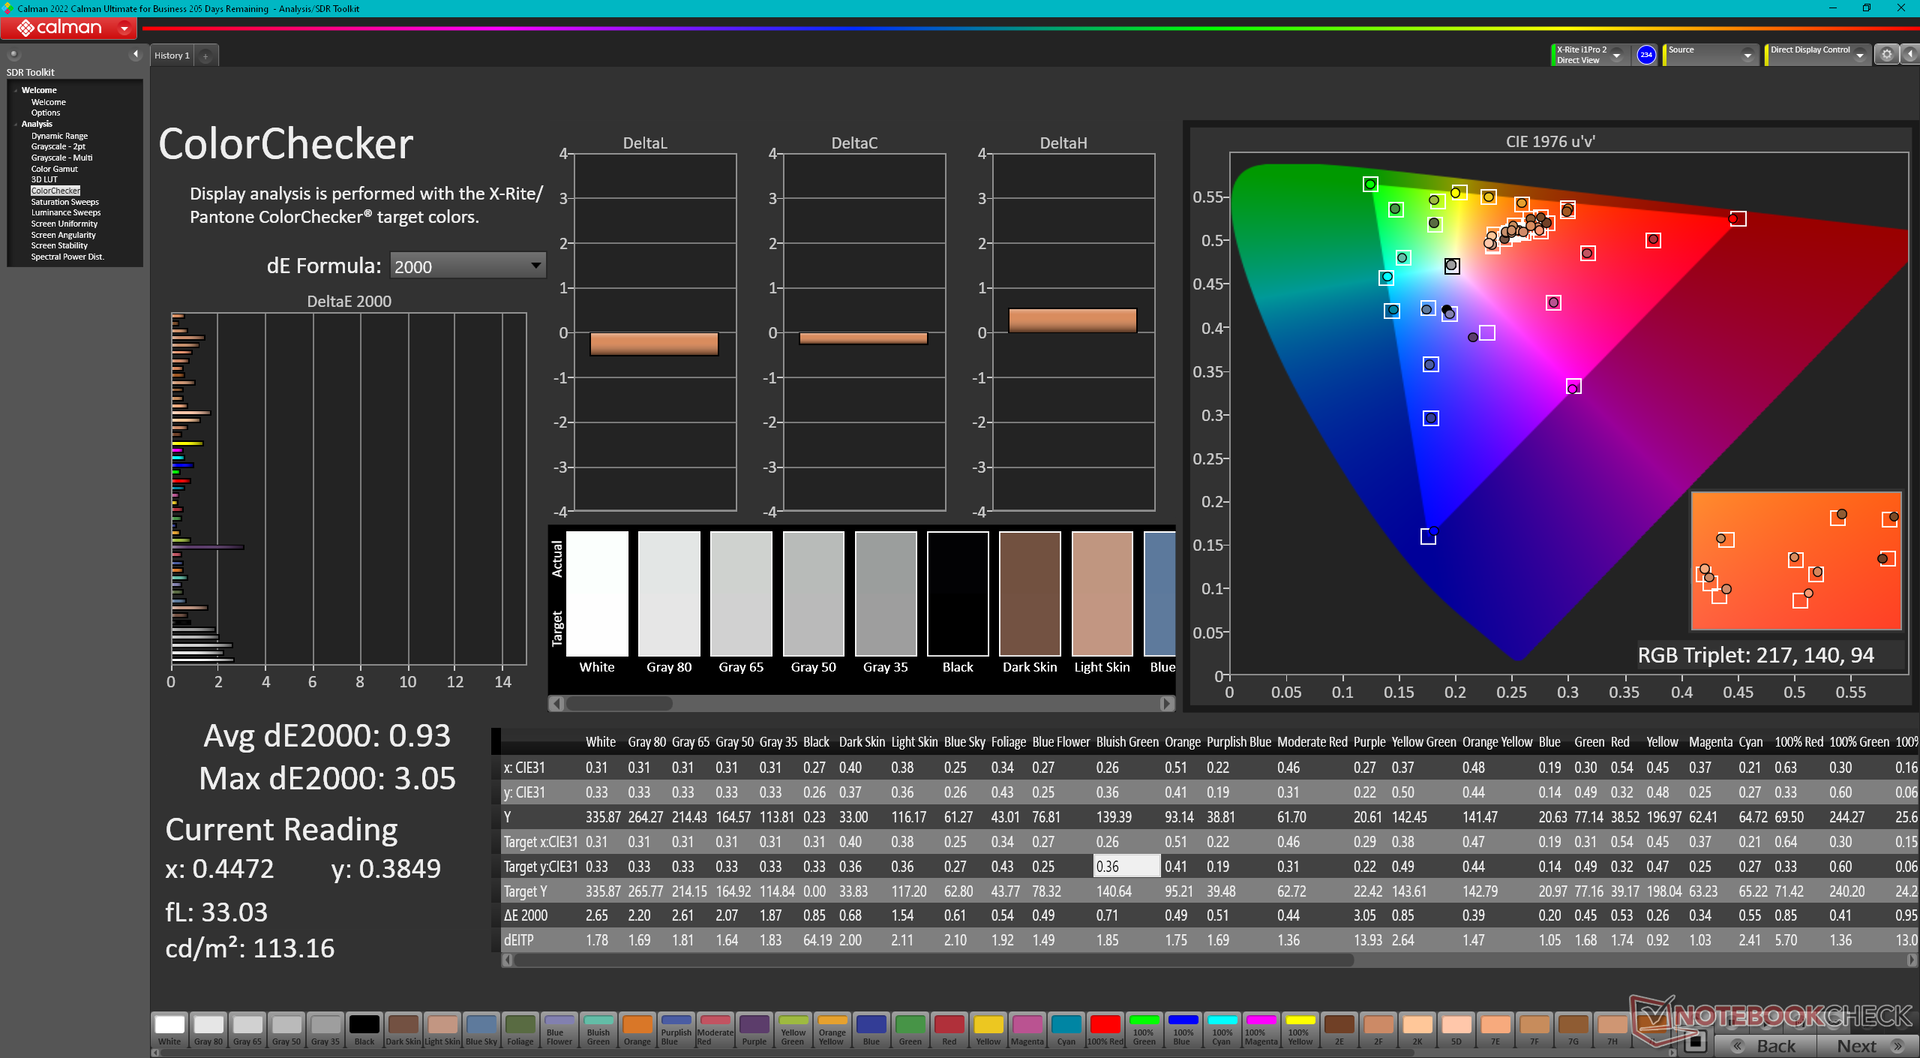
ΔE ColorChecker Calman: 2.18 | ∀{0.5-29.43 Ø4.71}
calibrated: 0.93
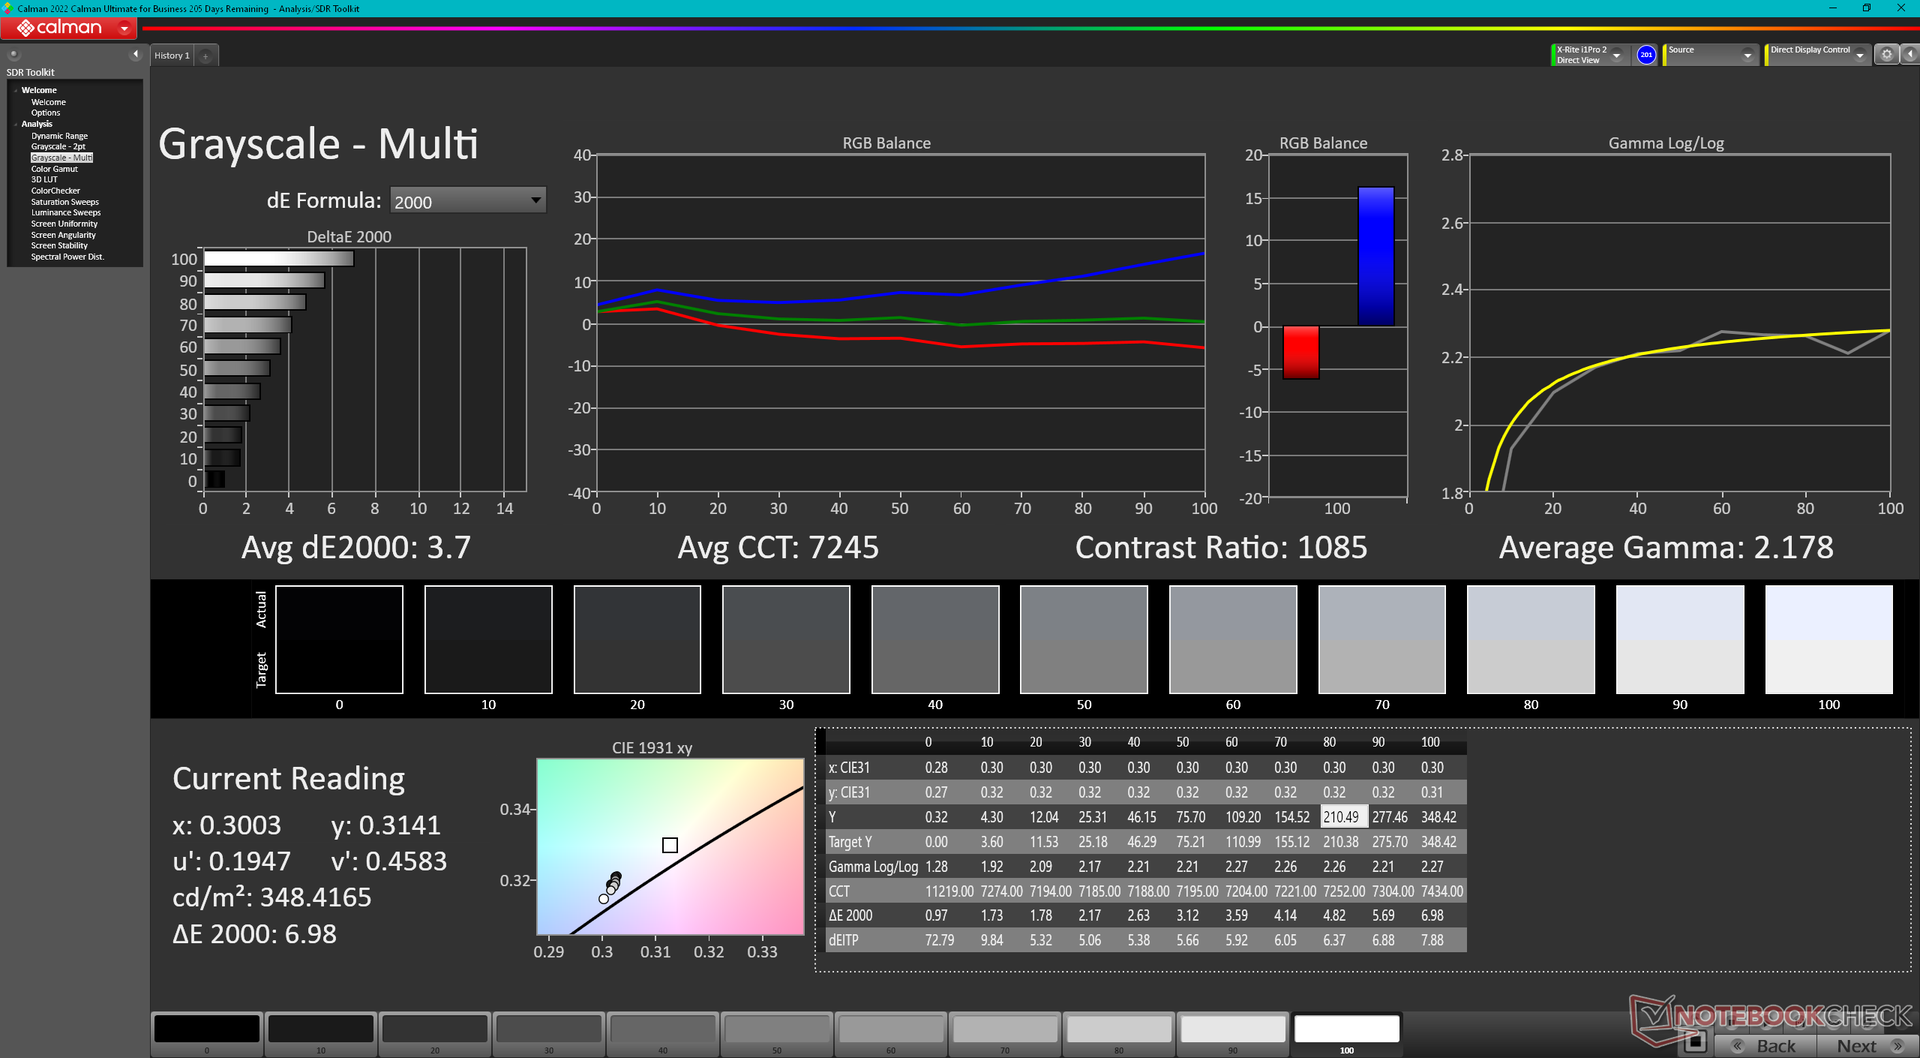
ΔE Greyscale Calman: 3.7 | ∀{0.09-98 Ø4.96}
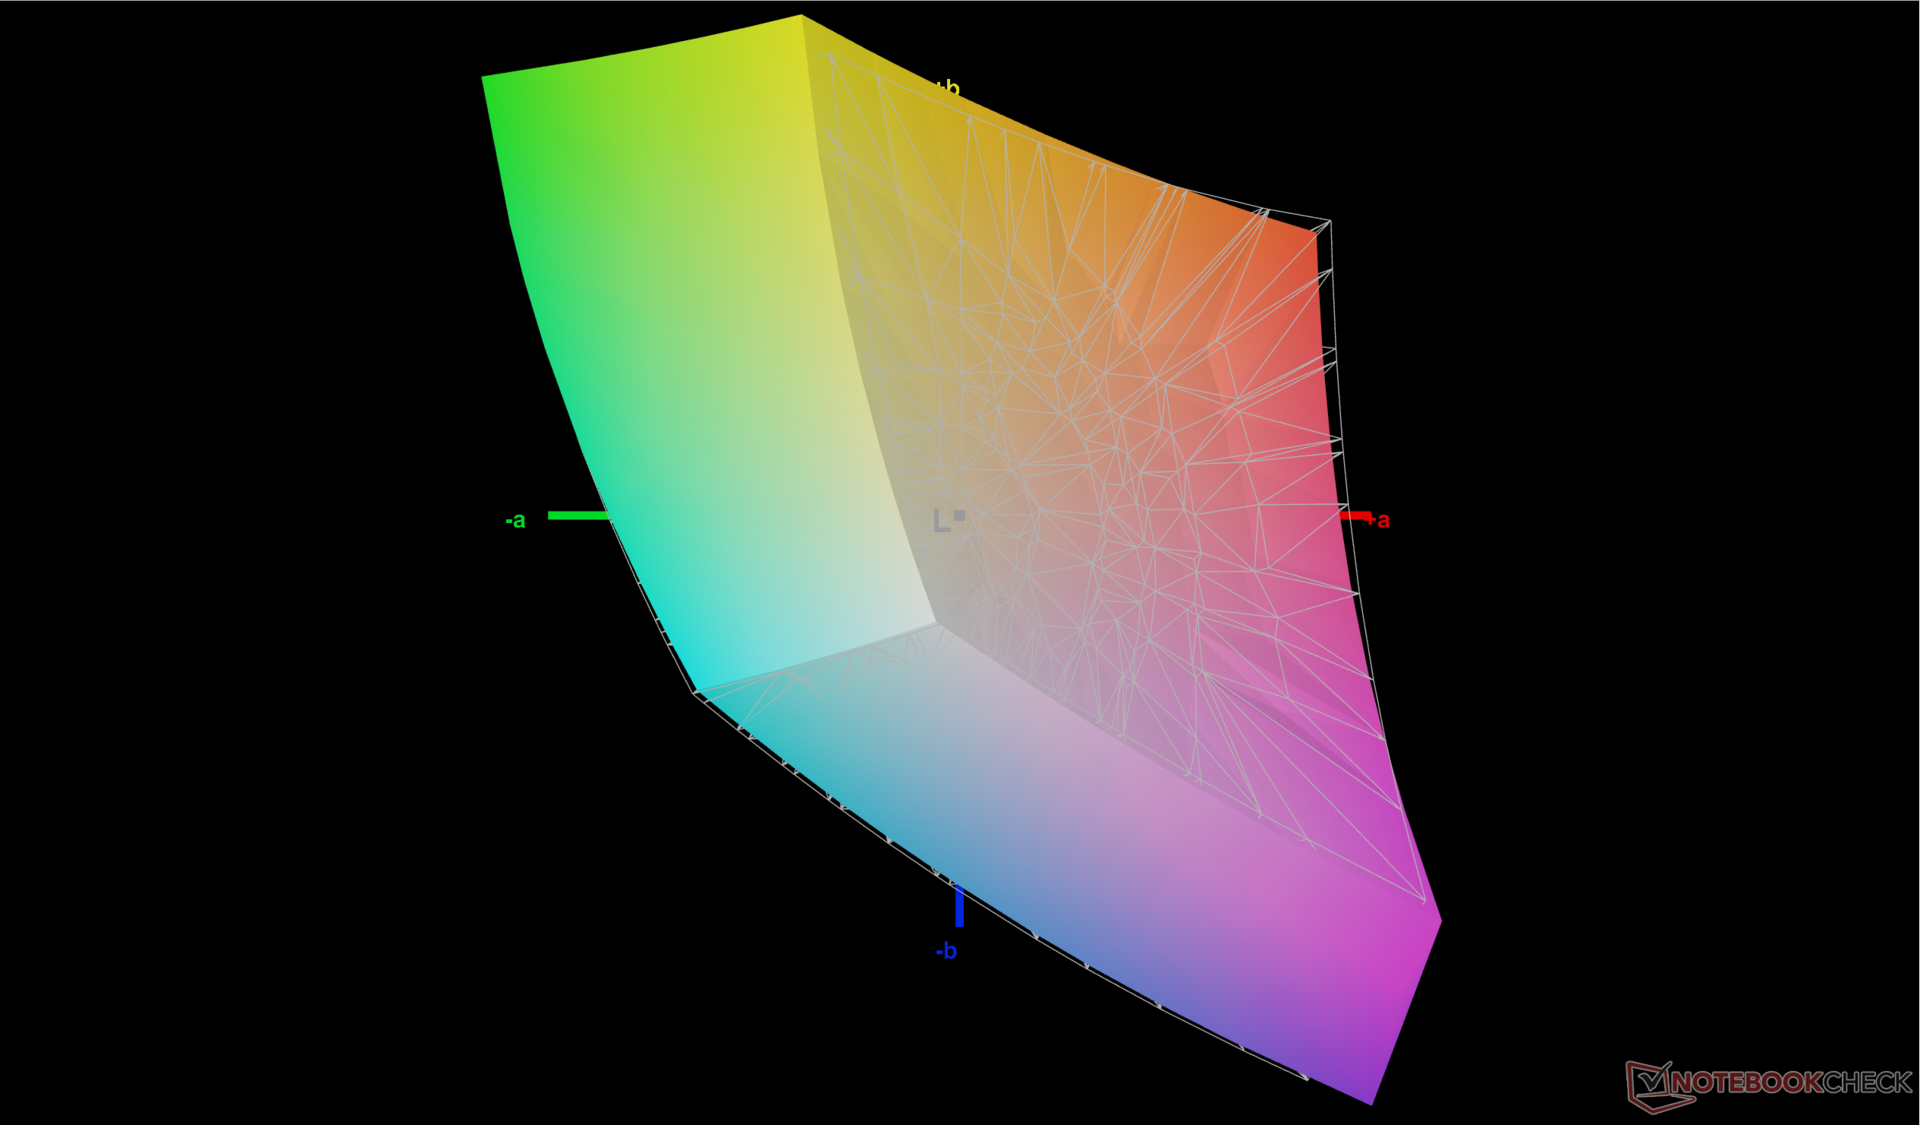
68.6% AdobeRGB 1998 (Argyll 3D)
96.4% sRGB (Argyll 3D)
67.5% Display P3 (Argyll 3D)
Gamma: 2.18
CCT: 7245 K
| Uniwill GM6PX7X RTX 4070 BOE CQ NE160QDM-NZ1, IPS, 2560x1600, 16" | Schenker XMG Neo 16 E23 BOE0AF0 NE160QDM-NZ1, IPS, 2560x1600, 16" | Asus ROG Strix G16 G614JZ TL160ADMP03-0, IPS, 2560x1600, 16" | Lenovo Legion Pro 7 16IRX8H MNG007DA2-3 (CSO1628), IPS, 2560x1600, 16" | Gigabyte AERO 16 OLED BSF Samsung SDC4191 (ATNA60YV09-0, OLED, 3840x2400, 16" | Razer Blade 16 Early 2023 CSOT T3 MNG007DA4-1, IPS, 2560x1600, 16" | |
|---|---|---|---|---|---|---|
| Display | 0% | 24% | 3% | 31% | 27% | |
| Display P3 Coverage (%) | 67.5 | 67.3 0% | 97 44% | 69.1 2% | 99.9 48% | 98.5 46% |
| sRGB Coverage (%) | 96.4 | 96.7 0% | 99.9 4% | 99.7 3% | 100 4% | 100 4% |
| AdobeRGB 1998 Coverage (%) | 68.6 | 68.9 0% | 84.9 24% | 71.2 4% | 96.4 41% | 89.7 31% |
| Response Times | -2% | 47% | 21% | 82% | 13% | |
| Response Time Grey 50% / Grey 80% * (ms) | 12.6 ? | 14.5 ? -15% | 5.1 ? 60% | 12.3 ? 2% | 2 ? 84% | 6.6 ? 48% |
| Response Time Black / White * (ms) | 9.8 ? | 8.6 ? 12% | 6.6 ? 33% | 5.9 ? 40% | 1.98 ? 80% | 12 ? -22% |
| PWM Frequency (Hz) | 60 | |||||
| Screen | 9% | 16% | 33% | 142% | 8% | |
| Brightness middle (cd/m²) | 338.6 | 372 10% | 470 39% | 511 51% | 389.97 15% | 456.8 35% |
| Brightness (cd/m²) | 328 | 349 6% | 459 40% | 469 43% | 395 20% | 437 33% |
| Brightness Distribution (%) | 89 | 88 -1% | 93 4% | 86 -3% | 97 9% | 83 -7% |
| Black Level * (cd/m²) | 0.32 | 0.32 -0% | 0.42 -31% | 0.4 -25% | 0.03 91% | 0.35 -9% |
| Contrast (:1) | 1058 | 1163 10% | 1119 6% | 1278 21% | 12999 1129% | 1305 23% |
| Colorchecker dE 2000 * | 2.18 | 2.06 6% | 1.86 15% | 0.95 56% | 2 8% | 3.7 -70% |
| Colorchecker dE 2000 max. * | 7.14 | 3 58% | 3.87 46% | 2.07 71% | 4.1 43% | 6.42 10% |
| Colorchecker dE 2000 calibrated * | 0.93 | 1.5 -61% | 0.93 -0% | 0.91 2% | 1.68 -81% | 0.66 29% |
| Greyscale dE 2000 * | 3.7 | 1.9 49% | 2.7 27% | 0.6 84% | 2.23 40% | 2.6 30% |
| Gamma | 2.18 101% | 2.312 95% | 2.246 98% | 2.176 101% | 2.41 91% | 2.3 96% |
| CCT | 7245 90% | 6747 96% | 6711 97% | 6545 99% | 6323 103% | 6108 106% |
| Totaal Gemiddelde (Programma / Instellingen) | 2% /
5% | 29% /
22% | 19% /
25% | 85% /
109% | 16% /
13% |
* ... kleiner is beter
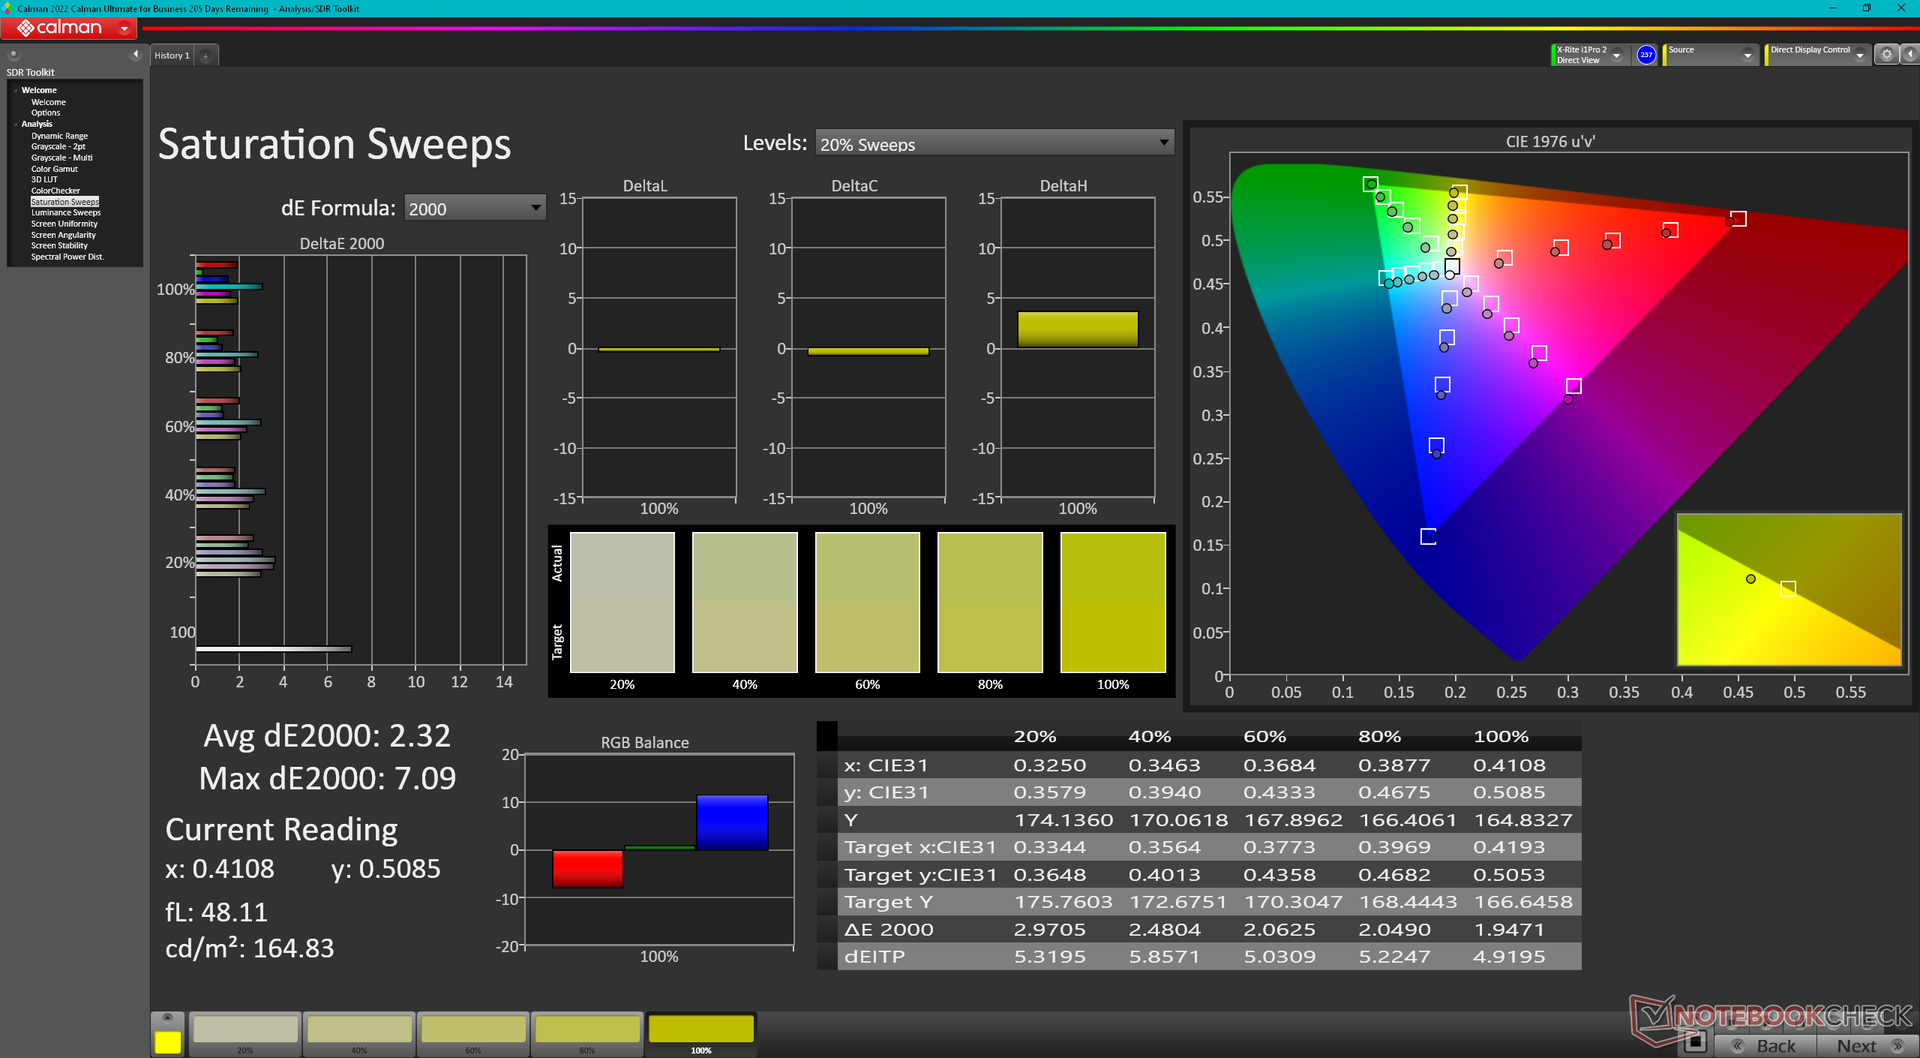
Het scherm is behoorlijk gekalibreerd uit de doos met gemiddelde grijswaarden en kleur deltaE waarden van 3,7 en 2,18, respectievelijk. De kleurtemperatuur is echter iets aan de koele kant, wat onze eigen X-Rite kalibratie aanpakt. Gebruikers kunnen ons gekalibreerde ICM profiel hierboven toepassen om nauwkeurigere kleuren uit de Uniwill te krijgen.
Responstijd Scherm
| ↔ Responstijd Zwart naar Wit | ||
|---|---|---|
| 9.8 ms ... stijging ↗ en daling ↘ gecombineerd | ↗ 5.1 ms stijging | 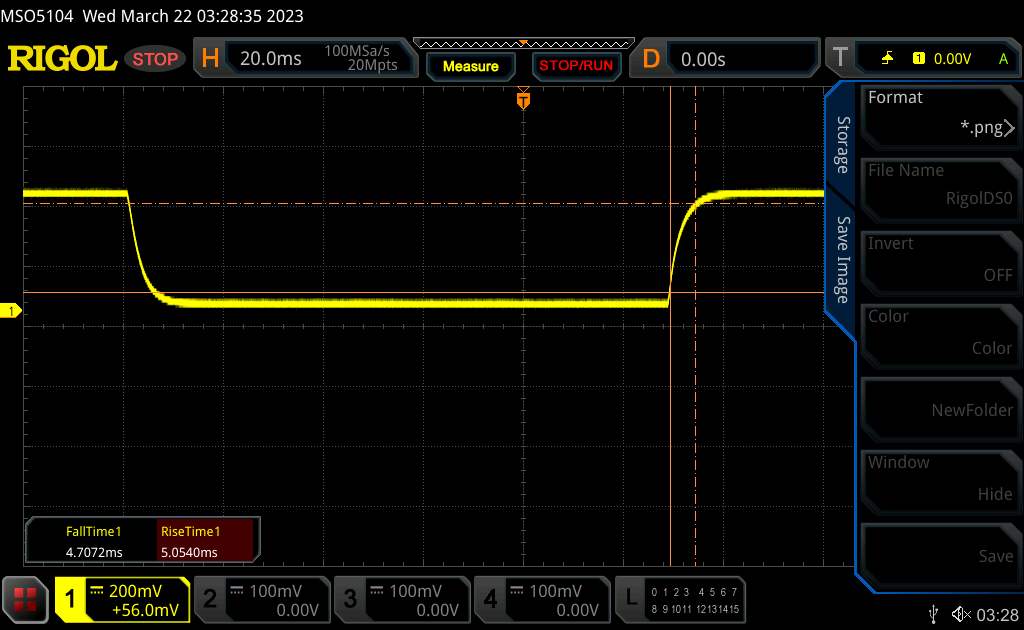 |
| ↘ 4.7 ms daling | ||
| Het scherm vertoonde snelle responstijden in onze tests en zou geschikt moeten zijn voor games. Ter vergelijking: alle testtoestellen variëren van 0.1 (minimum) tot 240 (maximum) ms. » 27 % van alle toestellen zijn beter. Dit betekent dat de gemeten responstijd beter is dan het gemiddelde (19.8 ms) van alle geteste toestellen. | ||
| ↔ Responstijd 50% Grijs naar 80% Grijs | ||
| 12.6 ms ... stijging ↗ en daling ↘ gecombineerd | ↗ 6.3 ms stijging | 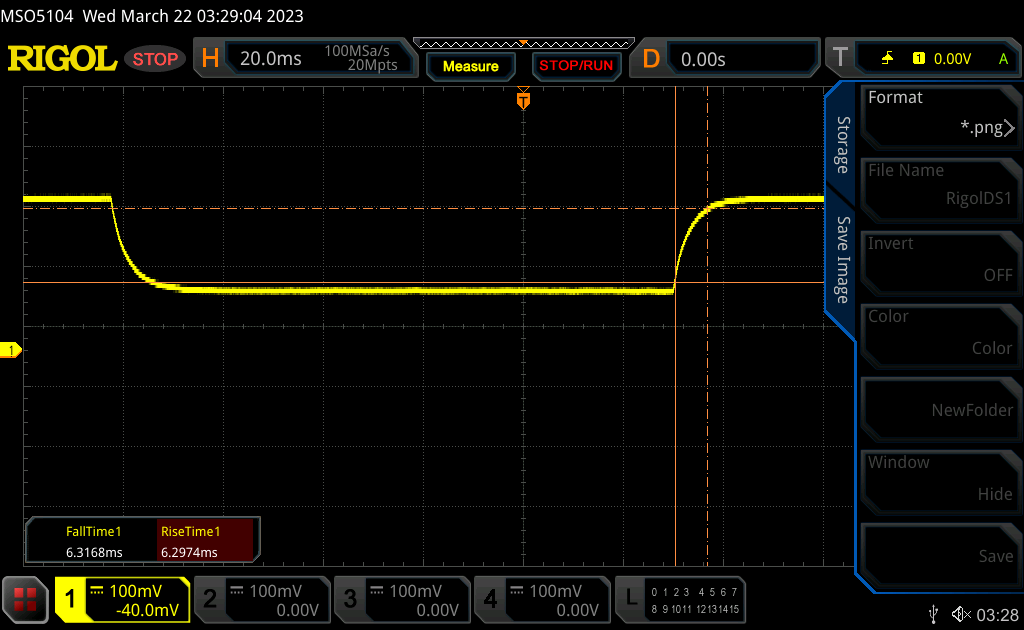 |
| ↘ 6.3 ms daling | ||
| Het scherm vertoonde prima responstijden in onze tests maar is misschien wat te traag voor competitieve games. Ter vergelijking: alle testtoestellen variëren van 0.165 (minimum) tot 636 (maximum) ms. » 26 % van alle toestellen zijn beter. Dit betekent dat de gemeten responstijd beter is dan het gemiddelde (31 ms) van alle geteste toestellen. | ||
Screen Flickering / PWM (Pulse-Width Modulation)
| Screen flickering / PWM niet waargenomen | 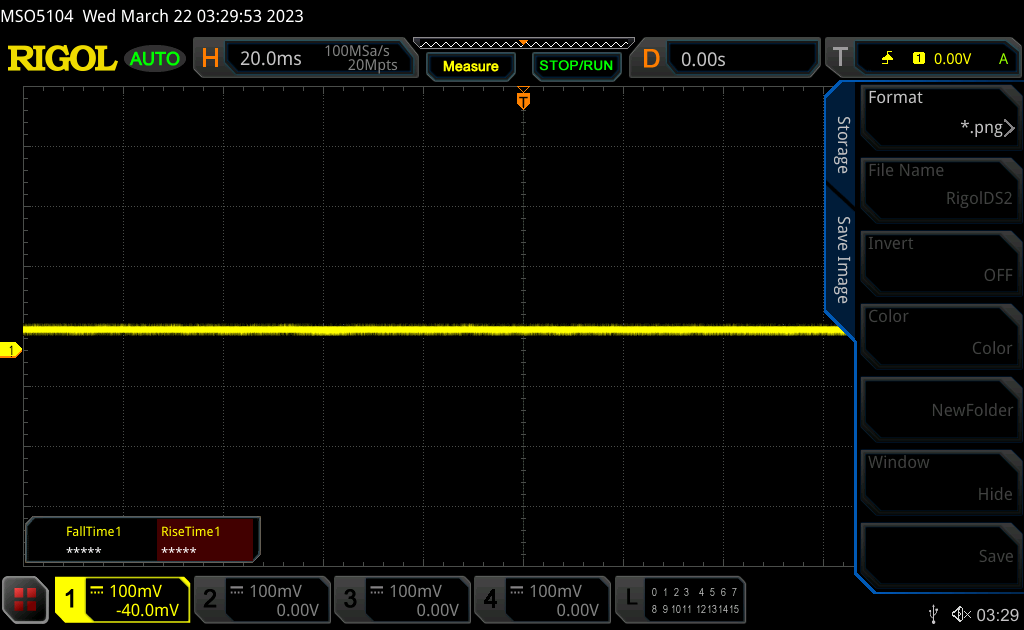 | ||
Ter vergelijking: 52 % van alle geteste toestellen maakten geen gebruik van PWM om de schermhelderheid te verlagen. Als het wel werd gebruikt, werd een gemiddelde van 7754 (minimum: 5 - maximum: 343500) Hz waargenomen. | |||

Prestaties
Testomstandigheden
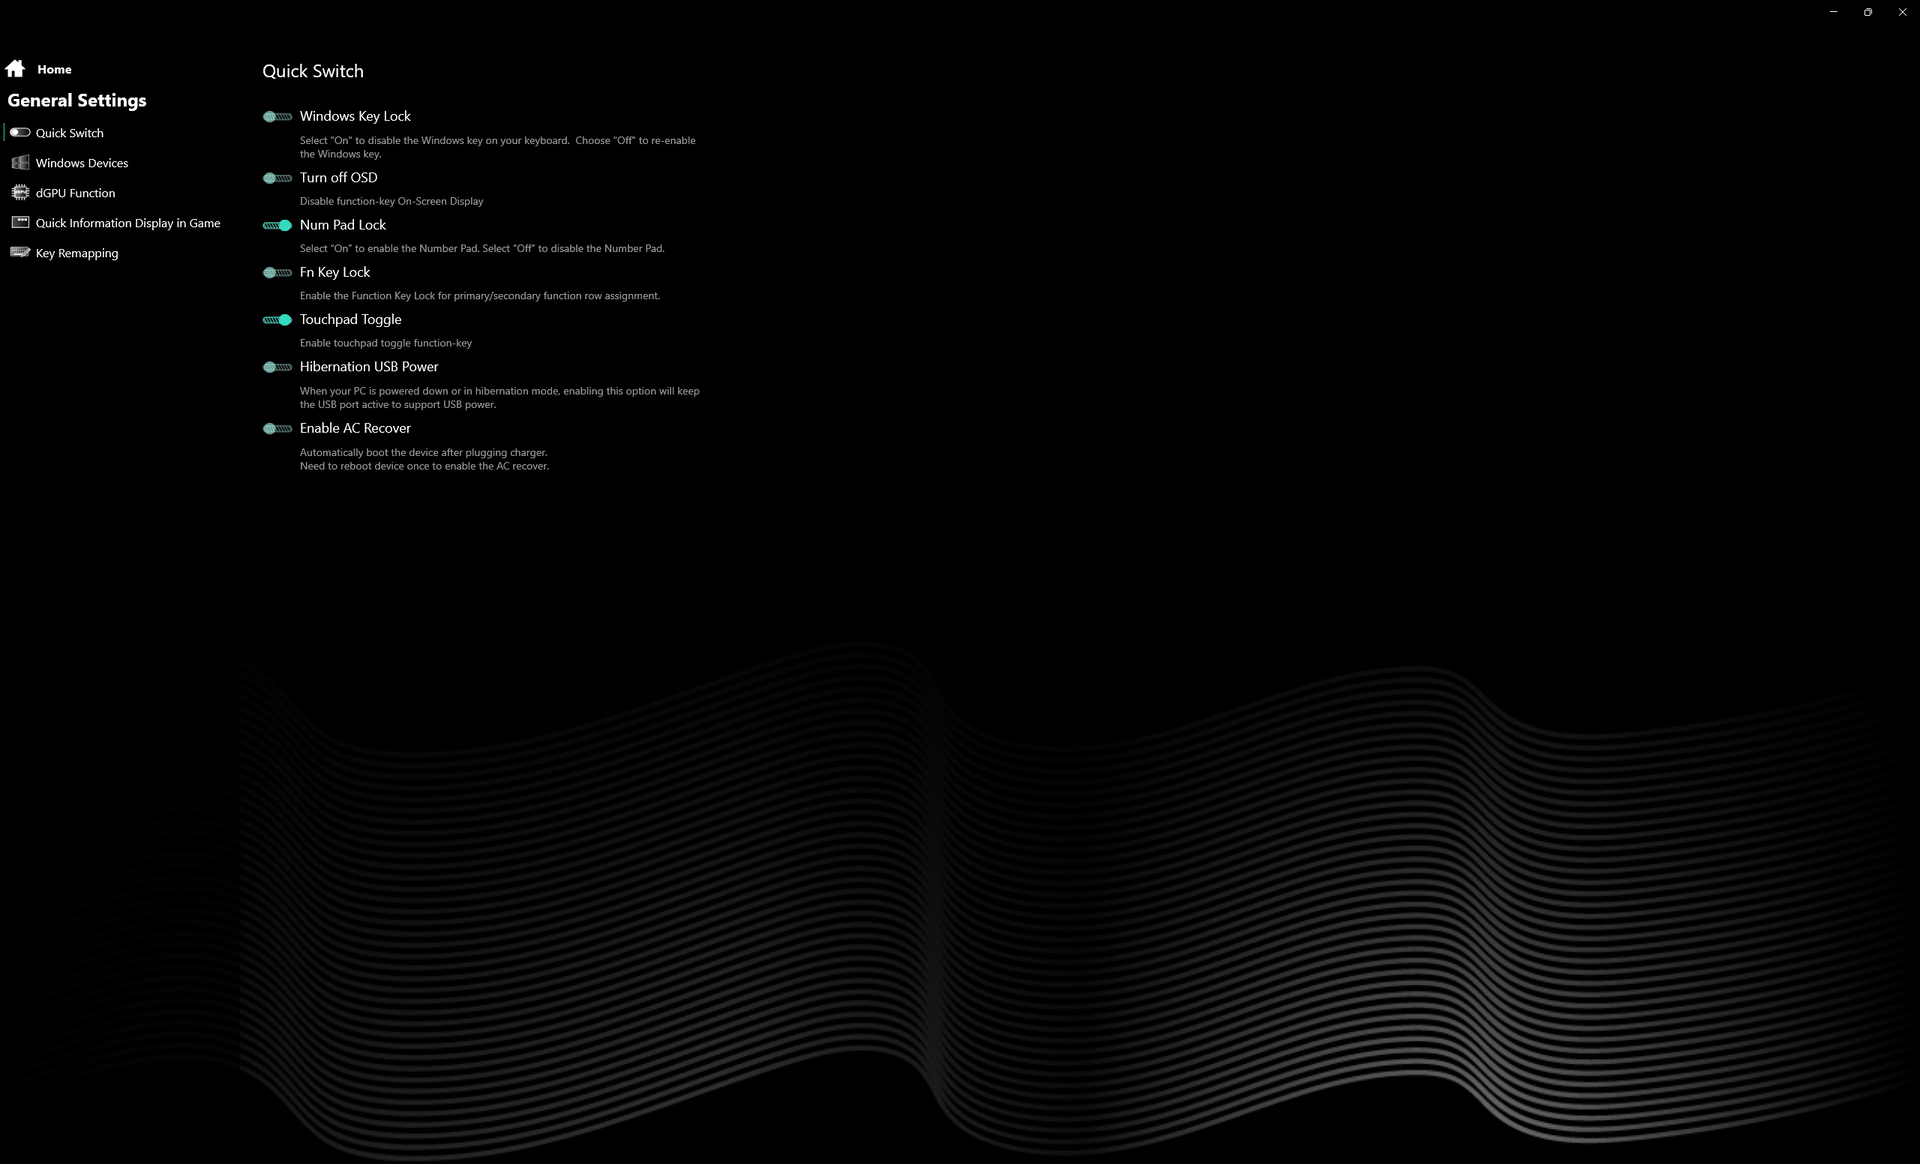
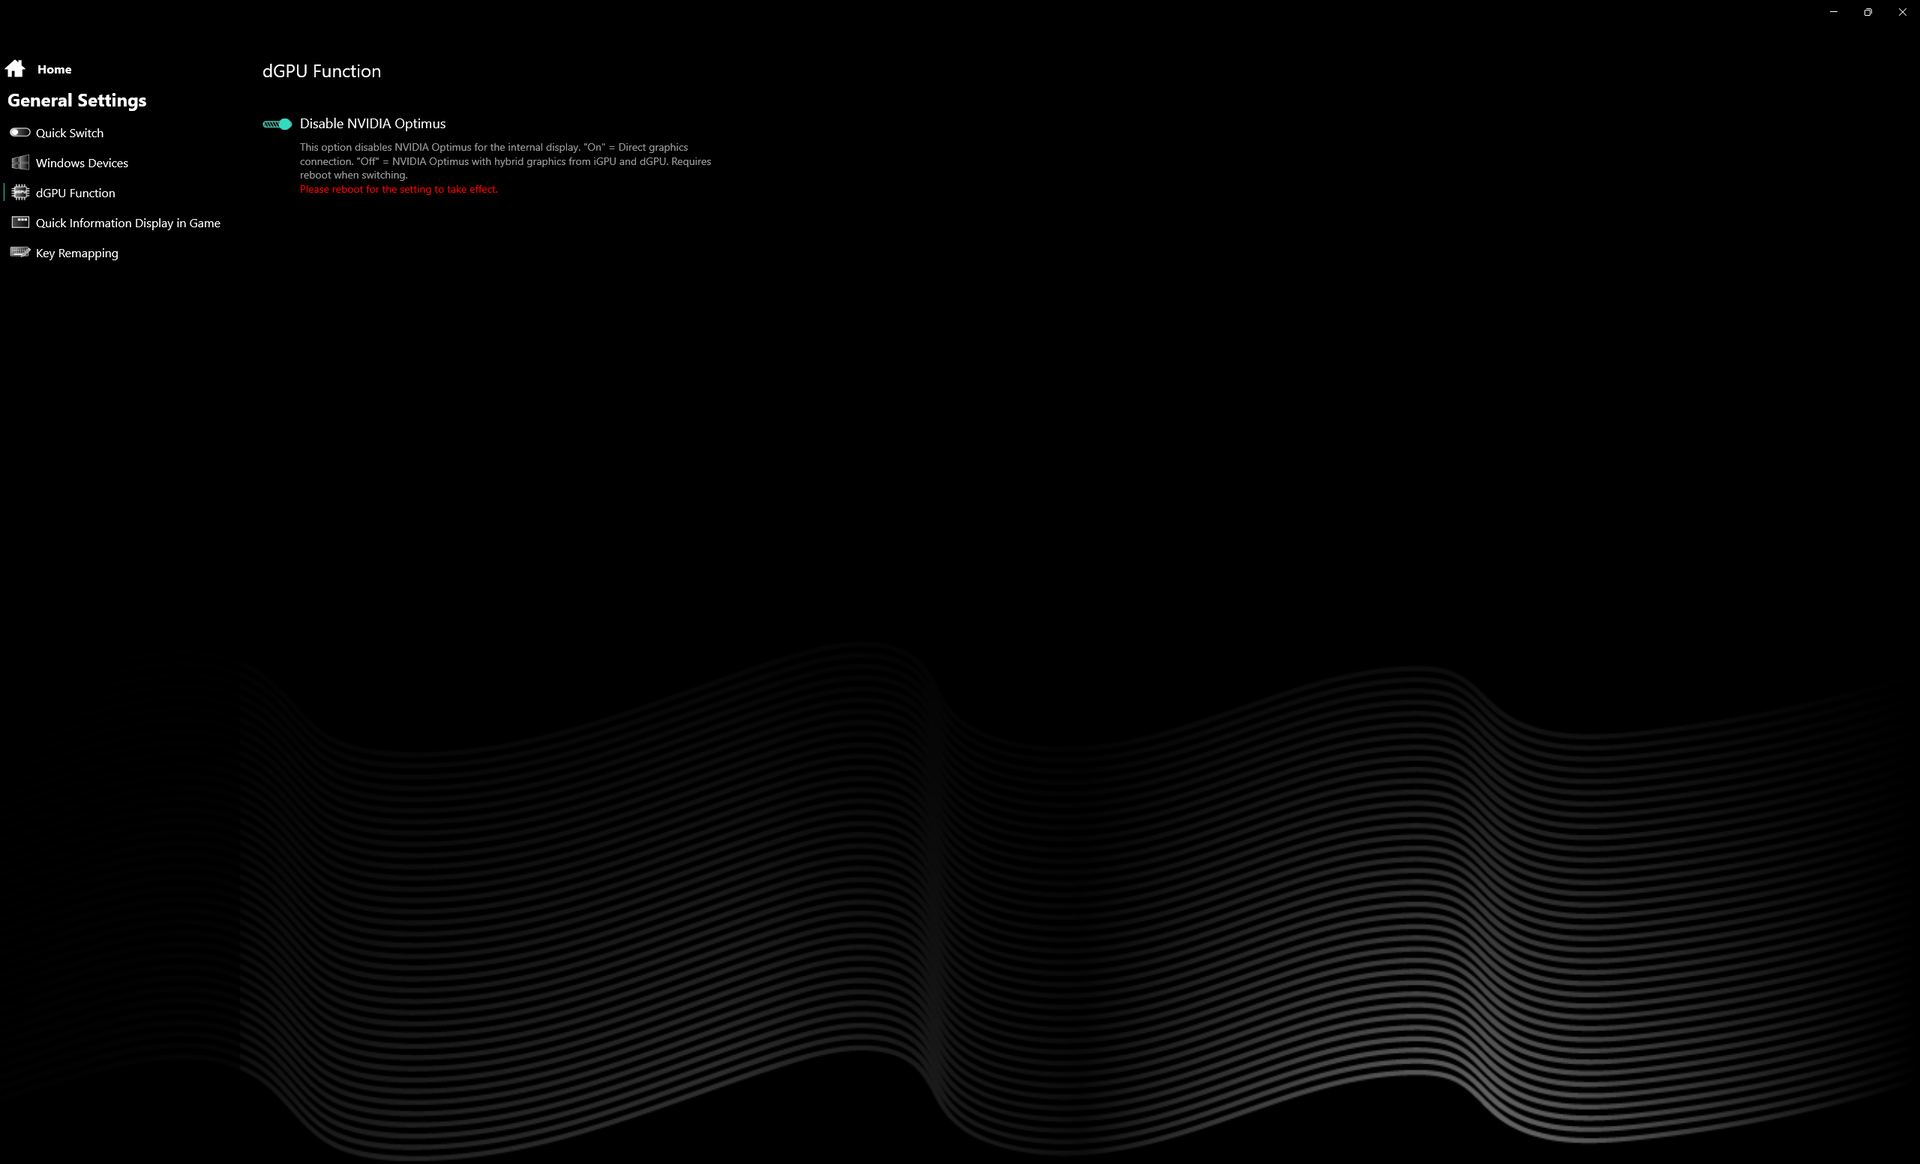
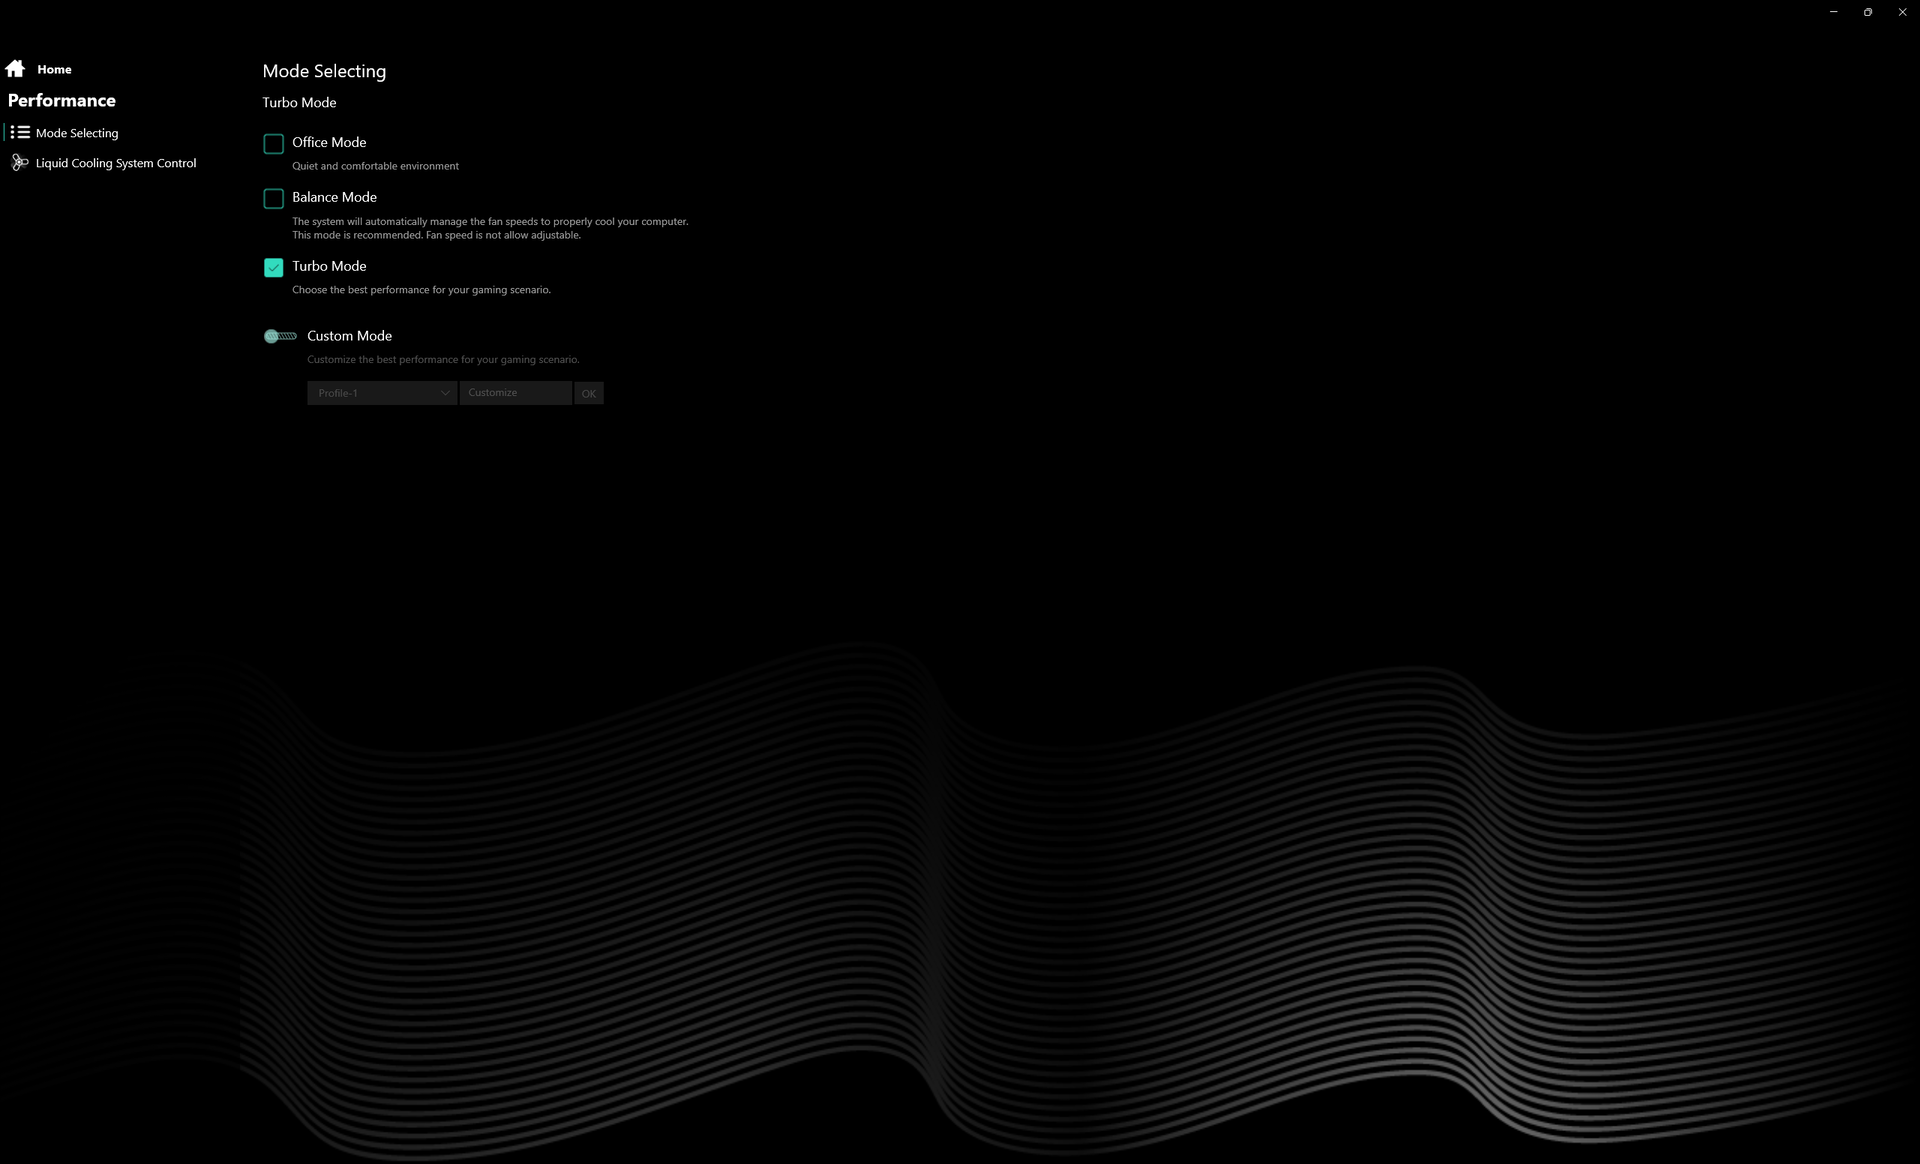
We hebben ons toestel via de voorgeïnstalleerde Control Center software in Turbo modus gezet met Optimus uitgeschakeld voordat we onderstaande benchmarks uitvoerden. Het systeem ondersteunt Advanced Optimus niet, wat betekent dat een herstart nodig is bij het schakelen tussen de discrete GPU en Optimus. Gebruikers worden aangemoedigd om vertrouwd te raken met de voorgeïnstalleerde Control Center software, aangezien dit het middelpunt is voor het aanpassen van prestatieprofielen, Optimus en meer.
G-Sync wordt niet ondersteund op het interne beeldscherm.

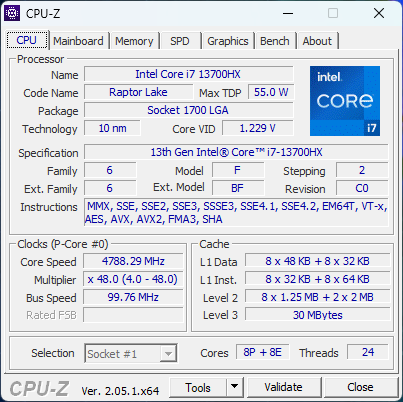
Processor
We kunnen eindelijk zien hoe de bovenste midrange Core i7-13700HX CPU schaalt na het testen van verschillende enthousiaste gaming laptops met 13e gen Core i9 processoren. Benchmarks laten zien dat hij ruwweg 25 procent sneller is dan de vorige generatie 12e gen Core i7-12700H meestal te vinden op de meeste mid-range tot high-end gaming laptops van 2022. Opwaarderen naar de Core i9-13900HX configuratie zal naar verwachting de prestaties aanzienlijk verbeteren met 35 procent.
De algemene prestaties liggen ver voor op elke mobiele Zen 3+ CPU, terwijl de nieuwste Zen 4 Ryzen 9 7945HX nog steeds de snellere processor is met 20 tot 50 procent. De prestatiestabiliteit is uitstekend, zonder grote schommelingen in de kloksnelheid bij belasting.
Meer technische details en benchmark vergelijkingen over de Core i7-13700HX zijn te vinden op onze speciale pagina hier.
Cinebench R15 Multi Loop
Cinebench R23: Multi Core | Single Core
Cinebench R20: CPU (Multi Core) | CPU (Single Core)
Cinebench R15: CPU Multi 64Bit | CPU Single 64Bit
Blender: v2.79 BMW27 CPU
7-Zip 18.03: 7z b 4 | 7z b 4 -mmt1
Geekbench 5.5: Multi-Core | Single-Core
HWBOT x265 Benchmark v2.2: 4k Preset
LibreOffice : 20 Documents To PDF
R Benchmark 2.5: Overall mean
* ... kleiner is beter
AIDA64: FP32 Ray-Trace | FPU Julia | CPU SHA3 | CPU Queen | FPU SinJulia | FPU Mandel | CPU AES | CPU ZLib | FP64 Ray-Trace | CPU PhotoWorxx
| Performance rating | |
| Lenovo Legion Pro 7 16IRX8H | |
| Asus ROG Strix G16 G614JZ | |
| Schenker XMG Neo 16 E23 | |
| Razer Blade 16 Early 2023 | |
| Uniwill GM6PX7X RTX 4070 | |
| Gigabyte AERO 16 OLED BSF | |
| Gemiddeld Intel Core i7-13700HX | |
| AIDA64 / FP32 Ray-Trace | |
| Asus ROG Strix G16 G614JZ | |
| Lenovo Legion Pro 7 16IRX8H | |
| Razer Blade 16 Early 2023 | |
| Razer Blade 16 Early 2023 | |
| Razer Blade 16 Early 2023 | |
| Schenker XMG Neo 16 E23 | |
| Uniwill GM6PX7X RTX 4070 | |
| Gemiddeld Intel Core i7-13700HX (14261 - 21999, n=11) | |
| Gigabyte AERO 16 OLED BSF | |
| AIDA64 / CPU Queen | |
| Asus ROG Strix G16 G614JZ | |
| Schenker XMG Neo 16 E23 | |
| Razer Blade 16 Early 2023 | |
| Razer Blade 16 Early 2023 | |
| Lenovo Legion Pro 7 16IRX8H | |
| Uniwill GM6PX7X RTX 4070 | |
| Gemiddeld Intel Core i7-13700HX (86532 - 114717, n=11) | |
| Gigabyte AERO 16 OLED BSF | |
| AIDA64 / FPU SinJulia | |
| Asus ROG Strix G16 G614JZ | |
| Razer Blade 16 Early 2023 | |
| Razer Blade 16 Early 2023 | |
| Razer Blade 16 Early 2023 | |
| Lenovo Legion Pro 7 16IRX8H | |
| Schenker XMG Neo 16 E23 | |
| Uniwill GM6PX7X RTX 4070 | |
| Gemiddeld Intel Core i7-13700HX (9290 - 13519, n=11) | |
| Gigabyte AERO 16 OLED BSF | |
| AIDA64 / FP64 Ray-Trace | |
| Lenovo Legion Pro 7 16IRX8H | |
| Asus ROG Strix G16 G614JZ | |
| Razer Blade 16 Early 2023 | |
| Razer Blade 16 Early 2023 | |
| Razer Blade 16 Early 2023 | |
| Schenker XMG Neo 16 E23 | |
| Uniwill GM6PX7X RTX 4070 | |
| Gemiddeld Intel Core i7-13700HX (7728 - 11837, n=11) | |
| Gigabyte AERO 16 OLED BSF | |
| AIDA64 / CPU PhotoWorxx | |
| Razer Blade 16 Early 2023 | |
| Razer Blade 16 Early 2023 | |
| Razer Blade 16 Early 2023 | |
| Schenker XMG Neo 16 E23 | |
| Lenovo Legion Pro 7 16IRX8H | |
| Gigabyte AERO 16 OLED BSF | |
| Uniwill GM6PX7X RTX 4070 | |
| Asus ROG Strix G16 G614JZ | |
| Gemiddeld Intel Core i7-13700HX (19678 - 42415, n=11) | |
Systeemprestaties
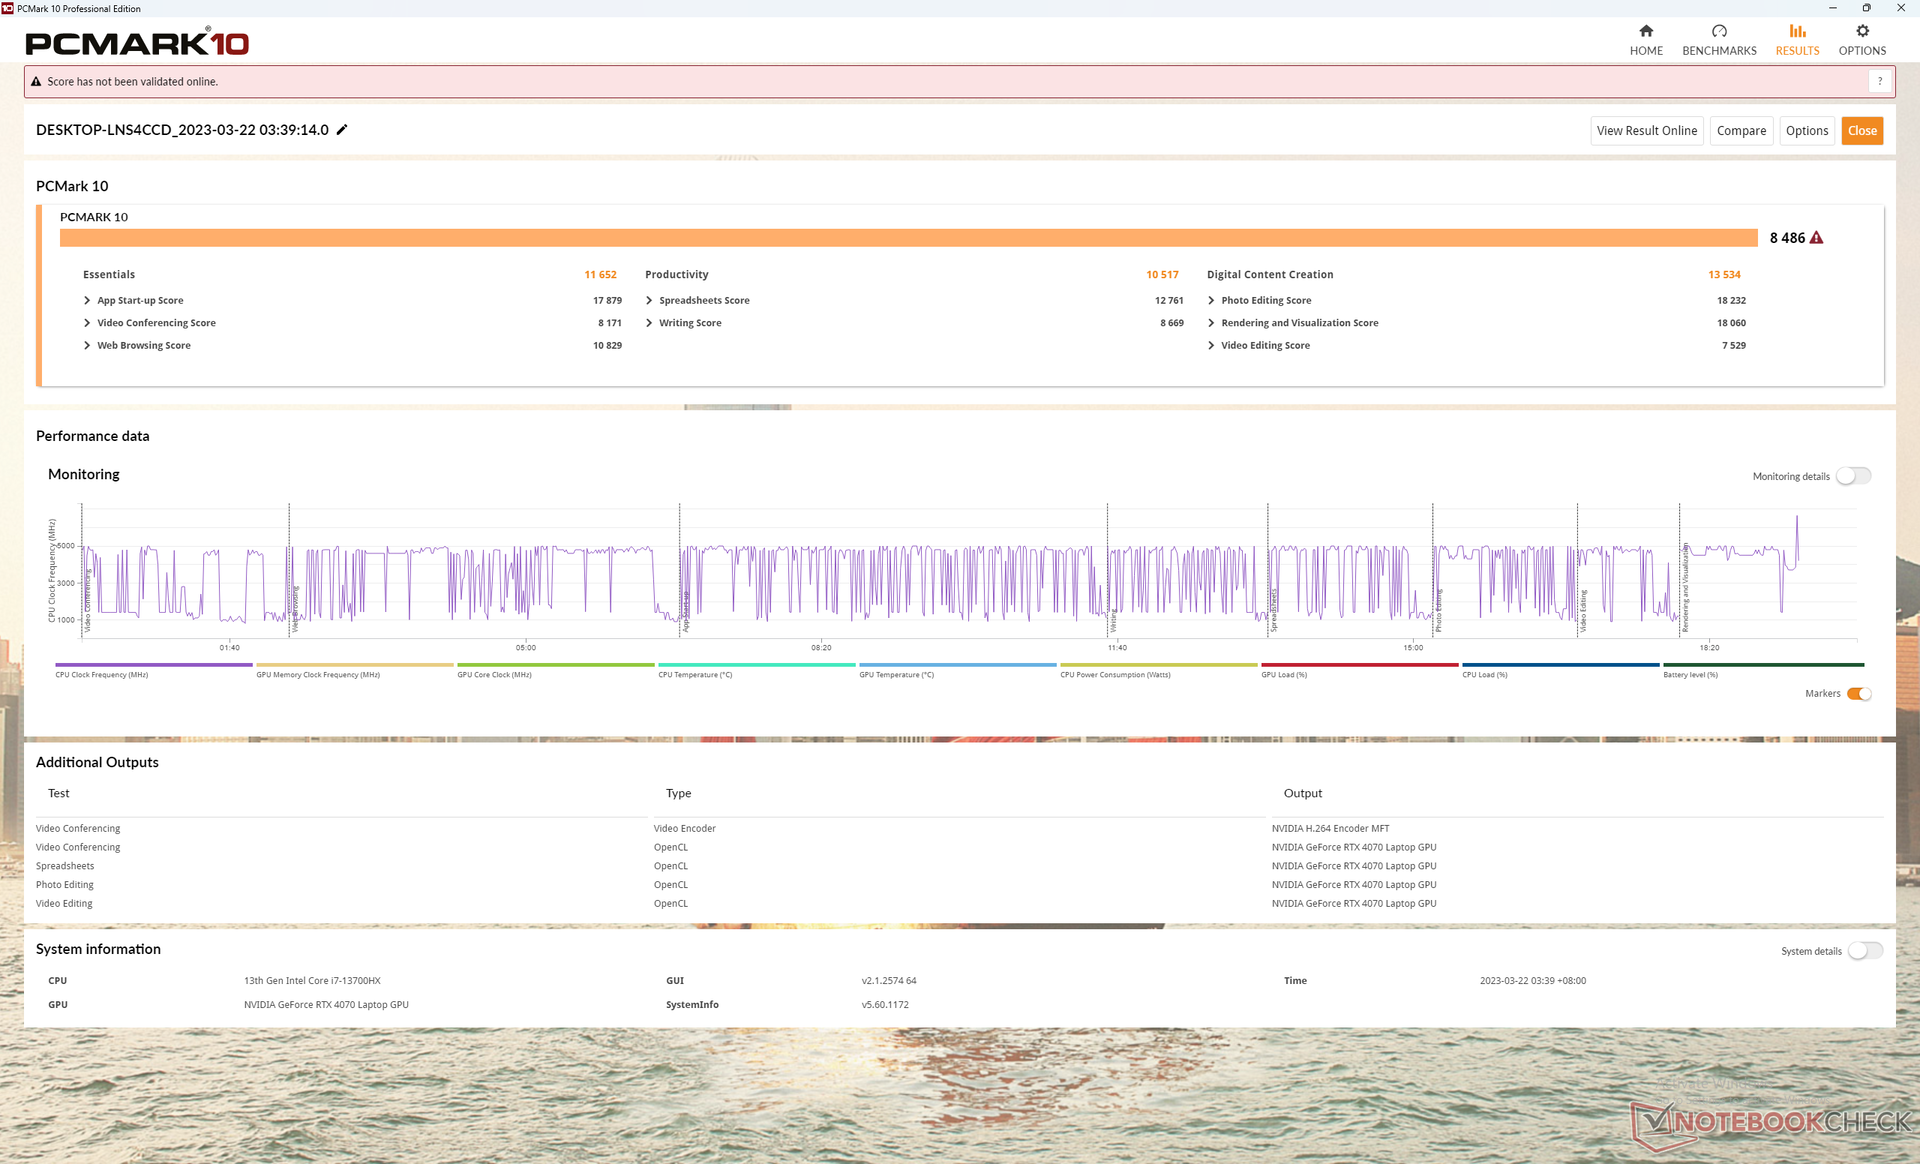
PCMark resultaten zijn vergelijkbaar met andere high-end gaming laptops die draaien op 13e gen Core CPU's en GeForce 40 GPU's, zoals de Gigabyte AERO 16 of Razer Blade 16. De scores liggen consequent voor op de Schenker XMG Neo 15 die draait op oudere Zen 3+ en GeForce 30 hardware.
CrossMark: Overall | Productivity | Creativity | Responsiveness
| PCMark 10 / Score | |
| Uniwill GM6PX7X RTX 4070 | |
| Schenker XMG Neo 16 E23 | |
| Gigabyte AERO 16 OLED BSF | |
| Razer Blade 16 Early 2023 | |
| Lenovo Legion Pro 7 16IRX8H | |
| Asus ROG Strix G16 G614JZ | |
| PCMark 10 / Essentials | |
| Asus ROG Strix G16 G614JZ | |
| Lenovo Legion Pro 7 16IRX8H | |
| Uniwill GM6PX7X RTX 4070 | |
| Gigabyte AERO 16 OLED BSF | |
| Razer Blade 16 Early 2023 | |
| Schenker XMG Neo 16 E23 | |
| PCMark 10 / Productivity | |
| Lenovo Legion Pro 7 16IRX8H | |
| Uniwill GM6PX7X RTX 4070 | |
| Schenker XMG Neo 16 E23 | |
| Gigabyte AERO 16 OLED BSF | |
| Razer Blade 16 Early 2023 | |
| Asus ROG Strix G16 G614JZ | |
| PCMark 10 / Digital Content Creation | |
| Schenker XMG Neo 16 E23 | |
| Razer Blade 16 Early 2023 | |
| Gigabyte AERO 16 OLED BSF | |
| Uniwill GM6PX7X RTX 4070 | |
| Asus ROG Strix G16 G614JZ | |
| Lenovo Legion Pro 7 16IRX8H | |
| CrossMark / Overall | |
| Asus ROG Strix G16 G614JZ | |
| Schenker XMG Neo 16 E23 | |
| Uniwill GM6PX7X RTX 4070 | |
| Gigabyte AERO 16 OLED BSF | |
| Razer Blade 16 Early 2023 | |
| CrossMark / Productivity | |
| Asus ROG Strix G16 G614JZ | |
| Schenker XMG Neo 16 E23 | |
| Uniwill GM6PX7X RTX 4070 | |
| Gigabyte AERO 16 OLED BSF | |
| Razer Blade 16 Early 2023 | |
| CrossMark / Creativity | |
| Schenker XMG Neo 16 E23 | |
| Asus ROG Strix G16 G614JZ | |
| Uniwill GM6PX7X RTX 4070 | |
| Gigabyte AERO 16 OLED BSF | |
| Razer Blade 16 Early 2023 | |
| CrossMark / Responsiveness | |
| Asus ROG Strix G16 G614JZ | |
| Gigabyte AERO 16 OLED BSF | |
| Uniwill GM6PX7X RTX 4070 | |
| Schenker XMG Neo 16 E23 | |
| Razer Blade 16 Early 2023 | |
| PCMark 10 Score | 8486 punten | |
Help | ||
| AIDA64 / Memory Copy | |
| Razer Blade 16 Early 2023 | |
| Razer Blade 16 Early 2023 | |
| Razer Blade 16 Early 2023 | |
| Lenovo Legion Pro 7 16IRX8H | |
| Schenker XMG Neo 16 E23 | |
| Gigabyte AERO 16 OLED BSF | |
| Uniwill GM6PX7X RTX 4070 | |
| Asus ROG Strix G16 G614JZ | |
| Gemiddeld Intel Core i7-13700HX (36125 - 63990, n=11) | |
| AIDA64 / Memory Read | |
| Razer Blade 16 Early 2023 | |
| Razer Blade 16 Early 2023 | |
| Razer Blade 16 Early 2023 | |
| Lenovo Legion Pro 7 16IRX8H | |
| Schenker XMG Neo 16 E23 | |
| Asus ROG Strix G16 G614JZ | |
| Uniwill GM6PX7X RTX 4070 | |
| Gigabyte AERO 16 OLED BSF | |
| Gemiddeld Intel Core i7-13700HX (36510 - 69729, n=11) | |
| AIDA64 / Memory Write | |
| Razer Blade 16 Early 2023 | |
| Razer Blade 16 Early 2023 | |
| Razer Blade 16 Early 2023 | |
| Schenker XMG Neo 16 E23 | |
| Lenovo Legion Pro 7 16IRX8H | |
| Gigabyte AERO 16 OLED BSF | |
| Uniwill GM6PX7X RTX 4070 | |
| Asus ROG Strix G16 G614JZ | |
| Gemiddeld Intel Core i7-13700HX (33598 - 85675, n=11) | |
| AIDA64 / Memory Latency | |
| Razer Blade 16 Early 2023 | |
| Razer Blade 16 Early 2023 | |
| Razer Blade 16 Early 2023 | |
| Gigabyte AERO 16 OLED BSF | |
| Asus ROG Strix G16 G614JZ | |
| Uniwill GM6PX7X RTX 4070 | |
| Gemiddeld Intel Core i7-13700HX (81.5 - 97.9, n=11) | |
| Schenker XMG Neo 16 E23 | |
| Lenovo Legion Pro 7 16IRX8H | |
* ... kleiner is beter
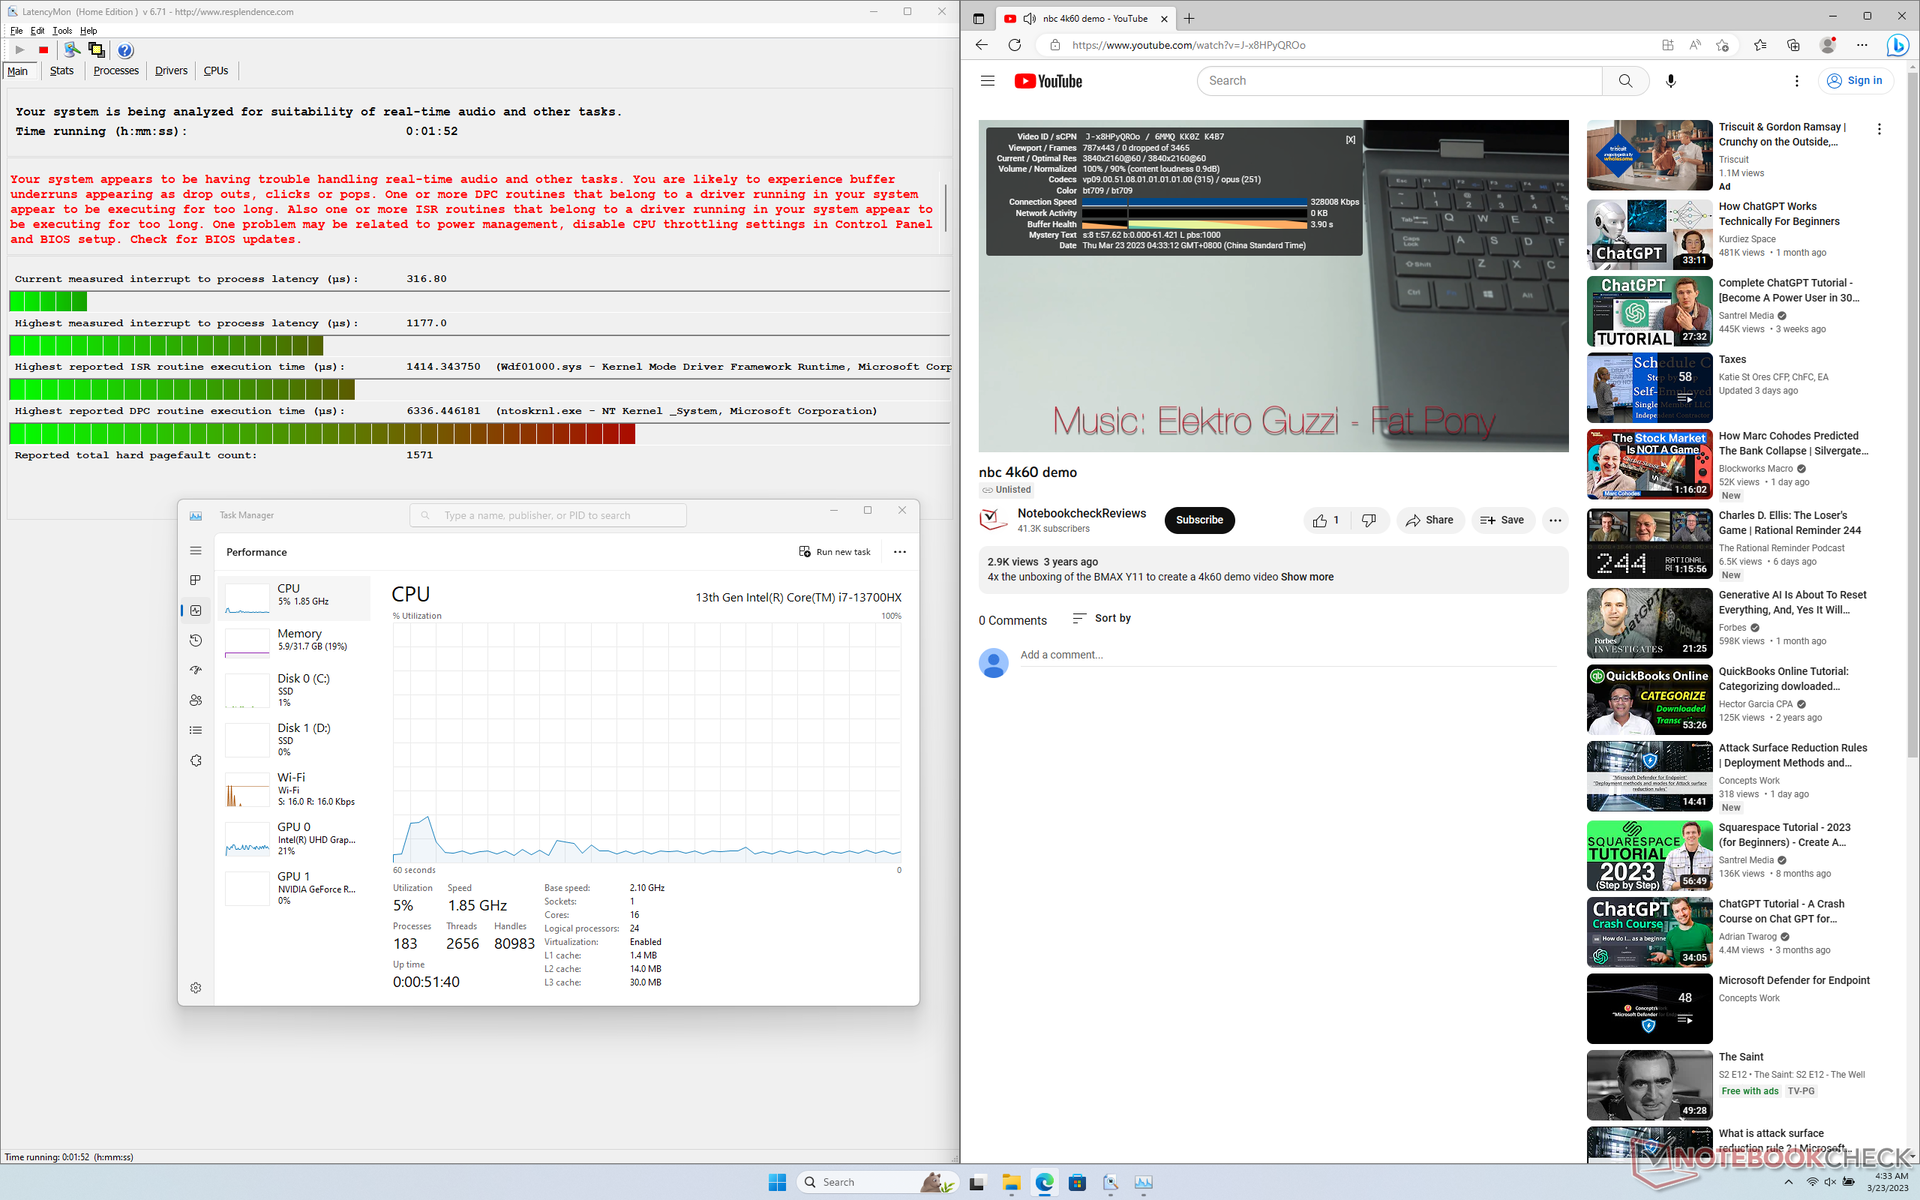
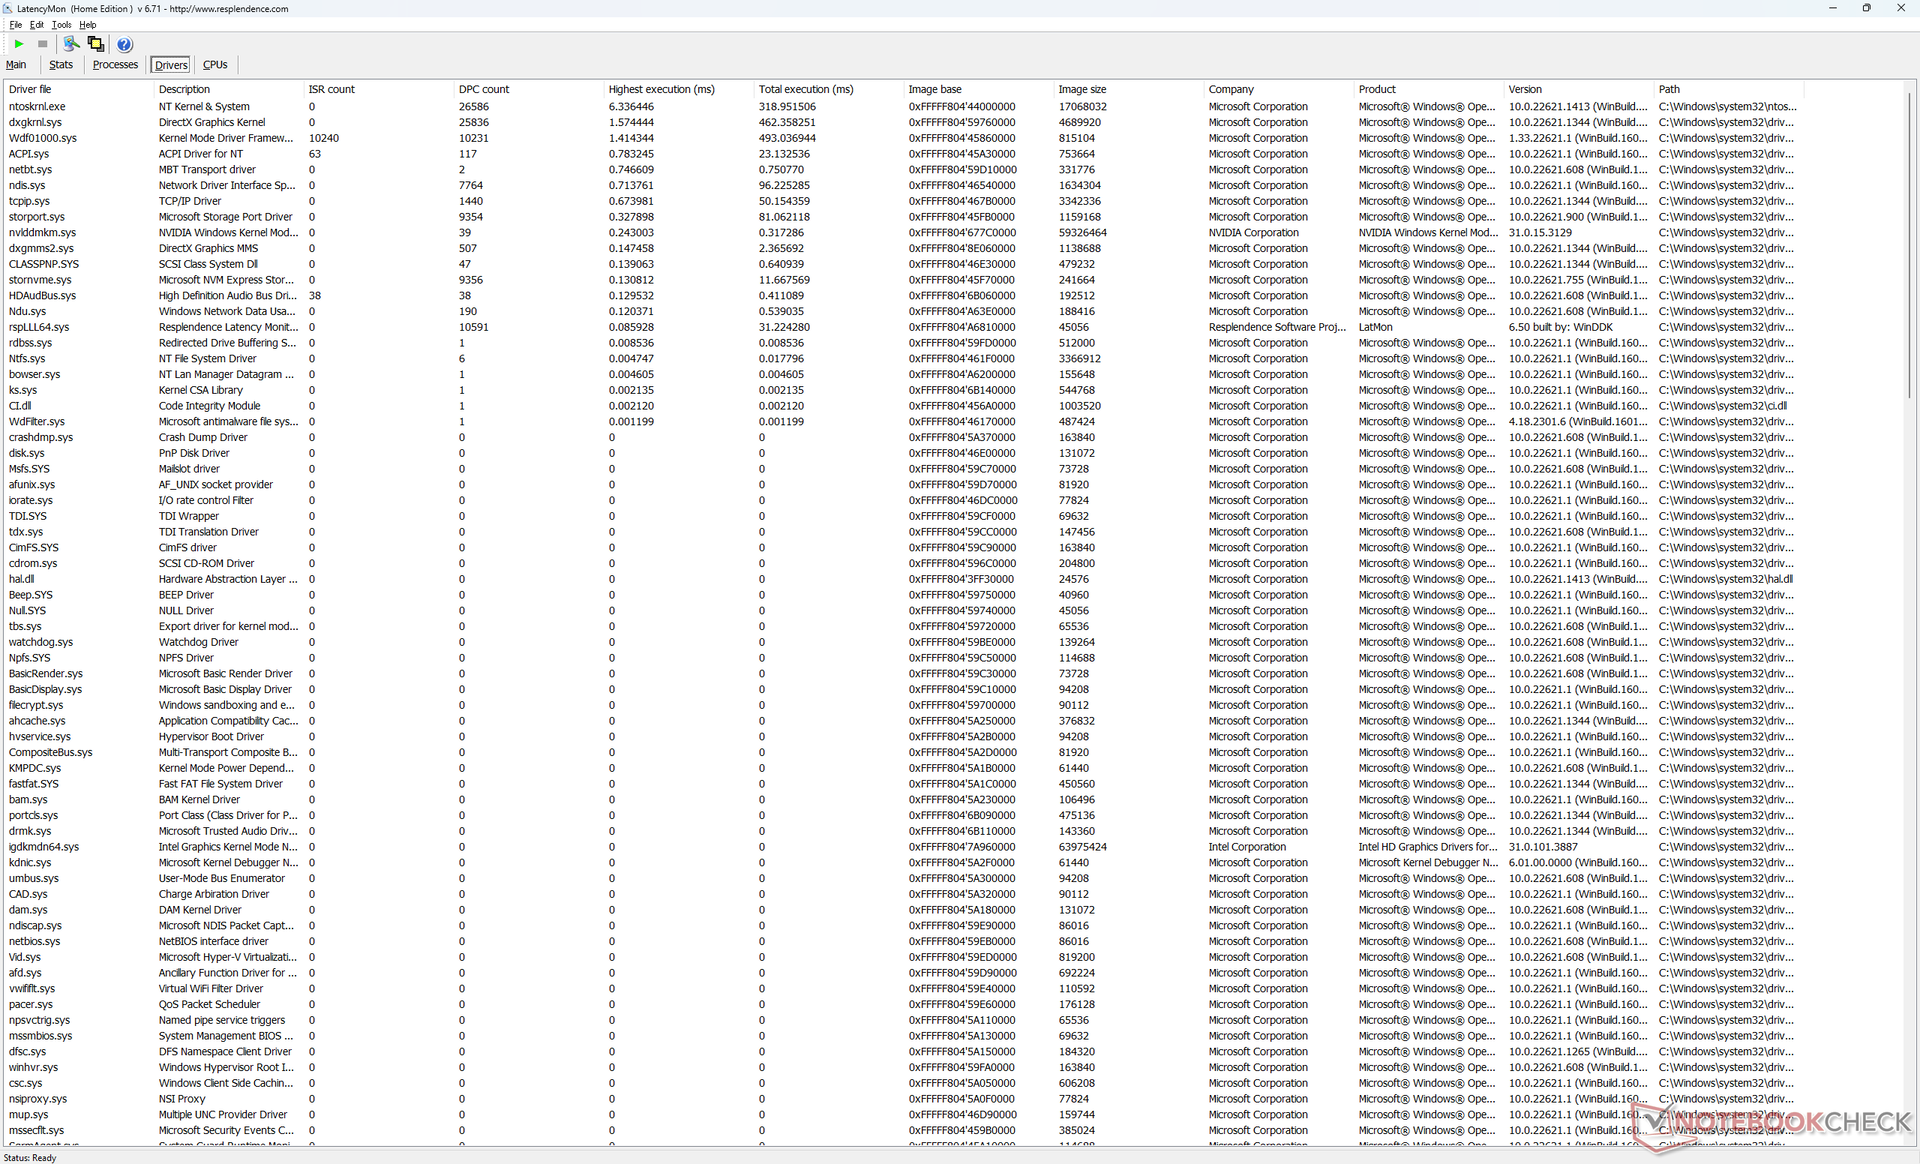
DPC latentie
LatencyMon onthult DPC-problemen bij het openen van meerdere browsertabbladen op onze homepage. het afspelen van 4K-video's met 60 FPS is verder perfect met een laag CPU- en GPU-gebruik en geen dropped frames.
| DPC Latencies / LatencyMon - interrupt to process latency (max), Web, Youtube, Prime95 | |
| Schenker XMG Neo 16 E23 | |
| Asus ROG Strix G16 G614JZ | |
| Razer Blade 16 Early 2023 | |
| Uniwill GM6PX7X RTX 4070 | |
| Gigabyte AERO 16 OLED BSF | |
| Lenovo Legion Pro 7 16IRX8H | |
* ... kleiner is beter
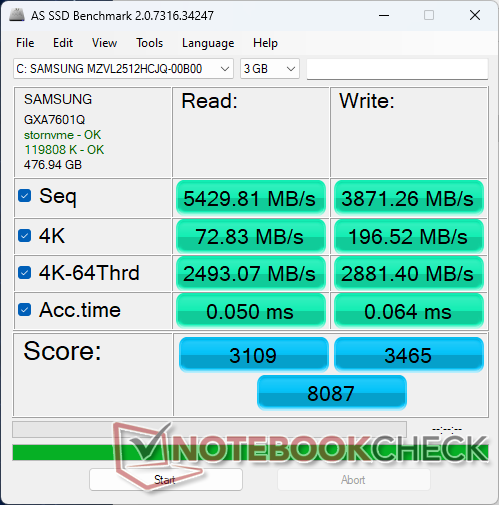
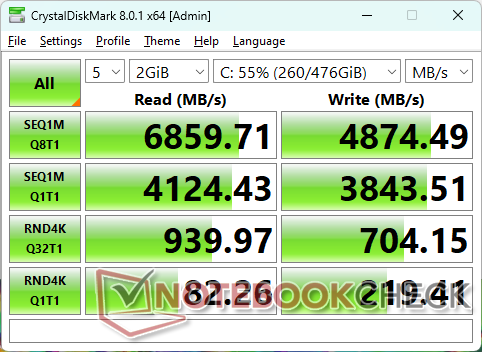
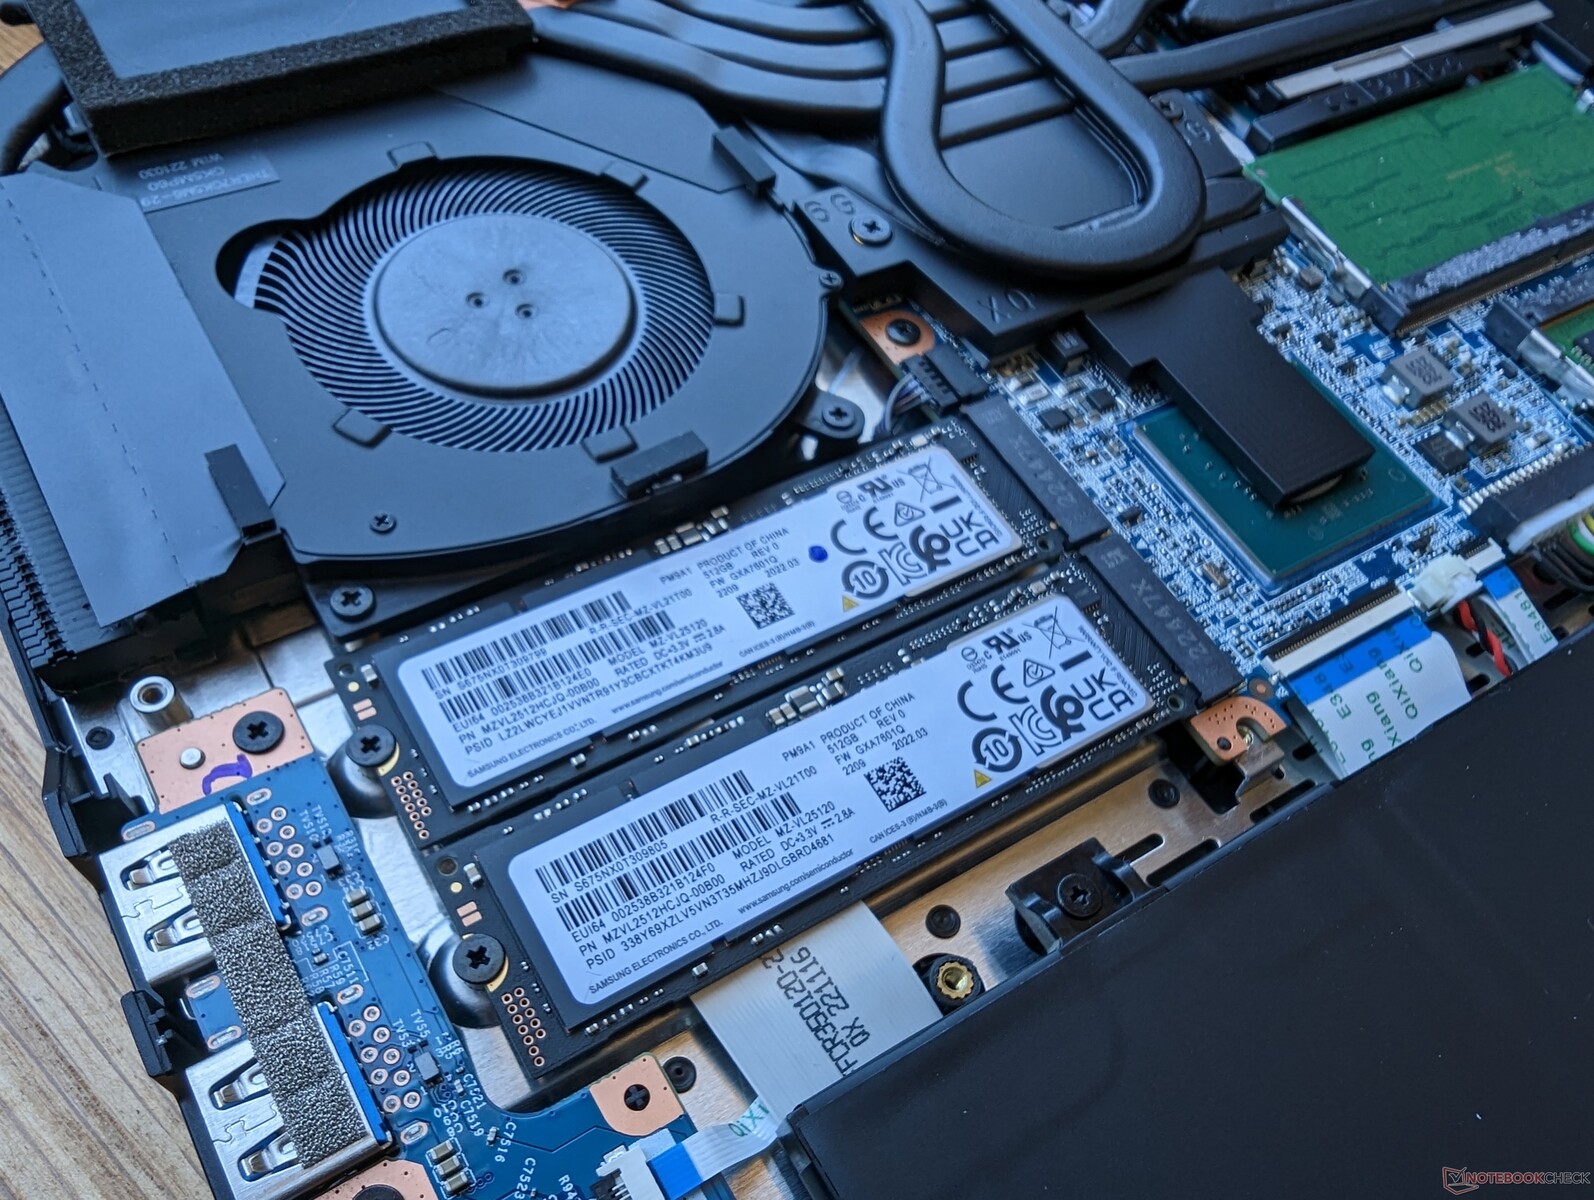
Opslagapparaten
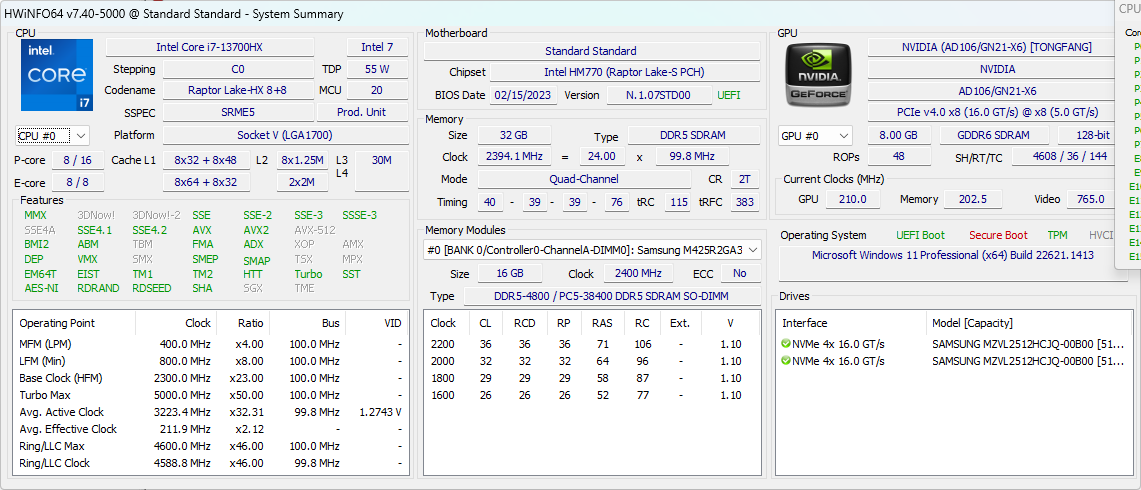
Onze testunit wordt geleverd met een PCIe4 x4 Samsung PM9A1 MZVL2512HCJQ NVMe SSD met een sequentiële leessnelheid van 6700 MB/s. De hoge snelheden zijn ook duurzaam, zonder prestatiedips bij belasting.

| Drive Performance rating - Percent | |
| Lenovo Legion Pro 7 16IRX8H | |
| Uniwill GM6PX7X RTX 4070 | |
| Gigabyte AERO 16 OLED BSF | |
| Razer Blade 16 Early 2023 | |
| Asus ROG Strix G16 G614JZ | |
| Schenker XMG Neo 16 E23 | |
* ... kleiner is beter
Disk Throttling: DiskSpd Read Loop, Queue Depth 8
GPU-prestaties
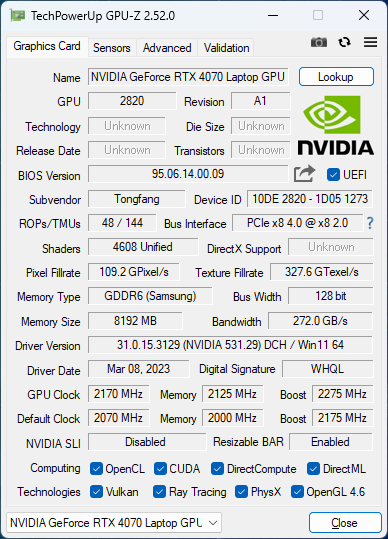
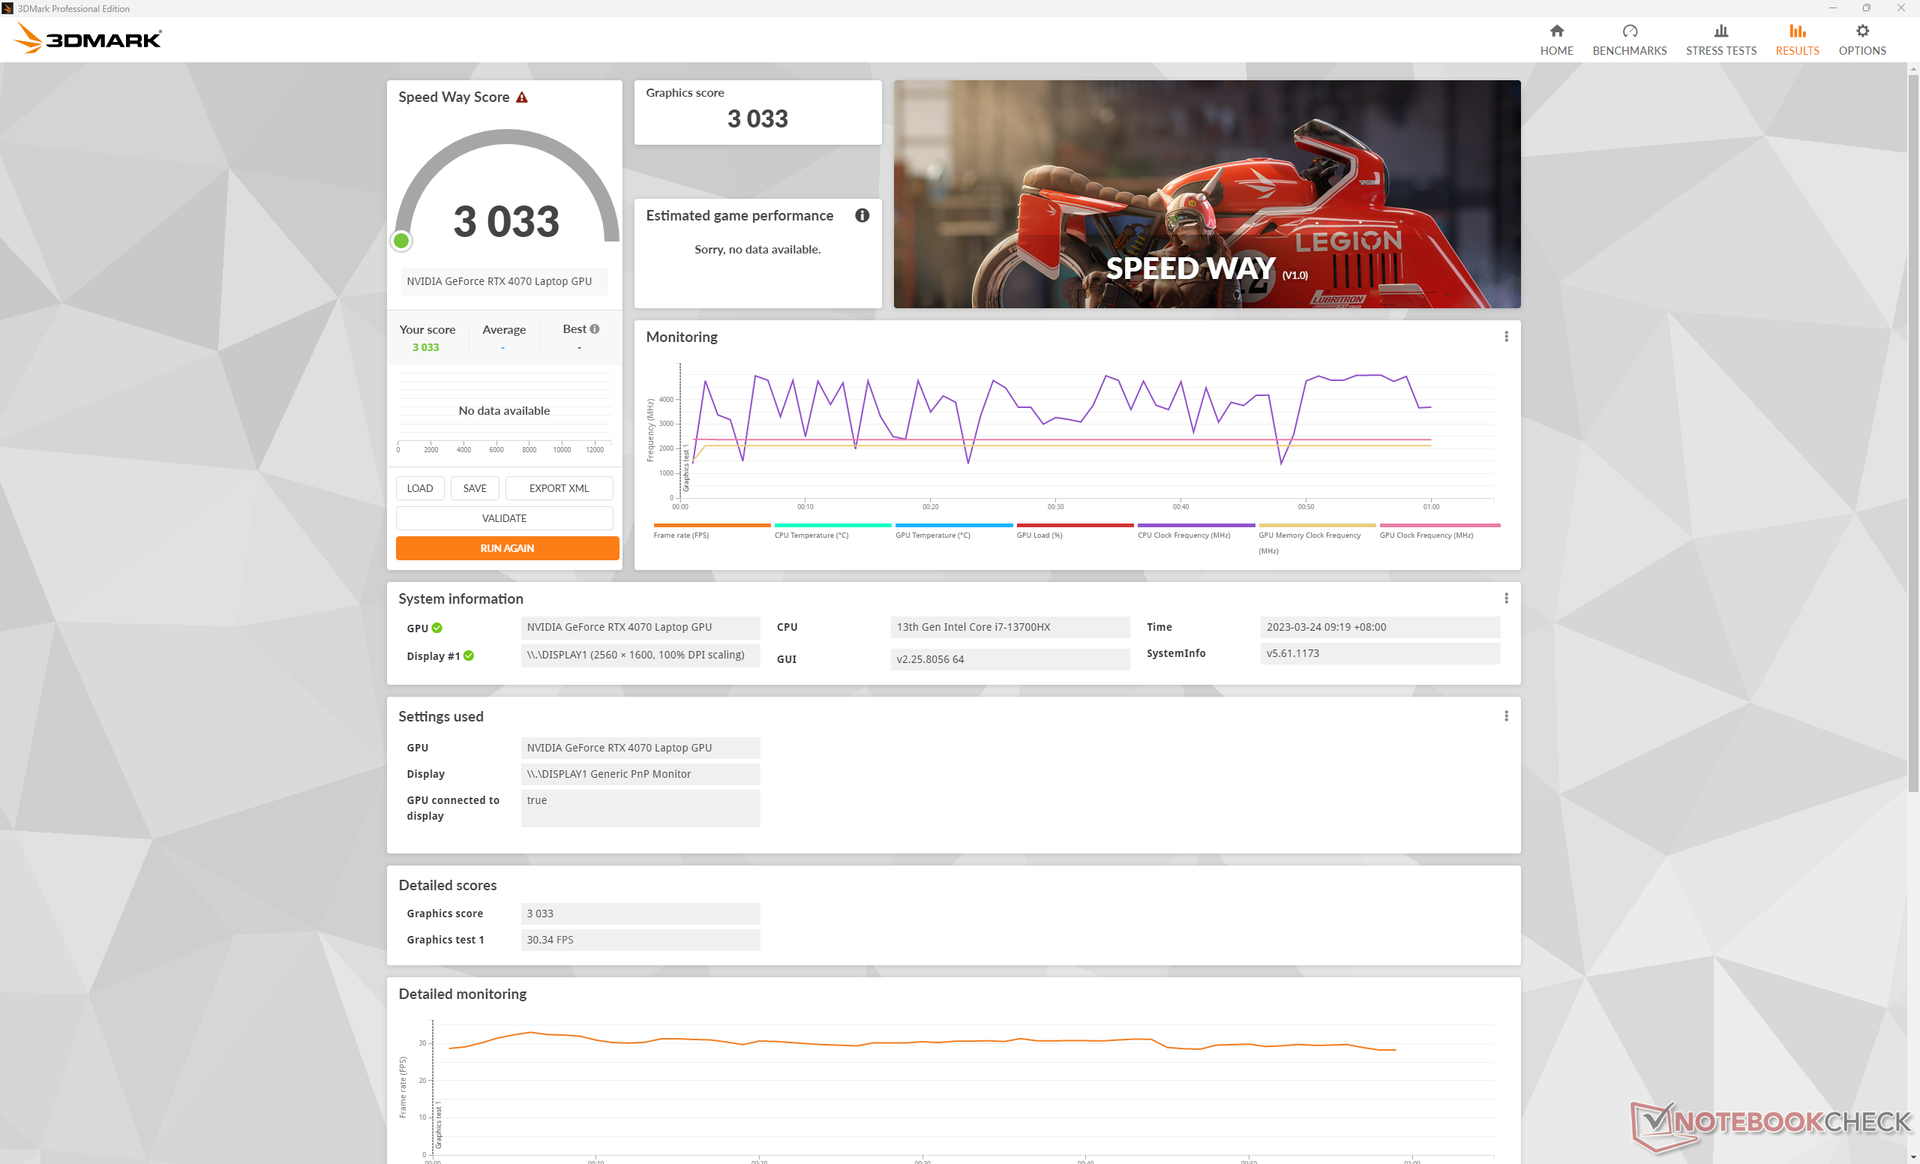
Na een handvol GeForce RTX 4060, 4070, 4080 en 4090 laptops tot nu toe, worden de verwachte prestatieverschillen tussen hen duidelijk. Met betrekking tot de 140 W mobiele RTX 4070 kunnen gebruikers verwachten dat deze 15 tot 20 procent sneller zal presteren dan de mobiele RTX 4060 of ruwweg 30 tot 35 procent langzamer dan de 175 W mobiele RTX 4080. De prestatiekloof tussen de mobiele RTX 4070 en mobiele RTX 4080 is dus veel groter dan de kloof tussen de mobiele RTX 4060 en RTX 4070. Dit kan Nvidia's manier zijn om potentiële kopers aan te moedigen om in plaats daarvan de duurdere 4080- of 4090-configuraties te overwegen.
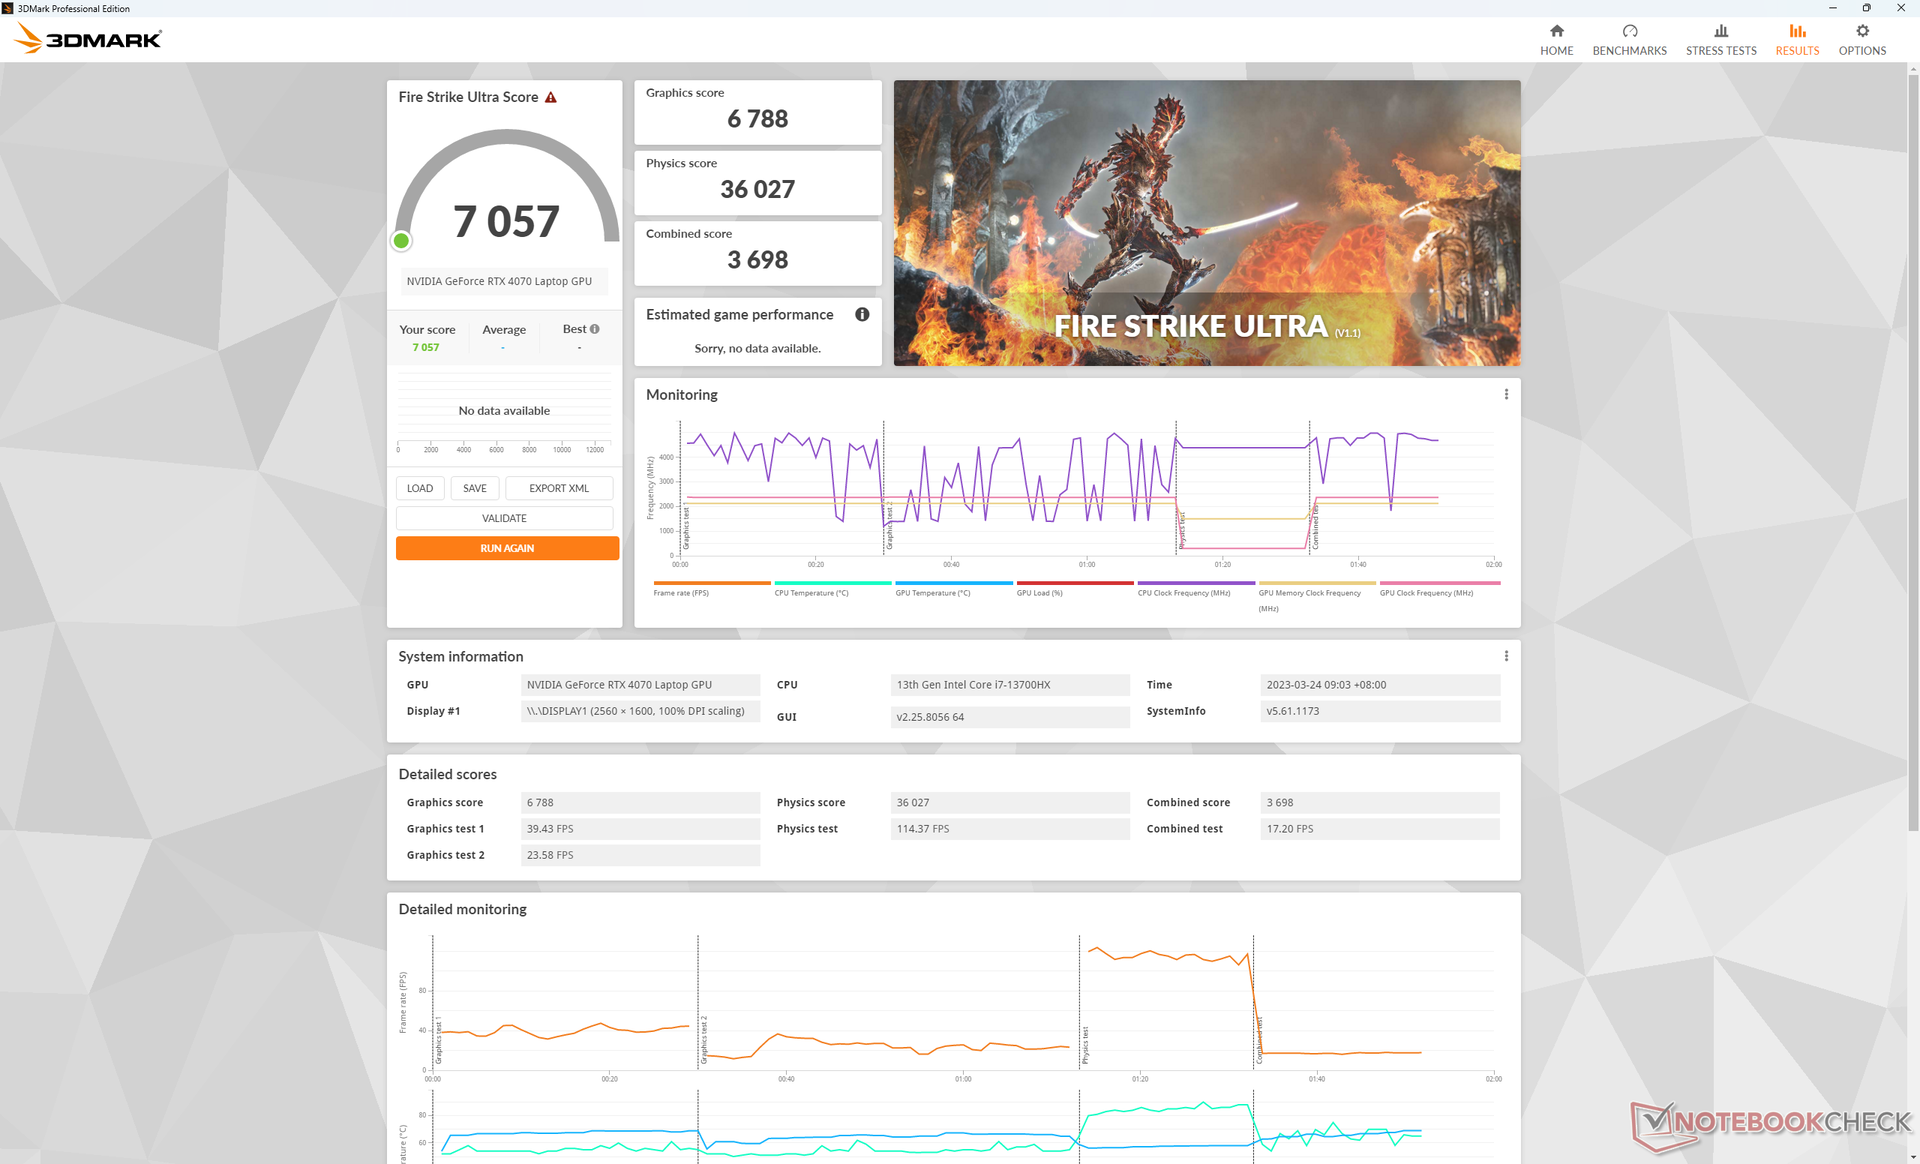
Upgraden van de mobiele RTX 4070 naar de 175 W mobiele RTX 4090 optie verhoogt de ruwe prestaties met ongeveer 55 tot 80 procent. Extreem veeleisende games op 4K zoals Cyberpunk 2077 of F1 22 draaien niet goed op de mobiele RTX 4070, tenzij als DLSS of frame generatie worden ondersteund.
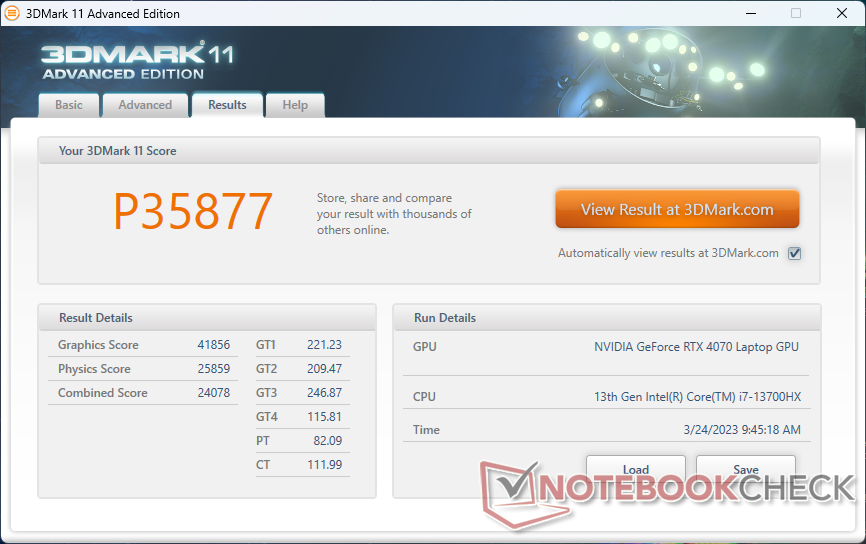
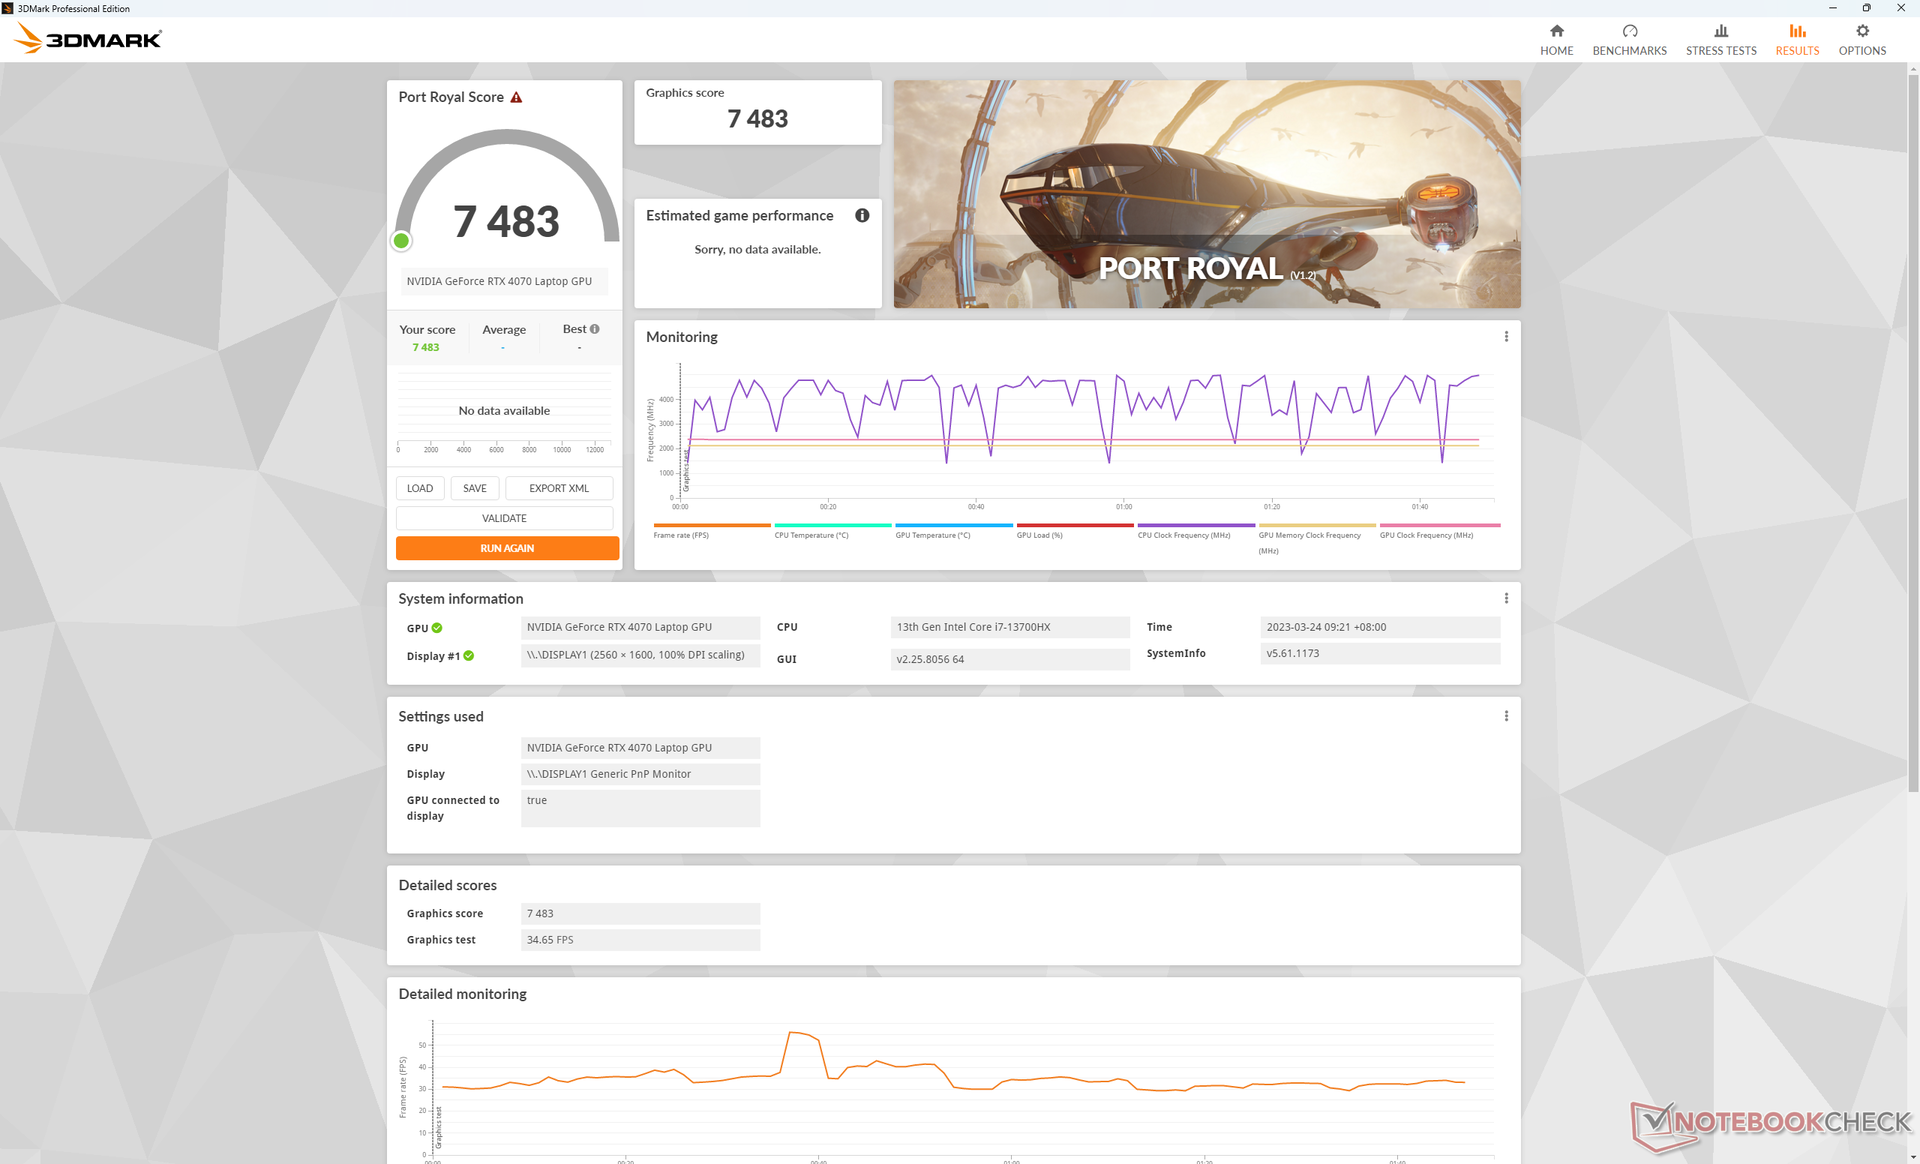
| 3DMark 11 Performance | 35877 punten | |
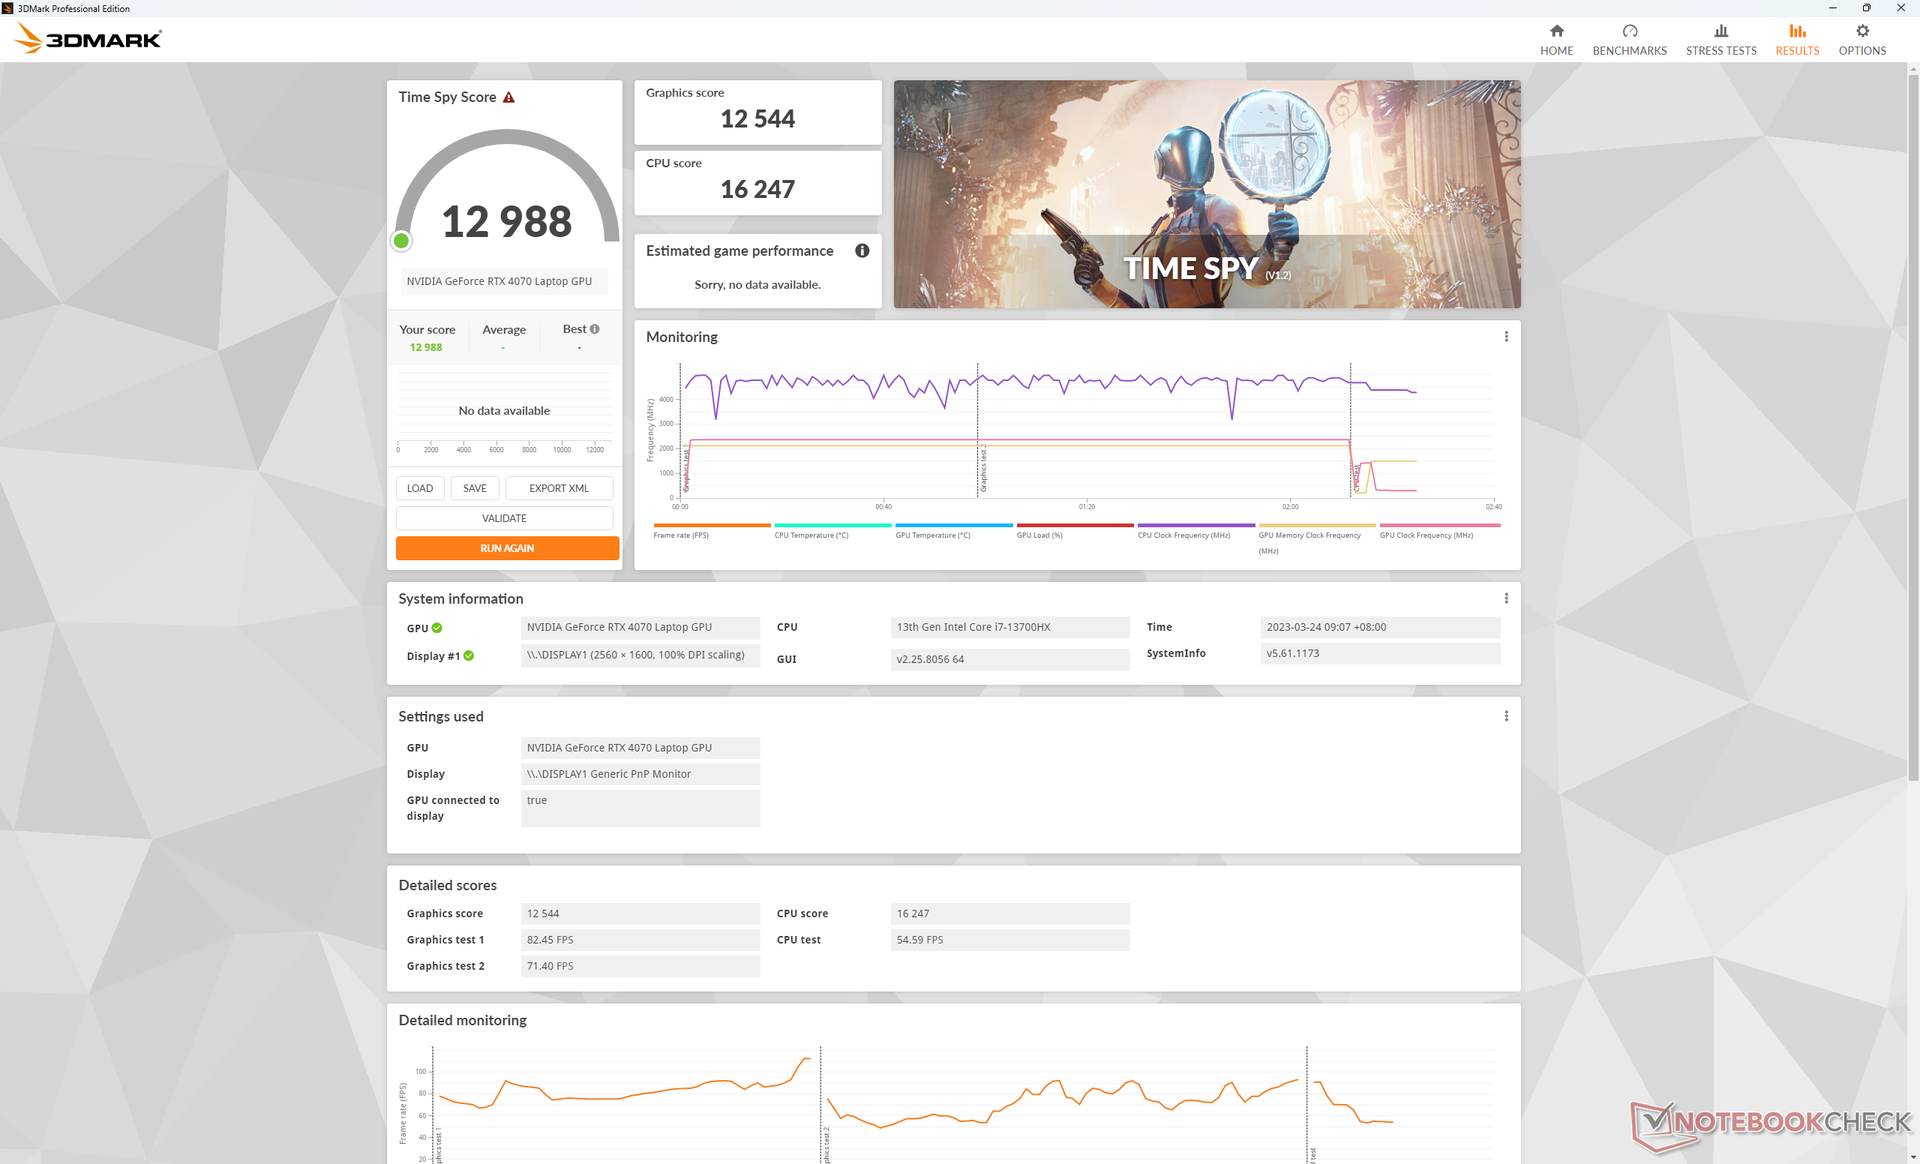
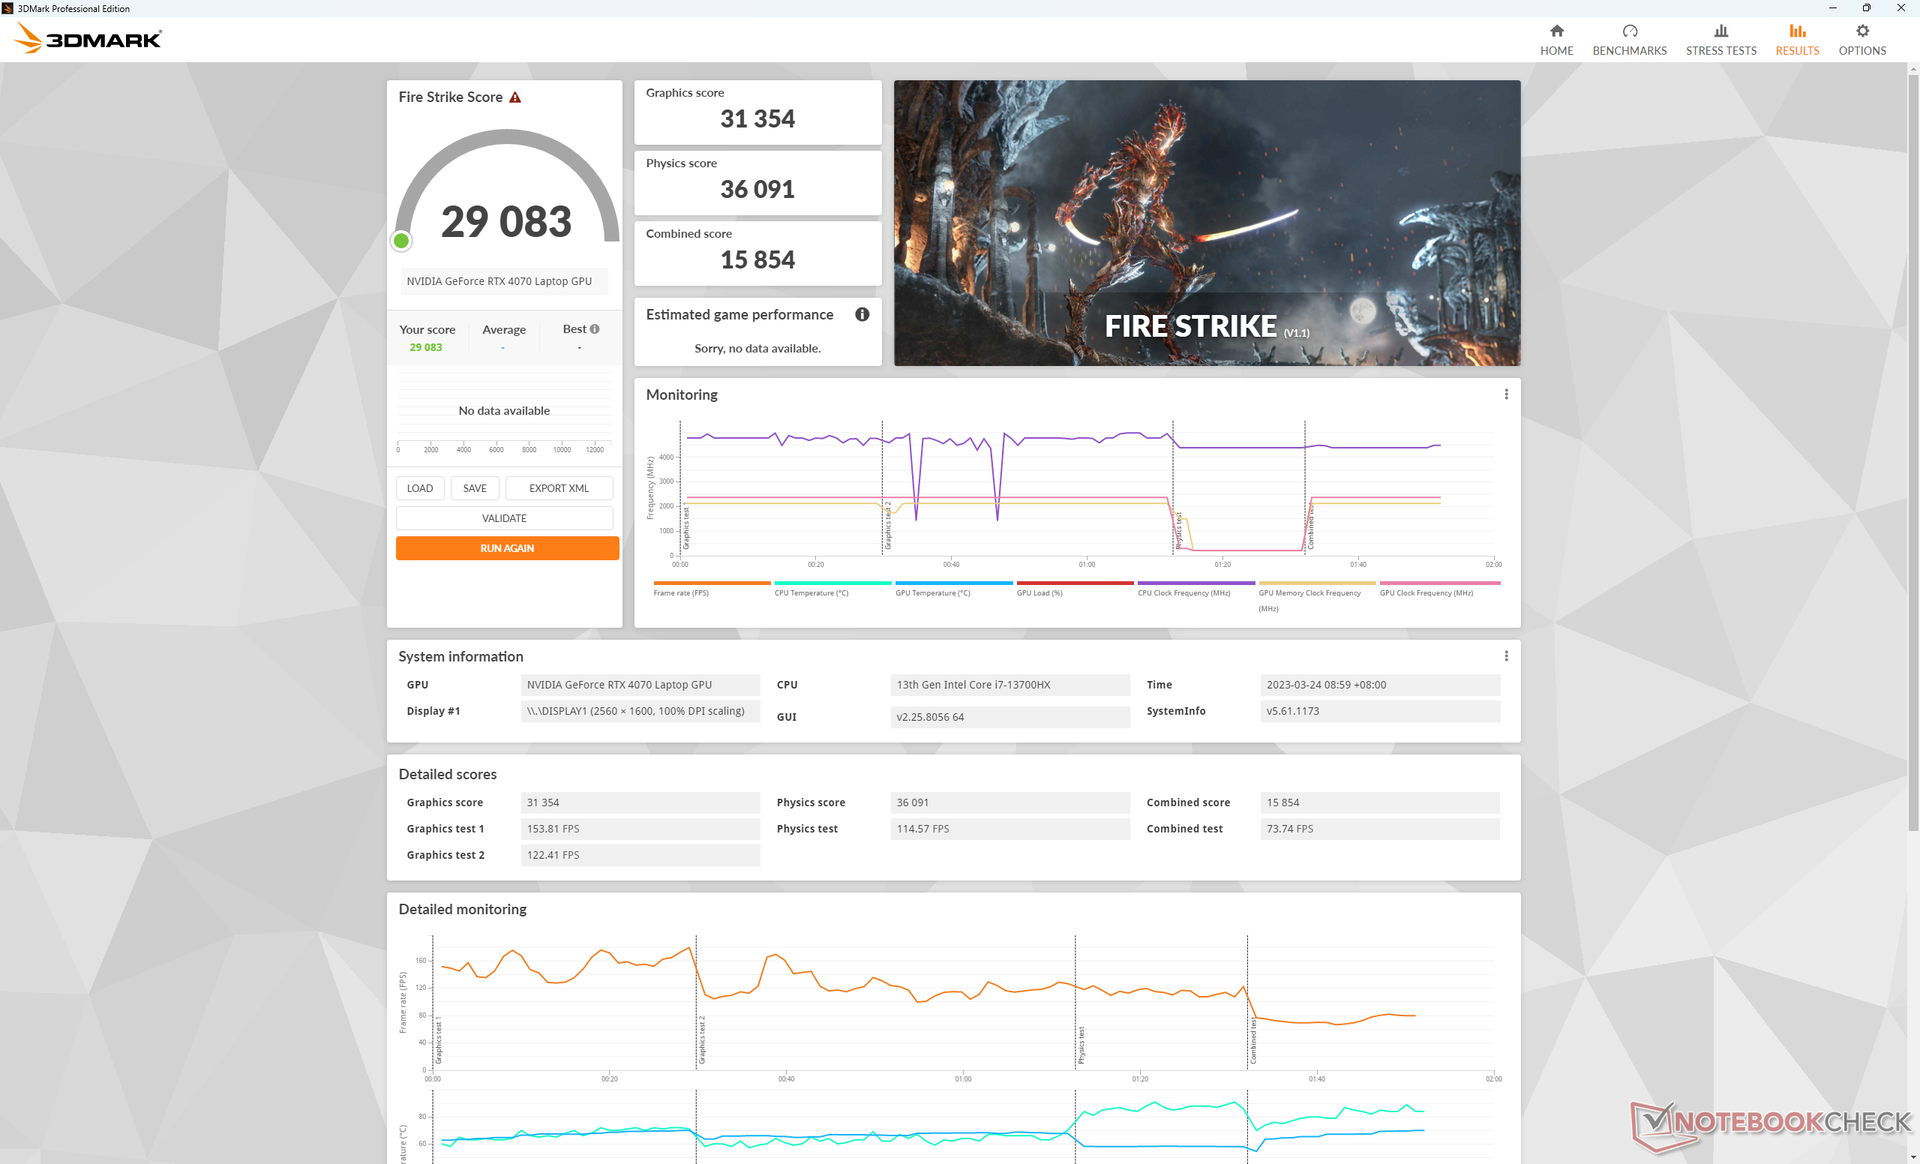
| 3DMark Fire Strike Score | 29083 punten | |
| 3DMark Time Spy Score | 12988 punten | |
Help | ||
* ... kleiner is beter
Witcher 3 FPS Chart
| lage | gem. | hoge | ultra | QHD | 4K | |
|---|---|---|---|---|---|---|
| GTA V (2015) | 187 | 186.9 | 183.1 | 124.8 | 93.1 | 93.6 |
| The Witcher 3 (2015) | 606.3 | 430.3 | 260.5 | 123.2 | 78.8 | |
| Dota 2 Reborn (2015) | 213 | 187.9 | 187.2 | 170.2 | 146.6 | |
| Final Fantasy XV Benchmark (2018) | 227 | 177.3 | 121.2 | 88.6 | 48.8 | |
| X-Plane 11.11 (2018) | 189.4 | 165.6 | 129.2 | 109.2 | ||
| Strange Brigade (2018) | 567 | 332 | 255 | 217 | 143.3 | 75.3 |
| Cyberpunk 2077 1.6 (2022) | 182.8 | 152.9 | 115.1 | 93.6 | 55.6 | 24.4 |
| F1 22 (2022) | 310 | 306 | 231 | 83.1 | 53.8 | 26.5 |
Emissies
Systeemgeluid
Het geluid van de ventilator is afhankelijk van het energieprofiel en de GPU-instelling. In de discrete GPU-modus is het geluid van de ventilator bijvoorbeeld 29 dB(A) bij stationair draaien tegen een stille achtergrond van 22,4 dB(A). Ter vergelijking: in de Optimus-modus is het geluid van de ventilator veel stiller met slechts 22,9 dB(A). Daarom zul je het systeem in de Optimus modus willen houden voor niet veeleisende taken zoals surfen op het web of video streamen.
Het draaien van Witcher 3 in de modus Prestaties met de dGPU actief zou resulteren in een ventilatorgeluid van iets minder dan 49 dB(A), wat stiller is dan op veel andere 16-inch gaming laptops, waaronder de dikkere RTX 4090-aangedreven Neo 16 ofLenovo Legion Pro 7 16. Niettemin kan het ventilatorgeluid nog steeds een nog luidere 55 dB(A) bereiken als de titel veel veeleisender is.
Geluidsniveau
| Onbelast |
| 22.9 / 29 / 29 dB (A) |
| Belasting |
| 40.2 / 55 dB (A) |
 | ||
30 dB stil 40 dB(A) hoorbaar 50 dB(A) luid |
||
min: | ||
| Uniwill GM6PX7X RTX 4070 GeForce RTX 4070 Laptop GPU, i7-13700HX, Samsung PM9A1 MZVL2512HCJQ | Schenker XMG Neo 16 E23 GeForce RTX 4090 Laptop GPU, i9-13900HX, Crucial P5 Plus 1TB CT1000P5PSSD8 | Asus ROG Strix G16 G614JZ GeForce RTX 4080 Laptop GPU, i9-13980HX, WD PC SN560 SDDPNQE-1T00 | Lenovo Legion Pro 7 16IRX8H GeForce RTX 4080 Laptop GPU, i9-13900HX, Samsung PM9A1 MZVL21T0HCLR | Gigabyte AERO 16 OLED BSF GeForce RTX 4070 Laptop GPU, i9-13900H, Gigabyte AG470S1TB-SI B10 | Razer Blade 16 Early 2023 GeForce RTX 4080 Laptop GPU, i9-13950HX, SSSTC CA6-8D1024 | |
|---|---|---|---|---|---|---|
| Noise | -25% | -6% | -10% | -6% | 6% | |
| uit / omgeving * (dB) | 22.4 | 25 -12% | 25 -12% | 24 -7% | 23 -3% | 23 -3% |
| Idle Minimum * (dB) | 22.9 | 31 -35% | 26 -14% | 26 -14% | 23 -0% | 23 -0% |
| Idle Average * (dB) | 29 | 33 -14% | 28 3% | 28 3% | 23 21% | 23 21% |
| Idle Maximum * (dB) | 29 | 42 -45% | 30 -3% | 34 -17% | 33.64 -16% | 23.6 19% |
| Load Average * (dB) | 40.2 | 58 -44% | 48 -19% | 47 -17% | 51.49 -28% | 39 3% |
| Witcher 3 ultra * (dB) | 48.7 | 57 -17% | 49 -1% | 55 -13% | 55.27 -13% | 51.6 -6% |
| Load Maximum * (dB) | 55 | 59 -7% | 52 5% | 56 -2% | 55.24 -0% | 51.3 7% |
* ... kleiner is beter
Temperatuur
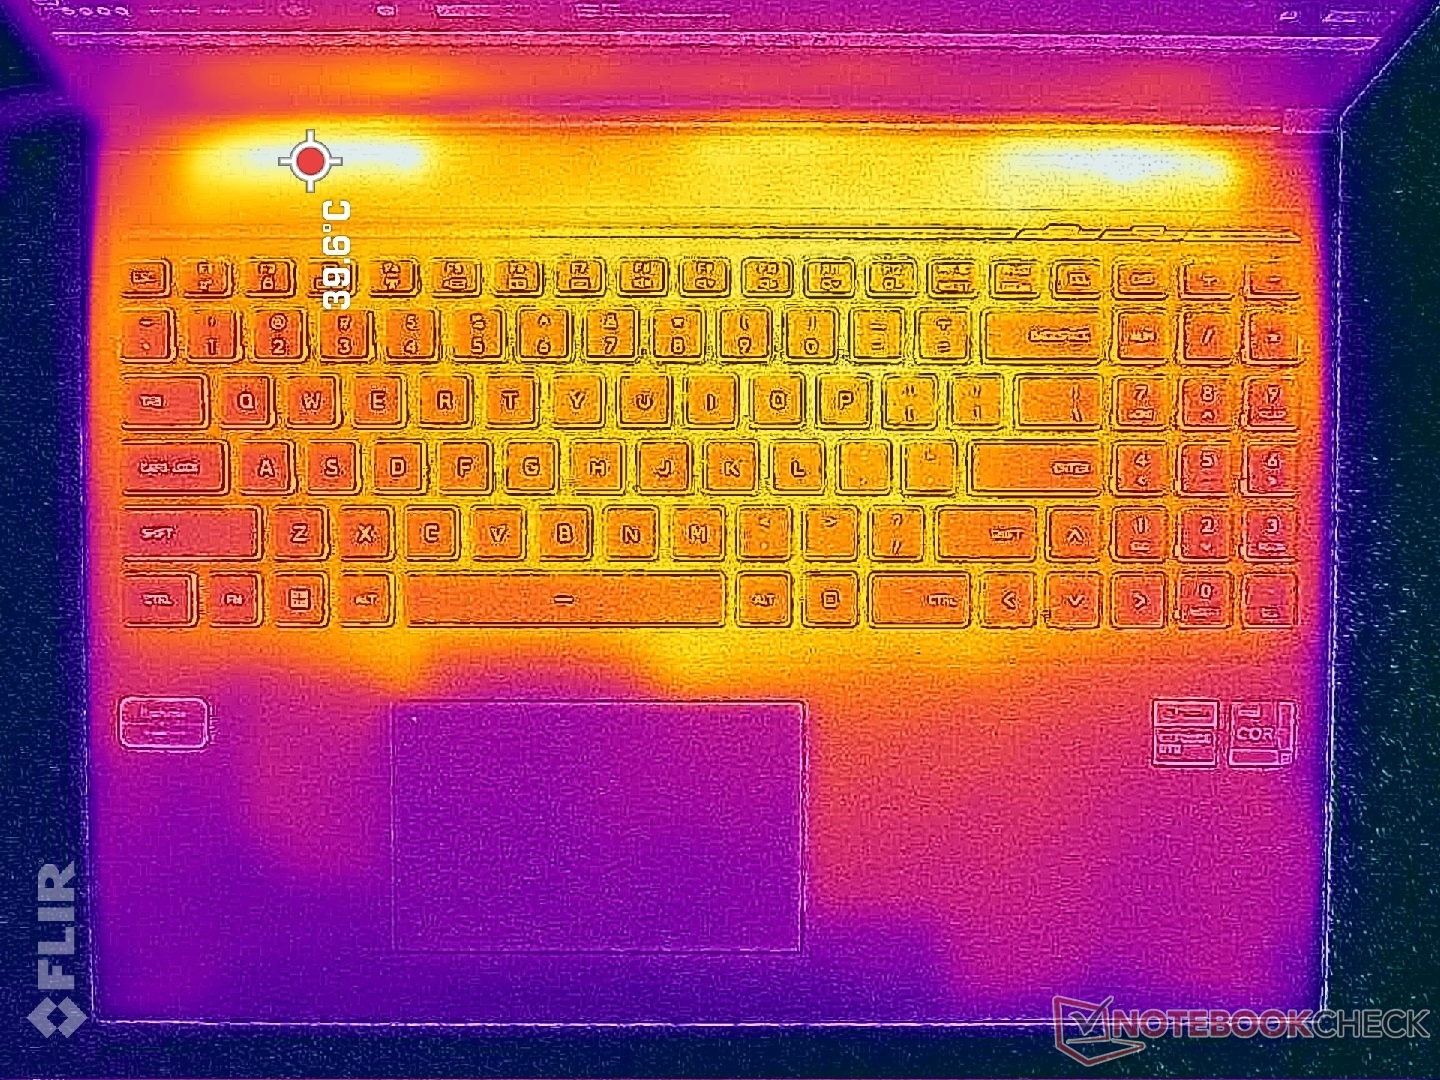
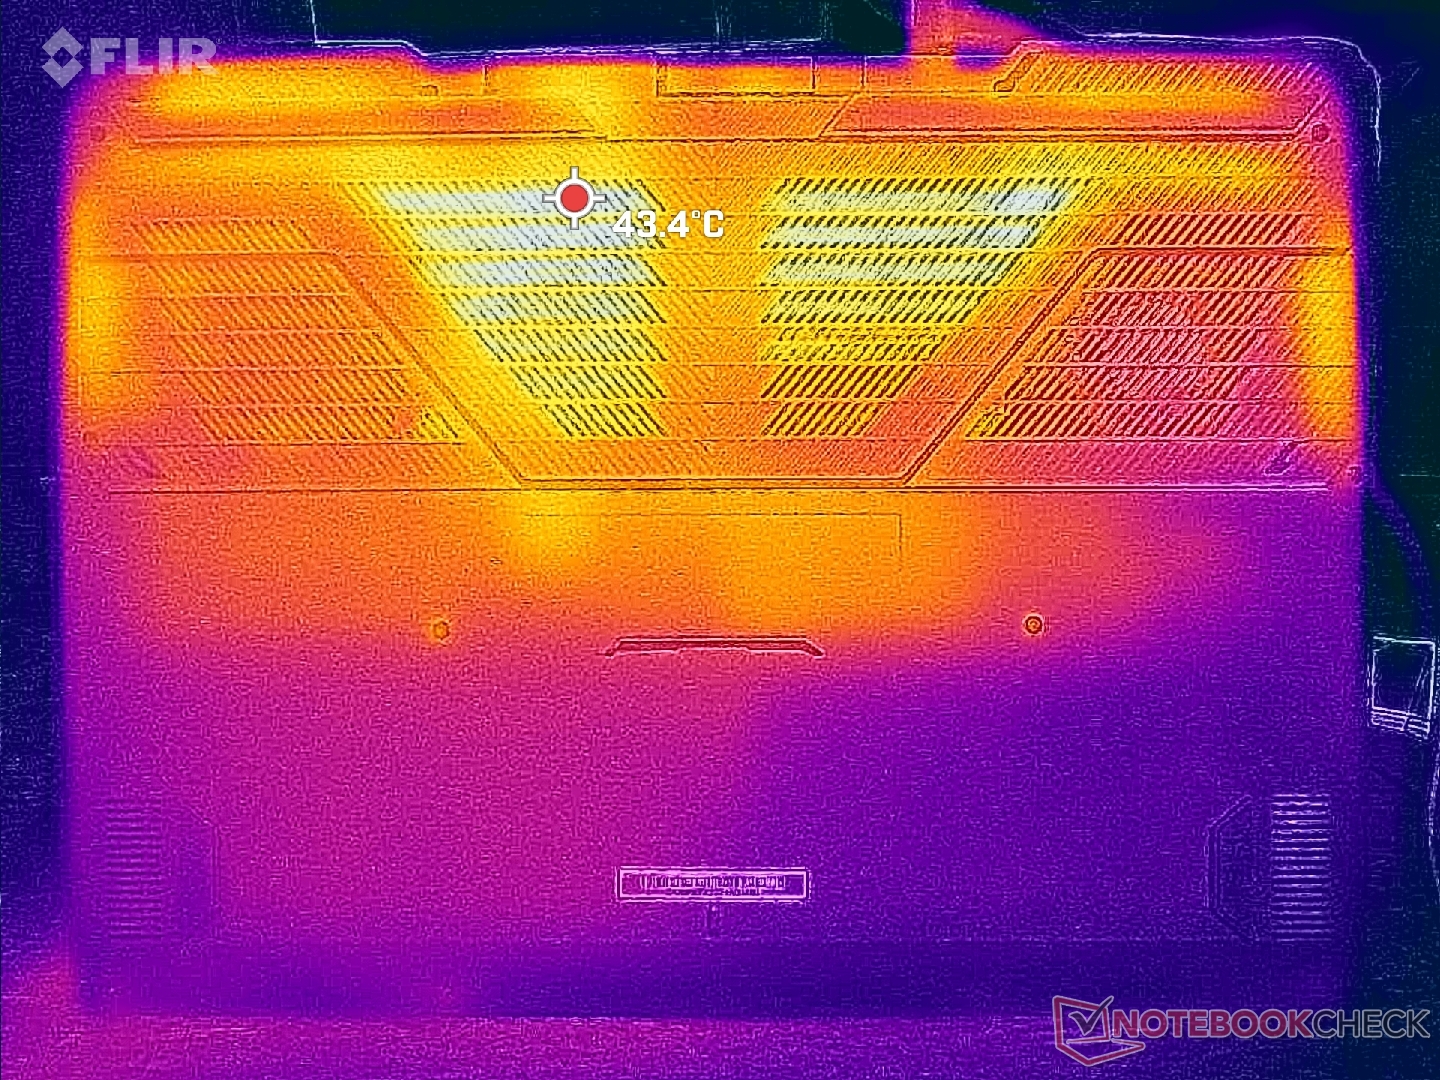
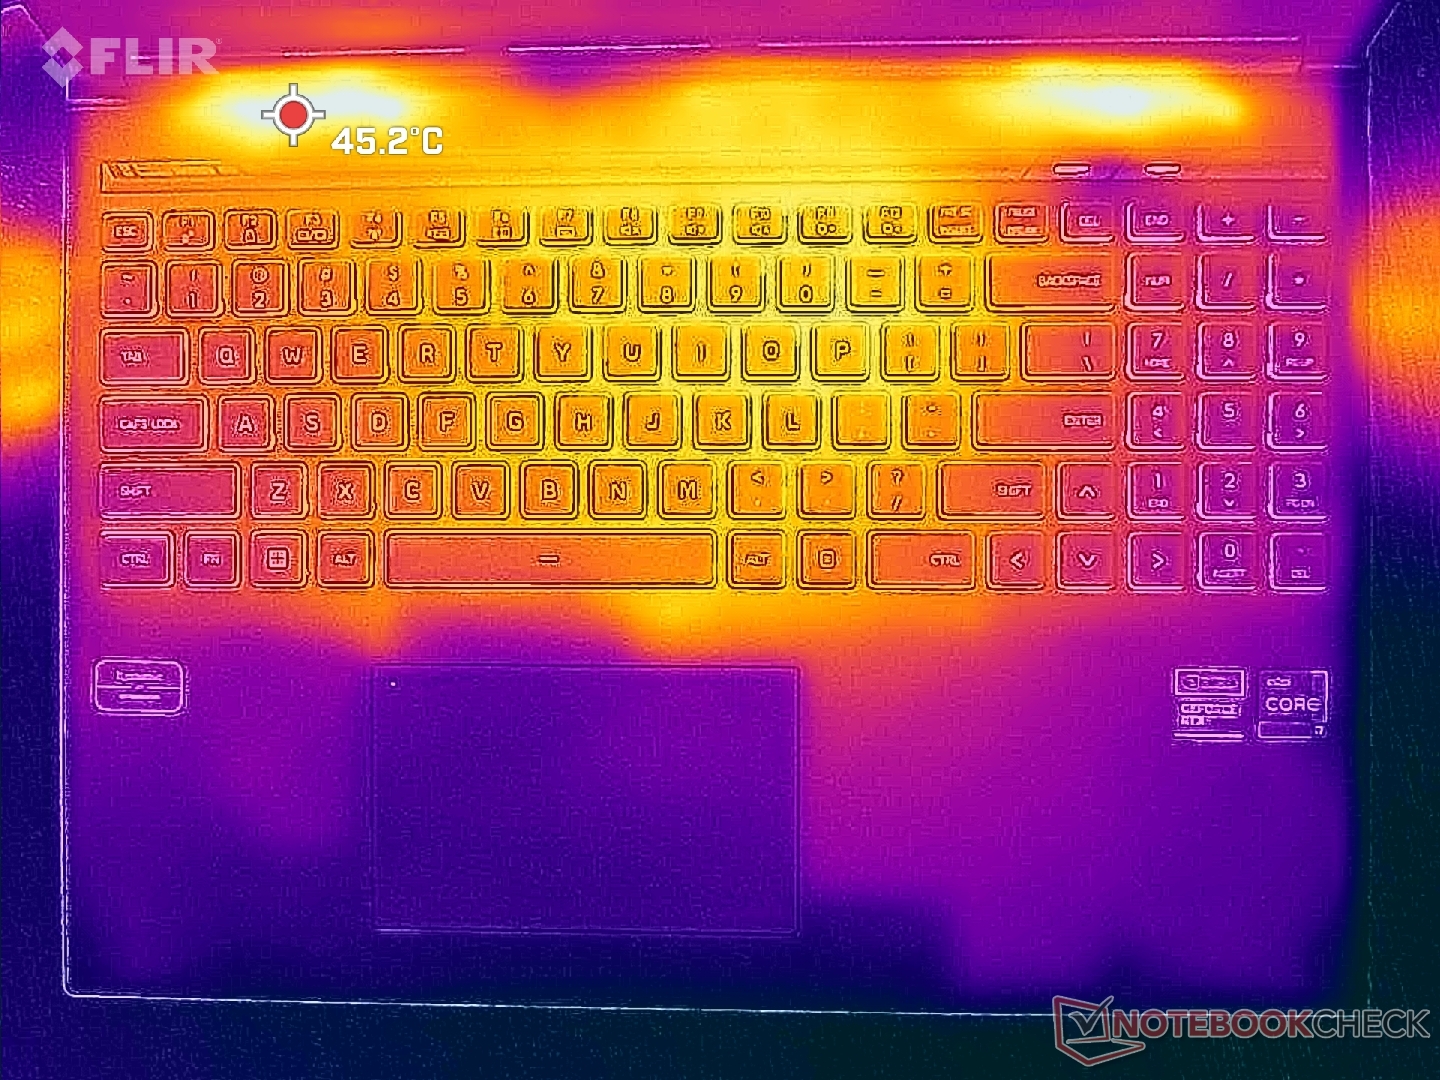
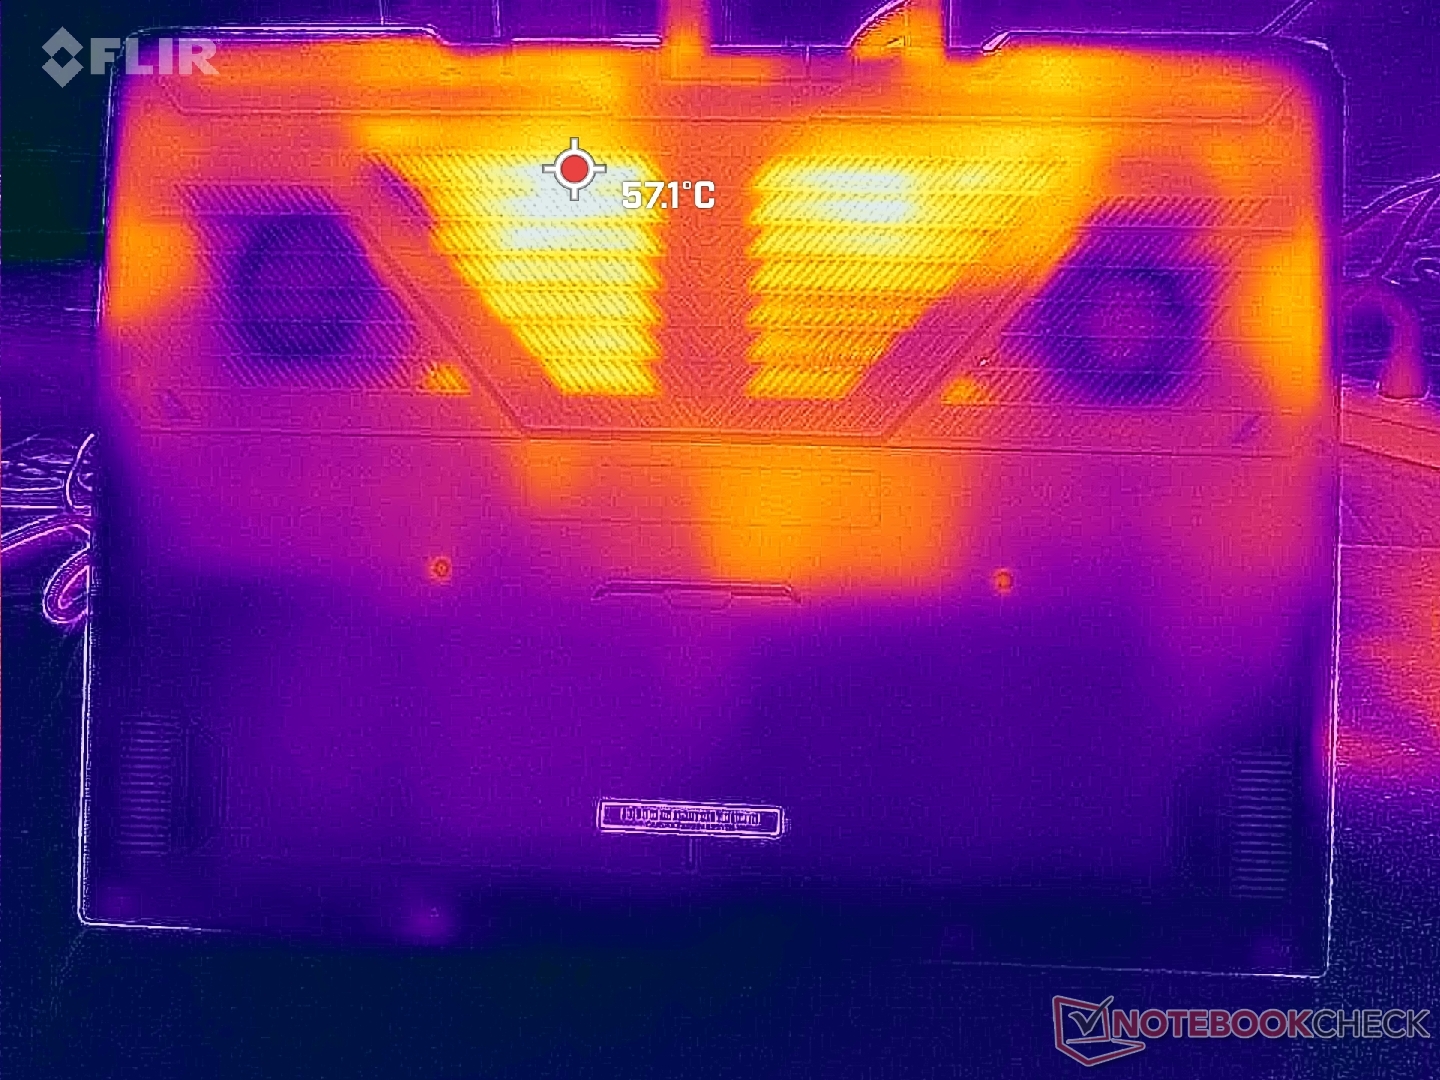
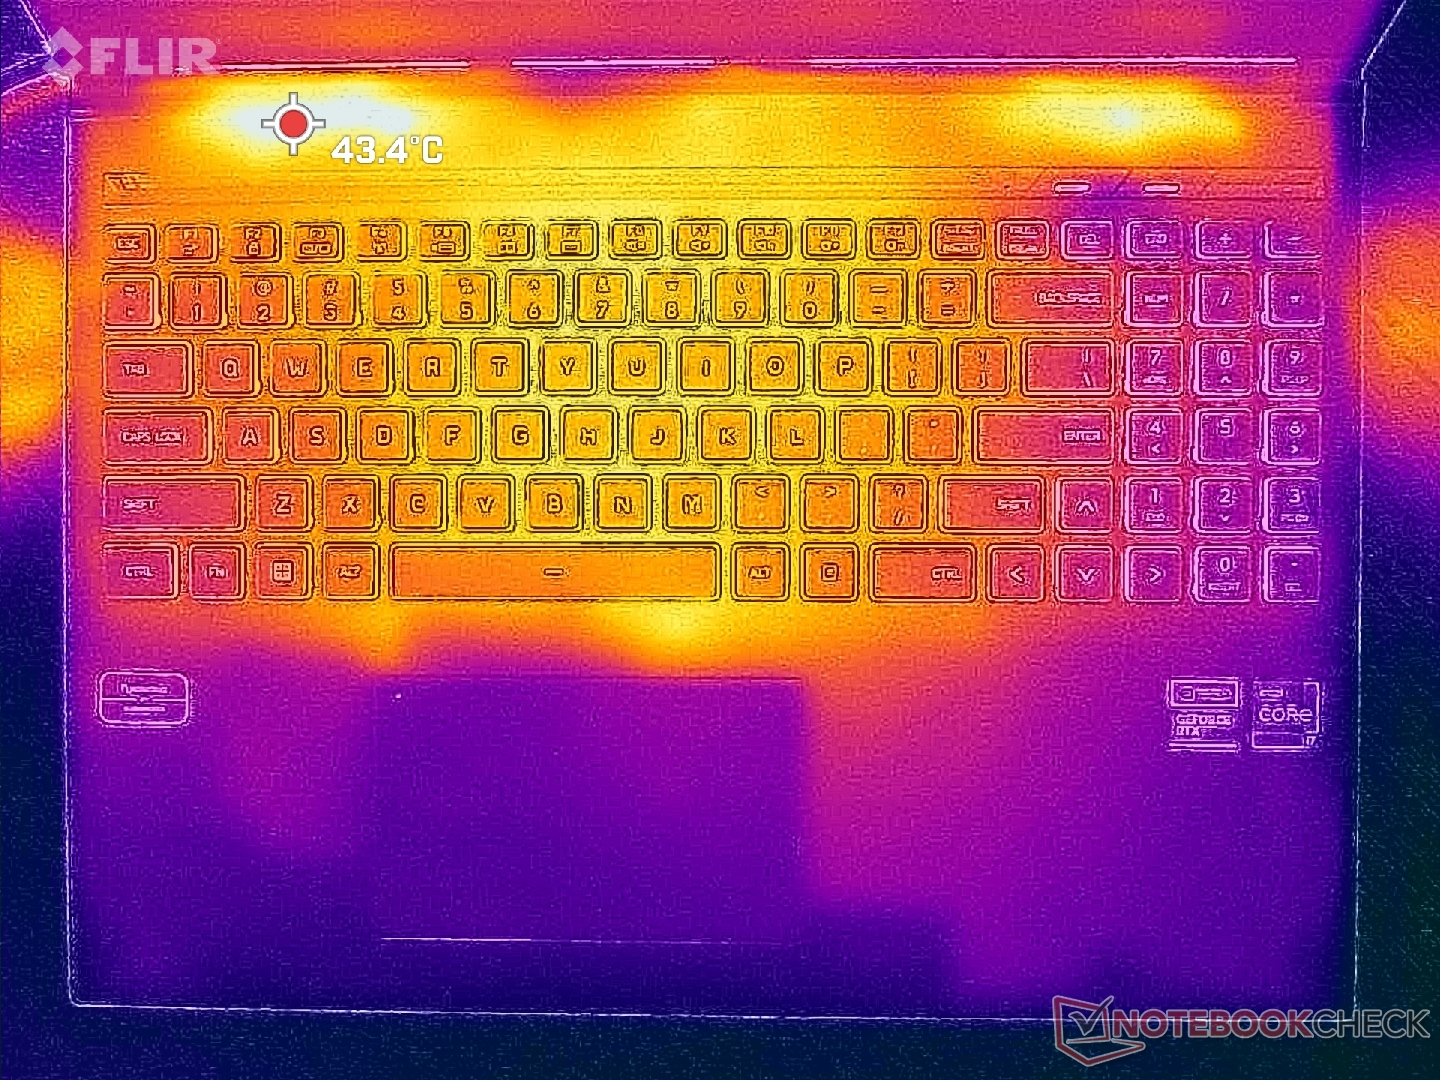
De oppervlaktetemperaturen tijdens het gamen zijn relatief koel in vergelijking met andere 16-inch gaming laptops. DeAsus ROG Strix G16kan bijvoorbeeld meer dan 54 C bereiken, terwijl de hete plekken op de Uniwill uitkomen op 40 C aan de bovenkant en 45 C aan de onderkant. De temperaturen zijn koeler dan op de RTX 4090-aangedreven Neo 16 met een paar graden C ook bij vergelijkbare gaming belastingen.
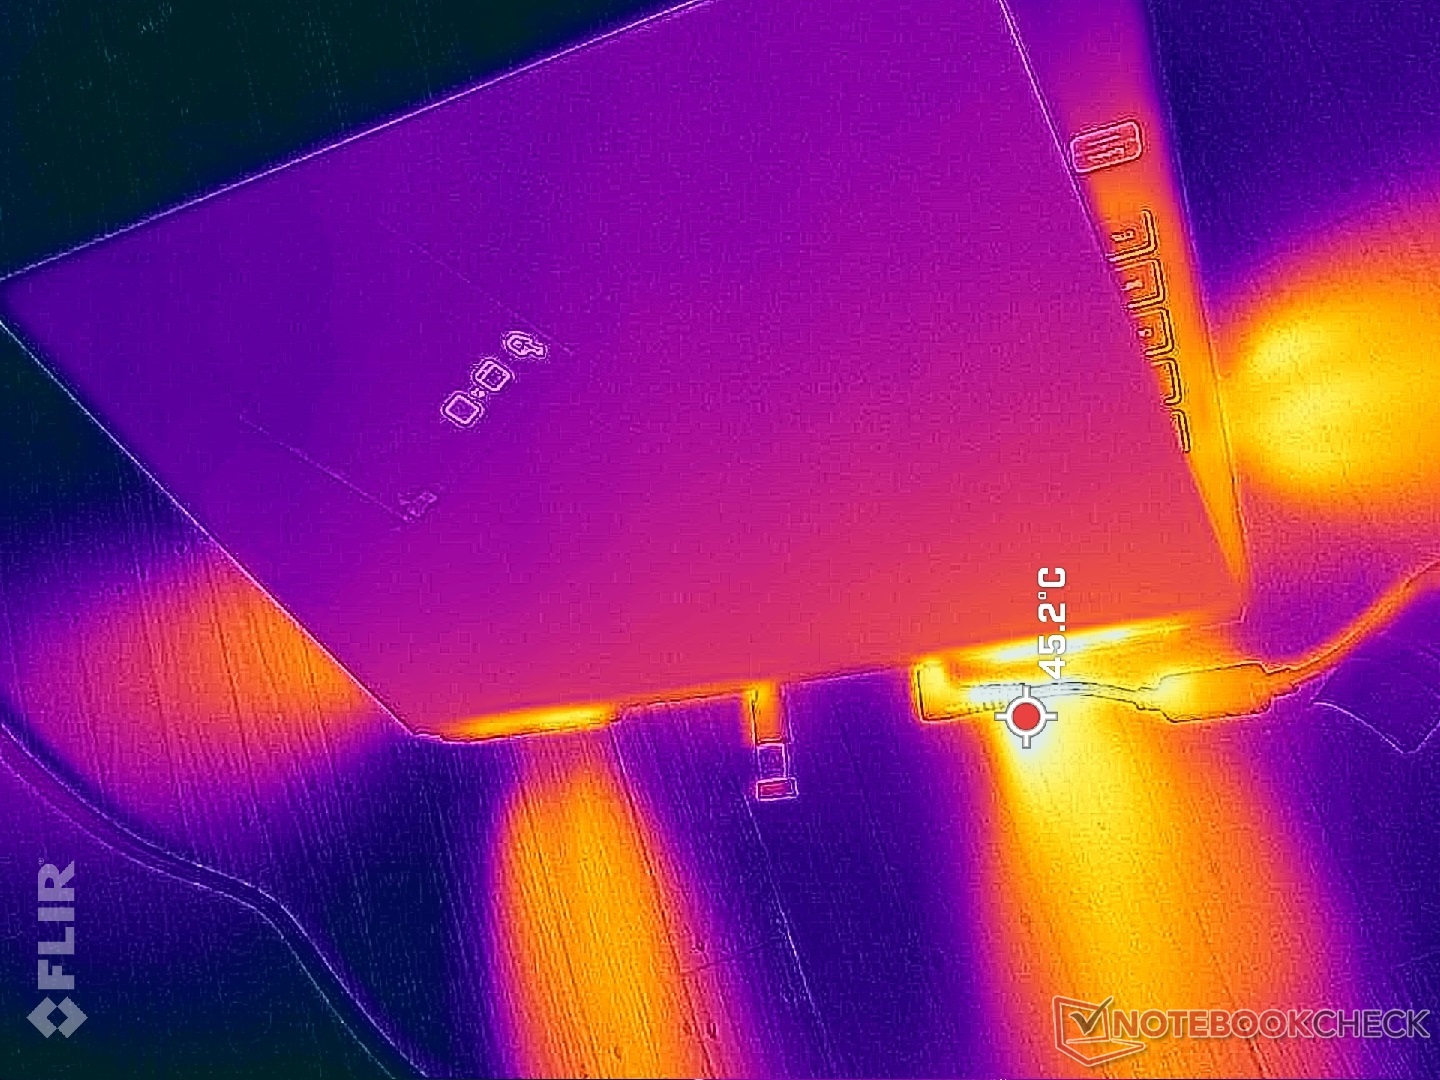
(+) De maximumtemperatuur aan de bovenzijde bedraagt 38.2 °C / 101 F, vergeleken met het gemiddelde van 40.4 °C / 105 F, variërend van 21.2 tot 68.8 °C voor de klasse Gaming.
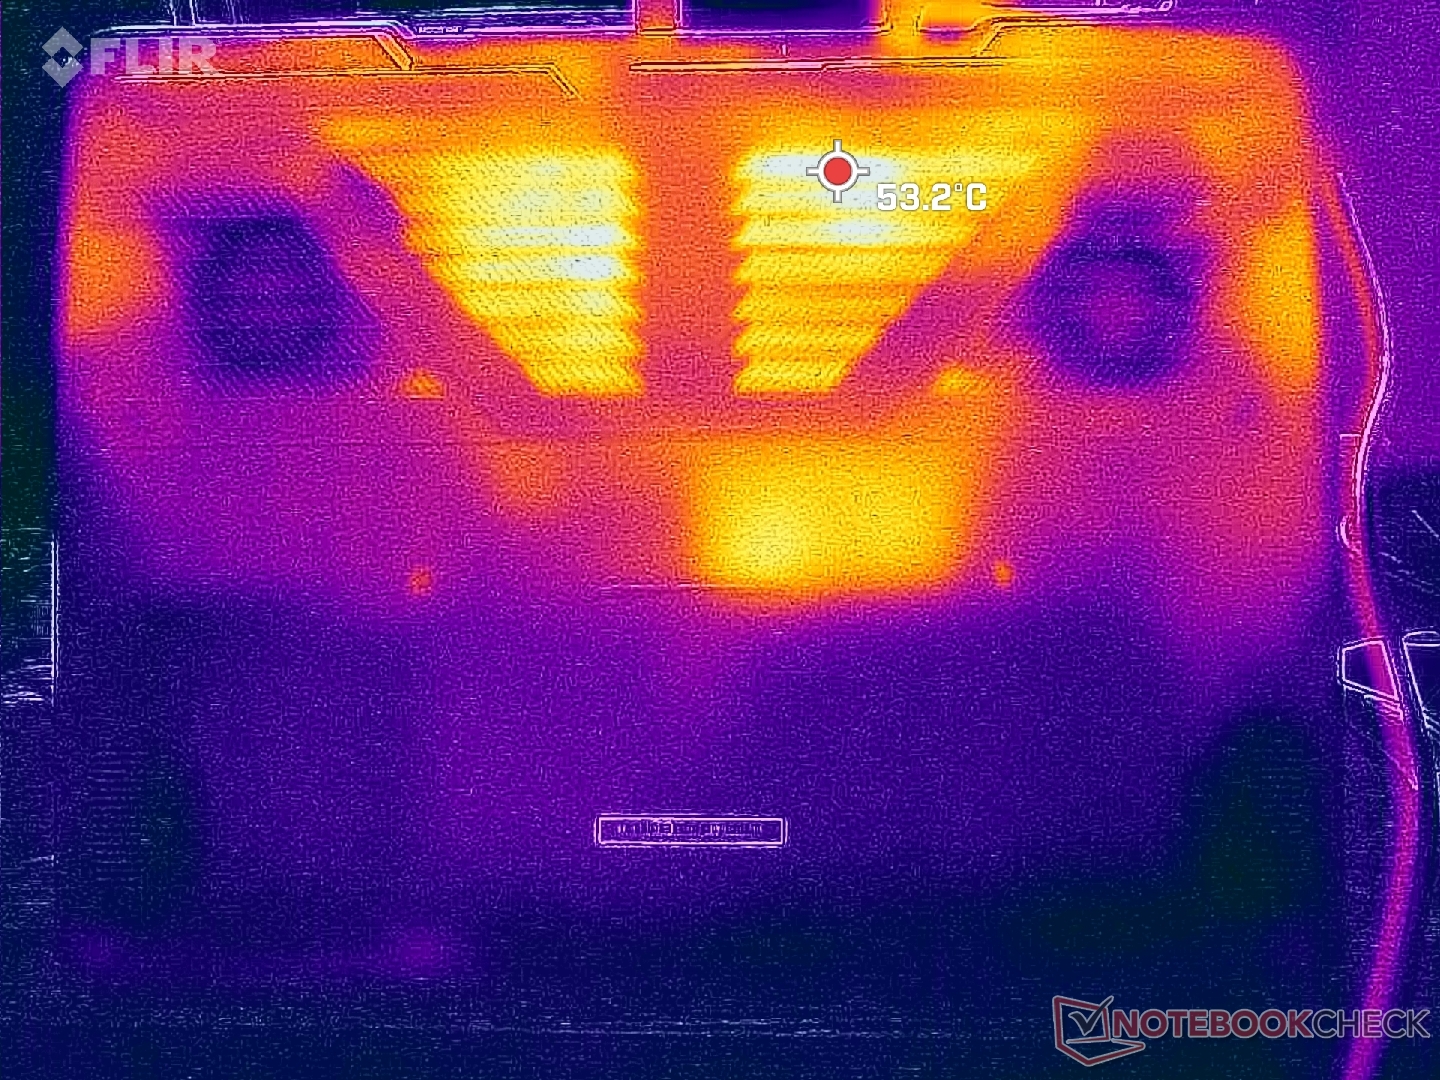
(±) De bodem warmt op tot een maximum van 45 °C / 113 F, vergeleken met een gemiddelde van 43.2 °C / 110 F
(+) Bij onbelast gebruik bedraagt de gemiddelde temperatuur voor de bovenzijde 28.9 °C / 84 F, vergeleken met het apparaatgemiddelde van 33.9 °C / 93 F.
(±) Bij het spelen van The Witcher 3 is de gemiddelde temperatuur voor de bovenzijde 32.7 °C / 91 F, vergeleken met het apparaatgemiddelde van 33.9 °C / 93 F.
(+) De palmsteunen en het touchpad zijn met een maximum van ###max## °C / 79.5 F koeler dan de huidtemperatuur en voelen daarom koel aan.
(+) De gemiddelde temperatuur van de handpalmsteun van soortgelijke toestellen bedroeg 28.8 °C / 83.8 F (+2.4 °C / 4.3 F).
| Uniwill GM6PX7X RTX 4070 Intel Core i7-13700HX, NVIDIA GeForce RTX 4070 Laptop GPU | Schenker XMG Neo 16 E23 Intel Core i9-13900HX, NVIDIA GeForce RTX 4090 Laptop GPU | Asus ROG Strix G16 G614JZ Intel Core i9-13980HX, NVIDIA GeForce RTX 4080 Laptop GPU | Lenovo Legion Pro 7 16IRX8H Intel Core i9-13900HX, NVIDIA GeForce RTX 4080 Laptop GPU | Gigabyte AERO 16 OLED BSF Intel Core i9-13900H, NVIDIA GeForce RTX 4070 Laptop GPU | Razer Blade 16 Early 2023 Intel Core i9-13950HX, NVIDIA GeForce RTX 4080 Laptop GPU | |
|---|---|---|---|---|---|---|
| Heat | 2% | -8% | -9% | 16% | 9% | |
| Maximum Upper Side * (°C) | 38.2 | 50 -31% | 54 -41% | 48 -26% | 41 -7% | 40 -5% |
| Maximum Bottom * (°C) | 45 | 51 -13% | 55 -22% | 49 -9% | 47 -4% | 37.6 16% |
| Idle Upper Side * (°C) | 33.6 | 28 17% | 29 14% | 40 -19% | 23 32% | 32.4 4% |
| Idle Bottom * (°C) | 39.6 | 26 34% | 33 17% | 33 17% | 23 42% | 31.4 21% |
* ... kleiner is beter
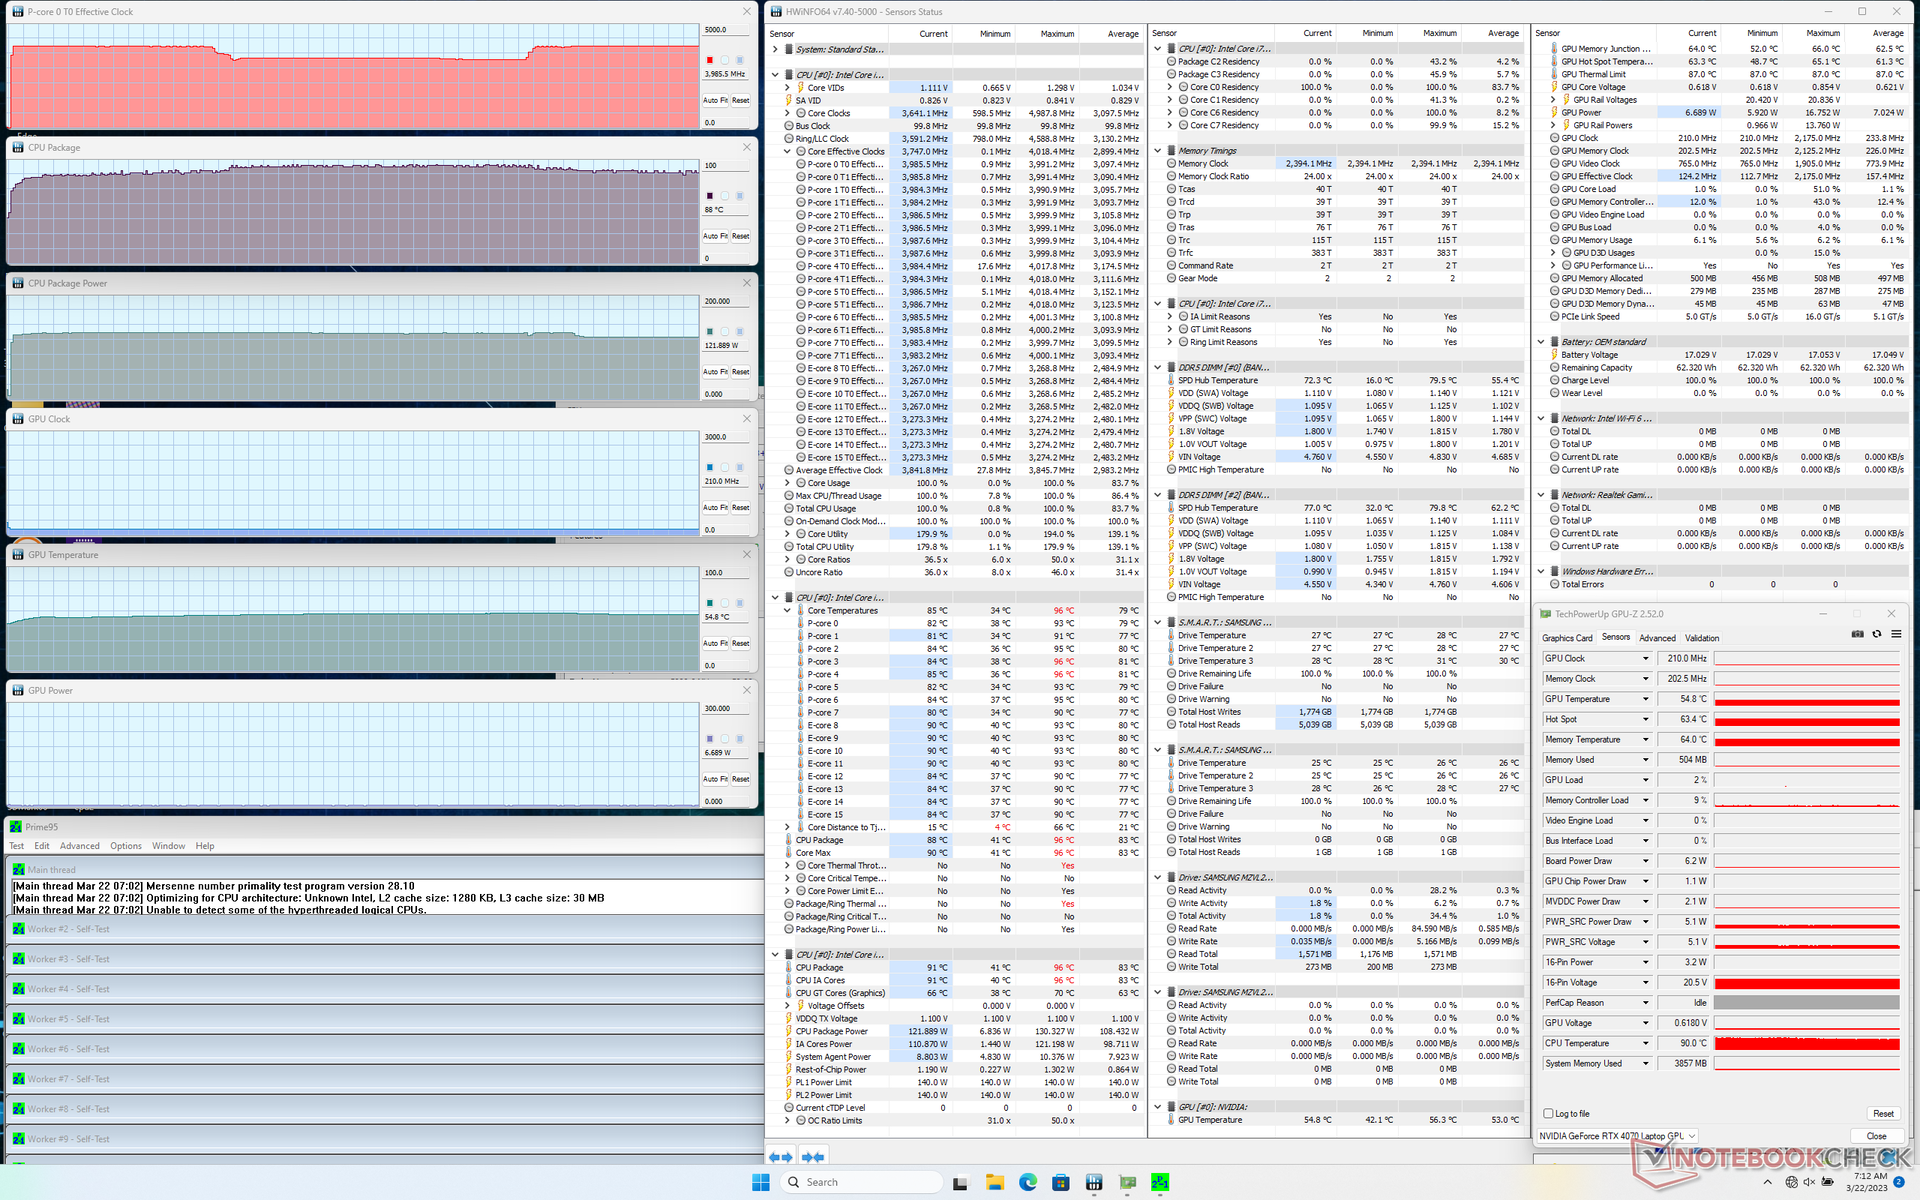
Stresstest
Bij belasting onder Prime95 steeg de CPU tot 4 GHz en 130 W, alleen gedurende de eerste minuten. Daarna dalen de kloksnelheden en het opgenomen vermogen tot respectievelijk 3,4 GHz en 122 W. De kerntemperatuur schommelt rond de 90 C, wat zelfs voor een gaming laptop erg warm is. Deze zelfde test uitvoeren op de Razer Blade 16, bijvoorbeeld, zou resulteren in een CPU-temperatuur veel dichter bij 80 C.
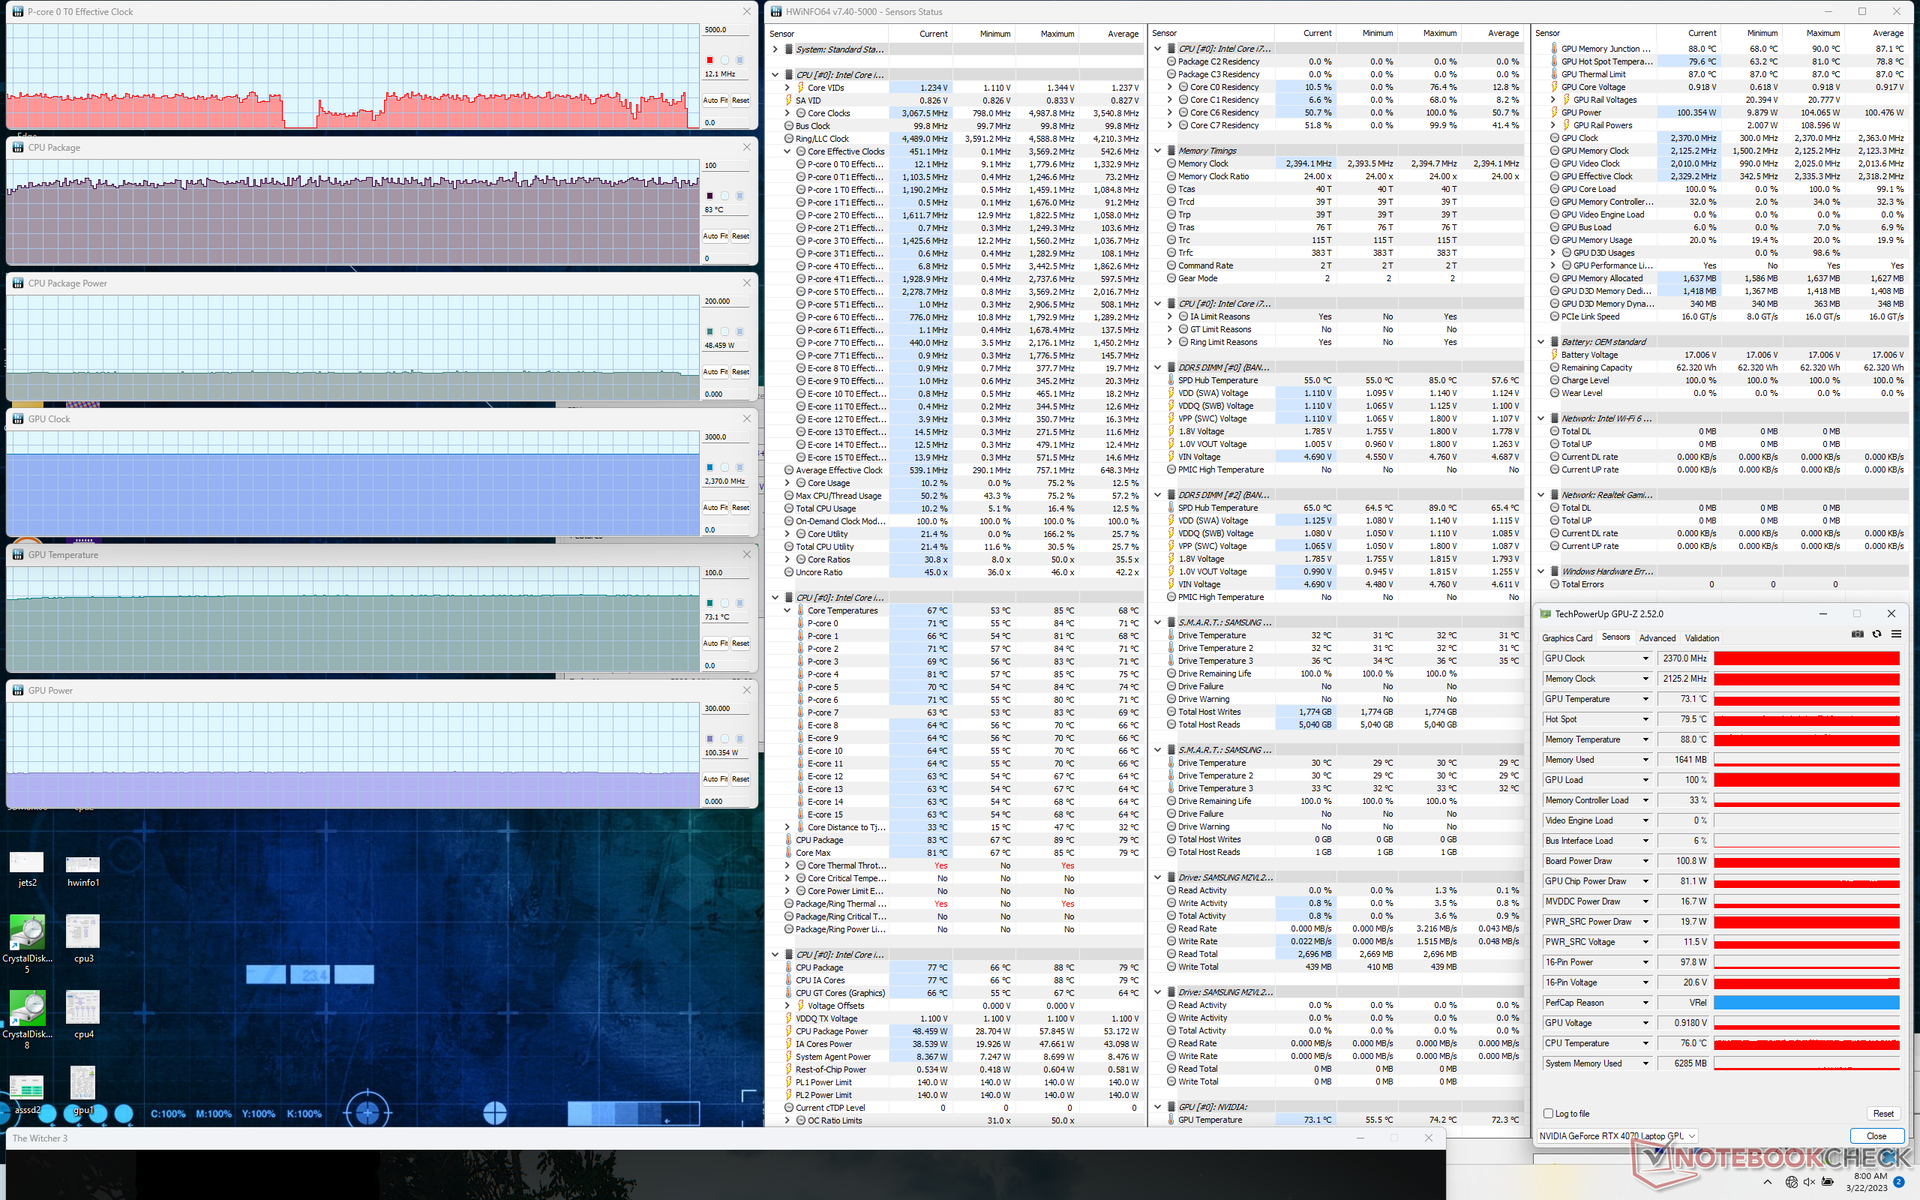
CPU en GPU temperatuur bij het uitvoeren van Witcher 3 zou stabiliseren op 83 C en 73 C, respectievelijk, vergeleken met 78 C elk op de Blade 16. Het stroomverbruik van de GPU zou zich stabiliseren op slechts 100 W, vergeleken met de 140 W van TGP.
Werken op batterijen beperkt de prestaties zoals verwacht. Een Fire Strike test op batterijen levert Physics en Graphics scores op van respectievelijk 9314 en 11777 punten, vergeleken met 36091 en 31354 punten op netstroom.
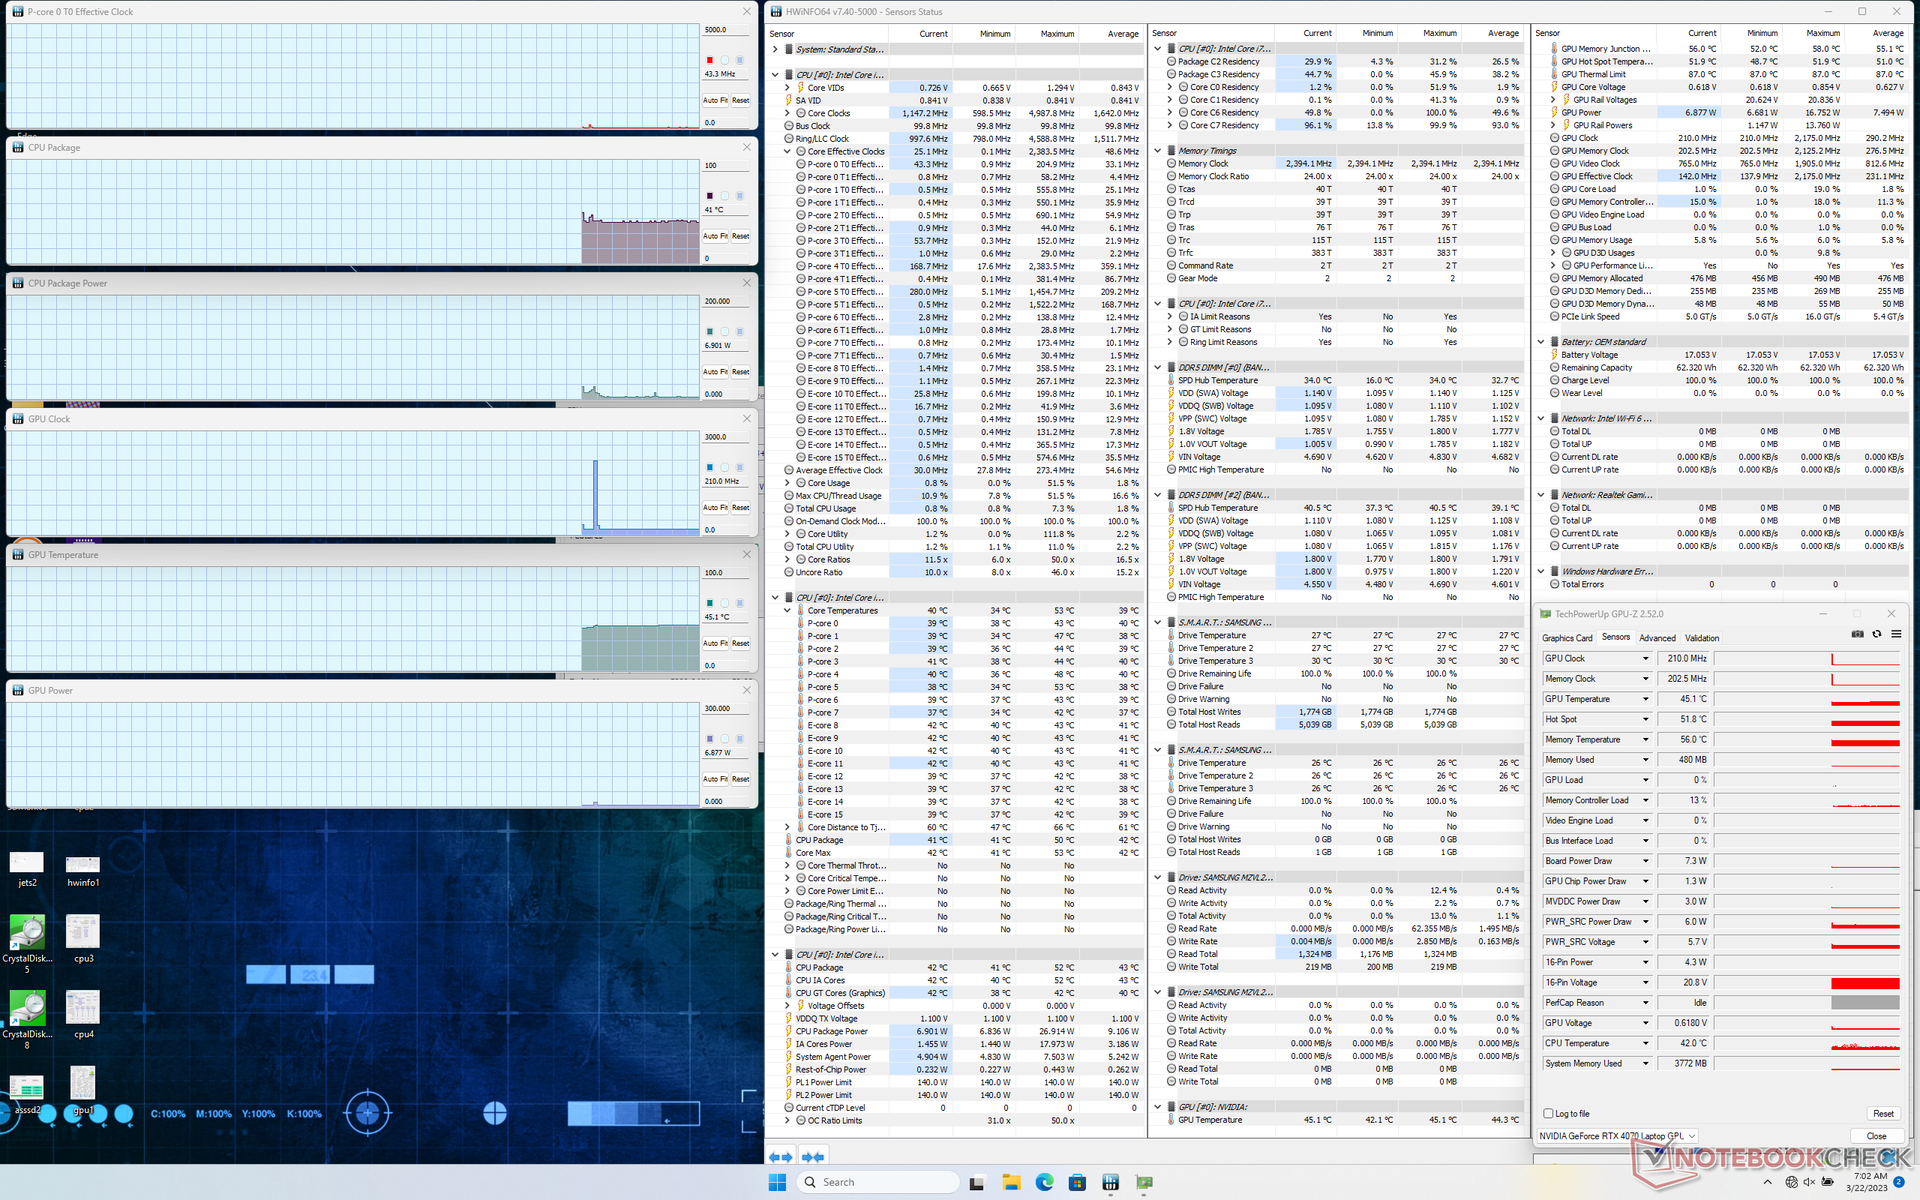
| CPU-klok (GHz) | GPU-klok (MHz) | Gemiddelde CPU-temperatuur (°C) | Gemiddelde GPU-temperatuur (°C) | |
| Systeem Idle | -- | -- | 41 | 45 |
| Prime95 Stress | 3.4 - 4.0 | -- | 89 | 55 |
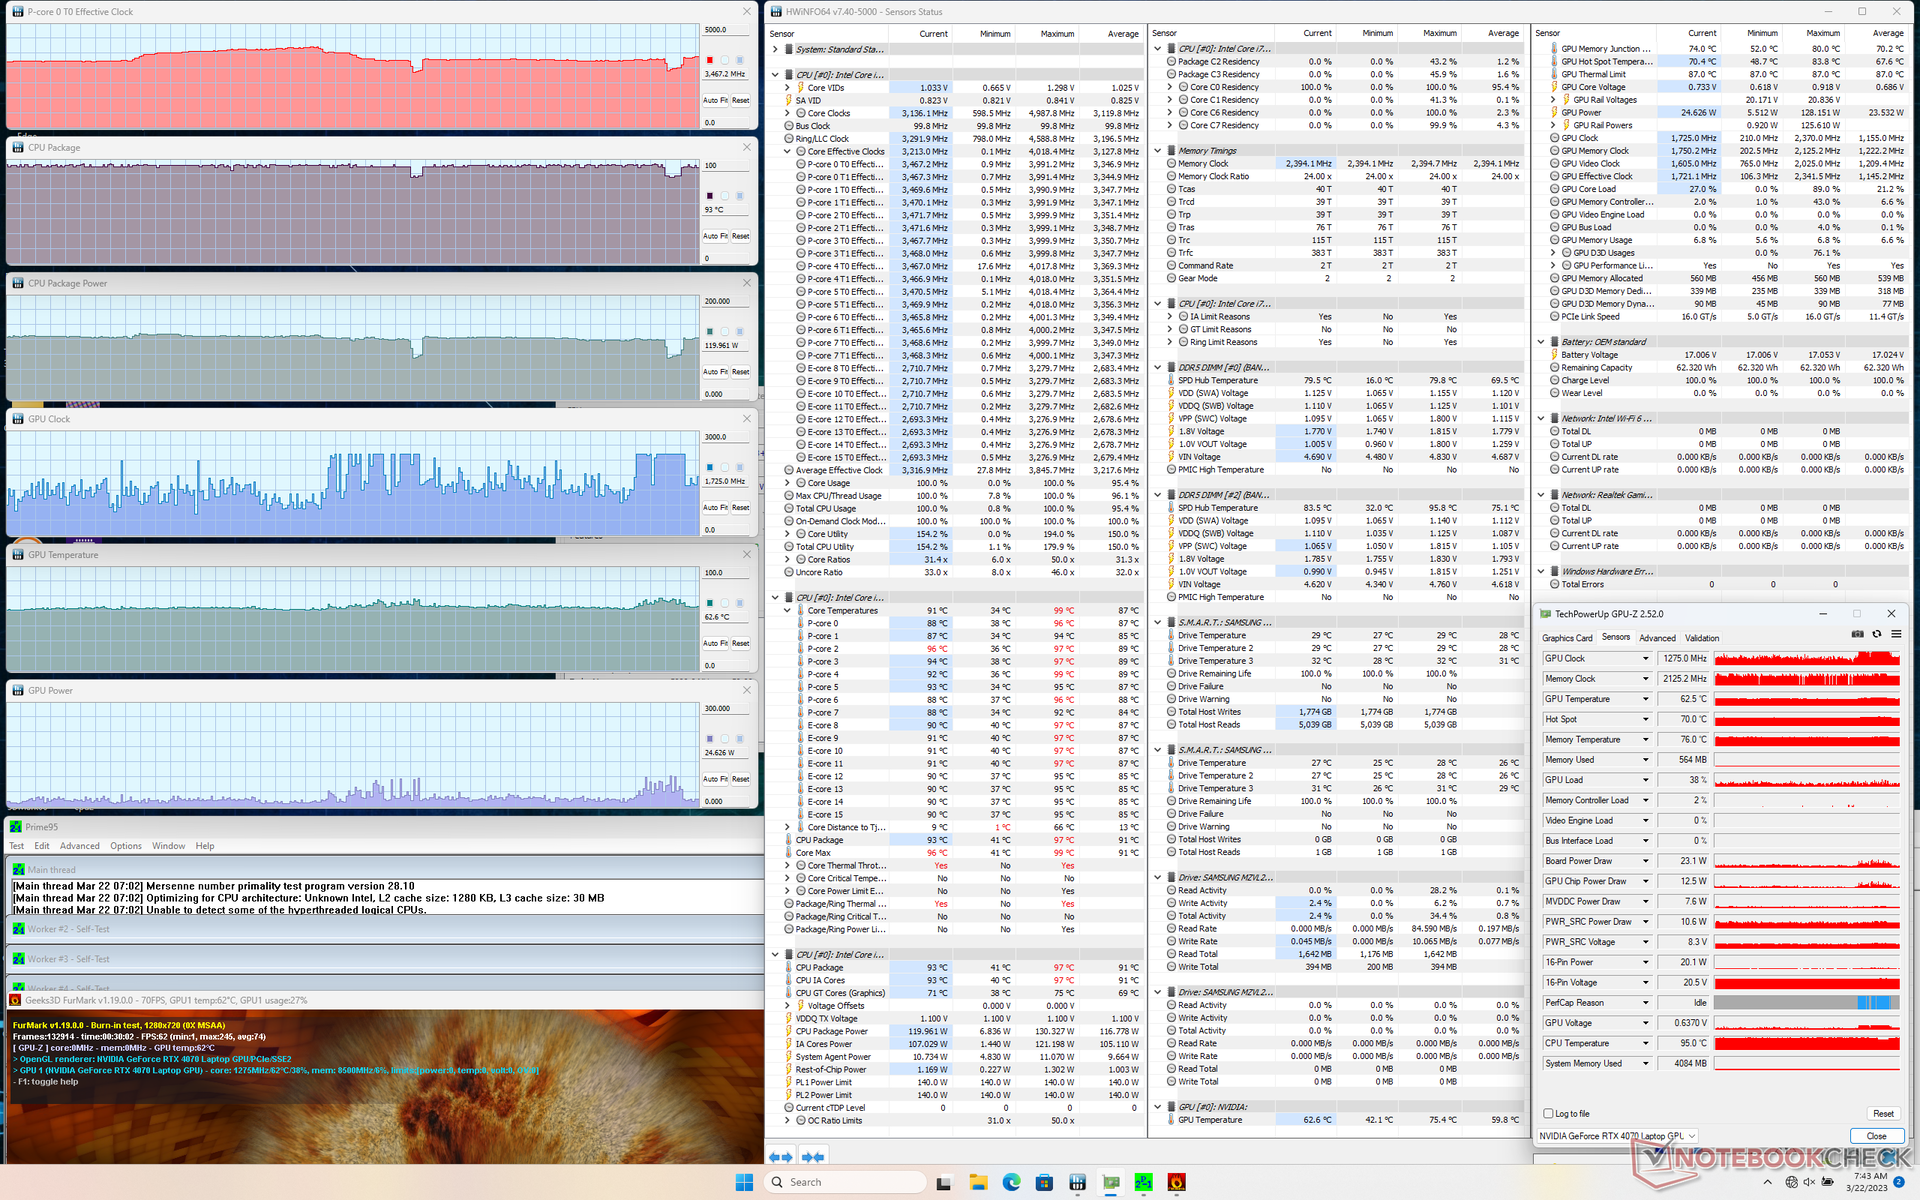
| Prime95 + FurMark Stress | ~3.5 | 1275 - 2350 | 93 | 63 |
| Witcher 3 Stress | ~1450 | 2370 | 83 | 73 |
Luidsprekers
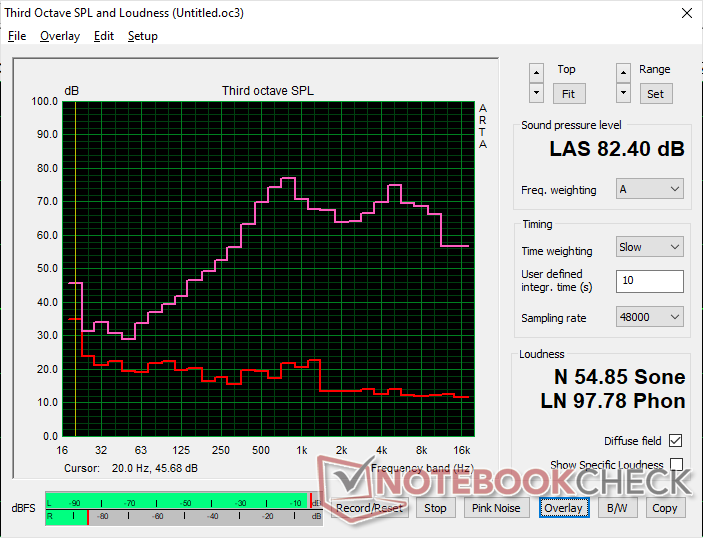
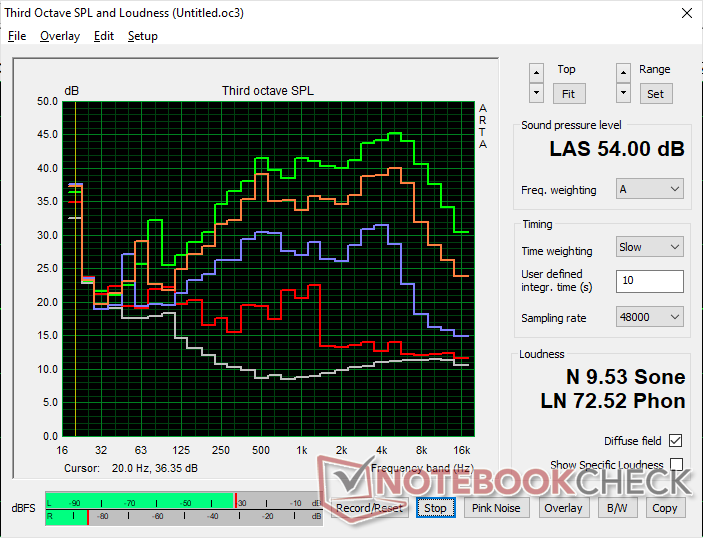
Uniwill GM6PX7X RTX 4070 audioanalyse
(+) | luidsprekers kunnen relatief luid spelen (82.4 dB)
Bas 100 - 315 Hz
(-) | bijna geen lage tonen - gemiddeld 18.6% lager dan de mediaan
(+) | de lage tonen zijn lineair (6.4% delta naar de vorige frequentie)
Midden 400 - 2000 Hz
(+) | evenwichtige middens - slechts 4.4% verwijderd van de mediaan
(±) | lineariteit van de middentonen is gemiddeld (8.4% delta ten opzichte van de vorige frequentie)
Hoog 2 - 16 kHz
(+) | evenwichtige hoogtepunten - slechts 2.9% verwijderd van de mediaan
(+) | de hoge tonen zijn lineair (5.5% delta naar de vorige frequentie)
Algemeen 100 - 16.000 Hz
(±) | lineariteit van het totale geluid is gemiddeld (16.8% verschil met de mediaan)
Vergeleken met dezelfde klasse
» 44% van alle geteste apparaten in deze klasse waren beter, 11% vergelijkbaar, 45% slechter
» De beste had een delta van 6%, het gemiddelde was 18%, de slechtste was 132%
Vergeleken met alle geteste toestellen
» 30% van alle geteste apparaten waren beter, 8% gelijk, 63% slechter
» De beste had een delta van 4%, het gemiddelde was 23%, de slechtste was 134%
Apple MacBook Pro 16 2021 M1 Pro audioanalyse
(+) | luidsprekers kunnen relatief luid spelen (84.7 dB)
Bas 100 - 315 Hz
(+) | goede baars - slechts 3.8% verwijderd van de mediaan
(+) | de lage tonen zijn lineair (5.2% delta naar de vorige frequentie)
Midden 400 - 2000 Hz
(+) | evenwichtige middens - slechts 1.3% verwijderd van de mediaan
(+) | de middentonen zijn lineair (2.1% delta ten opzichte van de vorige frequentie)
Hoog 2 - 16 kHz
(+) | evenwichtige hoogtepunten - slechts 1.9% verwijderd van de mediaan
(+) | de hoge tonen zijn lineair (2.7% delta naar de vorige frequentie)
Algemeen 100 - 16.000 Hz
(+) | het totale geluid is lineair (4.6% verschil met de mediaan)
Vergeleken met dezelfde klasse
» 0% van alle geteste apparaten in deze klasse waren beter, 0% vergelijkbaar, 100% slechter
» De beste had een delta van 5%, het gemiddelde was 17%, de slechtste was 45%
Vergeleken met alle geteste toestellen
» 0% van alle geteste apparaten waren beter, 0% gelijk, 100% slechter
» De beste had een delta van 4%, het gemiddelde was 23%, de slechtste was 134%
Energiebeheer
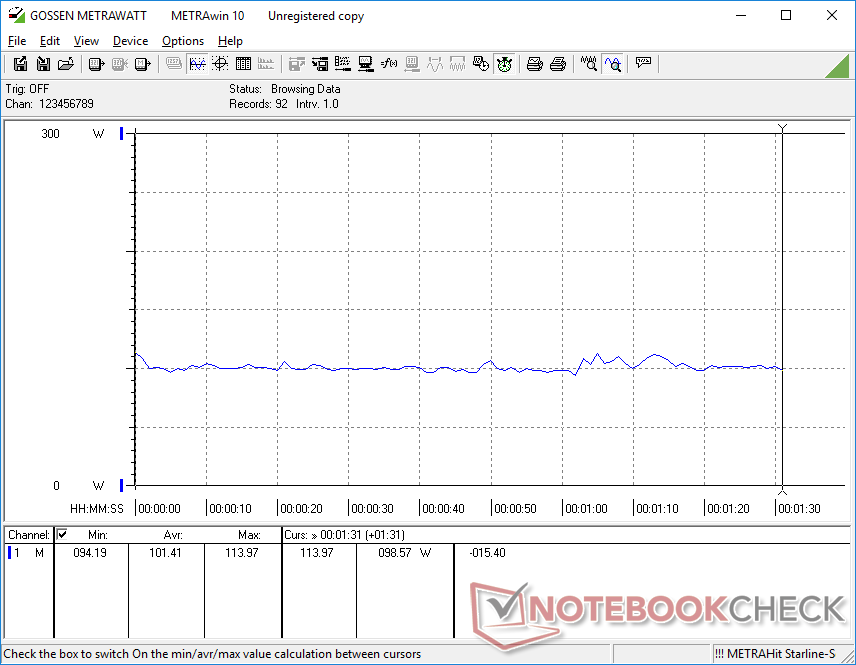
Stroomverbruik
Het stroomverbruik zou in alle gevallen minder moeten zijn dan de snellere met RTX 4090 uitgeruste Neo 16, maar dat is vreemd genoeg niet waar. Stationair draaien op de desktop zou tussen de 12 W en 32 W vragen, vergeleken met slechts 8 W en 28 W op de RTX 4090-aangedreven Neo 16. We hebben onze energieprofielen en helderheidsinstellingen dubbel gecontroleerd, maar de resultaten werden niet beter.
Het draaien van hogere belastingen zoals games trekt 24 tot 37 procent minder stroom dan de Neo 16. De mobiele RTX 4070 is ongeveer 35 tot 45 procent langzamer dan de mobiele RTX 4090 en dus is het lagere verbruik niet onverwacht.
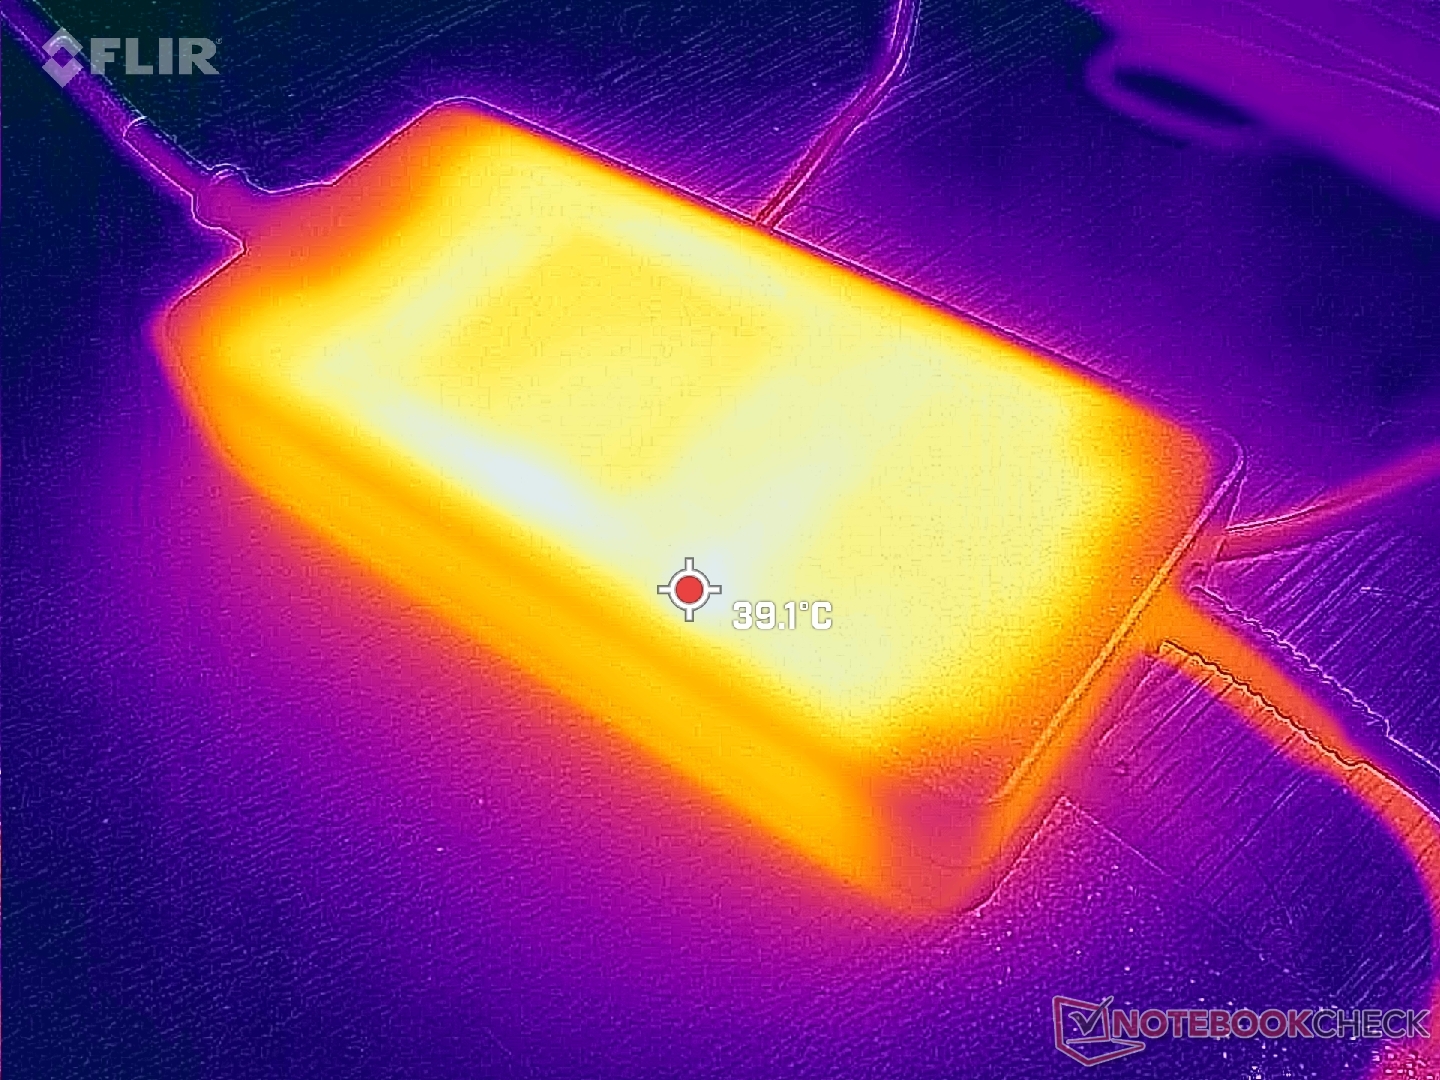
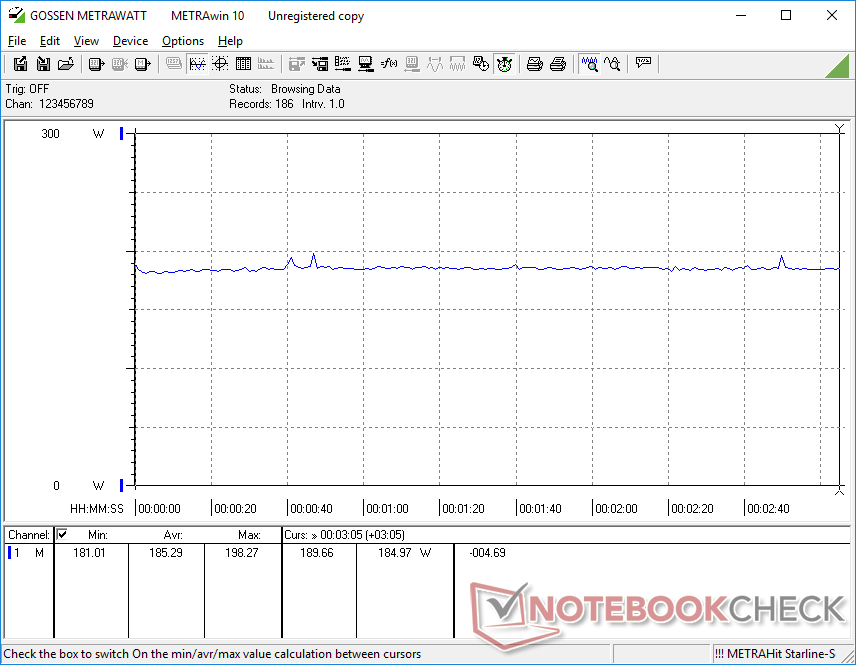
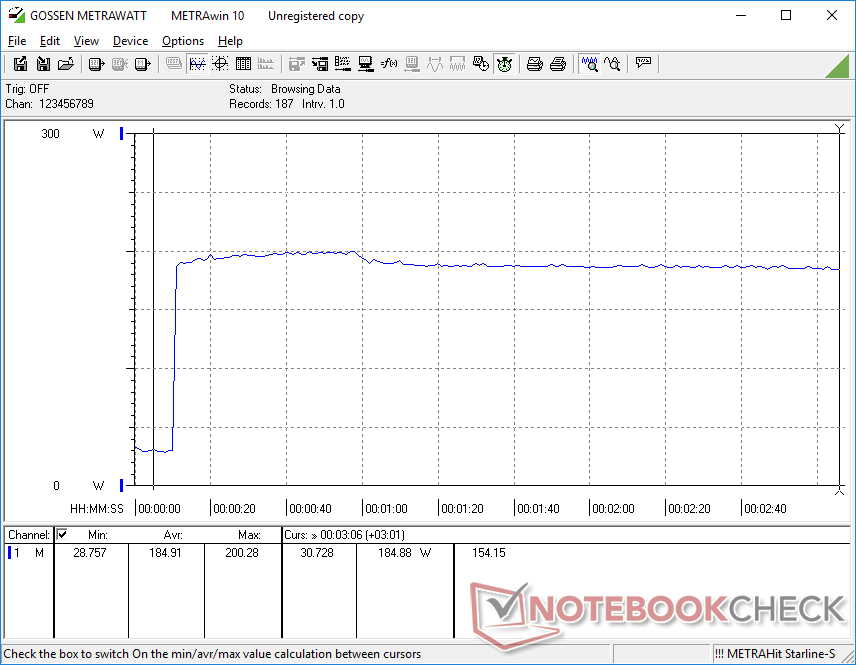
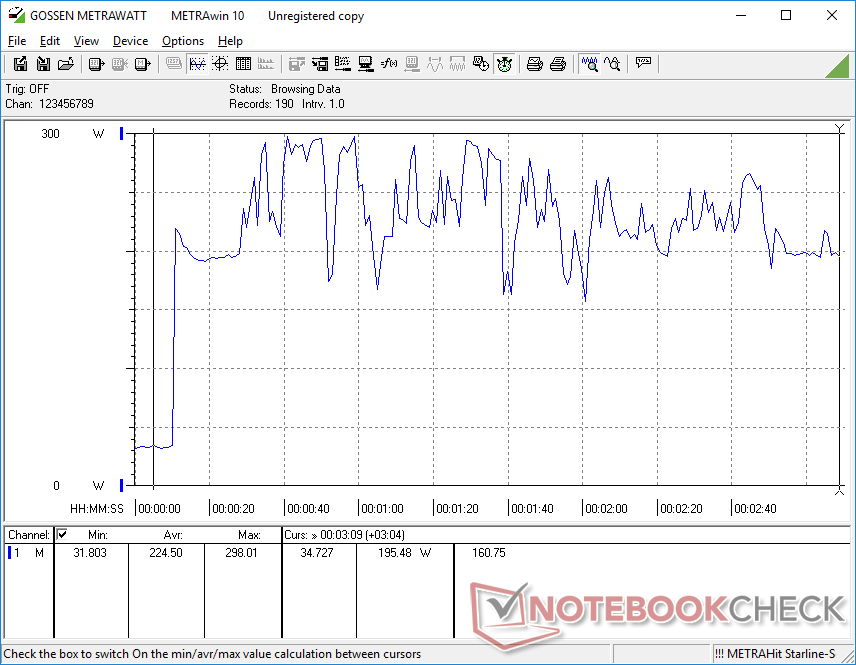
Als Prime95 en FurMark tegelijkertijd worden uitgevoerd, loopt het verbruik sterk uiteen van 167 W tot 298 W, ook al is de grote (~18 x 8,4 x 3,5 cm) wisselstroomadapter berekend op 280 W. Het verbruik is veel stabieler als deze test wordt herhaald op de met RTX 4090 uitgeruste Neo 16, zoals blijkt uit de onderstaande vergelijkingstabel.
| Uit / Standby | |
| Inactief | |
| Belasting |
|
Key:
min: | |
| Uniwill GM6PX7X RTX 4070 i7-13700HX, GeForce RTX 4070 Laptop GPU, Samsung PM9A1 MZVL2512HCJQ, IPS, 2560x1600, 16" | Schenker XMG Neo 16 E23 i9-13900HX, GeForce RTX 4090 Laptop GPU, Crucial P5 Plus 1TB CT1000P5PSSD8, IPS, 2560x1600, 16" | Asus ROG Strix G16 G614JZ i9-13980HX, GeForce RTX 4080 Laptop GPU, WD PC SN560 SDDPNQE-1T00, IPS, 2560x1600, 16" | Lenovo Legion Pro 7 16IRX8H i9-13900HX, GeForce RTX 4080 Laptop GPU, Samsung PM9A1 MZVL21T0HCLR, IPS, 2560x1600, 16" | Gigabyte AERO 16 OLED BSF i9-13900H, GeForce RTX 4070 Laptop GPU, Gigabyte AG470S1TB-SI B10, OLED, 3840x2400, 16" | Razer Blade 16 Early 2023 i9-13950HX, GeForce RTX 4080 Laptop GPU, SSSTC CA6-8D1024, IPS, 2560x1600, 16" | |
|---|---|---|---|---|---|---|
| Power Consumption | -13% | -5% | -26% | 19% | -25% | |
| Idle Minimum * (Watt) | 12.6 | 8 37% | 10 21% | 18 -43% | 11.8 6% | 15.2 -21% |
| Idle Average * (Watt) | 17.7 | 18 -2% | 16 10% | 24 -36% | 16.1 9% | 22.8 -29% |
| Idle Maximum * (Watt) | 31.8 | 28 12% | 27 15% | 32 -1% | 17 47% | 49.8 -57% |
| Load Average * (Watt) | 101.4 | 133 -31% | 129 -27% | 130 -28% | 100.6 1% | 121.2 -20% |
| Witcher 3 ultra * (Watt) | 185.3 | 294 -59% | 247 -33% | 260 -40% | 158 15% | 242 -31% |
| Load Maximum * (Watt) | 298 | 399 -34% | 342 -15% | 320 -7% | 192 36% | 273.7 8% |
* ... kleiner is beter
Power Consumption Witcher 3 / Stresstest
Power Consumption external Monitor
Levensduur van de batterij
De batterijcapaciteit is een derde kleiner dan op de RTX 4090-aangedreven Neo 16 voor een kortere WLAN-batterijduur van ongeveer 4 uur. De meeste andere 16-inch gaming laptops hebben in vergelijking grotere batterijcapaciteiten en looptijden.
Opladen van leeg naar volledige capaciteit duurt iets minder dan twee uur. Geen van onze USB-C laders is in staat om de laptop op te laden.
| Uniwill GM6PX7X RTX 4070 i7-13700HX, GeForce RTX 4070 Laptop GPU, 62 Wh | Schenker XMG Neo 16 E23 i9-13900HX, GeForce RTX 4090 Laptop GPU, 99 Wh | Asus ROG Strix G16 G614JZ i9-13980HX, GeForce RTX 4080 Laptop GPU, 90 Wh | Lenovo Legion Pro 7 16IRX8H i9-13900HX, GeForce RTX 4080 Laptop GPU, 99.9 Wh | Gigabyte AERO 16 OLED BSF i9-13900H, GeForce RTX 4070 Laptop GPU, 88 Wh | Razer Blade 16 Early 2023 i9-13950HX, GeForce RTX 4080 Laptop GPU, 95.2 Wh | |
|---|---|---|---|---|---|---|
| Batterijduur | 68% | 142% | 27% | 88% | 53% | |
| WiFi v1.3 (h) | 4 | 6.7 68% | 9.7 142% | 5.1 27% | 7.5 88% | 6.1 53% |
| H.264 (h) | 5.8 | 7.4 | ||||
| Witcher 3 ultra (h) | 1.4 | |||||
| Load (h) | 1.1 | 2.1 | 2.1 | 1.4 | ||
| Reader / Idle (h) | 6.4 | 8.9 |
Pro
Contra
Verdict
De Uniwill GM6PX7X is een solide 16-inch gaming laptop, zelfs als het niet uitblinkt in een bepaalde categorie. Het systeem is lichtgewicht, bijvoorbeeld, maar de Gigabyte Aero 16 is nog lichter. Kleurdekking benadert 100 procent sRGB, maar nog diepere P3-kleuren zijn beschikbaar op deAsus ROG Strix G16 ofRazer Blade 16. Grafische prestaties zijn geweldig voor het formaat, maar het ontbreken van Advanced Optimus of G-Sync ondersteuning op de interne monitor is een doorn in het oog. Zone-gebaseerde RGB-achtergrondverlichting wordt ondersteund, maar per-toets RGB-verlichting is gebonden aan een optionele Cherry mechanische upgrade. Ondertussen brengt het configureren met de snellere GeForce RTX 4080 of 4090 een dikker en zwaarder chassis met zich mee, wat een van de belangrijkste voordelen van het Uniwill GM6PX7X ontwerp teniet doet. Er zijn geen opmerkelijke zwakheden of opvallende kenmerken aan de Uniwill die het een gevoel van consistentie geeft dat sommige gamers zouden kunnen waarderen.
De Uniwill GM6PX7X is een no-frills gaming laptop die bovengemiddeld is in de meeste elke categorie, maar het mist de oomph of opvallende functie om te helpen onderscheiden van de menigte.
We kunnen nog steeds prijst het model voor zijn full-size numpad en pijltoetsen en zeldzame ondersteuning voor een optionele externe waterkoeler. Deze zelfde toetsenbord toetsen hebben de neiging om kleiner en krap te zijn op andere gaming laptops. Enthousiastelingen kunnen de high-end RTX 4080 of 4090 SKU's overwegen om de optionele waterkoeling beter te benutten.
Prijs en beschikbaarheid
De Uniwill GM6PX7X wordt nu onder verschillende namen en prijzen geleverd, afhankelijk van de regio. Schenker bijvoorbeeld biedt het chassis aan onder de merknaam XMG Neo 16.
Uniwill GM6PX7X RTX 4070
- 28-03-2023 v7 (old)
Allen Ngo
Transparantie
De selectie van te beoordelen apparaten wordt gemaakt door onze redactie. Het testexemplaar werd ten behoeve van deze beoordeling door de fabrikant of detailhandelaar in bruikleen aan de auteur verstrekt. De kredietverstrekker had geen invloed op deze recensie, noch ontving de fabrikant vóór publicatie een exemplaar van deze recensie. Er bestond geen verplichting om deze recensie te publiceren. Als onafhankelijk mediabedrijf is Notebookcheck niet onderworpen aan het gezag van fabrikanten, detailhandelaren of uitgevers.
[transparency_disclaimer]Dit is hoe Notebookcheck test
Elk jaar beoordeelt Notebookcheck onafhankelijk honderden laptops en smartphones met behulp van gestandaardiseerde procedures om ervoor te zorgen dat alle resultaten vergelijkbaar zijn. We hebben onze testmethoden al zo'n 20 jaar voortdurend ontwikkeld en daarbij de industriestandaard bepaald. In onze testlaboratoria wordt gebruik gemaakt van hoogwaardige meetapparatuur door ervaren technici en redacteuren. Deze tests omvatten een validatieproces in meerdere fasen. Ons complexe beoordelingssysteem is gebaseerd op honderden goed onderbouwde metingen en benchmarks, waardoor de objectiviteit behouden blijft. Meer informatie over onze testmethoden kunt u hier vinden.
Price comparison

