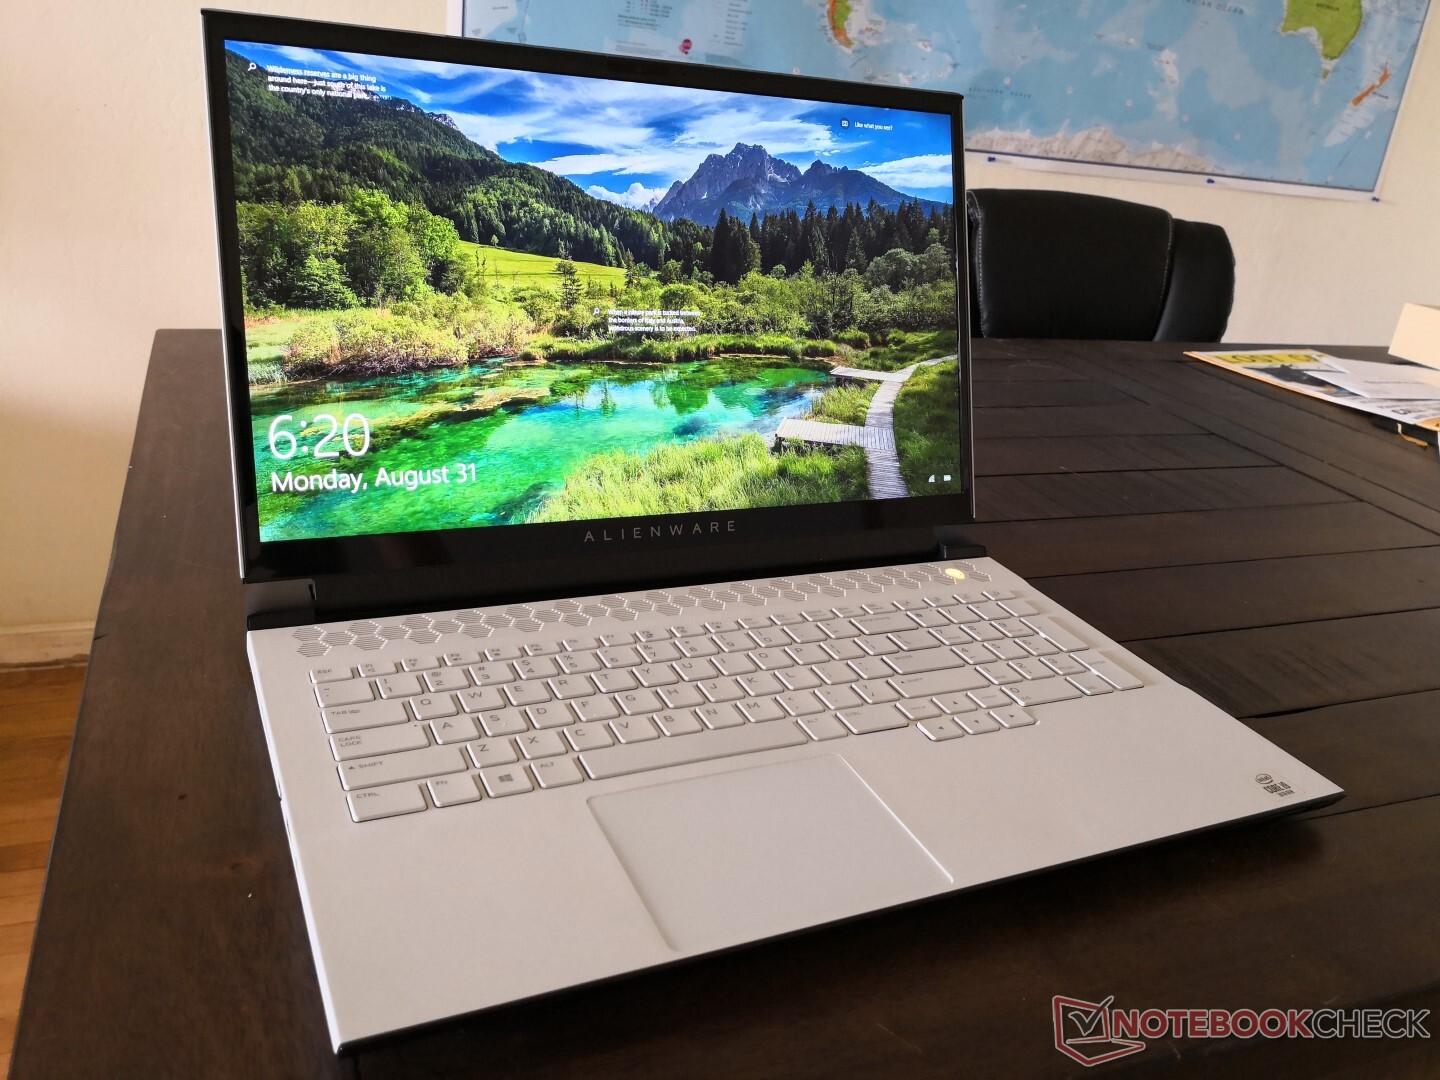
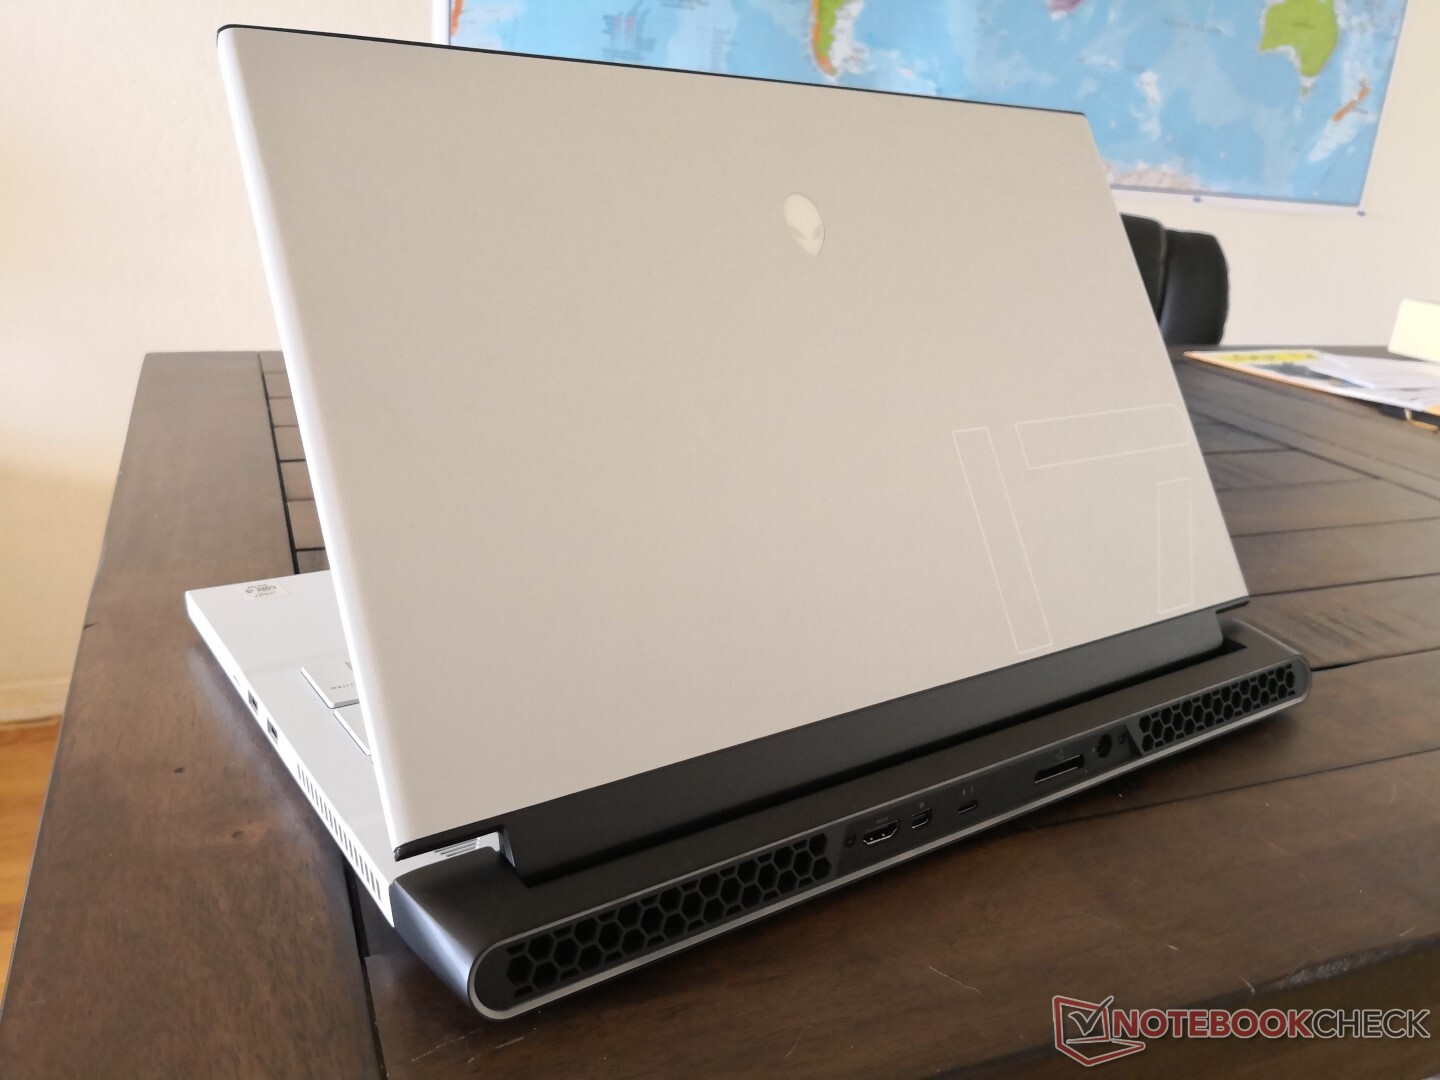
Kort testrapport Dell Alienware m17 R3 GeForce RTX 2080 Super Laptop: Tot ziens, Max-Q
Evaluatie | Datum | Model | Gewicht | Hoogte | Formaat | Resolutie | Beste prijs |
|---|---|---|---|---|---|---|---|
| 85.3 % v7 (old) | 09-2020 | Alienware m17 R3 P45E i9-10980HK, GeForce RTX 2080 Super Mobile | 3 kg | 20.7 mm | 17.30" | 1920x1080 | |
| 84.3 % v7 (old) | 08-2020 | Eluktronics RP-17 R7 4800H, GeForce RTX 2060 Mobile | 2.6 kg | 30 mm | 17.30" | 1920x1080 | |
| 83.7 % v7 (old) | 07-2020 | MSI GS75 10SF-609US i7-10875H, GeForce RTX 2070 Max-Q | 2.3 kg | 18.9 mm | 17.30" | 1920x1080 | |
| 82.7 % v7 (old) | 07-2020 | Asus Strix Scar 17 G732LXS i9-10980HK, GeForce RTX 2080 Super Mobile | 2.9 kg | 26.5 mm | 17.30" | 1920x1080 | |
| 85.1 % v7 (old) | 07-2020 | MSI GE75 Raider 10SE-008US i7-10750H, GeForce RTX 2060 Mobile | 2.6 kg | 27.5 mm | 17.30" | 1920x1080 | |
| 87.4 % v7 (old) | 06-2020 | Razer Blade Pro 17 RTX 2070 Max-Q 300 Hz i7-10875H, GeForce RTX 2070 Max-Q | 2.7 kg | 19.9 mm | 17.30" | 1920x1080 |
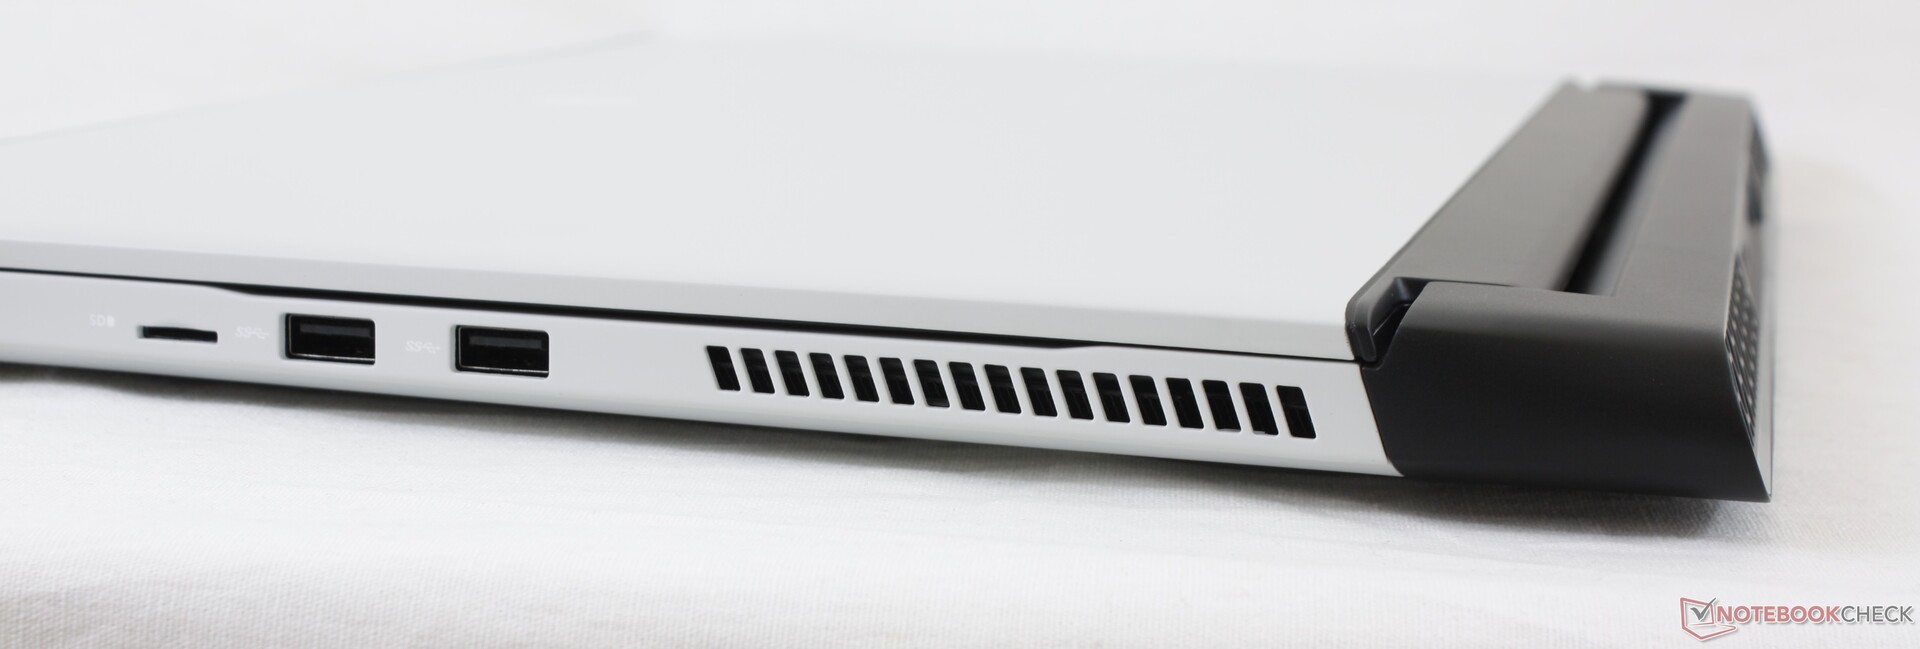
| SD Card Reader | |
| average JPG Copy Test (av. of 3 runs) | |
| Alienware m17 R3 P45E (Toshiba Exceria Pro M501 UHS-II) | |
| Razer Blade Pro 17 RTX 2070 Max-Q 300 Hz (Toshiba Exceria Pro SDXC 64 GB UHS-II) | |
| MSI GS75 10SF-609US (Toshiba Exceria Pro M501 UHS-II) | |
| Eluktronics RP-17 (Toshiba Exceria Pro SDXC 64 GB UHS-II) | |
| MSI GE75 Raider 10SE-008US (Toshiba Exceria Pro SDXC 64 GB UHS-II) | |
| maximum AS SSD Seq Read Test (1GB) | |
| Alienware m17 R3 P45E (Toshiba Exceria Pro M501 UHS-II) | |
| MSI GS75 10SF-609US (Toshiba Exceria Pro M501 UHS-II) | |
| Razer Blade Pro 17 RTX 2070 Max-Q 300 Hz (Toshiba Exceria Pro SDXC 64 GB UHS-II) | |
| Eluktronics RP-17 (Toshiba Exceria Pro SDXC 64 GB UHS-II) | |
| MSI GE75 Raider 10SE-008US (Toshiba Exceria Pro SDXC 64 GB UHS-II) | |

")
")
| |||||||||||||||||||||||||
Helderheidsverdeling: 91 %
Helderheid in Batterij-modus: 338.3 cd/m²
Contrast: 1253:1 (Zwart: 0.27 cd/m²)
ΔE ColorChecker Calman: 1.88 | ∀{0.5-29.43 Ø4.72}
calibrated: 1.32
ΔE Greyscale Calman: 2.4 | ∀{0.09-98 Ø4.97}
97.8% sRGB (Argyll 1.6.3 3D)
64.7% AdobeRGB 1998 (Argyll 1.6.3 3D)
71.4% AdobeRGB 1998 (Argyll 3D)
97.9% sRGB (Argyll 3D)
69.2% Display P3 (Argyll 3D)
Gamma: 2.39
CCT: 6572 K
| Alienware m17 R3 P45E AU Optronics B173HAN, IPS, 17.3", 1920x1080 | Eluktronics RP-17 BOE NV173FHM-N44, IPS, 17.3", 1920x1080 | MSI GS75 10SF-609US Sharp LQ173M1JW05, IPS, 17.3", 1920x1080 | Asus Strix Scar 17 G732LXS LQ173M1JW03 (SHP14DC), IPS, 17.3", 1920x1080 | MSI GE75 Raider 10SE-008US Chi Mei N173HCE-G33, IPS, 17.3", 1920x1080 | Razer Blade Pro 17 RTX 2070 Max-Q 300 Hz Sharp LQ173M1JW02, IPS, 17.3", 1920x1080 | |
|---|---|---|---|---|---|---|
| Display | -7% | 5% | 1% | -3% | 2% | |
| Display P3 Coverage (%) | 69.2 | 64.7 -7% | 75.6 9% | 71 3% | 65.6 -5% | 72.2 4% |
| sRGB Coverage (%) | 97.9 | 92 -6% | 99.8 2% | 99 1% | 98.1 0% | 98.5 1% |
| AdobeRGB 1998 Coverage (%) | 71.4 | 65.8 -8% | 75.1 5% | 71.6 0% | 67.8 -5% | 73 2% |
| Response Times | -10% | 62% | 53% | 49% | 49% | |
| Response Time Grey 50% / Grey 80% * (ms) | 16.8 ? | 22.4 ? -33% | 5 ? 70% | 5.8 ? 65% | 6.8 ? 60% | 5.6 ? 67% |
| Response Time Black / White * (ms) | 14 ? | 12 ? 14% | 6.6 ? 53% | 8.4 ? 40% | 8.8 ? 37% | 9.6 ? 31% |
| PWM Frequency (Hz) | 943 | 25000 ? | ||||
| Screen | -43% | -10% | -33% | -5% | -59% | |
| Brightness middle (cd/m²) | 338.3 | 311.5 -8% | 299.4 -11% | 310 -8% | 337.9 0% | 328 -3% |
| Brightness (cd/m²) | 325 | 301 -7% | 299 -8% | 311 -4% | 305 -6% | 329 1% |
| Brightness Distribution (%) | 91 | 91 0% | 84 -8% | 82 -10% | 81 -11% | 78 -14% |
| Black Level * (cd/m²) | 0.27 | 0.31 -15% | 0.31 -15% | 0.41 -52% | 0.29 -7% | 0.35 -30% |
| Contrast (:1) | 1253 | 1005 -20% | 966 -23% | 756 -40% | 1165 -7% | 937 -25% |
| Colorchecker dE 2000 * | 1.88 | 4.13 -120% | 1.82 3% | 2.41 -28% | 2.18 -16% | 4.74 -152% |
| Colorchecker dE 2000 max. * | 3.23 | 7.32 -127% | 3.91 -21% | 8.59 -166% | 3.9 -21% | 8.99 -178% |
| Colorchecker dE 2000 calibrated * | 1.32 | 2.93 -122% | 1.59 -20% | 1.13 14% | 0.69 48% | 2.12 -61% |
| Greyscale dE 2000 * | 2.4 | 3.3 -38% | 2.7 -13% | 4.3 -79% | 3.1 -29% | 6.8 -183% |
| Gamma | 2.39 92% | 2.17 101% | 2.18 101% | 2.149 102% | 2.07 106% | 2.2 100% |
| CCT | 6572 99% | 7157 91% | 6837 95% | 7059 92% | 6882 94% | 6446 101% |
| Color Space (Percent of AdobeRGB 1998) (%) | 64.7 | 59.5 -8% | 67.1 4% | 72 11% | 62 -4% | 64.8 0% |
| Color Space (Percent of sRGB) (%) | 97.8 | 91.6 -6% | 99.8 2% | 94 -4% | 98.2 0% | 98.6 1% |
| Totaal Gemiddelde (Programma / Instellingen) | -20% /
-32% | 19% /
2% | 7% /
-16% | 14% /
2% | -3% /
-34% |
* ... kleiner is beter
Responstijd Scherm
| ↔ Responstijd Zwart naar Wit | ||
|---|---|---|
| 14 ms ... stijging ↗ en daling ↘ gecombineerd | ↗ 7.6 ms stijging | 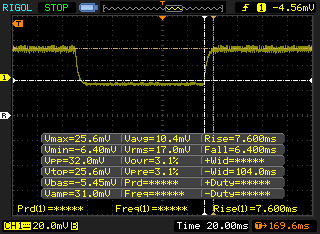 |
| ↘ 6.4 ms daling | ||
| Het scherm vertoonde prima responstijden in onze tests maar is misschien wat te traag voor competitieve games. Ter vergelijking: alle testtoestellen variëren van 0.1 (minimum) tot 240 (maximum) ms. » 34 % van alle toestellen zijn beter. Dit betekent dat de gemeten responstijd beter is dan het gemiddelde (19.9 ms) van alle geteste toestellen. | ||
| ↔ Responstijd 50% Grijs naar 80% Grijs | ||
| 16.8 ms ... stijging ↗ en daling ↘ gecombineerd | ↗ 11.6 ms stijging | 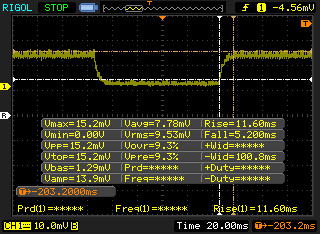 |
| ↘ 5.2 ms daling | ||
| Het scherm vertoonde prima responstijden in onze tests maar is misschien wat te traag voor competitieve games. Ter vergelijking: alle testtoestellen variëren van 0.165 (minimum) tot 636 (maximum) ms. » 31 % van alle toestellen zijn beter. Dit betekent dat de gemeten responstijd beter is dan het gemiddelde (31.1 ms) van alle geteste toestellen. | ||
Screen Flickering / PWM (Pulse-Width Modulation)
| Screen flickering / PWM niet waargenomen |  | ||
Ter vergelijking: 52 % van alle geteste toestellen maakten geen gebruik van PWM om de schermhelderheid te verlagen. Als het wel werd gebruikt, werd een gemiddelde van 7784 (minimum: 5 - maximum: 343500) Hz waargenomen. | |||
Cinebench R15: CPU Multi 64Bit | CPU Single 64Bit
Blender: v2.79 BMW27 CPU
7-Zip 18.03: 7z b 4 -mmt1 | 7z b 4
Geekbench 5.5: Single-Core | Multi-Core
HWBOT x265 Benchmark v2.2: 4k Preset
LibreOffice : 20 Documents To PDF
R Benchmark 2.5: Overall mean
| Cinebench R20 / CPU (Multi Core) | |
| Intel Core i9-10900K | |
| MSI GT76 Titan DT 9SG | |
| Eluktronics RP-17 | |
| Alienware m17 R3 P45E | |
| Asus Zephyrus G14 GA401IV | |
| Alienware m17 R2 P41E | |
| Gemiddeld Intel Core i9-10980HK (3526 - 4487, n=13) | |
| MSI GS75 10SF-609US | |
| MSI GE75 9SG | |
| MSI GE75 Raider 10SE-008US | |
| Medion Erazer X15805 | |
| Schenker XMG Pro 17 PB71RD-G | |
| Cinebench R20 / CPU (Single Core) | |
| Intel Core i9-10900K | |
| MSI GT76 Titan DT 9SG | |
| Medion Erazer X15805 | |
| Asus Zephyrus G14 GA401IV | |
| Gemiddeld Intel Core i9-10980HK (465 - 507, n=13) | |
| Eluktronics RP-17 | |
| Alienware m17 R2 P41E | |
| MSI GS75 10SF-609US | |
| Alienware m17 R3 P45E | |
| MSI GE75 Raider 10SE-008US | |
| MSI GE75 9SG | |
| Schenker XMG Pro 17 PB71RD-G | |
| Cinebench R15 / CPU Multi 64Bit | |
| Intel Core i9-10900K | |
| MSI GT76 Titan DT 9SG | |
| Eluktronics RP-17 | |
| Asus Zephyrus G14 GA401IV | |
| Alienware m17 R3 P45E | |
| Alienware m17 R2 P41E | |
| Gemiddeld Intel Core i9-10980HK (1606 - 1862, n=15) | |
| MSI GE75 9SG | |
| MSI GS75 10SF-609US | |
| MSI GE75 Raider 10SE-008US | |
| Medion Erazer X15805 | |
| Schenker XMG Pro 17 PB71RD-G | |
| Cinebench R15 / CPU Single 64Bit | |
| Intel Core i9-10900K | |
| MSI GT76 Titan DT 9SG | |
| Alienware m17 R3 P45E | |
| Gemiddeld Intel Core i9-10980HK (198 - 219, n=15) | |
| Medion Erazer X15805 | |
| MSI GS75 10SF-609US | |
| Alienware m17 R2 P41E | |
| Asus Zephyrus G14 GA401IV | |
| MSI GE75 9SG | |
| MSI GE75 Raider 10SE-008US | |
| Eluktronics RP-17 | |
| Schenker XMG Pro 17 PB71RD-G | |
| Blender / v2.79 BMW27 CPU | |
| Schenker XMG Pro 17 PB71RD-G | |
| MSI GE75 Raider 10SE-008US | |
| Asus Zephyrus G14 GA401IV | |
| MSI GE75 9SG | |
| MSI GS75 10SF-609US | |
| Gemiddeld Intel Core i9-10980HK (239 - 299, n=13) | |
| Eluktronics RP-17 | |
| Alienware m17 R3 P45E | |
| Intel Core i9-10900K | |
| 7-Zip 18.03 / 7z b 4 -mmt1 | |
| Intel Core i9-10900K | |
| Alienware m17 R3 P45E | |
| Gemiddeld Intel Core i9-10980HK (5081 - 5542, n=13) | |
| MSI GS75 10SF-609US | |
| MSI GE75 Raider 10SE-008US | |
| MSI GE75 9SG | |
| Asus Zephyrus G14 GA401IV | |
| Eluktronics RP-17 | |
| Schenker XMG Pro 17 PB71RD-G | |
| 7-Zip 18.03 / 7z b 4 | |
| Intel Core i9-10900K | |
| Eluktronics RP-17 | |
| Asus Zephyrus G14 GA401IV | |
| MSI GS75 10SF-609US | |
| Gemiddeld Intel Core i9-10980HK (43786 - 49275, n=13) | |
| Alienware m17 R3 P45E | |
| MSI GE75 9SG | |
| MSI GE75 Raider 10SE-008US | |
| Schenker XMG Pro 17 PB71RD-G | |
| Geekbench 5.5 / Single-Core | |
| Intel Core i9-10900K | |
| Alienware m17 R3 P45E | |
| Gemiddeld Intel Core i9-10980HK (1283 - 1401, n=12) | |
| MSI GT76 Titan DT 9SG | |
| MSI GS75 10SF-609US | |
| MSI GE75 Raider 10SE-008US | |
| Asus Zephyrus G14 GA401IV | |
| Eluktronics RP-17 | |
| Schenker XMG Pro 17 PB71RD-G | |
| Geekbench 5.5 / Multi-Core | |
| Intel Core i9-10900K | |
| MSI GT76 Titan DT 9SG | |
| MSI GS75 10SF-609US | |
| Gemiddeld Intel Core i9-10980HK (7634 - 8666, n=12) | |
| Alienware m17 R3 P45E | |
| Eluktronics RP-17 | |
| Asus Zephyrus G14 GA401IV | |
| MSI GE75 Raider 10SE-008US | |
| Schenker XMG Pro 17 PB71RD-G | |
| HWBOT x265 Benchmark v2.2 / 4k Preset | |
| Intel Core i9-10900K | |
| Alienware m17 R3 P45E | |
| Eluktronics RP-17 | |
| Gemiddeld Intel Core i9-10980HK (12 - 14.6, n=13) | |
| MSI GS75 10SF-609US | |
| Asus Zephyrus G14 GA401IV | |
| MSI GE75 9SG | |
| MSI GE75 Raider 10SE-008US | |
| Schenker XMG Pro 17 PB71RD-G | |
| LibreOffice / 20 Documents To PDF | |
| Intel Core i9-10900K | |
| Eluktronics RP-17 | |
| MSI GE75 Raider 10SE-008US | |
| Gemiddeld Intel Core i9-10980HK (44 - 89, n=13) | |
| MSI GS75 10SF-609US | |
| Alienware m17 R3 P45E | |
| R Benchmark 2.5 / Overall mean | |
| Schenker XMG Pro 17 PB71RD-G | |
| MSI GE75 Raider 10SE-008US | |
| MSI GS75 10SF-609US | |
| Eluktronics RP-17 | |
| Gemiddeld Intel Core i9-10980HK (0.561 - 0.596, n=13) | |
| Alienware m17 R3 P45E | |
| Intel Core i9-10900K | |
* ... kleiner is beter
| PCMark 8 Home Score Accelerated v2 | 5881 punten | |
| PCMark 8 Work Score Accelerated v2 | 6589 punten | |
| PCMark 10 Score | 6594 punten | |
Help | ||
| DPC Latencies / LatencyMon - interrupt to process latency (max), Web, Youtube, Prime95 | |
| Asus Strix Scar 17 G732LXS | |
| MSI GE75 Raider 10SE-008US | |
| Eluktronics RP-17 | |
| Razer Blade Pro 17 RTX 2070 Max-Q 300 Hz | |
| Alienware m17 R3 P45E | |
| MSI GS75 10SF-609US | |
* ... kleiner is beter
| Alienware m17 R3 P45E 2x Micron 2200S 512 GB (RAID 0) | Eluktronics RP-17 Phison PS5013 PRO-X-1TB-G2R NVMe SSD | MSI GS75 10SF-609US WDC PC SN730 SDBPNTY-512G | Asus Strix Scar 17 G732LXS 2x Intel SSD 660p 1TB SSDPEKNW010T8 (RAID 0) | MSI GE75 Raider 10SE-008US Samsung SSD PM981 MZVLB512HAJQ | Razer Blade Pro 17 RTX 2070 Max-Q 300 Hz Lite-On CA5-8D512 | |
|---|---|---|---|---|---|---|
| AS SSD | 23% | 17% | -2% | 21% | -10% | |
| Seq Read (MB/s) | 2060 | 1689 -18% | 2327 13% | 2450 19% | 2036 -1% | 2019 -2% |
| Seq Write (MB/s) | 2297 | 1695 -26% | 2479 8% | 1436 -37% | 1835 -20% | 1314 -43% |
| 4K Read (MB/s) | 35.39 | 50 41% | 45.46 28% | 49.48 40% | 60.6 71% | 46.61 32% |
| 4K Write (MB/s) | 63.1 | 182.9 190% | 157.4 149% | 119.4 89% | 127.2 102% | 90.2 43% |
| 4K-64 Read (MB/s) | 1337 | 1043 -22% | 1050 -21% | 1032 -23% | 1601 20% | 665 -50% |
| 4K-64 Write (MB/s) | 1307 | 1841 41% | 938 -28% | 1229 -6% | 1734 33% | 813 -38% |
| Access Time Read * (ms) | 0.057 | 0.04 30% | 0.076 -33% | 0.145 -154% | 0.049 14% | 0.058 -2% |
| Access Time Write * (ms) | 0.411 | 0.102 75% | 0.071 83% | 0.036 91% | 0.09 78% | 0.167 59% |
| Score Read (Points) | 1578 | 1262 -20% | 1328 -16% | 1327 -16% | 1865 18% | 913 -42% |
| Score Write (Points) | 1600 | 2194 37% | 1343 -16% | 1492 -7% | 2045 28% | 1034 -35% |
| Score Total (Points) | 3997 | 4112 3% | 3366 -16% | 3456 -14% | 4863 22% | 2392 -40% |
| Copy ISO MB/s (MB/s) | 1728 | 2124 23% | 3092 79% | 1900 10% | 1715 -1% | |
| Copy Program MB/s (MB/s) | 727 | 579 -20% | 733 1% | 205.5 -72% | 622 -14% | |
| Copy Game MB/s (MB/s) | 1585 | 1304 -18% | 1683 6% | 1419 -10% | 1506 -5% | |
| CrystalDiskMark 5.2 / 6 | 21% | 25% | 8% | 12% | 11% | |
| Write 4K (MB/s) | 68 | 226.1 233% | 177.9 162% | 125.8 85% | 139.2 105% | 119 75% |
| Read 4K (MB/s) | 42.04 | 54.7 30% | 47.42 13% | 52.9 26% | 53 26% | 51.9 23% |
| Write Seq (MB/s) | 2221 | 1868 -16% | 2707 22% | 1795 -19% | 1950 -12% | 2258 2% |
| Read Seq (MB/s) | 2202 | 1648 -25% | 2369 8% | 2315 5% | 2328 6% | 2283 4% |
| Write 4K Q32T1 (MB/s) | 494.5 | 429.9 -13% | 427.8 -13% | 407.1 -18% | 408.9 -17% | 491 -1% |
| Read 4K Q32T1 (MB/s) | 540 | 521 -4% | 543 1% | 411.9 -24% | 551 2% | 540 0% |
| Write Seq Q32T1 (MB/s) | 2623 | 2248 -14% | 2703 3% | 2844 8% | 1938 -26% | 2253 -14% |
| Read Seq Q32T1 (MB/s) | 3159 | 2484 -21% | 3387 7% | 3130 -1% | 3467 10% | 3172 0% |
| Totaal Gemiddelde (Programma / Instellingen) | 22% /
22% | 21% /
20% | 3% /
2% | 17% /
18% | 1% /
-2% |
* ... kleiner is beter

Disk Throttling: DiskSpd Read Loop, Queue Depth 8
| 3DMark 11 Performance | 27300 punten | |
| 3DMark Cloud Gate Standard Score | 54828 punten | |
| 3DMark Fire Strike Score | 21102 punten | |
| 3DMark Time Spy Score | 9921 punten | |
Help | ||
| lage | gem. | hoge | ultra | |
|---|---|---|---|---|
| The Witcher 3 (2015) | 389.7 | 274.2 | 186.2 | 97.7 |
| Dota 2 Reborn (2015) | 150 | 140 | 134 | 127 |
| Final Fantasy XV Benchmark (2018) | 193 | 134 | 103 | |
| X-Plane 11.11 (2018) | 128 | 114 | 93.8 |
| Alienware m17 R3 P45E GeForce RTX 2080 Super Mobile, i9-10980HK, 2x Micron 2200S 512 GB (RAID 0) | Eluktronics RP-17 GeForce RTX 2060 Mobile, R7 4800H, Phison PS5013 PRO-X-1TB-G2R NVMe SSD | MSI GS75 10SF-609US GeForce RTX 2070 Max-Q, i7-10875H, WDC PC SN730 SDBPNTY-512G | Asus Strix Scar 17 G732LXS GeForce RTX 2080 Super Mobile, i9-10980HK, 2x Intel SSD 660p 1TB SSDPEKNW010T8 (RAID 0) | MSI GE75 Raider 10SE-008US GeForce RTX 2060 Mobile, i7-10750H, Samsung SSD PM981 MZVLB512HAJQ | Razer Blade Pro 17 RTX 2070 Max-Q 300 Hz GeForce RTX 2070 Max-Q, i7-10875H, Lite-On CA5-8D512 | |
|---|---|---|---|---|---|---|
| Noise | 7% | -6% | -15% | -0% | 1% | |
| uit / omgeving * (dB) | 26.5 | 26.2 1% | 26.2 1% | 25 6% | 28.4 -7% | 28.2 -6% |
| Idle Minimum * (dB) | 27.8 | 26.2 6% | 31.2 -12% | 33 -19% | 30.2 -9% | 28.2 -1% |
| Idle Average * (dB) | 27.8 | 26.2 6% | 31.4 -13% | 38 -37% | 30.2 -9% | 28.2 -1% |
| Idle Maximum * (dB) | 27.8 | 30 -8% | 34 -22% | 45 -62% | 32 -15% | 30.5 -10% |
| Load Average * (dB) | 52.1 | 38.5 26% | 49.5 5% | 54 -4% | 33.2 36% | 42.2 19% |
| Witcher 3 ultra * (dB) | 51.8 | 47.2 9% | 50.6 2% | 50 3% | 55 -6% | 53 -2% |
| Load Maximum * (dB) | 59.1 | 54.6 8% | 60.7 -3% | 55 7% | 55 7% | 55.5 6% |
* ... kleiner is beter
Geluidsniveau
| Onbelast |
| 27.8 / 27.8 / 27.8 dB (A) |
| Belasting |
| 52.1 / 59.1 dB (A) |
 | ||
30 dB stil 40 dB(A) hoorbaar 50 dB(A) luid |
||
min: | ||
(-) De maximumtemperatuur aan de bovenzijde bedraagt 54 °C / 129 F, vergeleken met het gemiddelde van 40.4 °C / 105 F, variërend van 21.2 tot 68.8 °C voor de klasse Gaming.
(-) De bodem warmt op tot een maximum van 58.4 °C / 137 F, vergeleken met een gemiddelde van 43.2 °C / 110 F
(±) Bij onbelast gebruik bedraagt de gemiddelde temperatuur voor de bovenzijde 33.2 °C / 92 F, vergeleken met het apparaatgemiddelde van 33.9 °C / 93 F.
(-) Bij het spelen van The Witcher 3 is de gemiddelde temperatuur voor de bovenzijde 39.1 °C / 102 F, vergeleken met het apparaatgemiddelde van 33.9 °C / 93 F.
(+) De palmsteunen en het touchpad zijn met een maximum van ###max## °C / 88.2 F koeler dan de huidtemperatuur en voelen daarom koel aan.
(-) De gemiddelde temperatuur van de handpalmsteun van soortgelijke toestellen bedroeg 28.8 °C / 83.8 F (-2.4 °C / -4.4 F).
Alienware m17 R3 P45E audioanalyse
(+) | luidsprekers kunnen relatief luid spelen (87.5 dB)
Bas 100 - 315 Hz
(-) | bijna geen lage tonen - gemiddeld 17.9% lager dan de mediaan
(±) | lineariteit van de lage tonen is gemiddeld (9.6% delta ten opzichte van de vorige frequentie)
Midden 400 - 2000 Hz
(±) | hogere middens - gemiddeld 5.6% hoger dan de mediaan
(+) | de middentonen zijn lineair (4.5% delta ten opzichte van de vorige frequentie)
Hoog 2 - 16 kHz
(±) | higher highs - on average 5% higher than median
(+) | de hoge tonen zijn lineair (4.7% delta naar de vorige frequentie)
Algemeen 100 - 16.000 Hz
(±) | lineariteit van het totale geluid is gemiddeld (16.2% verschil met de mediaan)
Vergeleken met dezelfde klasse
» 40% van alle geteste apparaten in deze klasse waren beter, 7% vergelijkbaar, 54% slechter
» De beste had een delta van 6%, het gemiddelde was 18%, de slechtste was 132%
Vergeleken met alle geteste toestellen
» 26% van alle geteste apparaten waren beter, 6% gelijk, 68% slechter
» De beste had een delta van 4%, het gemiddelde was 24%, de slechtste was 134%
Apple MacBook 12 (Early 2016) 1.1 GHz audioanalyse
(+) | luidsprekers kunnen relatief luid spelen (83.6 dB)
Bas 100 - 315 Hz
(±) | verminderde zeebaars - gemiddeld 11.3% lager dan de mediaan
(±) | lineariteit van de lage tonen is gemiddeld (14.2% delta ten opzichte van de vorige frequentie)
Midden 400 - 2000 Hz
(+) | evenwichtige middens - slechts 2.4% verwijderd van de mediaan
(+) | de middentonen zijn lineair (5.5% delta ten opzichte van de vorige frequentie)
Hoog 2 - 16 kHz
(+) | evenwichtige hoogtepunten - slechts 2% verwijderd van de mediaan
(+) | de hoge tonen zijn lineair (4.5% delta naar de vorige frequentie)
Algemeen 100 - 16.000 Hz
(+) | het totale geluid is lineair (10.2% verschil met de mediaan)
Vergeleken met dezelfde klasse
» 7% van alle geteste apparaten in deze klasse waren beter, 2% vergelijkbaar, 91% slechter
» De beste had een delta van 5%, het gemiddelde was 18%, de slechtste was 53%
Vergeleken met alle geteste toestellen
» 5% van alle geteste apparaten waren beter, 1% gelijk, 94% slechter
» De beste had een delta van 4%, het gemiddelde was 24%, de slechtste was 134%
| Uit / Standby | |
| Inactief | |
| Belasting |
|
Key:
min: | |
| Alienware m17 R3 P45E i9-10980HK, GeForce RTX 2080 Super Mobile, 2x Micron 2200S 512 GB (RAID 0), IPS, 1920x1080, 17.3" | Eluktronics RP-17 R7 4800H, GeForce RTX 2060 Mobile, Phison PS5013 PRO-X-1TB-G2R NVMe SSD, IPS, 1920x1080, 17.3" | MSI GS75 10SF-609US i7-10875H, GeForce RTX 2070 Max-Q, WDC PC SN730 SDBPNTY-512G, IPS, 1920x1080, 17.3" | Asus Strix Scar 17 G732LXS i9-10980HK, GeForce RTX 2080 Super Mobile, 2x Intel SSD 660p 1TB SSDPEKNW010T8 (RAID 0), IPS, 1920x1080, 17.3" | MSI GE75 Raider 10SE-008US i7-10750H, GeForce RTX 2060 Mobile, Samsung SSD PM981 MZVLB512HAJQ, IPS, 1920x1080, 17.3" | Razer Blade Pro 17 RTX 2070 Max-Q 300 Hz i7-10875H, GeForce RTX 2070 Max-Q, Lite-On CA5-8D512, IPS, 1920x1080, 17.3" | |
|---|---|---|---|---|---|---|
| Power Consumption | 36% | 35% | 21% | 41% | 35% | |
| Idle Minimum * (Watt) | 33.6 | 20.2 40% | 19.2 43% | 16 52% | 14.7 56% | 19.6 42% |
| Idle Average * (Watt) | 43.9 | 24.5 44% | 22.4 49% | 25 43% | 20.4 54% | 21.7 51% |
| Idle Maximum * (Watt) | 59 | 28.7 51% | 34.7 41% | 35 41% | 26.9 54% | 36.1 39% |
| Load Average * (Watt) | 134.9 | 110.4 18% | 106.7 21% | 177 -31% | 93.2 31% | 115.6 14% |
| Witcher 3 ultra * (Watt) | 242 | 166.3 31% | 160.5 34% | 227 6% | 185.4 23% | 157 35% |
| Load Maximum * (Watt) | 320 | 217.4 32% | 248.7 22% | 280 12% | 237.8 26% | 219.9 31% |
* ... kleiner is beter
| Alienware m17 R3 P45E i9-10980HK, GeForce RTX 2080 Super Mobile, 86 Wh | Eluktronics RP-17 R7 4800H, GeForce RTX 2060 Mobile, 62 Wh | MSI GS75 10SF-609US i7-10875H, GeForce RTX 2070 Max-Q, 80.25 Wh | Asus Strix Scar 17 G732LXS i9-10980HK, GeForce RTX 2080 Super Mobile, 66 Wh | MSI GE75 Raider 10SE-008US i7-10750H, GeForce RTX 2060 Mobile, 65 Wh | Razer Blade Pro 17 RTX 2070 Max-Q 300 Hz i7-10875H, GeForce RTX 2070 Max-Q, 70 Wh | |
|---|---|---|---|---|---|---|
| Batterijduur | 48% | 224% | 123% | 16% | 53% | |
| Reader / Idle (h) | 3.7 | 8.6 132% | 10 170% | |||
| WiFi v1.3 (h) | 3.2 | 4.4 38% | 4.9 53% | 5.9 84% | 3.7 16% | 4.9 53% |
| Load (h) | 0.7 | 1.1 57% | 4.1 486% | 1.5 114% |
Pro
Contra
Voor het volledige, Engelse testrapport, klik hier.
In tegenstelling tot de MSI GS75 of Razer Blade Pro die afhankelijk zijn van Max-Q GPU's, slaagt de Alienware m17 R3 erin om in een krachtige mobiele GeForce RTX 2080 Super te passen voor merkbaar snellere prestaties in games. Liefhebbers die op zoek zijn naar 1080p-gaming met 60+ FPS of 4K60, zullen de extra pk's waarderen die de Alienware kan bieden ten opzichte van de meeste andere ultradunne gaming-laptops. De kloksnelheden van Turbo Boost zijn consistent in de tijd, wat indrukwekkend is voor zo'n dun chassis met zowel een ontgrendelde Core i9 CPU als een GeForce Super GPU.
Grote nadelen zijn onder meer het zware gewicht en de luide ventilatoren, zelfs voor een 17,3-inch gaminglaptop. De m17 R3 is ondanks hun identieke chassis niet stiller, koeler,degelijker of lichter dan de m17 R2. Het is beslist sneller, maar alle bestaande nadelen worden daardoor versterkt. Voor sommige hardcore gamers is dat de prijs misschien wel waard.
De Alienware m17 R3 is de snelste 17,3-inch gaminglaptop die je met deze dikte kunt krijgen, aangezien de meeste andere in deze categorie alleen met langzamere Max-Q-opties worden geleverd. Het is een "prestatie ten koste van alles" -benadering die werkt zolang je je bewust bent van het zware gewicht en de luide ventilatoren.
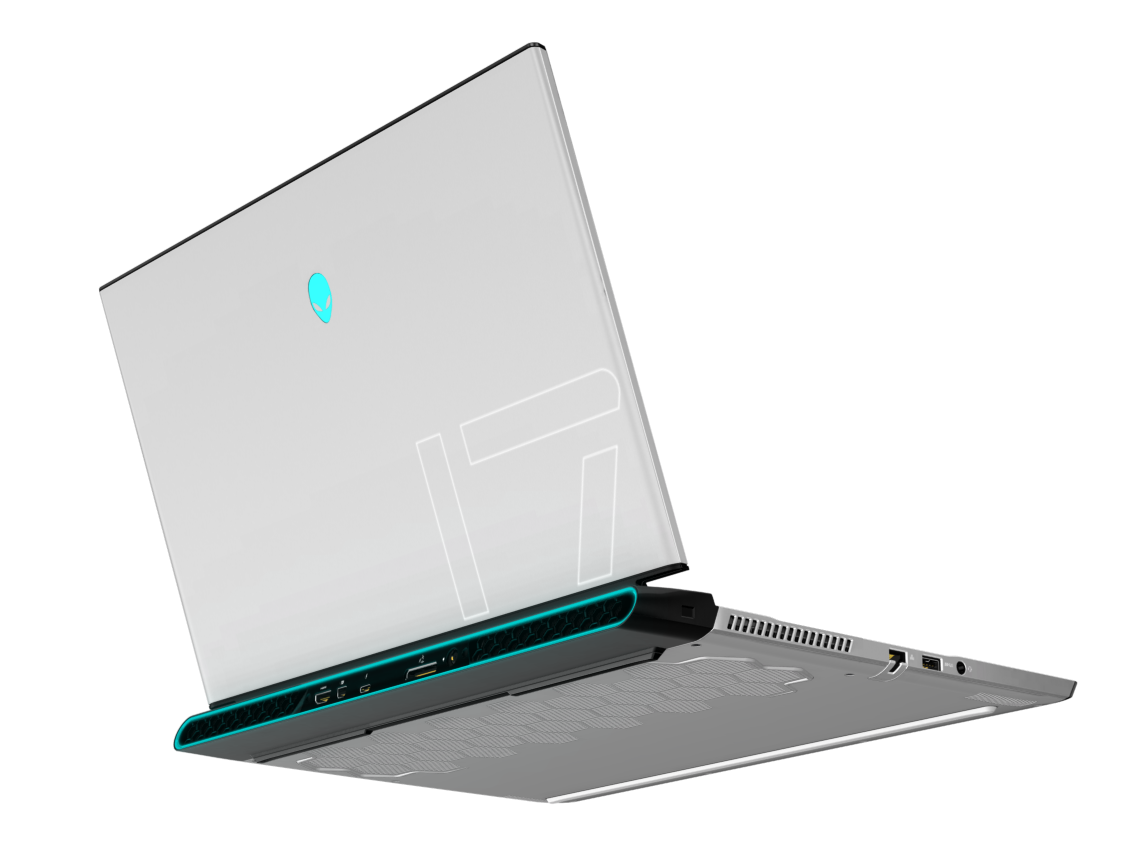
Alienware m17 R3 P45E
- 04-09-2020 v7 (old)
Allen Ngo
Price comparison
