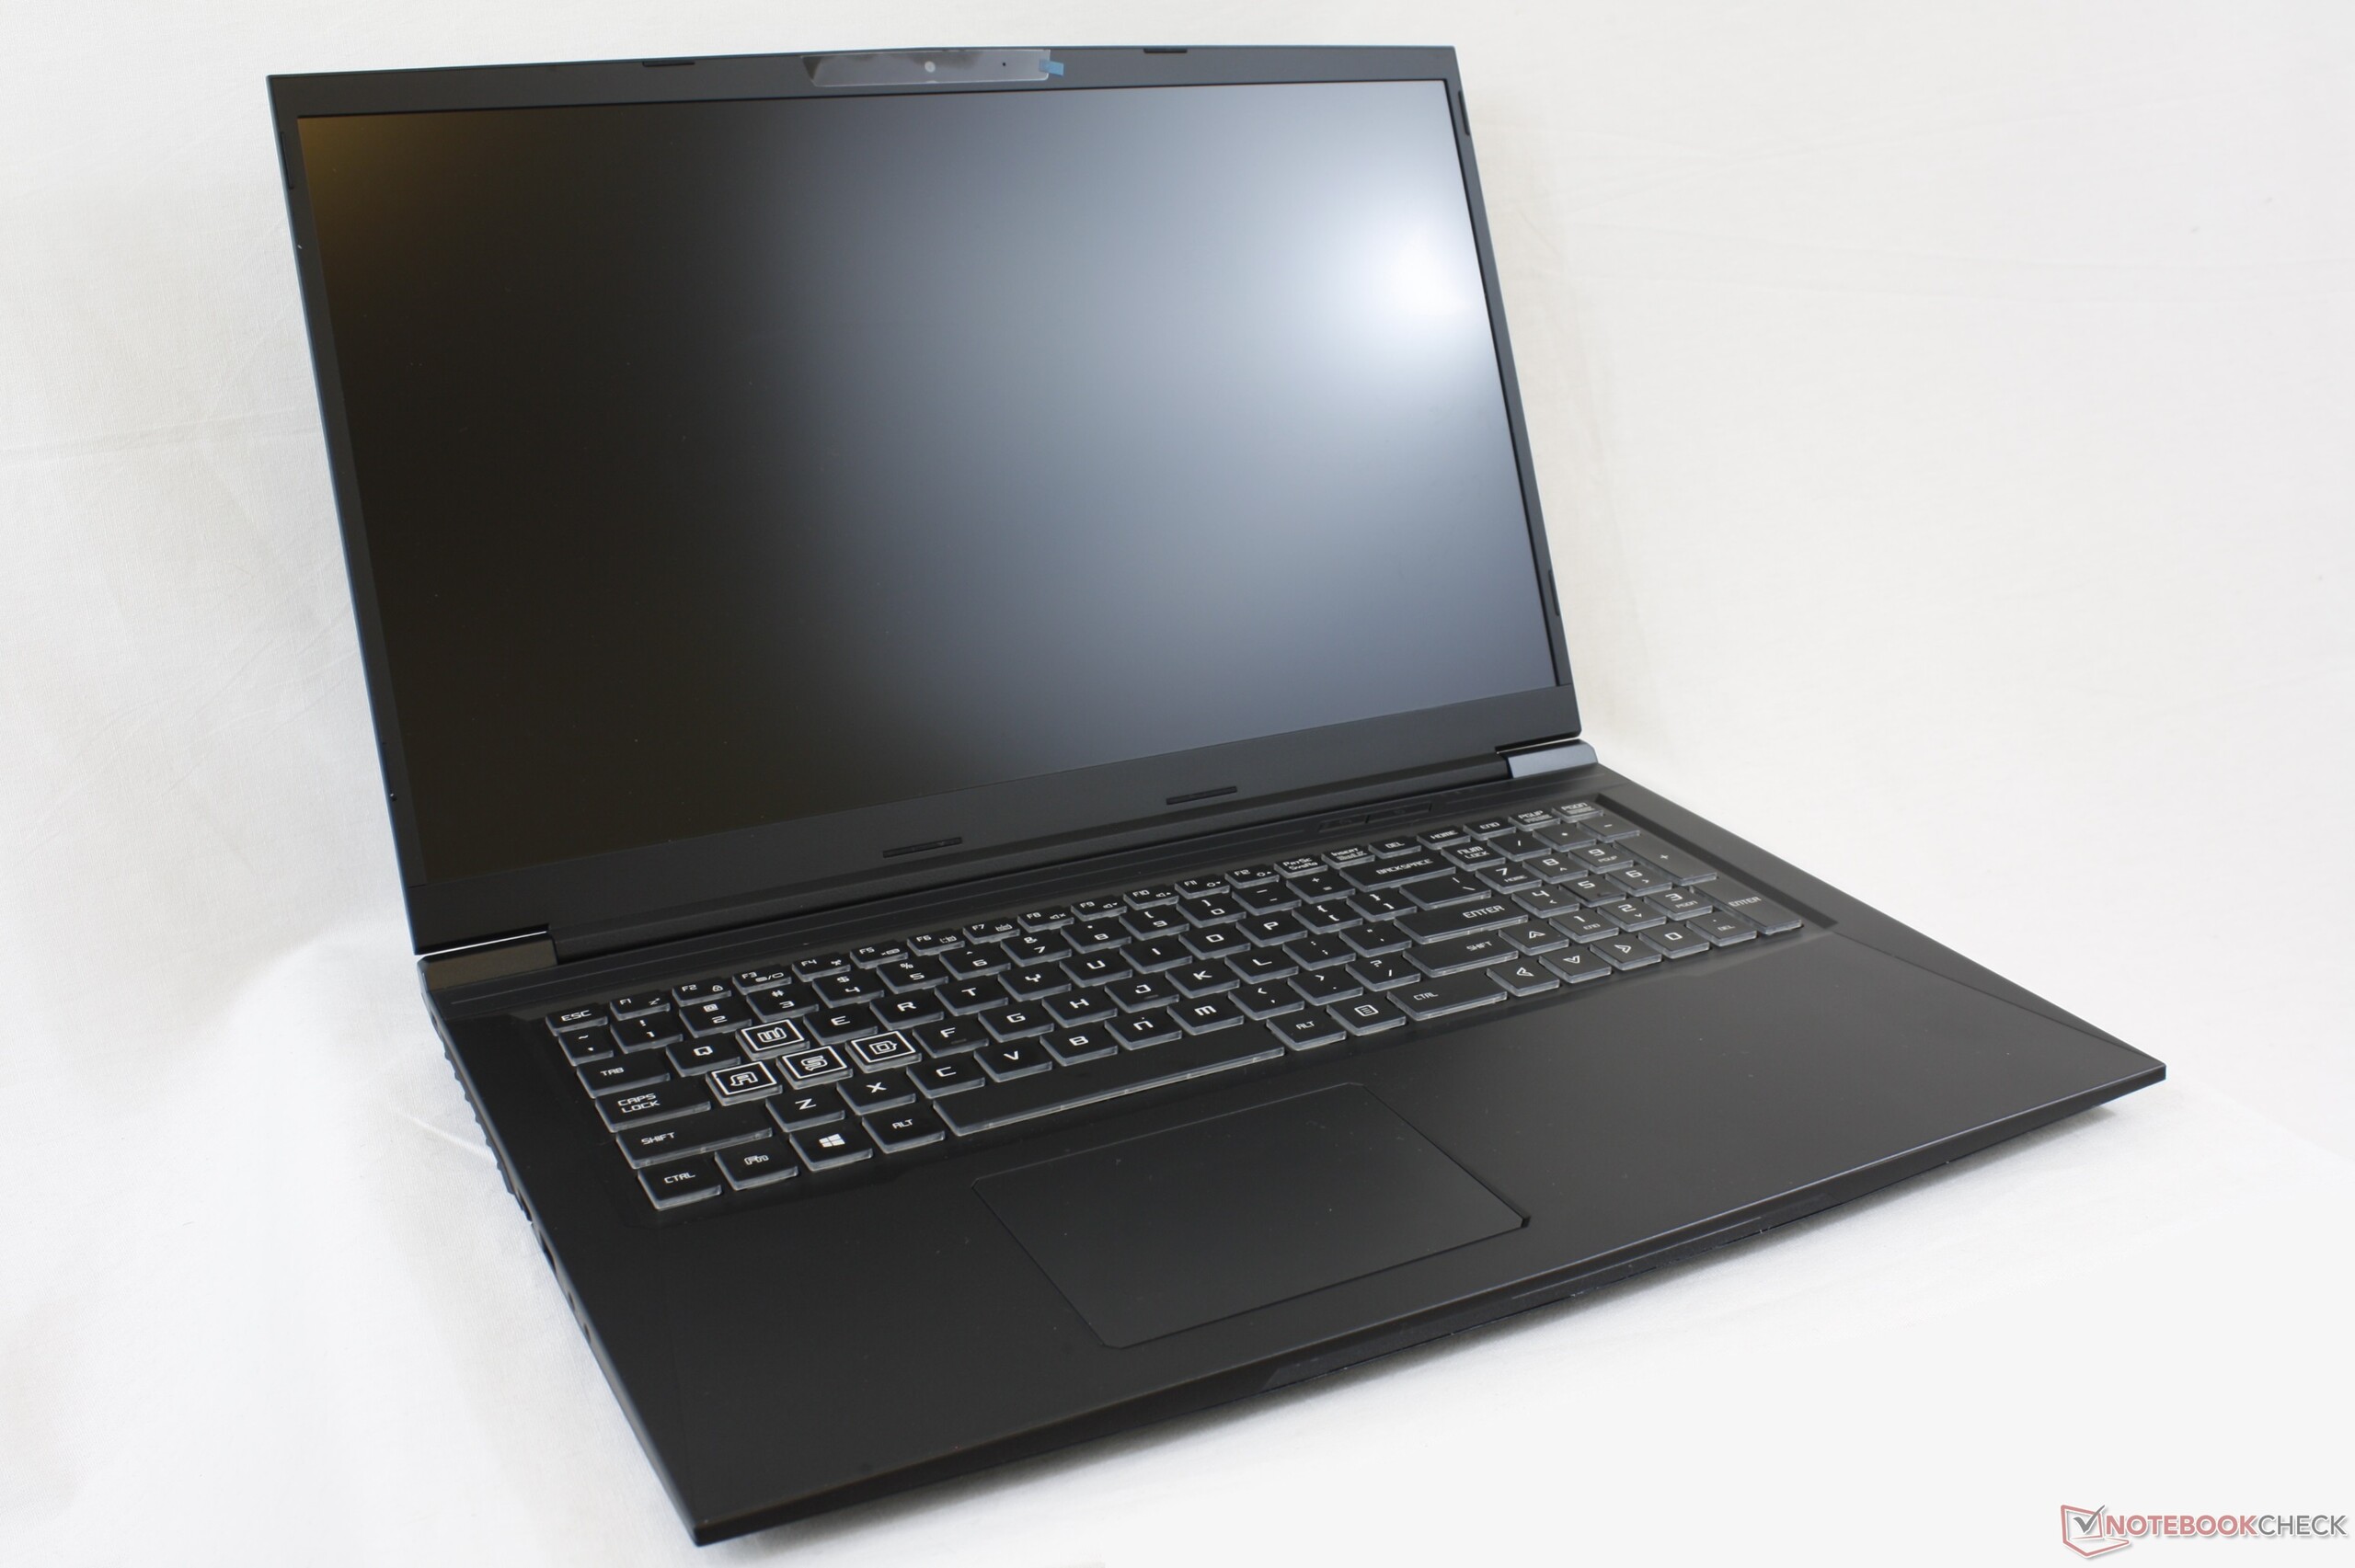
Kort testrapport Eluktronics Matrix RP-17 Laptop: Core i9-prestaties zonder de Core i9-prijs
Evaluatie | Datum | Model | Gewicht | Hoogte | Formaat | Resolutie | Beste prijs |
|---|---|---|---|---|---|---|---|
| 84.3 % v7 (old) | 08-2020 | Eluktronics RP-17 R7 4800H, GeForce RTX 2060 Mobile | 2.6 kg | 30 mm | 17.30" | 1920x1080 | |
| 85.1 % v7 (old) | 07-2020 | MSI GE75 Raider 10SE-008US i7-10750H, GeForce RTX 2060 Mobile | 2.6 kg | 27.5 mm | 17.30" | 1920x1080 | |
| 87.4 % v7 (old) | 06-2020 | Razer Blade Pro 17 RTX 2070 Max-Q 300 Hz i7-10875H, GeForce RTX 2070 Max-Q | 2.7 kg | 19.9 mm | 17.30" | 1920x1080 | |
| 82.9 % v7 (old) | 05-2020 | Asus TUF A17 FA706IU-AS76 R7 4800H, GeForce GTX 1660 Ti Mobile | 2.6 kg | 26 mm | 17.30" | 1920x1080 | |
| 84.5 % v7 (old) | Walmart EVOO Gaming 17 i7-9750H, GeForce RTX 2060 Mobile | 2.5 kg | 27.5 mm | 17.30" | 1920x1080 | ||
| 82.4 % v7 (old) | 12-2019 | Aorus 17 YA i9-9980HK, GeForce RTX 2080 Mobile | 3.8 kg | 38 mm | 17.30" | 1920x1080 |
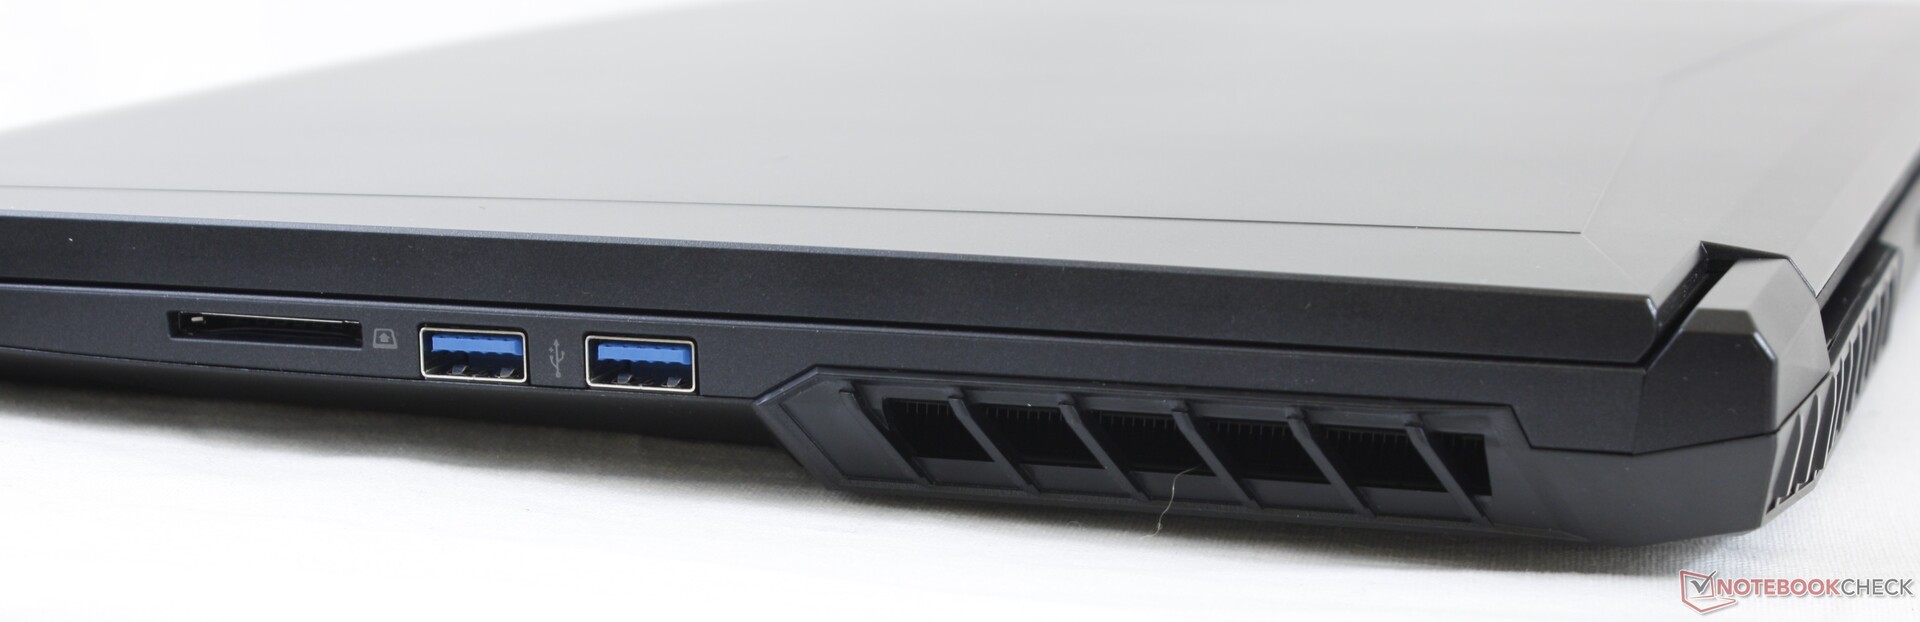
| SD Card Reader | |
| average JPG Copy Test (av. of 3 runs) | |
| Razer Blade Pro 17 RTX 2070 Max-Q 300 Hz (Toshiba Exceria Pro SDXC 64 GB UHS-II) | |
| Aorus 17 YA (Toshiba Exceria Pro SDXC 64 GB UHS-II) | |
| Walmart EVOO Gaming 17 (Toshiba Exceria Pro SDXC 64 GB UHS-II) | |
| Eluktronics RP-17 (Toshiba Exceria Pro SDXC 64 GB UHS-II) | |
| MSI GE75 Raider 10SE-008US (Toshiba Exceria Pro SDXC 64 GB UHS-II) | |
| maximum AS SSD Seq Read Test (1GB) | |
| Aorus 17 YA (Toshiba Exceria Pro SDXC 64 GB UHS-II) | |
| Razer Blade Pro 17 RTX 2070 Max-Q 300 Hz (Toshiba Exceria Pro SDXC 64 GB UHS-II) | |
| Walmart EVOO Gaming 17 (Toshiba Exceria Pro SDXC 64 GB UHS-II) | |
| Eluktronics RP-17 (Toshiba Exceria Pro SDXC 64 GB UHS-II) | |
| MSI GE75 Raider 10SE-008US (Toshiba Exceria Pro SDXC 64 GB UHS-II) | |


| |||||||||||||||||||||||||
Helderheidsverdeling: 91 %
Helderheid in Batterij-modus: 311.5 cd/m²
Contrast: 1005:1 (Zwart: 0.31 cd/m²)
ΔE ColorChecker Calman: 4.13 | ∀{0.5-29.43 Ø4.73}
calibrated: 2.93
ΔE Greyscale Calman: 3.3 | ∀{0.09-98 Ø4.97}
91.6% sRGB (Argyll 1.6.3 3D)
59.5% AdobeRGB 1998 (Argyll 1.6.3 3D)
65.8% AdobeRGB 1998 (Argyll 3D)
92% sRGB (Argyll 3D)
64.7% Display P3 (Argyll 3D)
Gamma: 2.17
CCT: 7157 K
| Eluktronics RP-17 BOE NV173FHM-N44, IPS, 17.3", 1920x1080 | MSI GE75 Raider 10SE-008US Chi Mei N173HCE-G33, IPS, 17.3", 1920x1080 | Razer Blade Pro 17 RTX 2070 Max-Q 300 Hz Sharp LQ173M1JW02, IPS, 17.3", 1920x1080 | Asus TUF A17 FA706IU-AS76 BOE NV173FHM-NX1, IPS, 17.3", 1920x1080 | Walmart EVOO Gaming 17 BOE HF N173FHM-N44, IPS, 17.3", 1920x1080 | Aorus 17 YA AU Optronics B173HAN05.0 (AUO509D), IPS, 17.3", 1920x1080 | |
|---|---|---|---|---|---|---|
| Display | 4% | 10% | -36% | 1% | 8% | |
| Display P3 Coverage (%) | 64.7 | 65.6 1% | 72.2 12% | 40.55 -37% | 65.5 1% | 70.1 8% |
| sRGB Coverage (%) | 92 | 98.1 7% | 98.5 7% | 59.7 -35% | 92.2 0% | 98 7% |
| AdobeRGB 1998 Coverage (%) | 65.8 | 67.8 3% | 73 11% | 41.89 -36% | 66.7 1% | 72.4 10% |
| Response Times | 49% | 48% | -30% | 7% | 18% | |
| Response Time Grey 50% / Grey 80% * (ms) | 22.4 ? | 6.8 ? 70% | 5.6 ? 75% | 22.4 ? -0% | 17.6 ? 21% | 16 ? 29% |
| Response Time Black / White * (ms) | 12 ? | 8.8 ? 27% | 9.6 ? 20% | 19.2 ? -60% | 12.8 ? -7% | 11.2 ? 7% |
| PWM Frequency (Hz) | 943 | 25000 ? | 980 ? | |||
| Screen | 19% | -11% | -26% | 11% | 29% | |
| Brightness middle (cd/m²) | 311.5 | 337.9 8% | 328 5% | 264.8 -15% | 314.2 1% | 253 -19% |
| Brightness (cd/m²) | 301 | 305 1% | 329 9% | 253 -16% | 307 2% | 252 -16% |
| Brightness Distribution (%) | 91 | 81 -11% | 78 -14% | 90 -1% | 92 1% | 93 2% |
| Black Level * (cd/m²) | 0.31 | 0.29 6% | 0.35 -13% | 0.31 -0% | 0.26 16% | 0.2 35% |
| Contrast (:1) | 1005 | 1165 16% | 937 -7% | 854 -15% | 1208 20% | 1265 26% |
| Colorchecker dE 2000 * | 4.13 | 2.18 47% | 4.74 -15% | 4.73 -15% | 3.15 24% | 1.14 72% |
| Colorchecker dE 2000 max. * | 7.32 | 3.9 47% | 8.99 -23% | 18.89 -158% | 5.4 26% | 2.01 73% |
| Colorchecker dE 2000 calibrated * | 2.93 | 0.69 76% | 2.12 28% | 4.64 -58% | 2.74 6% | 1.01 66% |
| Greyscale dE 2000 * | 3.3 | 3.1 6% | 6.8 -106% | 1.4 58% | 2.6 21% | 1.12 66% |
| Gamma | 2.17 101% | 2.07 106% | 2.2 100% | 2.16 102% | 2.31 95% | 2.43 91% |
| CCT | 7157 91% | 6882 94% | 6446 101% | 6641 98% | 6928 94% | 6366 102% |
| Color Space (Percent of AdobeRGB 1998) (%) | 59.5 | 62 4% | 64.8 9% | 38.4 -35% | 59.6 0% | 66 11% |
| Color Space (Percent of sRGB) (%) | 91.6 | 98.2 7% | 98.6 8% | 59.3 -35% | 91.8 0% | 98 7% |
| Totaal Gemiddelde (Programma / Instellingen) | 24% /
20% | 16% /
0% | -31% /
-29% | 6% /
8% | 18% /
24% |
* ... kleiner is beter
Responstijd Scherm
| ↔ Responstijd Zwart naar Wit | ||
|---|---|---|
| 12 ms ... stijging ↗ en daling ↘ gecombineerd | ↗ 7.2 ms stijging | 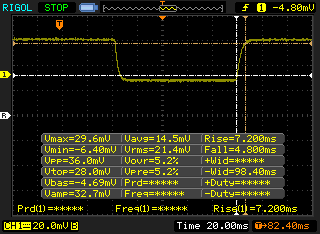 |
| ↘ 4.8 ms daling | ||
| Het scherm vertoonde prima responstijden in onze tests maar is misschien wat te traag voor competitieve games. Ter vergelijking: alle testtoestellen variëren van 0.1 (minimum) tot 240 (maximum) ms. » 31 % van alle toestellen zijn beter. Dit betekent dat de gemeten responstijd beter is dan het gemiddelde (19.9 ms) van alle geteste toestellen. | ||
| ↔ Responstijd 50% Grijs naar 80% Grijs | ||
| 22.4 ms ... stijging ↗ en daling ↘ gecombineerd | ↗ 10.8 ms stijging | 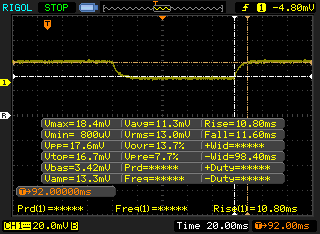 |
| ↘ 11.6 ms daling | ||
| Het scherm vertoonde prima responstijden in onze tests maar is misschien wat te traag voor competitieve games. Ter vergelijking: alle testtoestellen variëren van 0.165 (minimum) tot 636 (maximum) ms. » 34 % van alle toestellen zijn beter. Dit betekent dat de gemeten responstijd beter is dan het gemiddelde (31.1 ms) van alle geteste toestellen. | ||
Screen Flickering / PWM (Pulse-Width Modulation)
| Screen flickering / PWM waargenomen | 943 Hz | 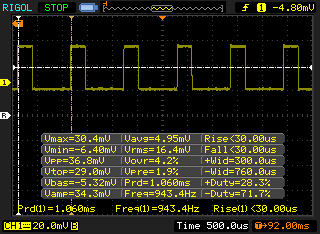 | |
De achtergrondverlichting van het scherm flikkert op 943 Hz (in het slechtste geval, bijvoorbeeld bij gebruik van PWM) . De frequentie van 943 Hz is redelijk hoog en de meeste mensen die gevoelig zijn aan flickering zouden dit dus niet mogen waarnemen of geïrriteerde ogen krijgen. Ter vergelijking: 52 % van alle geteste toestellen maakten geen gebruik van PWM om de schermhelderheid te verlagen. Als het wel werd gebruikt, werd een gemiddelde van 7798 (minimum: 5 - maximum: 343500) Hz waargenomen. | |||

Cinebench R15: CPU Multi 64Bit | CPU Single 64Bit
Blender: v2.79 BMW27 CPU
7-Zip 18.03: 7z b 4 -mmt1 | 7z b 4
Geekbench 5.5: Single-Core | Multi-Core
HWBOT x265 Benchmark v2.2: 4k Preset
LibreOffice : 20 Documents To PDF
R Benchmark 2.5: Overall mean
| Cinebench R20 / CPU (Multi Core) | |
| Intel Core i9-10900K | |
| MSI GT76 Titan DT 9SG | |
| Eluktronics RP-17 | |
| Asus Zephyrus G14 GA401IV | |
| Gemiddeld AMD Ryzen 7 4800H (3692 - 4663, n=18) | |
| MSI GS75 10SF-609US | |
| Asus Strix Scar 17 G732LXS | |
| MSI GE75 9SG | |
| Acer Nitro 5 AN515-44-R5FT | |
| MSI GE75 Raider 10SE-008US | |
| Schenker XMG Pro 17 PB71RD-G | |
| Cinebench R20 / CPU (Single Core) | |
| Intel Core i9-10900K | |
| MSI GT76 Titan DT 9SG | |
| Asus Zephyrus G14 GA401IV | |
| Asus Strix Scar 17 G732LXS | |
| Eluktronics RP-17 | |
| Gemiddeld AMD Ryzen 7 4800H (462 - 491, n=17) | |
| MSI GS75 10SF-609US | |
| MSI GE75 Raider 10SE-008US | |
| MSI GE75 9SG | |
| Acer Nitro 5 AN515-44-R5FT | |
| Schenker XMG Pro 17 PB71RD-G | |
| Cinebench R15 / CPU Multi 64Bit | |
| Intel Core i9-10900K | |
| MSI GT76 Titan DT 9SG | |
| Eluktronics RP-17 | |
| Asus Zephyrus G14 GA401IV | |
| Gemiddeld AMD Ryzen 7 4800H (1652 - 1995, n=21) | |
| Asus Strix Scar 17 G732LXS | |
| MSI GE75 9SG | |
| MSI GS75 10SF-609US | |
| Acer Nitro 5 AN515-44-R5FT | |
| MSI GE75 Raider 10SE-008US | |
| Schenker XMG Pro 17 PB71RD-G | |
| Cinebench R15 / CPU Single 64Bit | |
| Intel Core i9-10900K | |
| MSI GT76 Titan DT 9SG | |
| Asus Strix Scar 17 G732LXS | |
| MSI GS75 10SF-609US | |
| Asus Zephyrus G14 GA401IV | |
| MSI GE75 9SG | |
| MSI GE75 Raider 10SE-008US | |
| Gemiddeld AMD Ryzen 7 4800H (186 - 191, n=15) | |
| Eluktronics RP-17 | |
| Acer Nitro 5 AN515-44-R5FT | |
| Schenker XMG Pro 17 PB71RD-G | |
| Blender / v2.79 BMW27 CPU | |
| Schenker XMG Pro 17 PB71RD-G | |
| MSI GE75 Raider 10SE-008US | |
| Acer Nitro 5 AN515-44-R5FT | |
| Asus Zephyrus G14 GA401IV | |
| MSI GE75 9SG | |
| Asus Strix Scar 17 G732LXS | |
| MSI GS75 10SF-609US | |
| Gemiddeld AMD Ryzen 7 4800H (248 - 299, n=15) | |
| Eluktronics RP-17 | |
| Intel Core i9-10900K | |
| 7-Zip 18.03 / 7z b 4 -mmt1 | |
| Intel Core i9-10900K | |
| Asus Strix Scar 17 G732LXS | |
| MSI GS75 10SF-609US | |
| MSI GE75 Raider 10SE-008US | |
| MSI GE75 9SG | |
| Gemiddeld AMD Ryzen 7 4800H (4575 - 4743, n=15) | |
| Asus Zephyrus G14 GA401IV | |
| Eluktronics RP-17 | |
| Schenker XMG Pro 17 PB71RD-G | |
| Acer Nitro 5 AN515-44-R5FT | |
| 7-Zip 18.03 / 7z b 4 | |
| Intel Core i9-10900K | |
| Eluktronics RP-17 | |
| Gemiddeld AMD Ryzen 7 4800H (44827 - 53883, n=15) | |
| Asus Zephyrus G14 GA401IV | |
| MSI GS75 10SF-609US | |
| MSI GE75 9SG | |
| Asus Strix Scar 17 G732LXS | |
| Acer Nitro 5 AN515-44-R5FT | |
| MSI GE75 Raider 10SE-008US | |
| Schenker XMG Pro 17 PB71RD-G | |
| Geekbench 5.5 / Single-Core | |
| Intel Core i9-10900K | |
| Asus Strix Scar 17 G732LXS | |
| MSI GT76 Titan DT 9SG | |
| MSI GS75 10SF-609US | |
| MSI GE75 Raider 10SE-008US | |
| Asus Zephyrus G14 GA401IV | |
| Gemiddeld AMD Ryzen 7 4800H (1154 - 1207, n=17) | |
| Eluktronics RP-17 | |
| Schenker XMG Pro 17 PB71RD-G | |
| Acer Nitro 5 AN515-44-R5FT | |
| Geekbench 5.5 / Multi-Core | |
| Intel Core i9-10900K | |
| MSI GT76 Titan DT 9SG | |
| Asus Strix Scar 17 G732LXS | |
| MSI GS75 10SF-609US | |
| Eluktronics RP-17 | |
| Gemiddeld AMD Ryzen 7 4800H (5920 - 8672, n=17) | |
| Asus Zephyrus G14 GA401IV | |
| MSI GE75 Raider 10SE-008US | |
| Acer Nitro 5 AN515-44-R5FT | |
| Schenker XMG Pro 17 PB71RD-G | |
| HWBOT x265 Benchmark v2.2 / 4k Preset | |
| Intel Core i9-10900K | |
| Eluktronics RP-17 | |
| MSI GS75 10SF-609US | |
| Gemiddeld AMD Ryzen 7 4800H (10.8 - 14.1, n=16) | |
| Asus Strix Scar 17 G732LXS | |
| Asus Zephyrus G14 GA401IV | |
| MSI GE75 9SG | |
| MSI GE75 Raider 10SE-008US | |
| Acer Nitro 5 AN515-44-R5FT | |
| Schenker XMG Pro 17 PB71RD-G | |
| LibreOffice / 20 Documents To PDF | |
| Intel Core i9-10900K | |
| Acer Nitro 5 AN515-44-R5FT | |
| Gemiddeld AMD Ryzen 7 4800H (28.6 - 95.8, n=14) | |
| Eluktronics RP-17 | |
| MSI GE75 Raider 10SE-008US | |
| Asus Strix Scar 17 G732LXS | |
| MSI GS75 10SF-609US | |
| R Benchmark 2.5 / Overall mean | |
| Schenker XMG Pro 17 PB71RD-G | |
| Acer Nitro 5 AN515-44-R5FT | |
| MSI GE75 Raider 10SE-008US | |
| MSI GS75 10SF-609US | |
| Eluktronics RP-17 | |
| Asus Strix Scar 17 G732LXS | |
| Gemiddeld AMD Ryzen 7 4800H (0.562 - 0.603, n=15) | |
| Intel Core i9-10900K | |
* ... kleiner is beter
| PCMark 8 | |
| Home Score Accelerated v2 | |
| Aorus 17 YA | |
| Razer Blade Pro 17 RTX 2070 Max-Q 300 Hz | |
| Gemiddeld AMD Ryzen 7 4800H, NVIDIA GeForce RTX 2060 Mobile (4698 - 5197, n=4) | |
| Eluktronics RP-17 | |
| Asus TUF A17 FA706IU-AS76 | |
| MSI GE75 Raider 10SE-008US | |
| Walmart EVOO Gaming 17 | |
| Work Score Accelerated v2 | |
| Aorus 17 YA | |
| Razer Blade Pro 17 RTX 2070 Max-Q 300 Hz | |
| MSI GE75 Raider 10SE-008US | |
| Gemiddeld AMD Ryzen 7 4800H, NVIDIA GeForce RTX 2060 Mobile (5742 - 5983, n=4) | |
| Asus TUF A17 FA706IU-AS76 | |
| Walmart EVOO Gaming 17 | |
| Eluktronics RP-17 | |
| PCMark 8 Home Score Accelerated v2 | 4816 punten | |
| PCMark 8 Work Score Accelerated v2 | 5742 punten | |
| PCMark 10 Score | 5454 punten | |
Help | ||
| DPC Latencies / LatencyMon - interrupt to process latency (max), Web, Youtube, Prime95 | |
| Asus TUF A17 FA706IU-AS76 | |
| MSI GE75 Raider 10SE-008US | |
| Eluktronics RP-17 | |
| Razer Blade Pro 17 RTX 2070 Max-Q 300 Hz | |
* ... kleiner is beter
| Eluktronics RP-17 Phison PS5013 PRO-X-1TB-G2R NVMe SSD | MSI GE75 Raider 10SE-008US Samsung SSD PM981 MZVLB512HAJQ | Razer Blade Pro 17 RTX 2070 Max-Q 300 Hz Lite-On CA5-8D512 | Asus TUF A17 FA706IU-AS76 Intel SSD 660p 1TB SSDPEKNW010T8 | Walmart EVOO Gaming 17 Intel SSD 660p 1TB SSDPEKNW010T8 | Aorus 17 YA Intel SSD 760p SSDPEKKW010T8 | |
|---|---|---|---|---|---|---|
| AS SSD | 3% | -27% | -22% | -29% | -9% | |
| Seq Read (MB/s) | 1689 | 2036 21% | 2019 20% | 1320 -22% | 1038 -39% | 2716 61% |
| Seq Write (MB/s) | 1695 | 1835 8% | 1314 -22% | 1539 -9% | 1604 -5% | 1561 -8% |
| 4K Read (MB/s) | 50 | 60.6 21% | 46.61 -7% | 56.3 13% | 42.9 -14% | 34.96 -30% |
| 4K Write (MB/s) | 182.9 | 127.2 -30% | 90.2 -51% | 158.5 -13% | 107.4 -41% | 118.9 -35% |
| 4K-64 Read (MB/s) | 1043 | 1601 53% | 665 -36% | 586 -44% | 583 -44% | 926 -11% |
| 4K-64 Write (MB/s) | 1841 | 1734 -6% | 813 -56% | 820 -55% | 725 -61% | 979 -47% |
| Access Time Read * (ms) | 0.04 | 0.049 -23% | 0.058 -45% | 0.043 -8% | 0.045 -13% | 0.052 -30% |
| Access Time Write * (ms) | 0.102 | 0.09 12% | 0.167 -64% | 0.113 -11% | 0.127 -25% | 0.03 71% |
| Score Read (Points) | 1262 | 1865 48% | 913 -28% | 775 -39% | 730 -42% | 1232 -2% |
| Score Write (Points) | 2194 | 2045 -7% | 1034 -53% | 1132 -48% | 992 -55% | 1254 -43% |
| Score Total (Points) | 4112 | 4863 18% | 2392 -42% | 2333 -43% | 2137 -48% | 3062 -26% |
| Copy ISO MB/s (MB/s) | 2124 | 1900 -11% | 1715 -19% | 1736 -18% | 1612 -24% | |
| Copy Program MB/s (MB/s) | 579 | 205.5 -65% | 622 7% | 553 -4% | 564 -3% | |
| Copy Game MB/s (MB/s) | 1304 | 1419 9% | 1506 15% | 1264 -3% | 1328 2% | |
| CrystalDiskMark 5.2 / 6 | 4% | 7% | -6% | -12% | 8% | |
| Write 4K (MB/s) | 226.1 | 139.2 -38% | 119 -47% | 189.7 -16% | 134 -41% | 139.6 -38% |
| Read 4K (MB/s) | 54.7 | 53 -3% | 51.9 -5% | 62.3 14% | 55.5 1% | 62.9 15% |
| Write Seq (MB/s) | 1868 | 1950 4% | 2258 21% | 1681 -10% | 1292 -31% | 1573 -16% |
| Read Seq (MB/s) | 1648 | 2328 41% | 2283 39% | 1608 -2% | 1476 -10% | 2808 70% |
| Write 4K Q32T1 (MB/s) | 429.9 | 408.9 -5% | 491 14% | 468.6 9% | 545 27% | 509 18% |
| Read 4K Q32T1 (MB/s) | 521 | 551 6% | 540 4% | 541 4% | 582 12% | 639 23% |
| Write Seq Q32T1 (MB/s) | 2248 | 1938 -14% | 2253 0% | 1770 -21% | 1746 -22% | 1573 -30% |
| Read Seq Q32T1 (MB/s) | 2484 | 3467 40% | 3172 28% | 1898 -24% | 1793 -28% | 3082 24% |
| Totaal Gemiddelde (Programma / Instellingen) | 4% /
4% | -10% /
-15% | -14% /
-16% | -21% /
-23% | -1% /
-2% |
* ... kleiner is beter

Disk Throttling: DiskSpd Read Loop, Queue Depth 8
| 3DMark 11 Performance | 20068 punten | |
| 3DMark Cloud Gate Standard Score | 39513 punten | |
| 3DMark Fire Strike Score | 15584 punten | |
| 3DMark Time Spy Score | 6680 punten | |
Help | ||
| Final Fantasy XV Benchmark - 1920x1080 High Quality | |
| Intel Core i9-10900K | |
| Asus Strix Scar 17 G732LXS | |
| MSI RTX 2060 Gaming Z 6G | |
| Eluktronics RP-17 | |
| Asus Zephyrus G14 GA401IV | |
| Gemiddeld NVIDIA GeForce RTX 2060 Mobile (52 - 67.5, n=7) | |
| Acer Nitro 5 AN515-44-R5FT | |
| Asus TUF FX705DT-AU068T | |
| lage | gem. | hoge | ultra | 4K | |
|---|---|---|---|---|---|
| The Witcher 3 (2015) | 266.5 | 121.9 | 62.1 | ||
| Dota 2 Reborn (2015) | 118 | 113 | 105 | 101 | 87 |
| Final Fantasy XV Benchmark (2018) | 144 | 85.6 | 66.1 | ||
| X-Plane 11.11 (2018) | 92.1 | 81.8 | 68.8 |
| Eluktronics RP-17 GeForce RTX 2060 Mobile, R7 4800H, Phison PS5013 PRO-X-1TB-G2R NVMe SSD | MSI GE75 Raider 10SE-008US GeForce RTX 2060 Mobile, i7-10750H, Samsung SSD PM981 MZVLB512HAJQ | Razer Blade Pro 17 RTX 2070 Max-Q 300 Hz GeForce RTX 2070 Max-Q, i7-10875H, Lite-On CA5-8D512 | Asus TUF A17 FA706IU-AS76 GeForce GTX 1660 Ti Mobile, R7 4800H, Intel SSD 660p 1TB SSDPEKNW010T8 | Walmart EVOO Gaming 17 GeForce RTX 2060 Mobile, i7-9750H, Intel SSD 660p 1TB SSDPEKNW010T8 | Aorus 17 YA GeForce RTX 2080 Mobile, i9-9980HK, Intel SSD 760p SSDPEKKW010T8 | |
|---|---|---|---|---|---|---|
| Noise | -7% | -7% | -8% | -0% | -44% | |
| uit / omgeving * (dB) | 26.2 | 28.4 -8% | 28.2 -8% | 28.7 -10% | 28.7 -10% | 30 -15% |
| Idle Minimum * (dB) | 26.2 | 30.2 -15% | 28.2 -8% | 28.7 -10% | 28.7 -10% | 42 -60% |
| Idle Average * (dB) | 26.2 | 30.2 -15% | 28.2 -8% | 30.5 -16% | 28.7 -10% | 44 -68% |
| Idle Maximum * (dB) | 30 | 32 -7% | 30.5 -2% | 32.5 -8% | 29.5 2% | 52 -73% |
| Load Average * (dB) | 38.5 | 33.2 14% | 42.2 -10% | 42.5 -10% | 31.4 18% | 56 -45% |
| Witcher 3 ultra * (dB) | 47.2 | 55 -17% | 53 -12% | 50.1 -6% | 44.5 6% | 60 -27% |
| Load Maximum * (dB) | 54.6 | 55 -1% | 55.5 -2% | 53.4 2% | 54 1% | 64 -17% |
* ... kleiner is beter
Geluidsniveau
| Onbelast |
| 26.2 / 26.2 / 30 dB (A) |
| Belasting |
| 38.5 / 54.6 dB (A) |
 | ||
30 dB stil 40 dB(A) hoorbaar 50 dB(A) luid |
||
min: | ||
(+) De maximumtemperatuur aan de bovenzijde bedraagt 38.8 °C / 102 F, vergeleken met het gemiddelde van 40.4 °C / 105 F, variërend van 21.2 tot 68.8 °C voor de klasse Gaming.
(-) De bodem warmt op tot een maximum van 45.8 °C / 114 F, vergeleken met een gemiddelde van 43.2 °C / 110 F
(+) Bij onbelast gebruik bedraagt de gemiddelde temperatuur voor de bovenzijde 26.7 °C / 80 F, vergeleken met het apparaatgemiddelde van 33.9 °C / 93 F.
(+) Bij het spelen van The Witcher 3 is de gemiddelde temperatuur voor de bovenzijde 31.7 °C / 89 F, vergeleken met het apparaatgemiddelde van 33.9 °C / 93 F.
(+) De palmsteunen en het touchpad zijn met een maximum van ###max## °C / 81.7 F koeler dan de huidtemperatuur en voelen daarom koel aan.
(±) De gemiddelde temperatuur van de handpalmsteun van soortgelijke toestellen bedroeg 28.8 °C / 83.8 F (+1.2 °C / 2.1 F).
Eluktronics RP-17 audioanalyse
(±) | luidspreker luidheid is gemiddeld maar goed (78 dB)
Bas 100 - 315 Hz
(-) | bijna geen lage tonen - gemiddeld 22.3% lager dan de mediaan
(±) | lineariteit van de lage tonen is gemiddeld (12.8% delta ten opzichte van de vorige frequentie)
Midden 400 - 2000 Hz
(+) | evenwichtige middens - slechts 4.6% verwijderd van de mediaan
(±) | lineariteit van de middentonen is gemiddeld (7.9% delta ten opzichte van de vorige frequentie)
Hoog 2 - 16 kHz
(+) | evenwichtige hoogtepunten - slechts 1.2% verwijderd van de mediaan
(+) | de hoge tonen zijn lineair (3.2% delta naar de vorige frequentie)
Algemeen 100 - 16.000 Hz
(±) | lineariteit van het totale geluid is gemiddeld (19.9% verschil met de mediaan)
Vergeleken met dezelfde klasse
» 70% van alle geteste apparaten in deze klasse waren beter, 6% vergelijkbaar, 24% slechter
» De beste had een delta van 6%, het gemiddelde was 18%, de slechtste was 132%
Vergeleken met alle geteste toestellen
» 51% van alle geteste apparaten waren beter, 7% gelijk, 42% slechter
» De beste had een delta van 4%, het gemiddelde was 24%, de slechtste was 134%
Apple MacBook 12 (Early 2016) 1.1 GHz audioanalyse
(+) | luidsprekers kunnen relatief luid spelen (83.6 dB)
Bas 100 - 315 Hz
(±) | verminderde zeebaars - gemiddeld 11.3% lager dan de mediaan
(±) | lineariteit van de lage tonen is gemiddeld (14.2% delta ten opzichte van de vorige frequentie)
Midden 400 - 2000 Hz
(+) | evenwichtige middens - slechts 2.4% verwijderd van de mediaan
(+) | de middentonen zijn lineair (5.5% delta ten opzichte van de vorige frequentie)
Hoog 2 - 16 kHz
(+) | evenwichtige hoogtepunten - slechts 2% verwijderd van de mediaan
(+) | de hoge tonen zijn lineair (4.5% delta naar de vorige frequentie)
Algemeen 100 - 16.000 Hz
(+) | het totale geluid is lineair (10.2% verschil met de mediaan)
Vergeleken met dezelfde klasse
» 7% van alle geteste apparaten in deze klasse waren beter, 2% vergelijkbaar, 91% slechter
» De beste had een delta van 5%, het gemiddelde was 18%, de slechtste was 53%
Vergeleken met alle geteste toestellen
» 5% van alle geteste apparaten waren beter, 1% gelijk, 94% slechter
» De beste had een delta van 4%, het gemiddelde was 24%, de slechtste was 134%
| Uit / Standby | |
| Inactief | |
| Belasting |
|
Key:
min: | |
| Eluktronics RP-17 R7 4800H, GeForce RTX 2060 Mobile, Phison PS5013 PRO-X-1TB-G2R NVMe SSD, IPS, 1920x1080, 17.3" | MSI GE75 Raider 10SE-008US i7-10750H, GeForce RTX 2060 Mobile, Samsung SSD PM981 MZVLB512HAJQ, IPS, 1920x1080, 17.3" | Razer Blade Pro 17 RTX 2070 Max-Q 300 Hz i7-10875H, GeForce RTX 2070 Max-Q, Lite-On CA5-8D512, IPS, 1920x1080, 17.3" | Asus TUF A17 FA706IU-AS76 R7 4800H, GeForce GTX 1660 Ti Mobile, Intel SSD 660p 1TB SSDPEKNW010T8, IPS, 1920x1080, 17.3" | Walmart EVOO Gaming 17 i7-9750H, GeForce RTX 2060 Mobile, Intel SSD 660p 1TB SSDPEKNW010T8, IPS, 1920x1080, 17.3" | Aorus 17 YA i9-9980HK, GeForce RTX 2080 Mobile, Intel SSD 760p SSDPEKKW010T8, IPS, 1920x1080, 17.3" | |
|---|---|---|---|---|---|---|
| Power Consumption | 8% | -2% | 34% | 11% | -50% | |
| Idle Minimum * (Watt) | 20.2 | 14.7 27% | 19.6 3% | 7.4 63% | 11.4 44% | 34 -68% |
| Idle Average * (Watt) | 24.5 | 20.4 17% | 21.7 11% | 10.5 57% | 16.3 33% | 37 -51% |
| Idle Maximum * (Watt) | 28.7 | 26.9 6% | 36.1 -26% | 17 41% | 31.8 -11% | 41 -43% |
| Load Average * (Watt) | 110.4 | 93.2 16% | 115.6 -5% | 103.7 6% | 92.9 16% | 123 -11% |
| Witcher 3 ultra * (Watt) | 166.3 | 185.4 -11% | 157 6% | 128.1 23% | 171.5 -3% | 250 -50% |
| Load Maximum * (Watt) | 217.4 | 237.8 -9% | 219.9 -1% | 183.2 16% | 243.3 -12% | 386 -78% |
* ... kleiner is beter
| Eluktronics RP-17 R7 4800H, GeForce RTX 2060 Mobile, 62 Wh | MSI GE75 Raider 10SE-008US i7-10750H, GeForce RTX 2060 Mobile, 65 Wh | Razer Blade Pro 17 RTX 2070 Max-Q 300 Hz i7-10875H, GeForce RTX 2070 Max-Q, 70 Wh | Asus TUF A17 FA706IU-AS76 R7 4800H, GeForce GTX 1660 Ti Mobile, 90 Wh | Walmart EVOO Gaming 17 i7-9750H, GeForce RTX 2060 Mobile, 46 Wh | Aorus 17 YA i9-9980HK, GeForce RTX 2080 Mobile, 94.24 Wh | |
|---|---|---|---|---|---|---|
| Batterijduur | -16% | 11% | 147% | -5% | 31% | |
| WiFi v1.3 (h) | 4.4 | 3.7 -16% | 4.9 11% | 8.5 93% | 4.2 -5% | 3.9 -11% |
| Load (h) | 1.1 | 3.3 200% | 1.9 73% | |||
| Reader / Idle (h) | 9.1 |
Pro
Contra
Dit is de verkorte versie van het originele artikel. Het volledige, Engelse testrapport vind je hier.
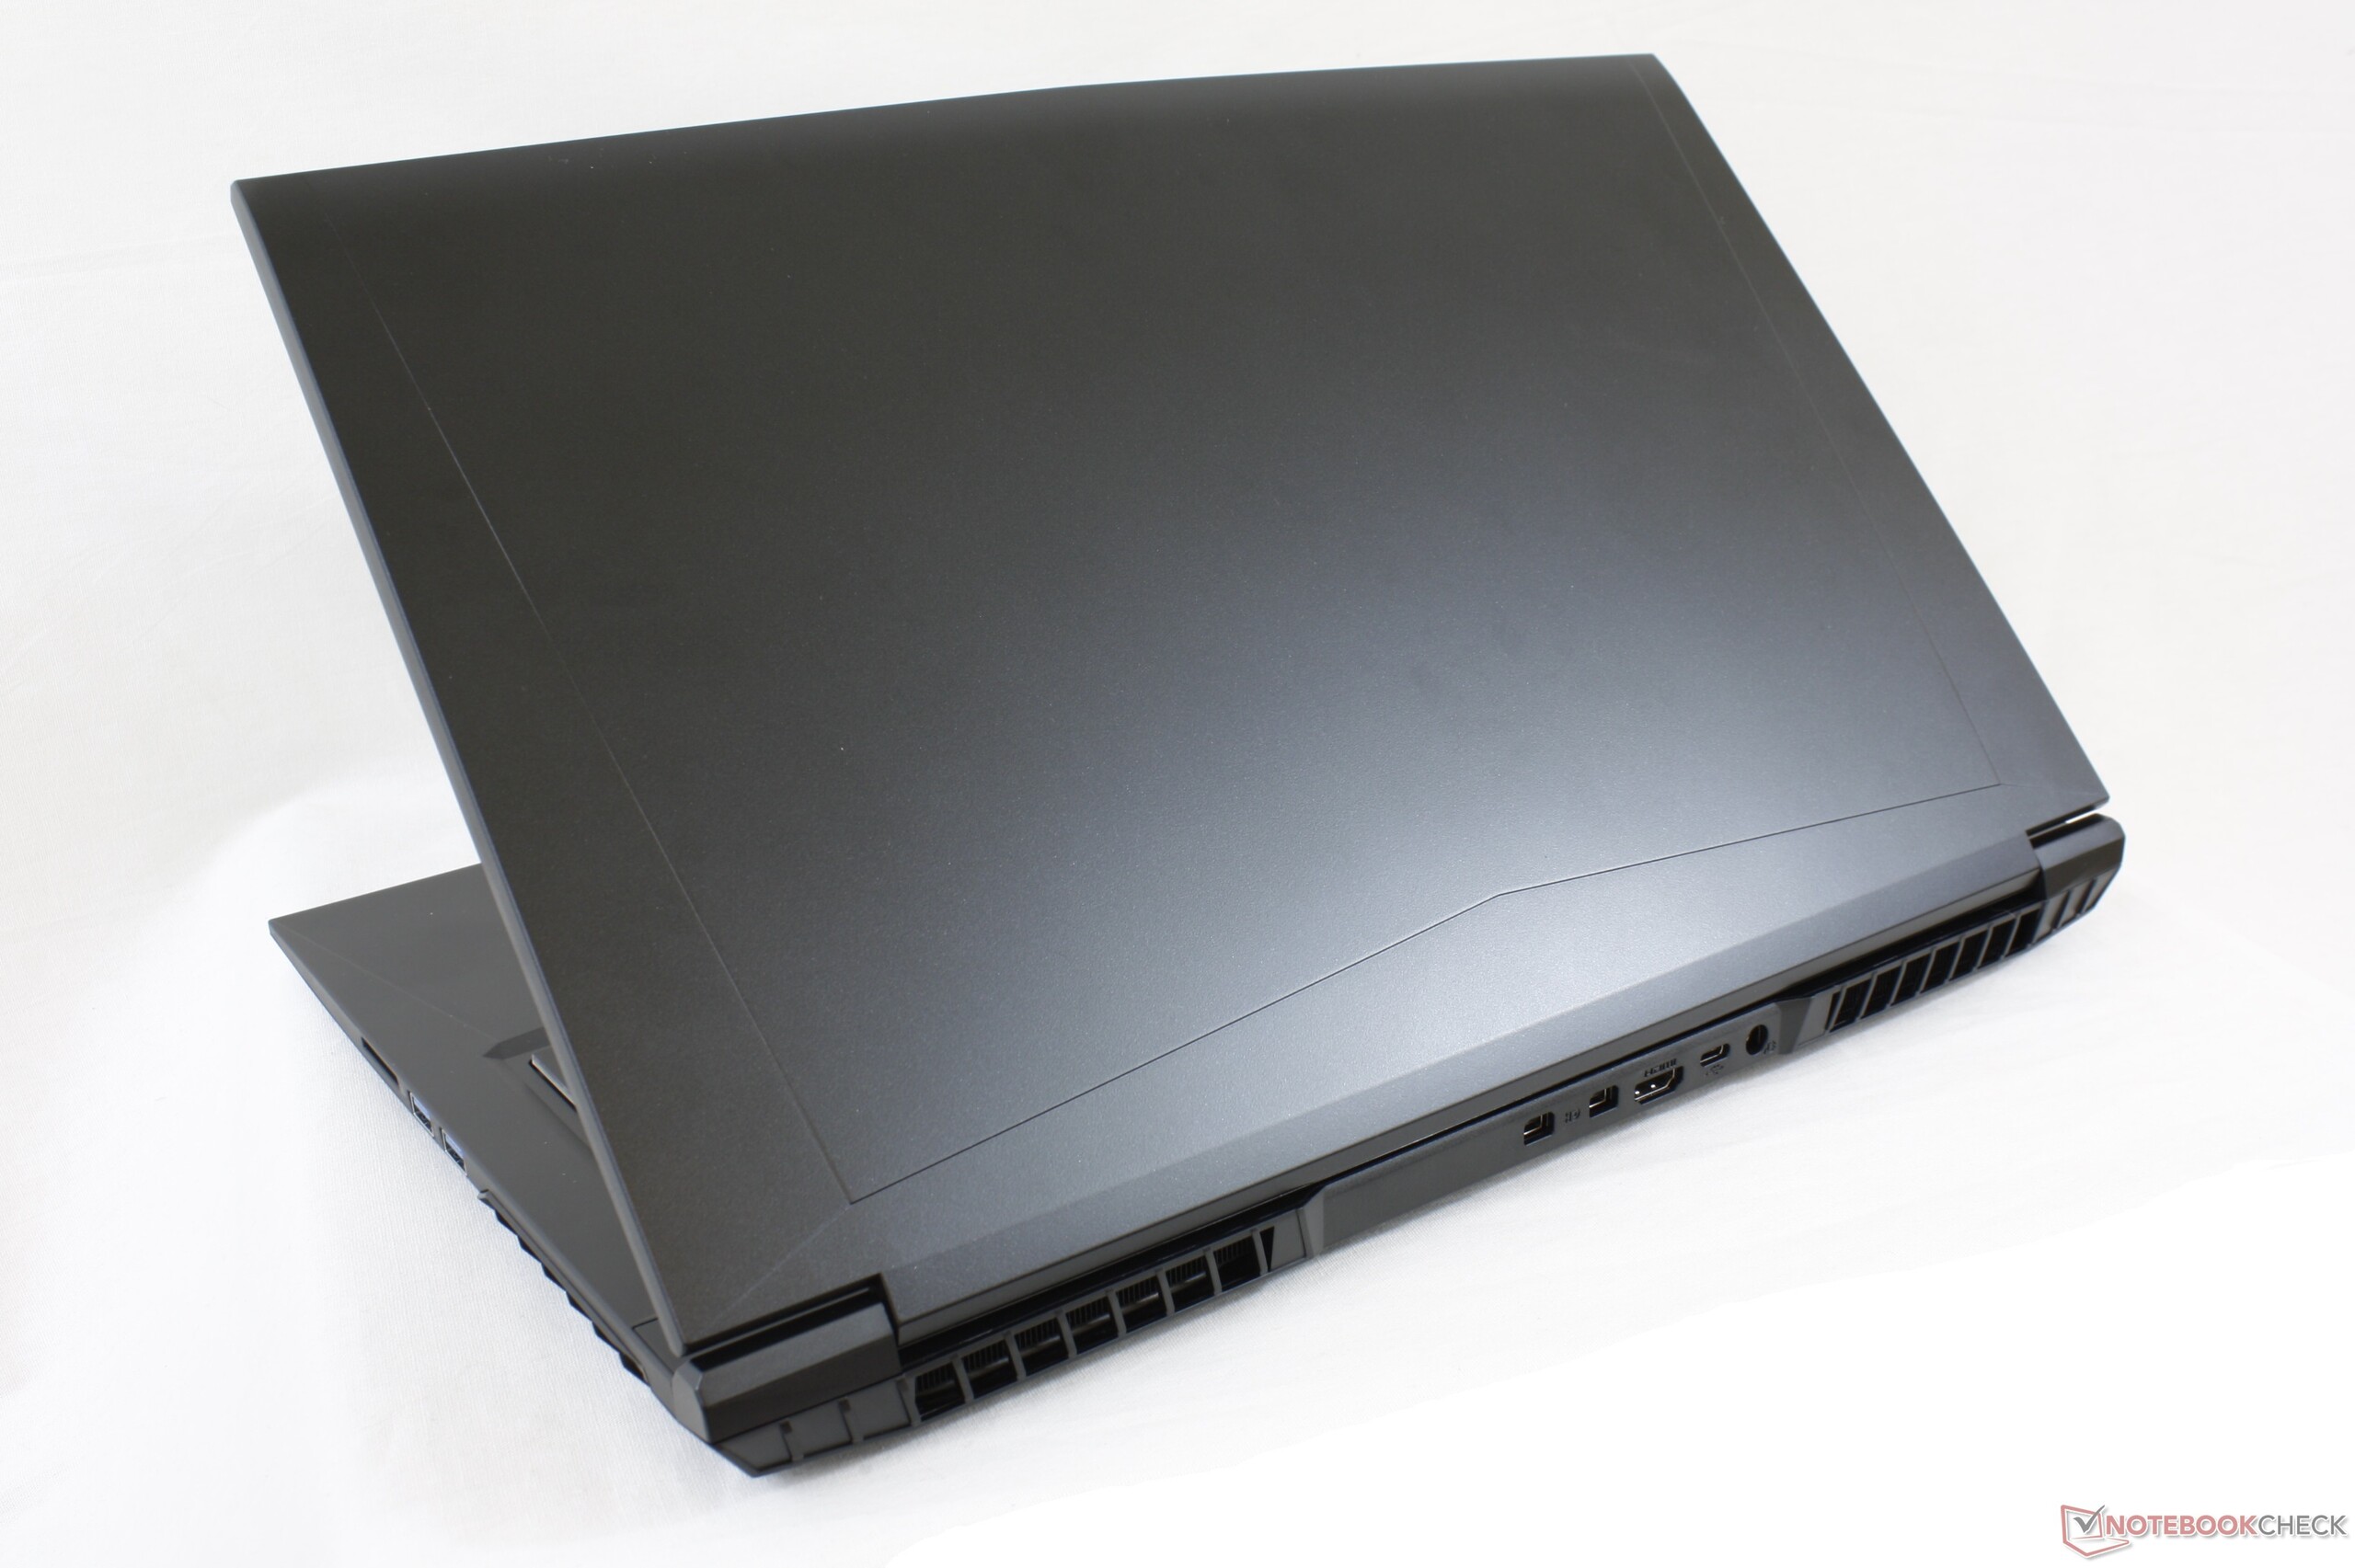
Net als bij de 15,6-inch Eluktronics RP-15, is de 17,3-inch RP-17 aantrekkelijk vanwege het eenvoudige ontwerp, het 144 Hz-scherm, de eenvoudige upgradebaarheid en de Zen 2 Ryzen 7-CPU voor dezelfde prijs als de meeste Core i7-alternatieven uitgerust met dezelfde GeForce RTX 2060 GPU. Core-temperaturen tijdens het gamen liggen ook lager dan verwacht, waarschijnlijk omdat de behuizing zelf nog snellere GPU-opties kan ondersteunen die Eluktronics momenteel helaas niet biedt. De turboventilatormodus is niet echt nodig om de framesnelheden te maximaliseren, zodat gebruikers kunnen gamen met de functie uitgeschakeld voor stillere ventilatoren. De behuizing voelt duurzamer aan dan de MSI GF75, ook al bereikt het niet helemaal hetzelfde niveau als de duurdere MSI GT-serie of Asus ROG Strix-serie.
De merkbare backlight-bleeding en de iets dikkere behuizing zijn de belangrijkste nadelen van het systeem. Verwacht van de RP-17 niet dezelfde gestroomlijnde, fotogenieke ervaring die je zou kunnen verwachten van een MSI GS66, Asus Zephyrus of Razer Blade.
Misschien is de grootste concurrent de Asus TUF A17, die kan worden geconfigureerd met exact dezelfde CPU- en GPU-opties voor ongeveer 100 tot 200 euro meer. Het Asus-systeem wordt warmer en luider tijdens het gamen, deels omdat het een dunnere machine is.
De Eluktronics RP-17 richt zich op de basis-game-ervaring zonder enige visuele afleiding die de prijs kan opdrijven. Het basispaneel van 144 Hz is opmerkelijk in vergelijking met andere gaming-laptops in deze prijsklasse, waar minderwaardige 60-Hz- of 120-Hz-panelen gebruikelijk zijn.
Eluktronics RP-17
- 09-08-2020 v7 (old)
Allen Ngo
Price comparison
