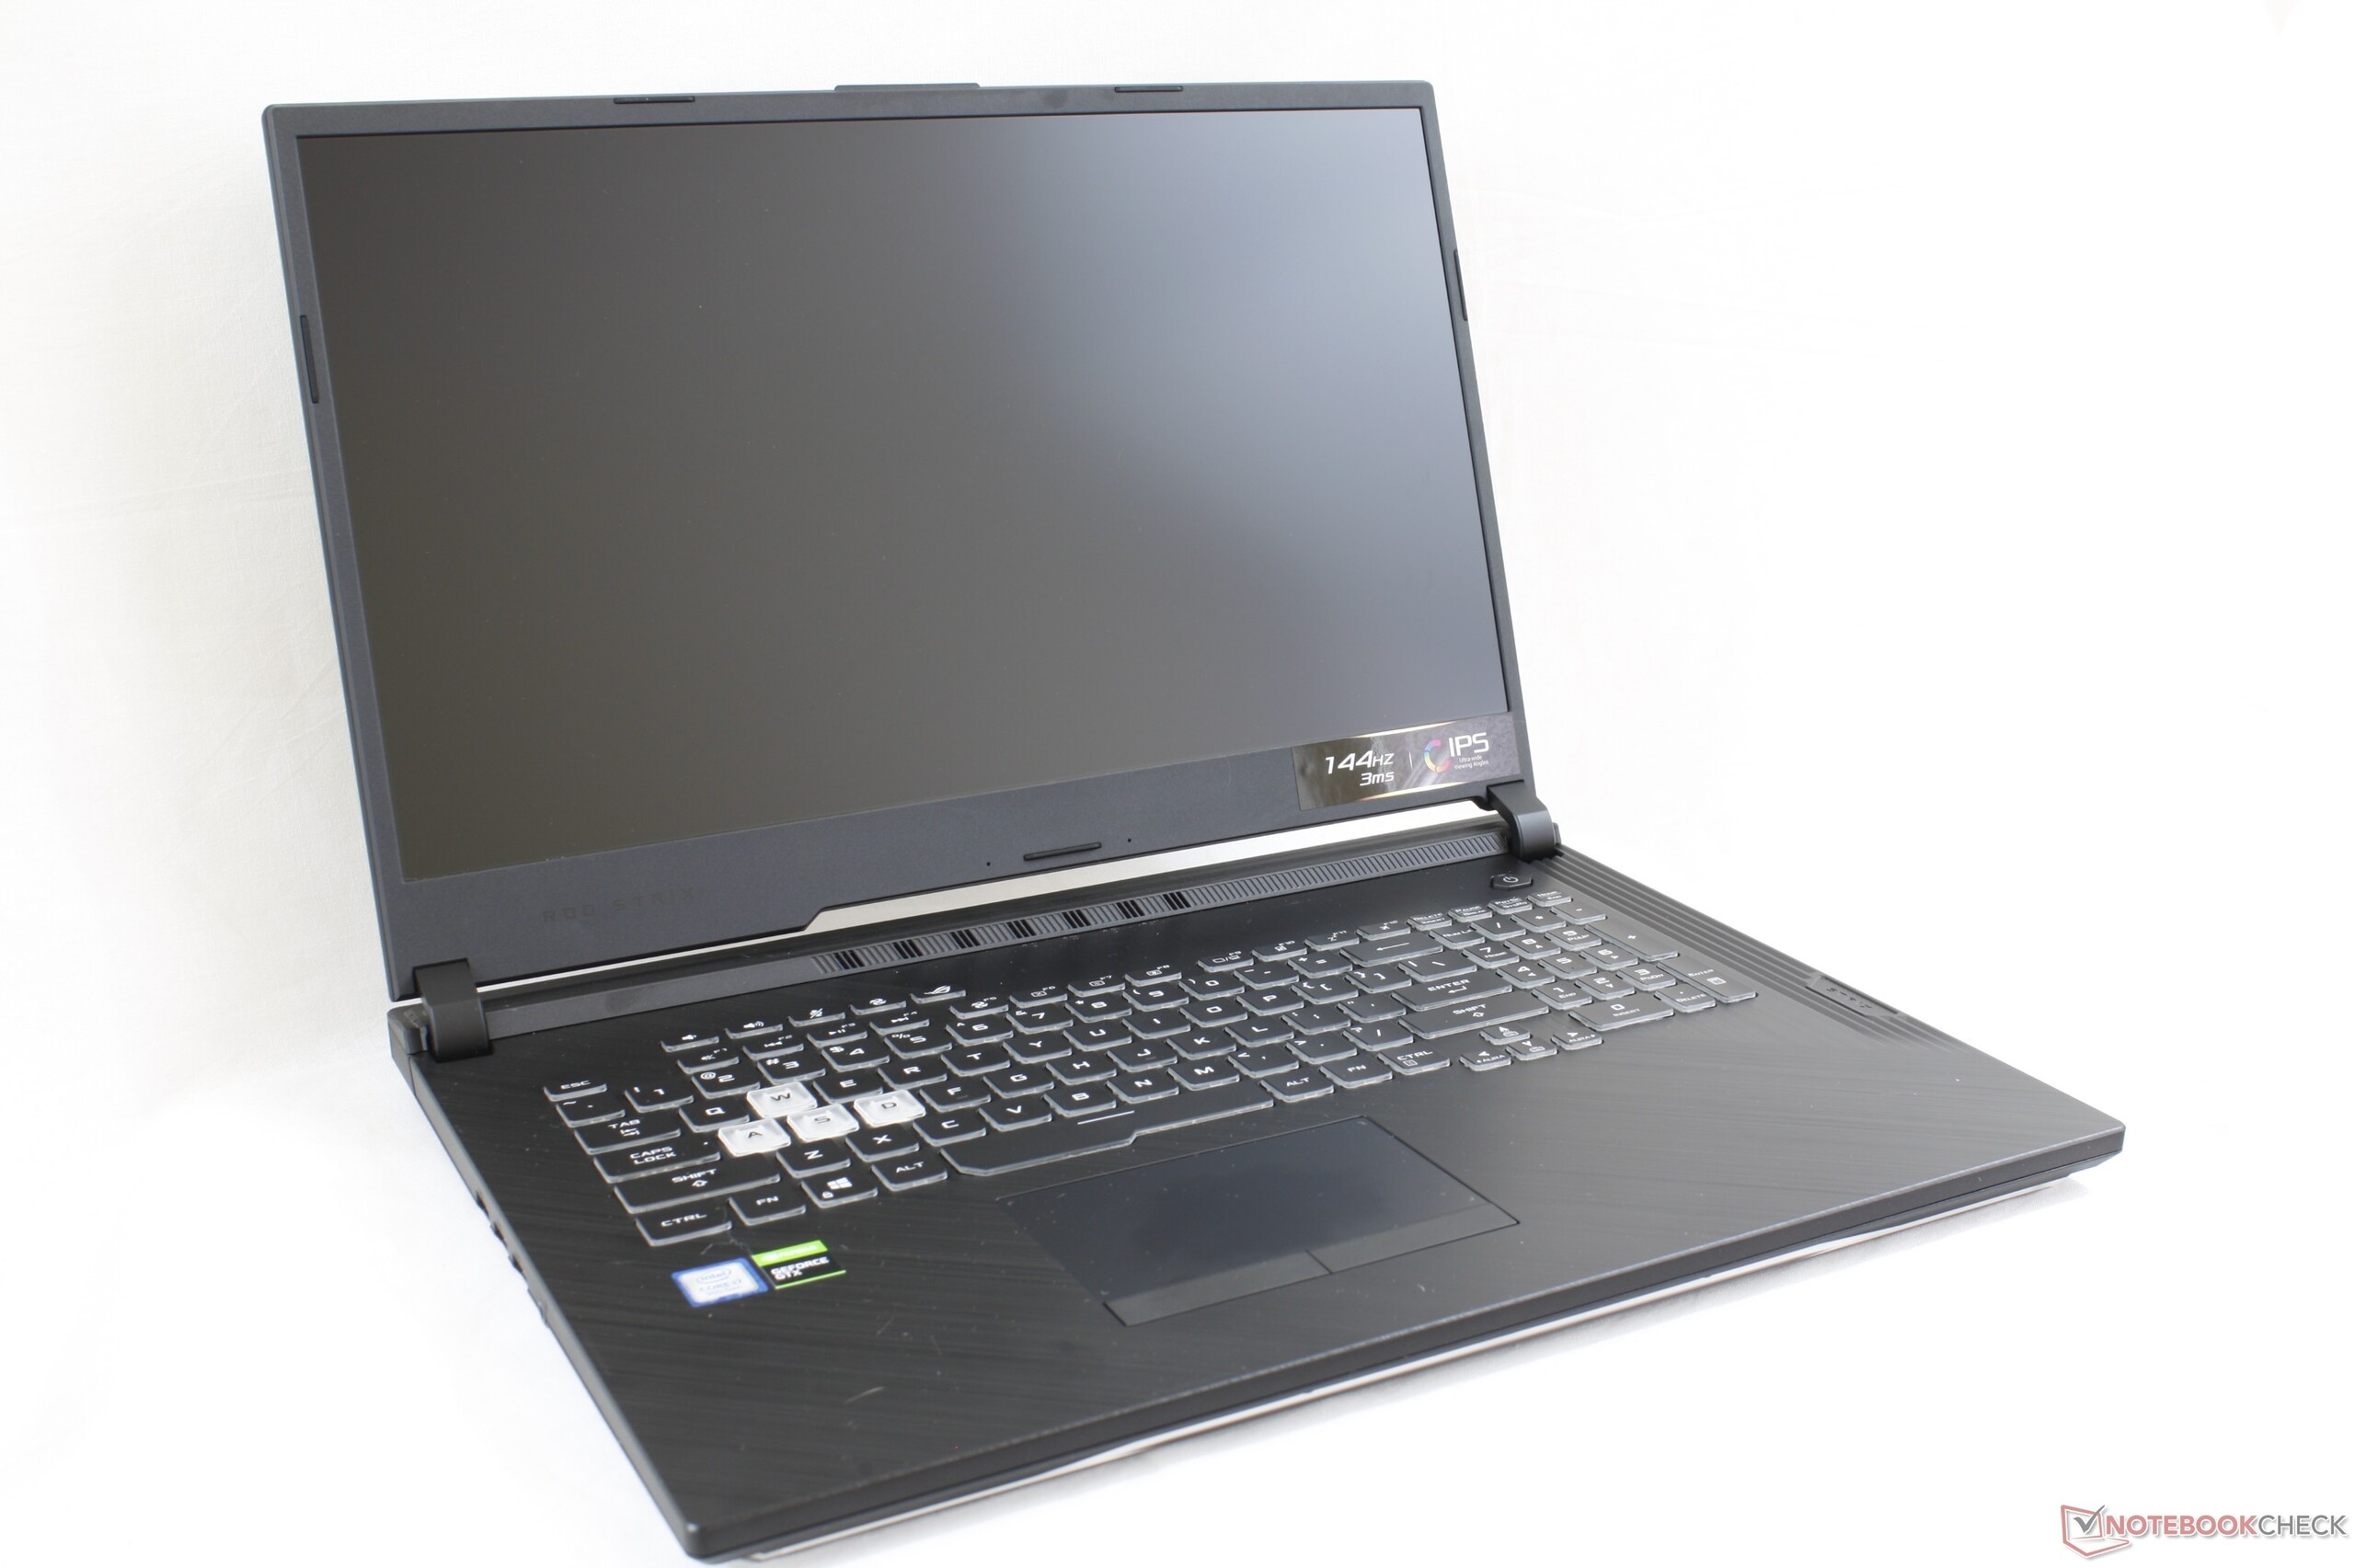
Kort testrapport Asus ROG Strix G GL731GU Laptop: een LED lichtshow
| Networking | |
| iperf3 transmit AX12 | |
| MSI GF75 Thin 9SC | |
| Asus ROG Strix G GL731GU-RB74 | |
| Lenovo Legion Y740-17ICH | |
| Asus TUF FX705DT-AU068T | |
| iperf3 receive AX12 | |
| MSI GF75 Thin 9SC | |
| Lenovo Legion Y740-17ICH | |
| Asus ROG Strix G GL731GU-RB74 | |
| Asus TUF FX705DT-AU068T | |
| |||||||||||||||||||||||||
Helderheidsverdeling: 89 %
Helderheid in Batterij-modus: 294.3 cd/m²
Contrast: 981:1 (Zwart: 0.3 cd/m²)
ΔE ColorChecker Calman: 3.95 | ∀{0.5-29.43 Ø4.71}
calibrated: 3.08
ΔE Greyscale Calman: 3.7 | ∀{0.09-98 Ø4.96}
89% sRGB (Argyll 1.6.3 3D)
57.7% AdobeRGB 1998 (Argyll 1.6.3 3D)
63.3% AdobeRGB 1998 (Argyll 3D)
89.4% sRGB (Argyll 3D)
61.9% Display P3 (Argyll 3D)
Gamma: 2.07
CCT: 7155 K
| Asus ROG Strix G GL731GU-RB74 AU Optronics B173HAN04.0, IPS, 17.3", 1920x1080 | Asus TUF FX705DT-AU068T AU Optronics B173HAN04.2, IPS, 17.3", 1920x1080 | MSI GF75 Thin 9SC AU Optronics B173HAN04.2, IPS, 17.3", 1920x1080 | Lenovo Legion Y740-17ICH AU Optronics B173HAN03.2, IPS, 17.3", 1920x1080 | Asus ROG Strix Scar II GL704GW B173HAN04.0 (AUO409D), AHVA, 17.3", 1920x1080 | Razer Blade Pro 17 RTX 2080 Max-Q AU Optronics B173HAN04.0, IPS, 17.3", 1920x1080 | |
|---|---|---|---|---|---|---|
| Display | 1% | 1% | 2% | 0% | -1% | |
| Display P3 Coverage (%) | 61.9 | 62.3 1% | 62.5 1% | 64 3% | 62.9 2% | 60.6 -2% |
| sRGB Coverage (%) | 89.4 | 89.1 0% | 90 1% | 90.4 1% | 87.1 -3% | 89 0% |
| AdobeRGB 1998 Coverage (%) | 63.3 | 63.7 1% | 64 1% | 64.8 2% | 63.7 1% | 62.1 -2% |
| Response Times | -355% | -301% | -79% | -88% | 4% | |
| Response Time Grey 50% / Grey 80% * (ms) | 6.4 ? | 41 ? -541% | 34 ? -431% | 15.6 ? -144% | 17.6 ? -175% | 6.8 ? -6% |
| Response Time Black / White * (ms) | 11.2 ? | 30 ? -168% | 30.4 ? -171% | 12.8 ? -14% | 11.2 ? -0% | 9.6 ? 14% |
| PWM Frequency (Hz) | ||||||
| Screen | 5% | 7% | -15% | 12% | 8% | |
| Brightness middle (cd/m²) | 294.3 | 316 7% | 344.7 17% | 299.1 2% | 295 0% | 299.3 2% |
| Brightness (cd/m²) | 289 | 294 2% | 332 15% | 273 -6% | 291 1% | 294 2% |
| Brightness Distribution (%) | 89 | 84 -6% | 91 2% | 81 -9% | 96 8% | 94 6% |
| Black Level * (cd/m²) | 0.3 | 0.32 -7% | 0.3 -0% | 0.27 10% | 0.24 20% | 0.29 3% |
| Contrast (:1) | 981 | 988 1% | 1149 17% | 1108 13% | 1229 25% | 1032 5% |
| Colorchecker dE 2000 * | 3.95 | 3.39 14% | 3.08 22% | 5.07 -28% | 3.2 19% | 2.55 35% |
| Colorchecker dE 2000 max. * | 6.49 | 5.56 14% | 6.32 3% | 10.55 -63% | 6.64 -2% | 4.73 27% |
| Colorchecker dE 2000 calibrated * | 3.08 | 2.14 31% | 2.94 5% | 3.31 -7% | 2.52 18% | 2.9 6% |
| Greyscale dE 2000 * | 3.7 | 3.17 14% | 3.8 -3% | 6.8 -84% | 2.16 42% | 3.5 5% |
| Gamma | 2.07 106% | 2.39 92% | 2.17 101% | 2.46 89% | 2.46 89% | 2.28 96% |
| CCT | 7155 91% | 7098 92% | 7284 89% | 7805 83% | 6872 95% | 7101 92% |
| Color Space (Percent of AdobeRGB 1998) (%) | 57.7 | 51 -12% | 58 1% | 58.5 1% | 57 -1% | 57 -1% |
| Color Space (Percent of sRGB) (%) | 89 | 89 0% | 89.6 1% | 89.9 1% | 87 -2% | 88.7 0% |
| Totaal Gemiddelde (Programma / Instellingen) | -116% /
-41% | -98% /
-32% | -31% /
-20% | -25% /
-3% | 4% /
6% |
* ... kleiner is beter
Responstijd Scherm
| ↔ Responstijd Zwart naar Wit | ||
|---|---|---|
| 11.2 ms ... stijging ↗ en daling ↘ gecombineerd | ↗ 6 ms stijging | 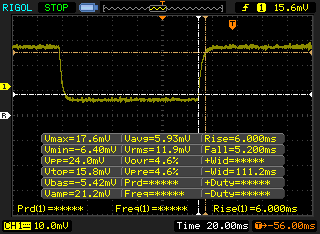 |
| ↘ 5.2 ms daling | ||
| Het scherm vertoonde prima responstijden in onze tests maar is misschien wat te traag voor competitieve games. Ter vergelijking: alle testtoestellen variëren van 0.1 (minimum) tot 240 (maximum) ms. » 30 % van alle toestellen zijn beter. Dit betekent dat de gemeten responstijd beter is dan het gemiddelde (19.8 ms) van alle geteste toestellen. | ||
| ↔ Responstijd 50% Grijs naar 80% Grijs | ||
| 6.4 ms ... stijging ↗ en daling ↘ gecombineerd | ↗ 3.4 ms stijging | 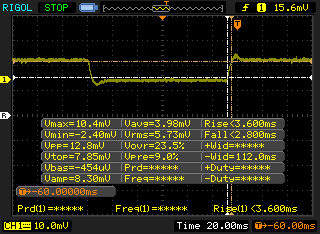 |
| ↘ 3 ms daling | ||
| Het scherm vertoonde erg snelle responstijden in onze tests en zou zeer geschikt moeten zijn voor snelle games. Ter vergelijking: alle testtoestellen variëren van 0.165 (minimum) tot 636 (maximum) ms. » 19 % van alle toestellen zijn beter. Dit betekent dat de gemeten responstijd beter is dan het gemiddelde (30.9 ms) van alle geteste toestellen. | ||
Screen Flickering / PWM (Pulse-Width Modulation)
| Screen flickering / PWM niet waargenomen | 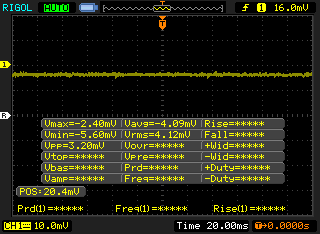 | ||
Ter vergelijking: 52 % van alle geteste toestellen maakten geen gebruik van PWM om de schermhelderheid te verlagen. Als het wel werd gebruikt, werd een gemiddelde van 7741 (minimum: 5 - maximum: 343500) Hz waargenomen. | |||
| PCMark 8 Home Score Accelerated v2 | 5217 punten | |
| PCMark 8 Work Score Accelerated v2 | 5744 punten | |
| PCMark 10 Score | 5811 punten | |
Help | ||
| Asus ROG Strix G GL731GU-RB74 Intel SSD 660p SSDPEKNW512G8 | Asus TUF FX705DT-AU068T WDC PC SN520 SDAPNUW-256G | Lenovo Legion Y740-17ICH Samsung SSD PM981 MZVLB256HAHQ | Asus ROG Strix Scar II GL704GW Intel SSD 660p SSDPEKNW512G8 | Razer Blade Pro 17 RTX 2080 Max-Q Samsung SSD PM981 MZVLB512HAJQ | |
|---|---|---|---|---|---|
| AS SSD | -9% | 29% | -2% | 68% | |
| Seq Read (MB/s) | 1319 | 1546 17% | 1153 -13% | 1315 0% | 1831 39% |
| Seq Write (MB/s) | 930 | 1182 27% | 1328 43% | 927 0% | 1744 88% |
| 4K Read (MB/s) | 49.43 | 36.54 -26% | 35.05 -29% | 52.4 6% | 45.16 -9% |
| 4K Write (MB/s) | 104.3 | 109.2 5% | 96 -8% | 122.8 18% | 107.1 3% |
| 4K-64 Read (MB/s) | 321.9 | 612 90% | 727 126% | 326.5 1% | 1240 285% |
| 4K-64 Write (MB/s) | 774 | 436.6 -44% | 1212 57% | 727 -6% | 1695 119% |
| Access Time Read * (ms) | 0.055 | 0.113 -105% | 0.063 -15% | 0.11 -100% | 0.064 -16% |
| Access Time Write * (ms) | 0.138 | 0.034 75% | 0.04 71% | 0.045 67% | 0.037 73% |
| Score Read (Points) | 503 | 803 60% | 878 75% | 510 1% | 1468 192% |
| Score Write (Points) | 971 | 664 -32% | 1441 48% | 942 -3% | 1977 104% |
| Score Total (Points) | 1731 | 1869 8% | 2784 61% | 1715 -1% | 4197 142% |
| Copy ISO MB/s (MB/s) | 1707 | 698 -59% | 1487 -13% | 2086 22% | |
| Copy Program MB/s (MB/s) | 852 | 114.1 -87% | 608 -29% | 425.5 -50% | |
| Copy Game MB/s (MB/s) | 930 | 379.6 -59% | 1162 25% | 555 -40% |
* ... kleiner is beter

| 3DMark 11 Performance | 17966 punten | |
| 3DMark Cloud Gate Standard Score | 36088 punten | |
| 3DMark Fire Strike Score | 12907 punten | |
| 3DMark Fire Strike Extreme Score | 6573 punten | |
| 3DMark Time Spy Score | 5651 punten | |
Help | ||
| Shadow of the Tomb Raider - 1920x1080 Highest Preset AA:T | |
| MSI GE75 9SG | |
| Asus ROG Strix Scar II GL704GW | |
| Alienware m15 P79F | |
| Asus G752VS | |
| Asus ROG Strix G GL731GU-RB74 | |
| Gemiddeld NVIDIA GeForce GTX 1660 Ti Mobile (62 - 73, n=8) | |
| MSI GL73 8SE-010US | |
| Asus ROG Zephyrus G15 GA502DU | |
| Asus TUF FX705GM | |
| MSI GF75 Thin 9SC | |
| Asus TUF FX705GE-EW096T | |
| Asus GL753VD | |
| lage | gem. | hoge | ultra | |
|---|---|---|---|---|
| BioShock Infinite (2013) | 320.1 | 256.8 | 263.3 | 140.8 |
| The Witcher 3 (2015) | 261.5 | 180.7 | 99.5 | 53.7 |
| Shadow of the Tomb Raider (2018) | 135 | 90 | 79 | 70 |
| Asus ROG Strix G GL731GU-RB74 GeForce GTX 1660 Ti Mobile, i7-9750H, Intel SSD 660p SSDPEKNW512G8 | Asus TUF FX705DT-AU068T GeForce GTX 1650 Mobile, R5 3550H, WDC PC SN520 SDAPNUW-256G | Asus ROG Strix Scar II GL704GW GeForce RTX 2070 Mobile, i7-8750H, Intel SSD 660p SSDPEKNW512G8 | Razer Blade Pro 17 RTX 2080 Max-Q GeForce RTX 2080 Max-Q, i7-9750H, Samsung SSD PM981 MZVLB512HAJQ | MSI GF75 Thin 9SC GeForce GTX 1650 Mobile, i7-9750H, Crucial P1 SSD CT1000P1SSD8 | Asus GL704GM-DH74 GeForce GTX 1060 Mobile, i7-8750H, WDC PC SN520 SDAPNUW-256G | |
|---|---|---|---|---|---|---|
| Noise | 9% | 1% | 7% | 8% | -3% | |
| uit / omgeving * (dB) | 28.2 | 30.8 -9% | 29 -3% | 28.2 -0% | 28.2 -0% | 28.2 -0% |
| Idle Minimum * (dB) | 31.8 | 30.8 3% | 29 9% | 28.2 11% | 33.6 -6% | 30 6% |
| Idle Average * (dB) | 32 | 30.8 4% | 32 -0% | 28.2 12% | 33.6 -5% | 31.8 1% |
| Idle Maximum * (dB) | 40.6 | 32.2 21% | 40 1% | 30.8 24% | 33.8 17% | 34.6 15% |
| Load Average * (dB) | 48 | 38.6 20% | 46 4% | 42 12% | 37.2 22% | 56 -17% |
| Witcher 3 ultra * (dB) | 48 | 51 -6% | 51 -6% | 40.6 15% | 54.2 -13% | |
| Load Maximum * (dB) | 51.5 | 44.8 13% | 52 -1% | 53 -3% | 44.4 14% | 56.7 -10% |
* ... kleiner is beter
Geluidsniveau
| Onbelast |
| 31.8 / 32 / 40.6 dB (A) |
| Belasting |
| 48 / 51.5 dB (A) |
 | ||
30 dB stil 40 dB(A) hoorbaar 50 dB(A) luid |
||
min: | ||
(±) De maximumtemperatuur aan de bovenzijde bedraagt 44.6 °C / 112 F, vergeleken met het gemiddelde van 40.4 °C / 105 F, variërend van 21.2 tot 68.8 °C voor de klasse Gaming.
(-) De bodem warmt op tot een maximum van 51.6 °C / 125 F, vergeleken met een gemiddelde van 43.2 °C / 110 F
(+) Bij onbelast gebruik bedraagt de gemiddelde temperatuur voor de bovenzijde 27 °C / 81 F, vergeleken met het apparaatgemiddelde van 33.9 °C / 93 F.
(+) Bij het spelen van The Witcher 3 is de gemiddelde temperatuur voor de bovenzijde 30.2 °C / 86 F, vergeleken met het apparaatgemiddelde van 33.9 °C / 93 F.
(+) De palmsteunen en het touchpad zijn met een maximum van ###max## °C / 80.6 F koeler dan de huidtemperatuur en voelen daarom koel aan.
(±) De gemiddelde temperatuur van de handpalmsteun van soortgelijke toestellen bedroeg 28.8 °C / 83.8 F (+1.8 °C / 3.2 F).
Asus ROG Strix G GL731GU-RB74 audioanalyse
(±) | luidspreker luidheid is gemiddeld maar goed (81.9 dB)
Analysis not possible as minimum curve is missing or too high
Apple MacBook 12 (Early 2016) 1.1 GHz audioanalyse
(+) | luidsprekers kunnen relatief luid spelen (83.6 dB)
Bas 100 - 315 Hz
(±) | verminderde zeebaars - gemiddeld 11.3% lager dan de mediaan
(±) | lineariteit van de lage tonen is gemiddeld (14.2% delta ten opzichte van de vorige frequentie)
Midden 400 - 2000 Hz
(+) | evenwichtige middens - slechts 2.4% verwijderd van de mediaan
(+) | de middentonen zijn lineair (5.5% delta ten opzichte van de vorige frequentie)
Hoog 2 - 16 kHz
(+) | evenwichtige hoogtepunten - slechts 2% verwijderd van de mediaan
(+) | de hoge tonen zijn lineair (4.5% delta naar de vorige frequentie)
Algemeen 100 - 16.000 Hz
(+) | het totale geluid is lineair (10.2% verschil met de mediaan)
Vergeleken met dezelfde klasse
» 7% van alle geteste apparaten in deze klasse waren beter, 2% vergelijkbaar, 90% slechter
» De beste had een delta van 5%, het gemiddelde was 18%, de slechtste was 53%
Vergeleken met alle geteste toestellen
» 5% van alle geteste apparaten waren beter, 1% gelijk, 94% slechter
» De beste had een delta van 4%, het gemiddelde was 23%, de slechtste was 134%
| Uit / Standby | |
| Inactief | |
| Belasting |
|
Key:
min: | |
| Asus ROG Strix G GL731GU-RB74 i7-9750H, GeForce GTX 1660 Ti Mobile, Intel SSD 660p SSDPEKNW512G8, IPS, 1920x1080, 17.3" | Asus TUF FX705DT-AU068T R5 3550H, GeForce GTX 1650 Mobile, WDC PC SN520 SDAPNUW-256G, IPS, 1920x1080, 17.3" | Asus ROG Strix Scar II GL704GW i7-8750H, GeForce RTX 2070 Mobile, Intel SSD 660p SSDPEKNW512G8, AHVA, 1920x1080, 17.3" | Razer Blade Pro 17 RTX 2080 Max-Q i7-9750H, GeForce RTX 2080 Max-Q, Samsung SSD PM981 MZVLB512HAJQ, IPS, 1920x1080, 17.3" | MSI GF75 Thin 9SC i7-9750H, GeForce GTX 1650 Mobile, Crucial P1 SSD CT1000P1SSD8, IPS, 1920x1080, 17.3" | MSI GF72VR 7RF i7-7700HQ, GeForce GTX 1060 Mobile, Samsung PM961 MZVLW256HEHP, TN LED, 1920x1080, 17.3" | |
|---|---|---|---|---|---|---|
| Power Consumption | 61% | -9% | 0% | 31% | 15% | |
| Idle Minimum * (Watt) | 13.6 | 3.9 71% | 19 -40% | 16.2 -19% | 6.1 55% | 15.7 -15% |
| Idle Average * (Watt) | 26.2 | 9.6 63% | 22 16% | 20.4 22% | 11.2 57% | 21.4 18% |
| Idle Maximum * (Watt) | 35 | 12.2 65% | 29 17% | 26.1 25% | 24.5 30% | 21.9 37% |
| Load Average * (Watt) | 113.6 | 59 48% | 102 10% | 96.5 15% | 94.7 17% | 83.9 26% |
| Witcher 3 ultra * (Watt) | 134.1 | 190 -42% | 182.9 -36% | 105.8 21% | 130.2 3% | |
| Load Maximum * (Watt) | 200.2 | 80 60% | 231 -15% | 214.3 -7% | 192.2 4% | 159.6 20% |
* ... kleiner is beter
| Asus ROG Strix G GL731GU-RB74 i7-9750H, GeForce GTX 1660 Ti Mobile, 66 Wh | Asus TUF FX705DT-AU068T R5 3550H, GeForce GTX 1650 Mobile, 64 Wh | Lenovo Legion Y740-17ICH i7-8750H, GeForce RTX 2080 Max-Q, 76 Wh | Asus ROG Strix Scar II GL704GW i7-8750H, GeForce RTX 2070 Mobile, 66 Wh | Razer Blade Pro 17 RTX 2080 Max-Q i7-9750H, GeForce RTX 2080 Max-Q, 70 Wh | MSI GF75 Thin 9SC i7-9750H, GeForce GTX 1650 Mobile, 51 Wh | |
|---|---|---|---|---|---|---|
| Batterijduur | 49% | -35% | -26% | -20% | -4% | |
| Reader / Idle (h) | 8.6 | 13.6 58% | 6.2 -28% | 4.9 -43% | ||
| WiFi v1.3 (h) | 4.9 | 7.8 59% | 3.2 -35% | 3.9 -20% | 4.7 -4% | 4.7 -4% |
| Load (h) | 1.6 | 2.1 31% | 1.1 -31% | 1.4 -13% | ||
| Witcher 3 ultra (h) | 0.9 |
Pro
Contra

Dit is de verkorte versie van het originele artikel. Het volledige, Engelse testrapport vind je hier.
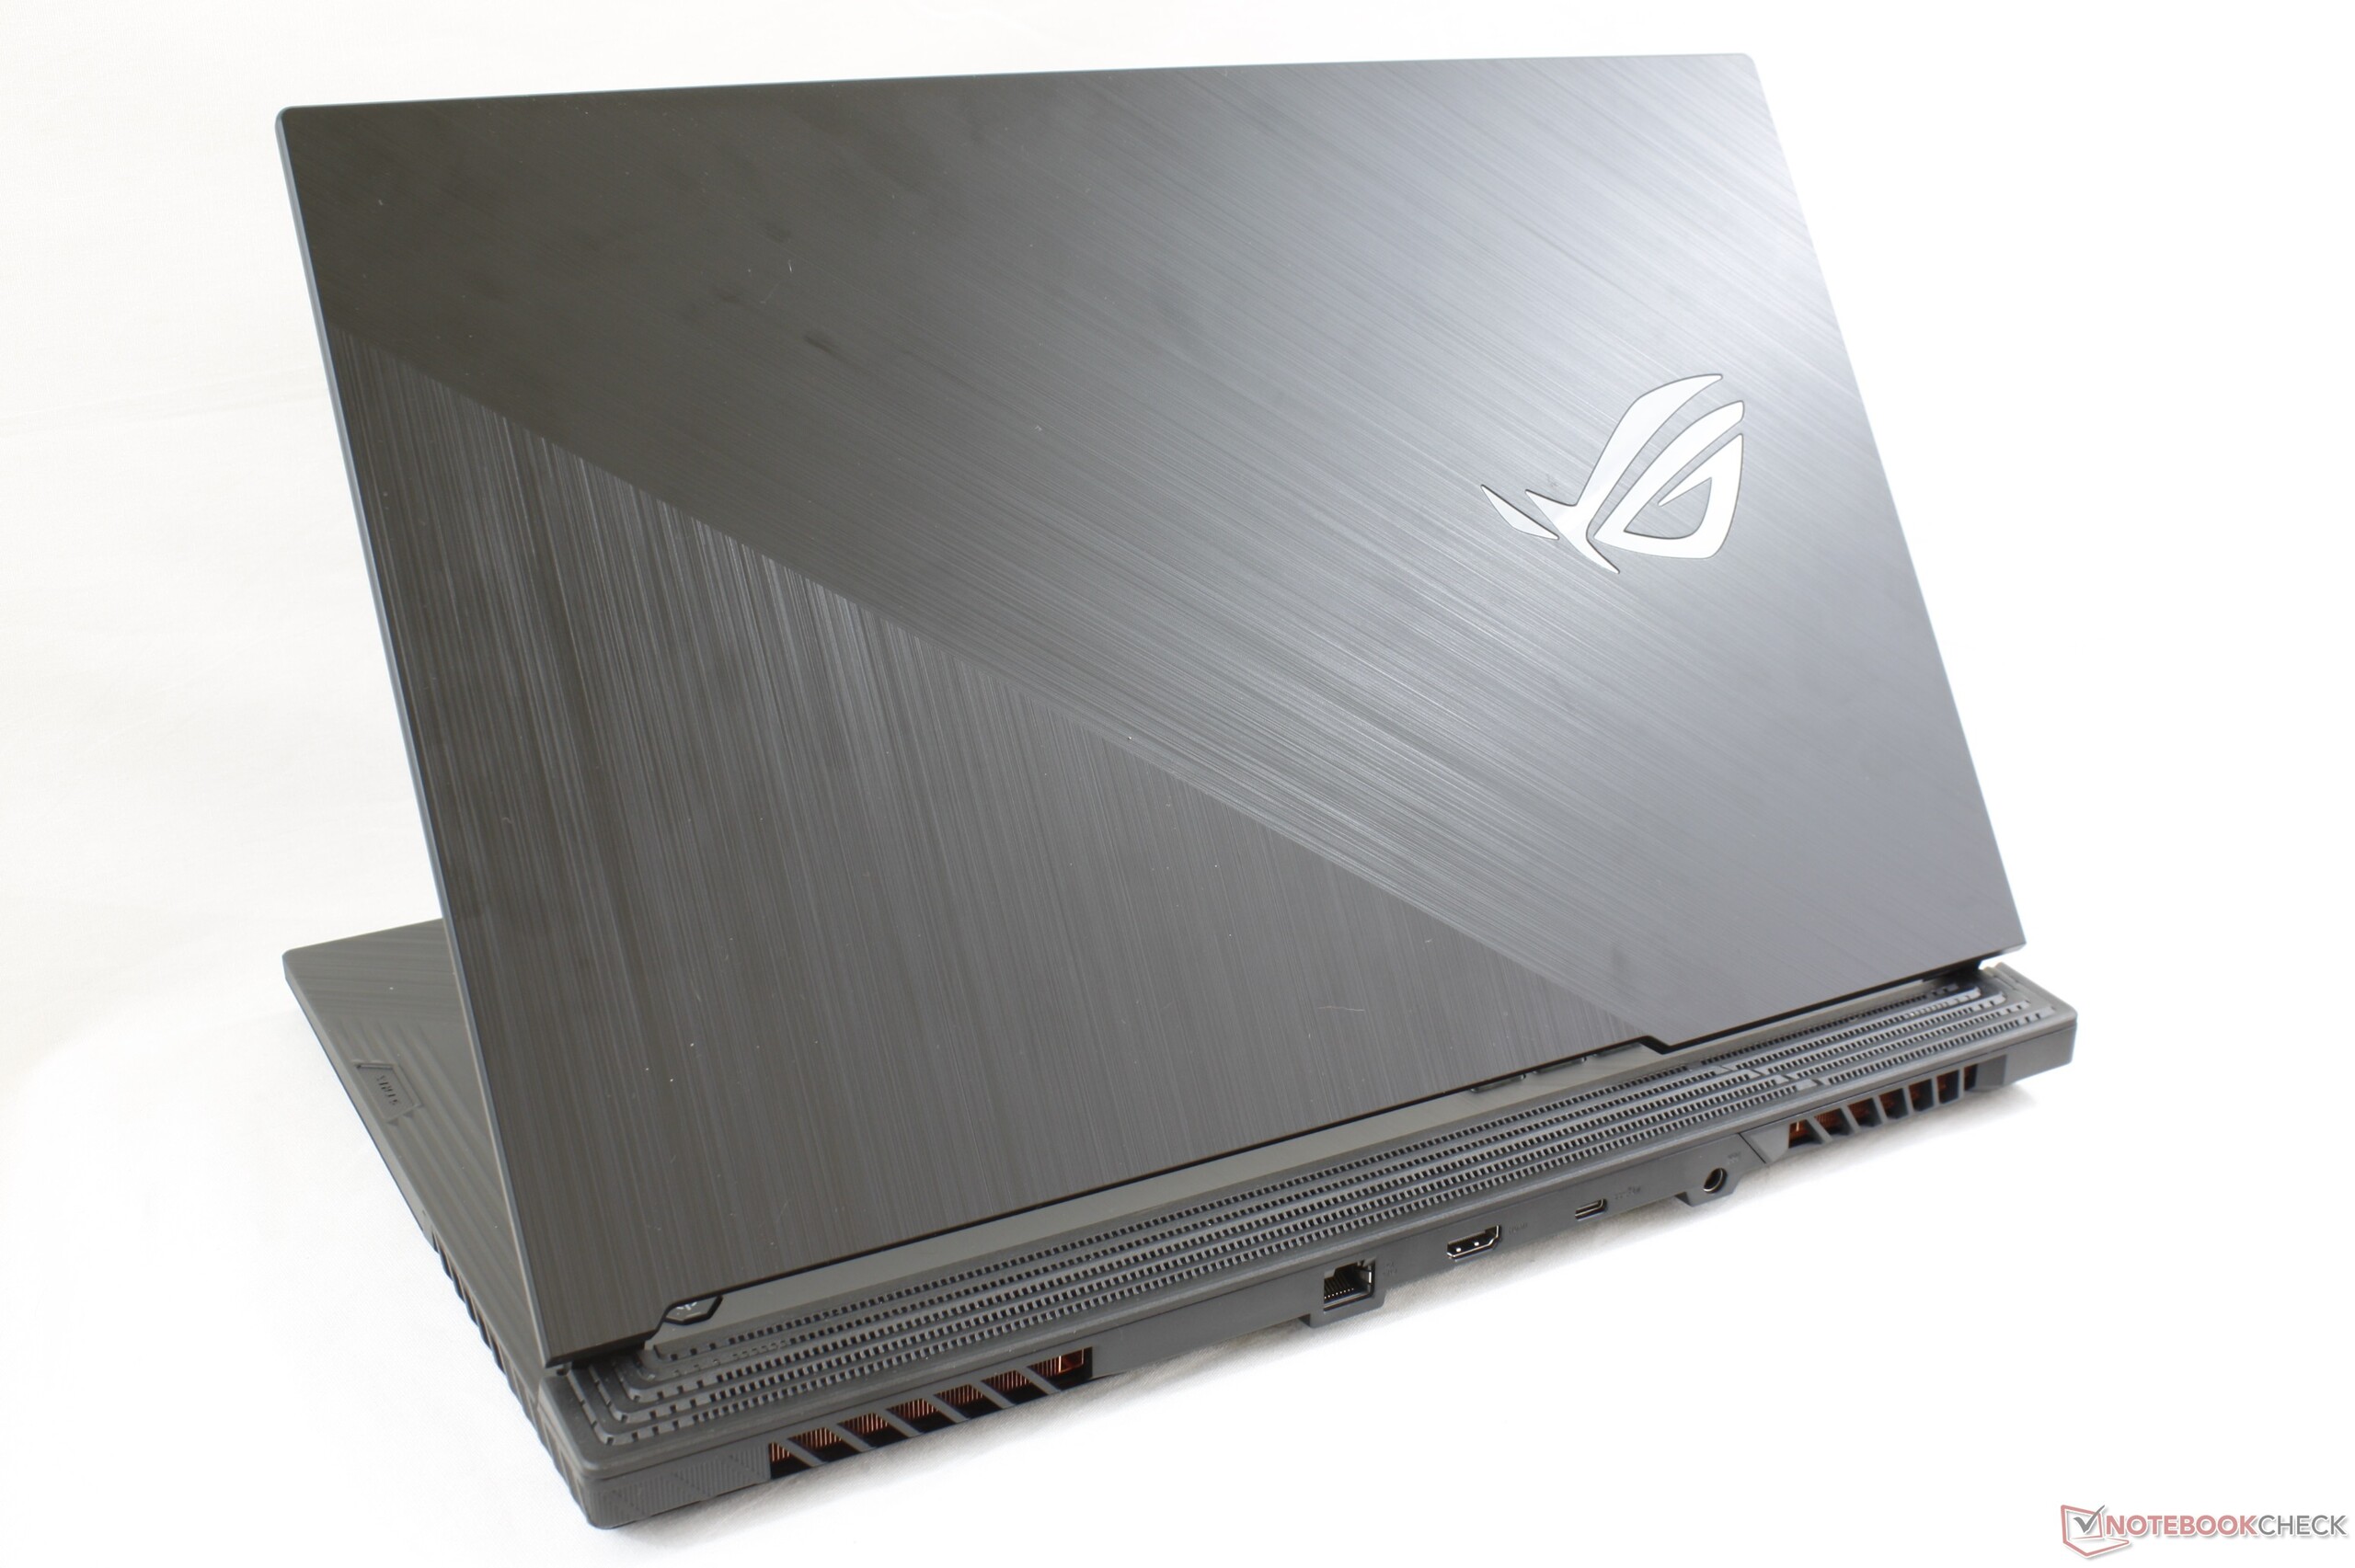
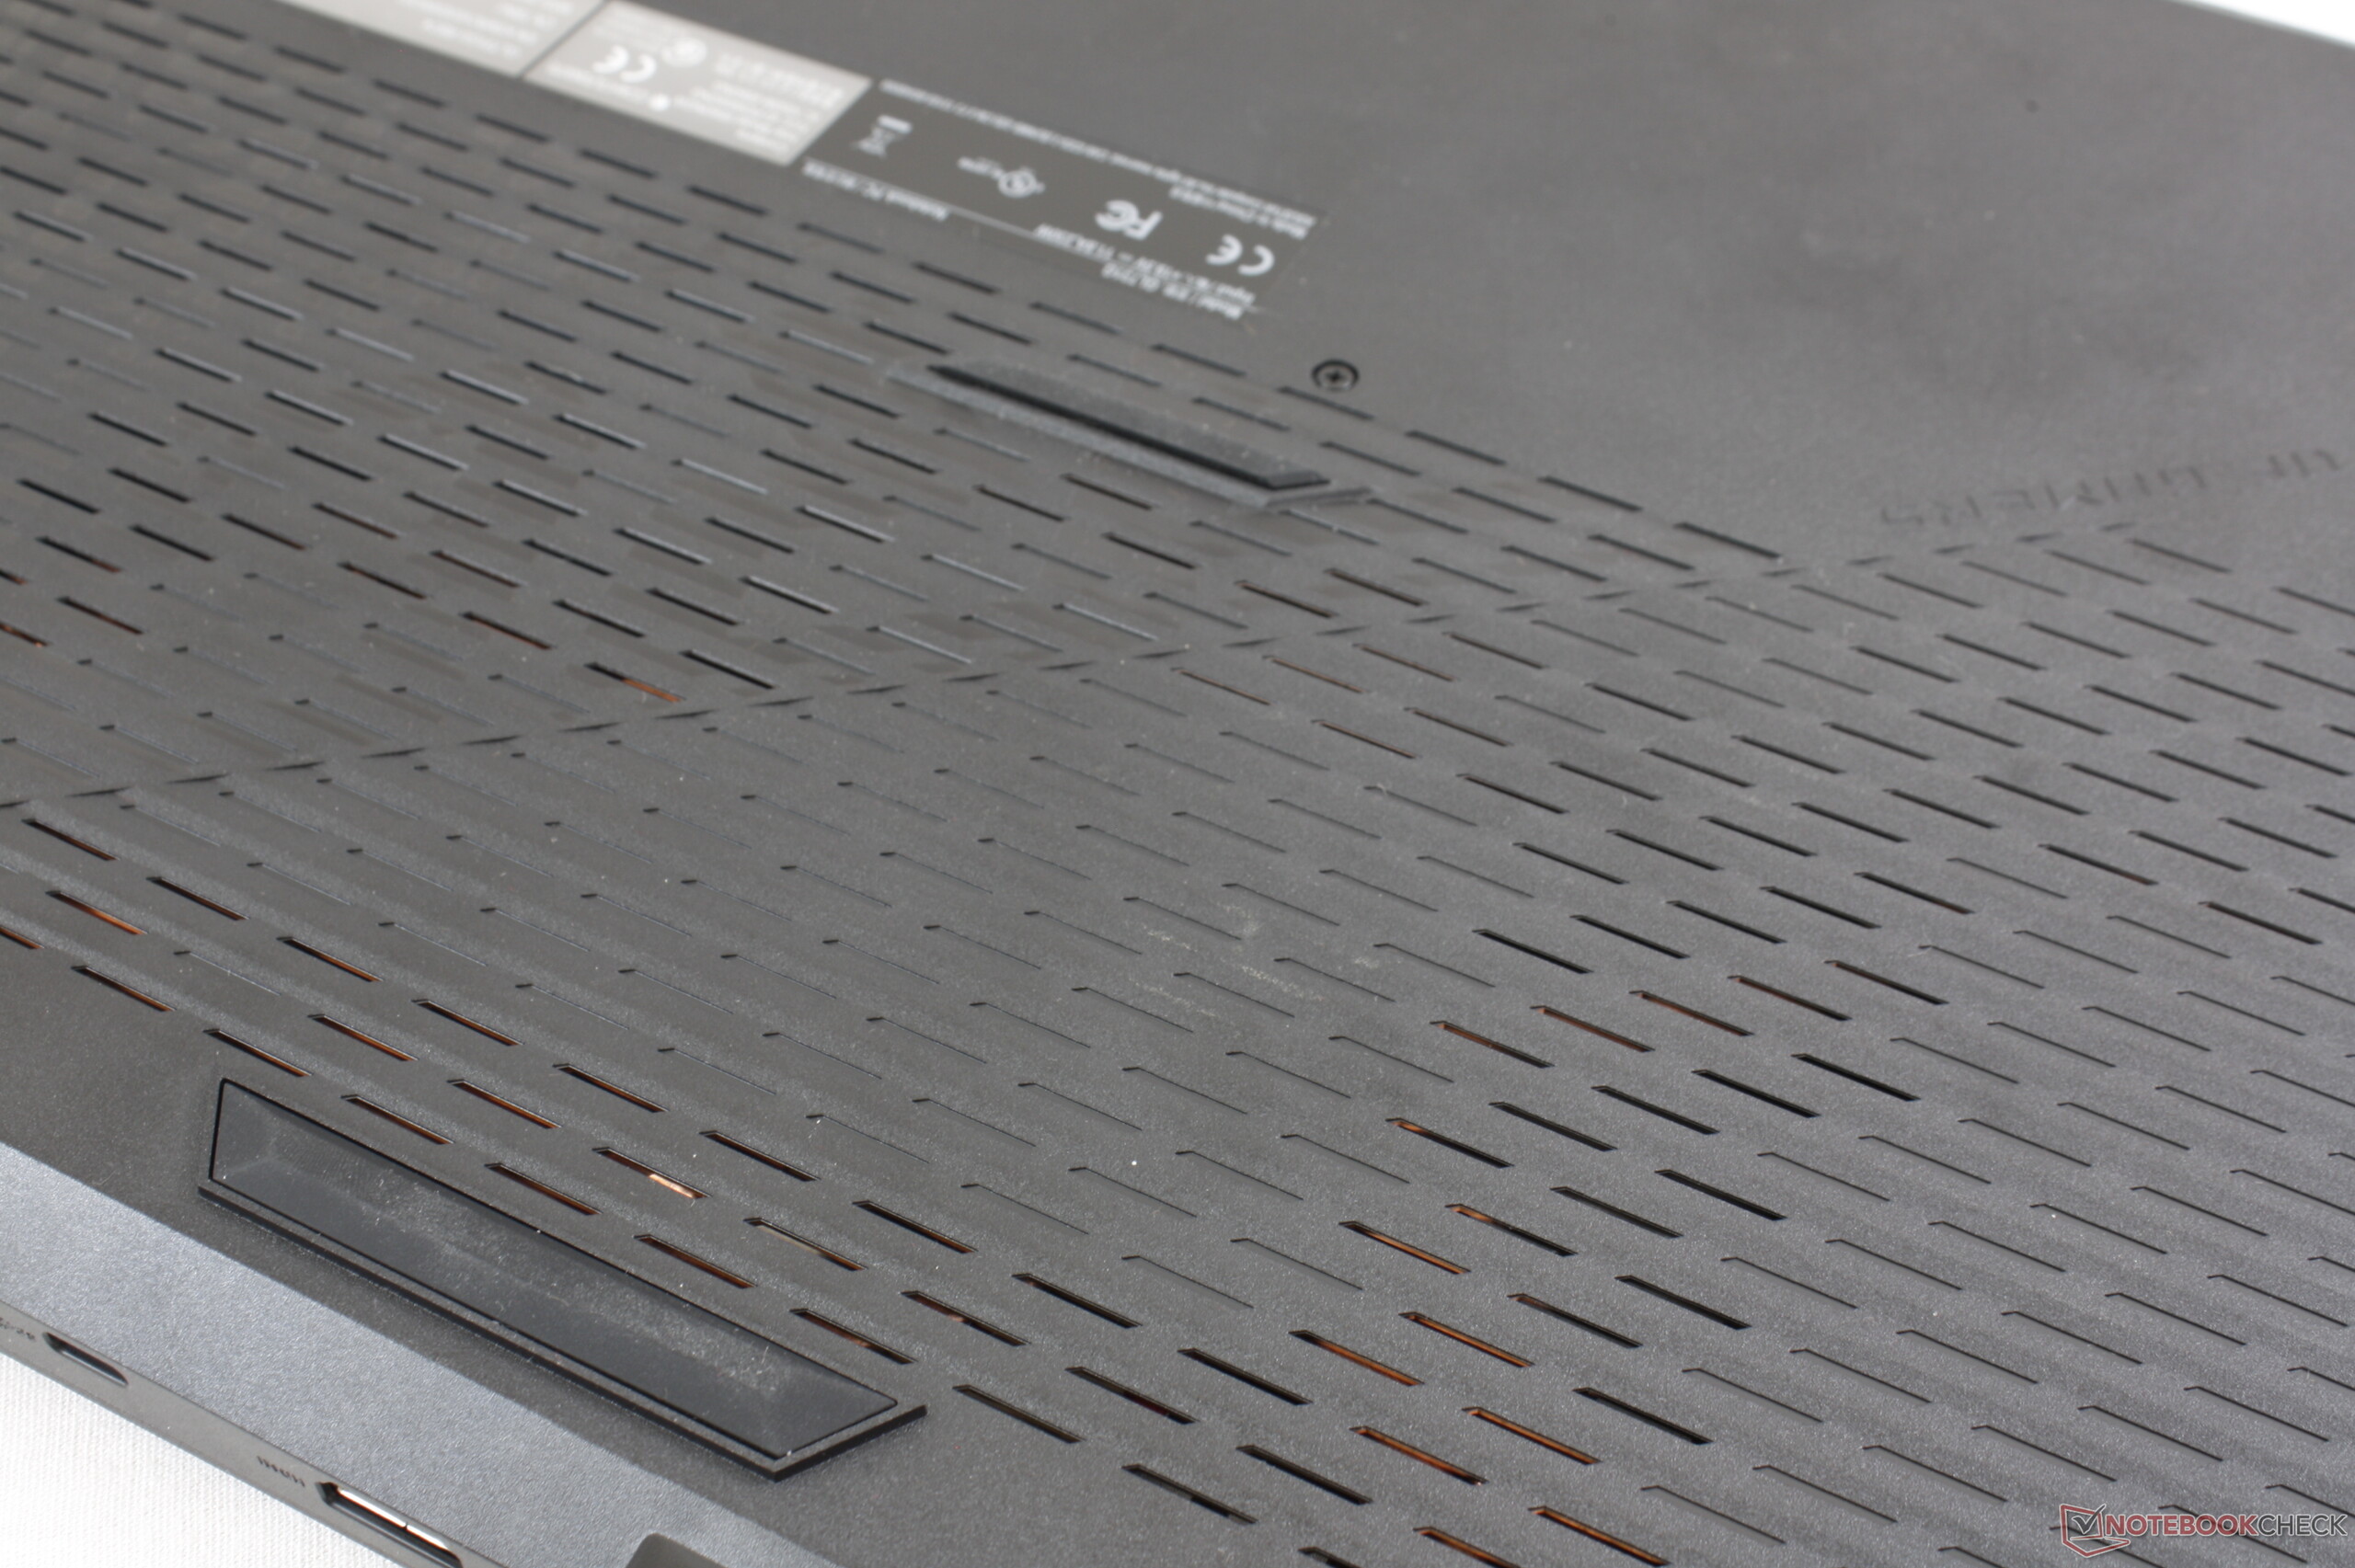
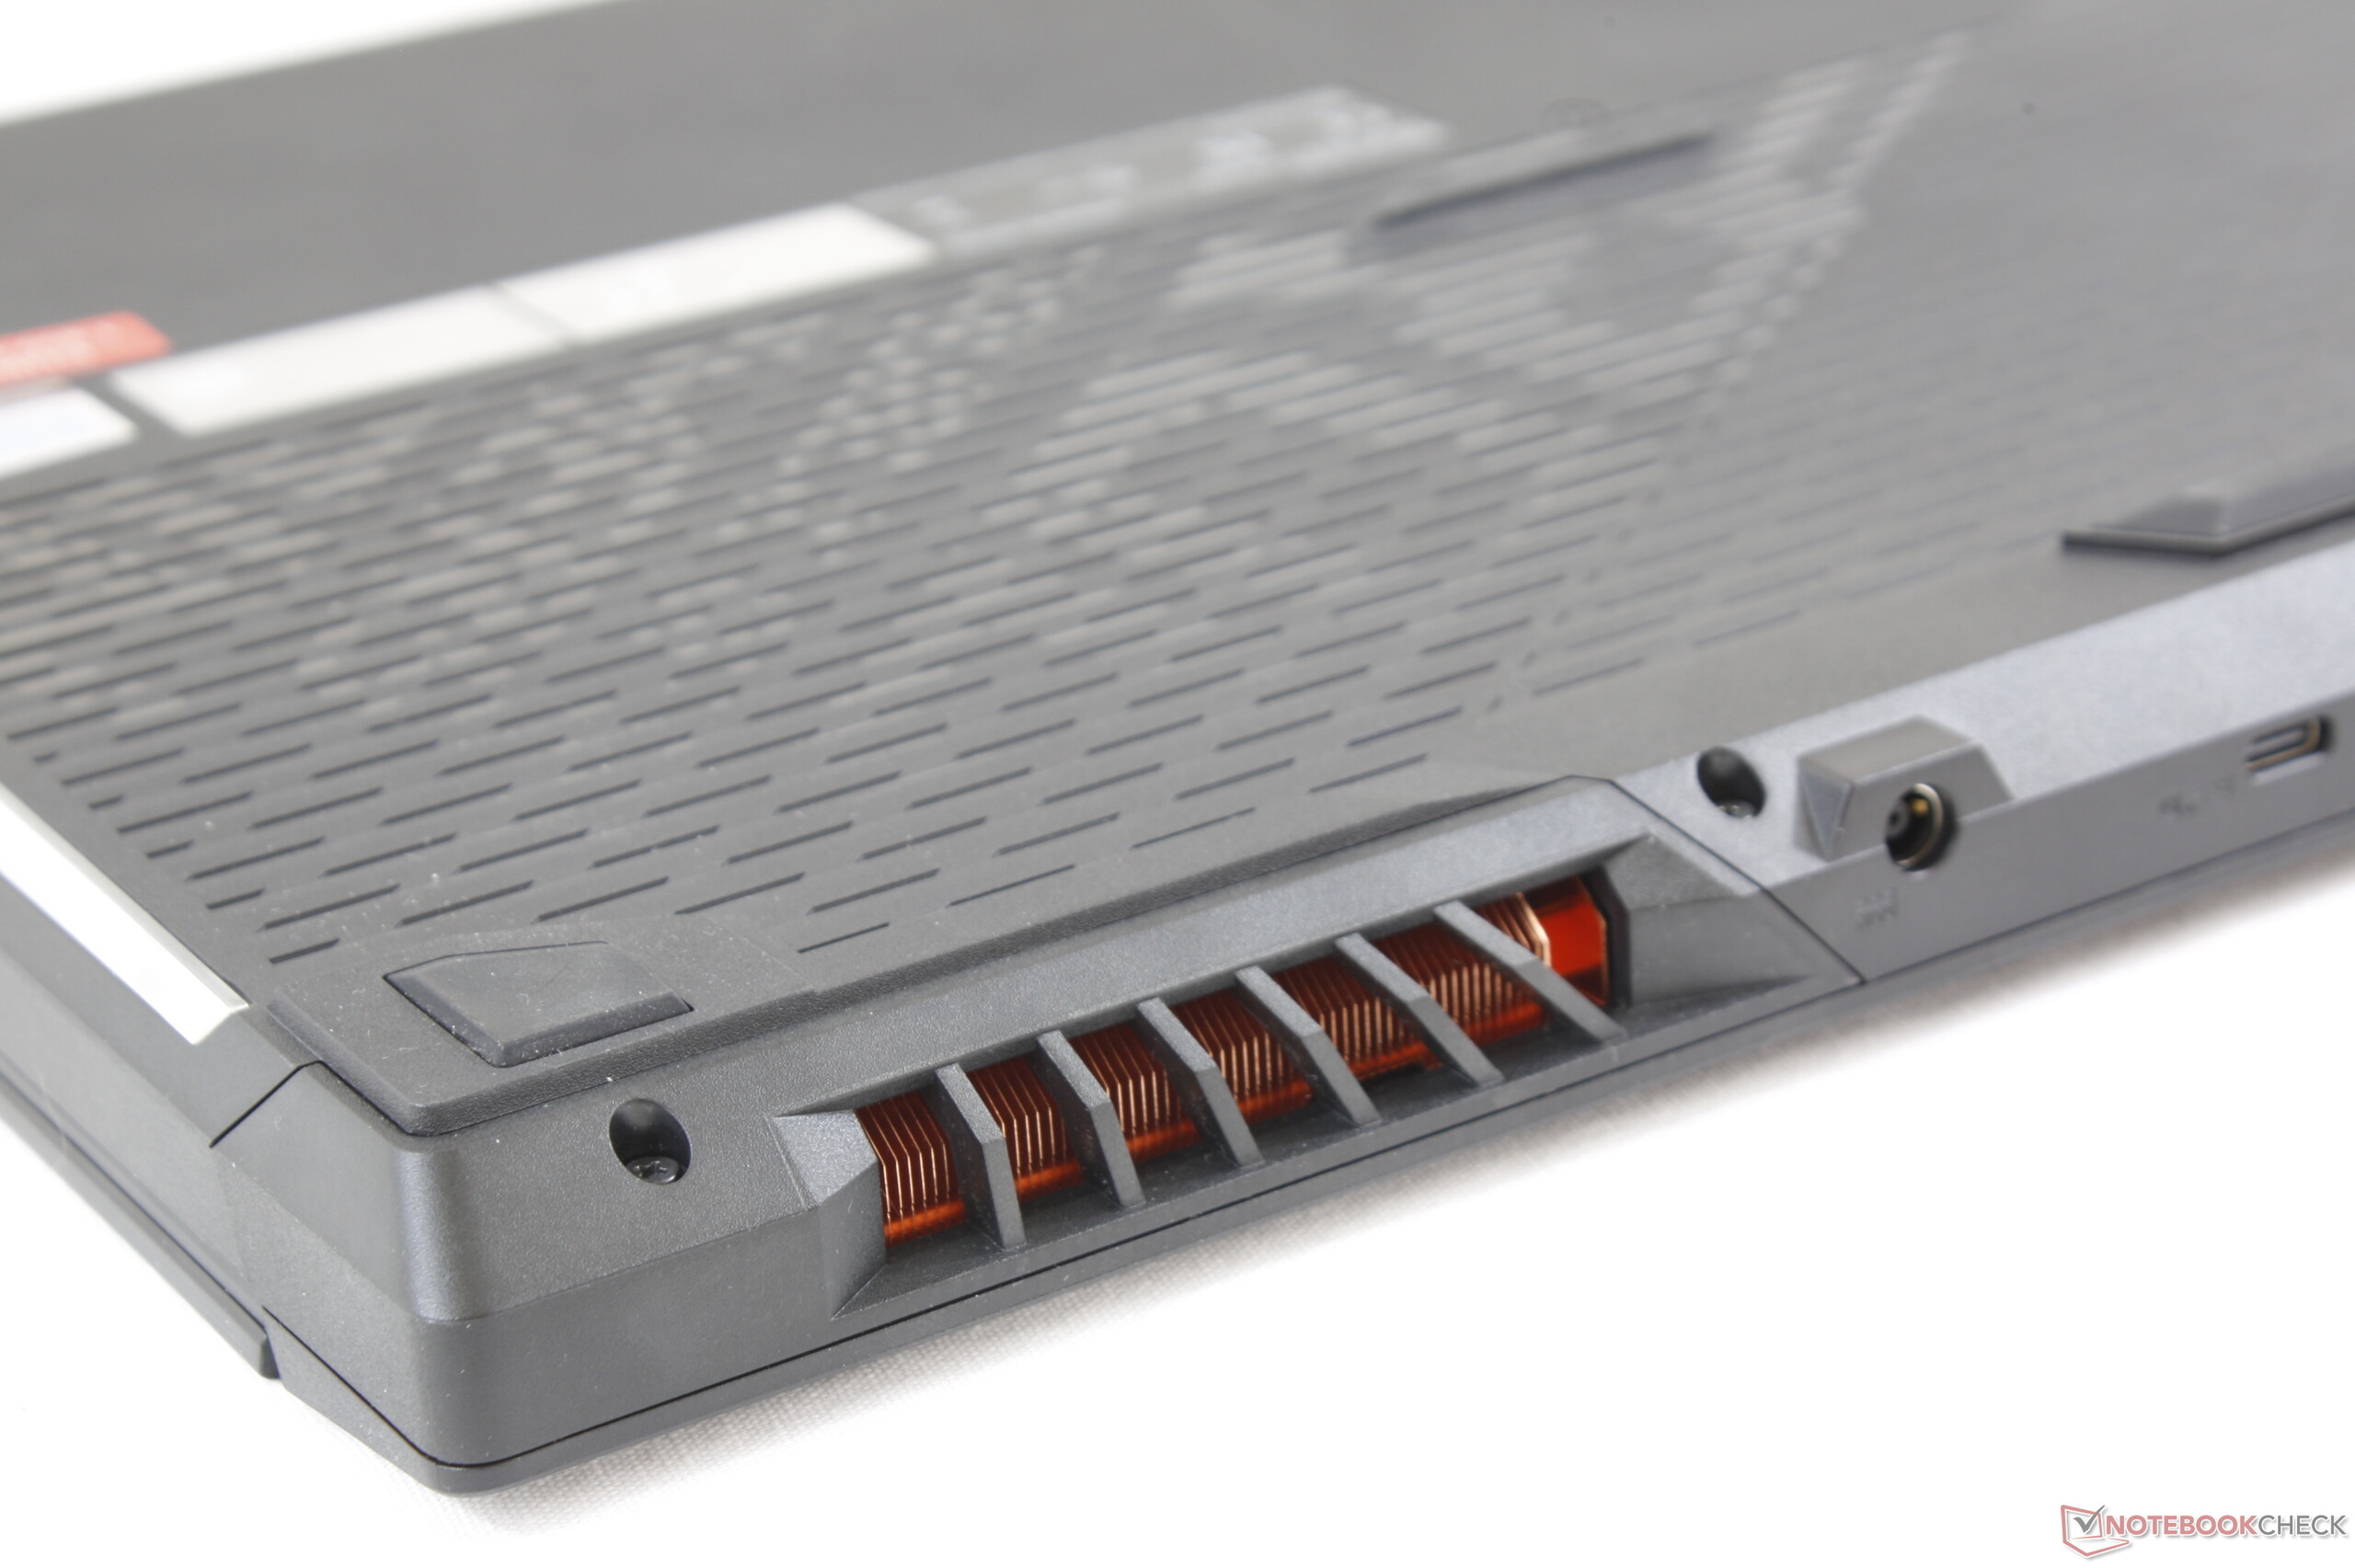
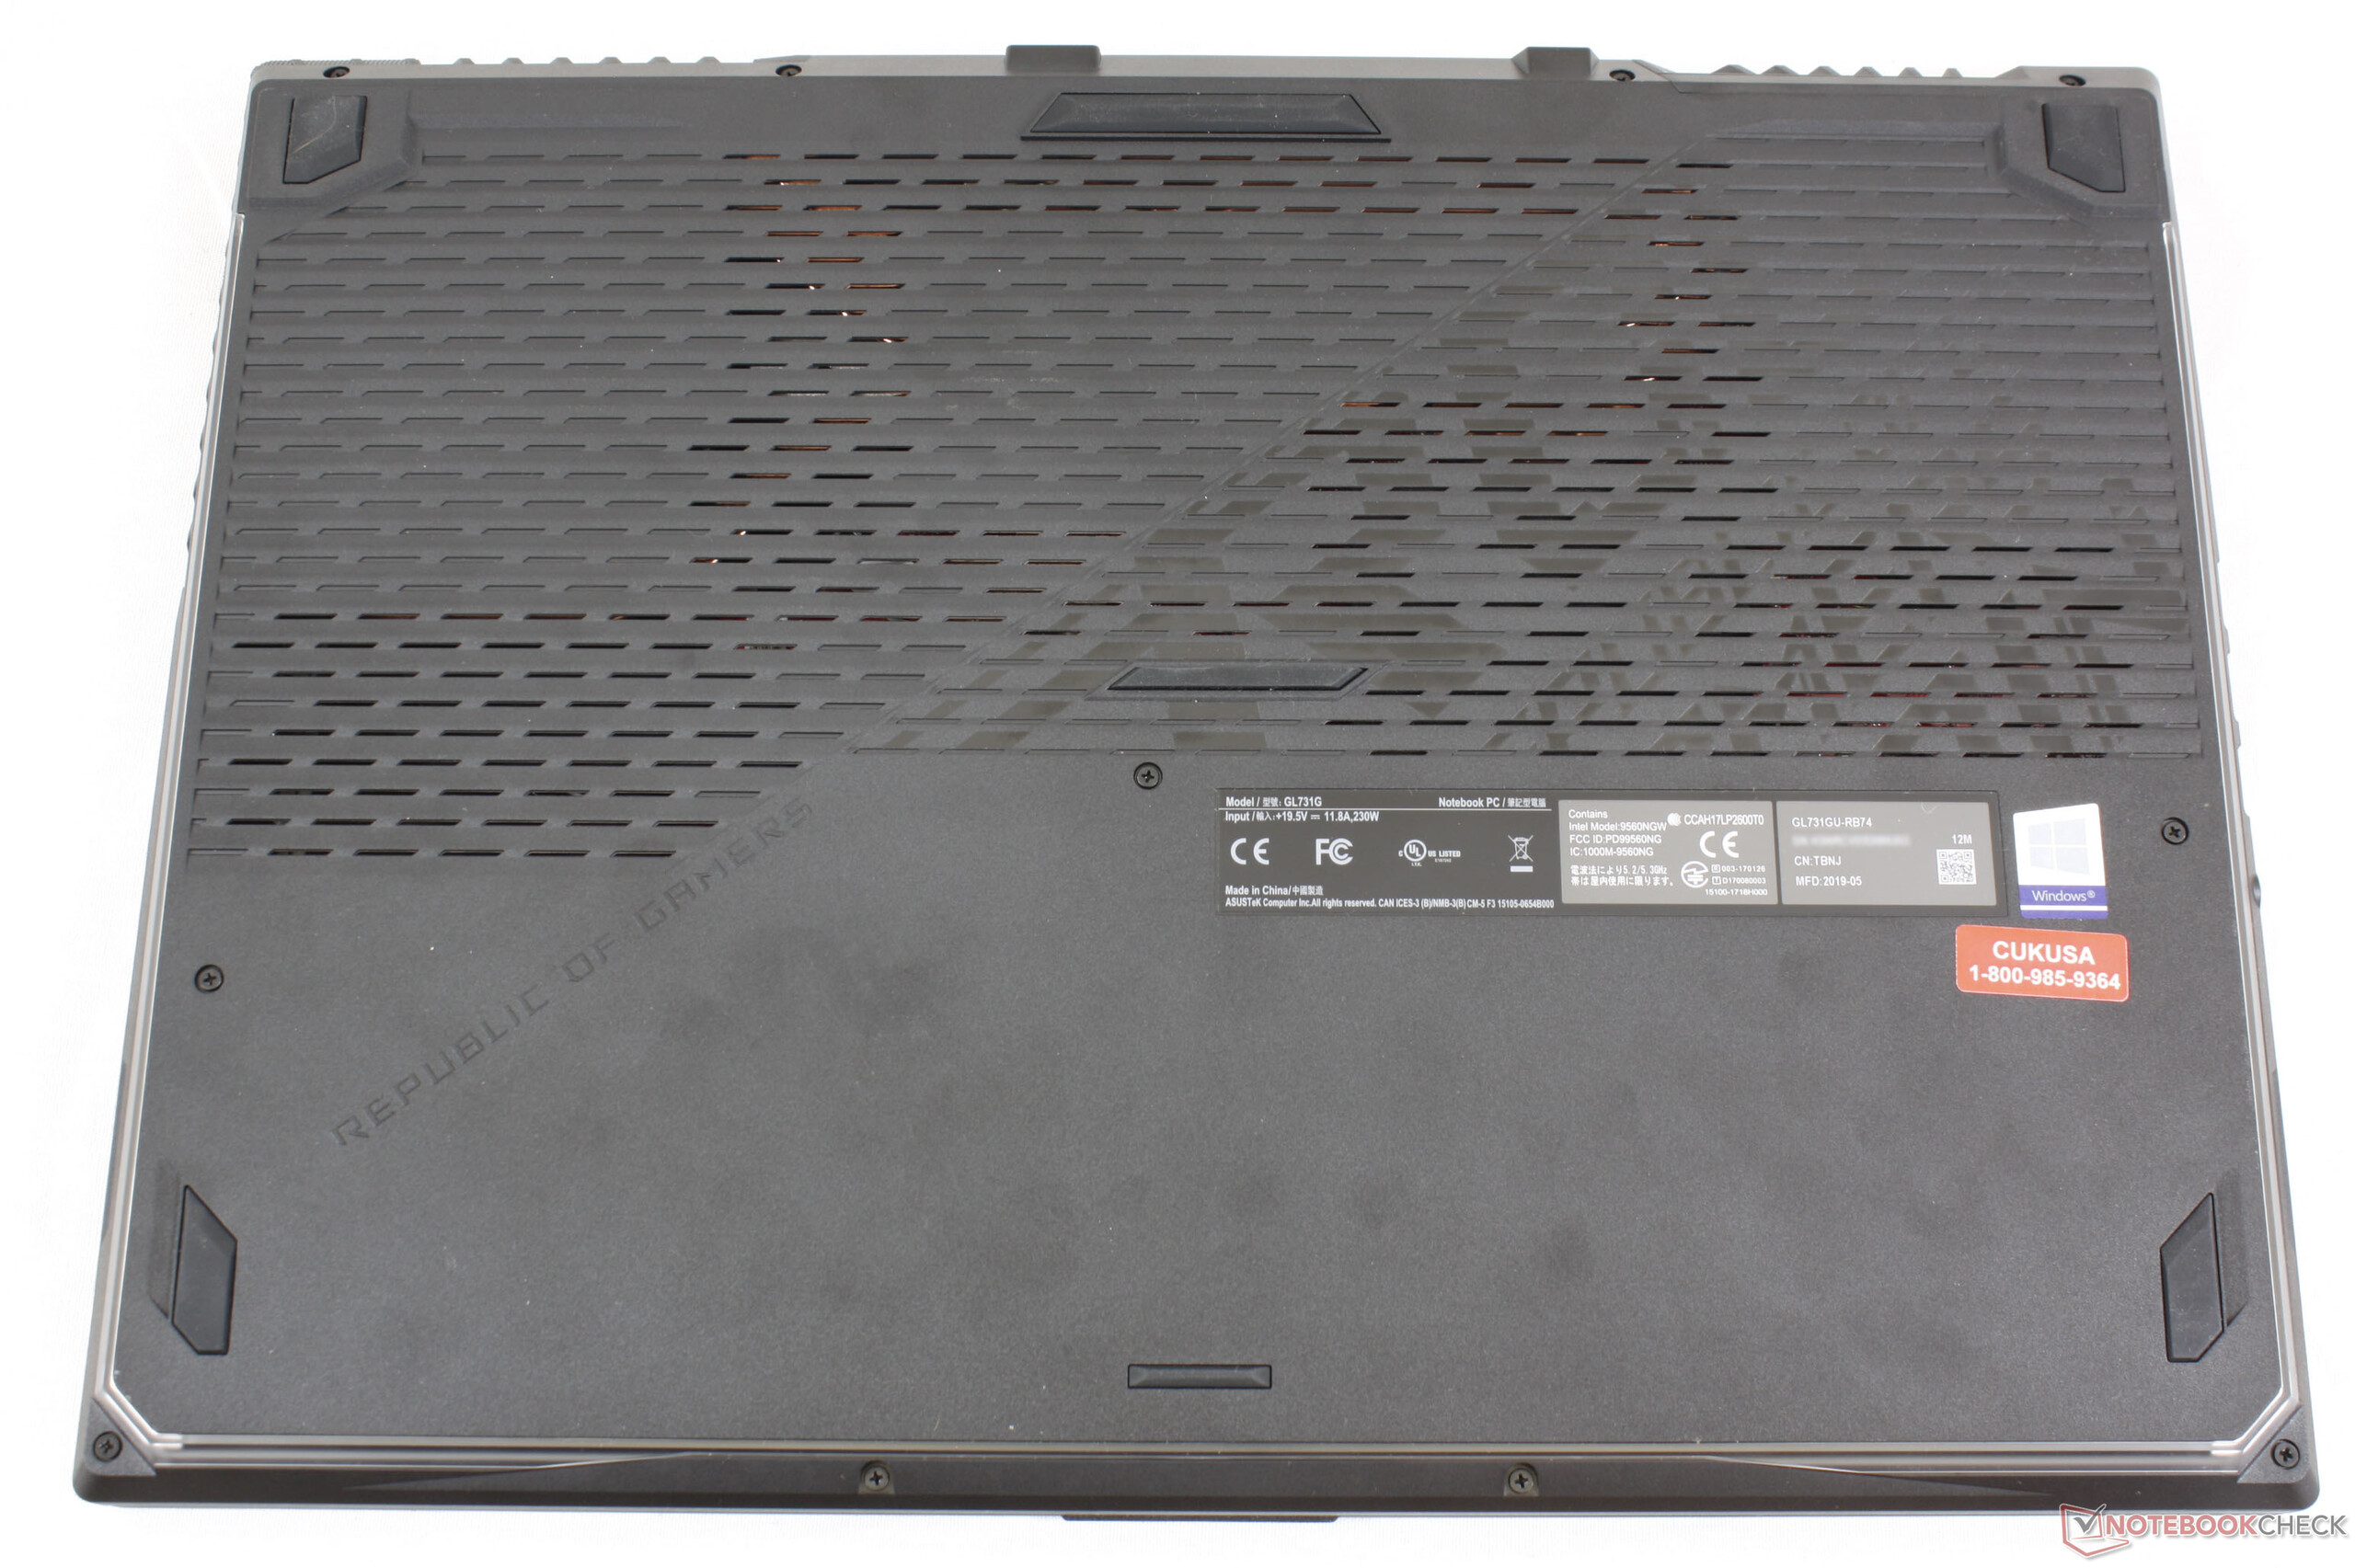
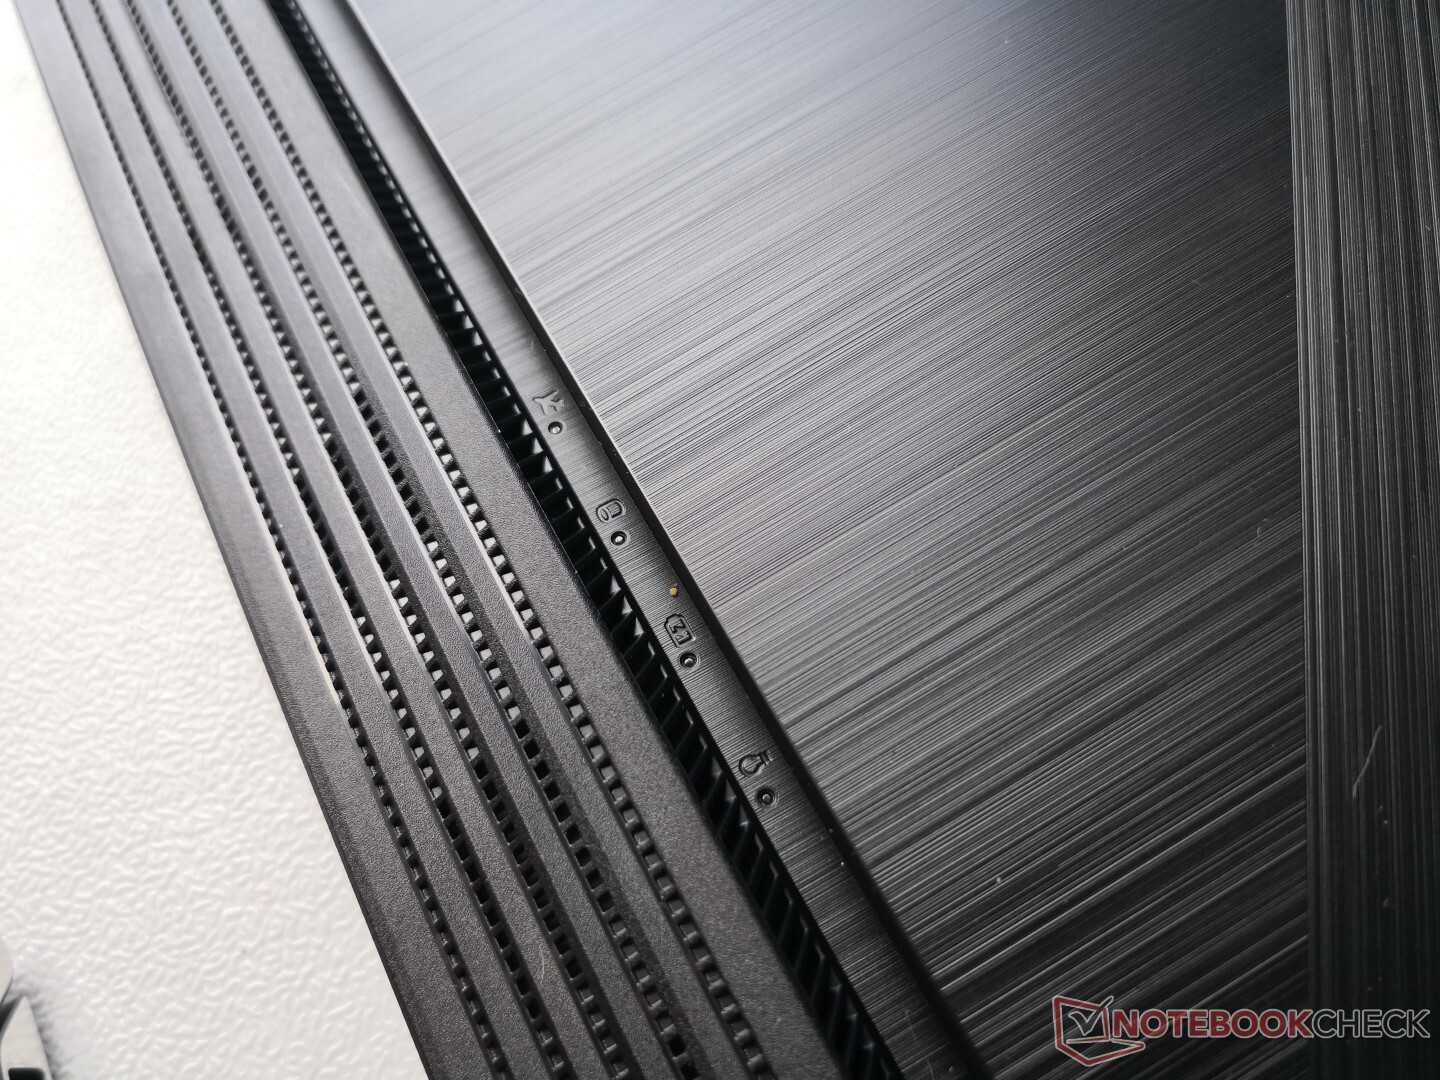
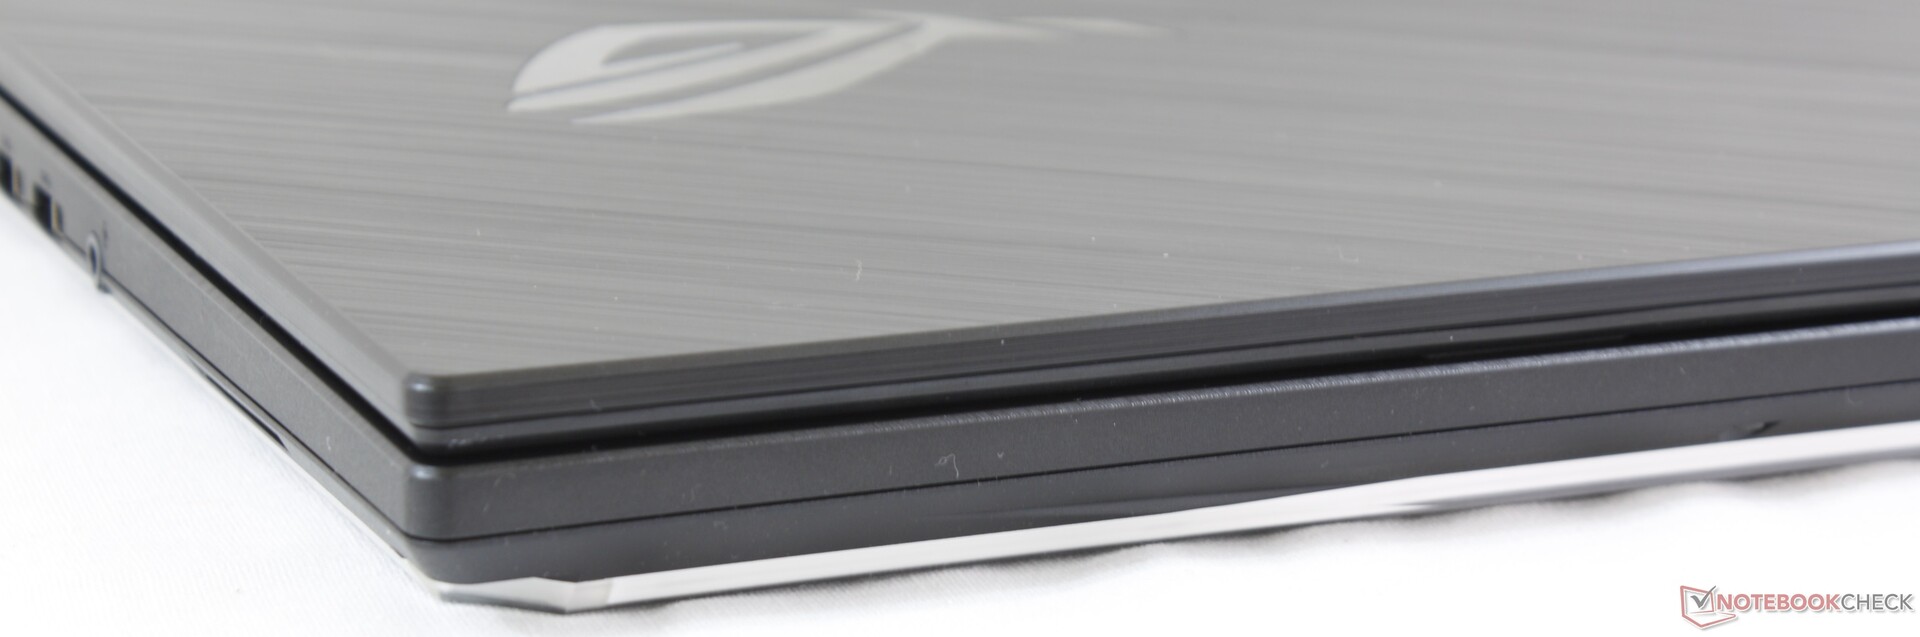
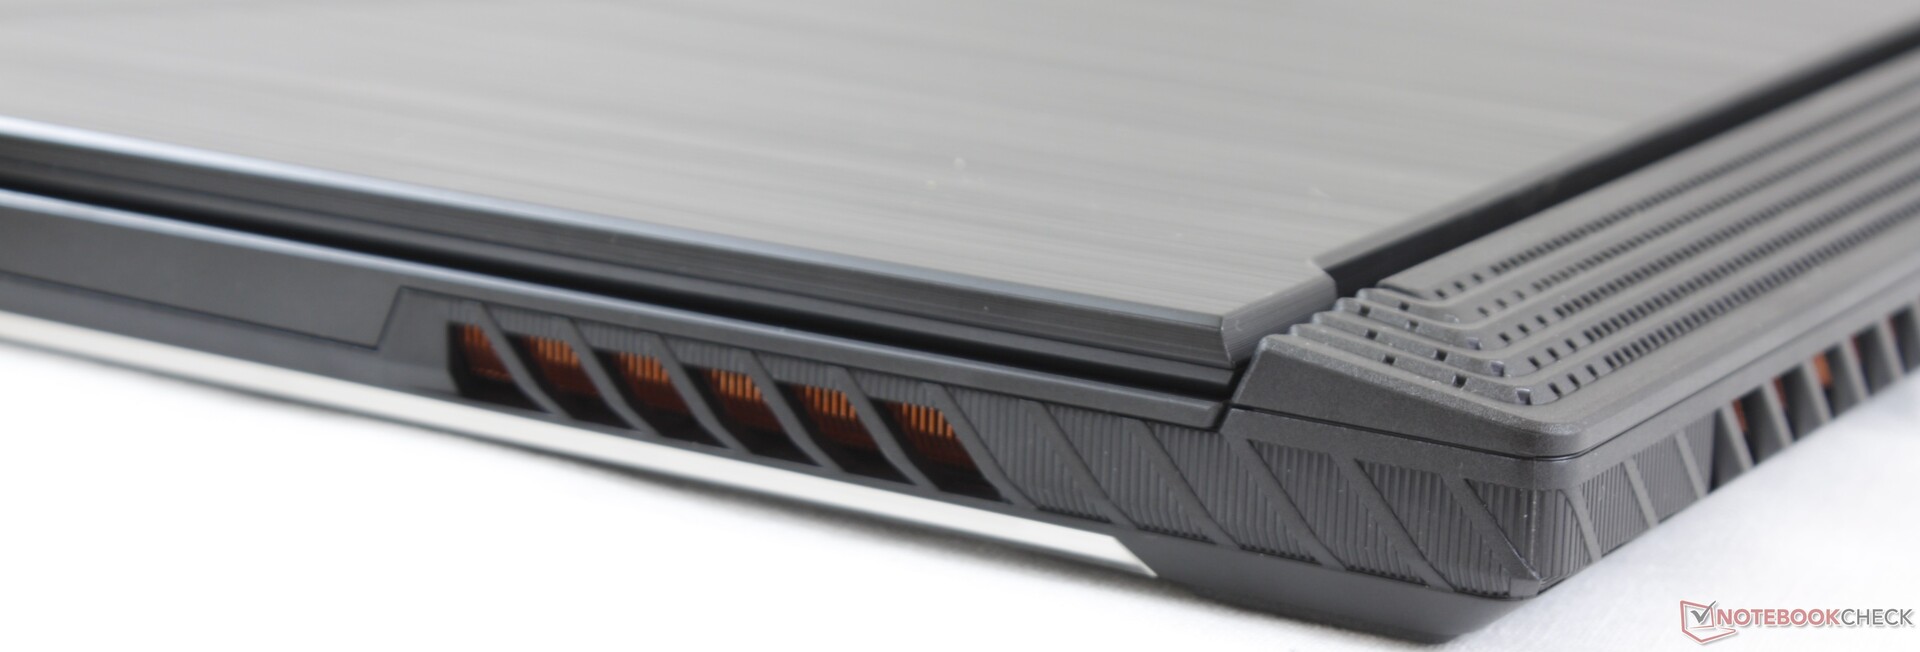
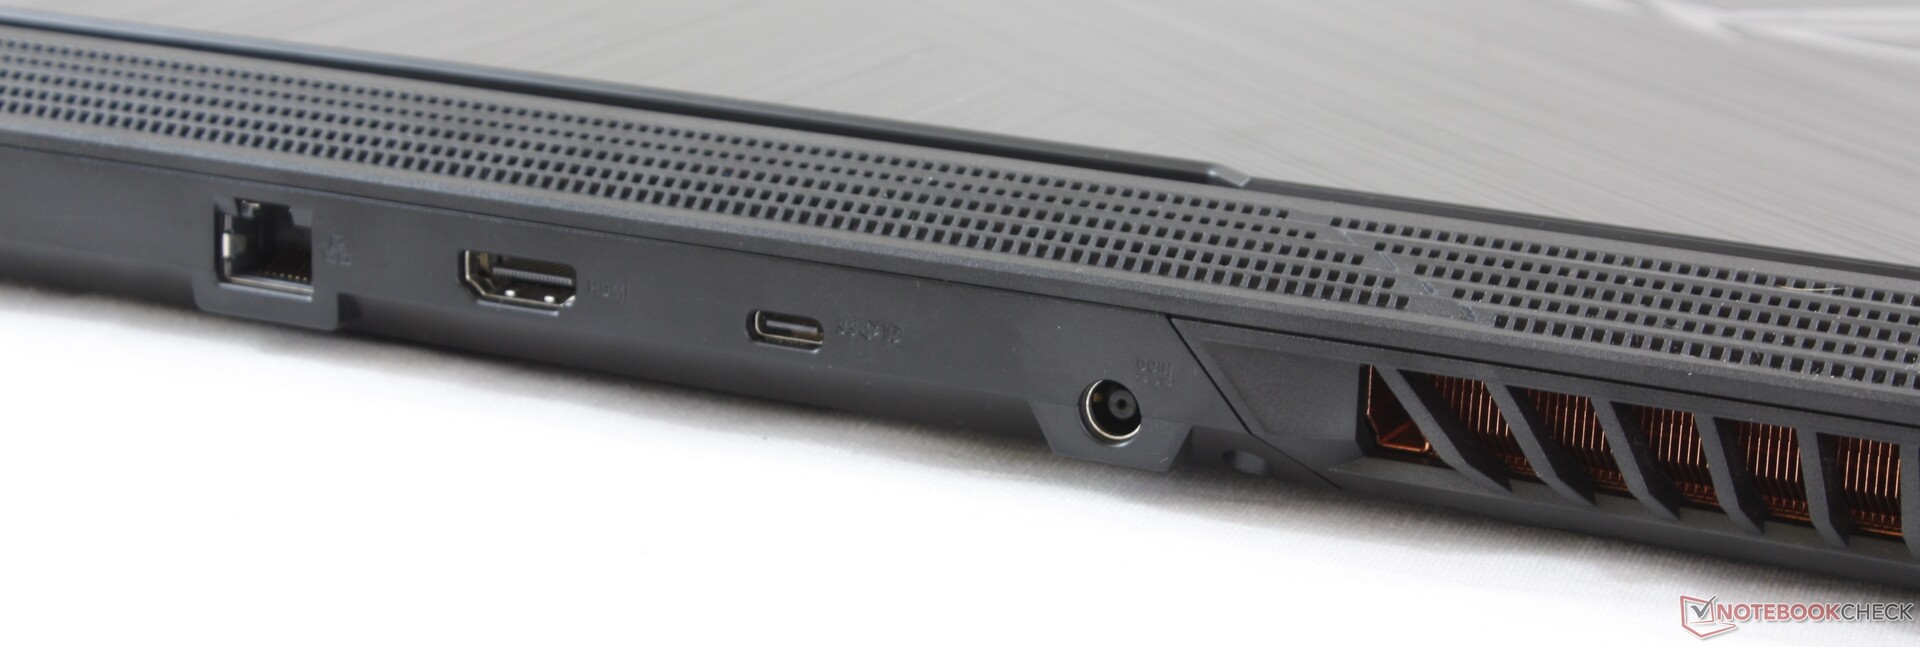
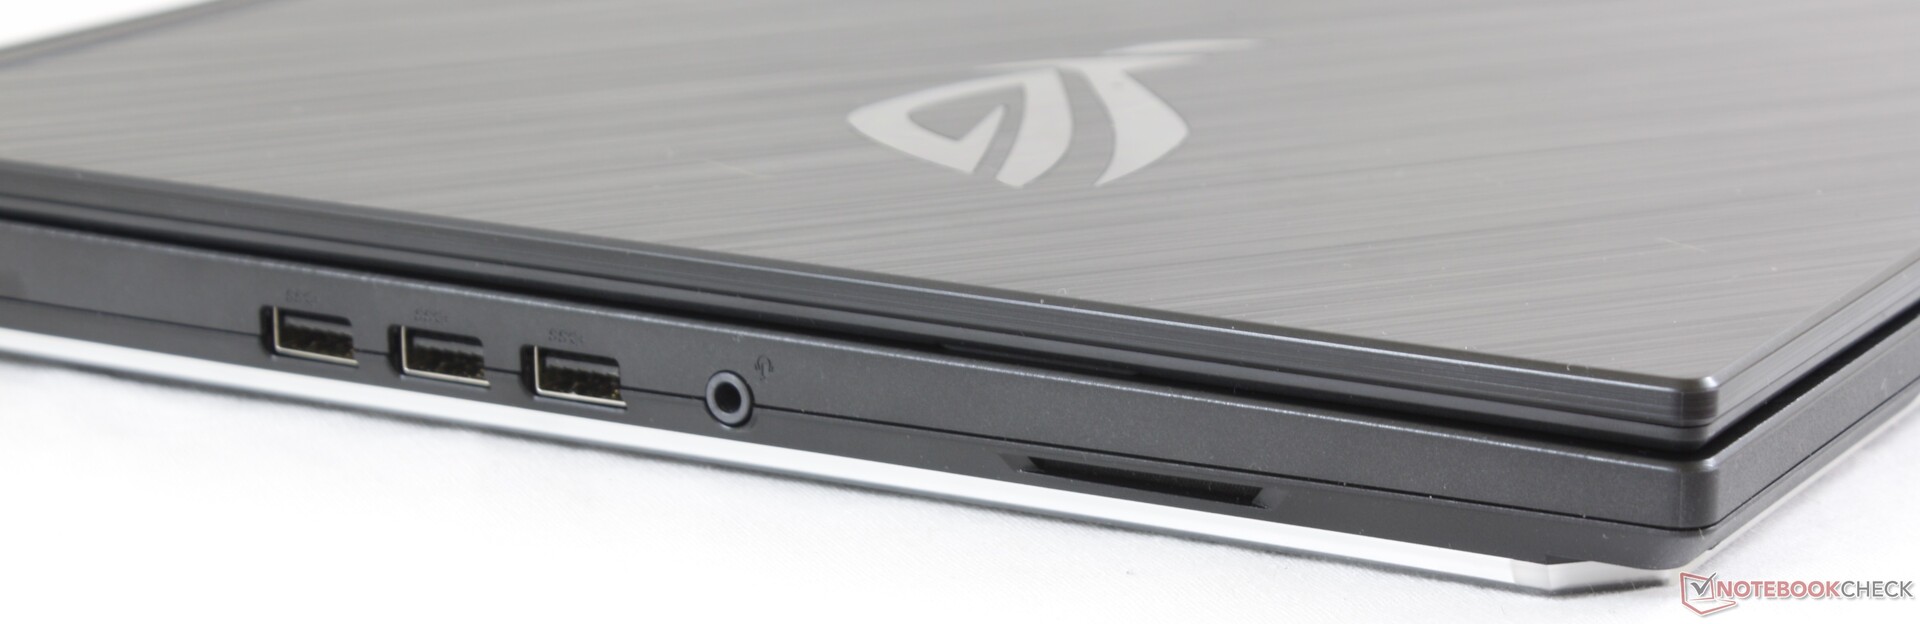
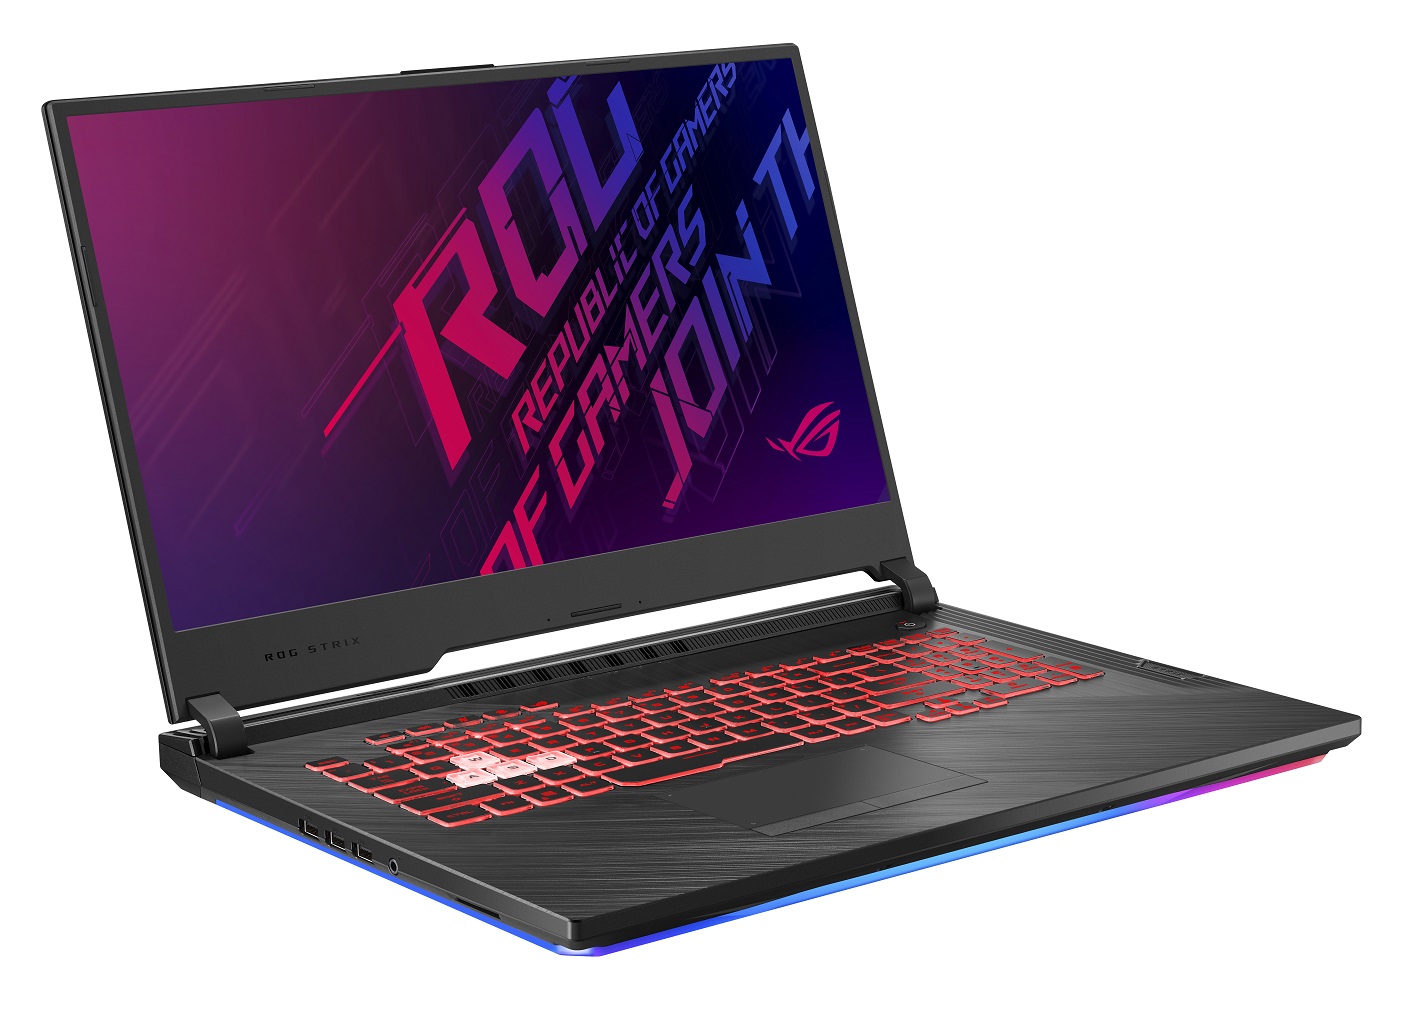
Al is er veel goeds aan de Asus GL731GU, zijn er ook enkele onbegrijpelijke beslissingen gemaakt qua design. Ten eerste gaat de LED-lichtstrip onverwachts ten koste van de onderhoudbaarheid doordat de bodemdeksel nu veel lastiger te verwijderen is. Als je enkel je opslag of RAM wilt uitbreiden, dan zul je je moeten voorbereiden op het voorzichtig losmaken en weer terugplaatsen van enkele erg fragiele lintkabels. Ten tweede is er geen reden waarom de pijltoetsen zo klein en krap moeten zijn in dit grote notebookformaat, zeker daar de vorige generatie Strix II grote pijltoetsen had. Ten derde ontbreekt de mogelijkheid om aparte kleurinstellingen te doen voor de LED-lichtstrip en het toetsenbord, wat de aanpasbaarheid van het systeem erg beperkt. We snappen het beperken van per-toets RGB-verlichting tot de duurdere modellen, maar voor € 1500 is dit toch een echt gemis. En tot slot zal de ongebruikelijke plaatsing van de poorten niet iedereen bevallen omdat er helemaal niets geplaatst is aan de rechterzijde - een zeldzaamheid voor een 17.3-inch game notebook.
Behalve de hiervoor genoemde verbijsterende minpunten weet de Strix G GL731 met succes de prestaties, beeldscherm en design van de duurdere Strix III G731-serie te bieden. Gebruikers die het uiterlijk en de gameprestaties van een high-end G731 willen, maar niet willen betalen voor per-toets RGB verlichting of een aluminium behuizing zullen in de GL731 een aantrekkelijk product vinden. De € 1500 prijsindicatie voor onze configuratie is vrij standaard voor een 17.3-inch game notebook met een GTX 1660 Ti grafische kaart.
Een paar ergernissen doen af aan de verder goed presterende notebook. Als je kunt leven met de relatief grote afmetingen, hoge gewicht, kleine pijltoetsen en lastig onderhoudbaarheid, dan vind je in de GL731GU een van de fraaiere middenklasse game notebooks van dit beeldschermformaat. Met name de temperaturen en de geluidskwaliteit zijn beter dan verwacht.
Asus ROG Strix G GL731GU-RB74
- 19-07-2019 v6 (old)
Allen Ngo
Price comparison
