Kort testrapport Eurocom Nightsky RX17 (Clevo PB71RF) Laptop
| SD Card Reader | |
| average JPG Copy Test (av. of 3 runs) | |
| Eurocom Nightsky RX17 (Toshiba Exceria Pro SDXC 64 GB UHS-II) | |
| Eurocom Q8 (Toshiba Exceria Pro SDXC 64 GB UHS-II) | |
| Razer Blade Pro 17 RTX 2080 Max-Q (Toshiba Exceria Pro SDXC 64 GB UHS-II) | |
| Asus ZenBook 15 UX533FD (Toshiba Exceria Pro SDXC 64 GB UHS-II) | |
| maximum AS SSD Seq Read Test (1GB) | |
| Eurocom Nightsky RX17 (Toshiba Exceria Pro SDXC 64 GB UHS-II) | |
| Eurocom Q8 (Toshiba Exceria Pro SDXC 64 GB UHS-II) | |
| Razer Blade Pro 17 RTX 2080 Max-Q (Toshiba Exceria Pro SDXC 64 GB UHS-II) | |
| Asus ZenBook 15 UX533FD (Toshiba Exceria Pro SDXC 64 GB UHS-II) | |
| Networking | |
| iperf3 transmit AX12 | |
| Razer Blade Pro 17 RTX 2080 Max-Q | |
| Eurocom Q8 | |
| Asus Zephyrus S GX701GX | |
| Eurocom Nightsky RX17 | |
| iperf3 receive AX12 | |
| Razer Blade Pro 17 RTX 2080 Max-Q | |
| Asus Zephyrus S GX701GX | |
| Eurocom Q8 | |
| Eurocom Nightsky RX17 | |
| |||||||||||||||||||||||||
Helderheidsverdeling: 90 %
Helderheid in Batterij-modus: 298.4 cd/m²
Contrast: 995:1 (Zwart: 0.3 cd/m²)
ΔE ColorChecker Calman: 3.58 | ∀{0.5-29.43 Ø4.71}
calibrated: 2.82
ΔE Greyscale Calman: 3.1 | ∀{0.09-98 Ø4.96}
92.7% sRGB (Argyll 1.6.3 3D)
60.2% AdobeRGB 1998 (Argyll 1.6.3 3D)
67.2% AdobeRGB 1998 (Argyll 3D)
93.1% sRGB (Argyll 3D)
66.1% Display P3 (Argyll 3D)
Gamma: 2.24
CCT: 7064 K
| Eurocom Nightsky RX17 BOE NV173FHM-N44, IPS, 17.3", 1920x1080 | Razer Blade Pro 17 RTX 2080 Max-Q AU Optronics B173HAN04.0, IPS, 17.3", 1920x1080 | Asus Zephyrus S GX701GX B173HAN04.0 (AUO409D), IPS, 17.3", 1920x1080 | MSI GS75 8SG Stealth N173HCE-G33 (CMN175C), IPS, 17.3", 1920x1080 | Eurocom Q8 AU Optronics B173QTN01.0, Dell P/N WJGD4, TN LED, 17.3", 2560x1440 | Lenovo Legion Y740-17ICH AU Optronics B173HAN03.2, IPS, 17.3", 1920x1080 | |
|---|---|---|---|---|---|---|
| Display | -7% | -5% | -2% | -12% | -3% | |
| Display P3 Coverage (%) | 66.1 | 60.6 -8% | 62.9 -5% | 63.6 -4% | 58.7 -11% | 64 -3% |
| sRGB Coverage (%) | 93.1 | 89 -4% | 87.8 -6% | 95.4 2% | 81 -13% | 90.4 -3% |
| AdobeRGB 1998 Coverage (%) | 67.2 | 62.1 -8% | 63.9 -5% | 65.5 -3% | 58.9 -12% | 64.8 -4% |
| Response Times | 34% | 32% | 31% | -10% | -9% | |
| Response Time Grey 50% / Grey 80% * (ms) | 16.4 ? | 6.8 ? 59% | 7.2 ? 56% | 7.6 ? 54% | 21.6 ? -32% | 15.6 ? 5% |
| Response Time Black / White * (ms) | 10.4 ? | 9.6 ? 8% | 9.6 ? 8% | 9.6 ? 8% | 9 ? 13% | 12.8 ? -23% |
| PWM Frequency (Hz) | 990 ? | 25510 ? | ||||
| Screen | 4% | 17% | 26% | -74% | -22% | |
| Brightness middle (cd/m²) | 298.4 | 299.3 0% | 288 -3% | 355 19% | 367.9 23% | 299.1 0% |
| Brightness (cd/m²) | 287 | 294 2% | 287 0% | 327 14% | 346 21% | 273 -5% |
| Brightness Distribution (%) | 90 | 94 4% | 91 1% | 85 -6% | 84 -7% | 81 -10% |
| Black Level * (cd/m²) | 0.3 | 0.29 3% | 0.2 33% | 0.26 13% | 0.55 -83% | 0.27 10% |
| Contrast (:1) | 995 | 1032 4% | 1440 45% | 1365 37% | 669 -33% | 1108 11% |
| Colorchecker dE 2000 * | 3.58 | 2.55 29% | 2.33 35% | 1.54 57% | 9.86 -175% | 5.07 -42% |
| Colorchecker dE 2000 max. * | 6.29 | 4.73 25% | 5.34 15% | 3 52% | 17.56 -179% | 10.55 -68% |
| Colorchecker dE 2000 calibrated * | 2.82 | 2.9 -3% | 2.47 12% | 0.77 73% | 4.43 -57% | 3.31 -17% |
| Greyscale dE 2000 * | 3.1 | 3.5 -13% | 1.19 62% | 2.19 29% | 12.4 -300% | 6.8 -119% |
| Gamma | 2.24 98% | 2.28 96% | 2.41 91% | 2.42 91% | 2.09 105% | 2.46 89% |
| CCT | 7064 92% | 7101 92% | 6710 97% | 6893 94% | 11064 59% | 7805 83% |
| Color Space (Percent of AdobeRGB 1998) (%) | 60.2 | 57 -5% | 57 -5% | 61 1% | 52.5 -13% | 58.5 -3% |
| Color Space (Percent of sRGB) (%) | 92.7 | 88.7 -4% | 88 -5% | 95 2% | 80.5 -13% | 89.9 -3% |
| Totaal Gemiddelde (Programma / Instellingen) | 10% /
6% | 15% /
15% | 18% /
22% | -32% /
-54% | -11% /
-17% |
* ... kleiner is beter
Responstijd Scherm
| ↔ Responstijd Zwart naar Wit | ||
|---|---|---|
| 10.4 ms ... stijging ↗ en daling ↘ gecombineerd | ↗ 6 ms stijging | 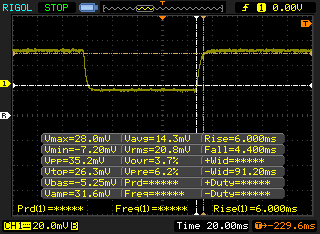 |
| ↘ 4.4 ms daling | ||
| Het scherm vertoonde prima responstijden in onze tests maar is misschien wat te traag voor competitieve games. Ter vergelijking: alle testtoestellen variëren van 0.1 (minimum) tot 240 (maximum) ms. » 28 % van alle toestellen zijn beter. Dit betekent dat de gemeten responstijd beter is dan het gemiddelde (19.8 ms) van alle geteste toestellen. | ||
| ↔ Responstijd 50% Grijs naar 80% Grijs | ||
| 16.4 ms ... stijging ↗ en daling ↘ gecombineerd | ↗ 8.4 ms stijging | 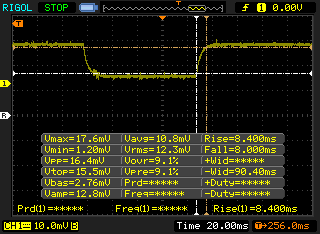 |
| ↘ 8 ms daling | ||
| Het scherm vertoonde prima responstijden in onze tests maar is misschien wat te traag voor competitieve games. Ter vergelijking: alle testtoestellen variëren van 0.165 (minimum) tot 636 (maximum) ms. » 31 % van alle toestellen zijn beter. Dit betekent dat de gemeten responstijd beter is dan het gemiddelde (30.9 ms) van alle geteste toestellen. | ||
Screen Flickering / PWM (Pulse-Width Modulation)
| Screen flickering / PWM waargenomen | 990 Hz | ≤ 99 % helderheid instelling | 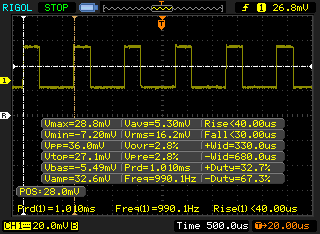 |
De achtergrondverlichting van het scherm flikkert op 990 Hz (in het slechtste geval, bijvoorbeeld bij gebruik van PWM) aan een helderheid van 99 % en lager. Boven deze helderheid zou er geen flickering / PWM mogen optreden. De frequentie van 990 Hz is redelijk hoog en de meeste mensen die gevoelig zijn aan flickering zouden dit dus niet mogen waarnemen of geïrriteerde ogen krijgen. Ter vergelijking: 52 % van alle geteste toestellen maakten geen gebruik van PWM om de schermhelderheid te verlagen. Als het wel werd gebruikt, werd een gemiddelde van 7741 (minimum: 5 - maximum: 343500) Hz waargenomen. | |||
| wPrime 2.10 - 1024m | |
| Asus ROG Zephyrus G15 GA502DU | |
| Alienware 17 R4 | |
| Gemiddeld Intel Core i7-9750H (n=1) | |
| Eurocom Sky X7C | |
| MSI GE75 9SG | |
* ... kleiner is beter
| PCMark 8 Home Score Accelerated v2 | 4402 punten | |
| PCMark 8 Work Score Accelerated v2 | 5721 punten | |
| PCMark 10 Score | 5982 punten | |
Help | ||
| Eurocom Nightsky RX17 2x Samsung SSD 970 Pro 512GB (RAID 0) | Razer Blade Pro 17 RTX 2080 Max-Q Samsung SSD PM981 MZVLB512HAJQ | MSI GS75 8SG Stealth 2x Samsung SSD PM981 MZVLB512HAJQ (RAID 0) | Eurocom Q8 Samsung SSD 960 Pro 512 GB m.2 | Lenovo Legion Y740-17ICH Samsung SSD PM981 MZVLB256HAHQ | |
|---|---|---|---|---|---|
| AS SSD | -12% | -2% | -11% | -26% | |
| Seq Read (MB/s) | 2297 | 1831 -20% | 3005 31% | 2481 8% | 1153 -50% |
| Seq Write (MB/s) | 2860 | 1744 -39% | 2668 -7% | 1869 -35% | 1328 -54% |
| 4K Read (MB/s) | 52.2 | 45.16 -13% | 40.89 -22% | 35.57 -32% | 35.05 -33% |
| 4K Write (MB/s) | 125.8 | 107.1 -15% | 94.4 -25% | 107.9 -14% | 96 -24% |
| 4K-64 Read (MB/s) | 1412 | 1240 -12% | 1366 -3% | 1232 -13% | 727 -49% |
| 4K-64 Write (MB/s) | 1228 | 1695 38% | 1197 -3% | 1285 5% | 1212 -1% |
| Access Time Read * (ms) | 0.04 | 0.064 -60% | 0.055 -38% | 0.043 -8% | 0.063 -58% |
| Access Time Write * (ms) | 0.09 | 0.037 59% | 0.039 57% | 0.035 61% | 0.04 56% |
| Score Read (Points) | 1694 | 1468 -13% | 1708 1% | 1515 -11% | 878 -48% |
| Score Write (Points) | 1640 | 1977 21% | 1558 -5% | 1579 -4% | 1441 -12% |
| Score Total (Points) | 4235 | 4197 -1% | 4123 -3% | 3840 -9% | 2784 -34% |
| Copy ISO MB/s (MB/s) | 2514 | 2086 -17% | 1596 -37% | 1487 -41% | |
| Copy Program MB/s (MB/s) | 592 | 425.5 -28% | 406.7 -31% | 608 3% | |
| Copy Game MB/s (MB/s) | 1494 | 555 -63% | 958 -36% | 1162 -22% |
* ... kleiner is beter

| 3DMark 11 Performance | 21509 punten | |
| 3DMark Cloud Gate Standard Score | 40478 punten | |
| 3DMark Fire Strike Score | 18195 punten | |
| 3DMark Time Spy Score | 7863 punten | |
Help | ||
| The Witcher 3 - 1920x1080 Ultra Graphics & Postprocessing (HBAO+) | |
| Asus ROG Strix RTX 2080 OC | |
| MSI GT76 Titan DT 9SG | |
| Razer Blade Pro 17 RTX 2080 Max-Q | |
| Gemiddeld NVIDIA GeForce RTX 2070 Mobile (64 - 82.1, n=21) | |
| Eurocom Nightsky RX17 | |
| MSI GT63 Titan 8RG-046 | |
| Dell G7 17 7790 | |
| MSI GL73 8SE-010US | |
| Asus ROG Zephyrus G15 GA502DU | |
| Eurocom Q8 | |
| Asus TUF FX705DT-AU068T | |
| Asus G752VY-GC110T | |
| Asus ZenBook 15 UX533FD | |
| lage | gem. | hoge | ultra | |
|---|---|---|---|---|
| BioShock Infinite (2013) | 355 | 305.3 | 272.2 | 172.9 |
| The Witcher 3 (2015) | 317.7 | 245.5 | 145.1 | 73.8 |
| Rise of the Tomb Raider (2016) | 218.2 | 201.7 | 148.5 | 122 |
| Eurocom Nightsky RX17 GeForce RTX 2070 Mobile, i7-9750H, 2x Samsung SSD 970 Pro 512GB (RAID 0) | Razer Blade Pro 17 RTX 2080 Max-Q GeForce RTX 2080 Max-Q, i7-9750H, Samsung SSD PM981 MZVLB512HAJQ | Asus Zephyrus S GX701GX GeForce RTX 2080 Max-Q, i7-8750H, Samsung SSD PM981 MZVLB1T0HALR | MSI GS75 8SG Stealth GeForce RTX 2080 Max-Q, i7-8750H, 2x Samsung SSD PM981 MZVLB512HAJQ (RAID 0) | Eurocom Q8 GeForce GTX 1070 Mobile, i9-8950HK, Samsung SSD 960 Pro 512 GB m.2 | Asus Strix Scar III G531GW GeForce RTX 2070 Mobile, i9-9880H, Intel SSD 660p 1TB SSDPEKNW010T8 | |
|---|---|---|---|---|---|---|
| Noise | 2% | -2% | -5% | -1% | -12% | |
| uit / omgeving * (dB) | 28 | 28.2 -1% | 29 -4% | 30 -7% | 28 -0% | 29 -4% |
| Idle Minimum * (dB) | 28 | 28.2 -1% | 29 -4% | 31 -11% | 28.2 -1% | 30 -7% |
| Idle Average * (dB) | 28.4 | 28.2 1% | 32 -13% | 32 -13% | 31.8 -12% | 37 -30% |
| Idle Maximum * (dB) | 32.9 | 30.8 6% | 33 -0% | 41 -25% | 36.3 -10% | 39 -19% |
| Load Average * (dB) | 45 | 42 7% | 47 -4% | 47 -4% | 46.7 -4% | 54 -20% |
| Witcher 3 ultra * (dB) | 53.2 | 51 4% | 49 8% | 47 12% | 46.9 12% | 54 -2% |
| Load Maximum * (dB) | 53.2 | 53 -0% | 51 4% | 48 10% | 49.7 7% | 54 -2% |
* ... kleiner is beter
Geluidsniveau
| Onbelast |
| 28 / 28.4 / 32.9 dB (A) |
| Belasting |
| 45 / 53.2 dB (A) |
 | ||
30 dB stil 40 dB(A) hoorbaar 50 dB(A) luid |
||
min: | ||
(-) De maximumtemperatuur aan de bovenzijde bedraagt 48.6 °C / 119 F, vergeleken met het gemiddelde van 40.4 °C / 105 F, variërend van 21.2 tot 68.8 °C voor de klasse Gaming.
(-) De bodem warmt op tot een maximum van 46.8 °C / 116 F, vergeleken met een gemiddelde van 43.2 °C / 110 F
(+) Bij onbelast gebruik bedraagt de gemiddelde temperatuur voor de bovenzijde 31.4 °C / 89 F, vergeleken met het apparaatgemiddelde van 33.9 °C / 93 F.
(±) Bij het spelen van The Witcher 3 is de gemiddelde temperatuur voor de bovenzijde 37.1 °C / 99 F, vergeleken met het apparaatgemiddelde van 33.9 °C / 93 F.
(+) De palmsteunen en het touchpad zijn met een maximum van ###max## °C / 88.2 F koeler dan de huidtemperatuur en voelen daarom koel aan.
(-) De gemiddelde temperatuur van de handpalmsteun van soortgelijke toestellen bedroeg 28.8 °C / 83.8 F (-2.4 °C / -4.4 F).
Eurocom Nightsky RX17 audioanalyse
(+) | luidsprekers kunnen relatief luid spelen (88.6 dB)
Bas 100 - 315 Hz
(±) | verminderde zeebaars - gemiddeld 8.5% lager dan de mediaan
(+) | de lage tonen zijn lineair (5.3% delta naar de vorige frequentie)
Midden 400 - 2000 Hz
(±) | hogere middens - gemiddeld 5.4% hoger dan de mediaan
(+) | de middentonen zijn lineair (4.8% delta ten opzichte van de vorige frequentie)
Hoog 2 - 16 kHz
(+) | evenwichtige hoogtepunten - slechts 1.1% verwijderd van de mediaan
(+) | de hoge tonen zijn lineair (4.1% delta naar de vorige frequentie)
Algemeen 100 - 16.000 Hz
(+) | het totale geluid is lineair (12% verschil met de mediaan)
Vergeleken met dezelfde klasse
» 12% van alle geteste apparaten in deze klasse waren beter, 4% vergelijkbaar, 84% slechter
» De beste had een delta van 6%, het gemiddelde was 18%, de slechtste was 132%
Vergeleken met alle geteste toestellen
» 9% van alle geteste apparaten waren beter, 2% gelijk, 88% slechter
» De beste had een delta van 4%, het gemiddelde was 23%, de slechtste was 134%
Apple MacBook 12 (Early 2016) 1.1 GHz audioanalyse
(+) | luidsprekers kunnen relatief luid spelen (83.6 dB)
Bas 100 - 315 Hz
(±) | verminderde zeebaars - gemiddeld 11.3% lager dan de mediaan
(±) | lineariteit van de lage tonen is gemiddeld (14.2% delta ten opzichte van de vorige frequentie)
Midden 400 - 2000 Hz
(+) | evenwichtige middens - slechts 2.4% verwijderd van de mediaan
(+) | de middentonen zijn lineair (5.5% delta ten opzichte van de vorige frequentie)
Hoog 2 - 16 kHz
(+) | evenwichtige hoogtepunten - slechts 2% verwijderd van de mediaan
(+) | de hoge tonen zijn lineair (4.5% delta naar de vorige frequentie)
Algemeen 100 - 16.000 Hz
(+) | het totale geluid is lineair (10.2% verschil met de mediaan)
Vergeleken met dezelfde klasse
» 7% van alle geteste apparaten in deze klasse waren beter, 2% vergelijkbaar, 90% slechter
» De beste had een delta van 5%, het gemiddelde was 18%, de slechtste was 53%
Vergeleken met alle geteste toestellen
» 5% van alle geteste apparaten waren beter, 1% gelijk, 94% slechter
» De beste had een delta van 4%, het gemiddelde was 23%, de slechtste was 134%
| Uit / Standby | |
| Inactief | |
| Belasting |
|
Key:
min: | |
| Eurocom Nightsky RX17 i7-9750H, GeForce RTX 2070 Mobile, 2x Samsung SSD 970 Pro 512GB (RAID 0), IPS, 1920x1080, 17.3" | Razer Blade Pro 17 RTX 2080 Max-Q i7-9750H, GeForce RTX 2080 Max-Q, Samsung SSD PM981 MZVLB512HAJQ, IPS, 1920x1080, 17.3" | Eurocom Q8 i9-8950HK, GeForce GTX 1070 Mobile, Samsung SSD 960 Pro 512 GB m.2, TN LED, 2560x1440, 17.3" | Dell G7 17 7790 i7-8750H, GeForce RTX 2070 Max-Q, Toshiba BG3 KBG30ZMS256G, IPS, 1920x1080, 17.3" | MSI GL73 8SE-010US i7-8750H, GeForce RTX 2060 Mobile, Kingston RBUSNS8154P3128GJ, TN LED, 1920x1080, 17.3" | Alienware 17 R4 i7-7820HK, GeForce GTX 1080 Mobile, SK Hynix PC300 NVMe 512 GB, TN LED, 2560x1440, 17.3" | |
|---|---|---|---|---|---|---|
| Power Consumption | 3% | -12% | 18% | 25% | -46% | |
| Idle Minimum * (Watt) | 18.6 | 16.2 13% | 26.3 -41% | 9.5 49% | 8.8 53% | 37.5 -102% |
| Idle Average * (Watt) | 22.6 | 20.4 10% | 29 -28% | 16.2 28% | 16.2 28% | 37.6 -66% |
| Idle Maximum * (Watt) | 23 | 26.1 -13% | 32.3 -40% | 23.8 -3% | 18.3 20% | 37.6 -63% |
| Load Average * (Watt) | 93.4 | 96.5 -3% | 82.4 12% | 101.7 -9% | 86.1 8% | 122.4 -31% |
| Witcher 3 ultra * (Watt) | 186.4 | 182.9 2% | 192 -3% | 155 17% | 146.7 21% | 180.3 3% |
| Load Maximum * (Watt) | 233.6 | 214.3 8% | 170.2 27% | 172.2 26% | 186.4 20% | 277.4 -19% |
* ... kleiner is beter
| Eurocom Nightsky RX17 i7-9750H, GeForce RTX 2070 Mobile, 62 Wh | Razer Blade Pro 17 RTX 2080 Max-Q i7-9750H, GeForce RTX 2080 Max-Q, 70 Wh | Asus Zephyrus S GX701GX i7-8750H, GeForce RTX 2080 Max-Q, 76 Wh | MSI GS75 8SG Stealth i7-8750H, GeForce RTX 2080 Max-Q, 80.25 Wh | Eurocom Q8 i9-8950HK, GeForce GTX 1070 Mobile, 66 Wh | Lenovo Legion Y740-17ICH i7-8750H, GeForce RTX 2080 Max-Q, 76 Wh | |
|---|---|---|---|---|---|---|
| Batterijduur | 56% | 28% | 74% | 30% | 60% | |
| Reader / Idle (h) | 4.2 | 4.9 17% | 5 19% | 7.7 83% | ||
| WiFi v1.3 (h) | 2 | 4.7 135% | 3.8 90% | 5.3 165% | 2.6 30% | 3.2 60% |
| Load (h) | 1.2 | 1.4 17% | 0.9 -25% | 0.9 -25% |
Pro
Contra
Voor het volledige, Engelse testrapport, klik hier.
We benoemen eenvoudig onderhoud altijd als de belangrijkste reden voor het bezit van een op Clevo gebaseerde laptop ten opzichte van populairdere opties geleverd door Asus, Alienware, Acer of MSI. Dit is helaas niet het geval voor de Eurocom Nightsky RX17. Het feit dat er twee tot drie keer meer schroeven moeten worden verwijderd en dat het toetsenbord eerst moet worden losgekoppeld om iets eenvoudigs te upgraden als RAM of opslag is een stap in de tegenovergestelde richting. Clevo-ontwerpen zijn altijd succesvol geweest om de gebruiker meer toegang te geven tot de kerncomponenten van een laptop dan de concurrenten, maar dit geldt niet voor de Nightsky RX17. Als het sneller en gemakkelijker wordt om een RAM-geheugen aan een Razer Blade Pro 17 toe te voegen dan aan een grotere Clevo-barebone, dan weet je dat het ergens mis is gegaan.
Naast van de teleurstellende onderhoudsmogelijkheden, doet de Nightsky RX17 niet genoeg om zichzelf te onderscheiden van de zee van 17-inch gaming-alternatieven. Ja, de prestaties zijn uitstekend, maar ventilatorruis, batterijlevensduur, de clickpad en stijfheid van de behuizing kunnen allemaal worden verbeterd. De Asus ROG Strix Hero III G731GW is online te vinden met dezelfde Core i7-9750H CPU, RTX 2070 GPU en 144 Hz display als onze Eurocom-configuratie voor ongeveer $200 tot $300 minder. Als je erop staat het beste te kopen dat Clevo te bieden heeft, dan is de Eurocom Sky X4C of X7C een betere koop dan de Nightsky RX17.
De Nightsky RX17 presteert iets sneller dan een concurrerende laptop met dezelfde Core i7-9750H en GeForce RTX 2070 GPU. Helaas is het apparaat waarschijnlijk ook aanzienlijk moeilijker om te onderhouden of te upgraden.
Eurocom Nightsky RX17
- 01-07-2019 v6 (old)
Allen Ngo
Price comparison
