Eurocom Nightsky TXi317 laptop review: 125 W GeForce RTX 3080 Ti speedster
")
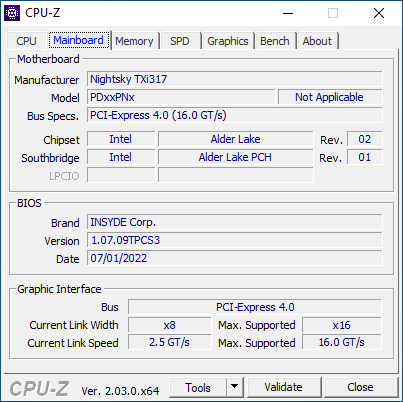
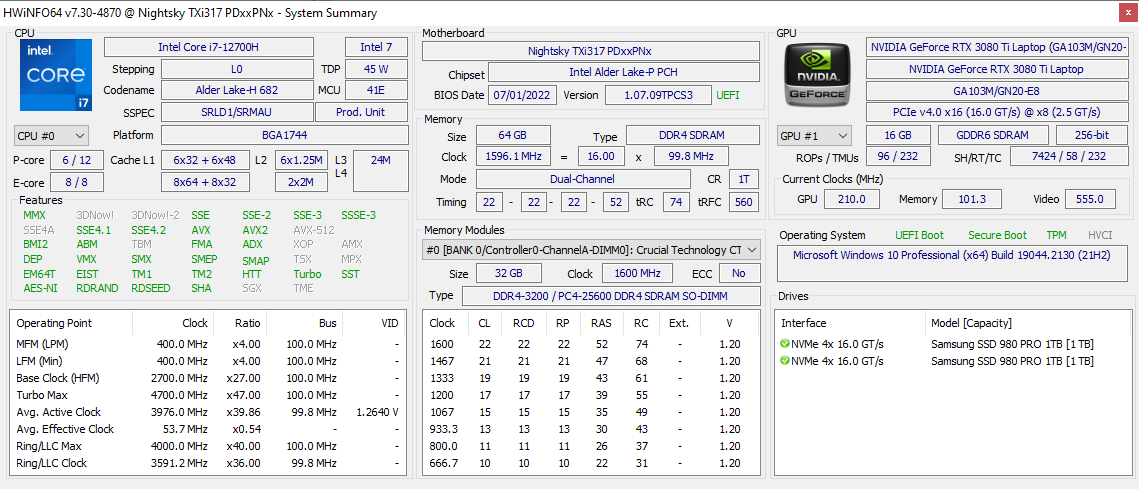
De Nightsky TXi317 is de nieuwste 17,3-inch gaming laptop van Eurocom met Intel's 12e generatie Alder Lake-H CPU's en een 155 W TGP GeForce RTX 3080 Ti GPU om een van de snelste gaming laptops van dit moment te zijn. Het deelt hetzelfde Tongfang chassisontwerp als de Schenker XMG Pro 17 E22 en dus raden we aan onze bestaande review hier voor meer details over het chassis en zijn fysieke kenmerken.
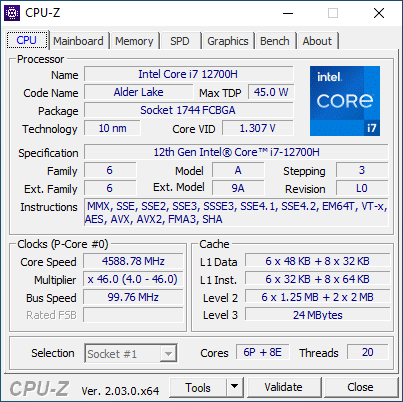
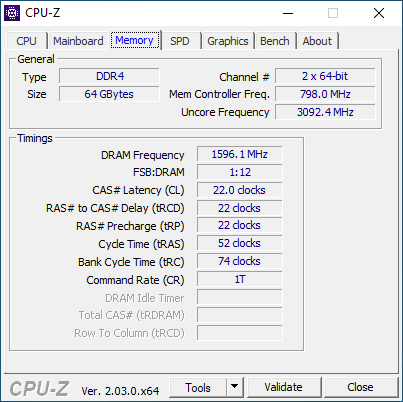
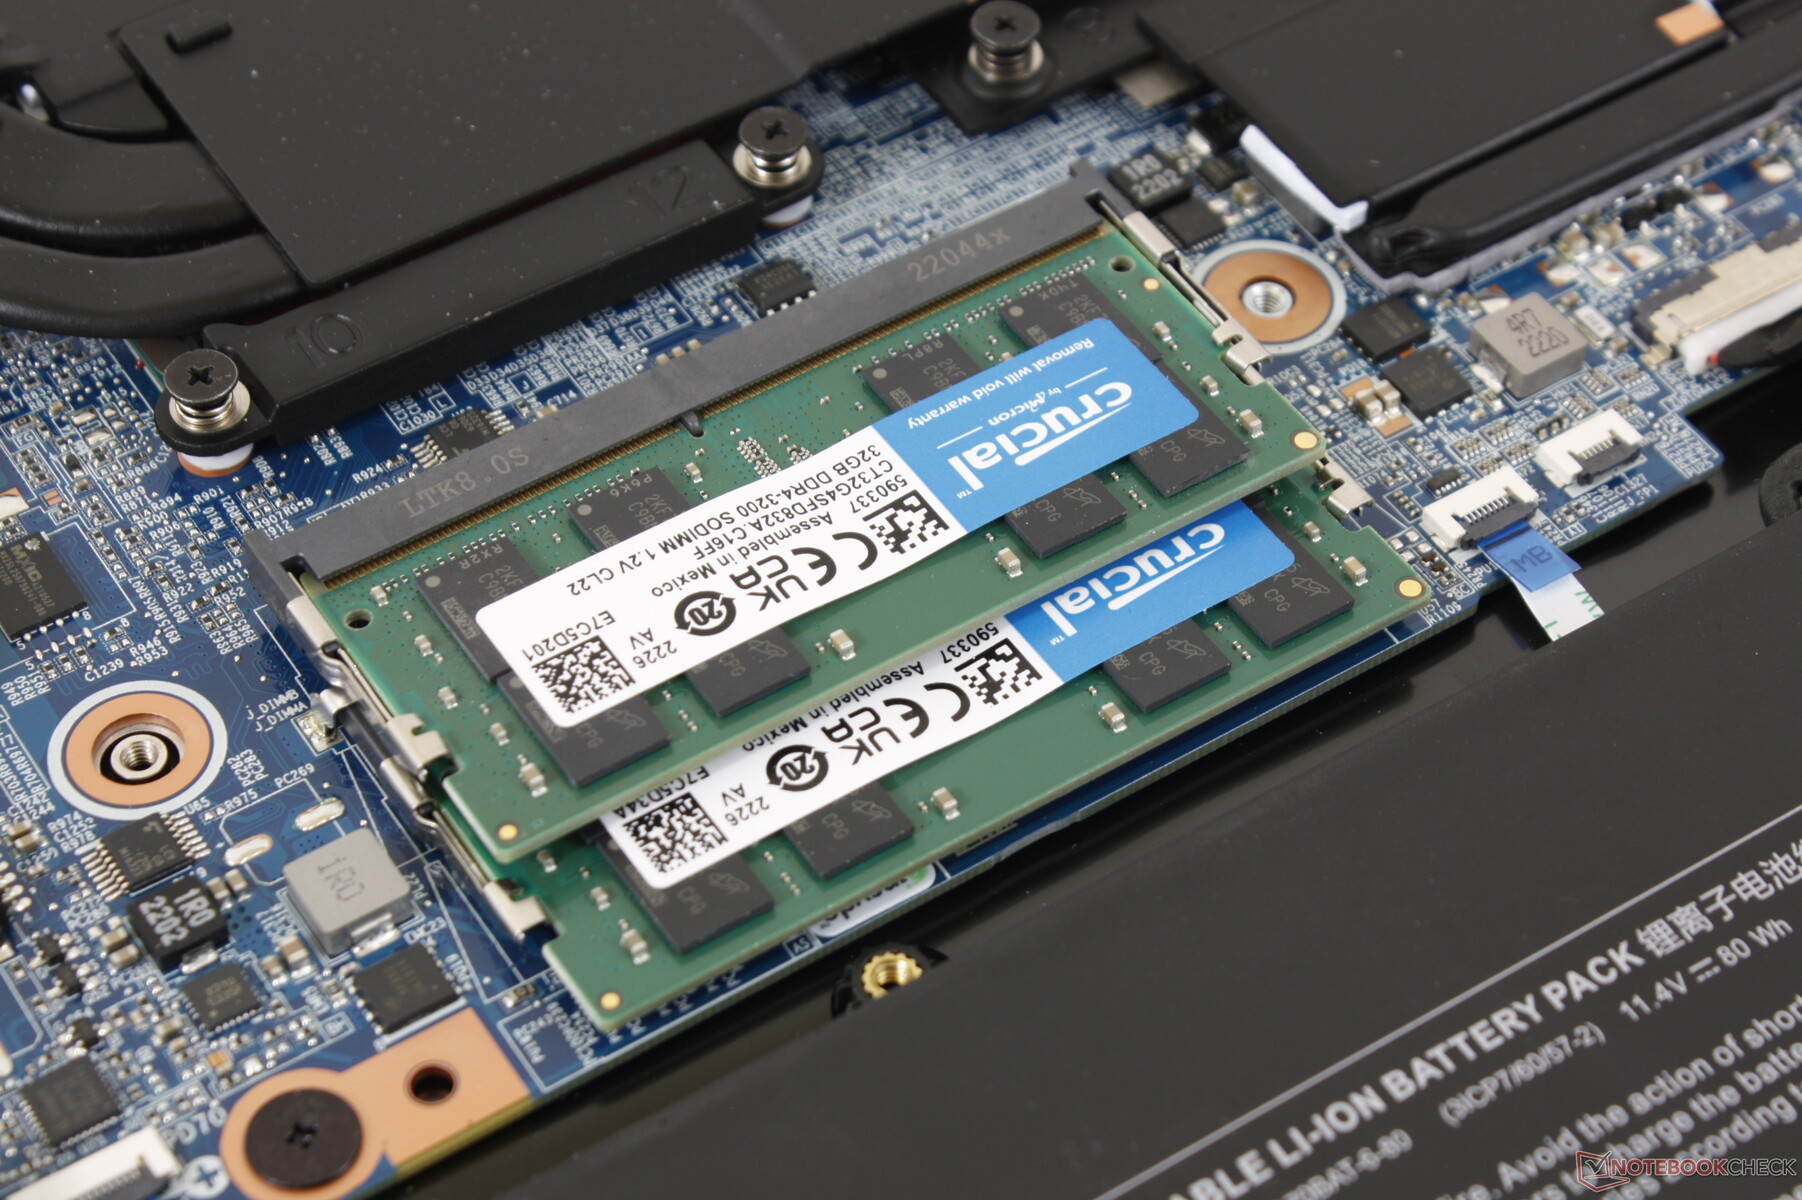
Onze review configuratie is uitgerust met de Core i7-12700H CPU, 144 Hz 1080p IPS-scherm, GeForce RTX 3080 Ti GPU, en 64 GB RAM voor ongeveer $ 4100 USD. De laagste GPU-optie is de GeForce RTX 3070 Ti, die de Nightsky TXi317 precies in de markt voor gaming-laptops voor liefhebbers plaatst.
Directe concurrenten zijn andere krachtige 17-inch gaming laptops zoals de Aorus 17X,MSI Raider GE77ofAlienware x17 R2.
Meer Eurocom beoordelingen:
Potentiële concurrenten in vergelijking
Evaluatie | Datum | Model | Gewicht | Hoogte | Formaat | Resolutie | Beste prijs |
|---|---|---|---|---|---|---|---|
| 85.3 % v7 (old) | 10-2022 | Eurocom Nightsky TXi317 i7-12700H, GeForce RTX 3080 Ti Laptop GPU | 2.9 kg | 27 mm | 17.30" | 1920x1080 | |
| 85.4 % v7 (old) | 07-2022 | Schenker XMG Pro 17 E22 i9-12900H, GeForce RTX 3080 Ti Laptop GPU | 2.8 kg | 27 mm | 17.30" | 2560x1440 | |
| 83.7 % v7 (old) | 08-2022 | Aorus 17X XES i9-12900HX, GeForce RTX 3070 Ti Laptop GPU | 2.7 kg | 30 mm | 17.30" | 1920x1080 | |
| 86.8 % v7 (old) | 07-2022 | MSI Raider GE77 HX 12UHS i9-12900HX, GeForce RTX 3080 Ti Laptop GPU | 3.1 kg | 25.9 mm | 17.30" | 3840x2160 | |
| 89.9 % v7 (old) | 07-2022 | Razer Blade 17 Early 2022 i9-12900H, GeForce RTX 3080 Ti Laptop GPU | 2.8 kg | 19.9 mm | 17.30" | 3840x2160 | |
| 89.2 % v7 (old) | 05-2022 | Alienware x17 R2 P48E i9-12900HK, GeForce RTX 3080 Ti Laptop GPU | 3.1 kg | 20.9 mm | 17.30" | 1920x1080 |
Zaak
Er is één oppervlakkig verschil tussen de Nightsky TXi317 en de XMG Pro 17 E22: de achterhoeken van het Eurocom-ontwerp zijn voorzien van glanzende bronskleurige randen, terwijl dat bij het Schenker-ontwerp niet het geval is. Verder zijn de chassisontwerpen identiek.
SD-kaartlezer
| SD Card Reader | |
| average JPG Copy Test (av. of 3 runs) | |
| Alienware x17 R2 P48E (AV Pro V60) | |
| Razer Blade 17 Early 2022 (AV PRO microSD 128 GB V60) | |
| Schenker XMG Pro 17 E22 (AV PRO microSD 128 GB V60) | |
| MSI Raider GE77 HX 12UHS (AV PRO microSD 128 GB V60) | |
| Eurocom Nightsky TXi317 (AV Pro V60) | |
| maximum AS SSD Seq Read Test (1GB) | |
| Alienware x17 R2 P48E (AV Pro V60) | |
| Eurocom Nightsky TXi317 (AV Pro V60) | |
| Schenker XMG Pro 17 E22 (AV PRO microSD 128 GB V60) | |
Communicatie
Wi-Fi 6 wordt standaard geleverd zonder Wi-Fi 6E-opties van de fabrikant, ondanks de hoge prijsklasse van het model. De overdrachtssnelheden zijn niettemin stabiel en zonder verbindingsproblemen.
| Networking | |
| iperf3 transmit AX12 | |
| Alienware x17 R2 P48E | |
| iperf3 receive AX12 | |
| Alienware x17 R2 P48E | |
| iperf3 receive AXE11000 6GHz | |
| Aorus 17X XES | |
| MSI Raider GE77 HX 12UHS | |
| iperf3 receive AXE11000 | |
| Schenker XMG Pro 17 E22 | |
| Razer Blade 17 Early 2022 | |
| Eurocom Nightsky TXi317 | |
| iperf3 transmit AXE11000 6GHz | |
| Aorus 17X XES | |
| iperf3 transmit AXE11000 | |
| Eurocom Nightsky TXi317 | |
Webcam
De camera is slechts 1 MP met geen 2 MP opties, wat opnieuw teleurstellend is gezien de hoge prijsklasse van het model.


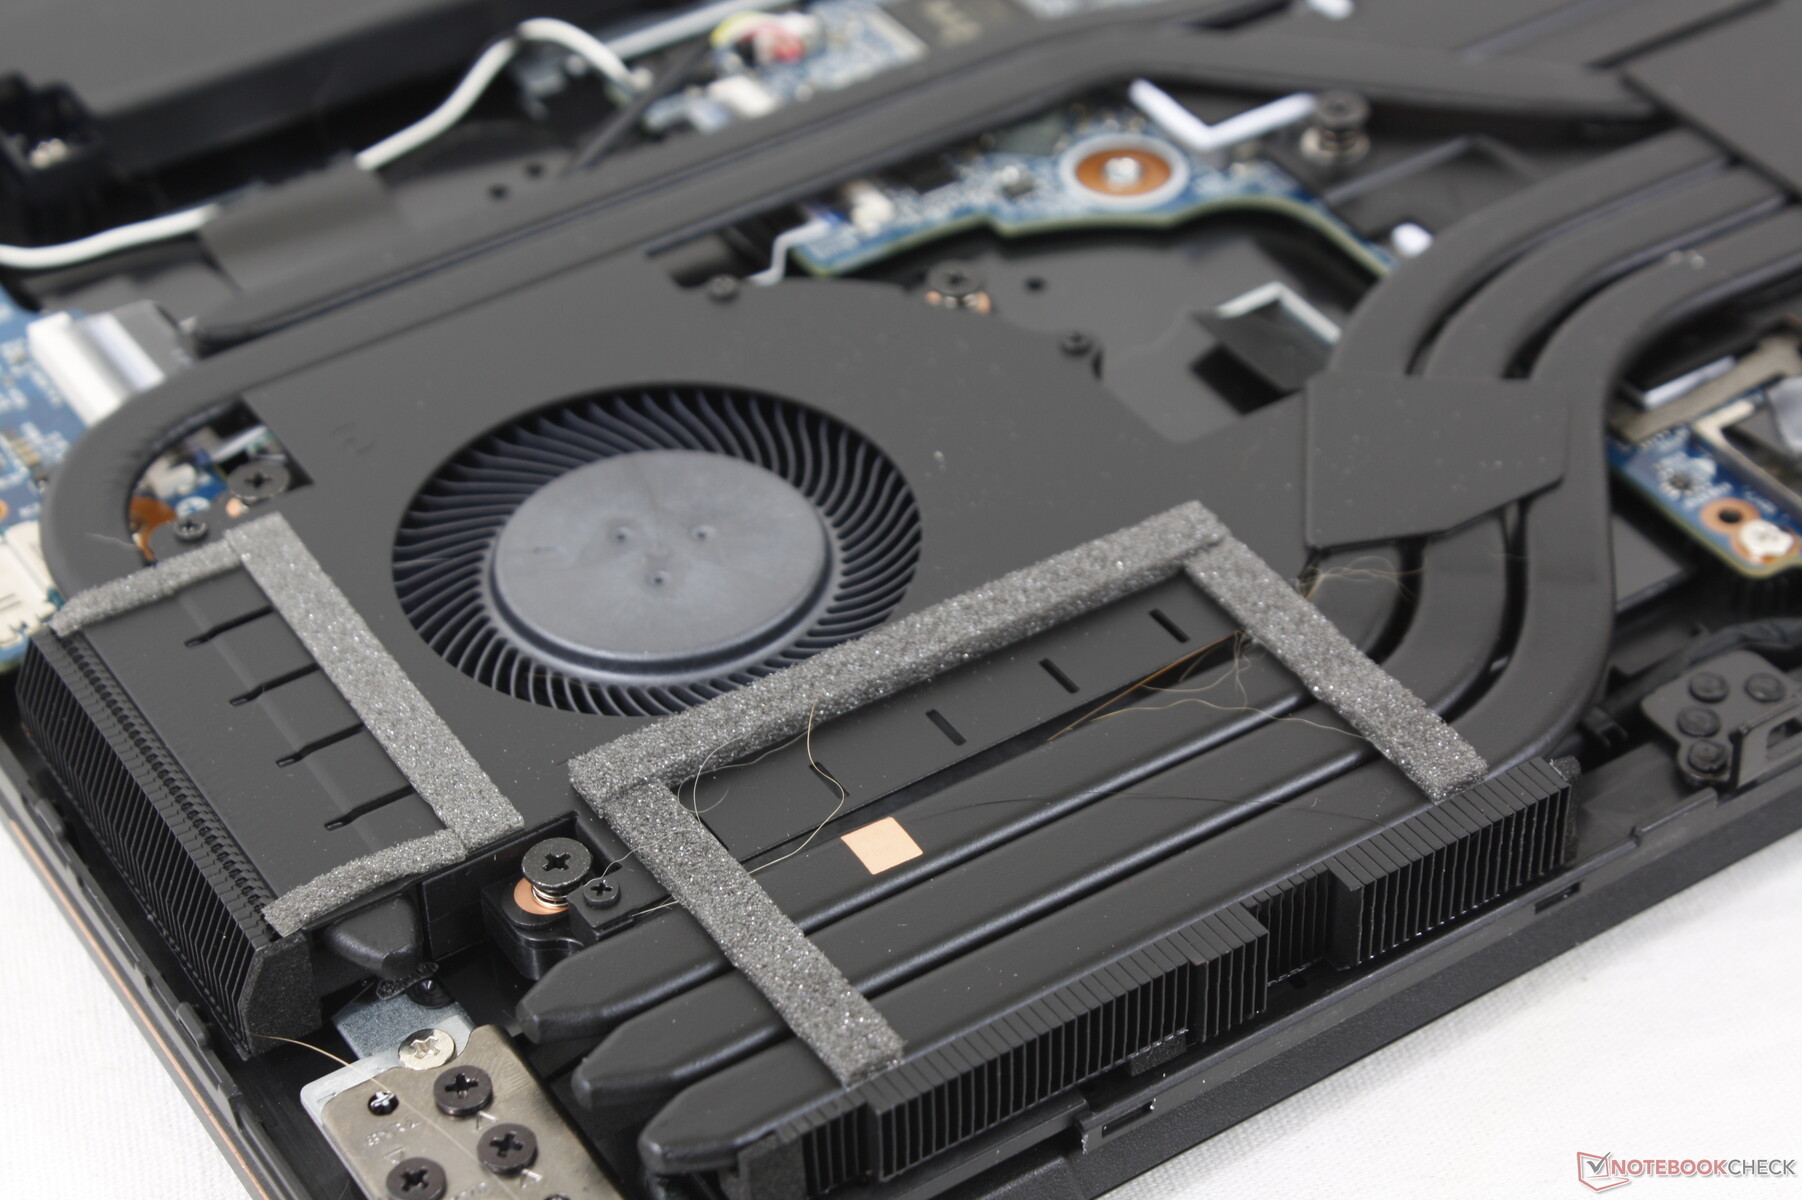
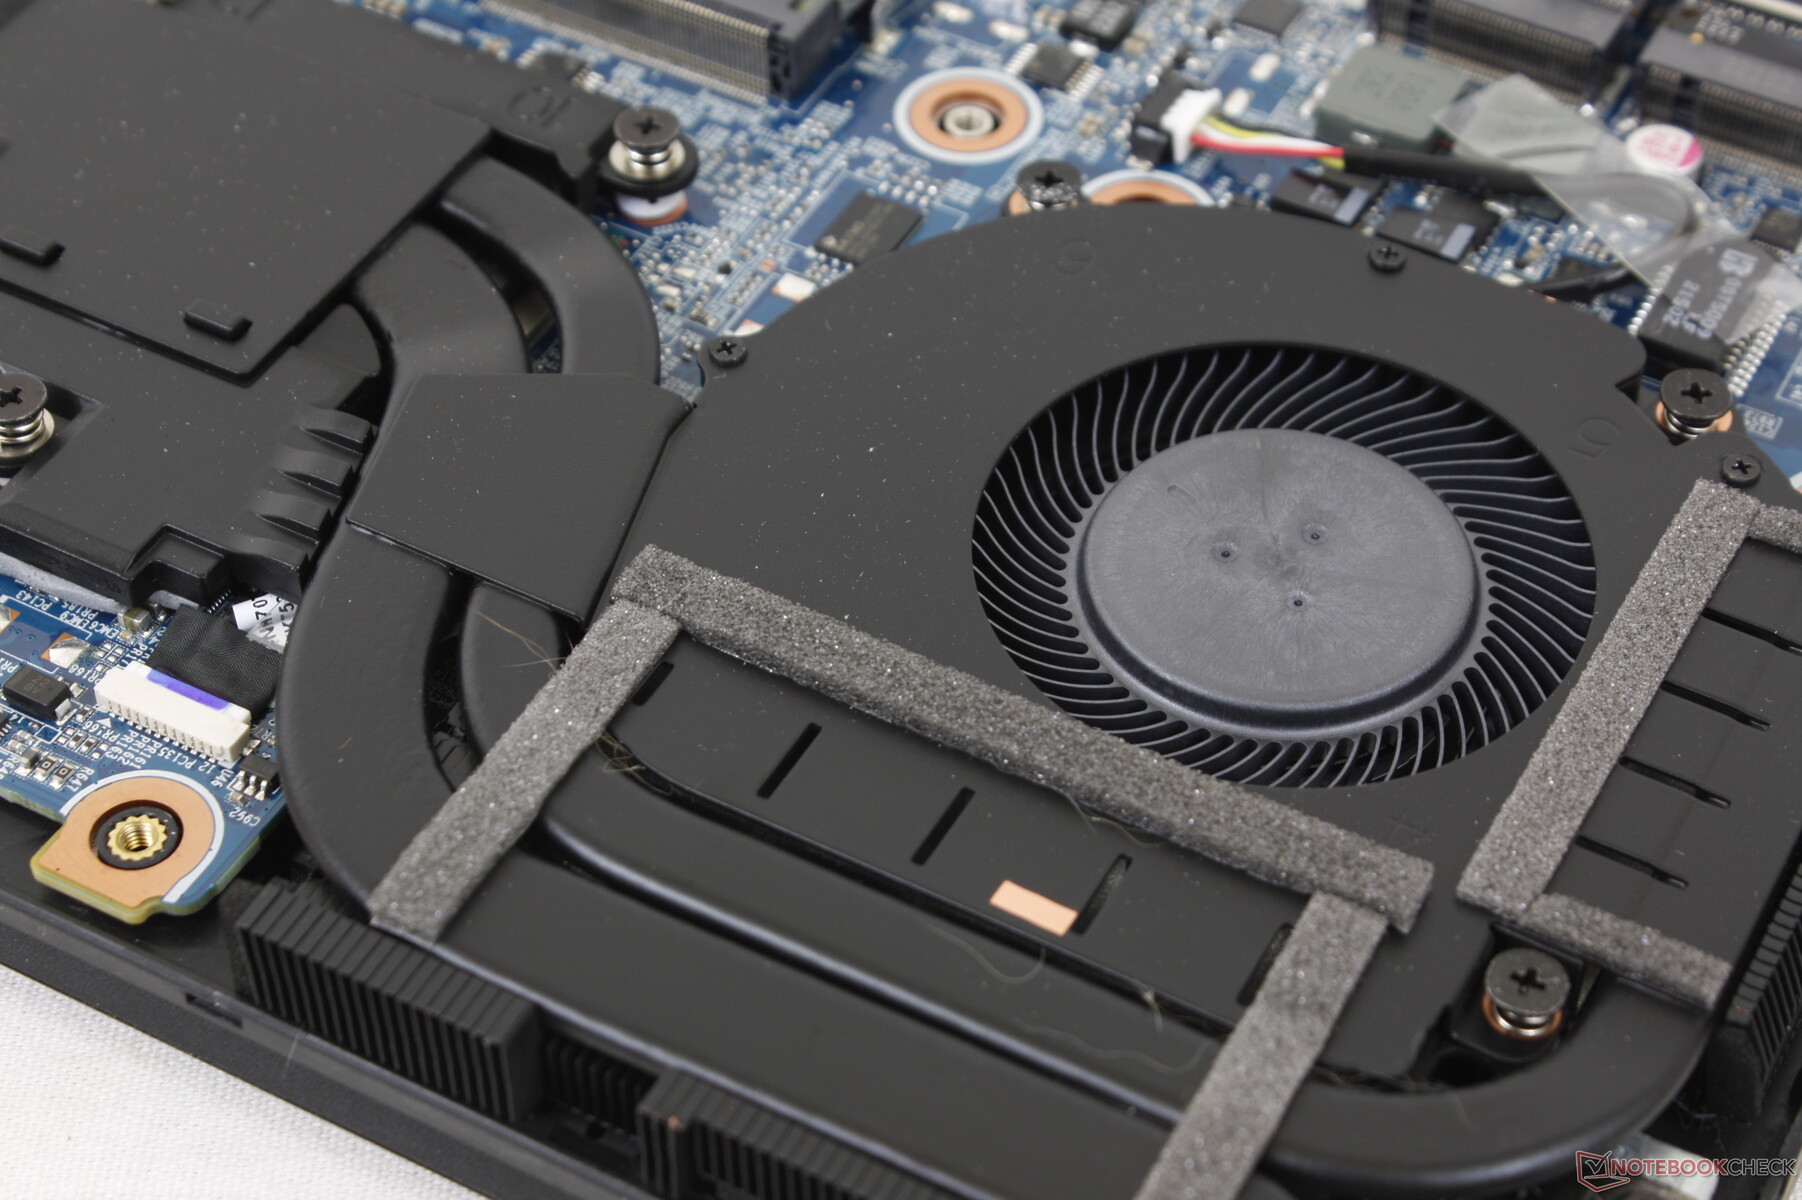
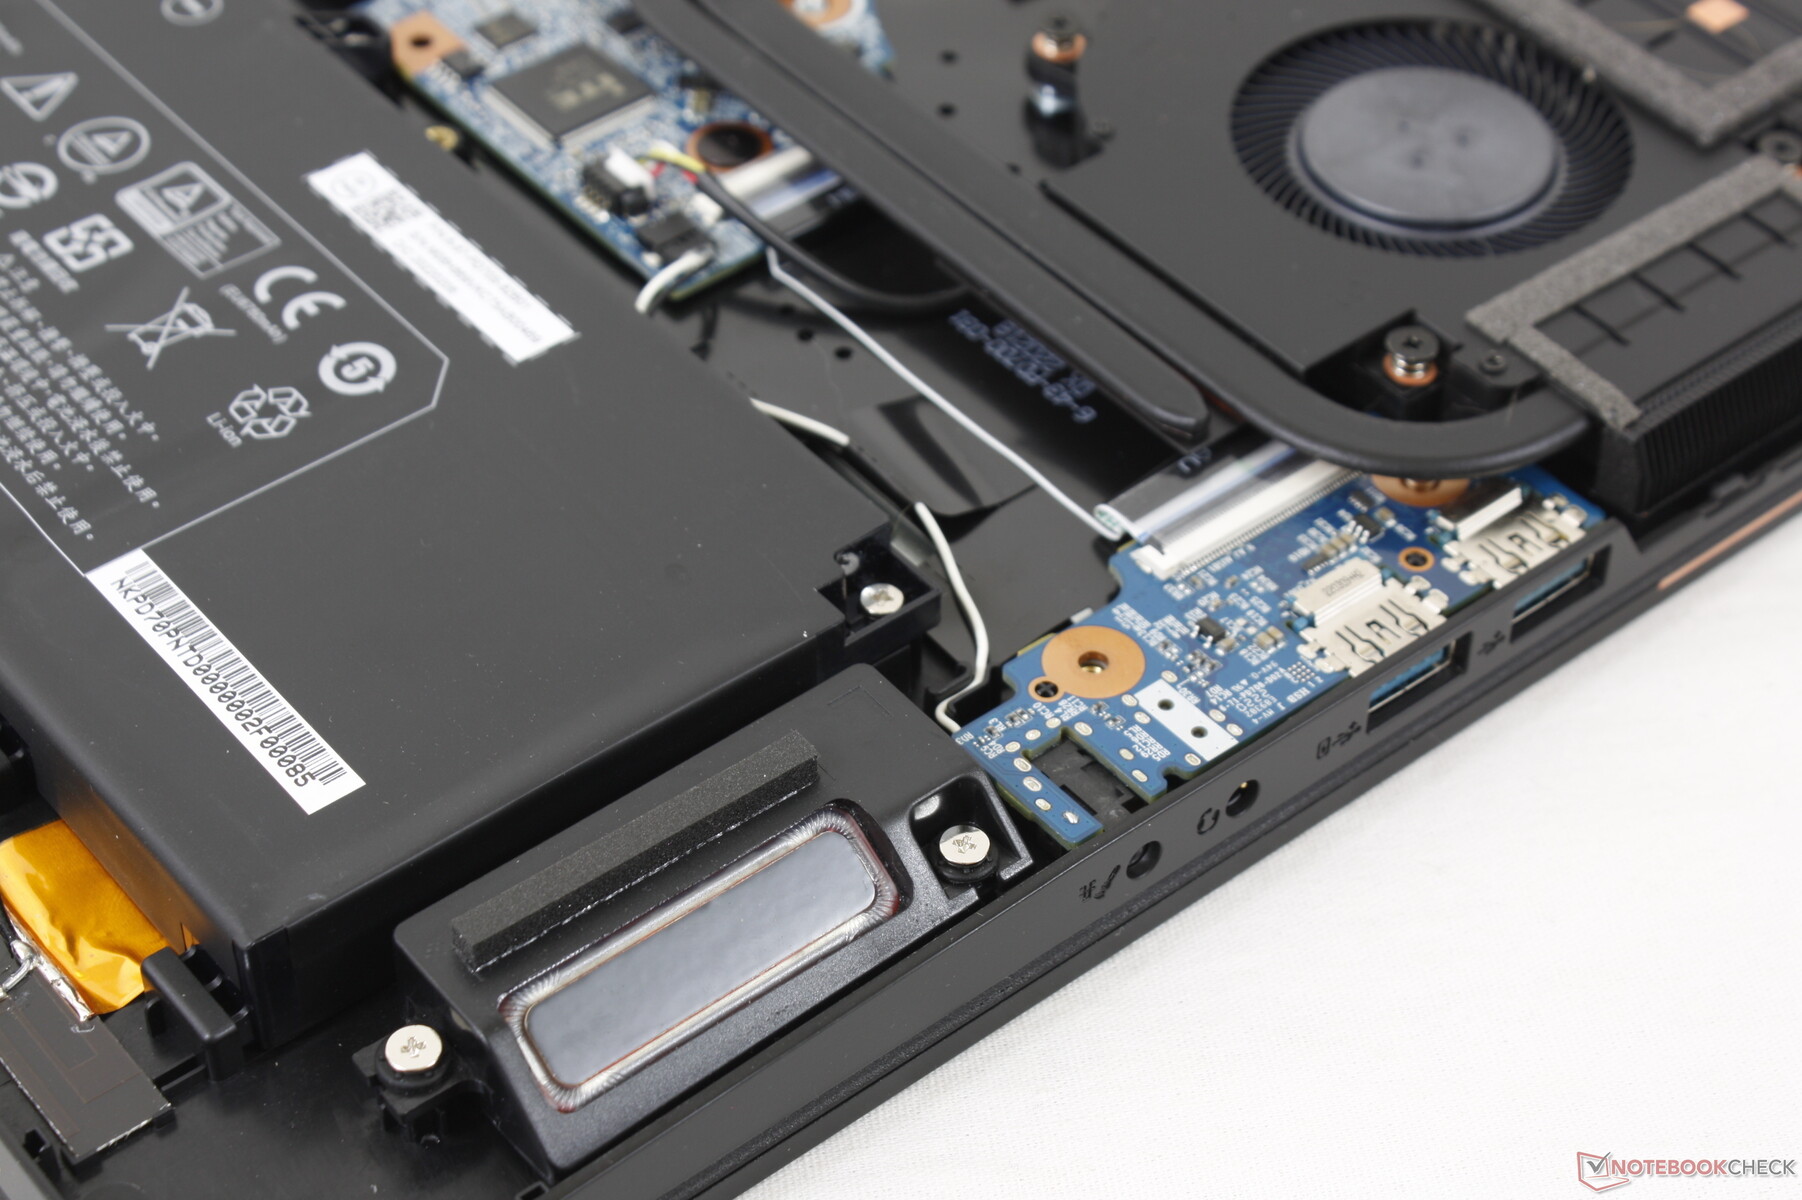
Onderhoud
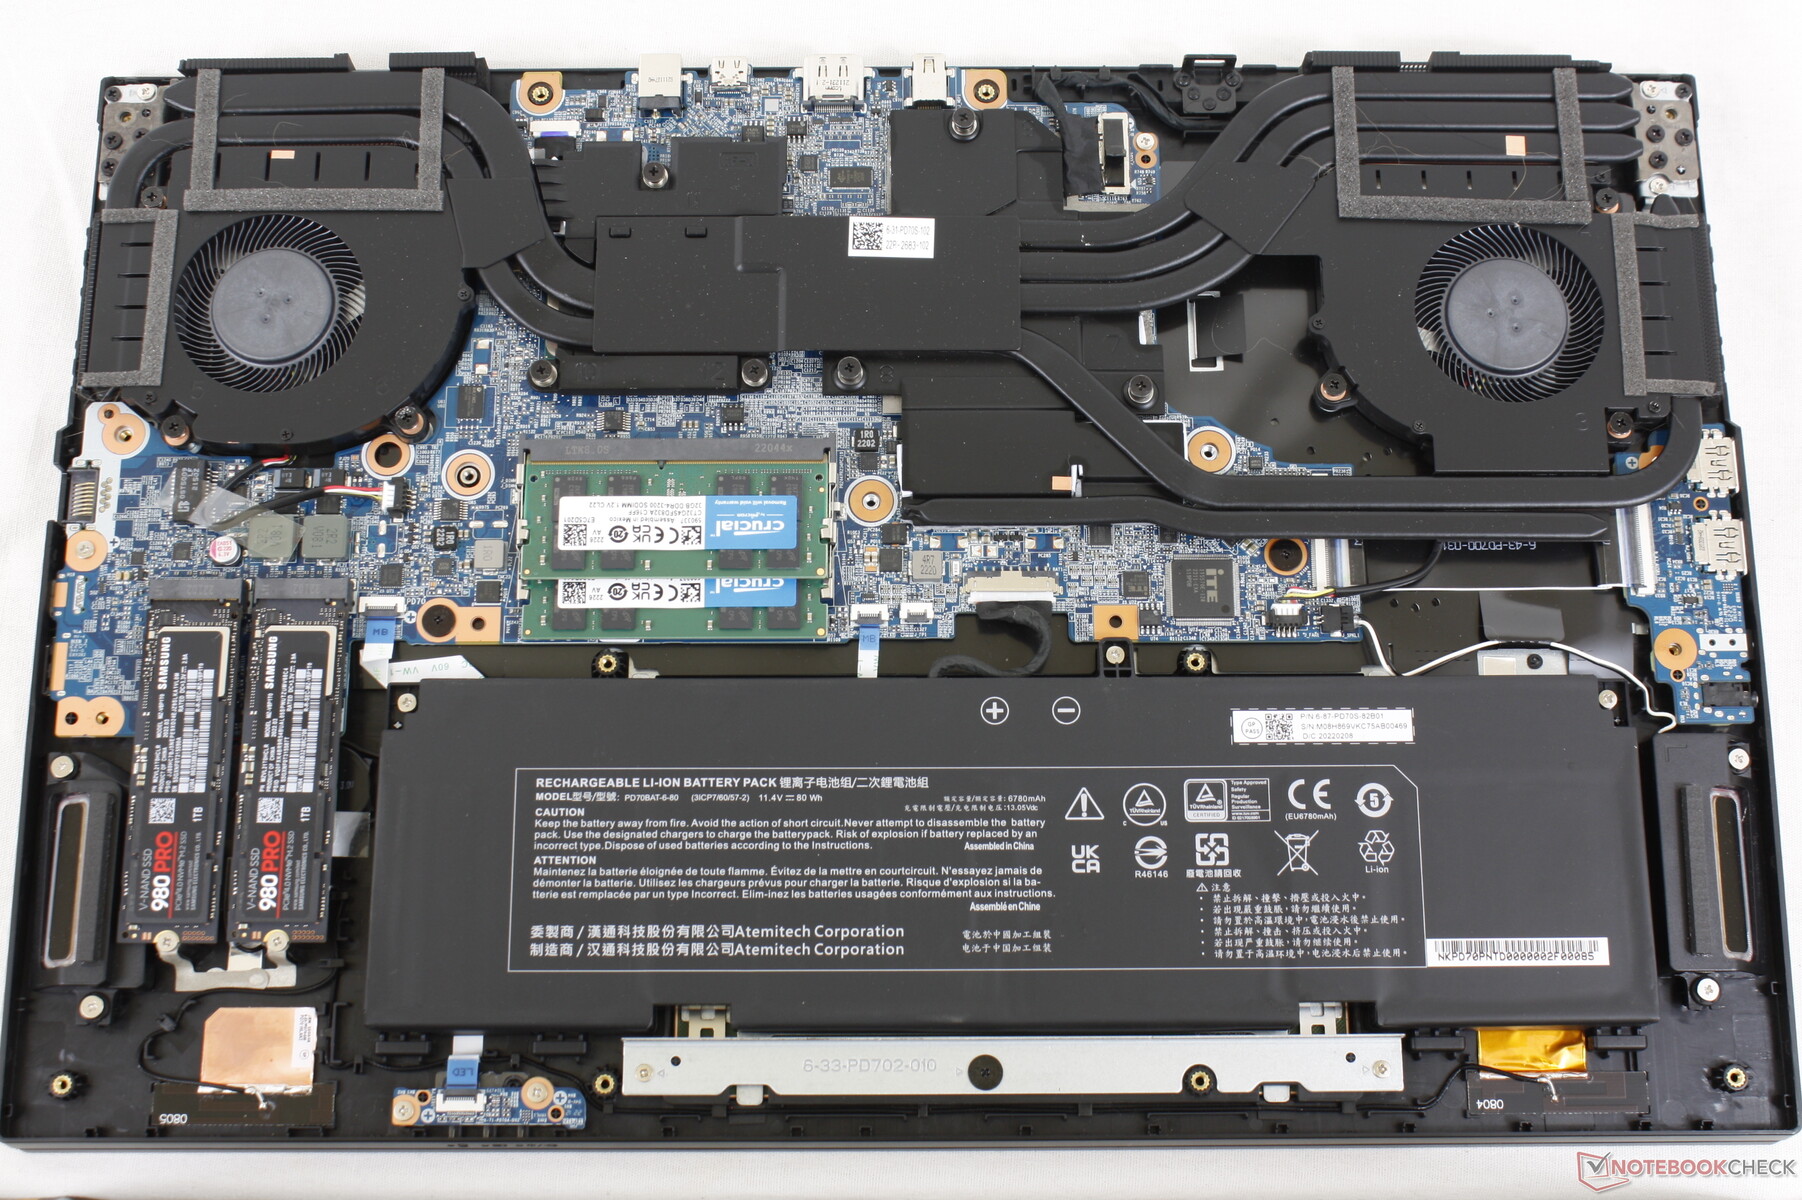
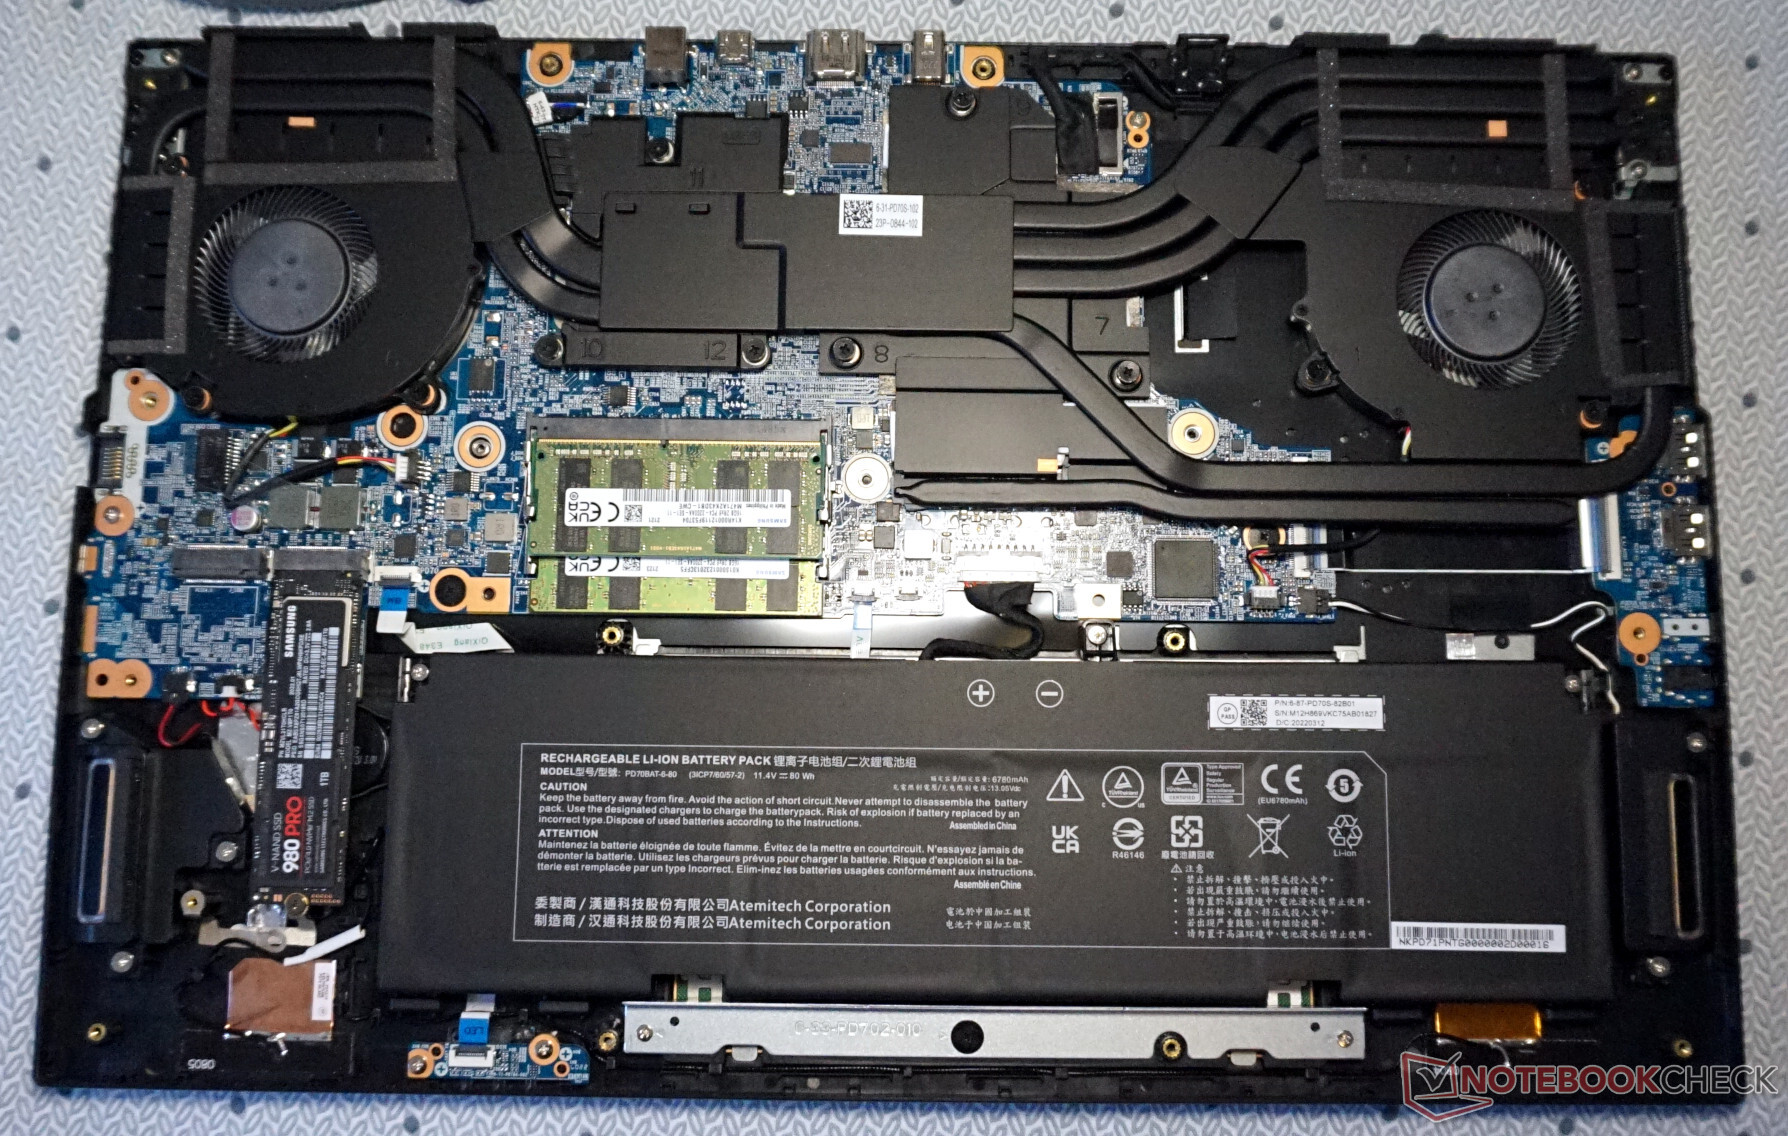
Het onderpaneel is vastgezet met 16 Philips-schroeven voor eenvoudige service. De meeste andere gaming laptops hebben echter veel minder schroeven, en dus vergt het wat meer geduld om de Eurocom te openen.
Accessoires en garantie
De doos bevat geen extra's behalve de wisselstroomadapter en papierwerk. Bij aankoop in de VS geldt de standaard beperkte fabrieksgarantie van een jaar.
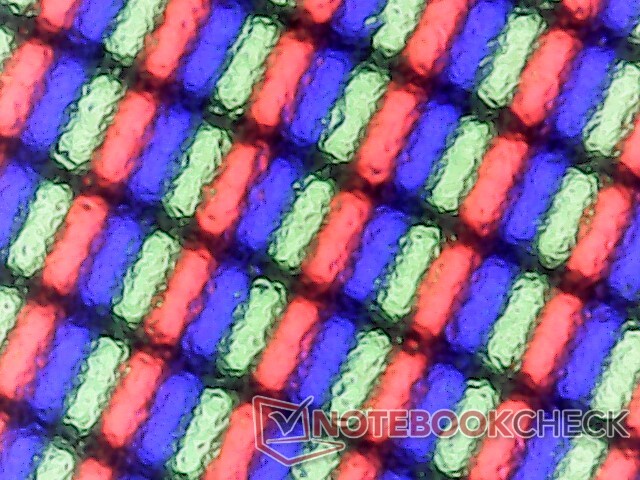
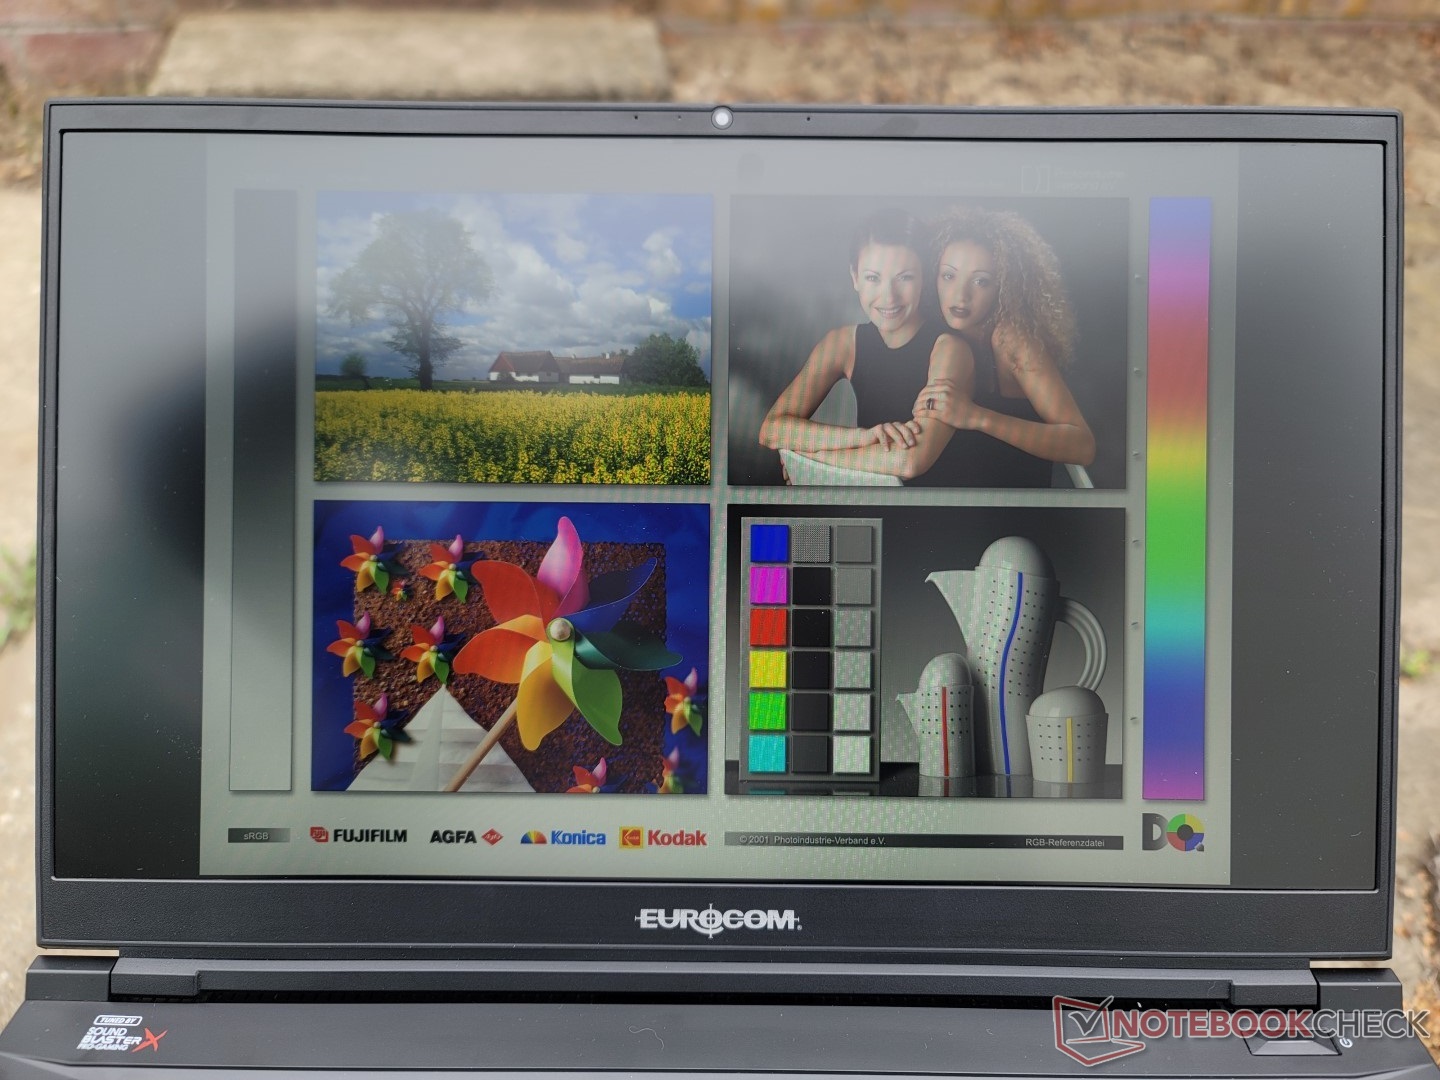
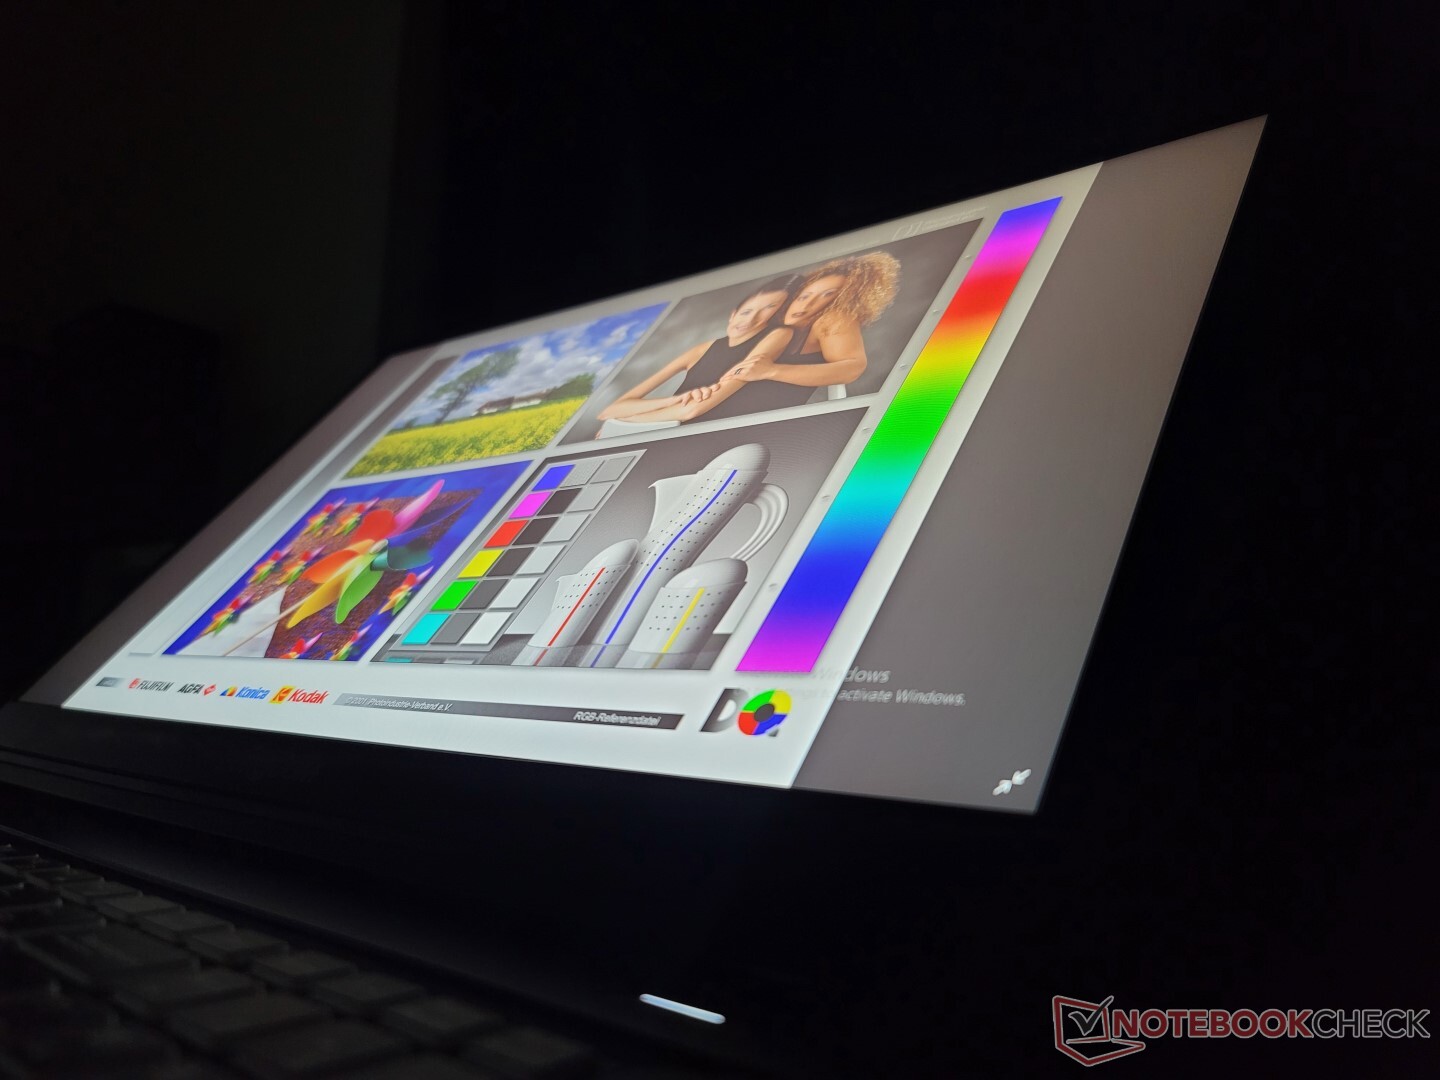
Display
Ons testtoestel maakt gebruik van hetzelfde LG Philips LP173WFG-SPB3 IPS-paneel als de Schenker XMG Focus 17. In vergelijking met het 1440p BOE-paneel van de XMG Pro 17 E22 biedt ons 1080p LG Philips-paneel smallere kleuren, een lagere vernieuwingsfrequentie en langzamere zwart-witreactietijden, waardoor het meer een middenklasse-scherm is dan een high-endscherm. Het is echter nog steeds erg goed, maar 1440p is zeker een betere pasvorm dan 1080p voor een laptop die draait op een GeForce RTX 3080 Ti GPU.
Gelukkig komt de TXi317 met drie panelen om uit te kiezen, variërend van 1080p tot 4K. Houd in gedachten dat geen van hen OLED is en ook geen volledige AdobeRGB dekking kan bieden.
- 1080p, 144 Hz, 100% sRGB, IPS
- 1440p, 165 Hz, 100% sRGB, IPS
- 2160p, 60 Hz, 100% sRGB, IPS

| |||||||||||||||||||||||||
Helderheidsverdeling: 88 %
Helderheid in Batterij-modus: 303.9 cd/m²
Contrast: 1013:1 (Zwart: 0.3 cd/m²)
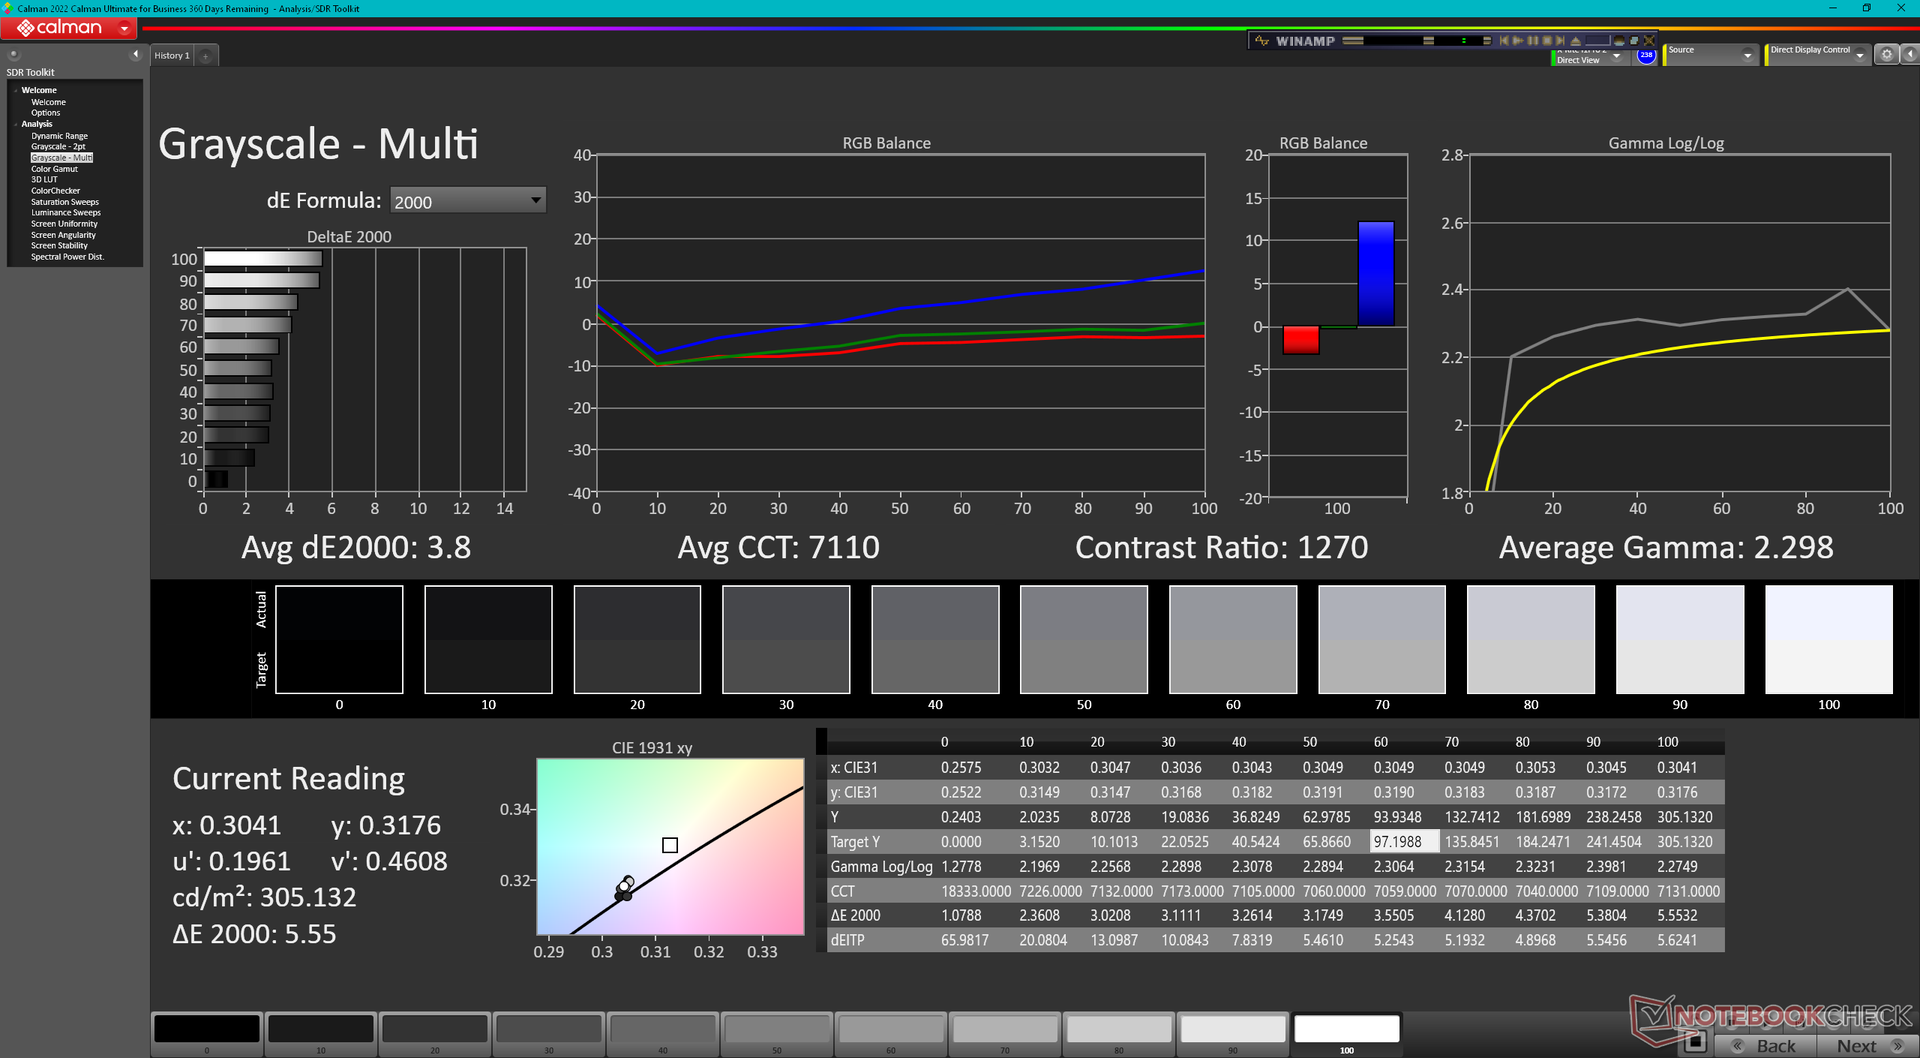
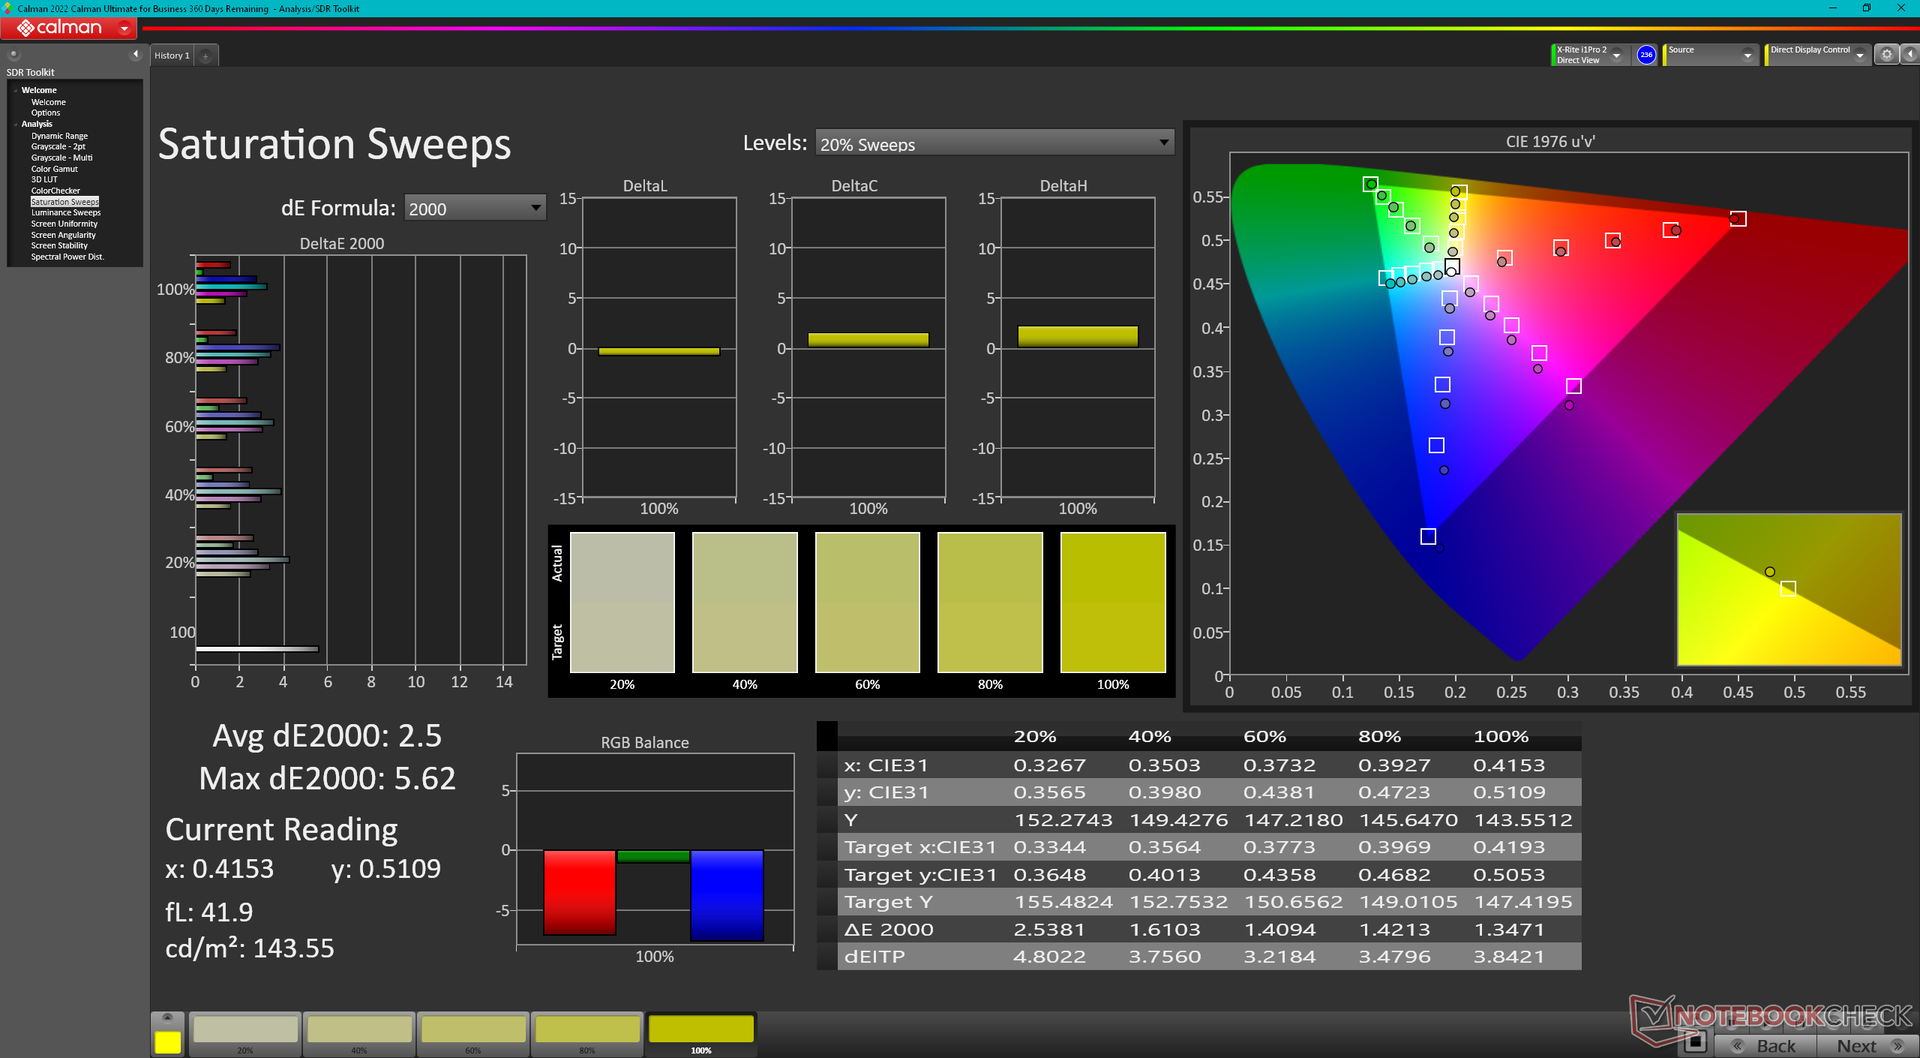
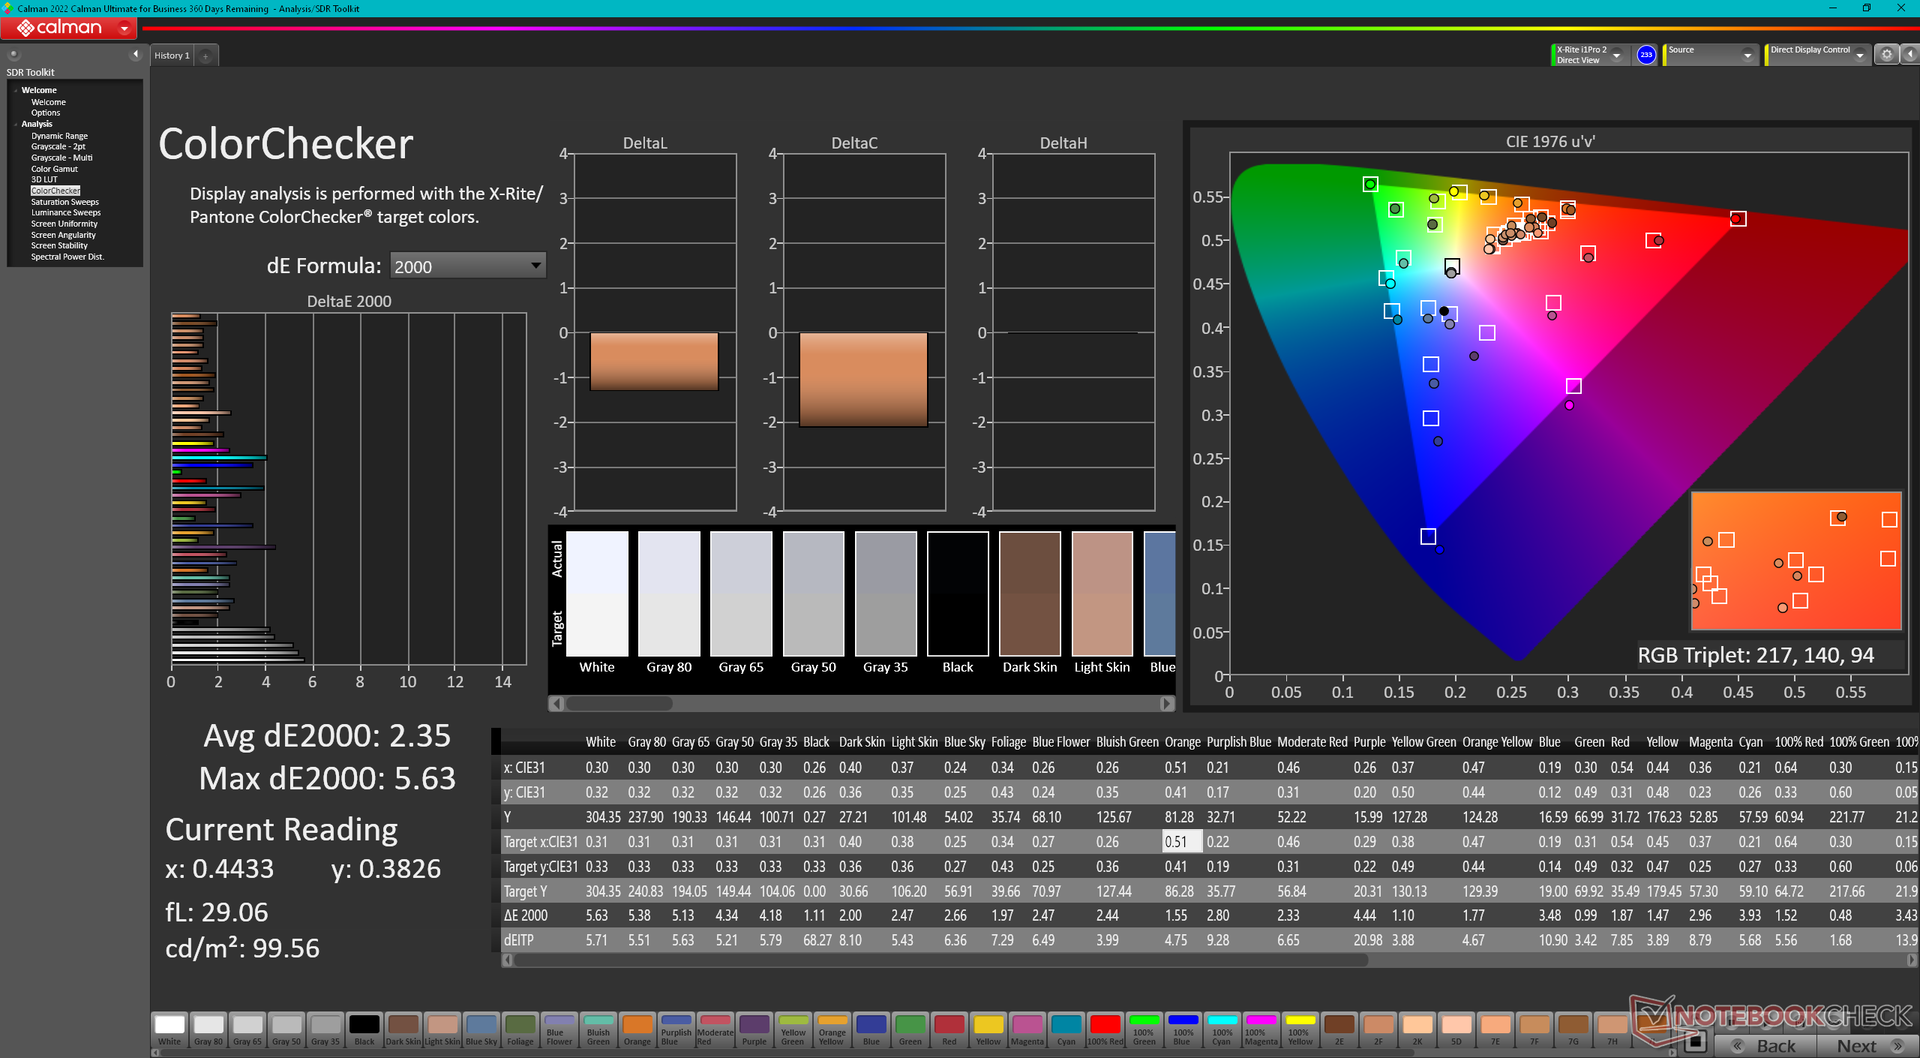
ΔE ColorChecker Calman: 2.35 | ∀{0.5-29.43 Ø4.71}
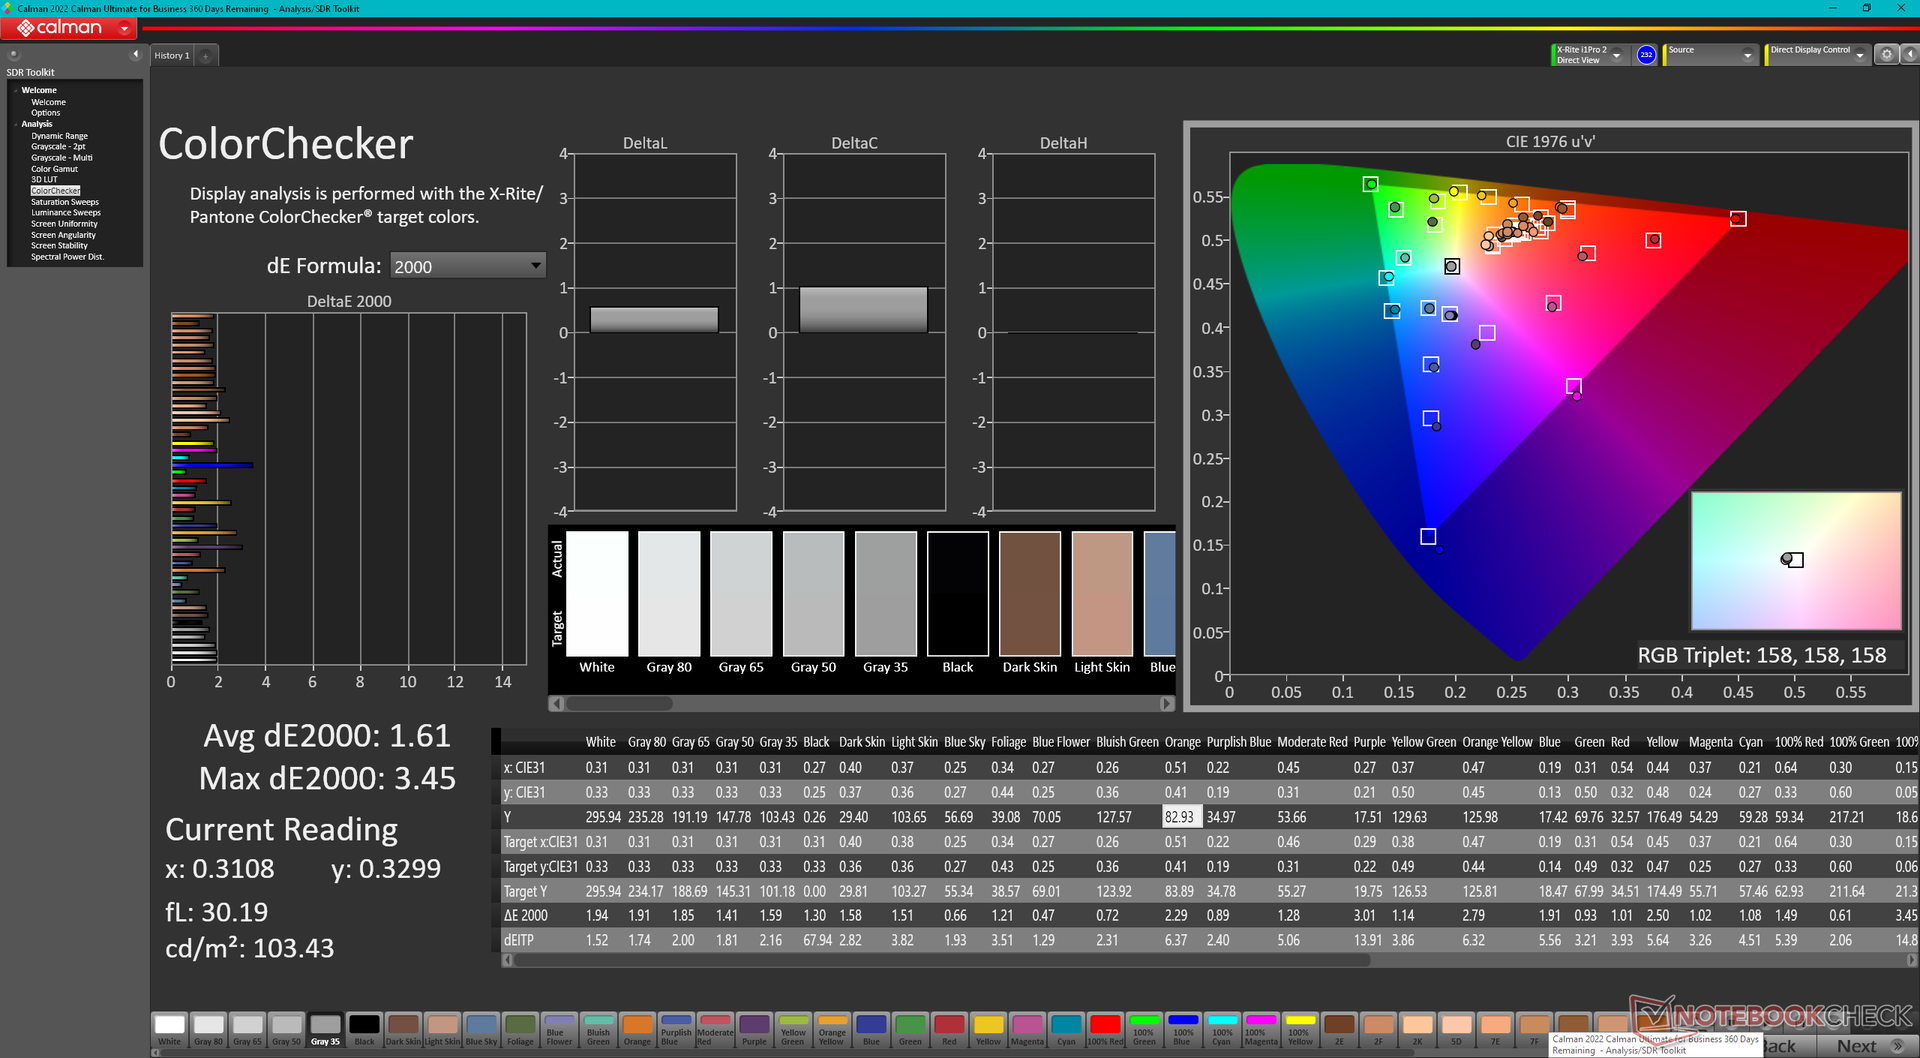
calibrated: 1.61
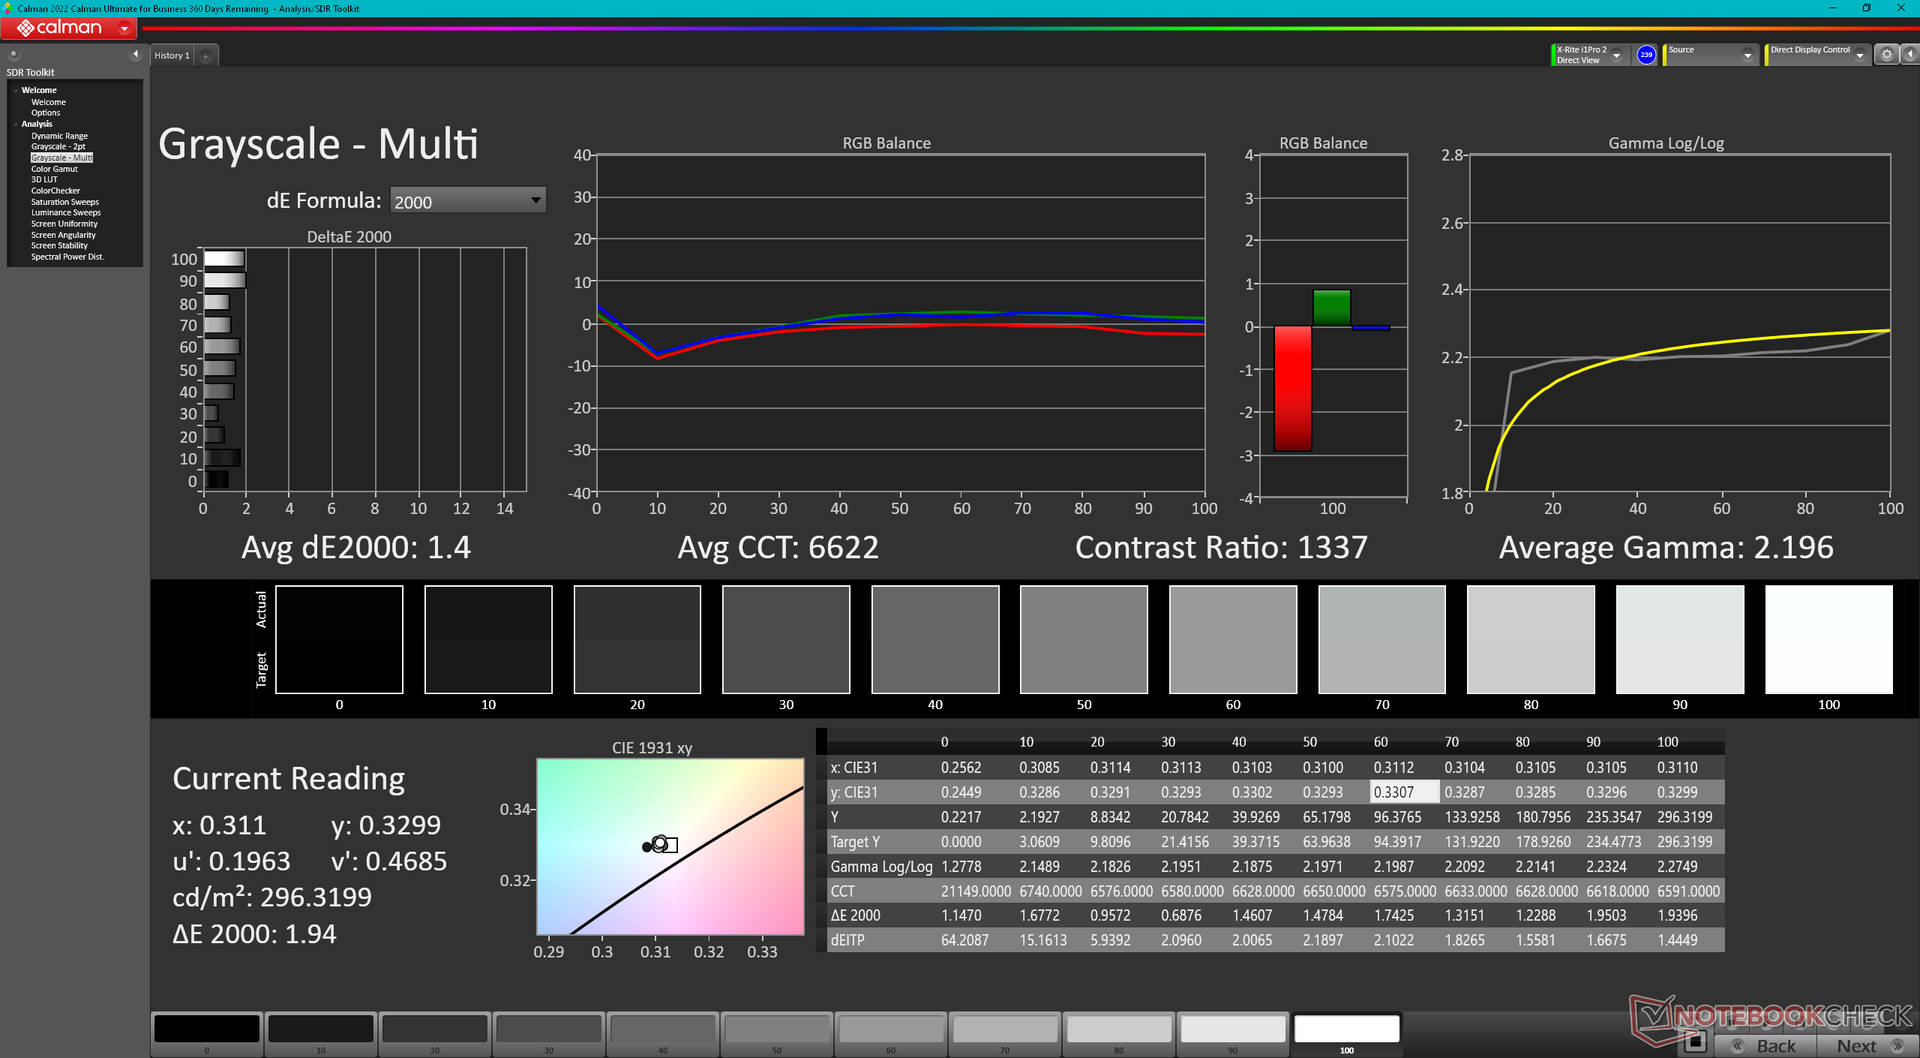
ΔE Greyscale Calman: 3.8 | ∀{0.09-98 Ø4.96}
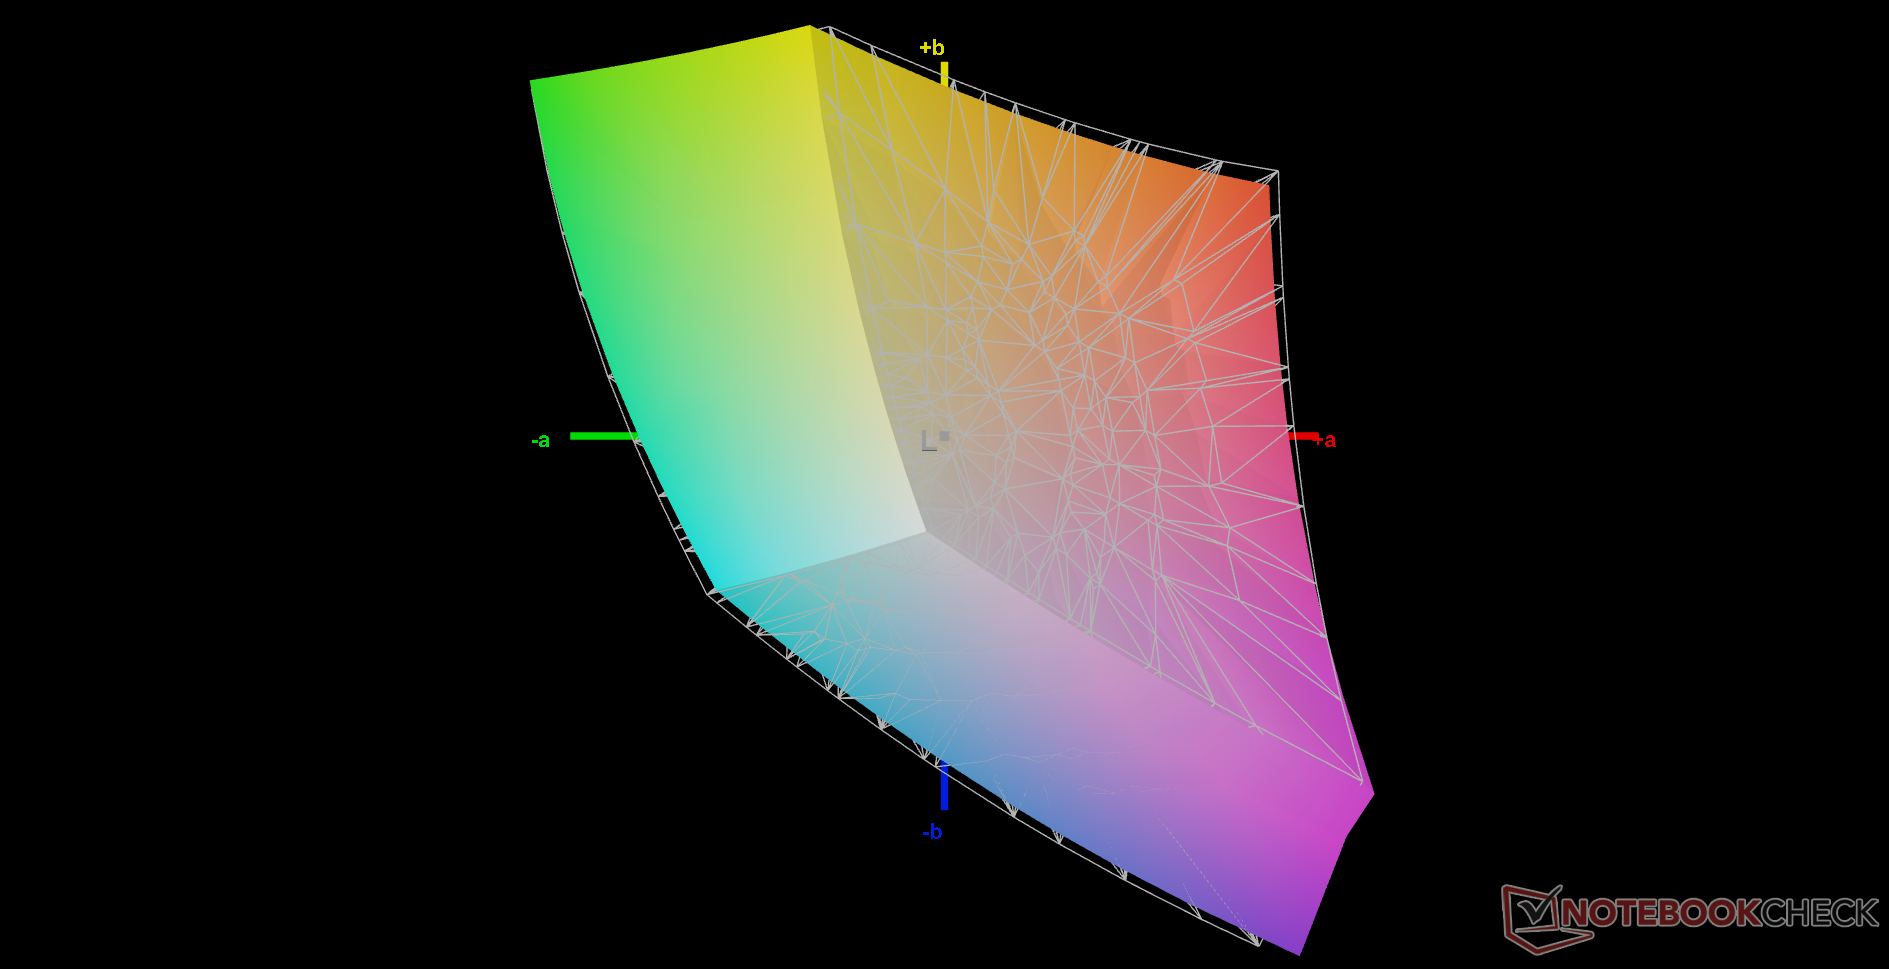
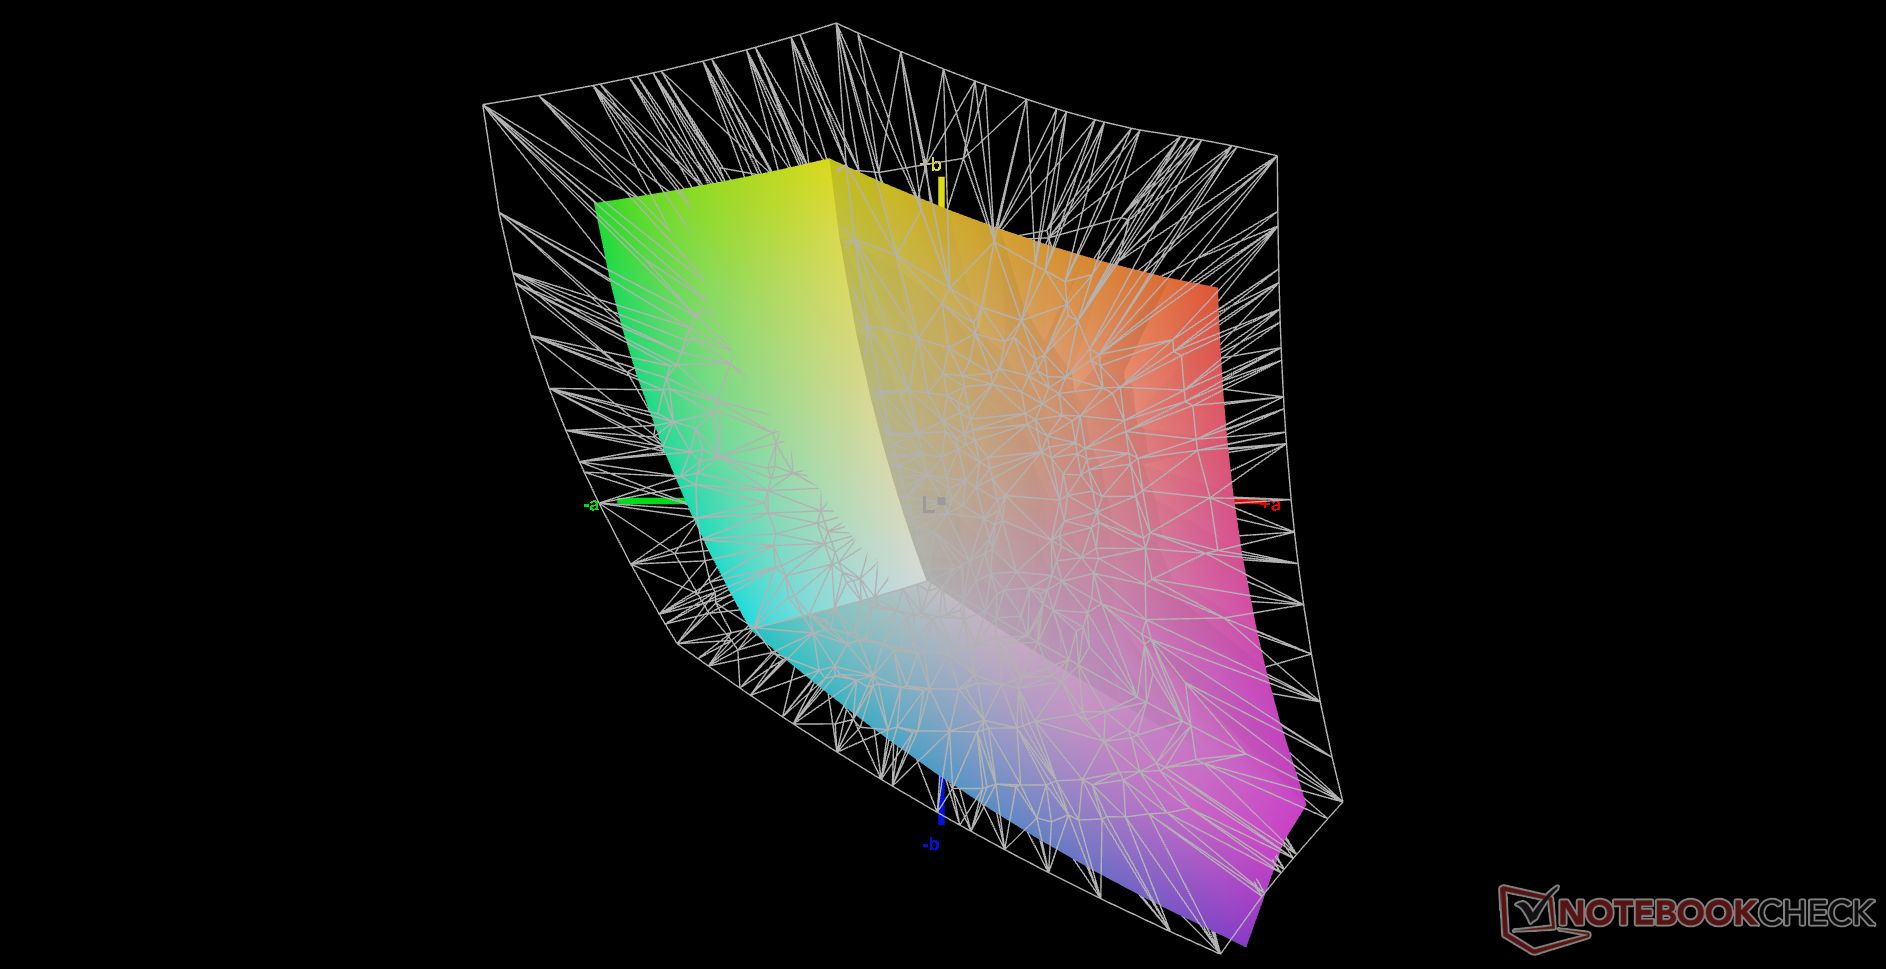
65.4% AdobeRGB 1998 (Argyll 3D)
95.2% sRGB (Argyll 3D)
64.5% Display P3 (Argyll 3D)
Gamma: 2.3
CCT: 7110 K
| Eurocom Nightsky TXi317 LG Philips LP173WFG-SPB3, IPS, 1920x1080, 17.3" | Schenker XMG Pro 17 E22 BOE099D, IPS, 2560x1440, 17.3" | Aorus 17X XES Sharp SHP1563, IPS, 1920x1080, 17.3" | MSI Raider GE77 HX 12UHS AU Optronics B173ZAN06.1, IPS, 3840x2160, 17.3" | Razer Blade 17 Early 2022 AU Optronics B173ZAN06.9, IPS, 3840x2160, 17.3" | Alienware x17 R2 P48E AU Optronics B173HAN, IPS, 1920x1080, 17.3" | |
|---|---|---|---|---|---|---|
| Display | 29% | 8% | 29% | 31% | 17% | |
| Display P3 Coverage (%) | 64.5 | 97.5 51% | 70.1 9% | 96.6 50% | 99.4 54% | 79.2 23% |
| sRGB Coverage (%) | 95.2 | 99.9 5% | 99.9 5% | 99.8 5% | 100 5% | 99.8 5% |
| AdobeRGB 1998 Coverage (%) | 65.4 | 85.2 30% | 71.9 10% | 85.8 31% | 87.3 33% | 79.6 22% |
| Response Times | 44% | 58% | 47% | 39% | -1% | |
| Response Time Grey 50% / Grey 80% * (ms) | 10.4 ? | 5.4 ? 48% | 3.4 ? 67% | 5.8 ? 44% | 7.5 ? 28% | 12.4 ? -19% |
| Response Time Black / White * (ms) | 11.2 ? | 6.8 ? 39% | 5.8 ? 48% | 5.6 ? 50% | 5.6 ? 50% | 9.2 ? 18% |
| PWM Frequency (Hz) | ||||||
| Screen | 5% | -24% | -19% | 33% | 2% | |
| Brightness middle (cd/m²) | 303.9 | 349 15% | 278 -9% | 381 25% | 503 66% | 365.4 20% |
| Brightness (cd/m²) | 292 | 319 9% | 273 -7% | 371 27% | 486 66% | 344 18% |
| Brightness Distribution (%) | 88 | 83 -6% | 79 -10% | 84 -5% | 84 -5% | 85 -3% |
| Black Level * (cd/m²) | 0.3 | 0.32 -7% | 0.26 13% | 0.52 -73% | 0.44 -47% | 0.29 3% |
| Contrast (:1) | 1013 | 1091 8% | 1069 6% | 733 -28% | 1143 13% | 1260 24% |
| Colorchecker dE 2000 * | 2.35 | 2.5 -6% | 3.96 -69% | 1.08 54% | 3.17 -35% | |
| Colorchecker dE 2000 max. * | 5.63 | 6.87 -22% | 10.78 -91% | 4.54 19% | 7.69 -37% | |
| Colorchecker dE 2000 calibrated * | 1.61 | 0.64 60% | 1.07 34% | 2.53 -57% | 0.6 63% | 0.51 68% |
| Greyscale dE 2000 * | 3.8 | 3.9 -3% | 6.8 -79% | 1.3 66% | 5.3 -39% | |
| Gamma | 2.3 96% | 2.09 105% | 2.224 99% | 2.151 102% | 2.18 101% | |
| CCT | 7110 91% | 7192 90% | 7651 85% | 6541 99% | 5879 111% | |
| Totaal Gemiddelde (Programma / Instellingen) | 26% /
16% | 14% /
-5% | 19% /
6% | 34% /
33% | 6% /
5% |
* ... kleiner is beter
Eurocom kalibreert het scherm voor u tegen betaling. Onze testunit werd ongekalibreerd geleverd met gemiddelde grijswaarden en kleurendeltaE waarden van respectievelijk 3,8 en 2,35, wat eigenlijk niet slecht is. Zelf kalibreren van het paneel zou deze gemiddelden nog verder verbeteren tot 1,4 en 1,61. Ons gekalibreerde profiel is hierboven gratis te downloaden.

Responstijd Scherm
| ↔ Responstijd Zwart naar Wit | ||
|---|---|---|
| 11.2 ms ... stijging ↗ en daling ↘ gecombineerd | ↗ 6 ms stijging | 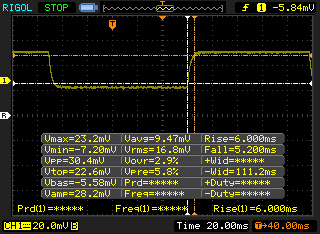 |
| ↘ 5.2 ms daling | ||
| Het scherm vertoonde prima responstijden in onze tests maar is misschien wat te traag voor competitieve games. Ter vergelijking: alle testtoestellen variëren van 0.1 (minimum) tot 240 (maximum) ms. » 30 % van alle toestellen zijn beter. Dit betekent dat de gemeten responstijd beter is dan het gemiddelde (19.8 ms) van alle geteste toestellen. | ||
| ↔ Responstijd 50% Grijs naar 80% Grijs | ||
| 10.4 ms ... stijging ↗ en daling ↘ gecombineerd | ↗ 6 ms stijging | 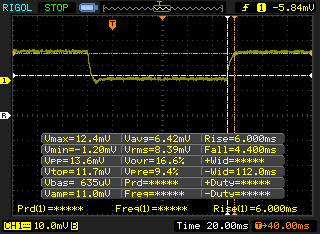 |
| ↘ 4.4 ms daling | ||
| Het scherm vertoonde prima responstijden in onze tests maar is misschien wat te traag voor competitieve games. Ter vergelijking: alle testtoestellen variëren van 0.165 (minimum) tot 636 (maximum) ms. » 24 % van alle toestellen zijn beter. Dit betekent dat de gemeten responstijd beter is dan het gemiddelde (31 ms) van alle geteste toestellen. | ||
Screen Flickering / PWM (Pulse-Width Modulation)
| Screen flickering / PWM niet waargenomen |  | ||
Ter vergelijking: 52 % van alle geteste toestellen maakten geen gebruik van PWM om de schermhelderheid te verlagen. Als het wel werd gebruikt, werd een gemiddelde van 7757 (minimum: 5 - maximum: 343500) Hz waargenomen. | |||
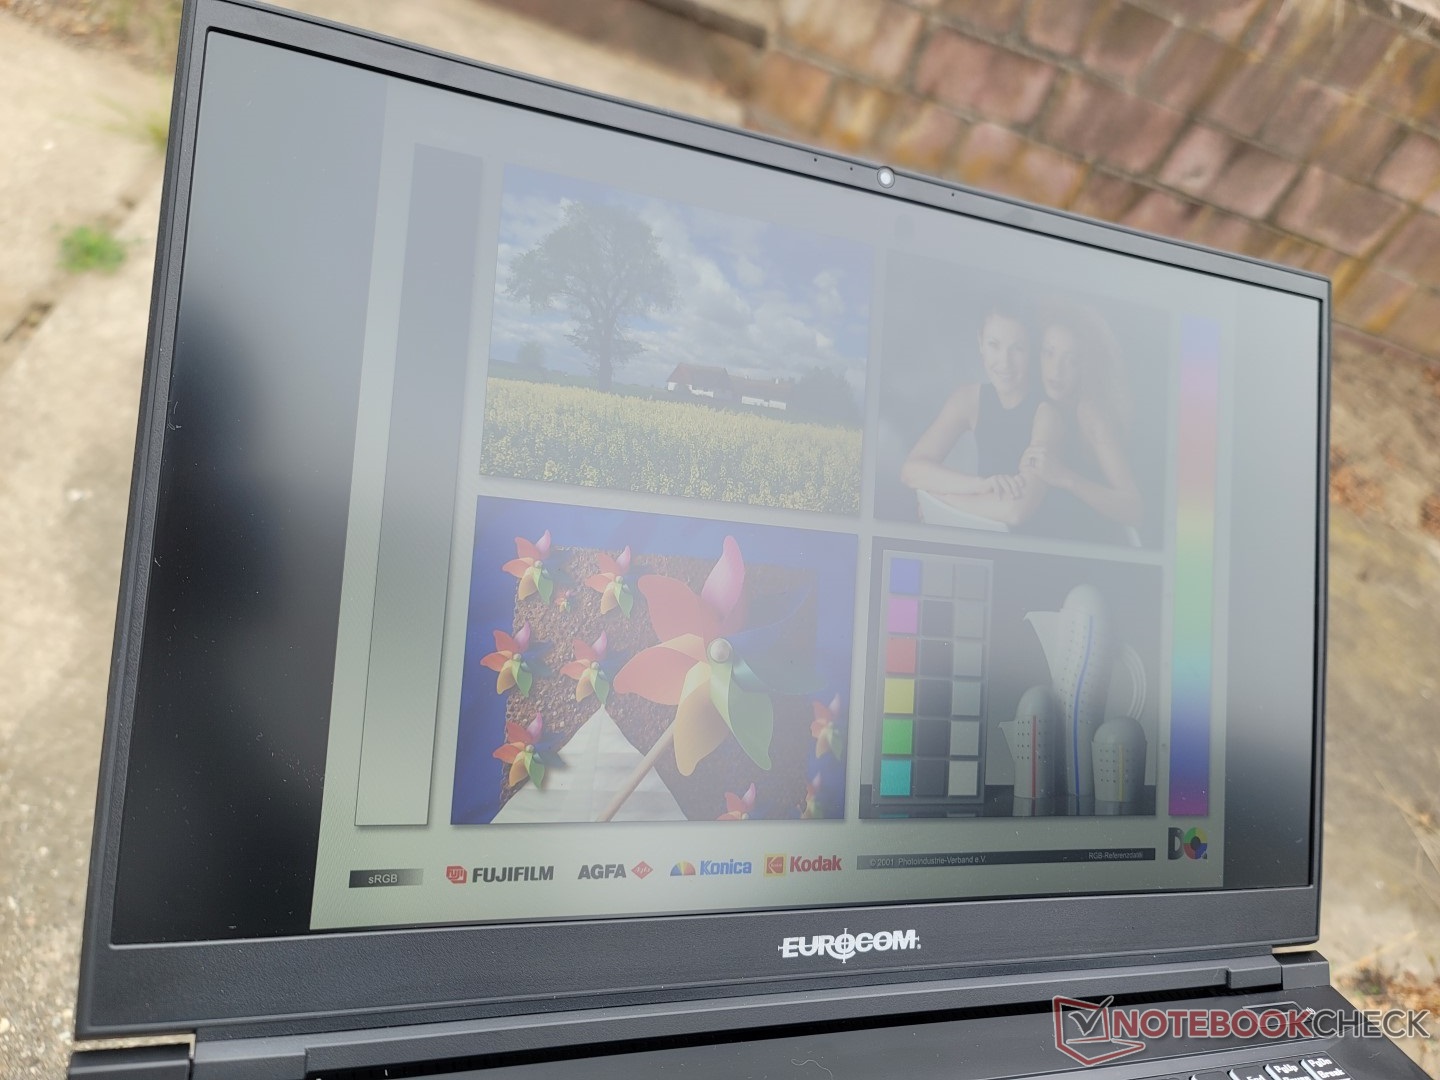
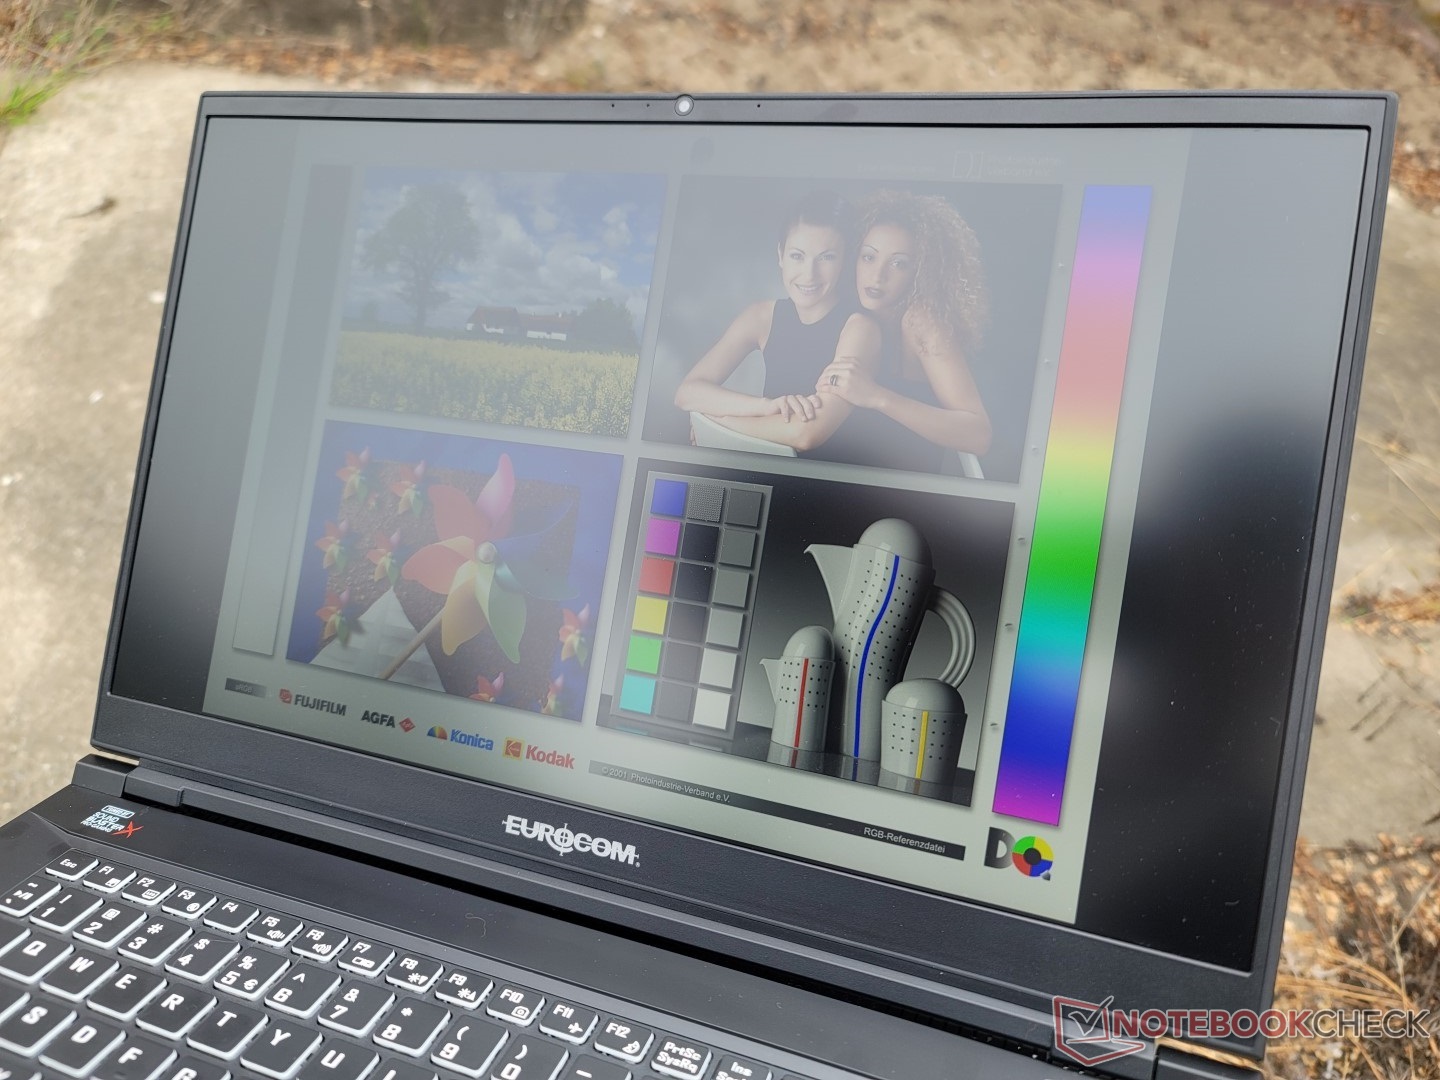
Met maximaal 300 nits is het scherm ongeveer gemiddeld voor zichtbaarheid buitenshuis in vergelijking met andere 17-inch gaming laptops. Een paar alternatieven, zoals deRazer Blade 17, hebben veel helderdere displays van meer dan 500 nits voor betere leesbaarheid buitenshuis.
Prestaties
Testomstandigheden
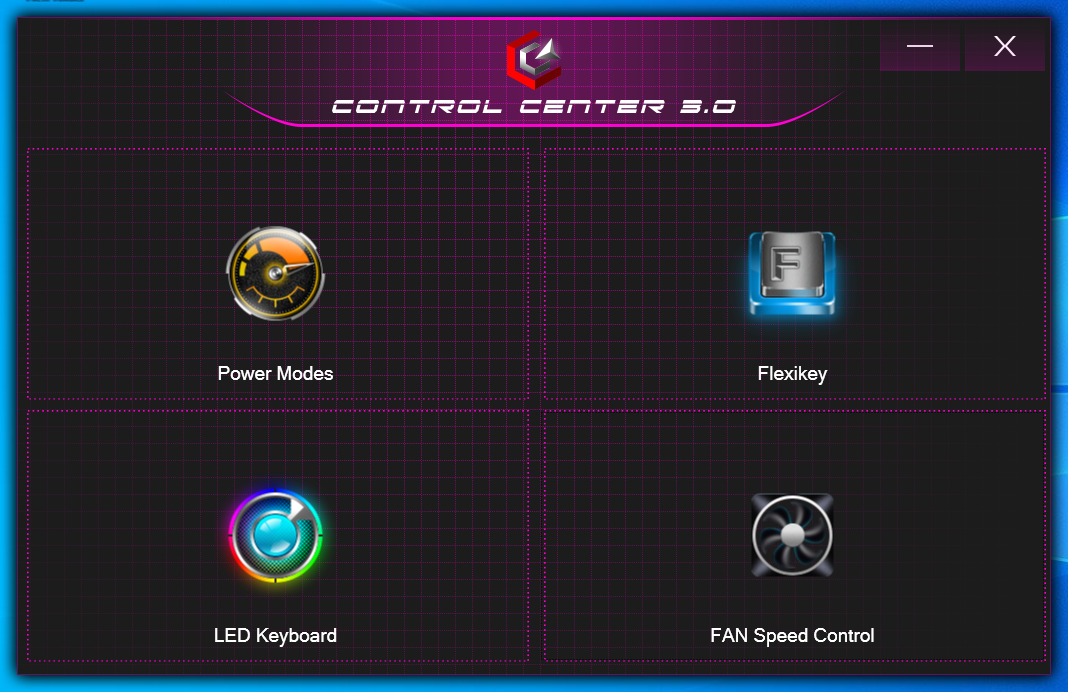
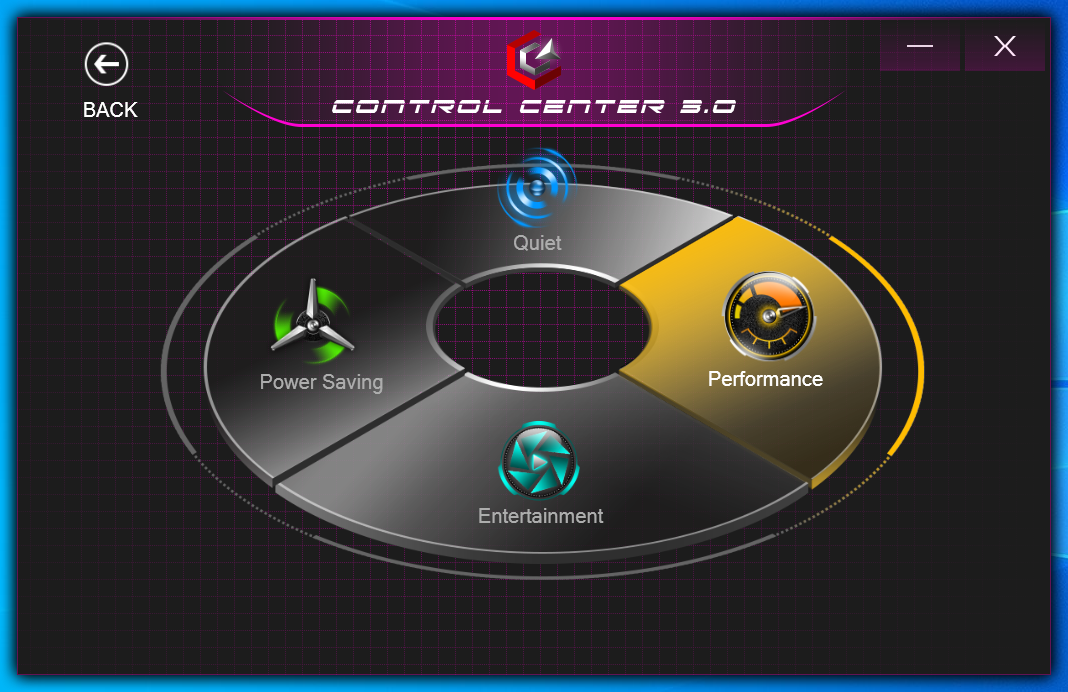
Ons toestel werd via zowel Windows als de voorgeïnstalleerde Control Center 3.0 software ingesteld op Performance mode alvorens onderstaande benchmarks uit te voeren voor de hoogst mogelijke scores. We hebben er ook voor gezorgd dat Nvidia Optimus is ingesteld op discrete graphics; MUX wordt hier helaas niet ondersteund.
Processor
De ruwe multi-thread prestaties zijn ongeveer 10 procent sneller dan de gemiddelde laptop in onze database uitgerust met dezelfde Core i7-12700H. De processor in de HP Envy 16is bijvoorbeeld veel langzamer dan onze Eurocom, zelfs na eventuele prestatiebeperking
Opwaarderen naar de Core i9-12900H zal naar verwachting de processorprestaties slechts marginaal verbeteren met ongeveer 5 tot 10 procent, gebaseerd op onze ervaring met de Alienware x15 R2 en Schenker XMG Pro 17 E22
CineBench R15 zou niet correct draaien op onze unit, net als op het laatste Eurocom systeem dat we eerder dit jaar hebben beoordeeld. We hebben contact opgenomen met de fabrikant en zij konden onze bevindingen bevestigen. De benchmark is weggelaten voor deze review.
Cinebench R23 Multi Loop
Cinebench R23: Multi Core | Single Core
Cinebench R15: CPU Multi 64Bit | CPU Single 64Bit
Blender: v2.79 BMW27 CPU
7-Zip 18.03: 7z b 4 | 7z b 4 -mmt1
Geekbench 5.5: Multi-Core | Single-Core
HWBOT x265 Benchmark v2.2: 4k Preset
LibreOffice : 20 Documents To PDF
R Benchmark 2.5: Overall mean
Cinebench R23: Multi Core | Single Core
Cinebench R15: CPU Multi 64Bit | CPU Single 64Bit
Blender: v2.79 BMW27 CPU
7-Zip 18.03: 7z b 4 | 7z b 4 -mmt1
Geekbench 5.5: Multi-Core | Single-Core
HWBOT x265 Benchmark v2.2: 4k Preset
LibreOffice : 20 Documents To PDF
R Benchmark 2.5: Overall mean
* ... kleiner is beter
AIDA64: FP32 Ray-Trace | FPU Julia | CPU SHA3 | CPU Queen | FPU SinJulia | FPU Mandel | CPU AES | CPU ZLib | FP64 Ray-Trace | CPU PhotoWorxx
| Performance rating | |
| MSI Raider GE77 HX 12UHS | |
| Aorus 17X XES | |
| Eurocom Nightsky TXi317 | |
| Alienware x17 R2 P48E | |
| Gemiddeld Intel Core i7-12700H | |
| Schenker XMG Pro 17 E22 | |
| Razer Blade 17 Early 2022 | |
| AIDA64 / FP32 Ray-Trace | |
| MSI Raider GE77 HX 12UHS | |
| Eurocom Nightsky TXi317 | |
| Aorus 17X XES | |
| Gemiddeld Intel Core i7-12700H (2585 - 17957, n=64) | |
| Alienware x17 R2 P48E | |
| Schenker XMG Pro 17 E22 | |
| Razer Blade 17 Early 2022 | |
| AIDA64 / FPU Julia | |
| MSI Raider GE77 HX 12UHS | |
| Eurocom Nightsky TXi317 | |
| Aorus 17X XES | |
| Gemiddeld Intel Core i7-12700H (12439 - 90760, n=64) | |
| Alienware x17 R2 P48E | |
| Schenker XMG Pro 17 E22 | |
| Razer Blade 17 Early 2022 | |
| AIDA64 / CPU SHA3 | |
| MSI Raider GE77 HX 12UHS | |
| Eurocom Nightsky TXi317 | |
| Aorus 17X XES | |
| Alienware x17 R2 P48E | |
| Gemiddeld Intel Core i7-12700H (833 - 4242, n=64) | |
| Schenker XMG Pro 17 E22 | |
| Razer Blade 17 Early 2022 | |
| AIDA64 / CPU Queen | |
| Alienware x17 R2 P48E | |
| Schenker XMG Pro 17 E22 | |
| Aorus 17X XES | |
| Eurocom Nightsky TXi317 | |
| MSI Raider GE77 HX 12UHS | |
| Gemiddeld Intel Core i7-12700H (57923 - 103202, n=63) | |
| Razer Blade 17 Early 2022 | |
| AIDA64 / FPU SinJulia | |
| MSI Raider GE77 HX 12UHS | |
| Aorus 17X XES | |
| Alienware x17 R2 P48E | |
| Eurocom Nightsky TXi317 | |
| Schenker XMG Pro 17 E22 | |
| Gemiddeld Intel Core i7-12700H (3249 - 9939, n=64) | |
| Razer Blade 17 Early 2022 | |
| AIDA64 / FPU Mandel | |
| MSI Raider GE77 HX 12UHS | |
| Aorus 17X XES | |
| Eurocom Nightsky TXi317 | |
| Gemiddeld Intel Core i7-12700H (7135 - 44760, n=64) | |
| Alienware x17 R2 P48E | |
| Schenker XMG Pro 17 E22 | |
| Razer Blade 17 Early 2022 | |
| AIDA64 / CPU AES | |
| MSI Raider GE77 HX 12UHS | |
| Eurocom Nightsky TXi317 | |
| Aorus 17X XES | |
| Alienware x17 R2 P48E | |
| Schenker XMG Pro 17 E22 | |
| Gemiddeld Intel Core i7-12700H (31839 - 144360, n=64) | |
| Razer Blade 17 Early 2022 | |
| AIDA64 / CPU ZLib | |
| MSI Raider GE77 HX 12UHS | |
| Alienware x17 R2 P48E | |
| Eurocom Nightsky TXi317 | |
| Schenker XMG Pro 17 E22 | |
| Aorus 17X XES | |
| Gemiddeld Intel Core i7-12700H (305 - 1171, n=64) | |
| Razer Blade 17 Early 2022 | |
| AIDA64 / FP64 Ray-Trace | |
| MSI Raider GE77 HX 12UHS | |
| Aorus 17X XES | |
| Eurocom Nightsky TXi317 | |
| Gemiddeld Intel Core i7-12700H (1437 - 9692, n=64) | |
| Alienware x17 R2 P48E | |
| Schenker XMG Pro 17 E22 | |
| Razer Blade 17 Early 2022 | |
| AIDA64 / CPU PhotoWorxx | |
| MSI Raider GE77 HX 12UHS | |
| Aorus 17X XES | |
| Razer Blade 17 Early 2022 | |
| Alienware x17 R2 P48E | |
| Gemiddeld Intel Core i7-12700H (12863 - 52207, n=64) | |
| Eurocom Nightsky TXi317 | |
| Schenker XMG Pro 17 E22 | |
Systeemprestaties
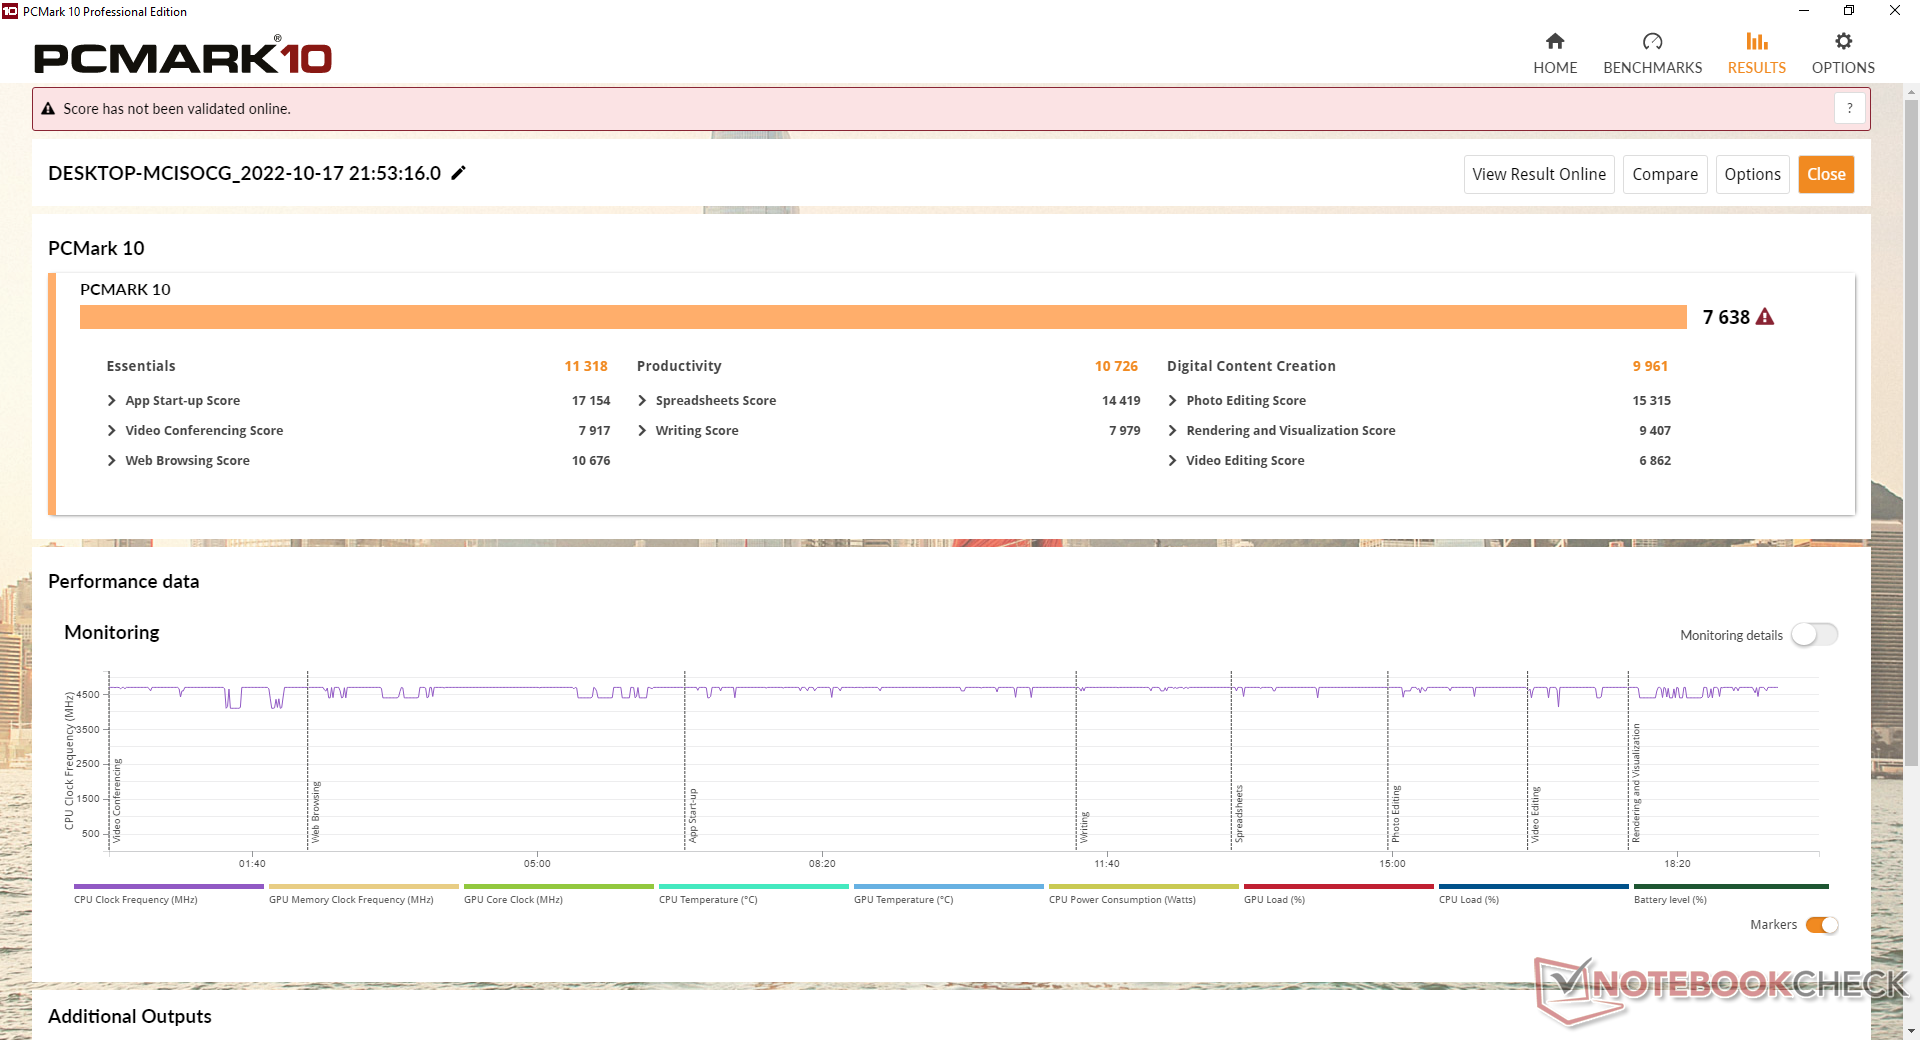
CrossMark: Overall | Productivity | Creativity | Responsiveness
| PCMark 10 / Score | |
| Alienware x17 R2 P48E | |
| Aorus 17X XES | |
| Schenker XMG Pro 17 E22 | |
| Eurocom Nightsky TXi317 | |
| Gemiddeld Intel Core i7-12700H, NVIDIA GeForce RTX 3080 Ti Laptop GPU (6868 - 7638, n=7) | |
| Razer Blade 17 Early 2022 | |
| MSI Raider GE77 HX 12UHS | |
| PCMark 10 / Essentials | |
| Eurocom Nightsky TXi317 | |
| Alienware x17 R2 P48E | |
| Schenker XMG Pro 17 E22 | |
| Aorus 17X XES | |
| Gemiddeld Intel Core i7-12700H, NVIDIA GeForce RTX 3080 Ti Laptop GPU (9987 - 11318, n=7) | |
| Razer Blade 17 Early 2022 | |
| MSI Raider GE77 HX 12UHS | |
| PCMark 10 / Productivity | |
| Eurocom Nightsky TXi317 | |
| Aorus 17X XES | |
| Schenker XMG Pro 17 E22 | |
| Alienware x17 R2 P48E | |
| MSI Raider GE77 HX 12UHS | |
| Gemiddeld Intel Core i7-12700H, NVIDIA GeForce RTX 3080 Ti Laptop GPU (8944 - 10726, n=7) | |
| Razer Blade 17 Early 2022 | |
| PCMark 10 / Digital Content Creation | |
| Alienware x17 R2 P48E | |
| Aorus 17X XES | |
| Schenker XMG Pro 17 E22 | |
| Gemiddeld Intel Core i7-12700H, NVIDIA GeForce RTX 3080 Ti Laptop GPU (8956 - 12249, n=7) | |
| Razer Blade 17 Early 2022 | |
| Eurocom Nightsky TXi317 | |
| MSI Raider GE77 HX 12UHS | |
| CrossMark / Overall | |
| MSI Raider GE77 HX 12UHS | |
| Aorus 17X XES | |
| Alienware x17 R2 P48E | |
| Eurocom Nightsky TXi317 | |
| Gemiddeld Intel Core i7-12700H, NVIDIA GeForce RTX 3080 Ti Laptop GPU (1761 - 1861, n=4) | |
| Razer Blade 17 Early 2022 | |
| CrossMark / Productivity | |
| MSI Raider GE77 HX 12UHS | |
| Aorus 17X XES | |
| Alienware x17 R2 P48E | |
| Eurocom Nightsky TXi317 | |
| Razer Blade 17 Early 2022 | |
| Gemiddeld Intel Core i7-12700H, NVIDIA GeForce RTX 3080 Ti Laptop GPU (1645 - 1800, n=4) | |
| CrossMark / Creativity | |
| MSI Raider GE77 HX 12UHS | |
| Aorus 17X XES | |
| Alienware x17 R2 P48E | |
| Gemiddeld Intel Core i7-12700H, NVIDIA GeForce RTX 3080 Ti Laptop GPU (1936 - 2041, n=4) | |
| Eurocom Nightsky TXi317 | |
| Razer Blade 17 Early 2022 | |
| CrossMark / Responsiveness | |
| Aorus 17X XES | |
| MSI Raider GE77 HX 12UHS | |
| Eurocom Nightsky TXi317 | |
| Alienware x17 R2 P48E | |
| Gemiddeld Intel Core i7-12700H, NVIDIA GeForce RTX 3080 Ti Laptop GPU (1461 - 1868, n=4) | |
| Razer Blade 17 Early 2022 | |
| PCMark 10 Score | 7638 punten | |
Help | ||
| AIDA64 / Memory Copy | |
| MSI Raider GE77 HX 12UHS | |
| Aorus 17X XES | |
| Razer Blade 17 Early 2022 | |
| Alienware x17 R2 P48E | |
| Gemiddeld Intel Core i7-12700H (25615 - 80511, n=64) | |
| Eurocom Nightsky TXi317 | |
| Schenker XMG Pro 17 E22 | |
| AIDA64 / Memory Read | |
| MSI Raider GE77 HX 12UHS | |
| Aorus 17X XES | |
| Razer Blade 17 Early 2022 | |
| Alienware x17 R2 P48E | |
| Gemiddeld Intel Core i7-12700H (25586 - 79442, n=64) | |
| Eurocom Nightsky TXi317 | |
| Schenker XMG Pro 17 E22 | |
| AIDA64 / Memory Write | |
| MSI Raider GE77 HX 12UHS | |
| Aorus 17X XES | |
| Razer Blade 17 Early 2022 | |
| Gemiddeld Intel Core i7-12700H (23679 - 88660, n=64) | |
| Alienware x17 R2 P48E | |
| Eurocom Nightsky TXi317 | |
| Schenker XMG Pro 17 E22 | |
| AIDA64 / Memory Latency | |
| Alienware x17 R2 P48E | |
| Schenker XMG Pro 17 E22 | |
| Eurocom Nightsky TXi317 | |
| Aorus 17X XES | |
| MSI Raider GE77 HX 12UHS | |
| Gemiddeld Intel Core i7-12700H (76.2 - 133.9, n=62) | |
* ... kleiner is beter
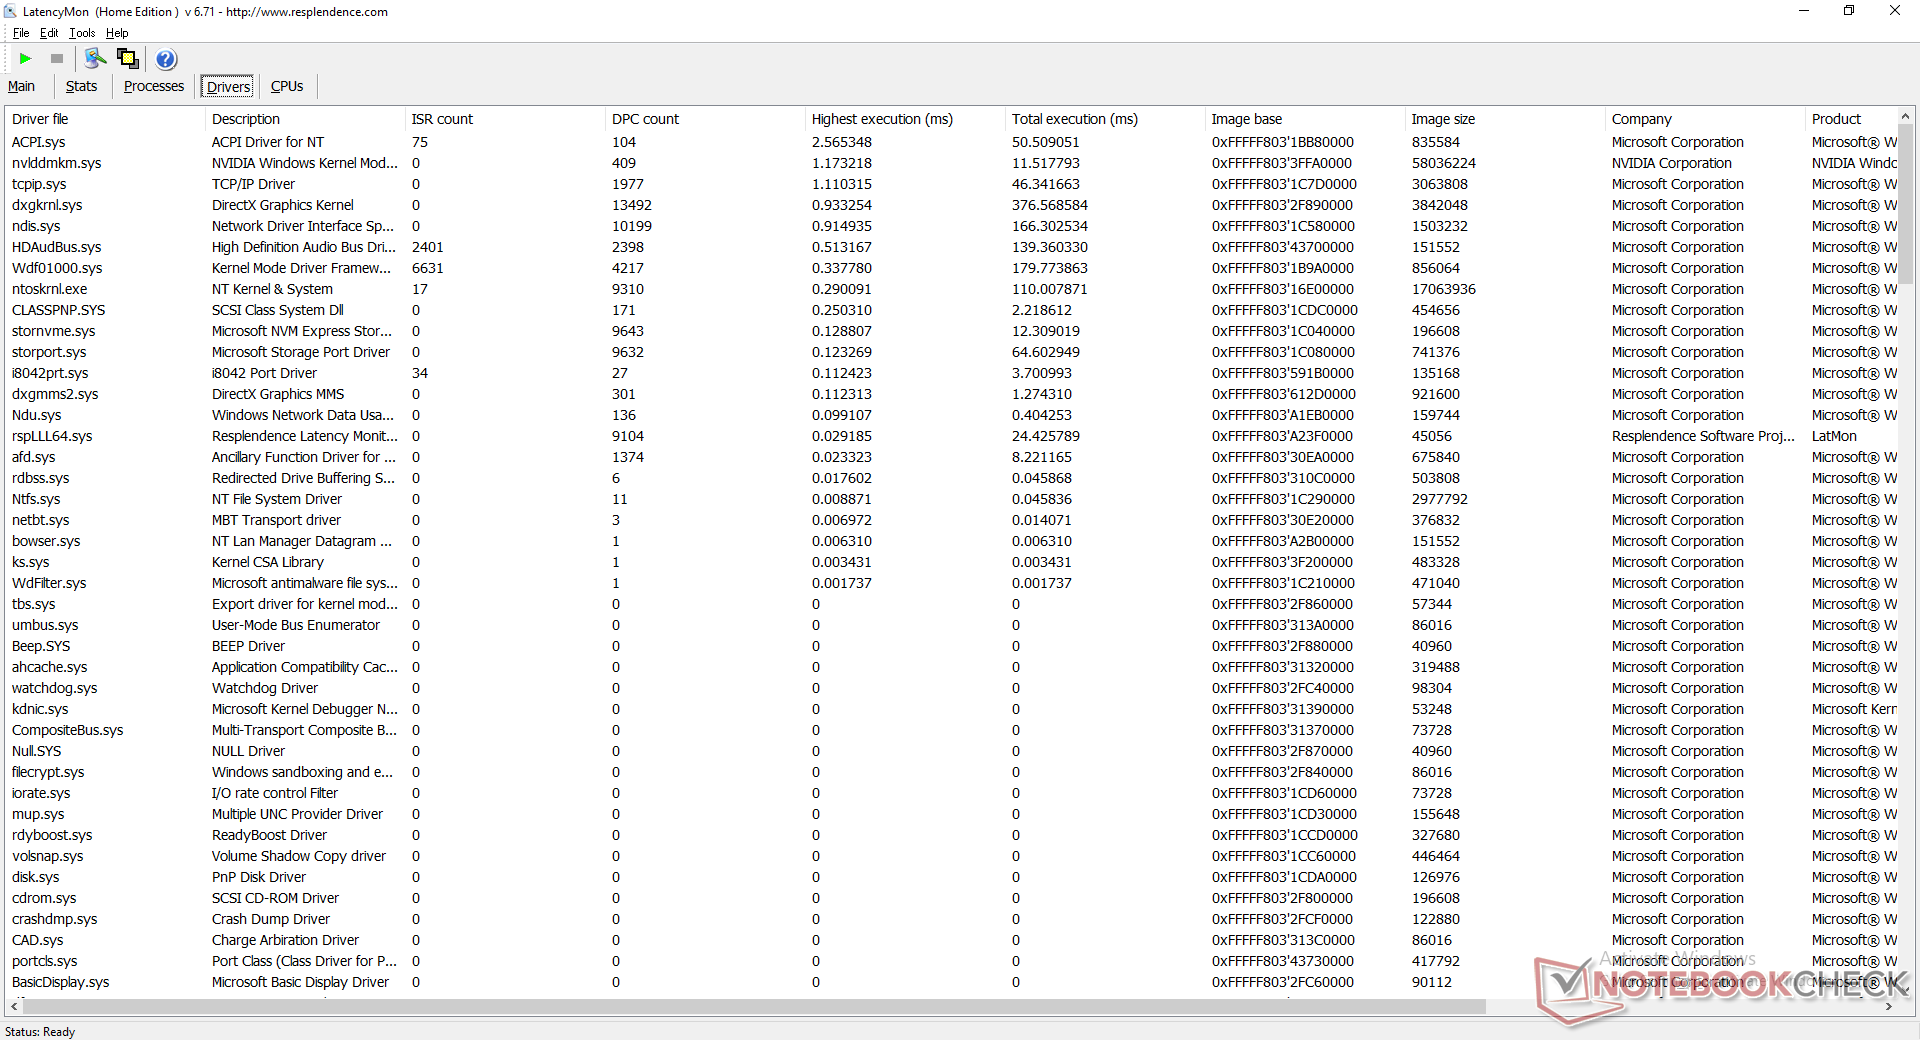
DPC latentie
LatencyMon onthult DPC-problemen bij het openen van meerdere browsertabbladen op onze homepage. het afspelen van 4K-video's met 60 FPS is verder perfect zonder dropped frames.
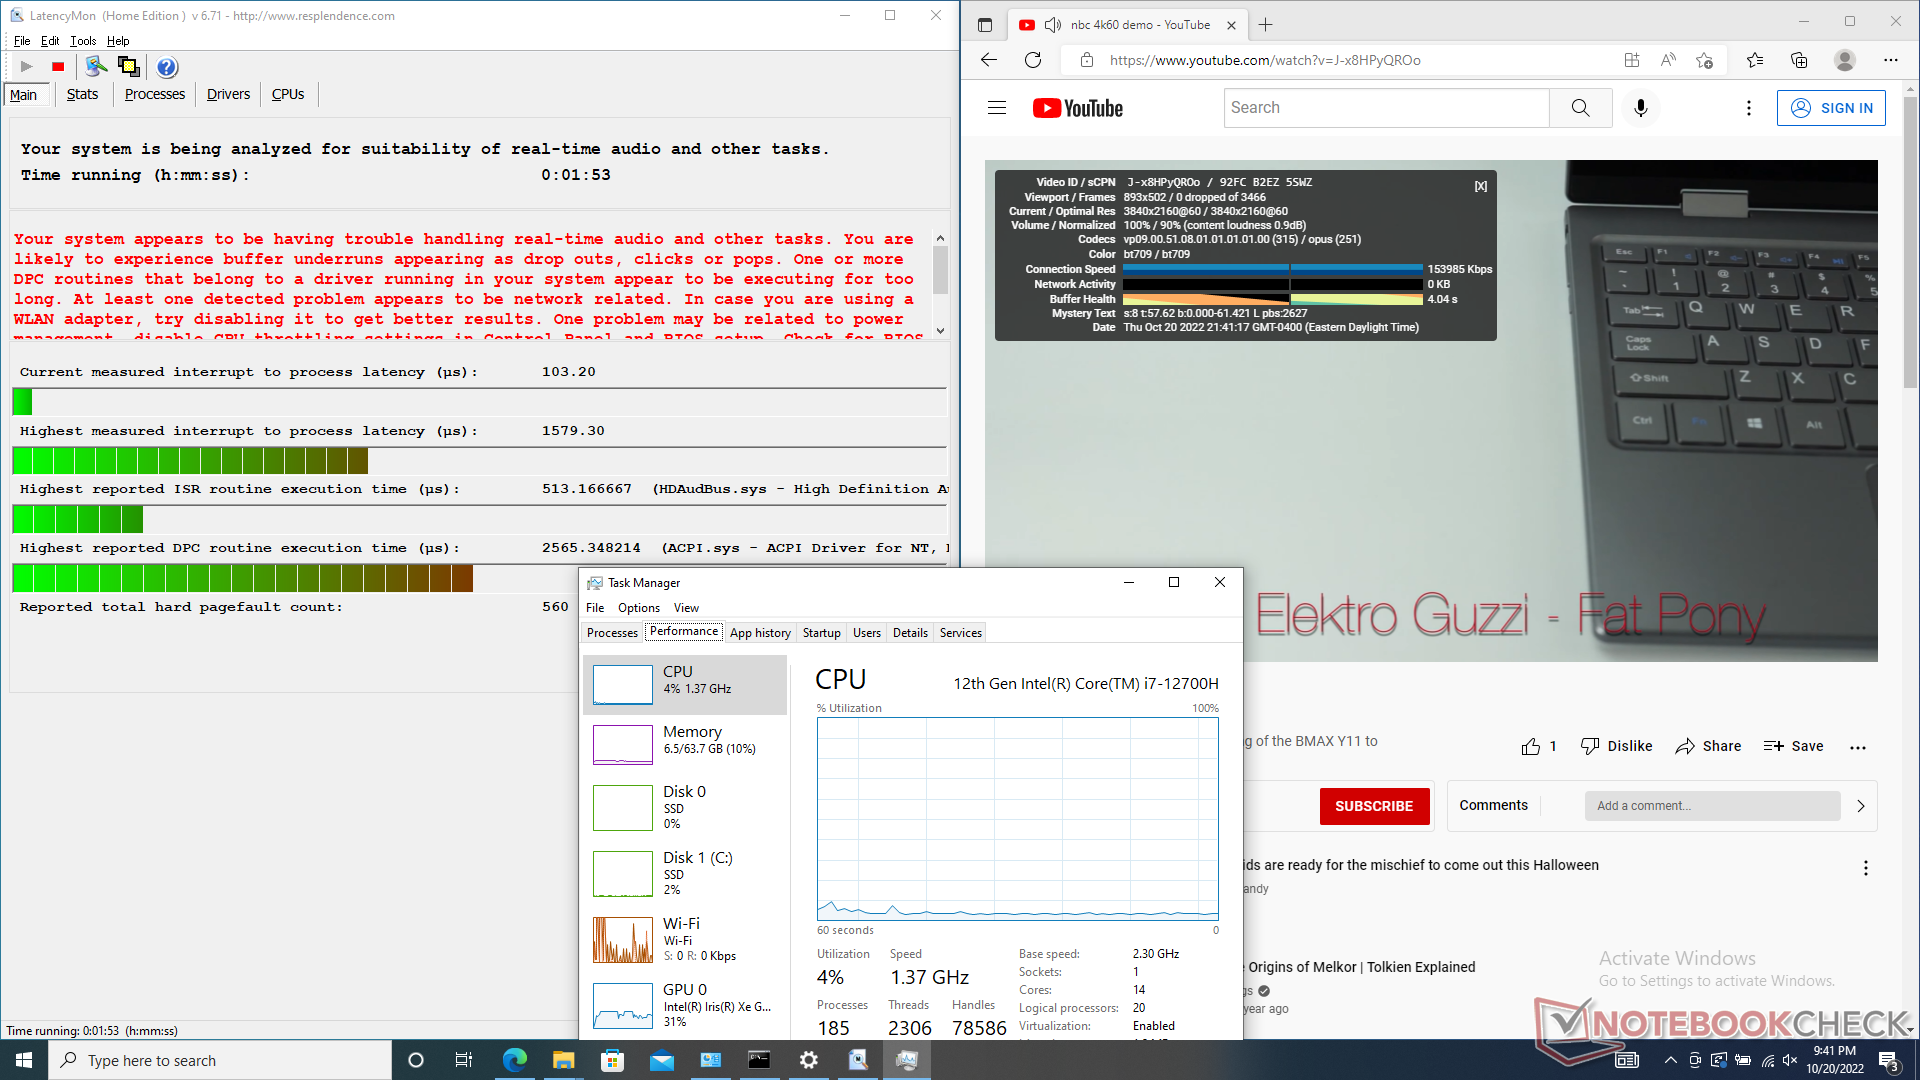
| DPC Latencies / LatencyMon - interrupt to process latency (max), Web, Youtube, Prime95 | |
| MSI Raider GE77 HX 12UHS | |
| Eurocom Nightsky TXi317 | |
| Aorus 17X XES | |
| Alienware x17 R2 P48E | |
| Schenker XMG Pro 17 E22 | |
| Razer Blade 17 Early 2022 | |
* ... kleiner is beter
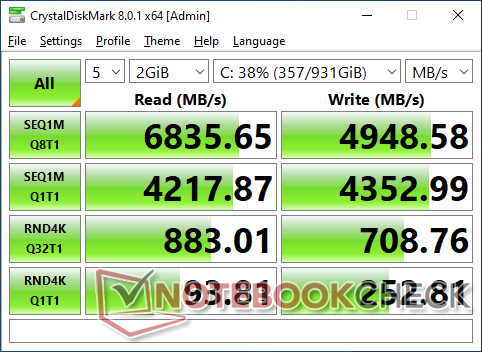
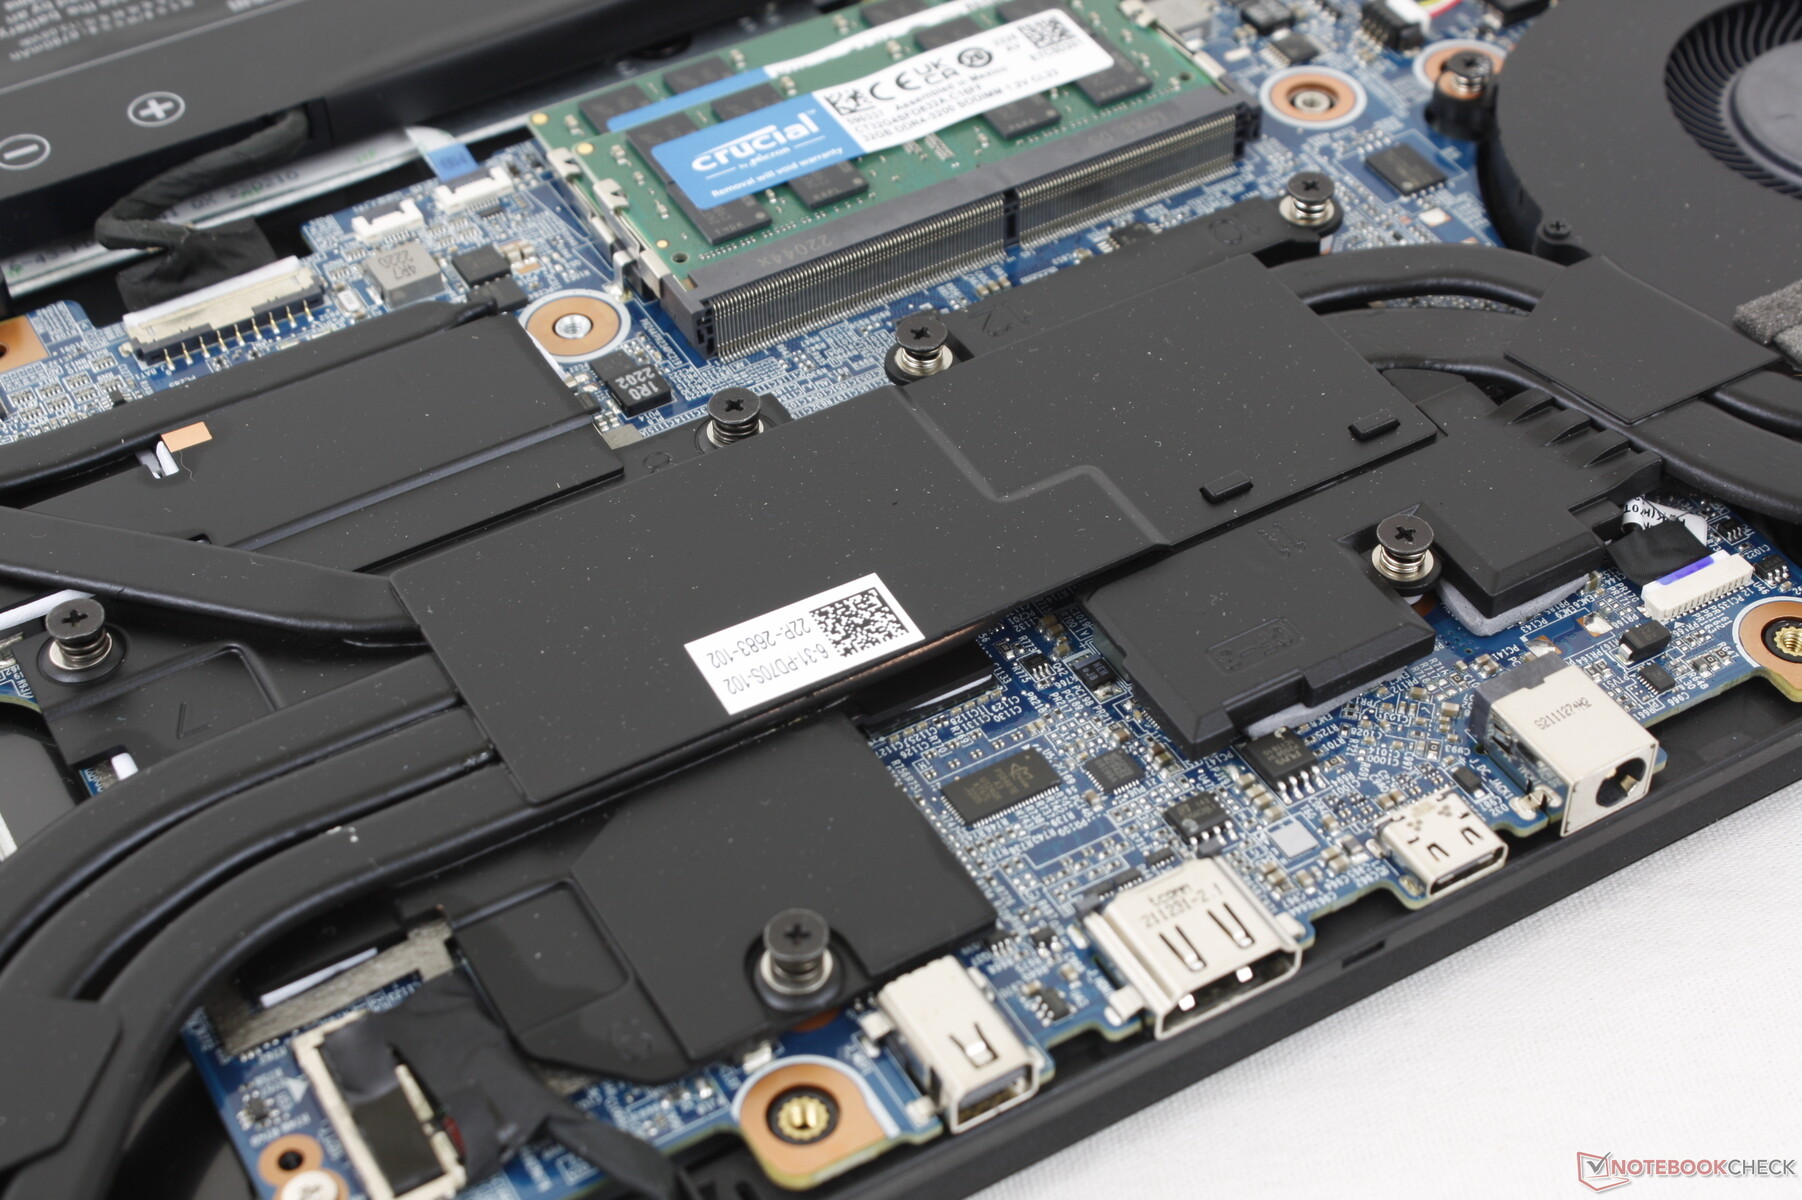
Opslagapparaten
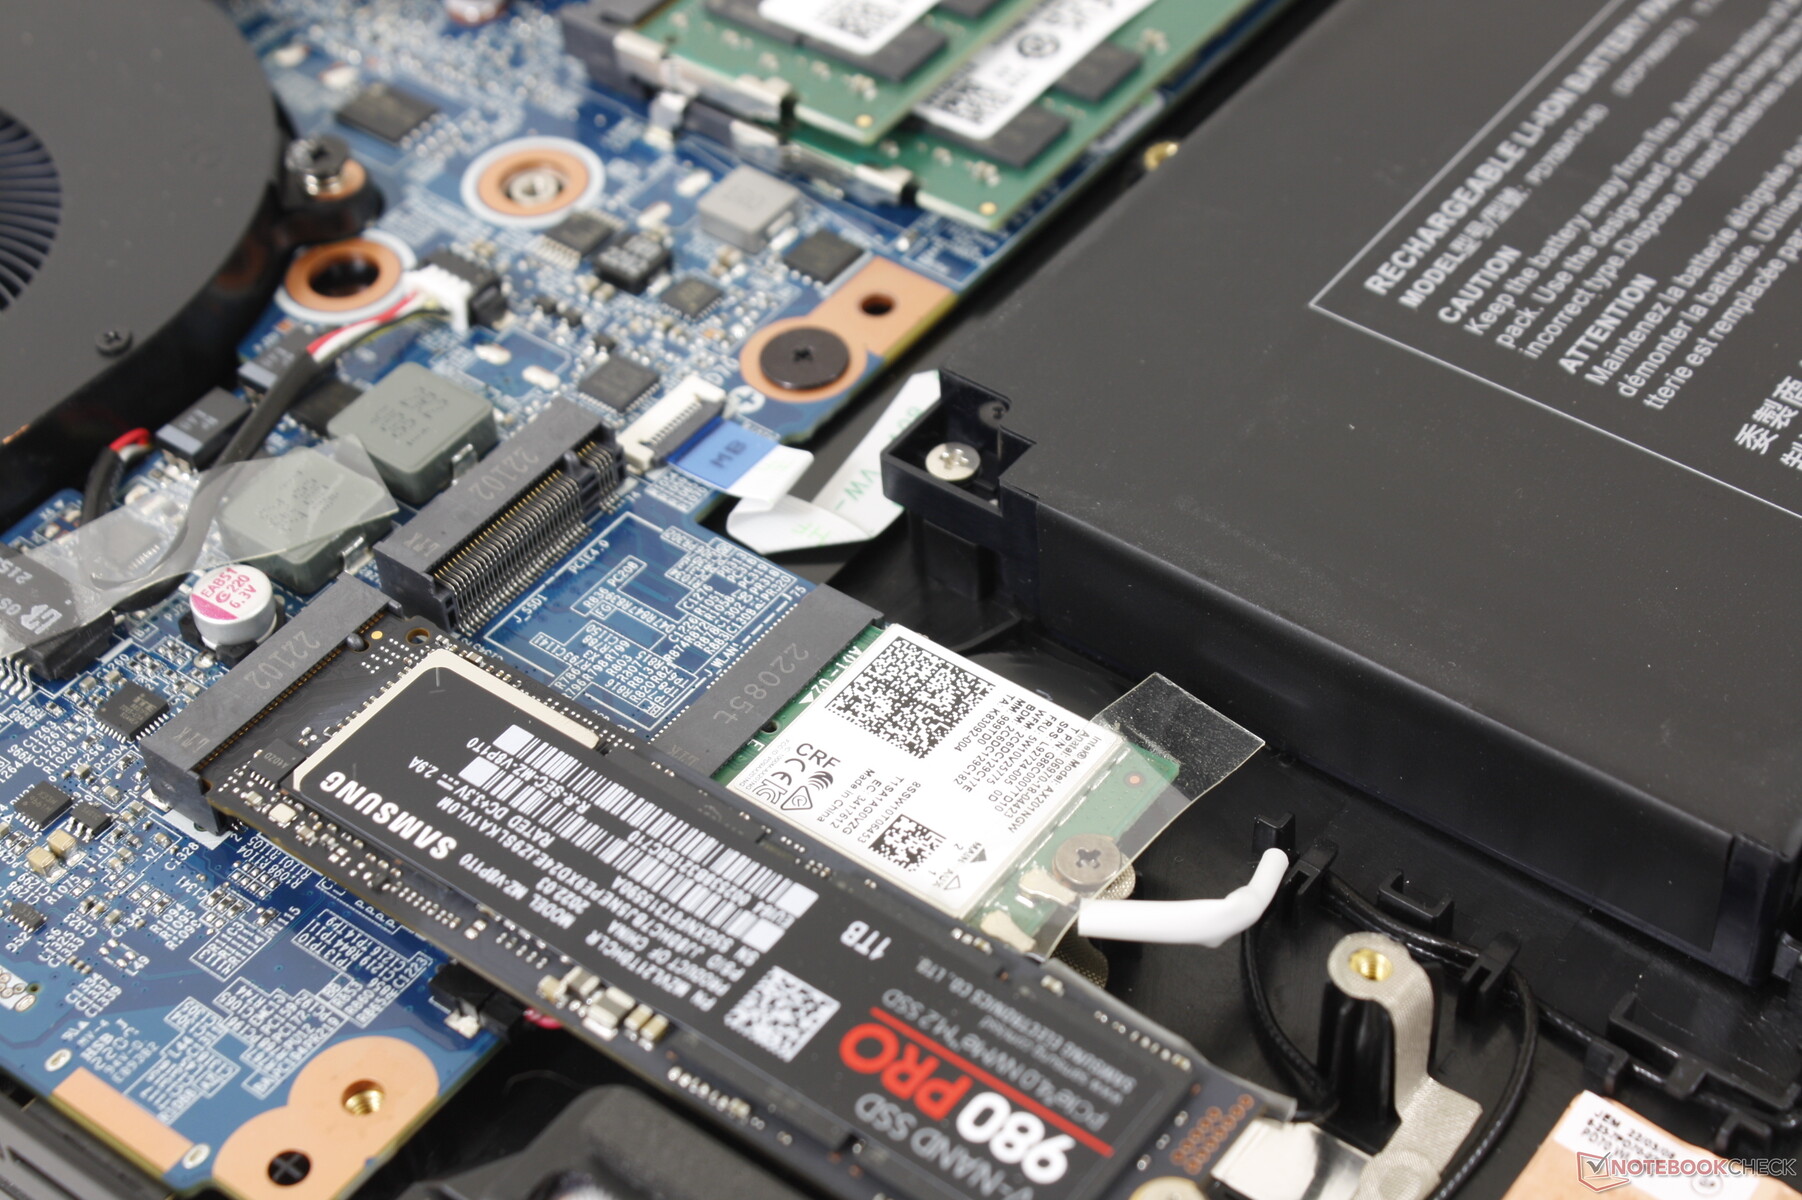
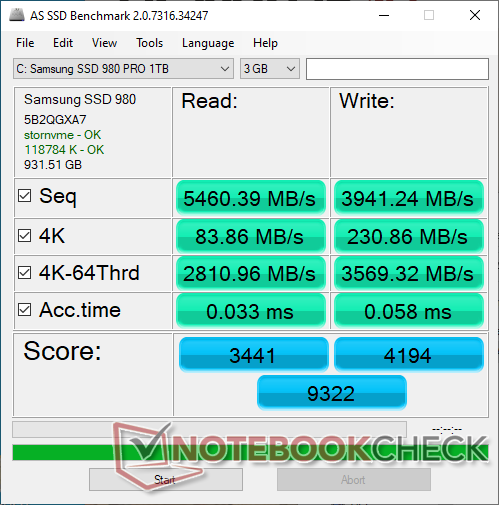
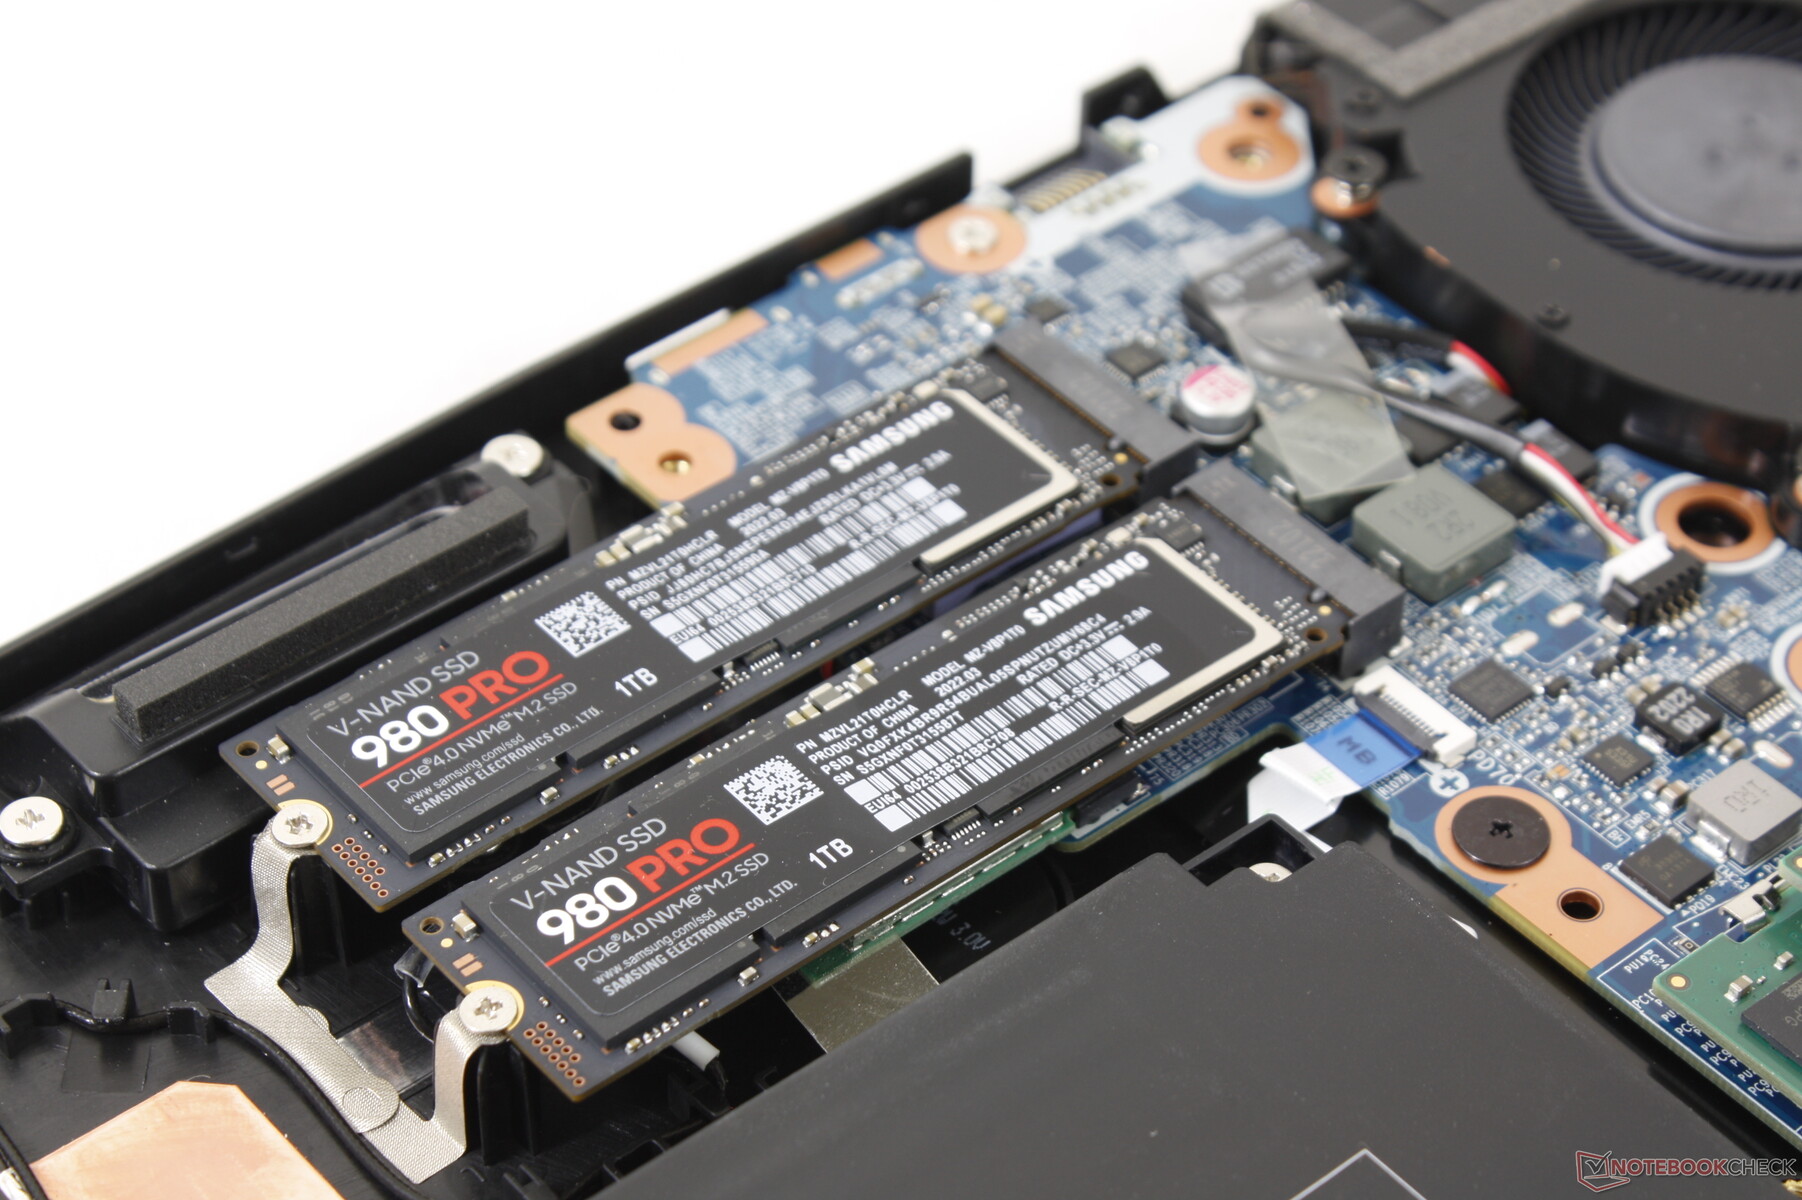
De twee interne M.2 2280 slots kunnen elk PCIe4 x4 SSD's ondersteunen voor waanzinnige snelheden, althans in theorie. In werkelijkheid zullen de drives echter waarschijnlijk vastlopen omdat het chassis geen ingebouwde warmteverdeler heeft voor de SSD's. De 1 TB Samsung 980 Pro PCIe4 x4 NVMe SSD in onze testunit daalde tot 1400 MB/s van een aanvankelijk hoge snelheid van 6800 MB/s bij het draaien van DiskSpd in een loop, zoals blijkt uit onze onderstaande grafiek. Dergelijke resultaten zijn over het algemeen acceptabel voor budget gaming laptops, maar ze zijn teleurstellend om te zien op high-end machines zoals deze.

| Drive Performance rating - Percent | |
| MSI Raider GE77 HX 12UHS | |
| Eurocom Nightsky TXi317 | |
| Aorus 17X XES | |
| Schenker XMG Pro 17 E22 | |
| Razer Blade 17 Early 2022 | |
| Alienware x17 R2 P48E | |
* ... kleiner is beter
Disk Throttling: DiskSpd Read Loop, Queue Depth 8
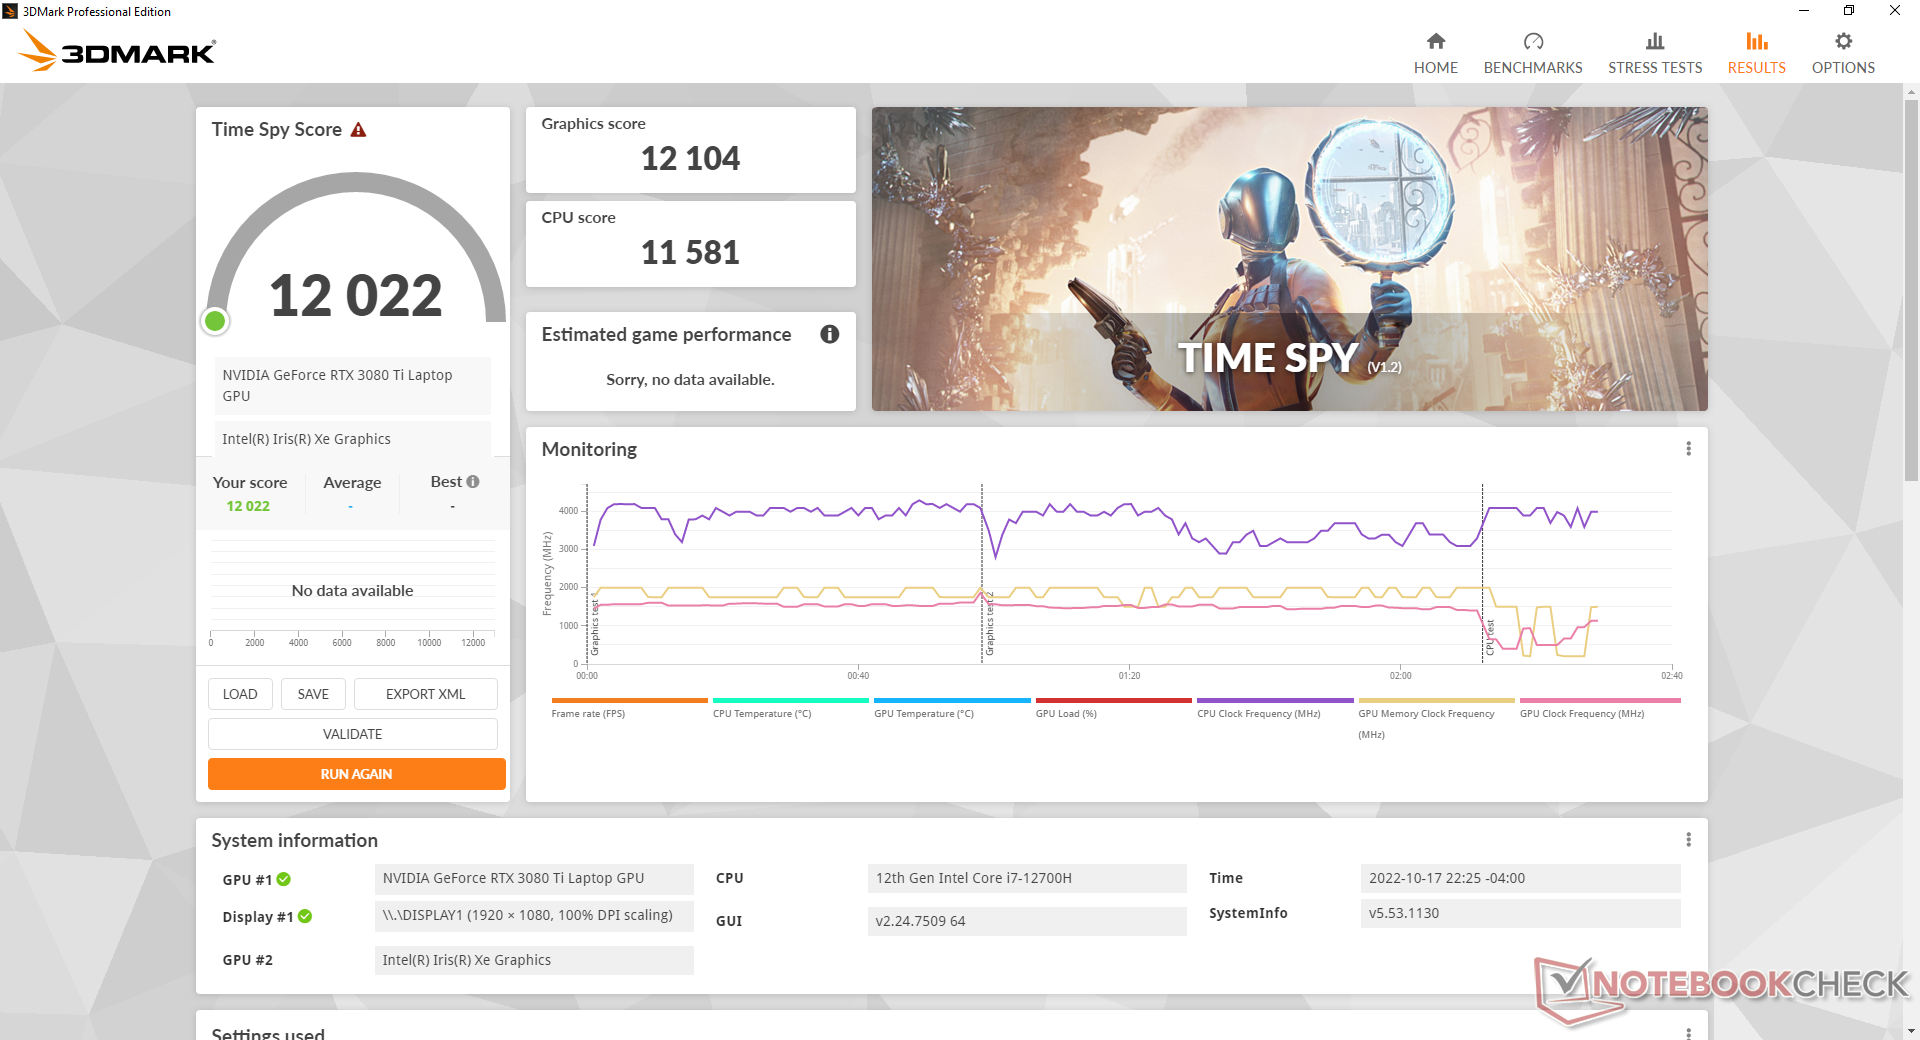
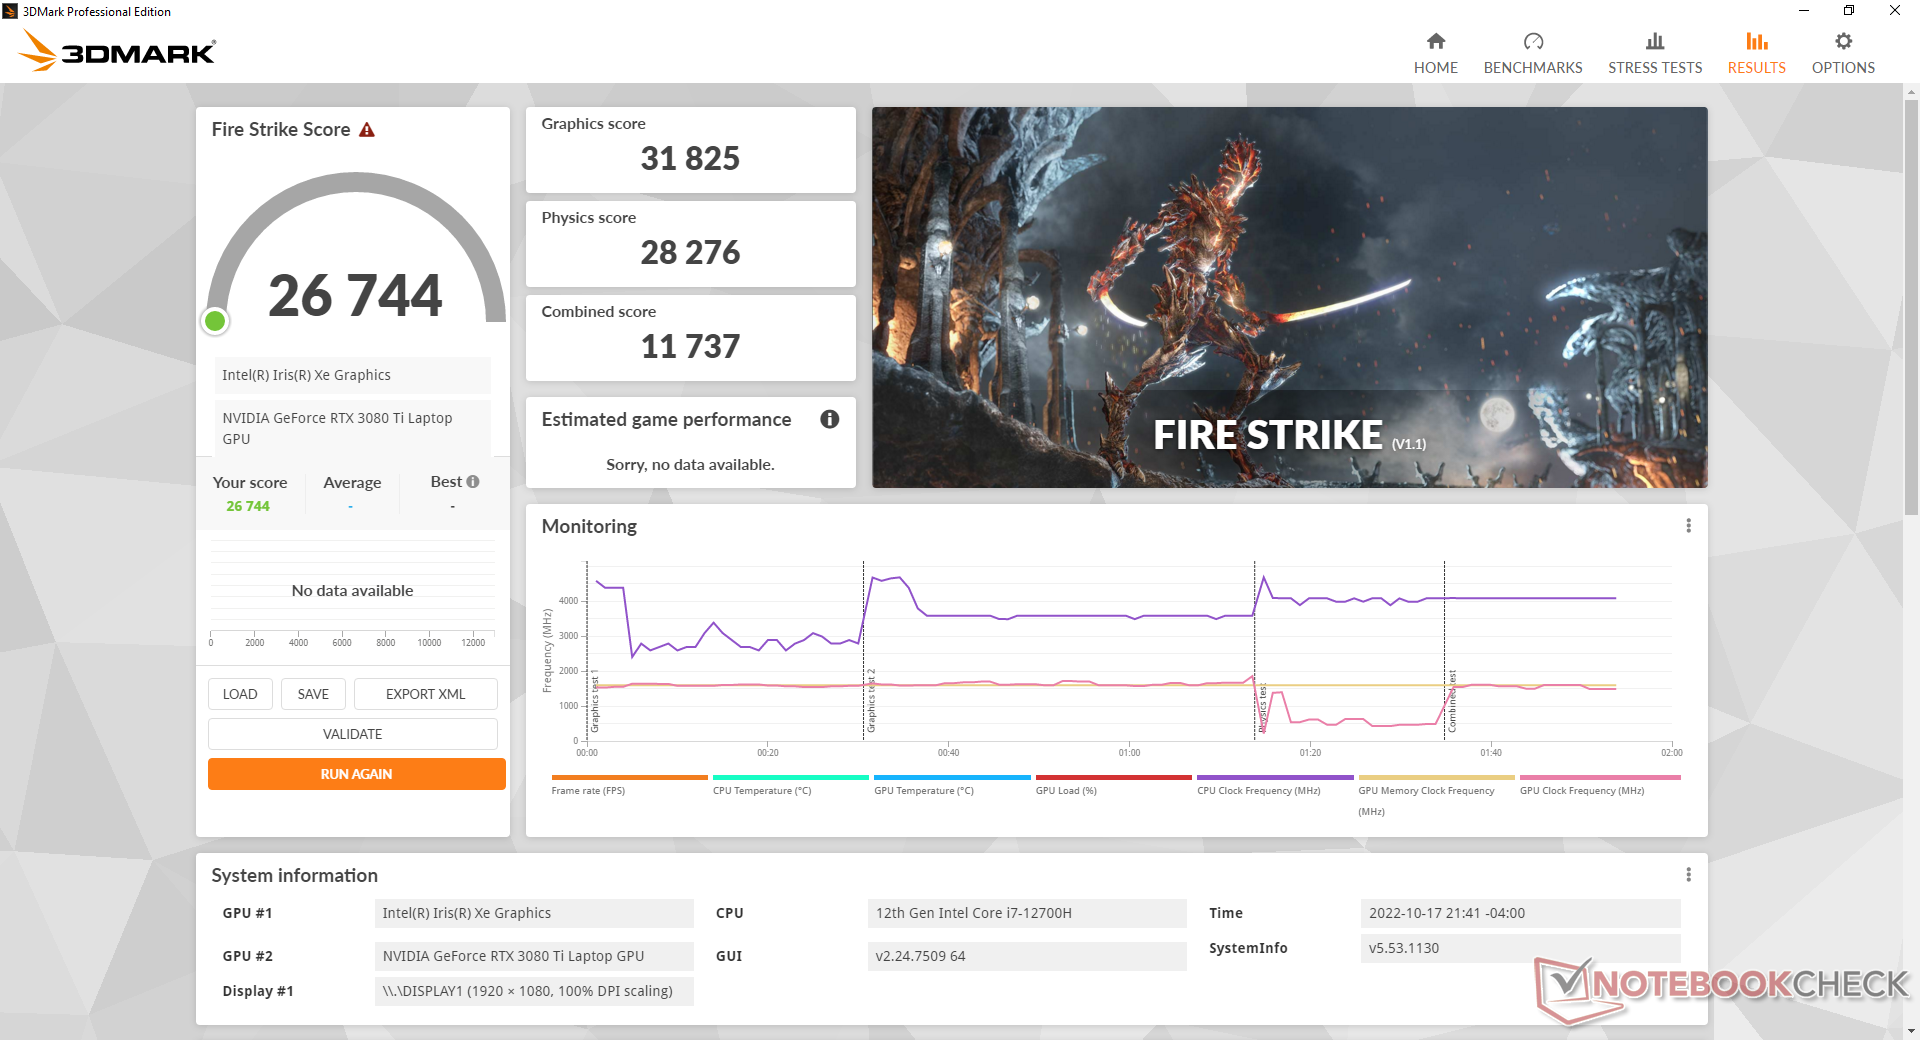
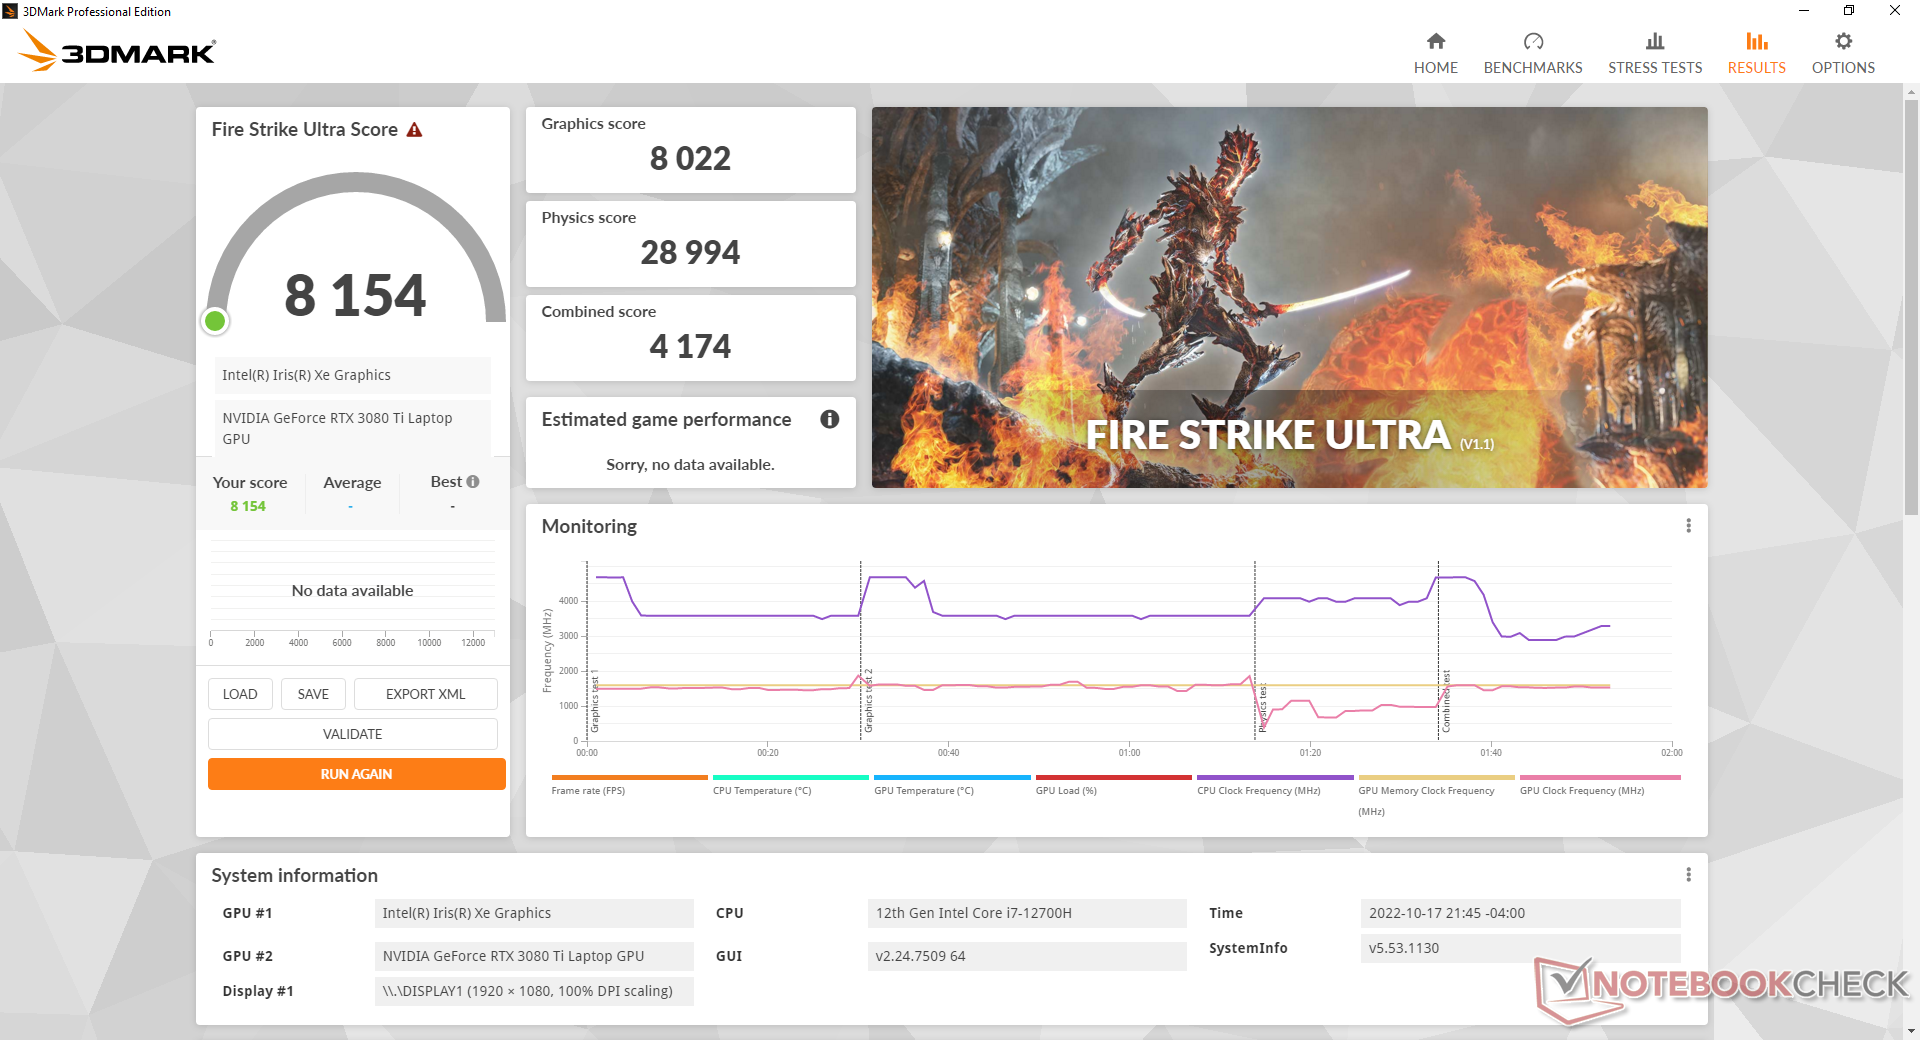
GPU-prestaties
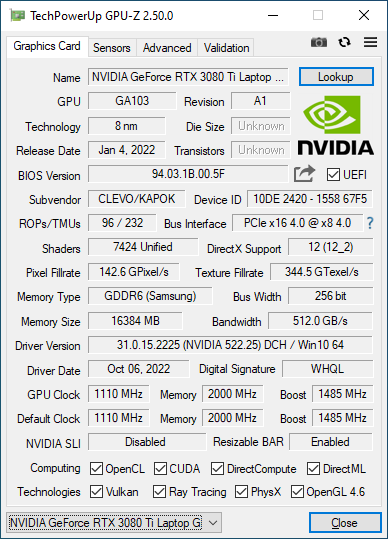
De grafische prestaties zijn uitstekend met resultaten die iets beter zijn dan die van de meeste andere laptops met dezelfde GeForce RTX 3080 Ti GPU. De 125 W TGP is niet de hoogste als de Alienware x17 R2 en zelfs de Razer Blade 17 hogere doelen hebben, maar het is in ieder geval hoger dan op veel ultradunne laptops zoals de MSI GS-serie.
Interessant is dat het Nvidia Control Panel een TGP van 155 W claimt, terwijl Eurocom een TGP van 125 W claimt. Het laatste getal lijkt het meer accurate doel te zijn, zoals onze Stress Test sectie hieronder zal laten zien.
Downgraden naar de GeForce RTX 3070 Ti zal de grafische prestaties slechts met ongeveer 10 procent beïnvloeden. De algemene prestaties zijn ongeveer 20 tot 30 procent langzamer dan onze referentie desktop GeForce RTX 3080.
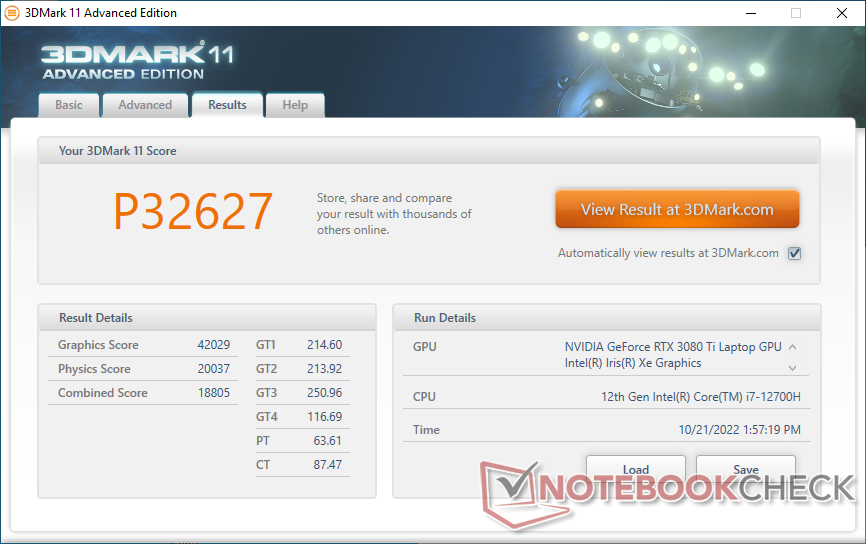
| 3DMark 11 Performance | 32627 punten | |
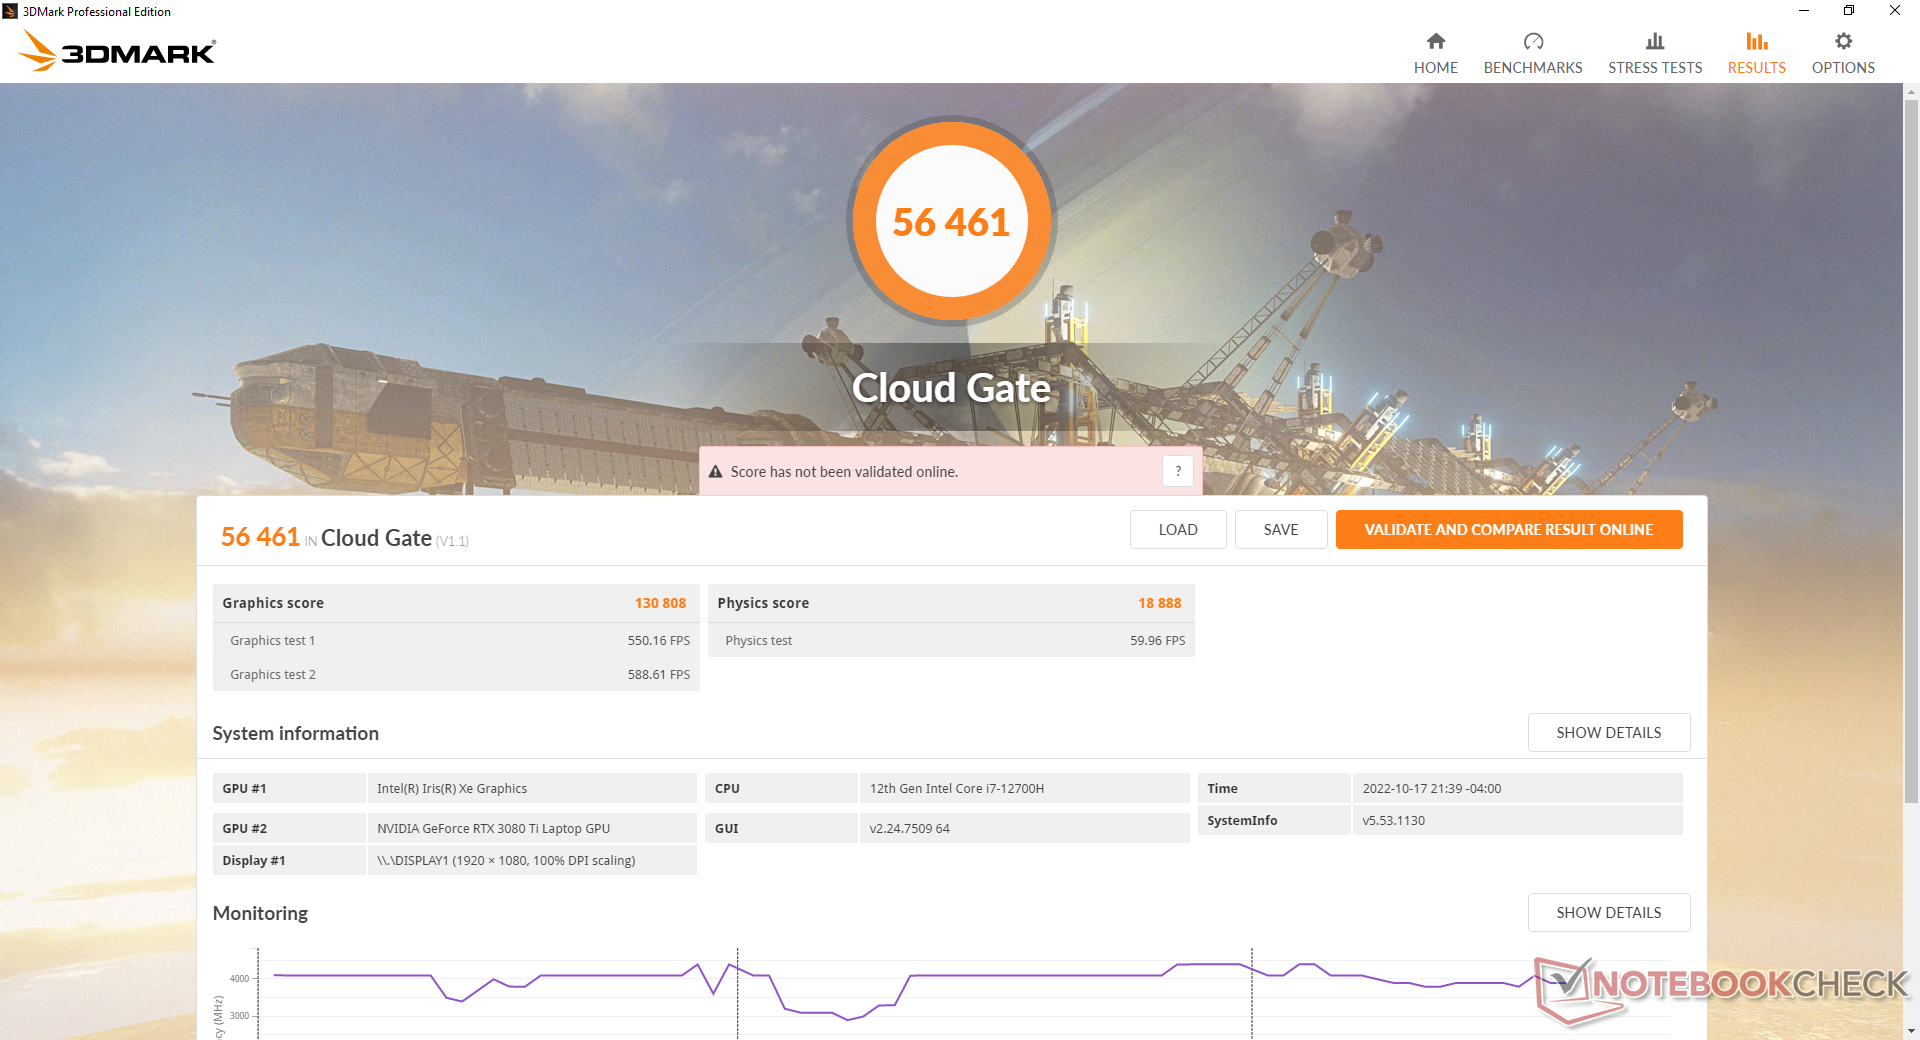
| 3DMark Cloud Gate Standard Score | 56461 punten | |
| 3DMark Fire Strike Score | 26744 punten | |
| 3DMark Time Spy Score | 12022 punten | |
Help | ||
* ... kleiner is beter
Witcher 3 FPS Chart
| lage | gem. | hoge | ultra | |
|---|---|---|---|---|
| GTA V (2015) | 186.2 | 181.3 | 169.5 | 107.4 |
| The Witcher 3 (2015) | 391.9 | 313.9 | 212.5 | 109.4 |
| Dota 2 Reborn (2015) | 176.1 | 157.9 | 148.6 | 140.8 |
| Final Fantasy XV Benchmark (2018) | 200 | 147.4 | 115.1 | |
| X-Plane 11.11 (2018) | 124.3 | 106.6 | 96.4 | |
| Strange Brigade (2018) | 416 | 273 | 226 | 199.8 |
| Cyberpunk 2077 1.6 (2022) | 135.4 | 123.2 | 96.2 | 80 |
Emissies
Systeemgeluid
De machine maakt bijna altijd enig ventilatorgeluid. De ventilatoren hebben de neiging om stationair te draaien op de desktop, maar zelfs de lichtste belastingen zoals surfen op het web veroorzaken een ventilatorgeluid van 30 dB(A) tegen een stille achtergrond van 23 dB(A). Ventilator geluid zou snel bereiken zijn maximum van 56 dB(A) bij het uitvoeren van meer veeleisende belastingen zoals 3DMark 06 of games, zelfs indien ingesteld op de Balanced power profiel. Dit is een gaming laptop die niet bang is om luid, ongeacht de macht profiel instelling.
De meeste andere 17-inch gaming laptops bereiken ook de 50 dB(A) of luider bereik wanneer onder soortgelijke omstandigheden en dus dit probleem is niet uniek voor Eurocom. Niettemin heeft de Eurocom machine de neiging om plotseling en sneller luider te worden.
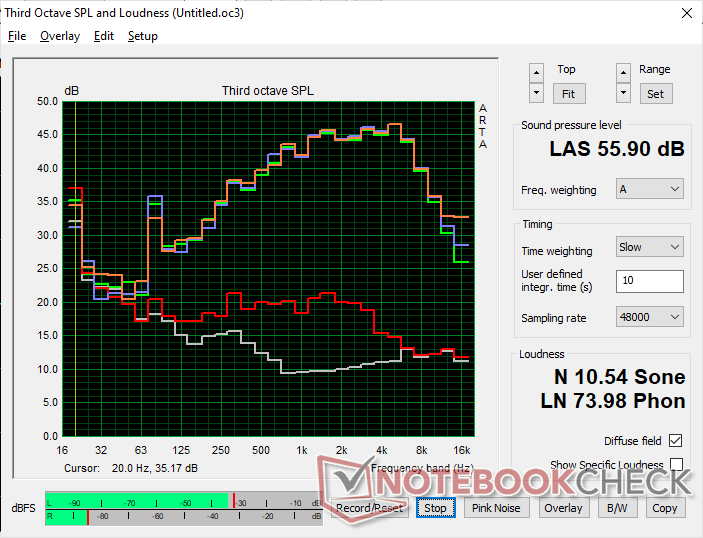
Geluidsniveau
| Onbelast |
| 23.3 / 30.7 / 30.7 dB (A) |
| Belasting |
| 56.2 / 55.9 dB (A) |
 | ||
30 dB stil 40 dB(A) hoorbaar 50 dB(A) luid |
||
min: | ||
| Eurocom Nightsky TXi317 GeForce RTX 3080 Ti Laptop GPU, i7-12700H, Samsung SSD 980 Pro 1TB MZ-V8P1T0BW | Schenker XMG Pro 17 E22 GeForce RTX 3080 Ti Laptop GPU, i9-12900H, Samsung SSD 980 Pro 1TB MZ-V8P1T0BW | Aorus 17X XES GeForce RTX 3070 Ti Laptop GPU, i9-12900HX, Gigabyte AG470S1TB-SI B10 | MSI Raider GE77 HX 12UHS GeForce RTX 3080 Ti Laptop GPU, i9-12900HX, Samsung PM9A1 MZVL22T0HBLB | Razer Blade 17 Early 2022 GeForce RTX 3080 Ti Laptop GPU, i9-12900H, Samsung PM9A1 MZVL21T0HCLR | Alienware x17 R2 P48E GeForce RTX 3080 Ti Laptop GPU, i9-12900HK, 2x Samsung PM9A1 1TB (RAID 0) | |
|---|---|---|---|---|---|---|
| Noise | -12% | -7% | -11% | 2% | 16% | |
| uit / omgeving * (dB) | 23.3 | 26 -12% | 26 -12% | 26 -12% | 26 -12% | 22.7 3% |
| Idle Minimum * (dB) | 23.3 | 26 -12% | 28 -20% | 26 -12% | 26 -12% | 23.1 1% |
| Idle Average * (dB) | 30.7 | 34 -11% | 32 -4% | 34 -11% | 27 12% | 23.1 25% |
| Idle Maximum * (dB) | 30.7 | 42 -37% | 38 -24% | 46 -50% | 32 -4% | 23.1 25% |
| Load Average * (dB) | 56.2 | 58 -3% | 53 6% | 50 11% | 50 11% | 31.9 43% |
| Witcher 3 ultra * (dB) | 56.1 | 57 -2% | 54 4% | 55 2% | 51 9% | 52.5 6% |
| Load Maximum * (dB) | 55.9 | 58 -4% | 55 2% | 57 -2% | 51 9% | 52.5 6% |
* ... kleiner is beter
Temperatuur
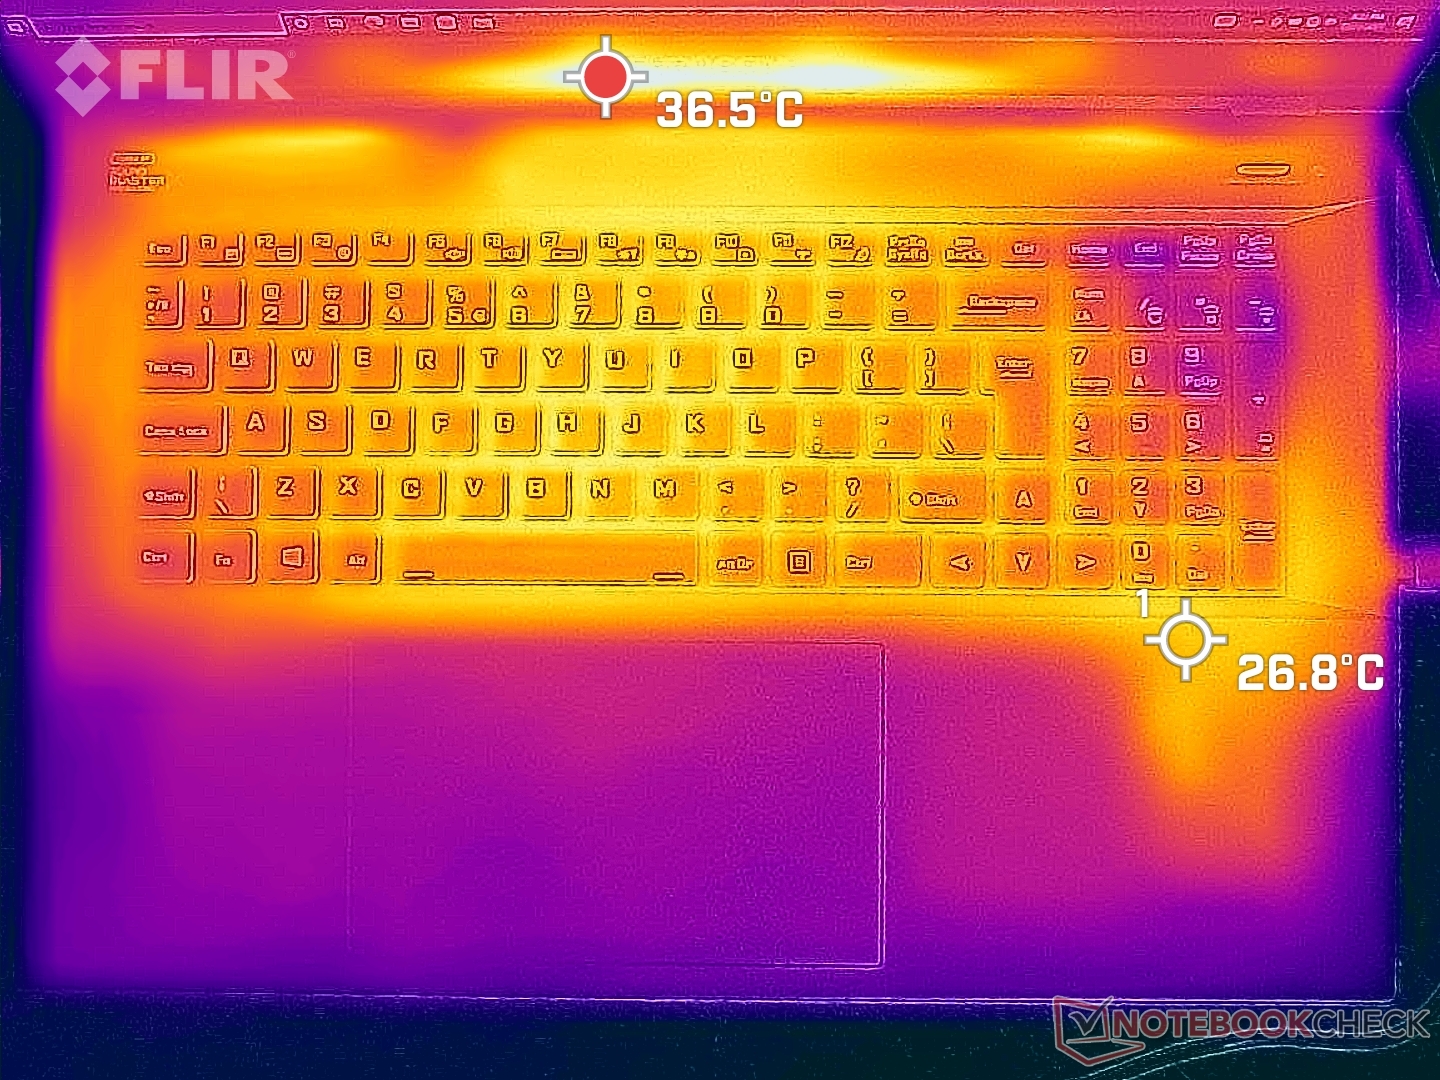
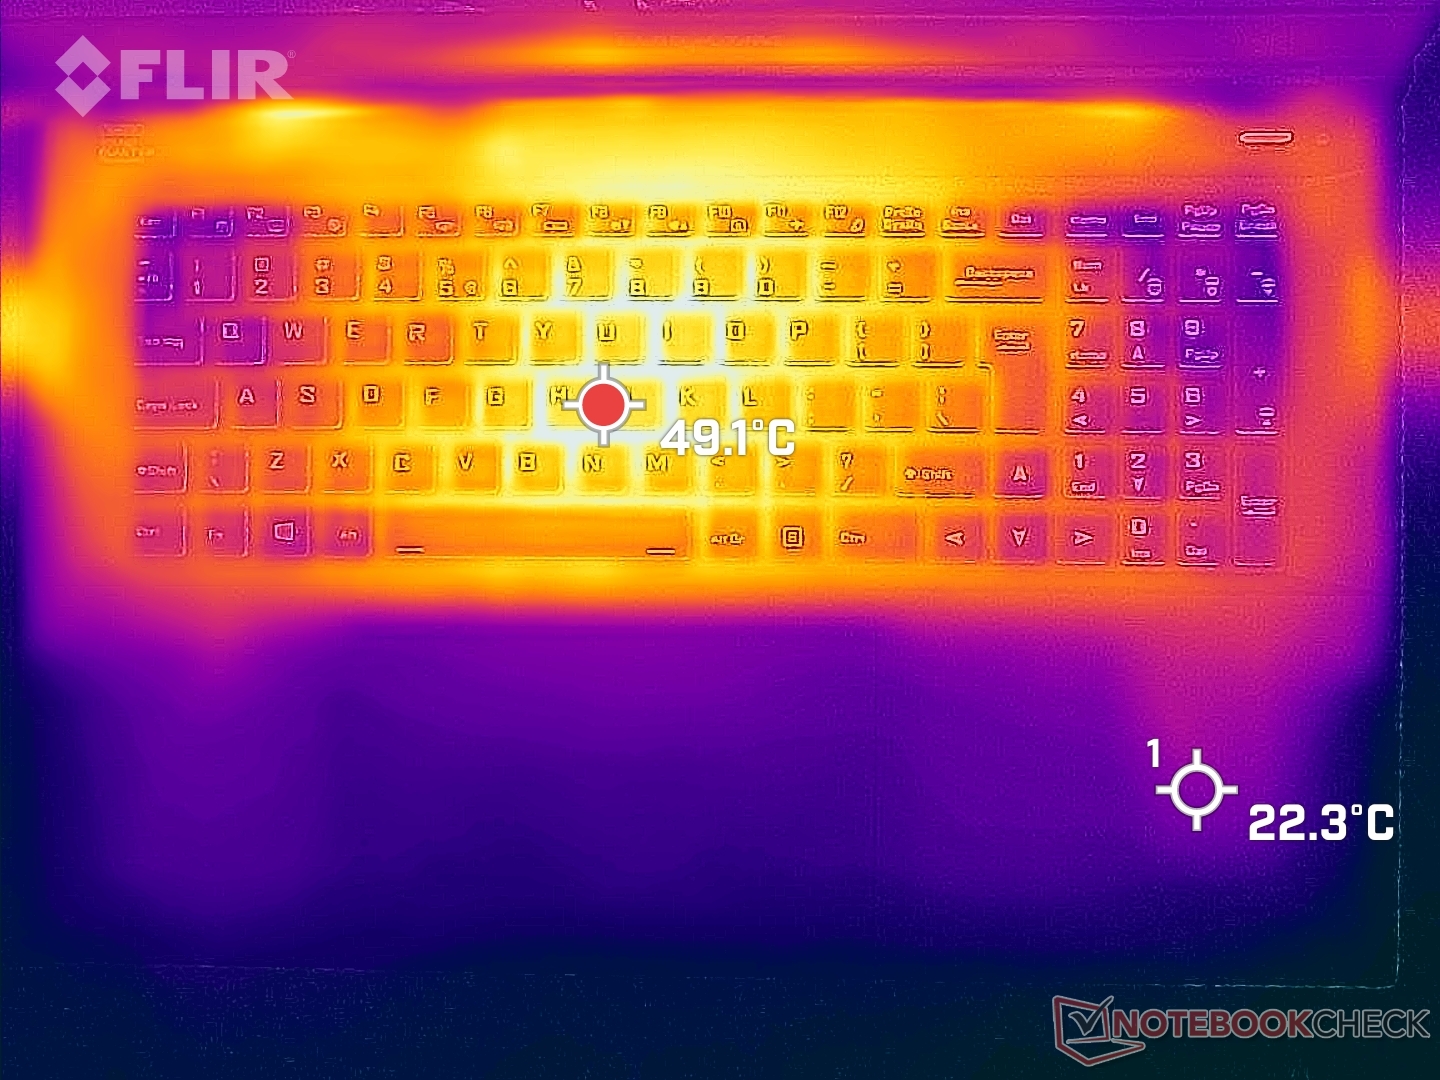
De oppervlaktetemperaturen zijn het warmst in het midden van het toetsenbord, terwijl de palmsteunen veel koeler zijn voor comfortabeler gamen. Dunnere laptops zoals de Razer Blade 17 hebben merkbaar warmere palmsteunen die oncomfortabeler zijn voor de hand
Merk op dat de rechterpalmsteun op de Nightsky TXi317 altijd iets warmer zal zijn dan de linkerpalmsteun, omdat de M.2 SSD's zich onder de rechterpalmsteun bevinden.
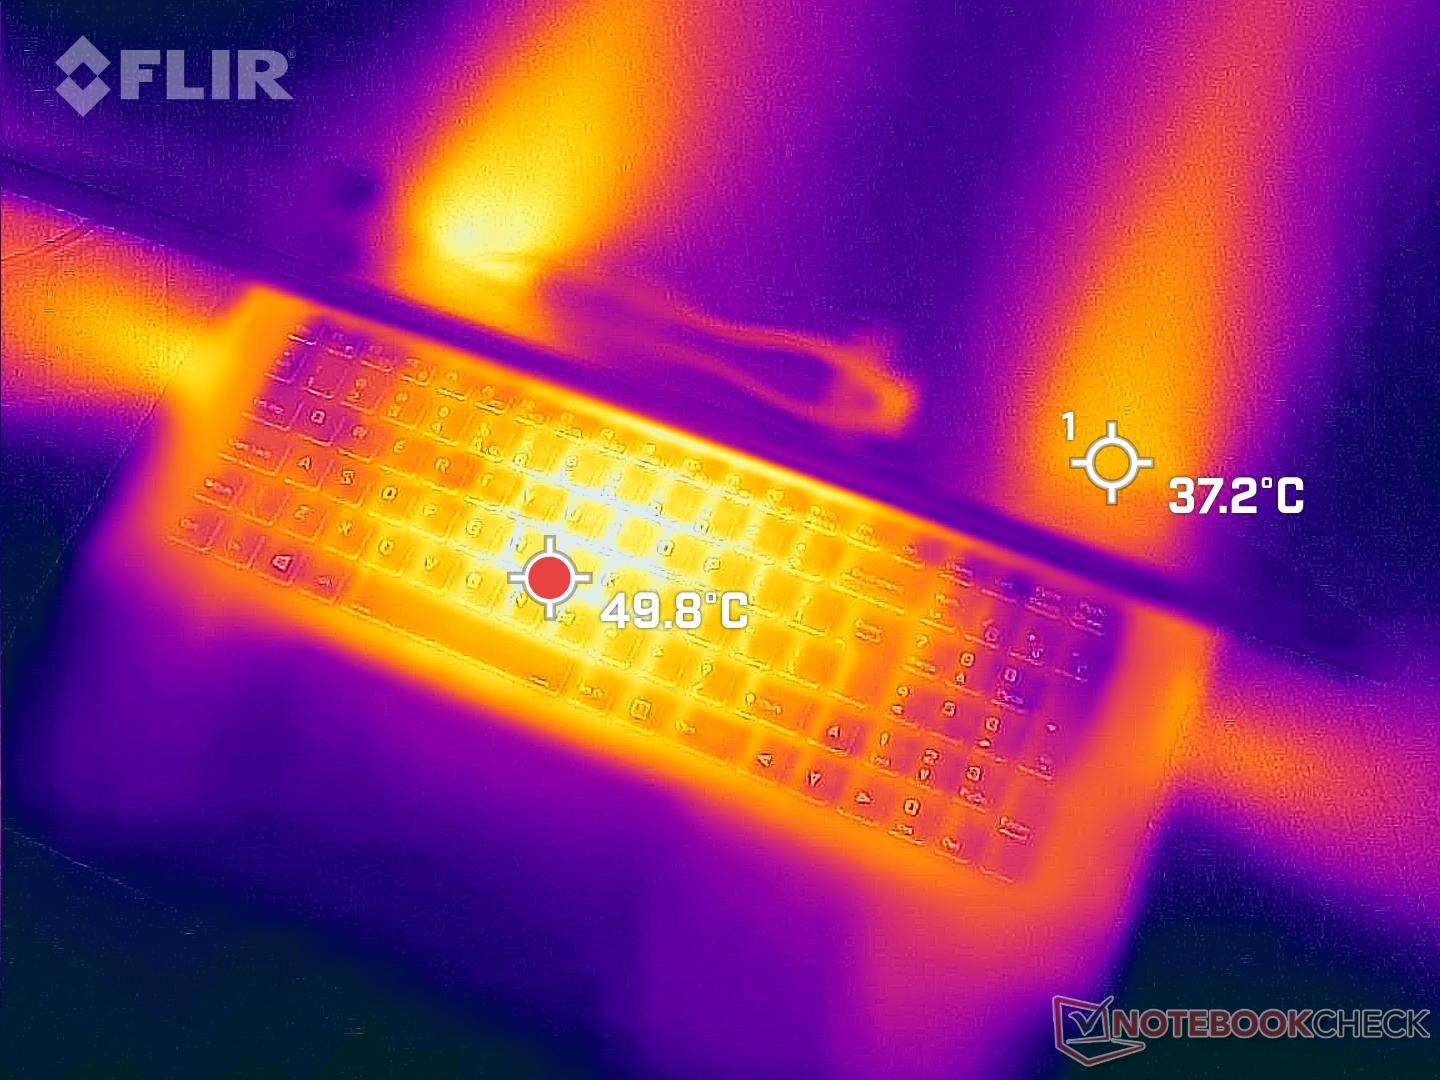
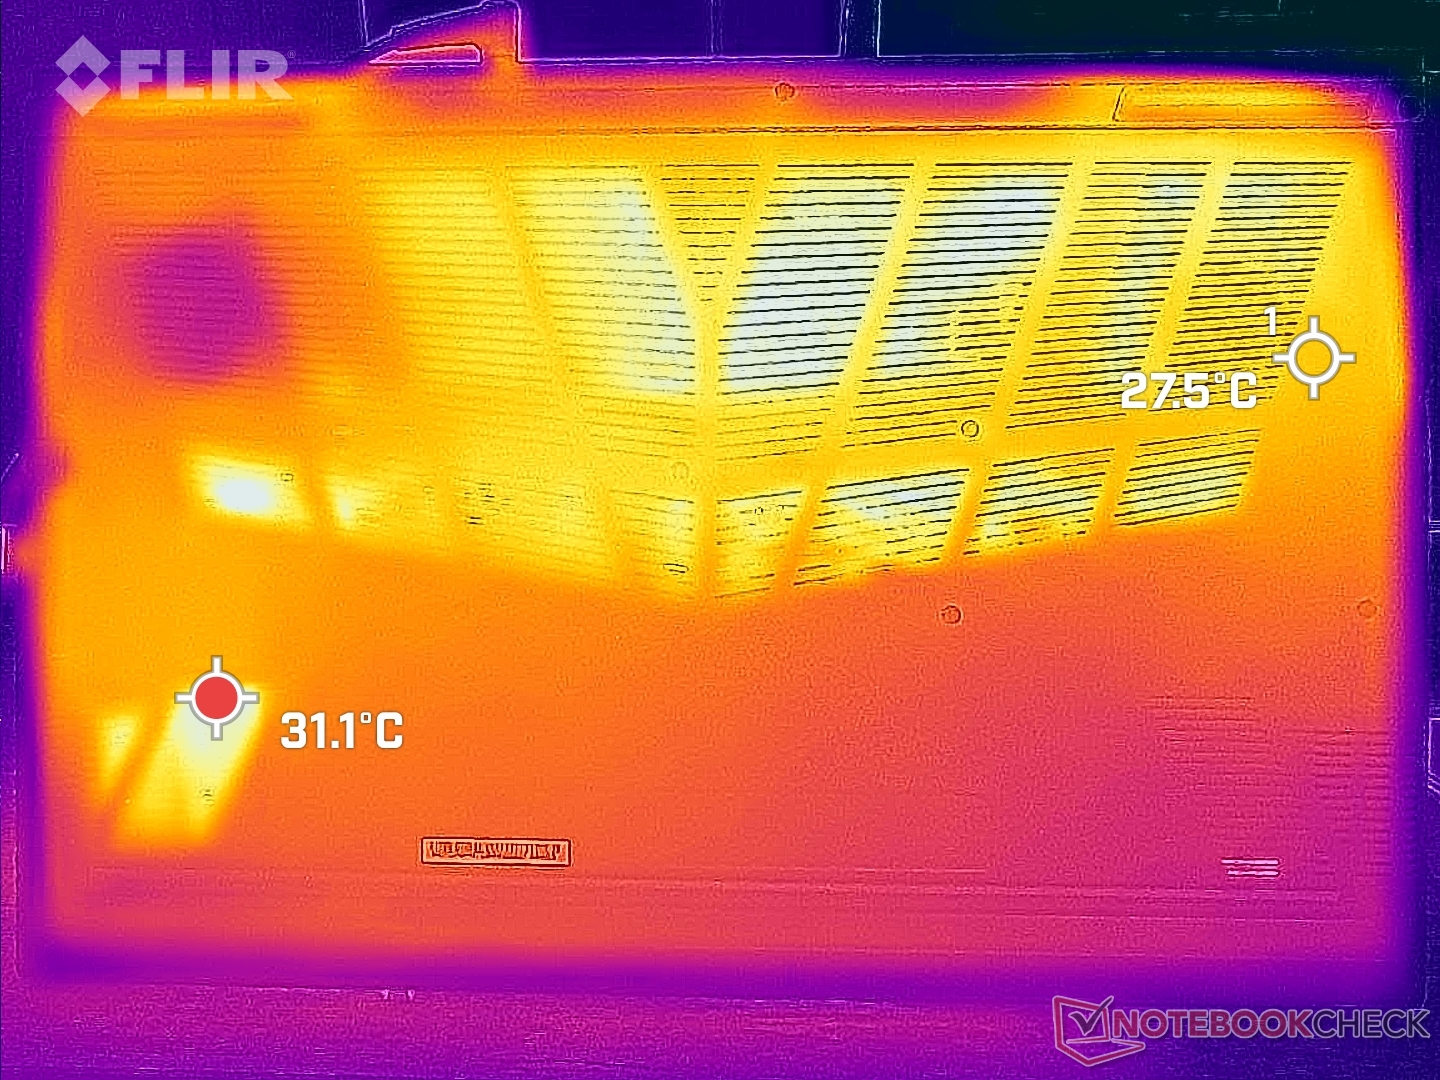
(-) De maximumtemperatuur aan de bovenzijde bedraagt 50.4 °C / 123 F, vergeleken met het gemiddelde van 40.4 °C / 105 F, variërend van 21.2 tot 68.8 °C voor de klasse Gaming.
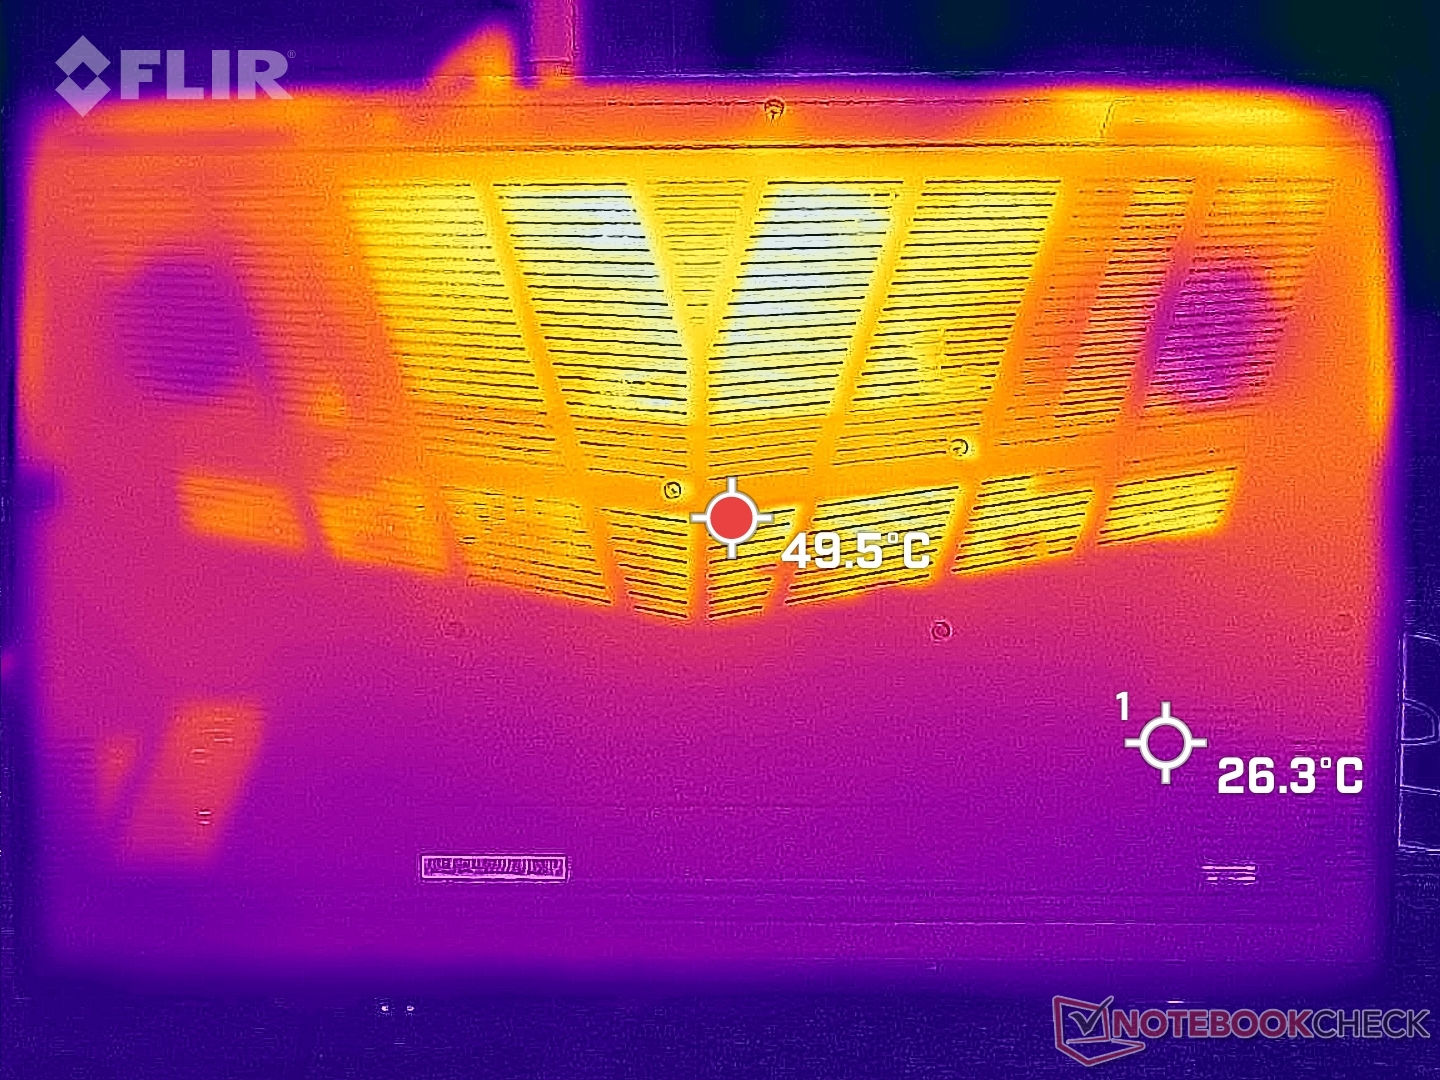
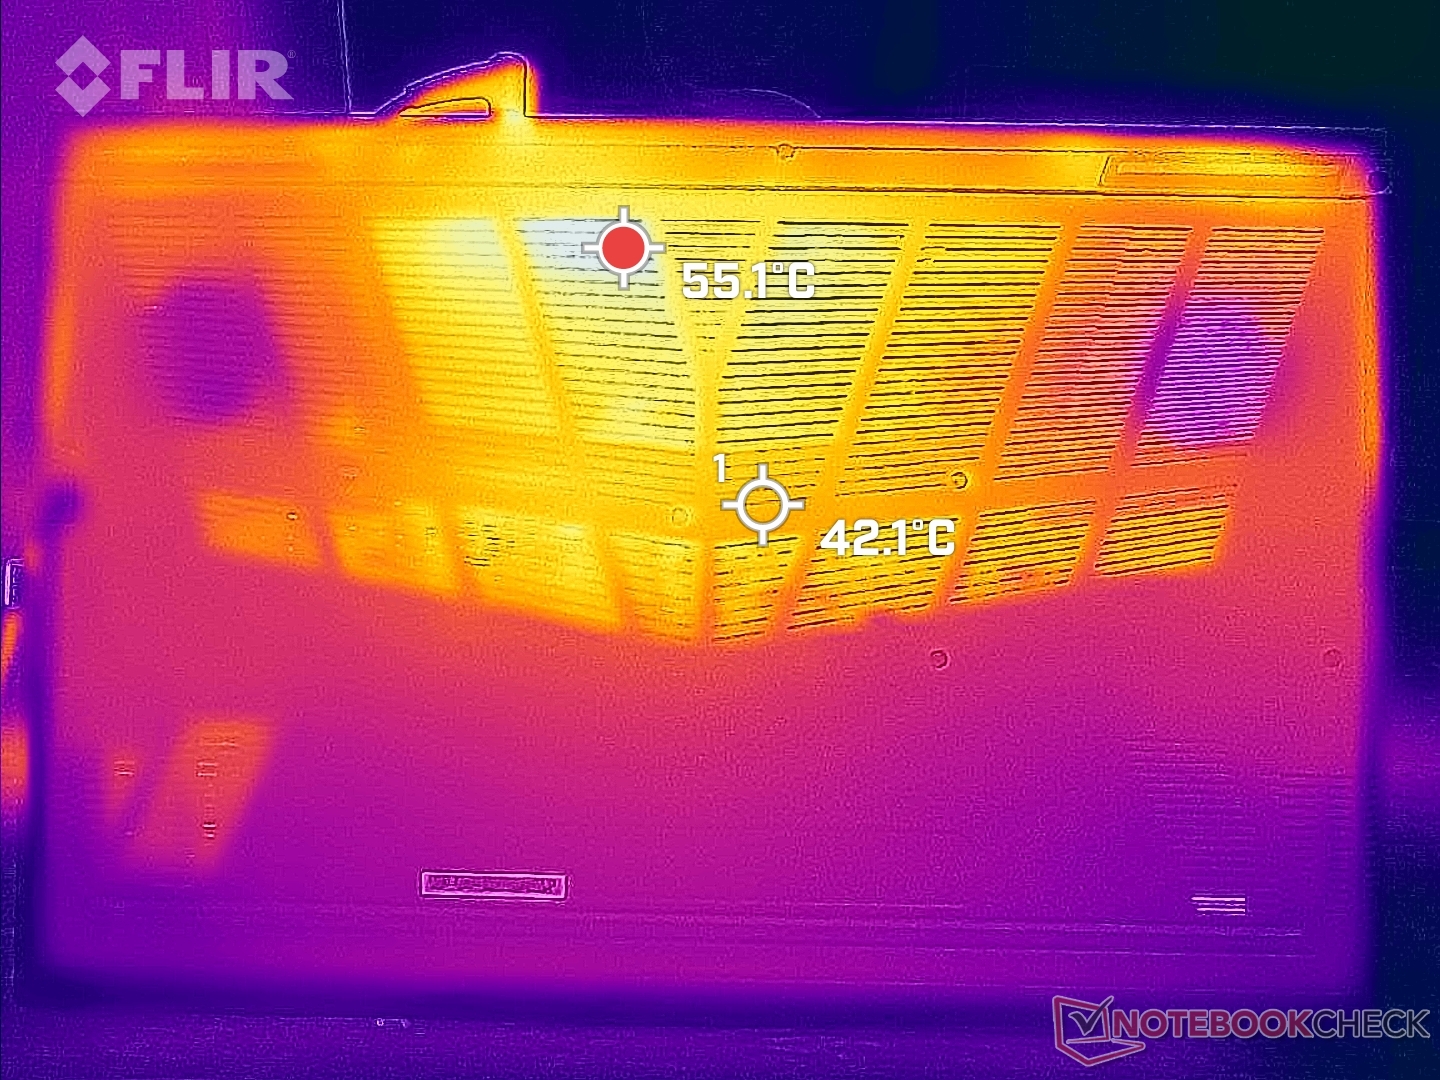
(-) De bodem warmt op tot een maximum van 47.6 °C / 118 F, vergeleken met een gemiddelde van 43.2 °C / 110 F
(+) Bij onbelast gebruik bedraagt de gemiddelde temperatuur voor de bovenzijde 29.4 °C / 85 F, vergeleken met het apparaatgemiddelde van 33.9 °C / 93 F.
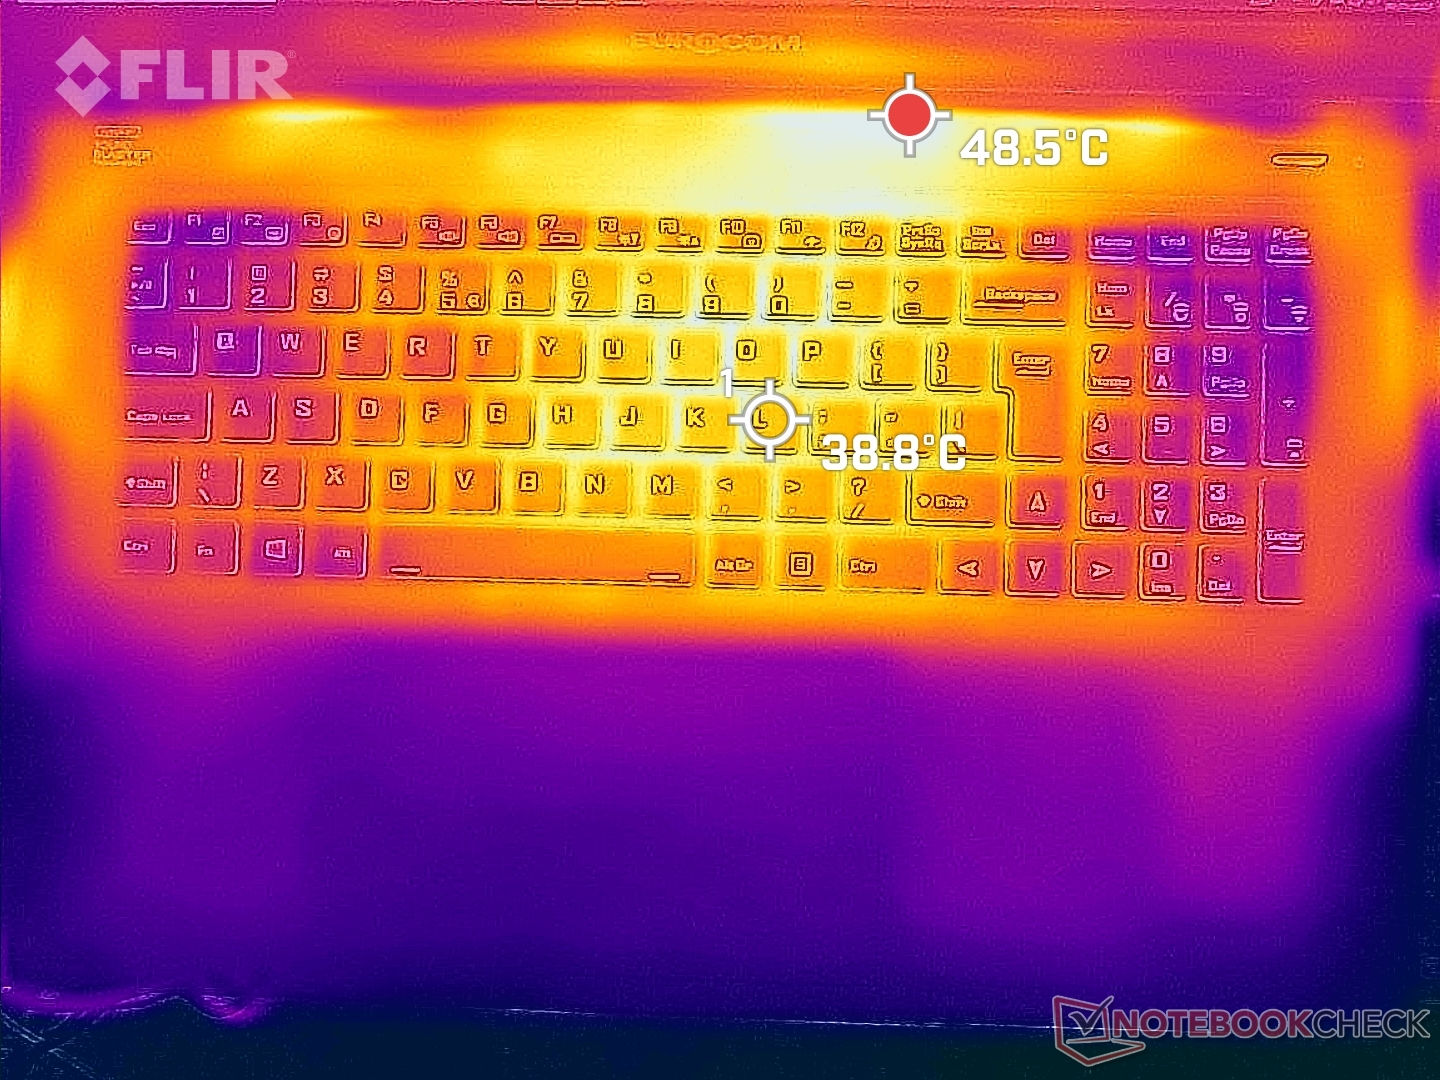
(-) Bij het spelen van The Witcher 3 is de gemiddelde temperatuur voor de bovenzijde 39.2 °C / 103 F, vergeleken met het apparaatgemiddelde van 33.9 °C / 93 F.
(+) De palmsteunen en het touchpad zijn met een maximum van ###max## °C / 88.2 F koeler dan de huidtemperatuur en voelen daarom koel aan.
(-) De gemiddelde temperatuur van de handpalmsteun van soortgelijke toestellen bedroeg 28.8 °C / 83.8 F (-2.4 °C / -4.4 F).
| Eurocom Nightsky TXi317 Intel Core i7-12700H, NVIDIA GeForce RTX 3080 Ti Laptop GPU | Schenker XMG Pro 17 E22 Intel Core i9-12900H, NVIDIA GeForce RTX 3080 Ti Laptop GPU | Aorus 17X XES Intel Core i9-12900HX, NVIDIA GeForce RTX 3070 Ti Laptop GPU | MSI Raider GE77 HX 12UHS Intel Core i9-12900HX, NVIDIA GeForce RTX 3080 Ti Laptop GPU | Razer Blade 17 Early 2022 Intel Core i9-12900H, NVIDIA GeForce RTX 3080 Ti Laptop GPU | Alienware x17 R2 P48E Intel Core i9-12900HK, NVIDIA GeForce RTX 3080 Ti Laptop GPU | |
|---|---|---|---|---|---|---|
| Heat | -12% | -15% | -19% | -10% | 7% | |
| Maximum Upper Side * (°C) | 50.4 | 56 -11% | 54 -7% | 53 -5% | 50 1% | 49.6 2% |
| Maximum Bottom * (°C) | 47.6 | 60 -26% | 58 -22% | 58 -22% | 56 -18% | 42.4 11% |
| Idle Upper Side * (°C) | 32.6 | 34 -4% | 37 -13% | 38 -17% | 36 -10% | 29.2 10% |
| Idle Bottom * (°C) | 33.2 | 36 -8% | 39 -17% | 43 -30% | 38 -14% | 32 4% |
* ... kleiner is beter
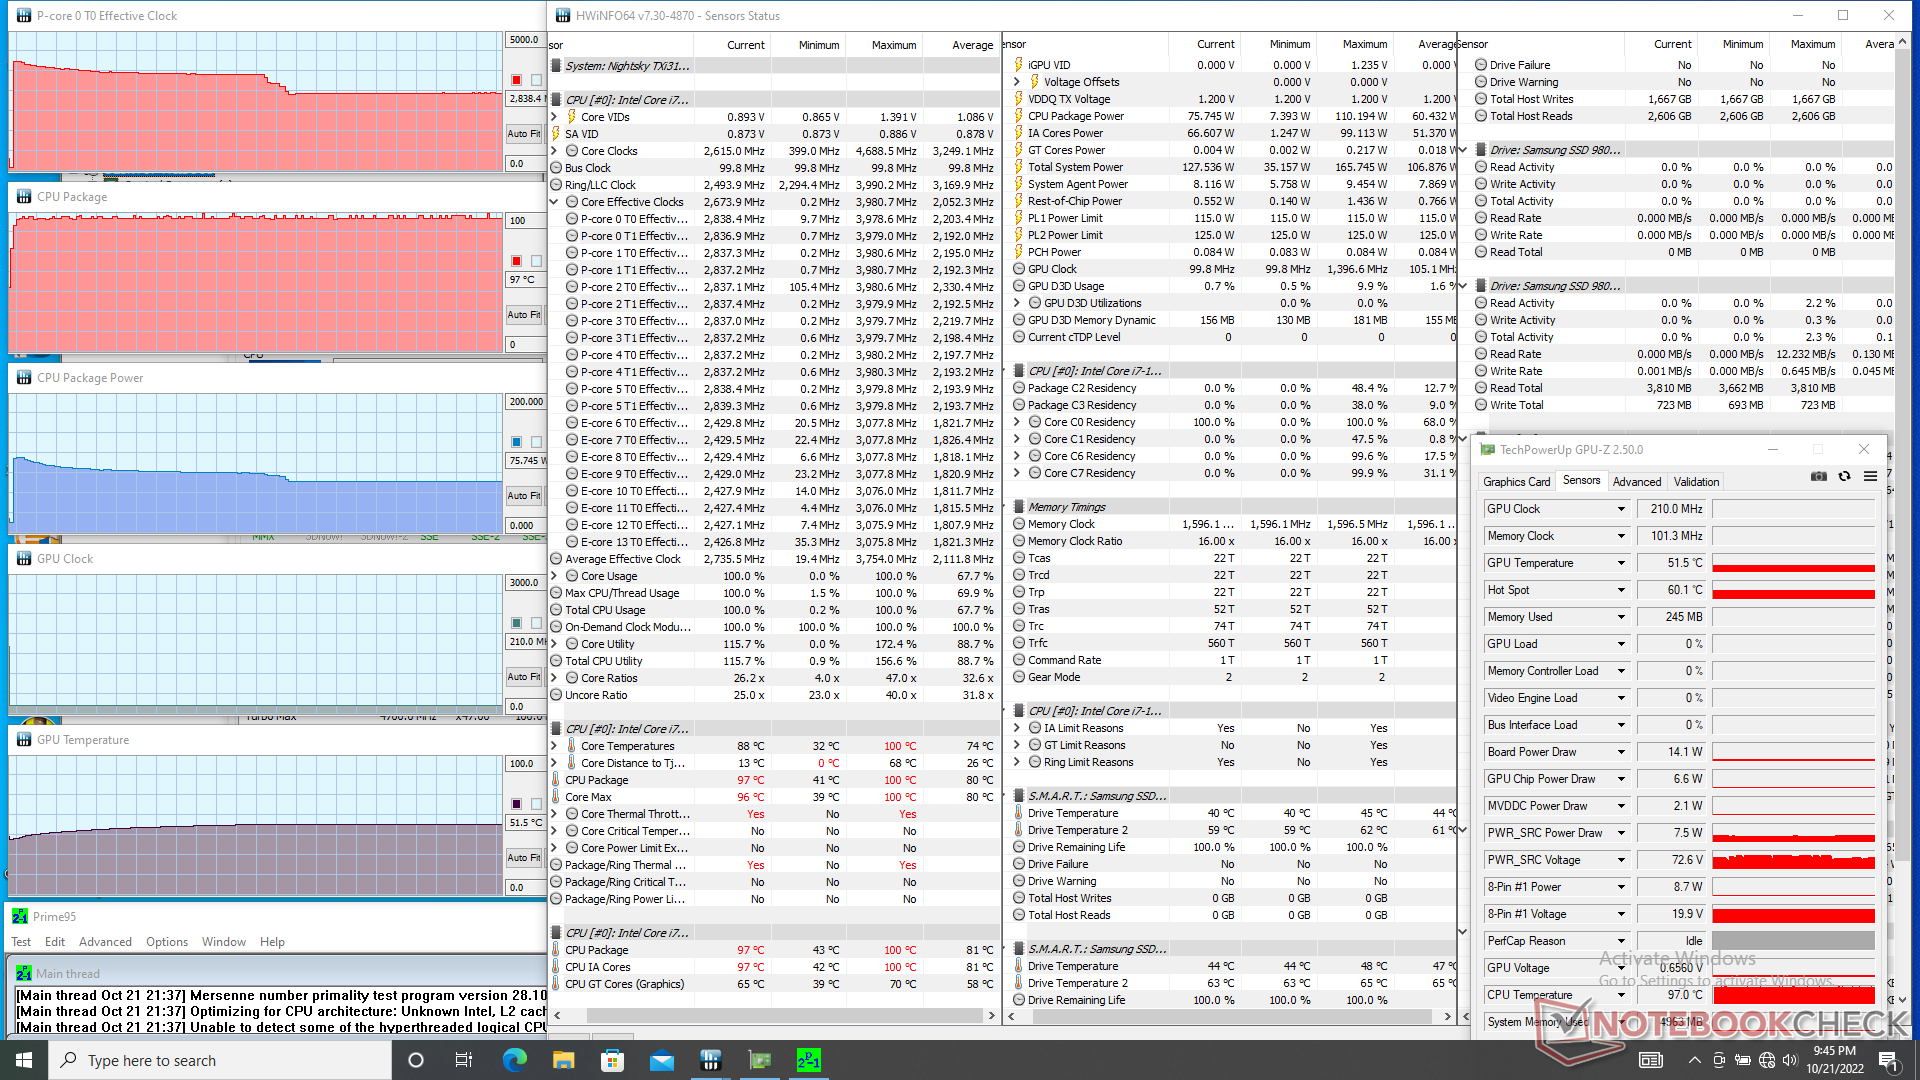
Stresstest
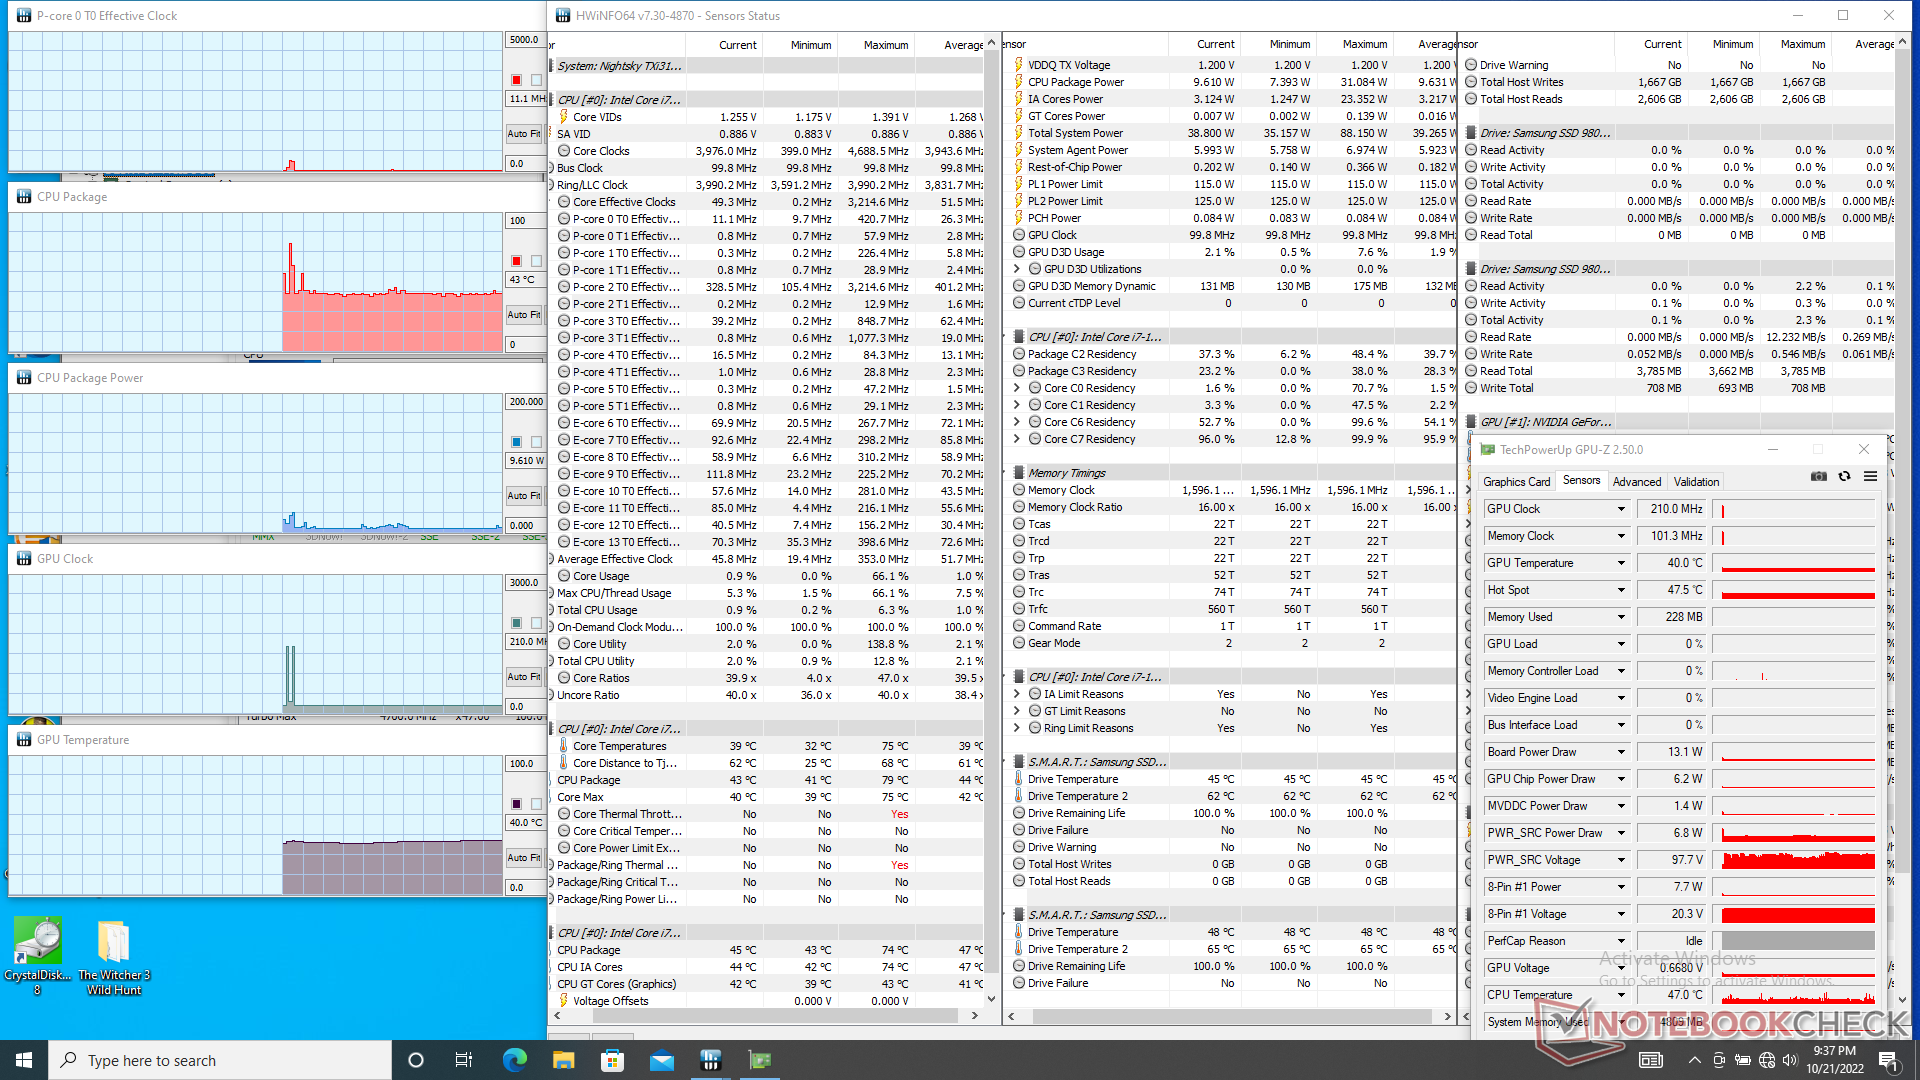
CPU kloksnelheden, temperatuur en stroomverbruik op het bord zouden pieken tot respectievelijk 4 GHz, 97 C en 110 W bij het starten van Prime95 stress. De kloksnelheden en het opgenomen vermogen daalden daarna gestaag en stabiliseerden zich op respectievelijk 2,8 GHz en 76 W, zonder veranderingen in de kerntemperatuur. Het herhalen van deze test op deDell G16 7620 met een identieke processor zou resulteren in iets hogere stabiele kloksnelheden van ongeveer 3,3 GHz, maar vergelijkbare kerntemperaturen van bijna 100 C.
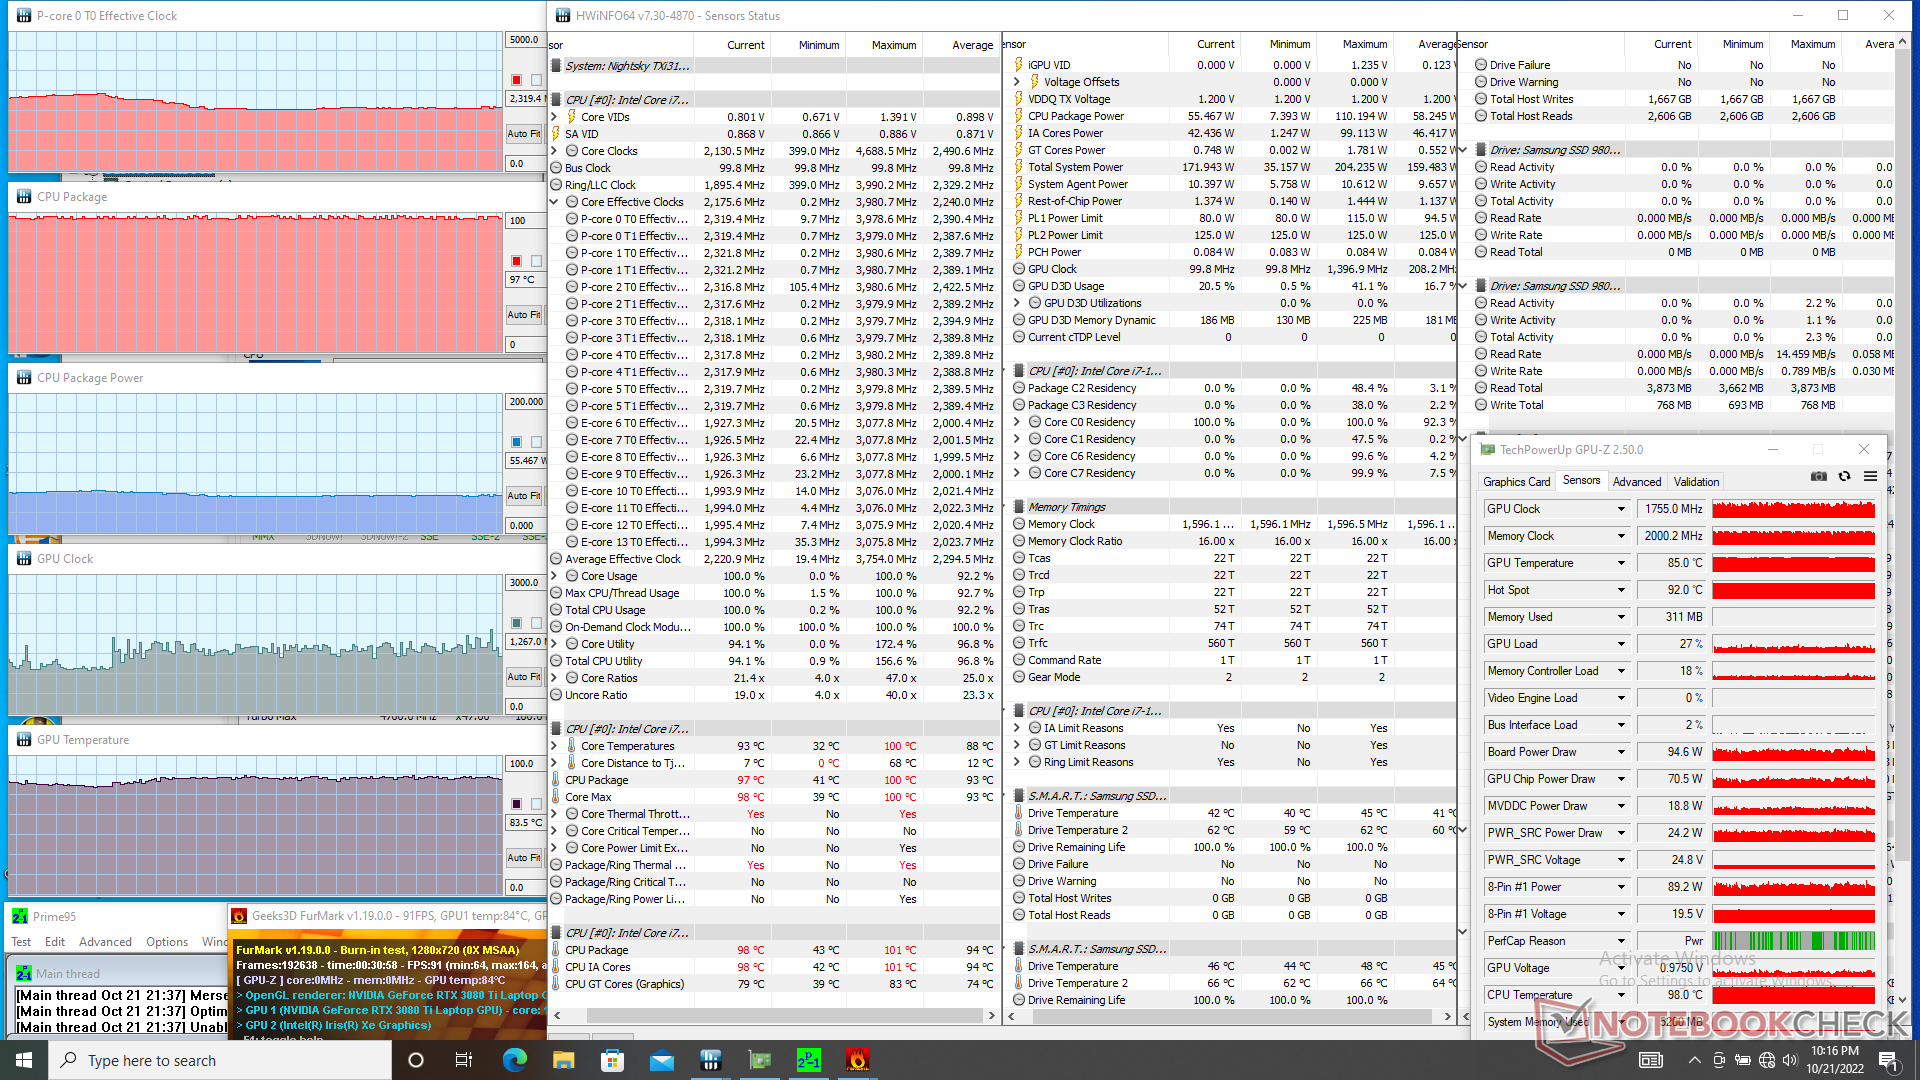
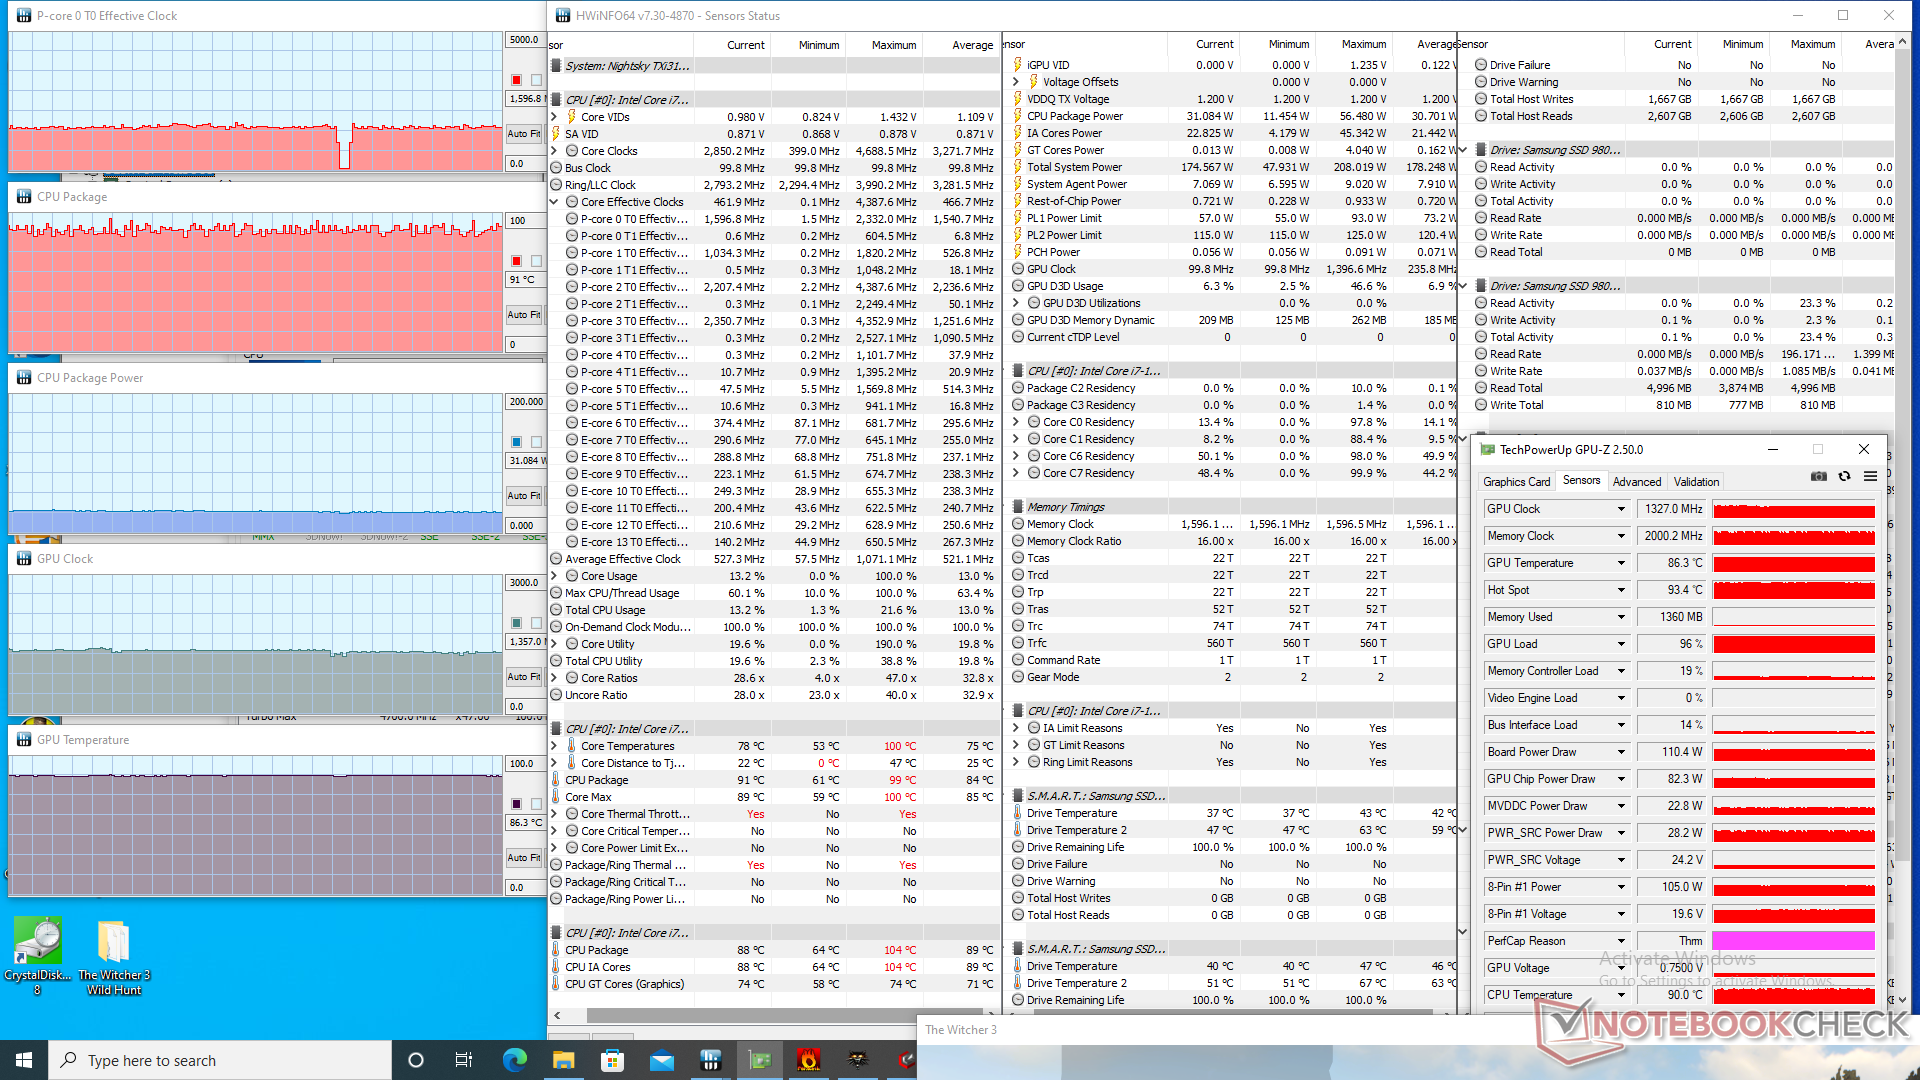
Kloksnelheden, temperatuur en stroomverbruik van de GPU zouden zich stabiliseren op respectievelijk 1432 MHz, 87 C en 121 W bij het draaien van Witcher 3. Herhaling van deze test met het stroomprofiel "Entertainment" resulteert in iets mindere GPU-prestaties: kloksnelheid en stroomverbruik dalen tot respectievelijk 1327 MHz en 110 W, zonder dat de temperatuur verandert. Het is jammer dat we niet dichter bij de geclaimde 125 W tot 155 W TGP-doelstelling kunnen komen.
Met Witcher 3 op de MSI GS77 met dezelfde RTX 3080 Ti GPU zou resulteren in een lagere GPU-kloksnelheid, een koelere kerntemperatuur en een lager stroomverbruik van respectievelijk 1432 MHz, 75 C en 105 W in vergelijking met onze Eurocom.
De prestaties zijn beperkt als je op batterijen werkt. Een Fire Strike test op batterijvoeding zou Physics en Graphics scores opleveren van respectievelijk 12300 en 5071 punten, vergeleken met 28276 en 31825 punten op het lichtnet.
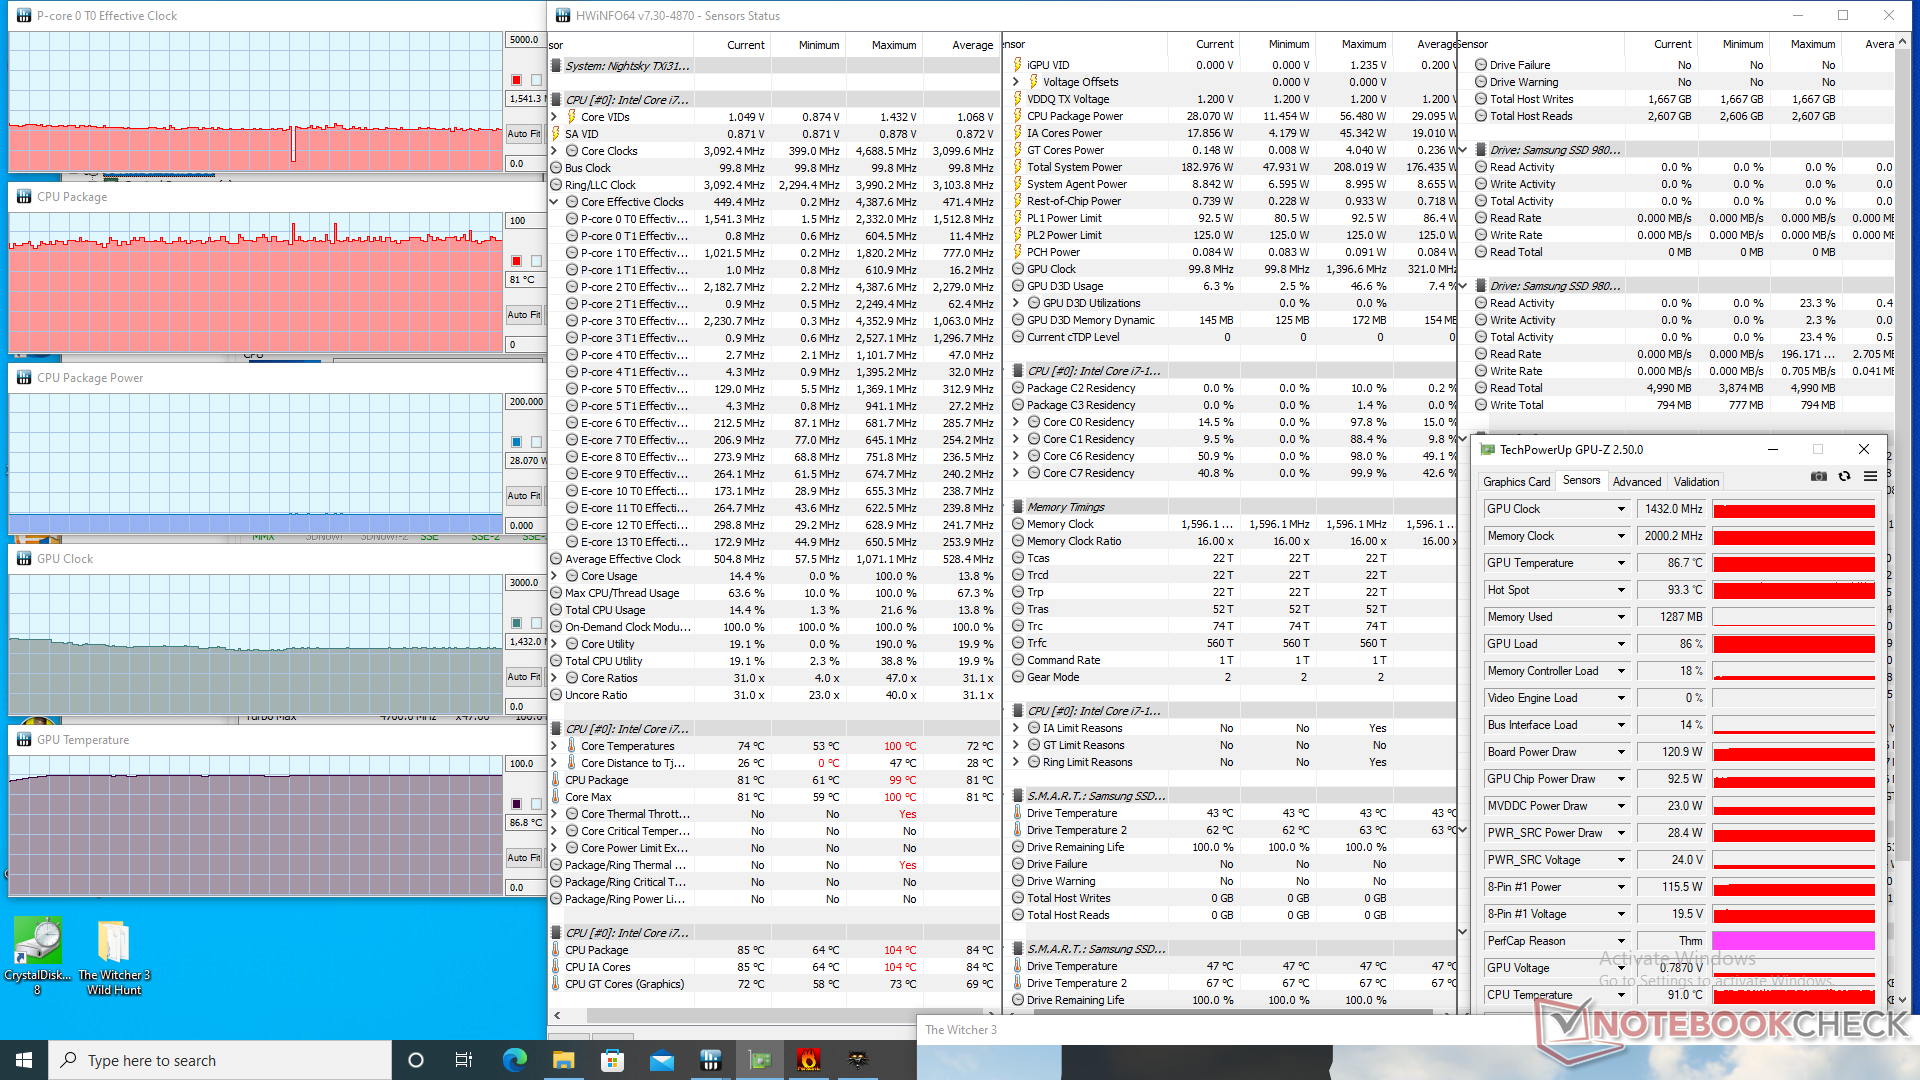
| CPU-klok (GHz) | GPU-klok (MHz) | Gemiddelde CPU-temperatuur (°C) | Gemiddelde GPU-temperatuur (°C) | |
| Systeem Idle | -- | -- | 43 | 40 |
| Prime95 Stress | 2.8 | -- | 97 | 52 |
| Prime95 + FurMark Stress | 2.3 - 2.8 | 1267 - 1755 | 97 | 84 |
| Witcher 3 Stress | 1,5 | 1432 | 81 | 87 |
Luidsprekers
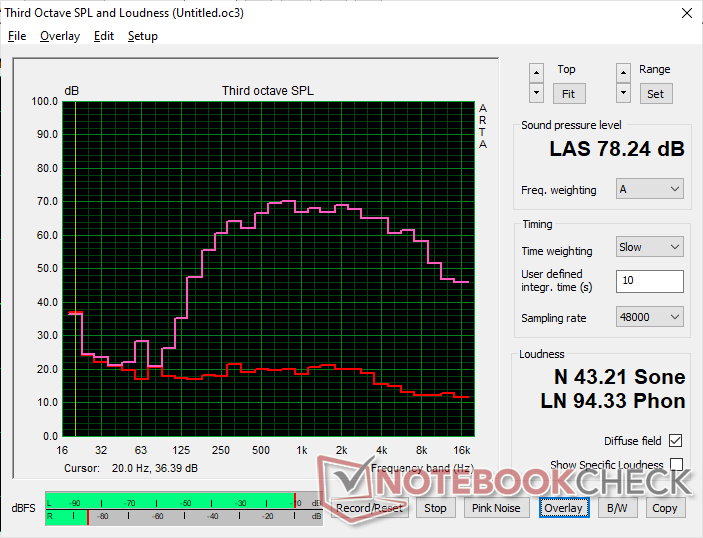
Eurocom Nightsky TXi317 audioanalyse
(±) | luidspreker luidheid is gemiddeld maar goed (78.2 dB)
Bas 100 - 315 Hz
(±) | verminderde zeebaars - gemiddeld 14.6% lager dan de mediaan
(-) | de lage tonen zijn niet lineair (16.5% delta naar de vorige frequentie)
Midden 400 - 2000 Hz
(±) | hogere middens - gemiddeld 5.1% hoger dan de mediaan
(+) | de middentonen zijn lineair (5% delta ten opzichte van de vorige frequentie)
Hoog 2 - 16 kHz
(+) | evenwichtige hoogtepunten - slechts 4% verwijderd van de mediaan
(+) | de hoge tonen zijn lineair (6.2% delta naar de vorige frequentie)
Algemeen 100 - 16.000 Hz
(±) | lineariteit van het totale geluid is gemiddeld (20.4% verschil met de mediaan)
Vergeleken met dezelfde klasse
» 72% van alle geteste apparaten in deze klasse waren beter, 6% vergelijkbaar, 22% slechter
» De beste had een delta van 6%, het gemiddelde was 18%, de slechtste was 132%
Vergeleken met alle geteste toestellen
» 54% van alle geteste apparaten waren beter, 8% gelijk, 38% slechter
» De beste had een delta van 4%, het gemiddelde was 23%, de slechtste was 134%
Apple MacBook Pro 16 2021 M1 Pro audioanalyse
(+) | luidsprekers kunnen relatief luid spelen (84.7 dB)
Bas 100 - 315 Hz
(+) | goede baars - slechts 3.8% verwijderd van de mediaan
(+) | de lage tonen zijn lineair (5.2% delta naar de vorige frequentie)
Midden 400 - 2000 Hz
(+) | evenwichtige middens - slechts 1.3% verwijderd van de mediaan
(+) | de middentonen zijn lineair (2.1% delta ten opzichte van de vorige frequentie)
Hoog 2 - 16 kHz
(+) | evenwichtige hoogtepunten - slechts 1.9% verwijderd van de mediaan
(+) | de hoge tonen zijn lineair (2.7% delta naar de vorige frequentie)
Algemeen 100 - 16.000 Hz
(+) | het totale geluid is lineair (4.6% verschil met de mediaan)
Vergeleken met dezelfde klasse
» 0% van alle geteste apparaten in deze klasse waren beter, 0% vergelijkbaar, 100% slechter
» De beste had een delta van 5%, het gemiddelde was 17%, de slechtste was 45%
Vergeleken met alle geteste toestellen
» 0% van alle geteste apparaten waren beter, 0% gelijk, 100% slechter
» De beste had een delta van 4%, het gemiddelde was 23%, de slechtste was 134%
Energiebeheer
Stroomverbruik
Stationair draaien op de desktop bij de laagste helderheidsinstelling en het laagste energieprofiel zou iets minder dan 13 W vergen om vergelijkbaar te zijn met de XMG Pro 17 E22. Dit kan echter oplopen tot 40 W bij de maximale helderheidsinstelling en het prestatievermogensprofiel met de actieve Nvidia GPU. Het wordt aanbevolen om op lagere energie-instellingen te werken als de extra prestaties niet nodig zijn vanwege de aanzienlijke energiebesparing.
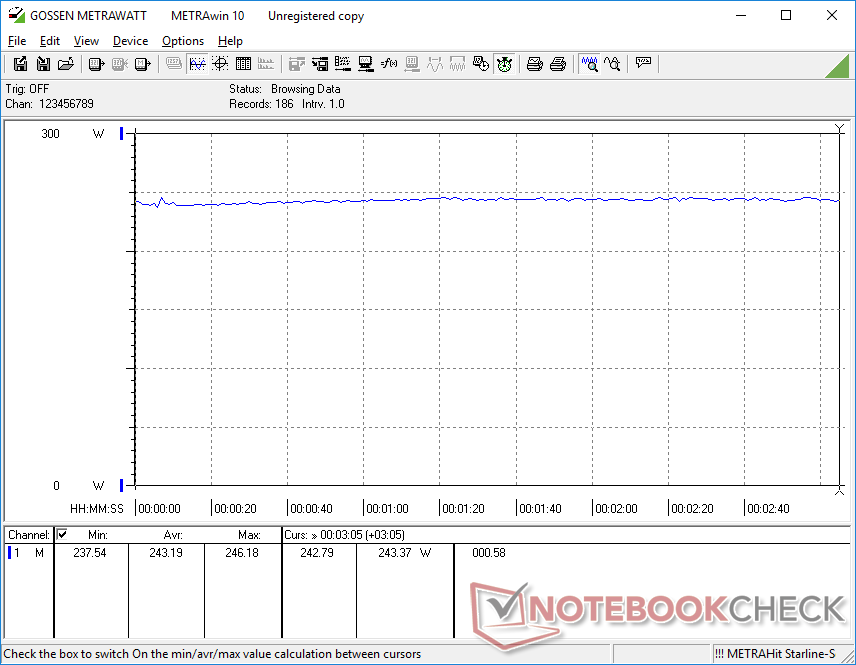
Het stroomverbruik tijdens het draaien Witcher 3 is bijna identiek aan wat we registreerden op deMSI Raider GE77 uitgerust met dezelfde GPU. Het systeem is veel veeleisender dan oudere gaming laptops die draaien op de GeForce RTX 2080, zoals deLenovo Legion 7 15 met meer dan 80 W
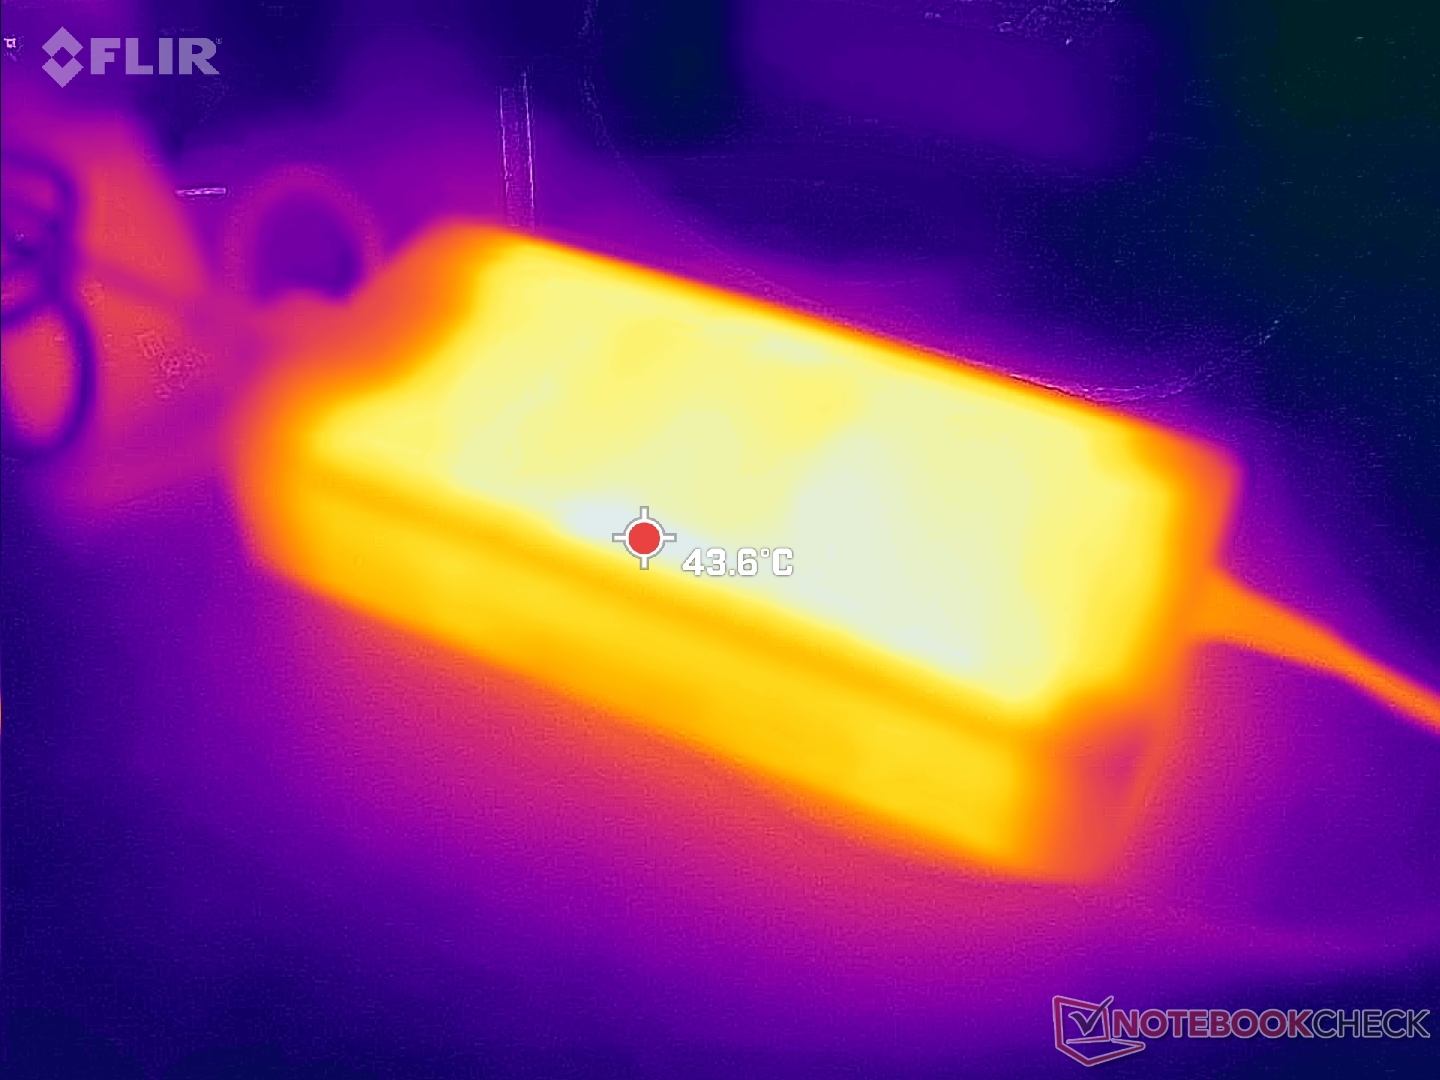
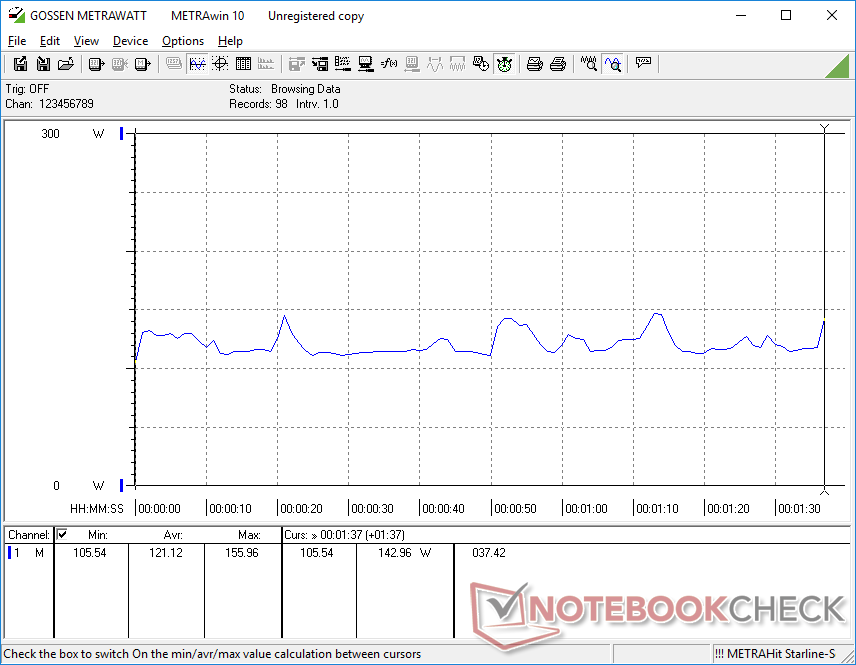
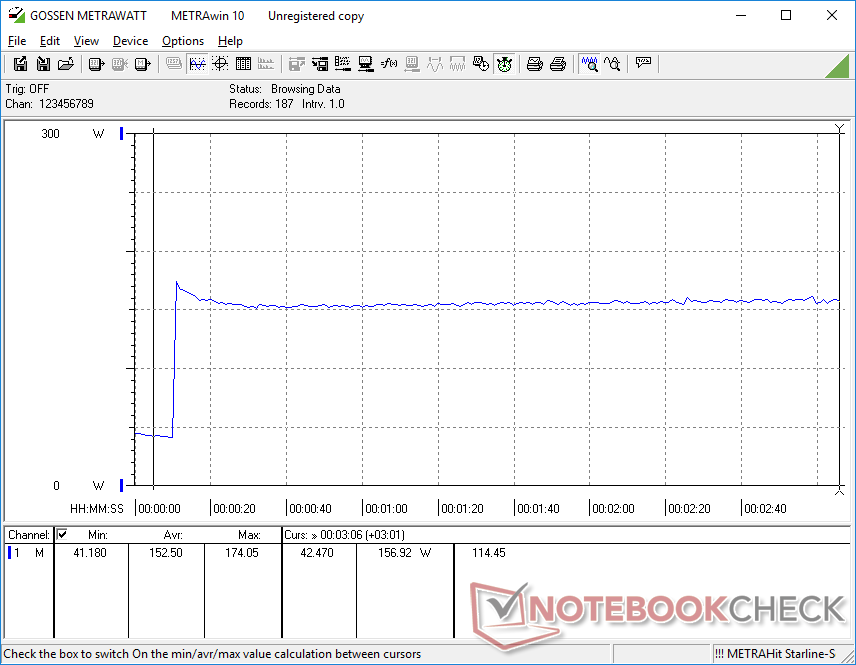
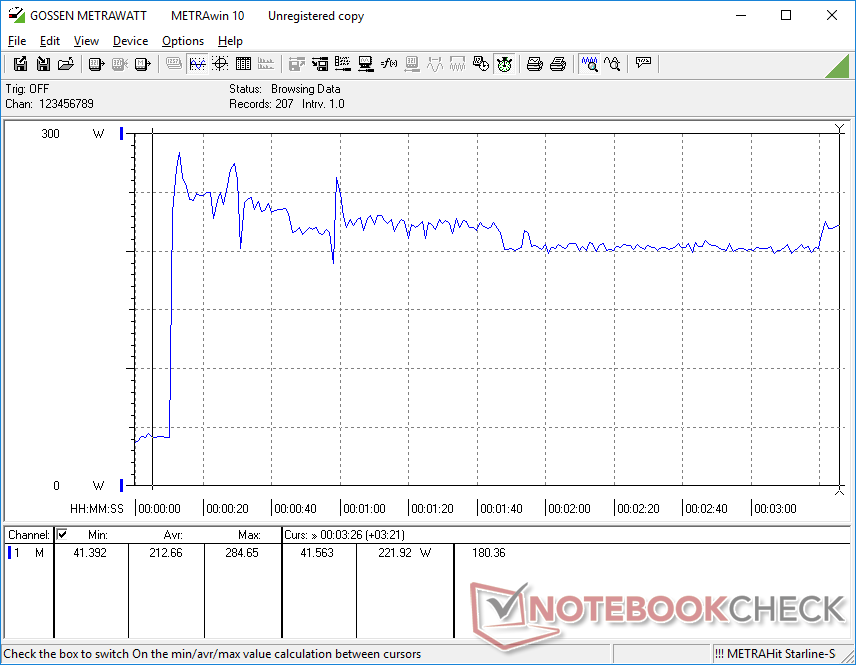
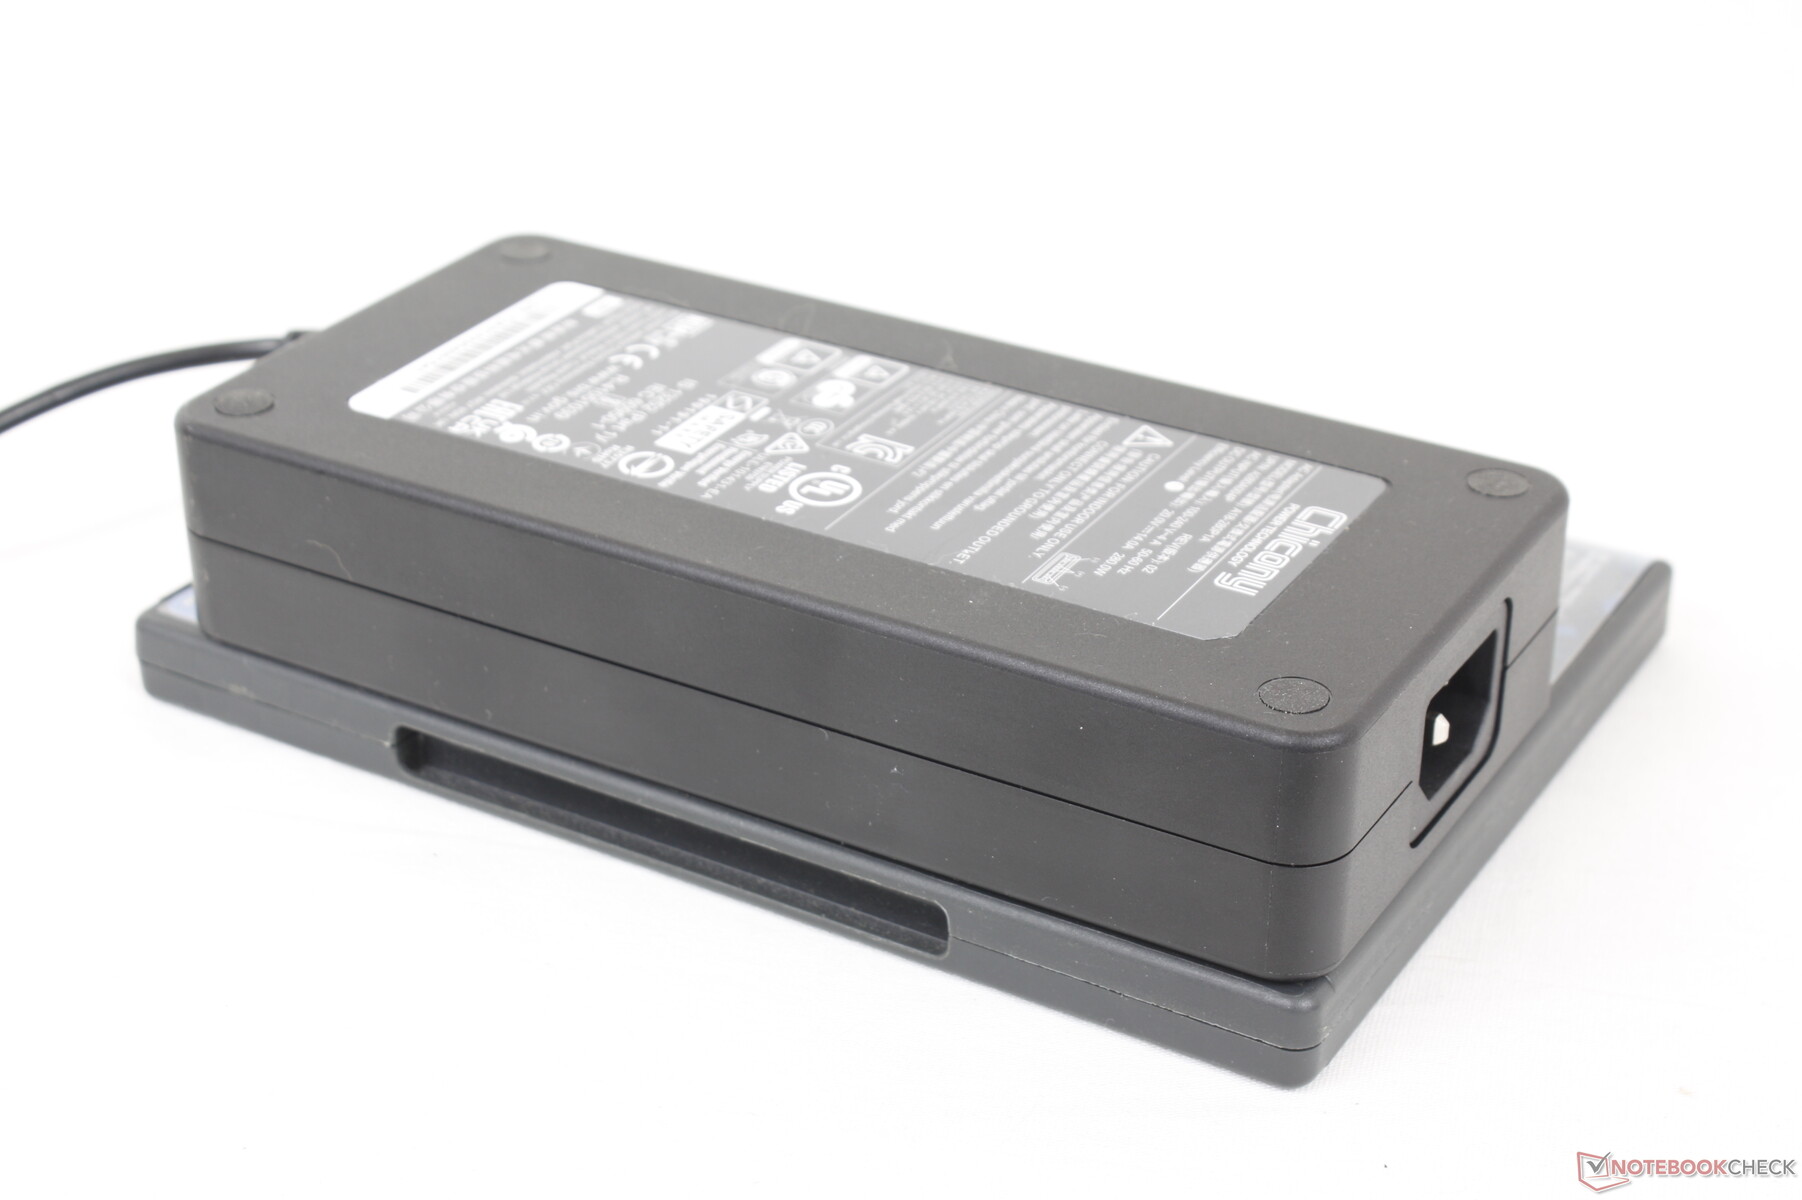
We zijn in staat om een maximale afname van 285 W te registreren uit de grote (~18 x 8,5 x 3,5 cm) 280 W AC-adapter wanneer zowel de CPU als de GPU op 100 procent gebruik staan. Dit percentage is slechts tijdelijk, zoals blijkt uit onze onderstaande grafiek, vanwege thermische beperkingen. Het systeem kan nog steeds games draaien en tegelijkertijd redelijk snel opladen.
| Uit / Standby | |
| Inactief | |
| Belasting |
|
Key:
min: | |
| Eurocom Nightsky TXi317 i7-12700H, GeForce RTX 3080 Ti Laptop GPU, Samsung SSD 980 Pro 1TB MZ-V8P1T0BW, IPS, 1920x1080, 17.3" | Schenker XMG Pro 17 E22 i9-12900H, GeForce RTX 3080 Ti Laptop GPU, Samsung SSD 980 Pro 1TB MZ-V8P1T0BW, IPS, 2560x1440, 17.3" | Aorus 17X XES i9-12900HX, GeForce RTX 3070 Ti Laptop GPU, Gigabyte AG470S1TB-SI B10, IPS, 1920x1080, 17.3" | MSI Raider GE77 HX 12UHS i9-12900HX, GeForce RTX 3080 Ti Laptop GPU, Samsung PM9A1 MZVL22T0HBLB, IPS, 3840x2160, 17.3" | Razer Blade 17 Early 2022 i9-12900H, GeForce RTX 3080 Ti Laptop GPU, Samsung PM9A1 MZVL21T0HCLR, IPS, 3840x2160, 17.3" | Alienware x17 R2 P48E i9-12900HK, GeForce RTX 3080 Ti Laptop GPU, 2x Samsung PM9A1 1TB (RAID 0), IPS, 1920x1080, 17.3" | |
|---|---|---|---|---|---|---|
| Power Consumption | 17% | -6% | 4% | 6% | -25% | |
| Idle Minimum * (Watt) | 12.8 | 13 -2% | 18 -41% | 13 -2% | 17 -33% | 24.1 -88% |
| Idle Average * (Watt) | 33.9 | 17 50% | 28 17% | 19 44% | 23 32% | 28.5 16% |
| Idle Maximum * (Watt) | 39.1 | 26 34% | 36 8% | 29 26% | 34 13% | 60 -53% |
| Load Average * (Watt) | 121.1 | 120 1% | 153 -26% | 143 -18% | 120 1% | 128.7 -6% |
| Witcher 3 ultra * (Watt) | 243 | 221 9% | 221 9% | 247 -2% | 229 6% | 254 -5% |
| Load Maximum * (Watt) | 284.7 | 266 7% | 290 -2% | 352 -24% | 243 15% | 323 -13% |
* ... kleiner is beter
Power Consumption Witcher 3 / Stresstest
Power Consumption external Monitor
Levensduur van de batterij
WLAN runtime is kort op iets meer dan 4 uur real-world browsen voordat moet worden opgeladen. Onze unit was ingesteld op het Balanced power profiel met de iGPU actief voorafgaand aan het uitvoeren van de batterijlevensduur test. De resultaten zijn vergelijkbaar met de Razer Blade 17 of Aorus 17X maar nog steeds meer dan twee uur korter dan op de Schenker XMG Pro 17 E22.
Het opladen van lege tot volle capaciteit gaat met ongeveer 2,5 uur erg langzaam. De meeste gaming laptops doen er in vergelijking slechts 1,5 tot 2 uur over. Het systeem kan niet worden opgeladen via USB-C.
| Eurocom Nightsky TXi317 i7-12700H, GeForce RTX 3080 Ti Laptop GPU, 80 Wh | Schenker XMG Pro 17 E22 i9-12900H, GeForce RTX 3080 Ti Laptop GPU, 80 Wh | Aorus 17X XES i9-12900HX, GeForce RTX 3070 Ti Laptop GPU, 99 Wh | MSI Raider GE77 HX 12UHS i9-12900HX, GeForce RTX 3080 Ti Laptop GPU, 99.99 Wh | Razer Blade 17 Early 2022 i9-12900H, GeForce RTX 3080 Ti Laptop GPU, 82 Wh | Alienware x17 R2 P48E i9-12900HK, GeForce RTX 3080 Ti Laptop GPU, 87 Wh | |
|---|---|---|---|---|---|---|
| Batterijduur | 62% | 5% | 29% | -10% | -52% | |
| WiFi v1.3 (h) | 4.2 | 6.8 62% | 4.4 5% | 5.4 29% | 3.8 -10% | 2 -52% |
| H.264 (h) | 4.6 | 3.8 | 6.5 | 4.8 | ||
| Load (h) | 1.5 | 1.4 | 2 | 1.7 | 0.8 | |
| Reader / Idle (h) | 9.8 | 7.1 | 3.9 |
Pro
Contra
Verdict - Behoefte aan een chassisrenovatie
De Eurocom Nightsky TXi317 heeft de CPU en GPU prestaties van een grote gaming laptop, maar zonder veel van de extra functies die we gewend zijn van een middelgroot ontwerp. Het meest opvallende is dat het model niet in staat is om SSD's voor langere periodes te gebruiken zonder dat de overdrachtssnelheden moeten worden beperkt. De doelgroep van prestatiegerichte gebruikers zal eerder teleurgesteld zijn dat ze hun nieuwe PCIe4 x4-schijven niet volledig kunnen benutten. Alternatieven zoals de Alienware x17of MSI GE66 series hebben doorgaans warmteverspreiders over hun interne SSD's om deze exacte reden.
De Eurocom Nightsky TXi317 heeft de prestaties van een dure gaming laptop, maar mist veel basis en geavanceerde extra functies van een.
Meer kleine nadelen zijn de zeer lage resolutie webcam, geen privacy shutter, gebrek aan USB-C PD ondersteuning, geen Advanced Optimus, geen Wi-Fi 6E opties, en de zeer warme kerntemperaturen die bijna 90 C bereiken tijdens het gamen. Het chassis loopt zelfs achter als het gaat om onderhoud, omdat het verwijderen van het onderste paneel langer duurt dan bij de meeste andere gaming laptops van tegenwoordig. Voor $3000 en meer biedt de Nightsky TXi317 gewoon lang niet zoveel als andere high-end concurrenten.
Prijs en beschikbaarheid
De Nightsky TXi317 kan hier rechtstreeks bij Eurocom gekocht worden in verschillende configuraties vanaf 3000 USD.
Eurocom Nightsky TXi317
- 26-10-2022 v7 (old)
Allen Ngo
Price comparison

