Alienware x15 R2 Laptop Review: Ultrabook-achtige UFO zweeft met Core i9-12900H en 140 W RTX 3080 Ti
Het is al enige tijd geleden dat Dell de Alienware m15 serie heeft vervangen door de x15. De x15-serie heeft in principe dezelfde designtaal als het Legend-chassis van de m15, maar is nu slanker. Dit jaar hebben we de Alienware x15 R2 en de Alienware x17 R2 die strijden om een deel van uw zuurverdiende taart.
We hebben eerder de Alienware x15 R1 en de Alienware x17 R2, dus nu is het tijd om ook de Alienware x15 R2 te bekijken en te zien wat de Alder Lake-H refresh van dit jaar voor ons in petto heeft.
De Alienware x15 R2 van dit jaar is min of meer een rehash van de vorige gen x15 R1. We zien echter enkele broodnodige interne verbeteringen, waaronder upgrades naar Intel 12e gen Alder Lake-H, Nvidia RTX 30 Ti graphics, Dolby Vision displays, en meer
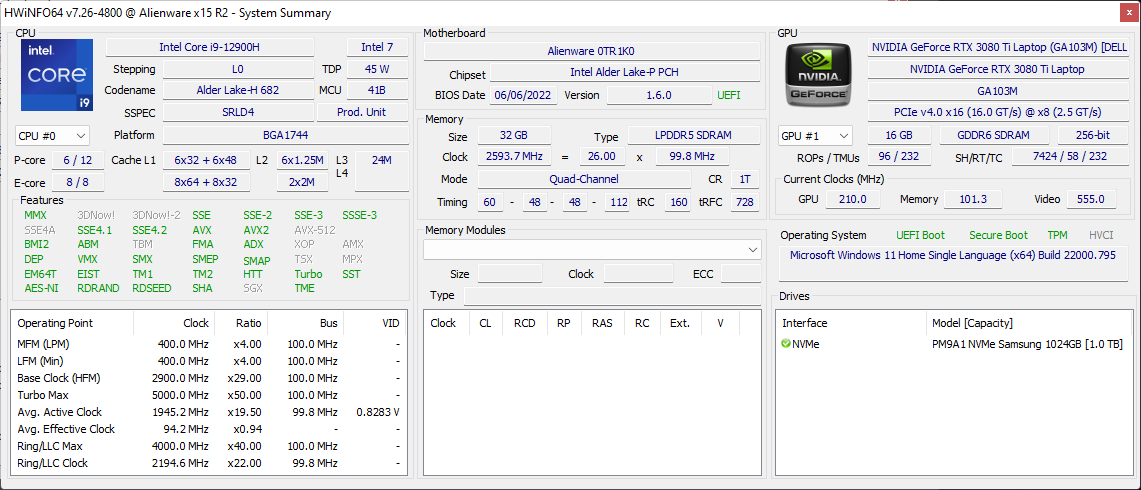
Onze test Alienware x15 R2 is uitgerust met een Intel Core i9-12900H, Nvidia GeForce RTX 3080 Ti laptop GPU, een 1080p 360 Hz beeldscherm, 32 GB LPDDR5-4800 RAM, en een 1 TB Samsung PM9A1 NVMe SSD. Deze configuratie kost u ₹3.68.190 (~US$4.500 of €4.583) indien online besteld via Dell India.
In deze review nemen we de Alienware x15 R2 onder de loep en kijken we of de nieuwe upgrades bijdragen aan een geweldige ervaring voor de vraagprijs.
Potentiële concurrenten in vergelijking
Evaluatie | Datum | Model | Gewicht | Hoogte | Formaat | Resolutie | Beste prijs |
|---|---|---|---|---|---|---|---|
| 87.7 % v7 (old) | 10-2022 | Alienware x15 R2 P111F i9-12900H, GeForce RTX 3080 Ti Laptop GPU | 2.4 kg | 15.9 mm | 15.60" | 1920x1080 | |
| 86.3 % v7 (old) | 06-2022 | Asus ROG Strix Scar 15 G533ZW-LN106WS i9-12900H, GeForce RTX 3070 Ti Laptop GPU | 2.3 kg | 27.2 mm | 15.60" | 2560x1440 | |
| 88.2 % v7 (old) | 05-2022 | Asus ROG Zephyrus Duo 16 GX650RX R9 6900HX, GeForce RTX 3080 Ti Laptop GPU | 2.6 kg | 20.5 mm | 16.00" | 3840x2400 | |
| 87.4 % v7 (old) | 06-2022 | MSI Raider GE66 12UHS i9-12900HK, GeForce RTX 3080 Ti Laptop GPU | 2.4 kg | 23.4 mm | 15.60" | 3840x2160 | |
| 88.3 % v7 (old) | 08-2022 | MSI Titan GT77 12UHS i9-12900HX, GeForce RTX 3080 Ti Laptop GPU | 3.3 kg | 23 mm | 17.30" | 1920x1080 | |
| 86.9 % v7 (old) | 03-2022 | MSI Vector GP66 12UGS i9-12900H, GeForce RTX 3070 Ti Laptop GPU | 2.3 kg | 23.4 mm | 15.60" | 1920x1080 | |
| 88.3 % v7 (old) | 05-2022 | Razer Blade 15 Advanced Model Early 2022 i7-12800H, GeForce RTX 3080 Ti Laptop GPU | 2.1 kg | 16.99 mm | 15.60" | 1920x1080 |
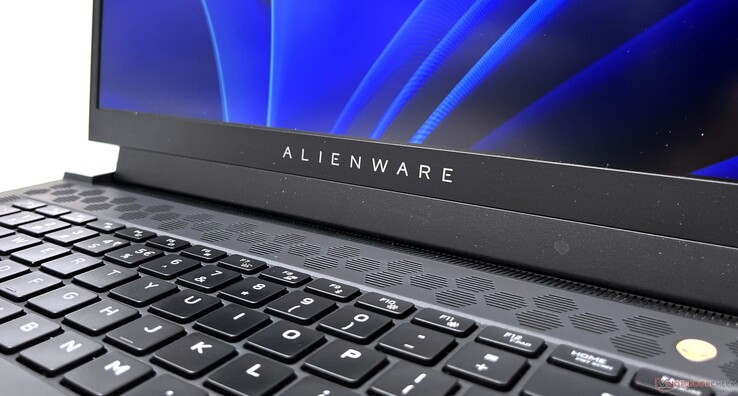
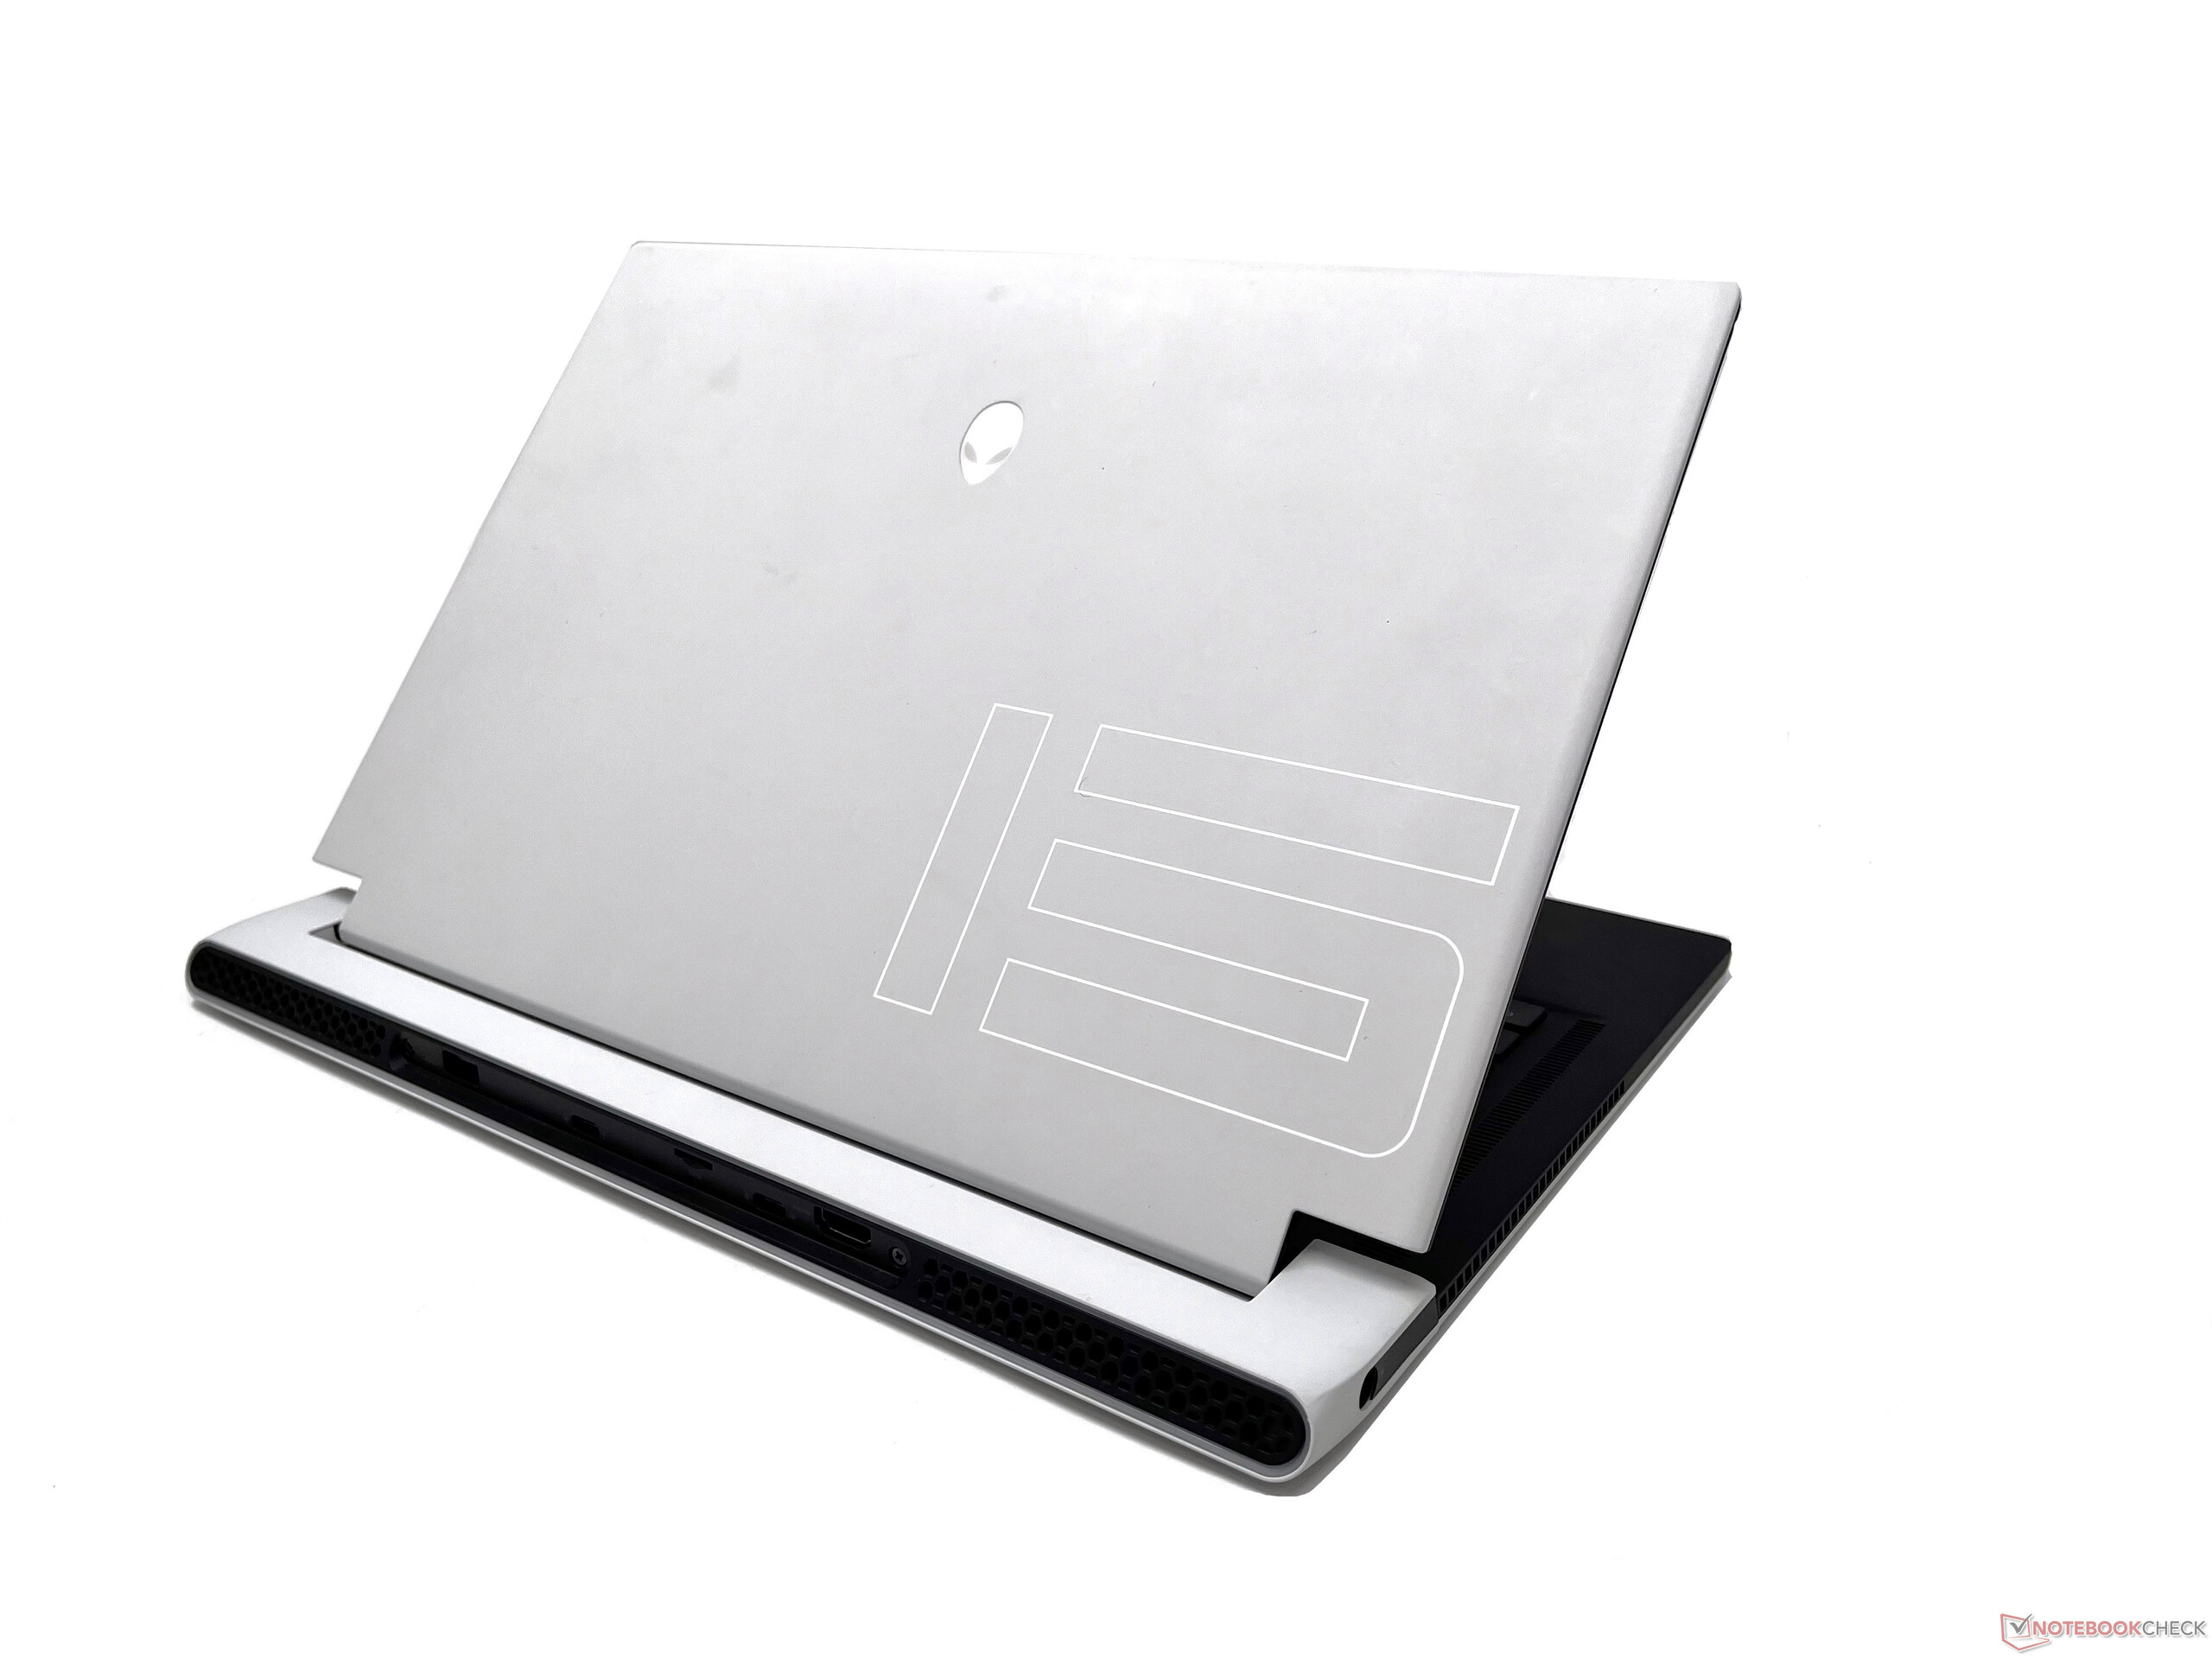
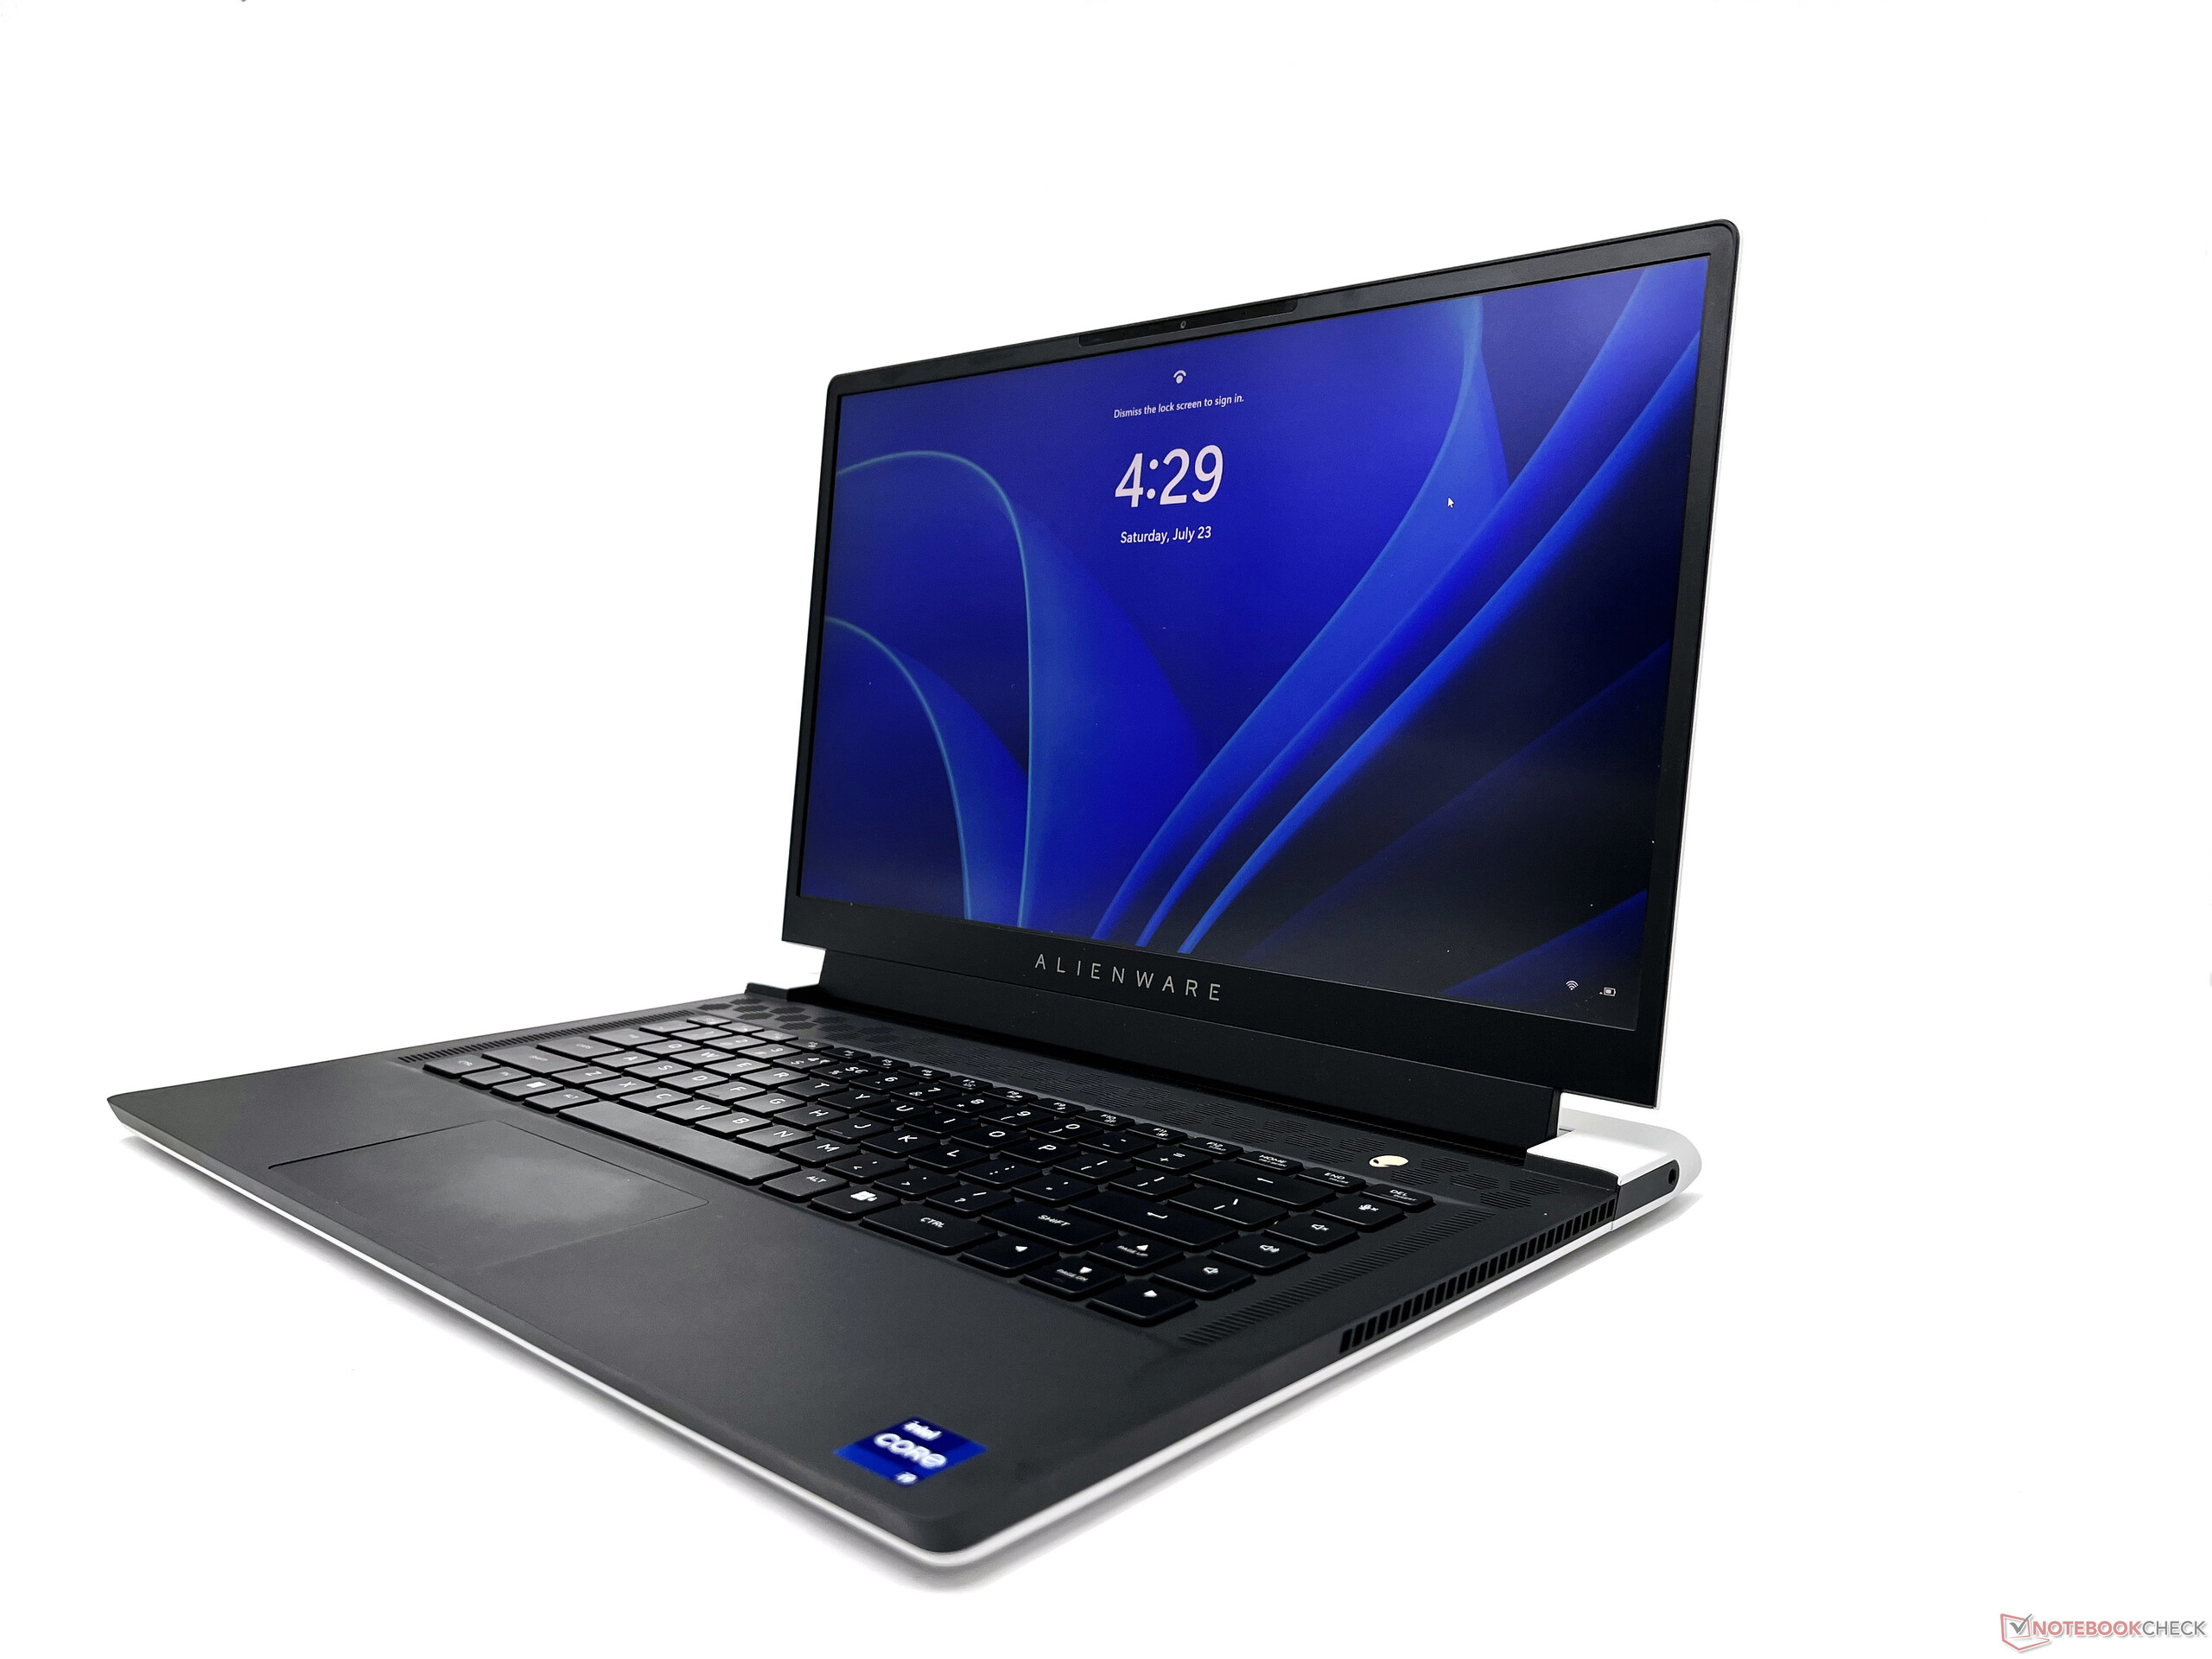
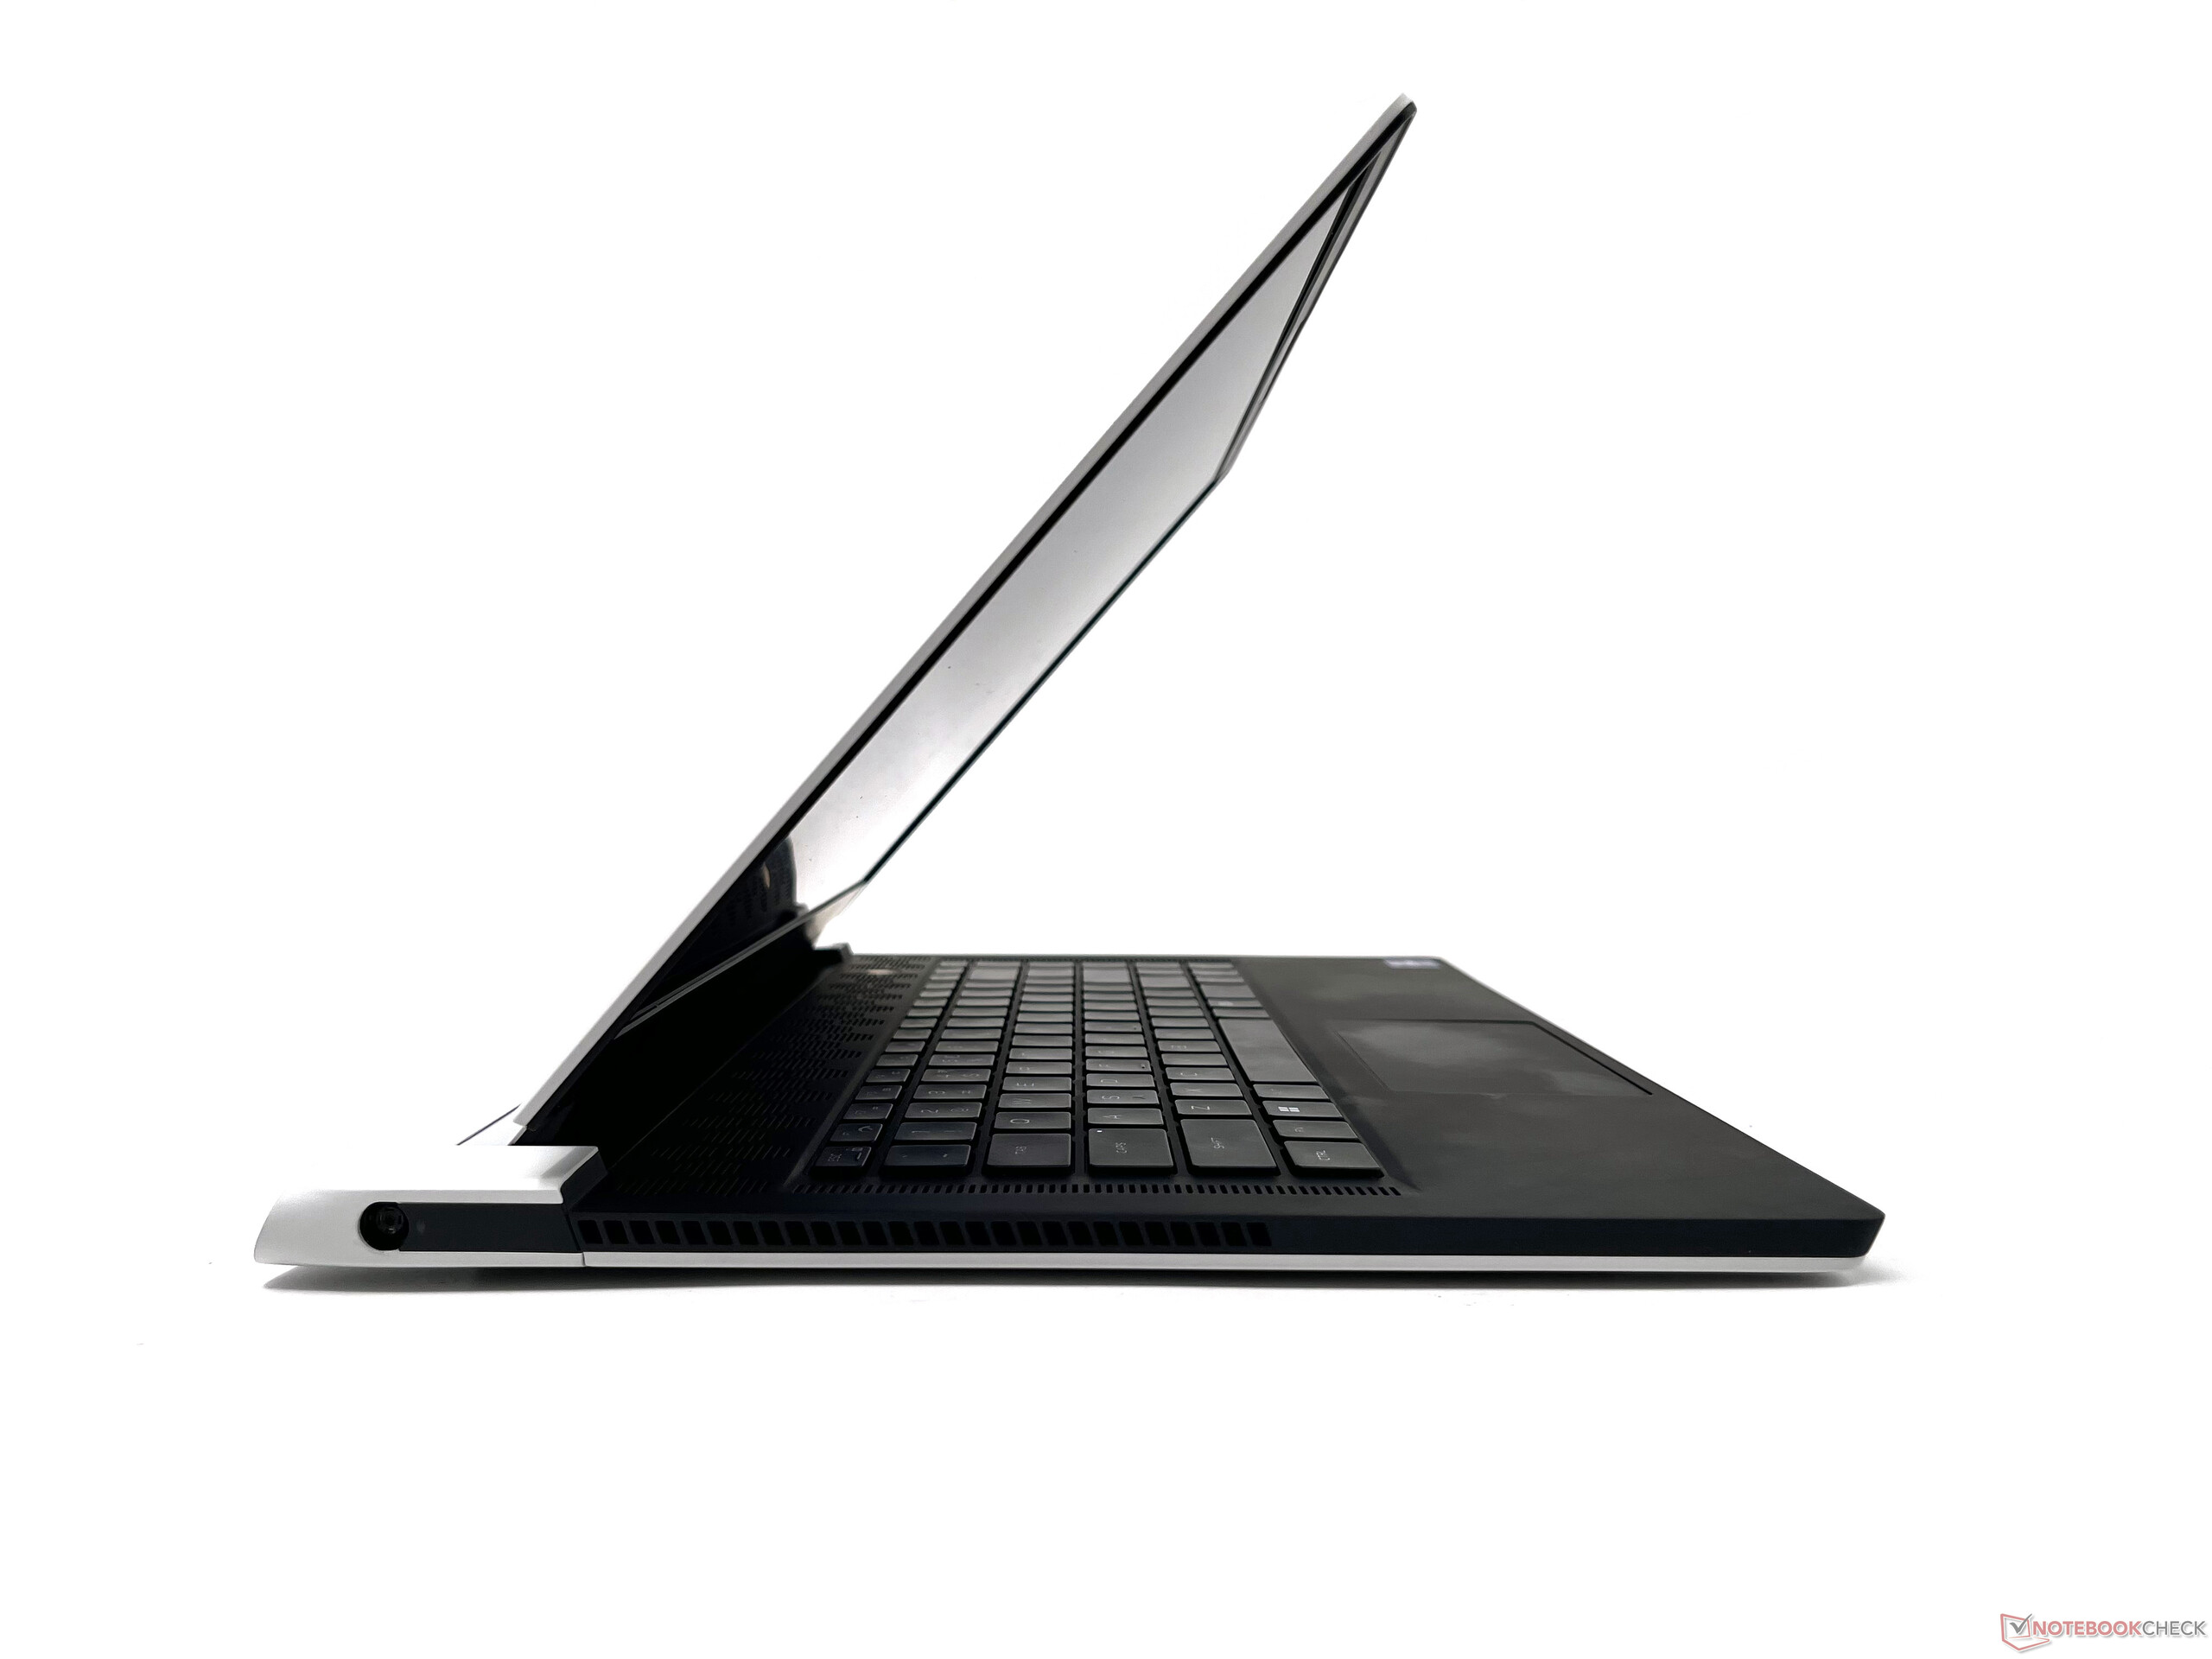
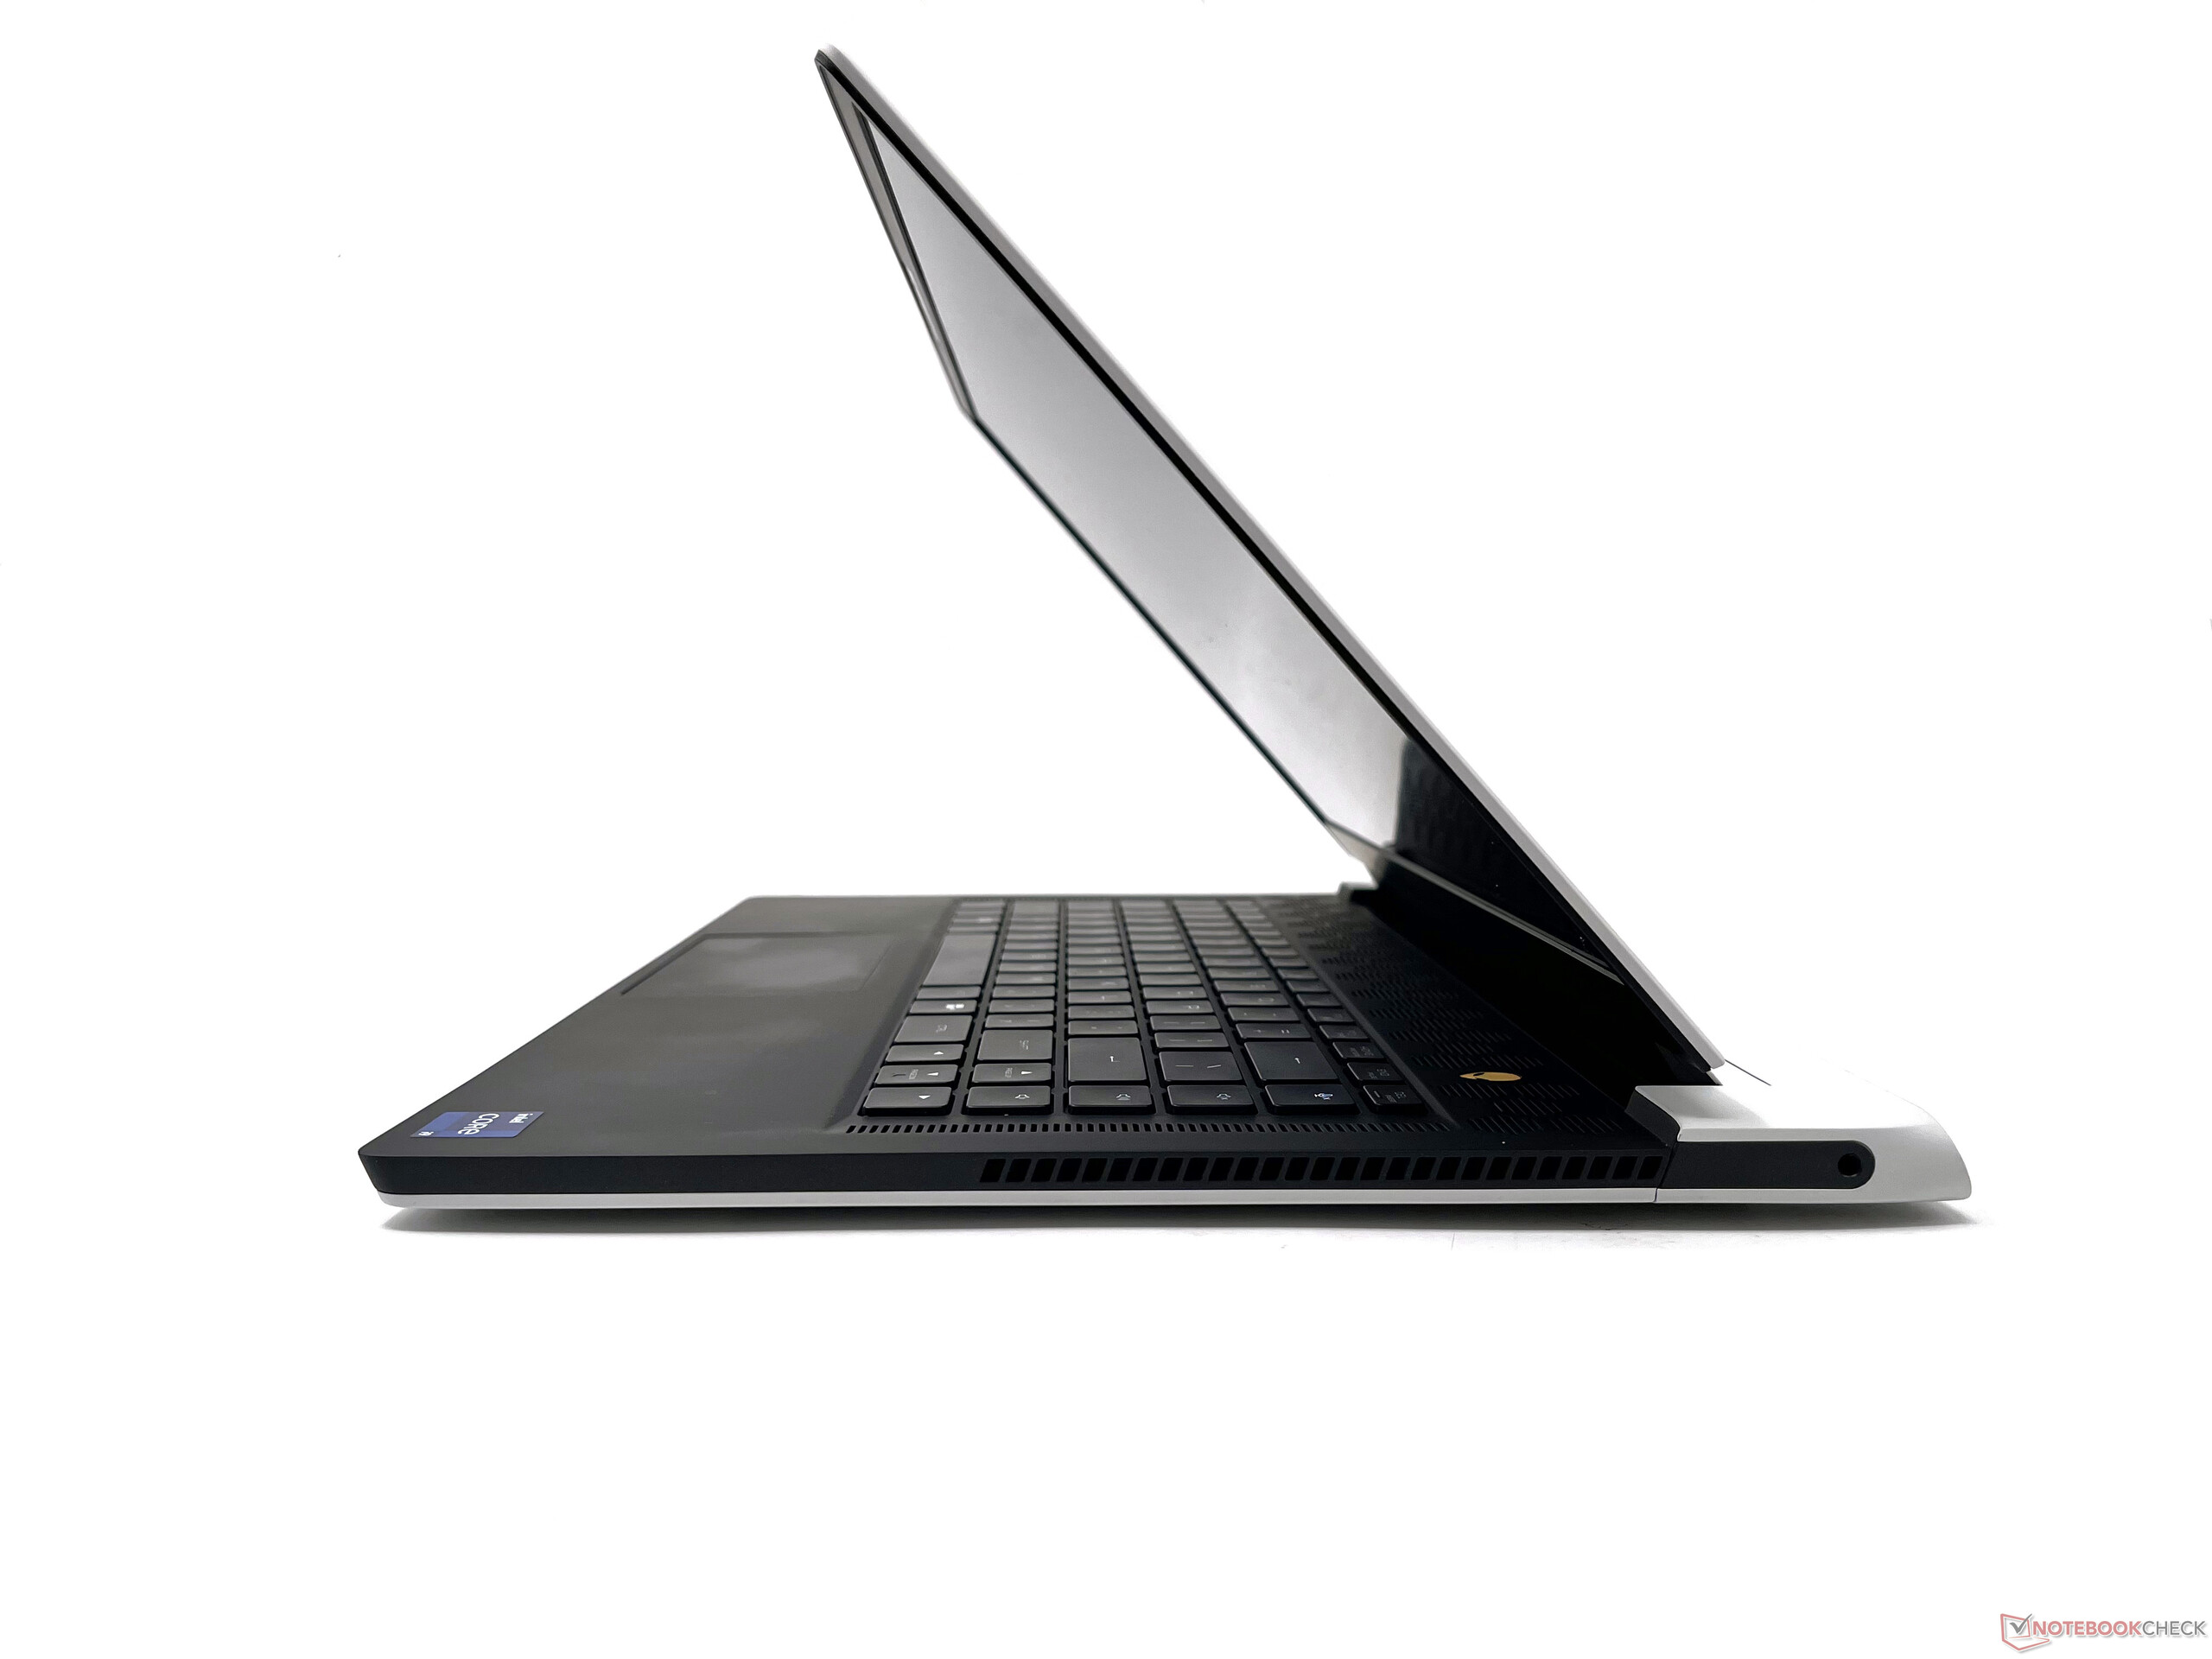
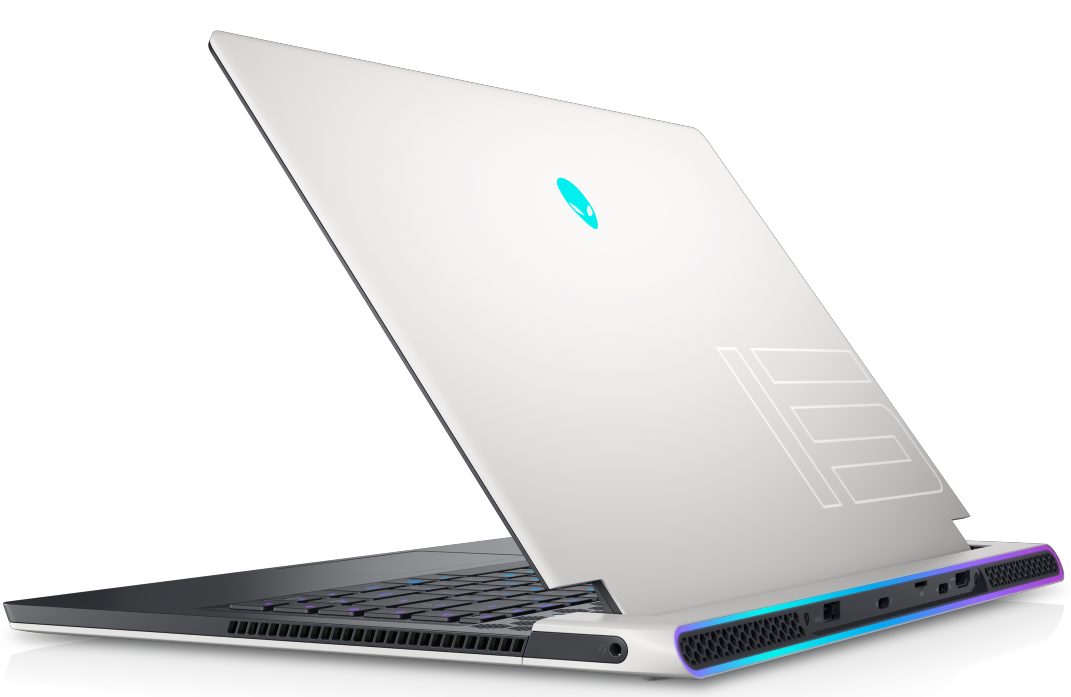
Behuizing: Elke centimeter een Alienware in een bijna-ultrabook chassis
Het Legend 2.0 chassis is grotendeels ongewijzigd ten opzichte van de x15 R1 en is net zo opvallend. De x15 R2 ziet er vrij slank uit voor de aangeboden hardware, en Alienware is erin geslaagd om de mix van klasse en gamery esthetiek precies goed te krijgen.
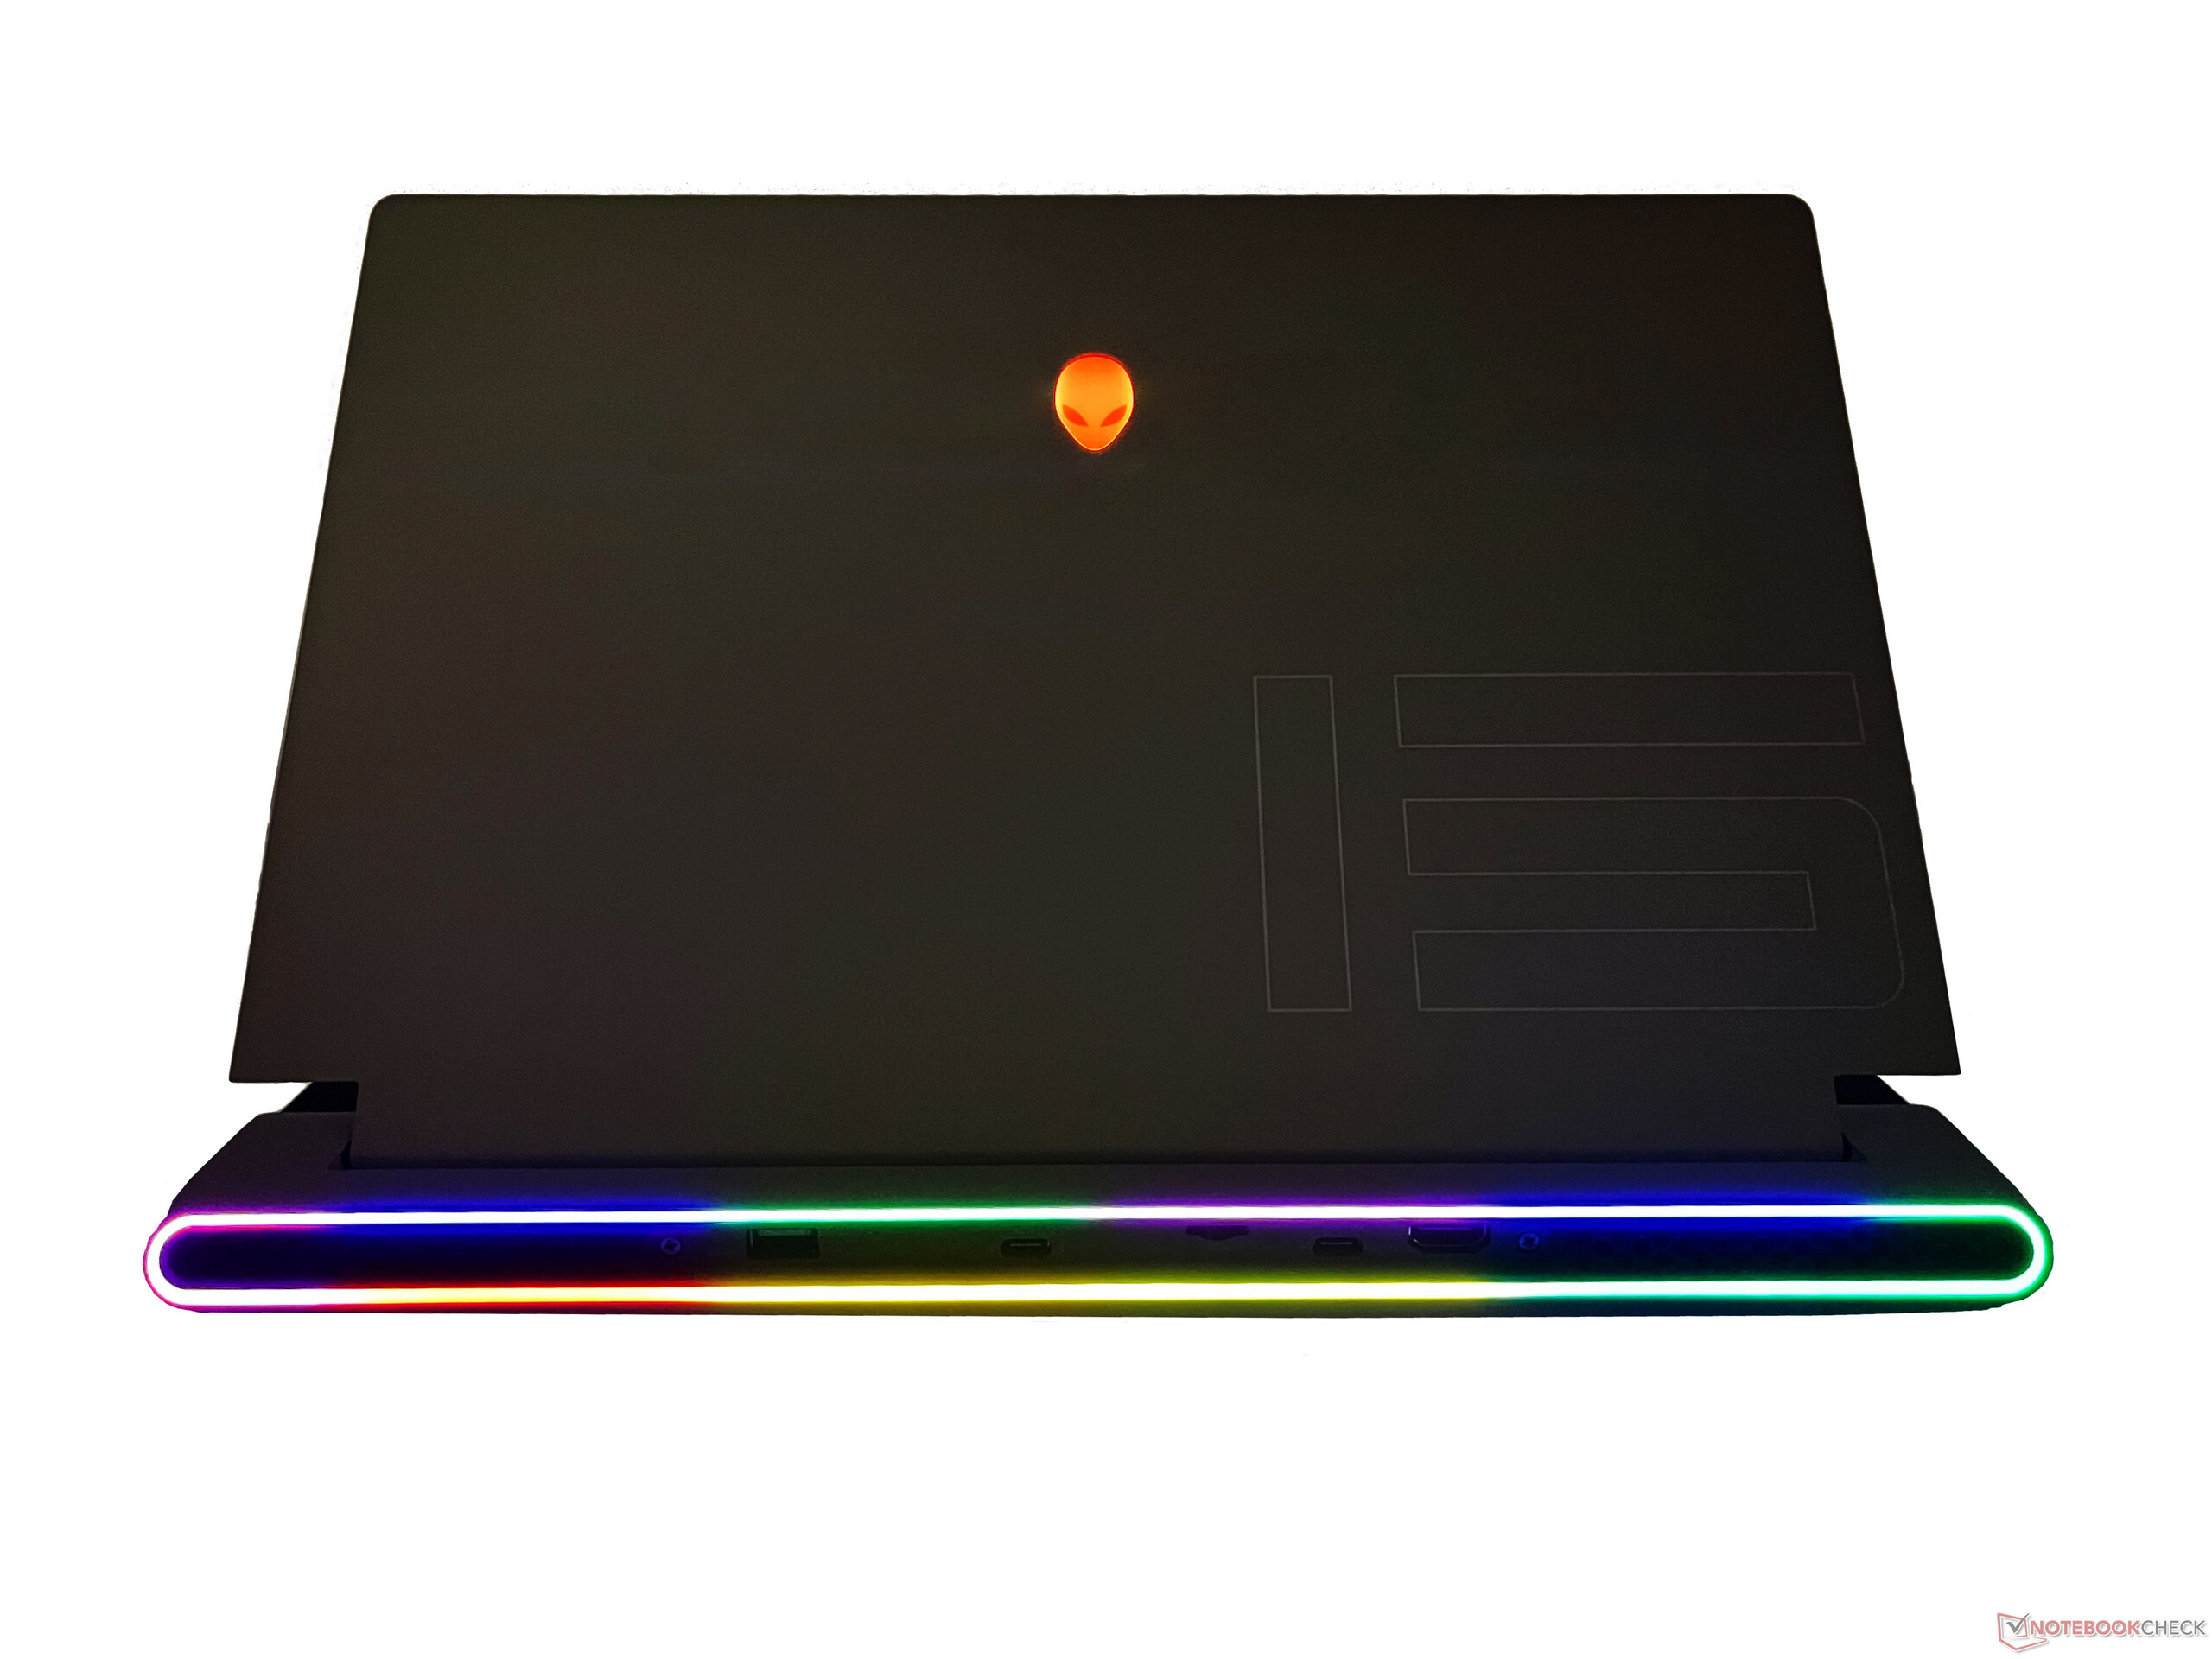
De tweekleurige lak met een wit chassis en een zwart toetsenbord ziet er aantrekkelijk uit en voelt glad aan. Het kenmerkende alien hoofd logo op de achterkant van het deksel en de power knop gloeit in ongerepte RGB, net als de achterste stadion RGB lichten gemaakt van 90 micro-LED's, die allemaal volledig kunnen worden aangepast of uitgeschakeld in de Alienware Command Center
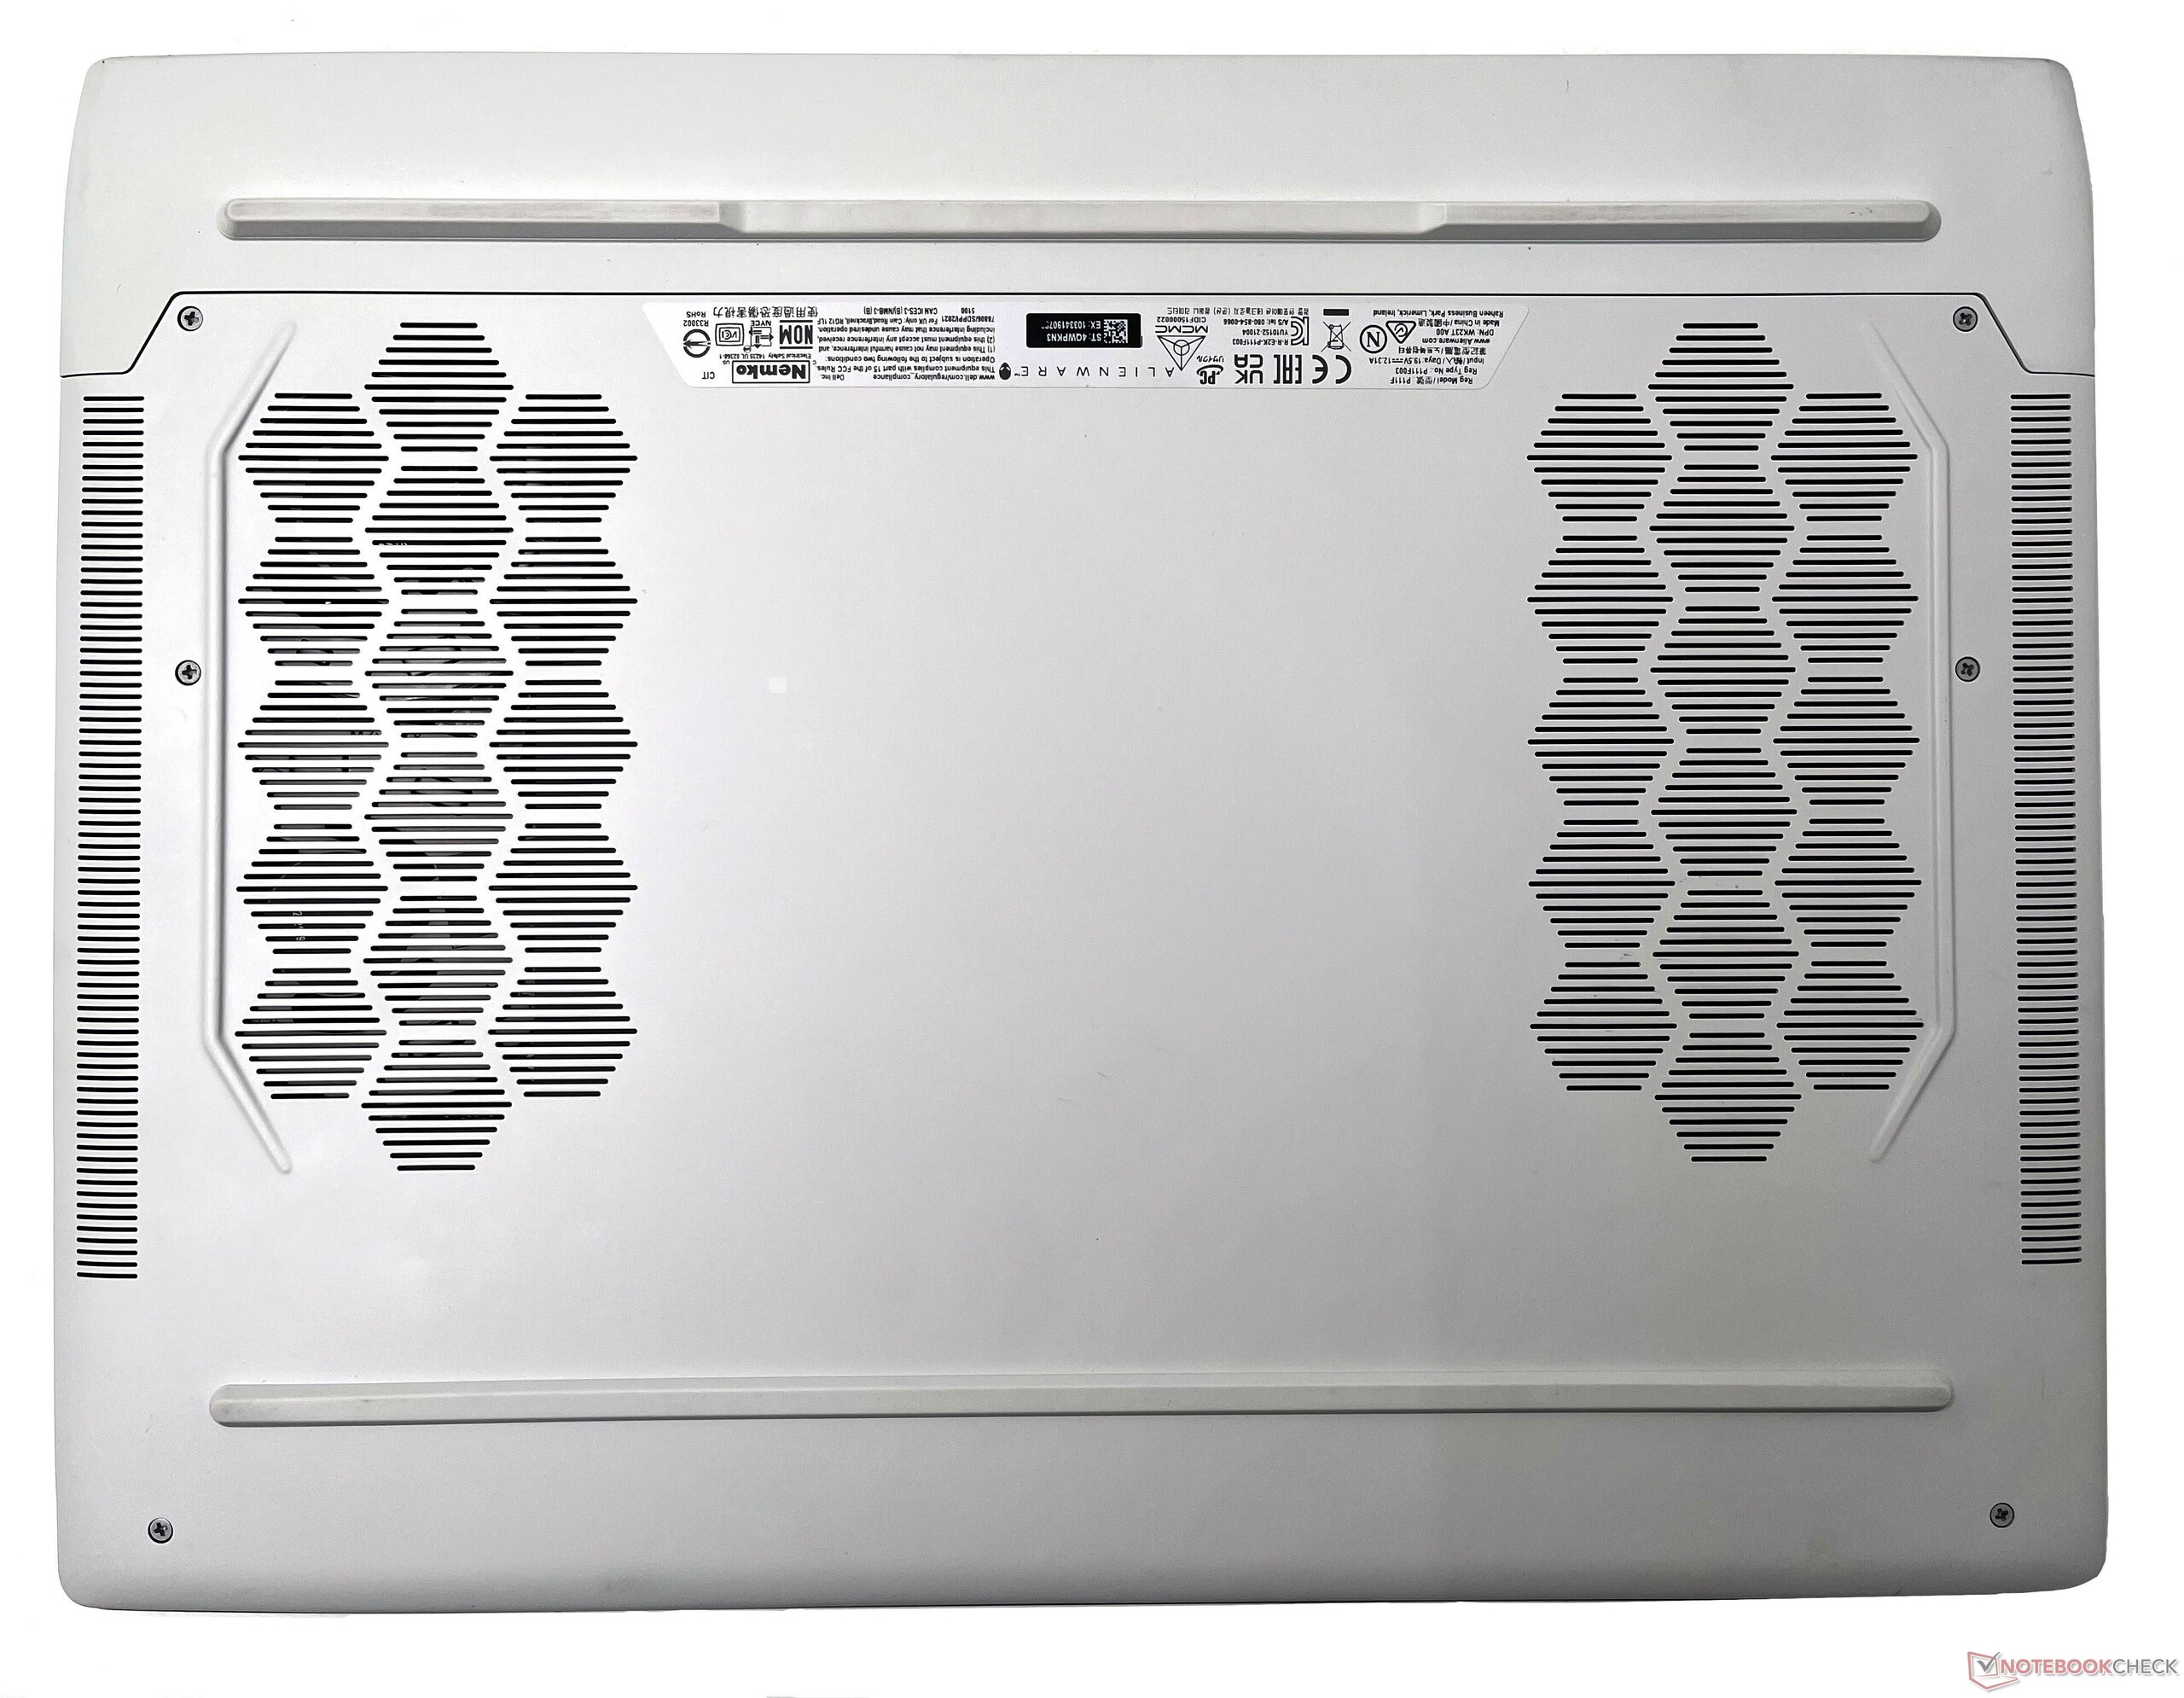
De achterste ventilatieopeningen hebben een honingraatpatroon om een beetje elegantie toe te voegen. Het onderpaneel heeft ook een plastic constructie en heeft inlaatopeningen met een patroon
Hoewel de constructie van het toetsenbord grotendeels van plastic is, voelt het vrij hoogwaardig en uniform aan, zonder scherpe randen of ongebreidelde flexibiliteit - iets waar de vorige generatie Alienwares berucht om was. Er is enige
flexibiliteit, maar die wordt alleen waargenomen wanneer er opzettelijk druk wordt uitgeoefend. Het schermdeksel is gemaakt van een magnesiumlegering voor stevigheid met het nummer "15" duidelijk geëtst.
Al met al geeft de Alienware x15 R2 op het eerste gezicht een geweldig gevoel met zijn ultrabook-achtige vormfactor, terwijl de kenmerkende Alienware-functies behouden blijven.
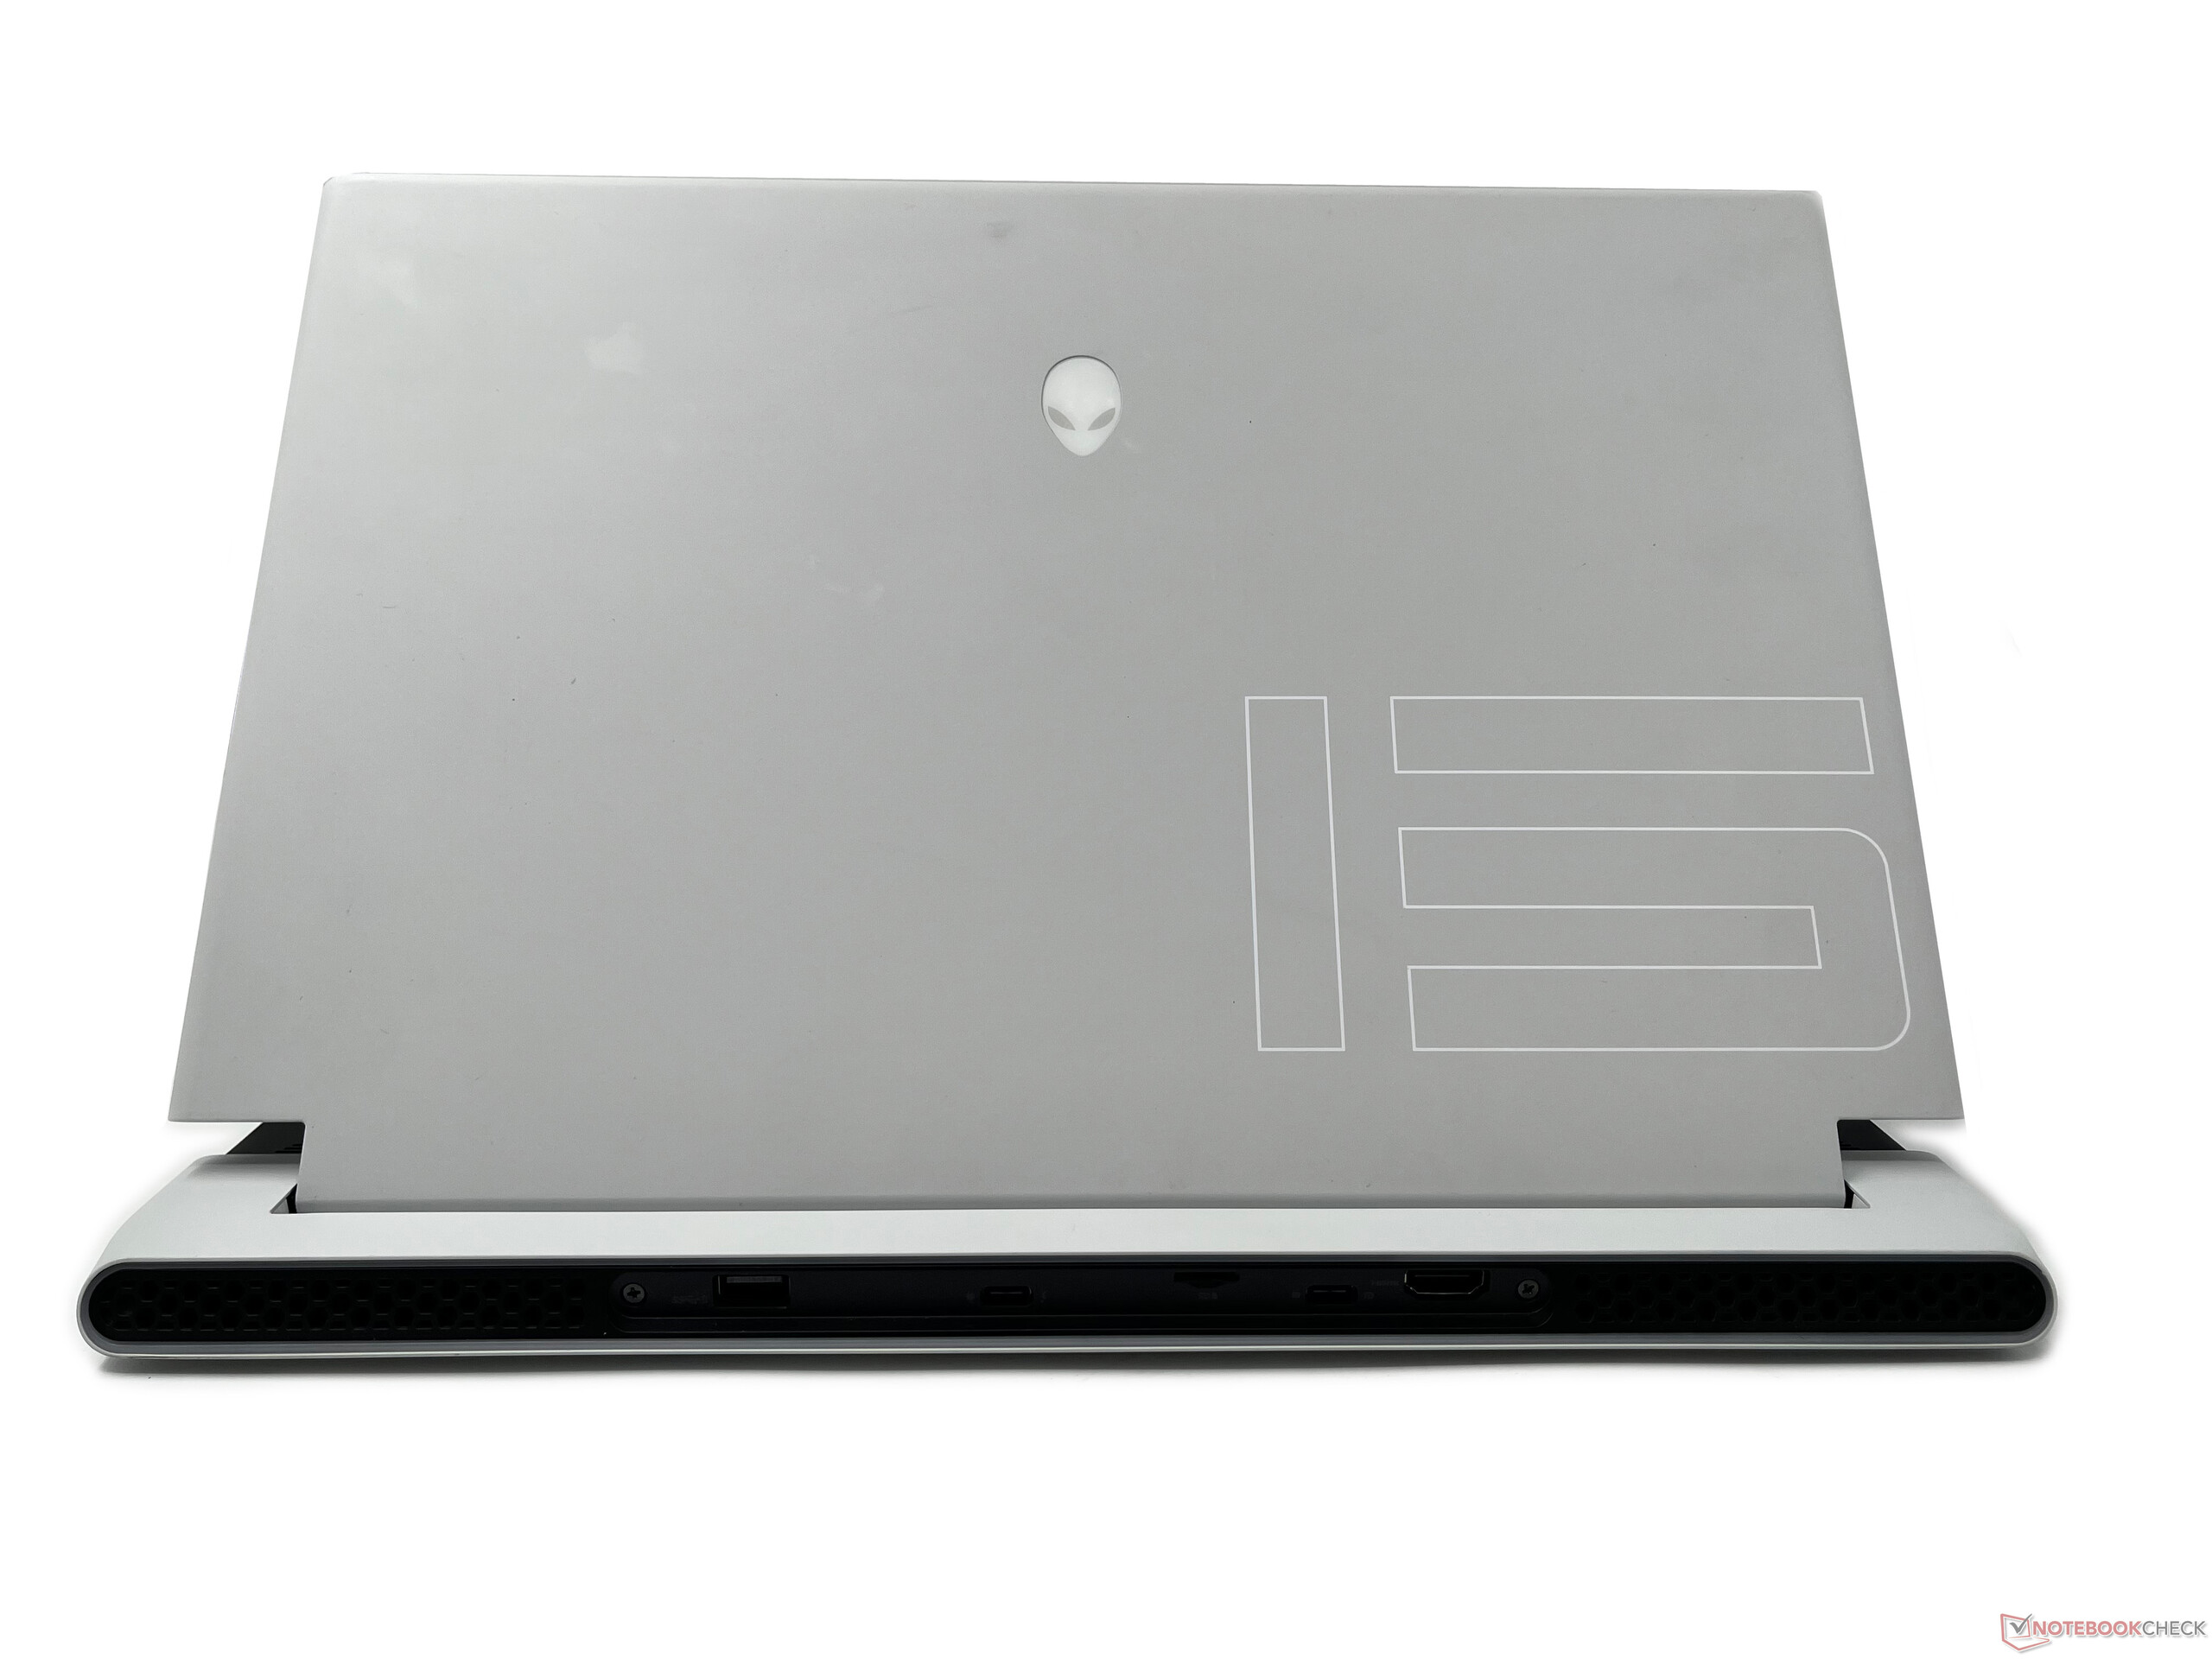
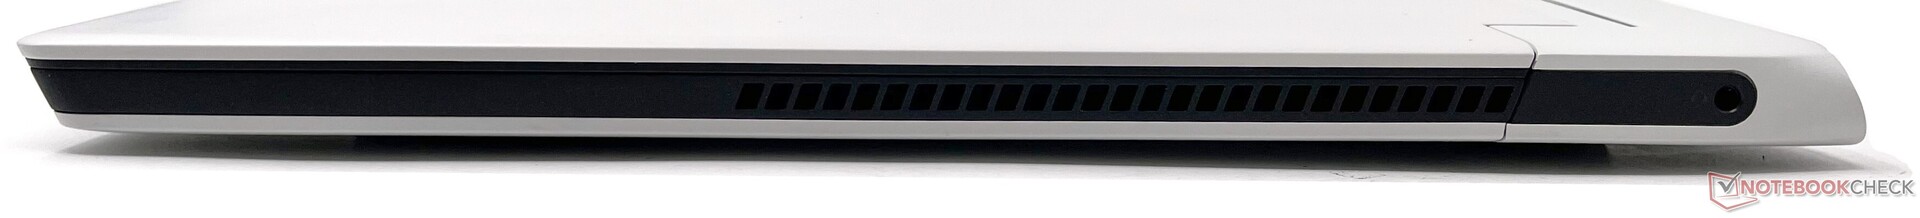
Connectiviteit: Alle poorten achtersteven
De indeling van de poorten in de Alienware x15 R2 is vergelijkbaar met die van de x15 R1
Links hebben we een voedingsadapterpoort, terwijl rechts alleen de 3,5 mm combo audio-aansluiting zit. De audio-aansluiting is verder naar achteren geplaatst, wat vervelend kan zijn als uw bedrade headsets kortere kabels gebruiken
De achterkant bevat een USB 3.2 Gen 1 Type-A poort met PowerShare, een USB 3.2 Gen 2 Type-C poort en een Thunderbolt 4 poort. De USB Type-C en Thunderbolt 4 poorten ondersteunen Power Delivery. Een microSD-kaartlezer en een HDMI 2.1-out-poort ronden het poortaanbod af. Een Kensington-slot en een RJ-45-aansluiting zijn niet aanwezig. Dell bundelt echter een USB Type-C naar RJ-45 dongle in de doos die 2,5 GbE LAN-connectiviteit biedt
De plaatsing van de poorten vormt geen belemmering bij het aansluiten van meerdere randapparaten. Dat gezegd zijnde, kan de eenzijdige plaatsing van alle belangrijke poorten aan de achterkant de toegang tot deze poorten een beetje lastig maken, vooral als u veel randapparatuur verwisselt.


SD-kaartlezer
De microSD kaartlezer presteert bewonderenswaardig in onze tests. De prestaties lijken een beetje langzamer dan wat we eerder met de x15 R1 hadden gezien, maar het is in dezelfde klasse als die van de Asus ROG Zephyrus Duo 16 en de Razer Blade 15 Advanced.
| SD Card Reader | |
| average JPG Copy Test (av. of 3 runs) | |
| Alienware x15 RTX 3070 P111F (AV Pro V60) | |
| Razer Blade 15 Advanced Model Early 2022 (AV PRO microSD 128 GB V60) | |
| Asus ROG Zephyrus Duo 16 GX650RX (AV PRO microSD 128 GB V60) | |
| Alienware x15 R2 P111F (AV PRO microSD 128 GB V60) | |
| Gemiddelde van klas Gaming (20.9 - 210, n=54, laatste 2 jaar) | |
| MSI Raider GE66 12UHS (AV PRO microSD 128 GB V60) | |
| MSI Titan GT77 12UHS (AV PRO microSD 128 GB V60) | |
| maximum AS SSD Seq Read Test (1GB) | |
| Alienware x15 RTX 3070 P111F (AV Pro V60) | |
| Alienware x15 R2 P111F (AV PRO microSD 128 GB V60) | |
| Asus ROG Zephyrus Duo 16 GX650RX (AV PRO microSD 128 GB V60) | |
| Gemiddelde van klas Gaming (25.5 - 261, n=51, laatste 2 jaar) | |
| MSI Titan GT77 12UHS (AV PRO microSD 128 GB V60) | |
Communicatie
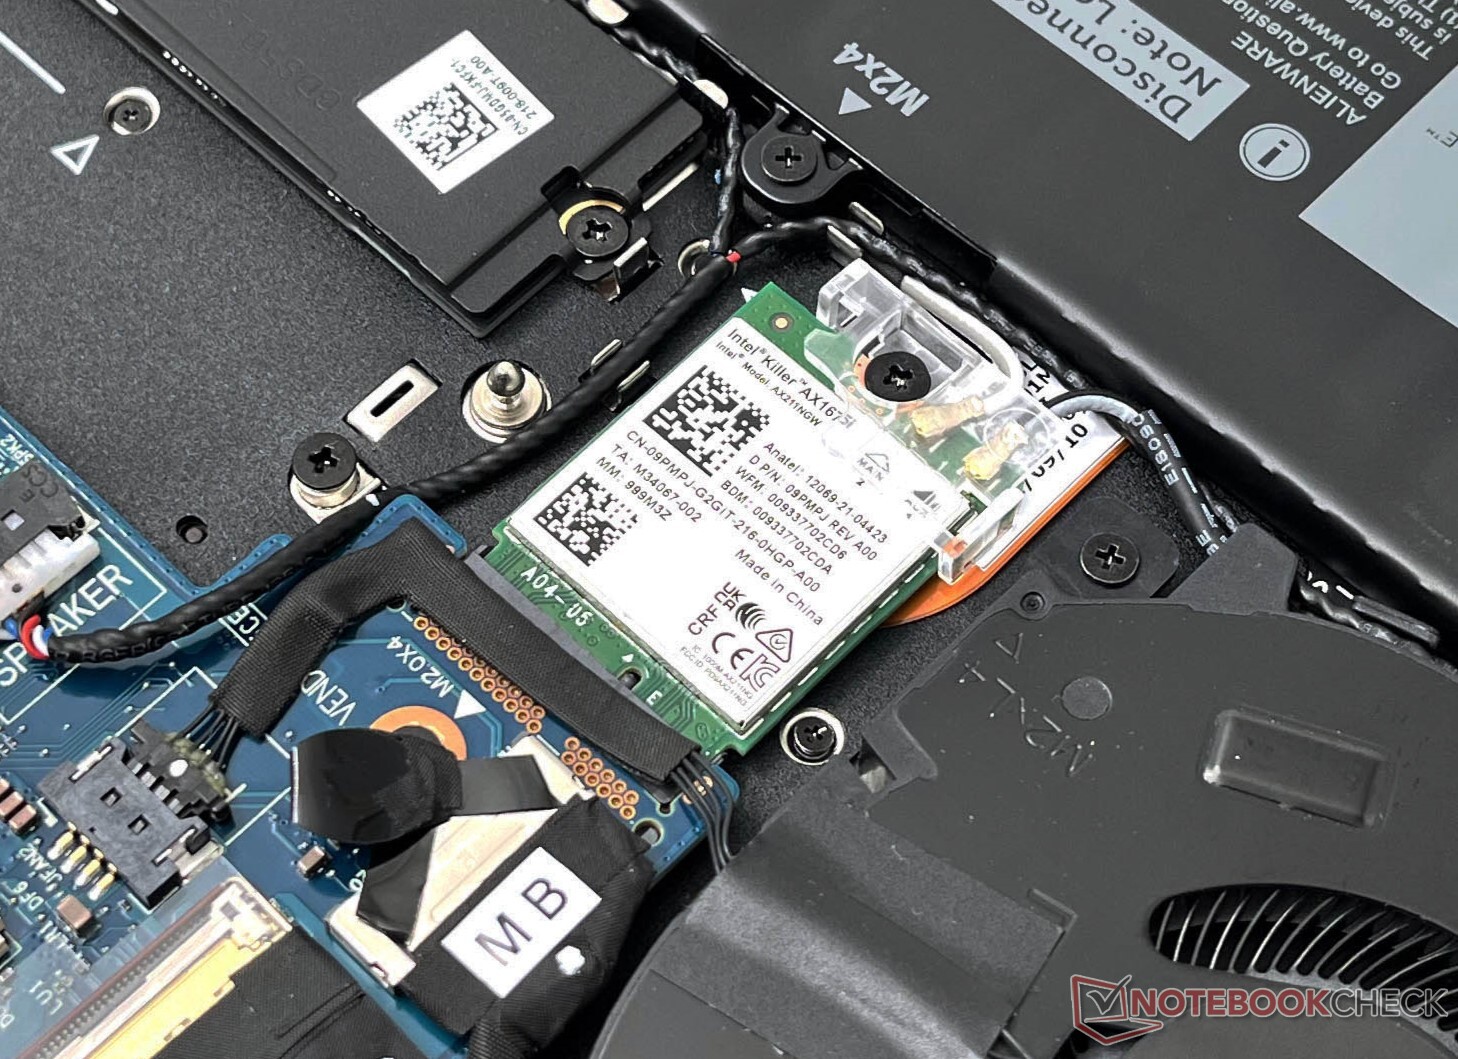
De x15 R2 is uitgerust met een Killer Wi-Fi 6E AX1675i WLAN kaart. De prestaties zijn behoorlijk, maar we hebben snellere doorvoer gezien van deze kaart in andere laptops. We hebben enkele dips waargenomen in de 5 GHz zendtest, maar de verbinding was over het algemeen vrij stabiel tijdens het testen met onze referentie Asus ROG Rapture GT-AXE11000 router.
We merkten geen tastbare voordelen bij het overschakelen naar de 6 GHz band, behalve iets hogere gemiddelde ontvangstsnelheden en hogere piekdoorvoerwaarden.
Webcam
In het tijdperk van FHD webcams levert Dell een schamele 720p shooter in de Alienware x15 R2. De webcam is nog net bruikbaar voor af en toe een videogesprek. Kleuren vertonen grote afwijkingen en donkere gebieden blijken nogal lawaaierig. De beeldscherpte en detaillering is ondermaats, zelfs bij voldoende omgevingslicht. Er is geen fysieke webcam shutter aanwezig.


Beveiliging
De x15 R2 heeft een geïntegreerde IR-camera die biometrische authenticatie op basis van Windows Hello ondersteunt. Er is geen vingerafdruklezer beschikbaar
De IR camera is gemakkelijk in te schrijven en reageert goed. Een TPM 2.0 module is ook aanwezig.
Accessoires
Naast de 240 W voedingsadapter en het gebruikelijke papierwerk, bundelt Dell ook een USB Type-C naar RJ-45 2,5 Gb Ethernet dongle in de doos.
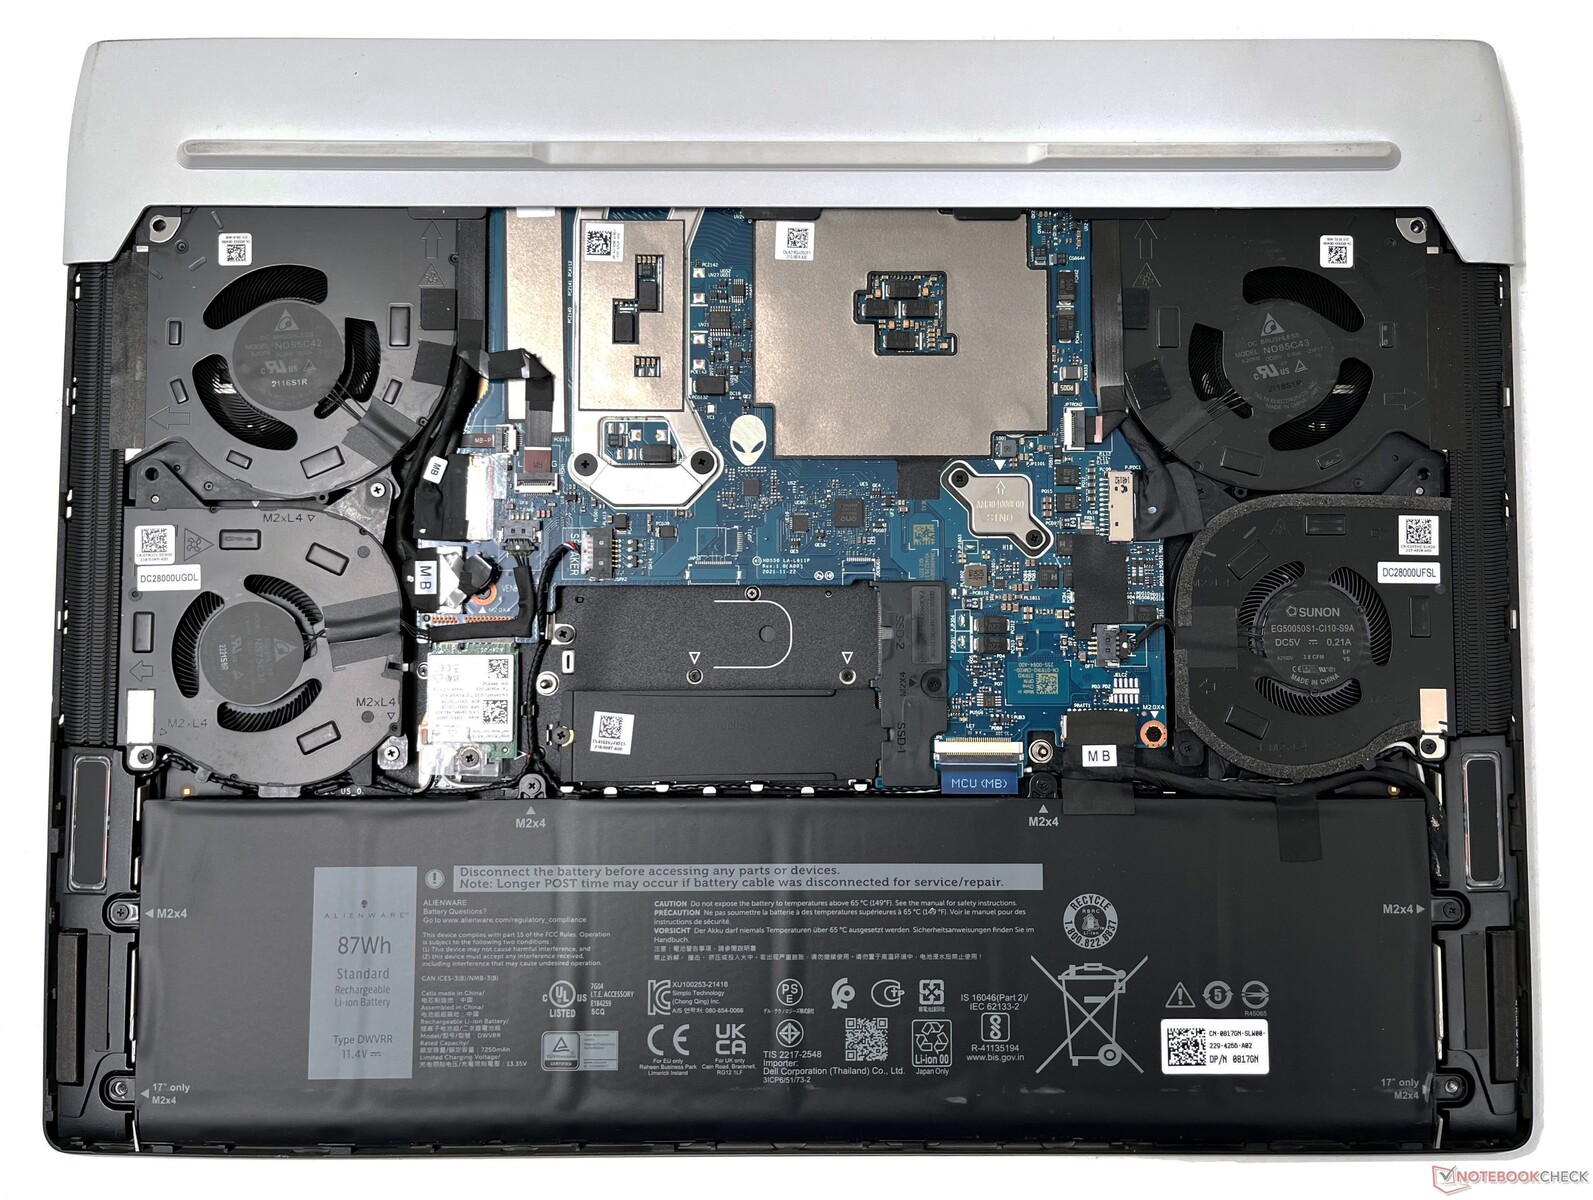
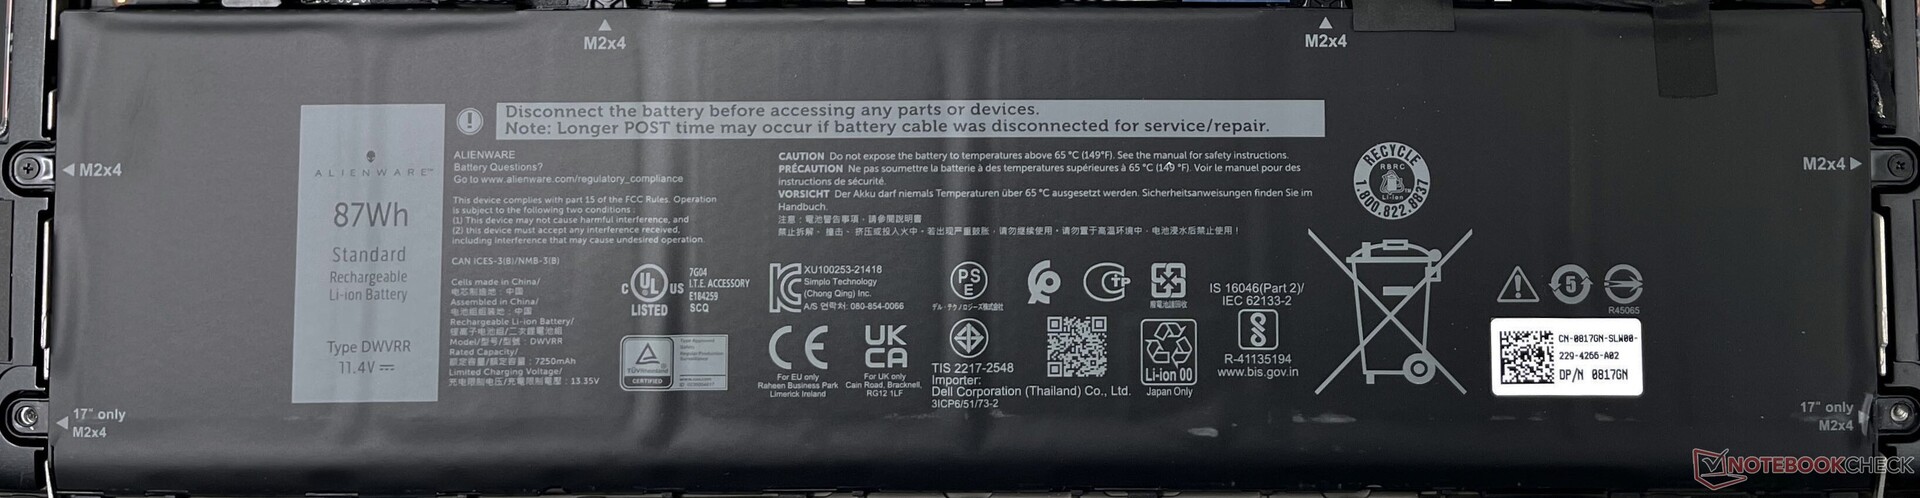
Onderhoud
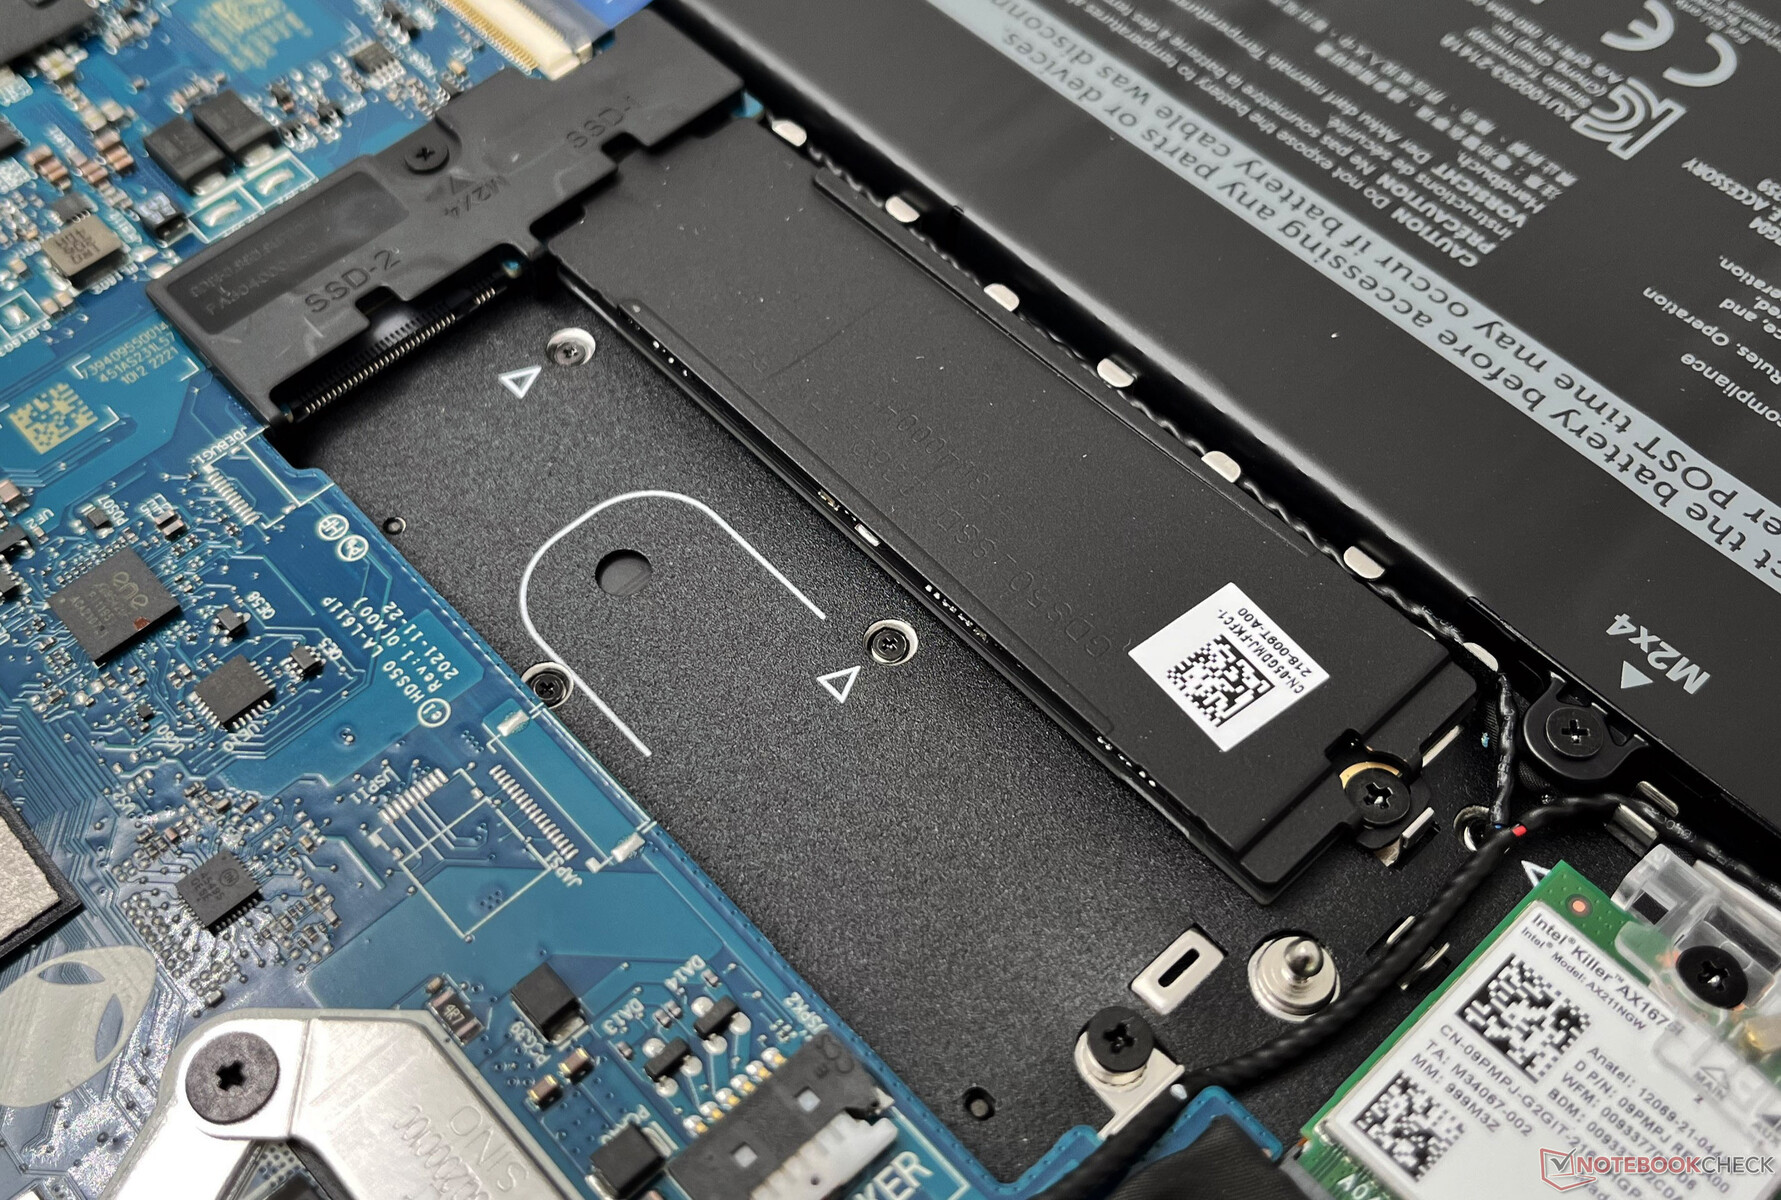
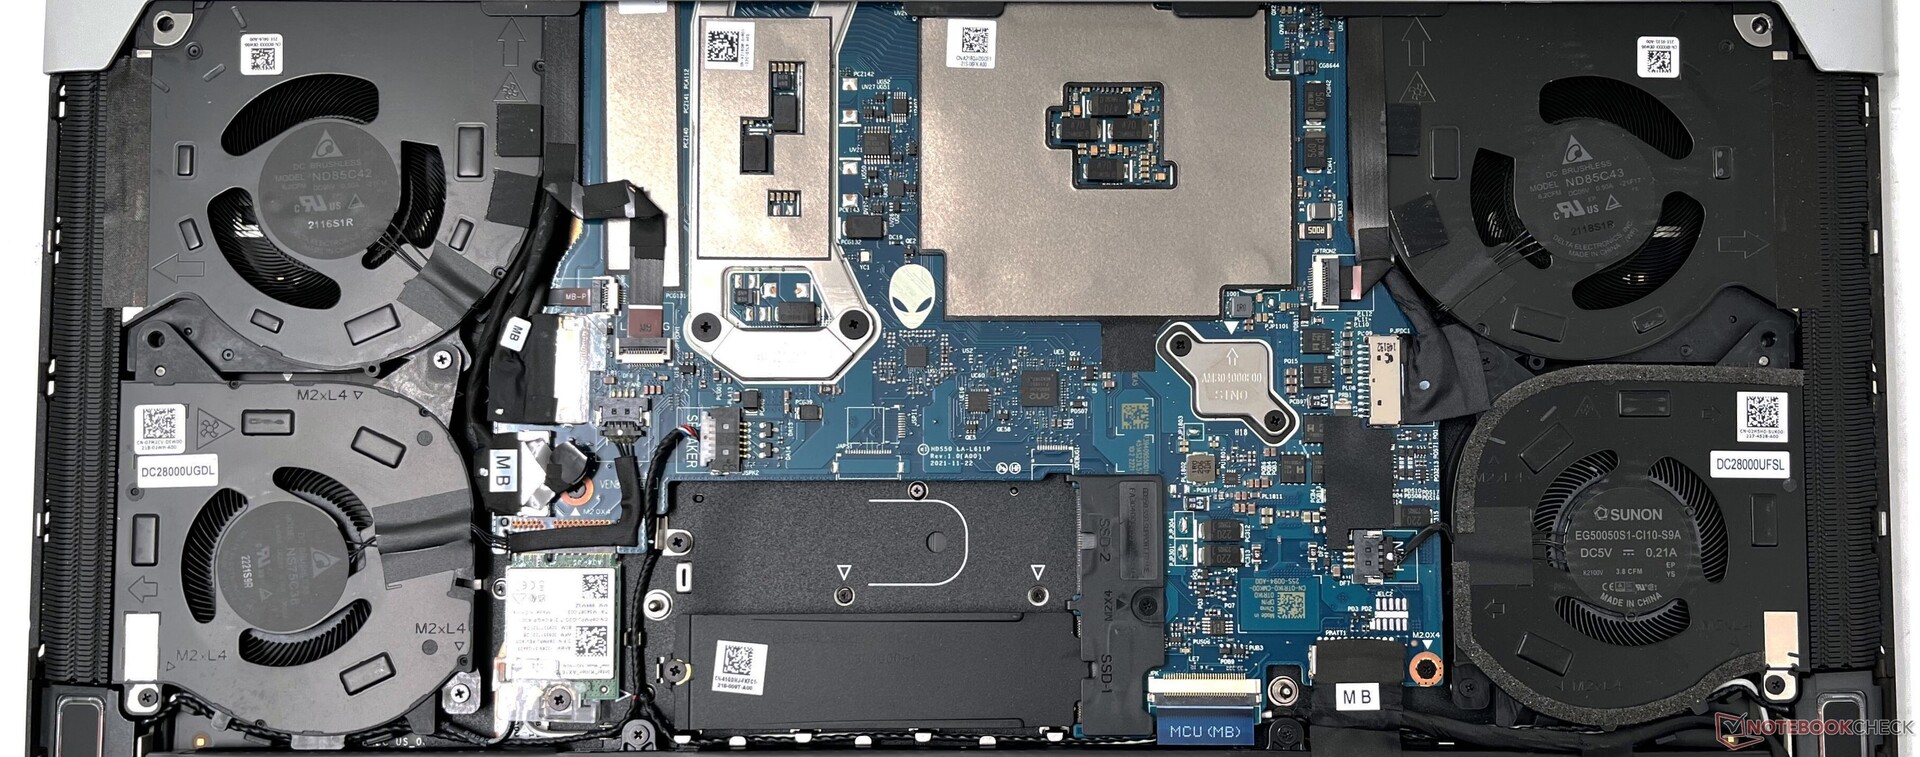
De interne onderdelen zijn toegankelijk door eenvoudigweg de zes Philips-schroeven op het bodempaneel te verwijderen. Het kost wel wat moeite om het bodempaneel volledig los te wrikken van het chassis. Er is geen onderhoudsluik voorzien
De interne lay-out is ongewijzigd ten opzichte van vorig jaar, wat ook betekent dat je opnieuw genoegen moet nemen met gesoldeerd RAM. De NVMe SSD, Killer Wi-Fi kaart en de 87 WHr batterij kunnen indien nodig vervangen worden.
Garantie
De Alienware x15 R2 wordt standaard geleverd met één jaar Premium Support Plus en Onsite Service van Dell. Extra garantie- en supportopties kunnen worden toegevoegd tijdens het afrekenen op Dell.com.
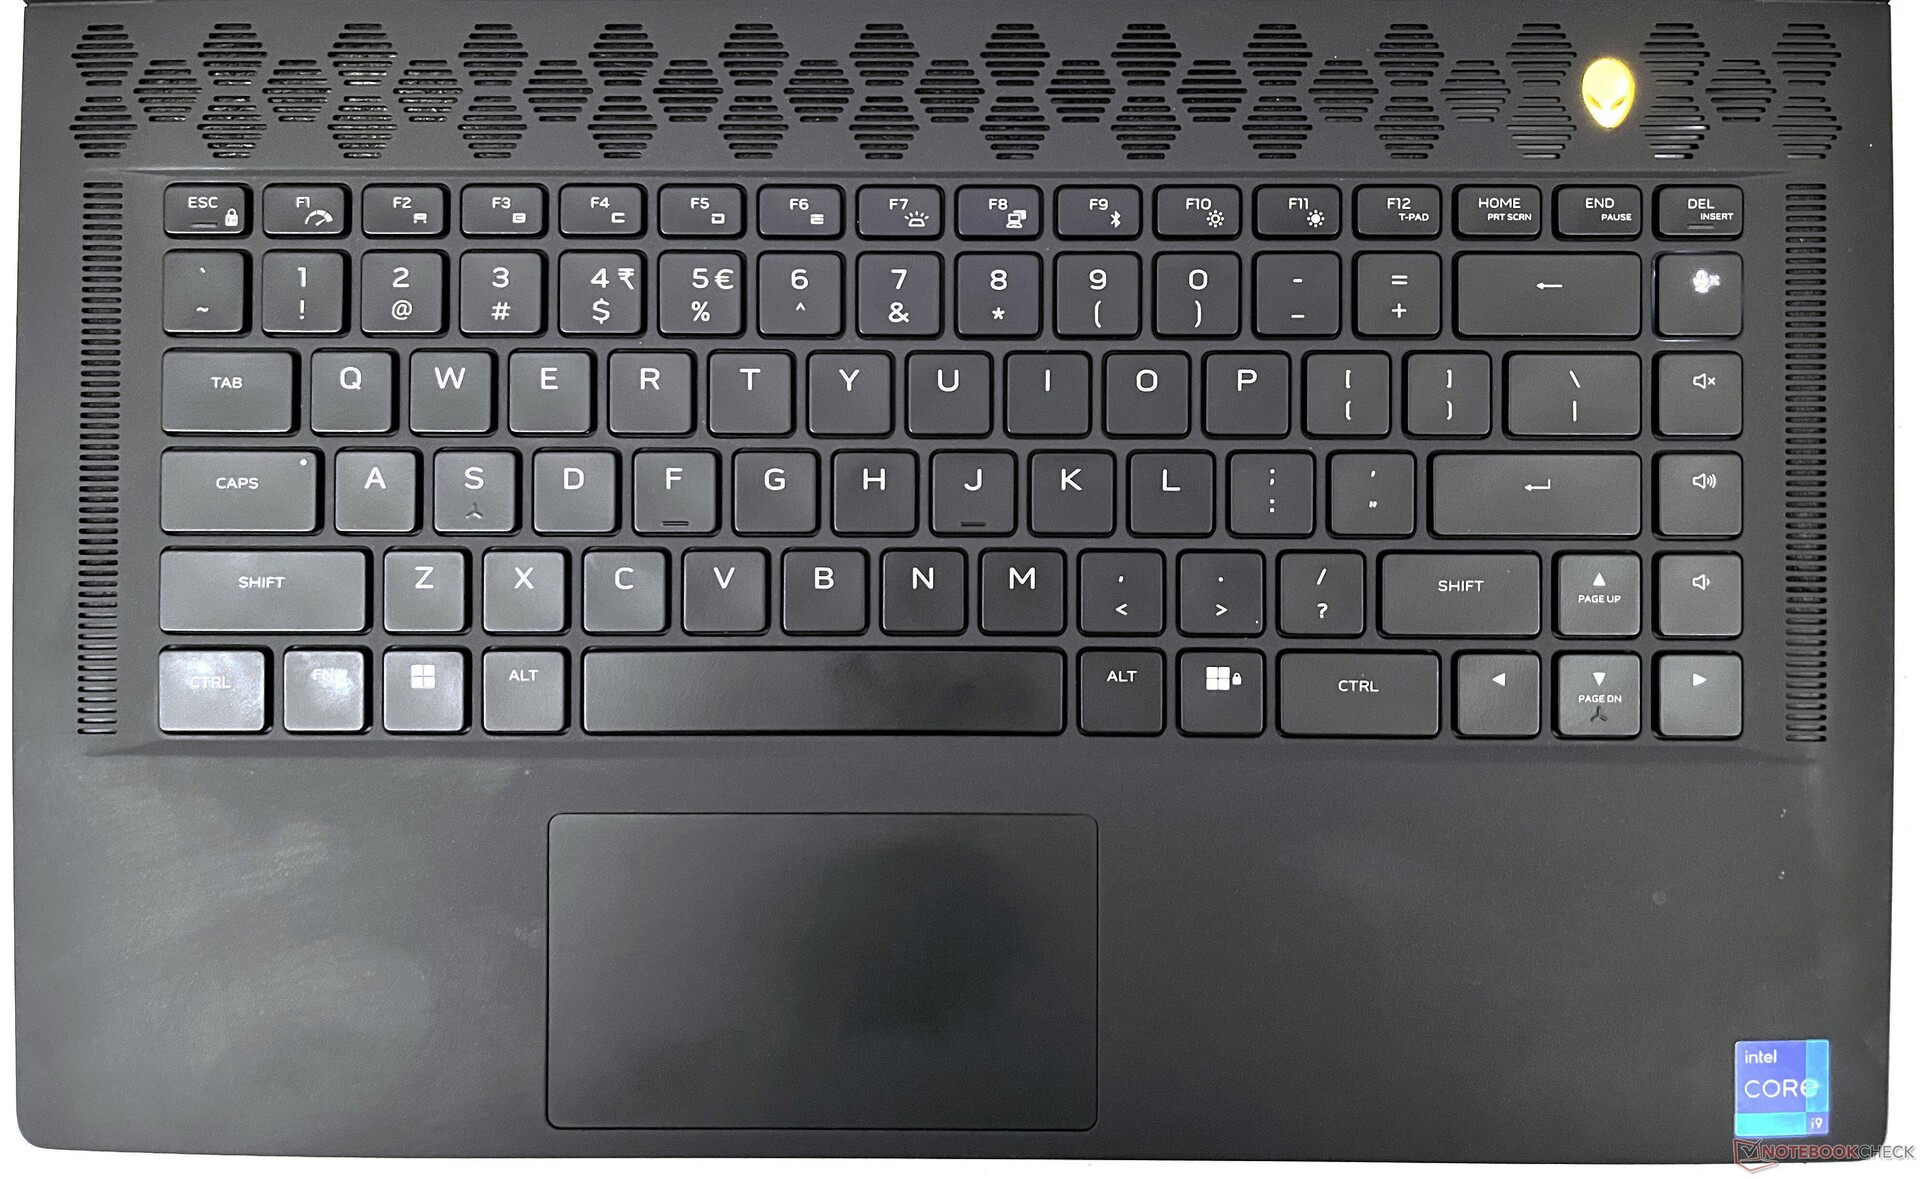
Invoerapparaten: Secundaire toetsen blijven onverlicht
Toetsenbord
Het toetsenbord blijft ongewijzigd ten opzichte van de x15 R1. Dell gebruikt een Alienware X Series dun toetsenbord met 1,5 mm toets travel, N-toets rollover en anti-ghosting technologie. Er zijn geen mechanische toetsen vanwege het dunne chassis.
Typen op het toetsenbord van de x15 R2 is over het algemeen een aangename ervaring dankzij de goede tactiele feedback. De full-size pijltjestoetsen zijn ook overgenomen van de x15 R1 en zijn een welkome aanvulling. De secundaire symbolen op de functietoetsen blijven echter onverlicht, waardoor het vervelend is om ze in het donker te gebruiken.
Touchpad
Het touchpad van 10,5 cm x 6 cm voelt wat kleiner aan in vergelijking met de concurrentie, maar biedt een soepele glijervaring. Windows Precision gebaren worden ondersteund. Klikken kost soms wat moeite en kan ook profiteren van wat extra feedback
In tegenstelling tot de x15 R1 past het kleurenschema van het touchpad van de x15 R2 bij de rest van het toetsenbord, maar het is nog steeds een vingerafdruk- en vuilmagneet.
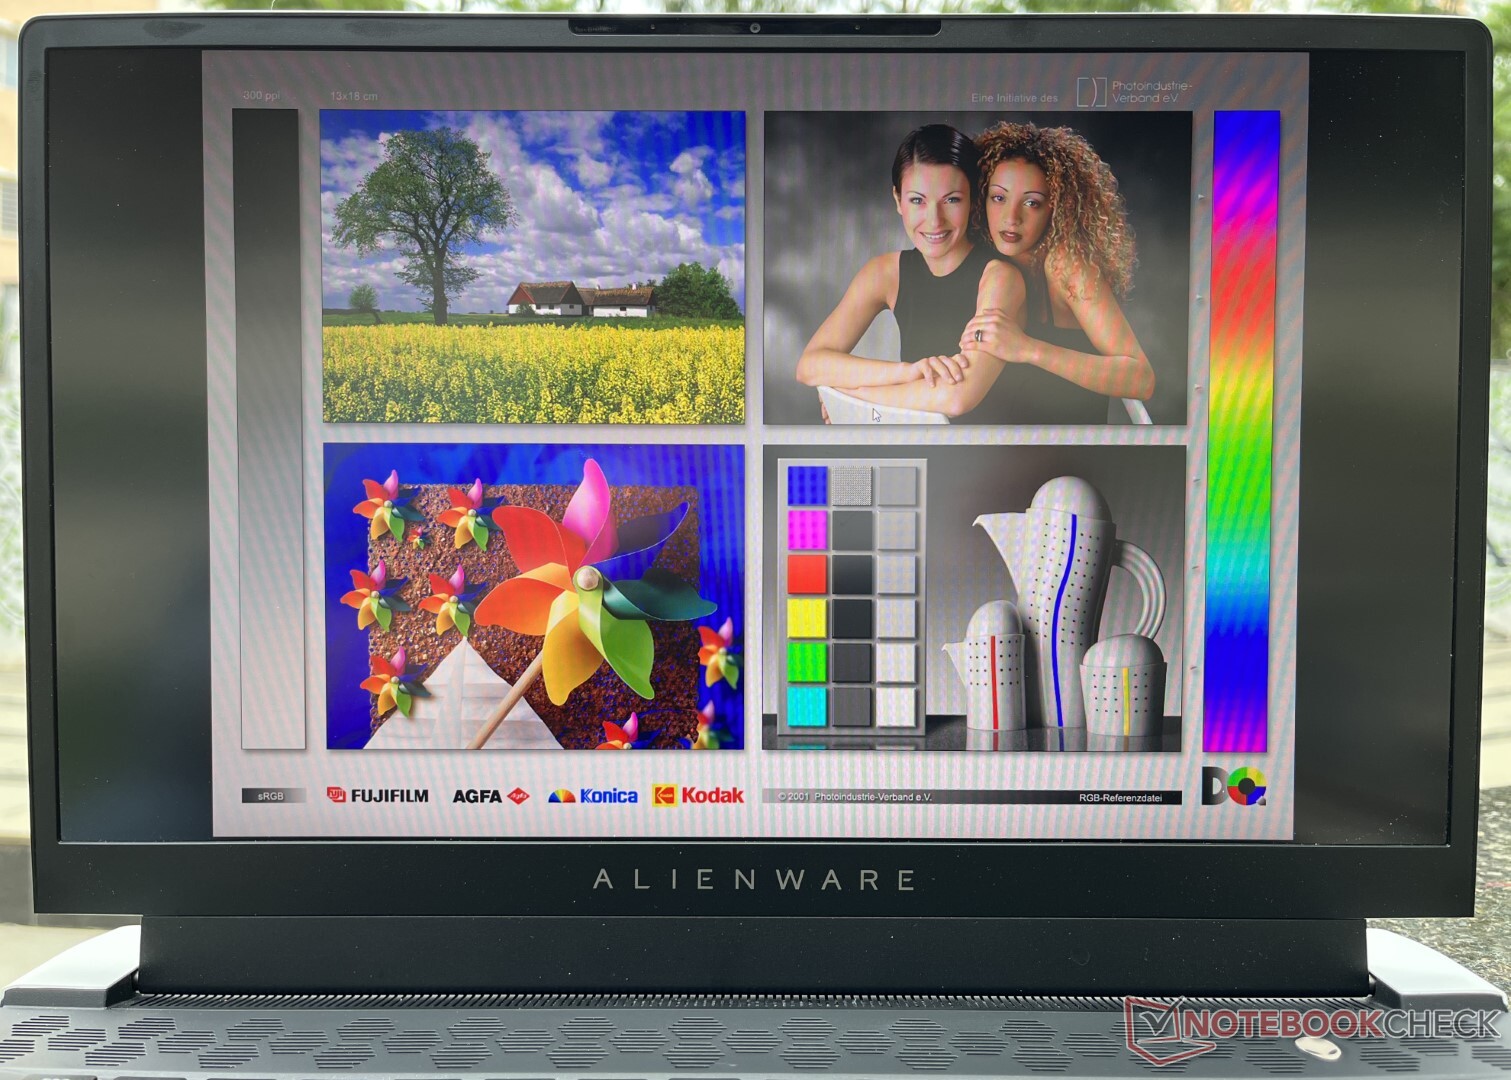
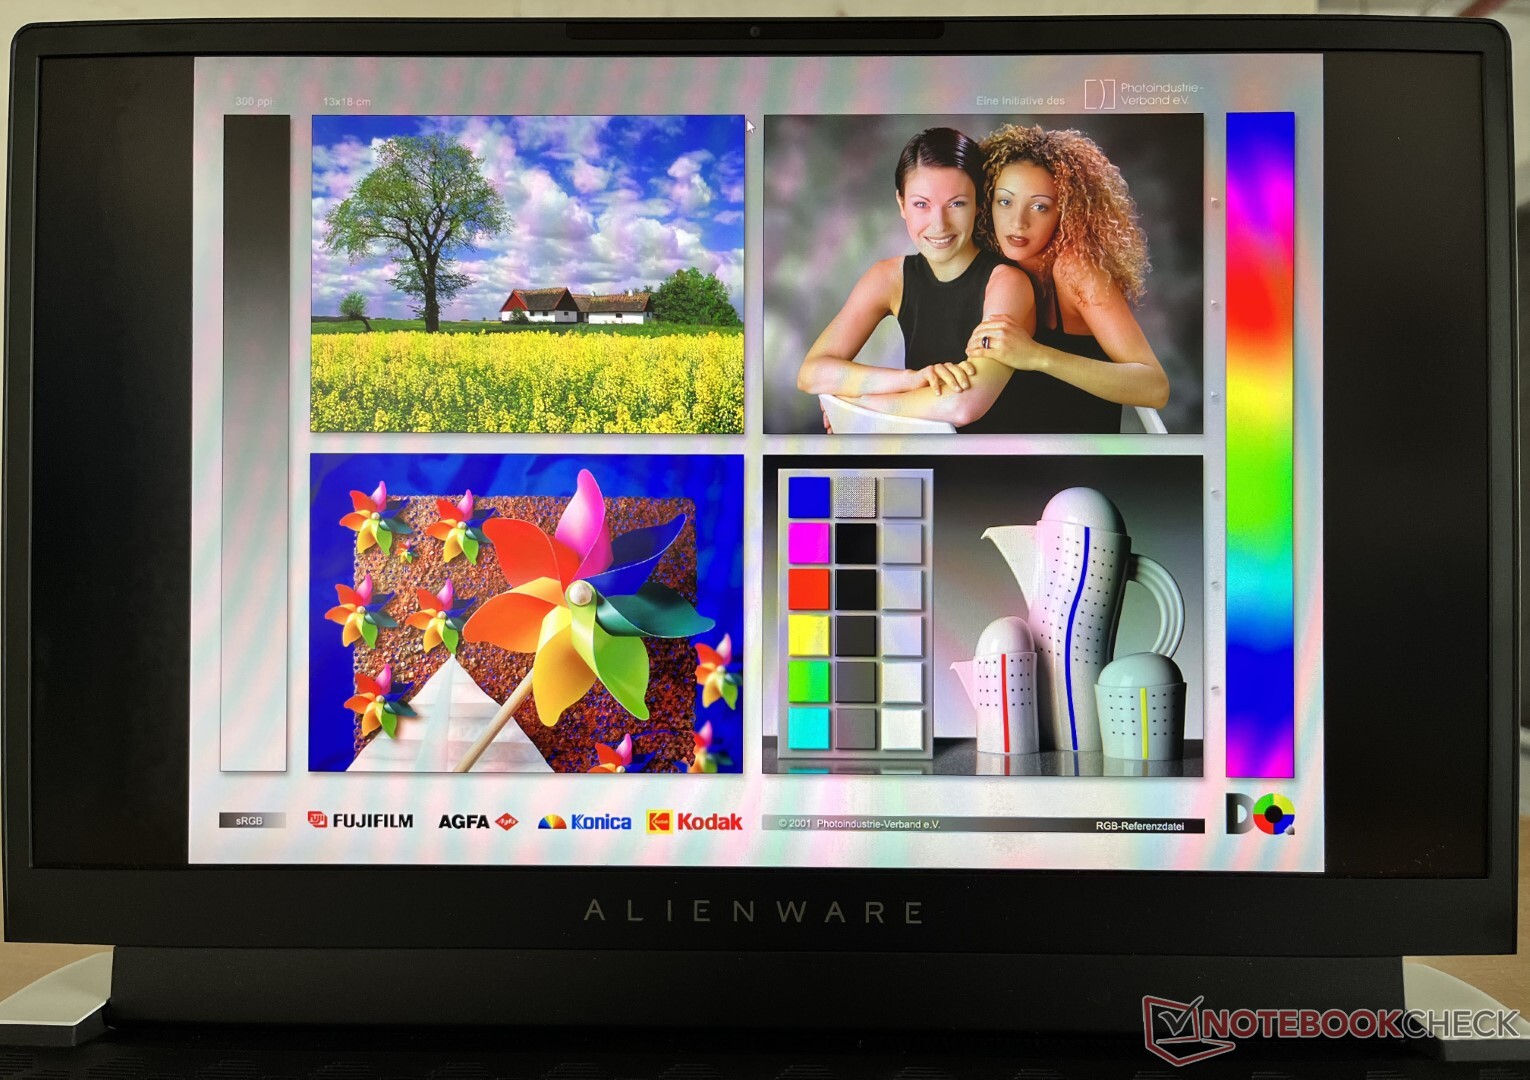
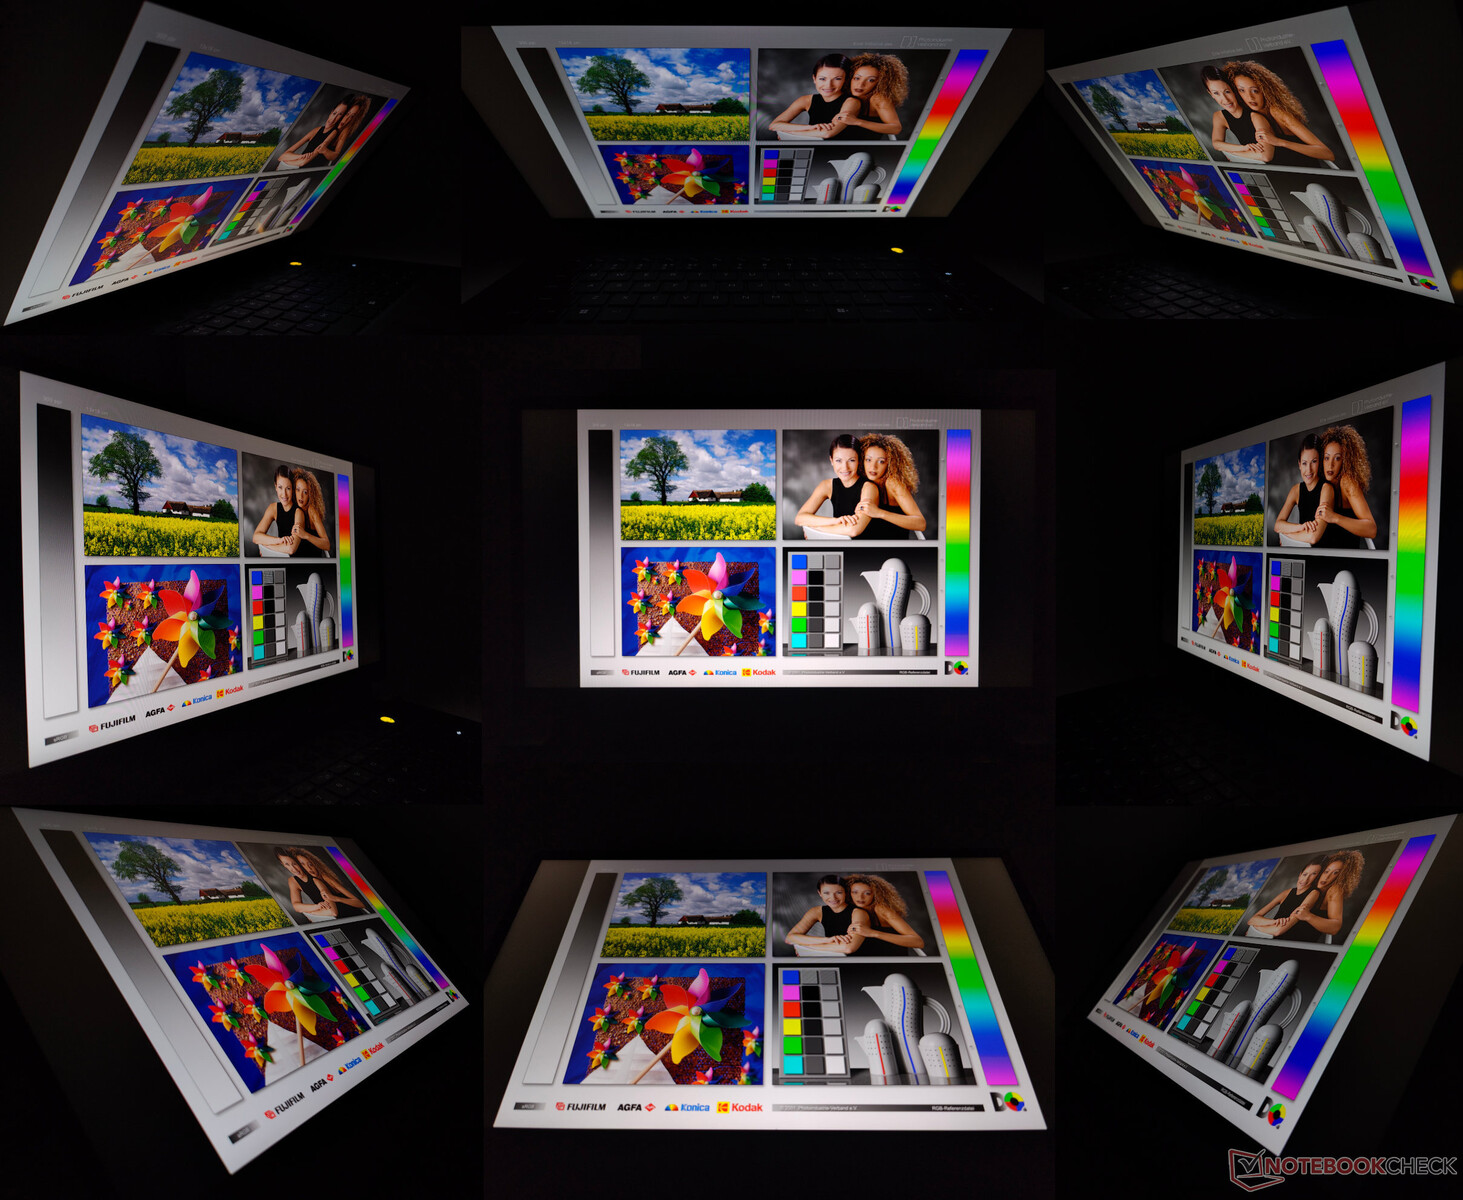
Beeldscherm: 360 Hz G-Sync paneel met Dolby Vision en geen PWM
Onze Alienware x15 R2 is uitgerust met een 1080p 360 Hz paneel. Dit is een Nvidia G-Sync paneel met ondersteuning voor Dolby Vision HDR. Gebruikers kunnen de x15 R2 ook configureren met FHD 165 Hz en QHD 240 Hz paneelopties met G-Sync en Dolby Vision ondersteuning.
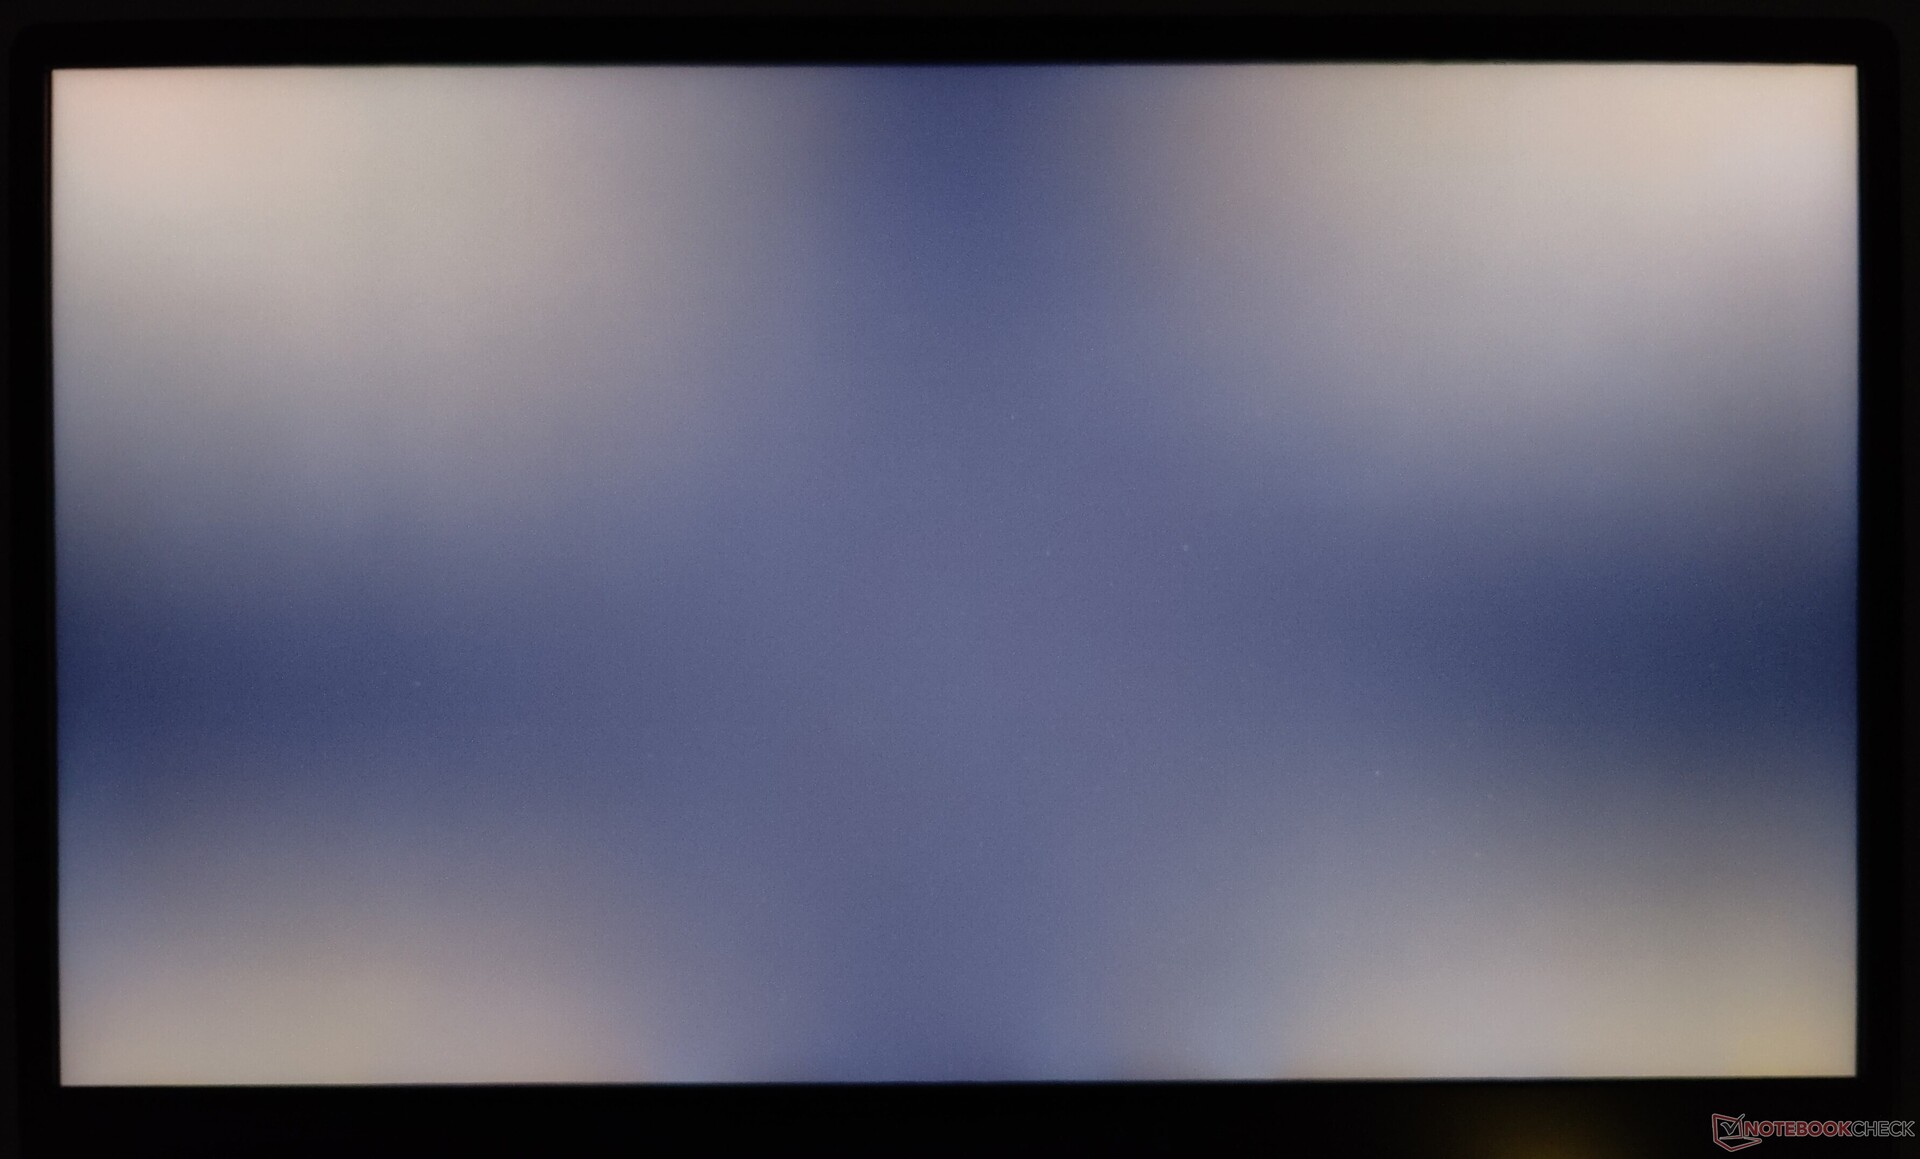
De 1080p resolutie resulteert in een grotere pixelgrootte met een totale dichtheid van 141 PPI. We hebben aanzienlijke backlight bleeding waargenomen in alle vier de hoeken bij lange belichting.
De displaykenmerken van de x15 R2 zijn vergelijkbaar met wat we eerder zagen bij de 2020 Alienware m15 R3, die ook over hetzelfde paneel beschikt. De helderheidsverdeling is met 82% behoorlijk, en de gemeten contrastverhouding van 1033:1 biedt een goede subjectieve kijkervaring.

| |||||||||||||||||||||||||
Helderheidsverdeling: 82 %
Helderheid in Batterij-modus: 341 cd/m²
Contrast: 1033:1 (Zwart: 0.33 cd/m²)
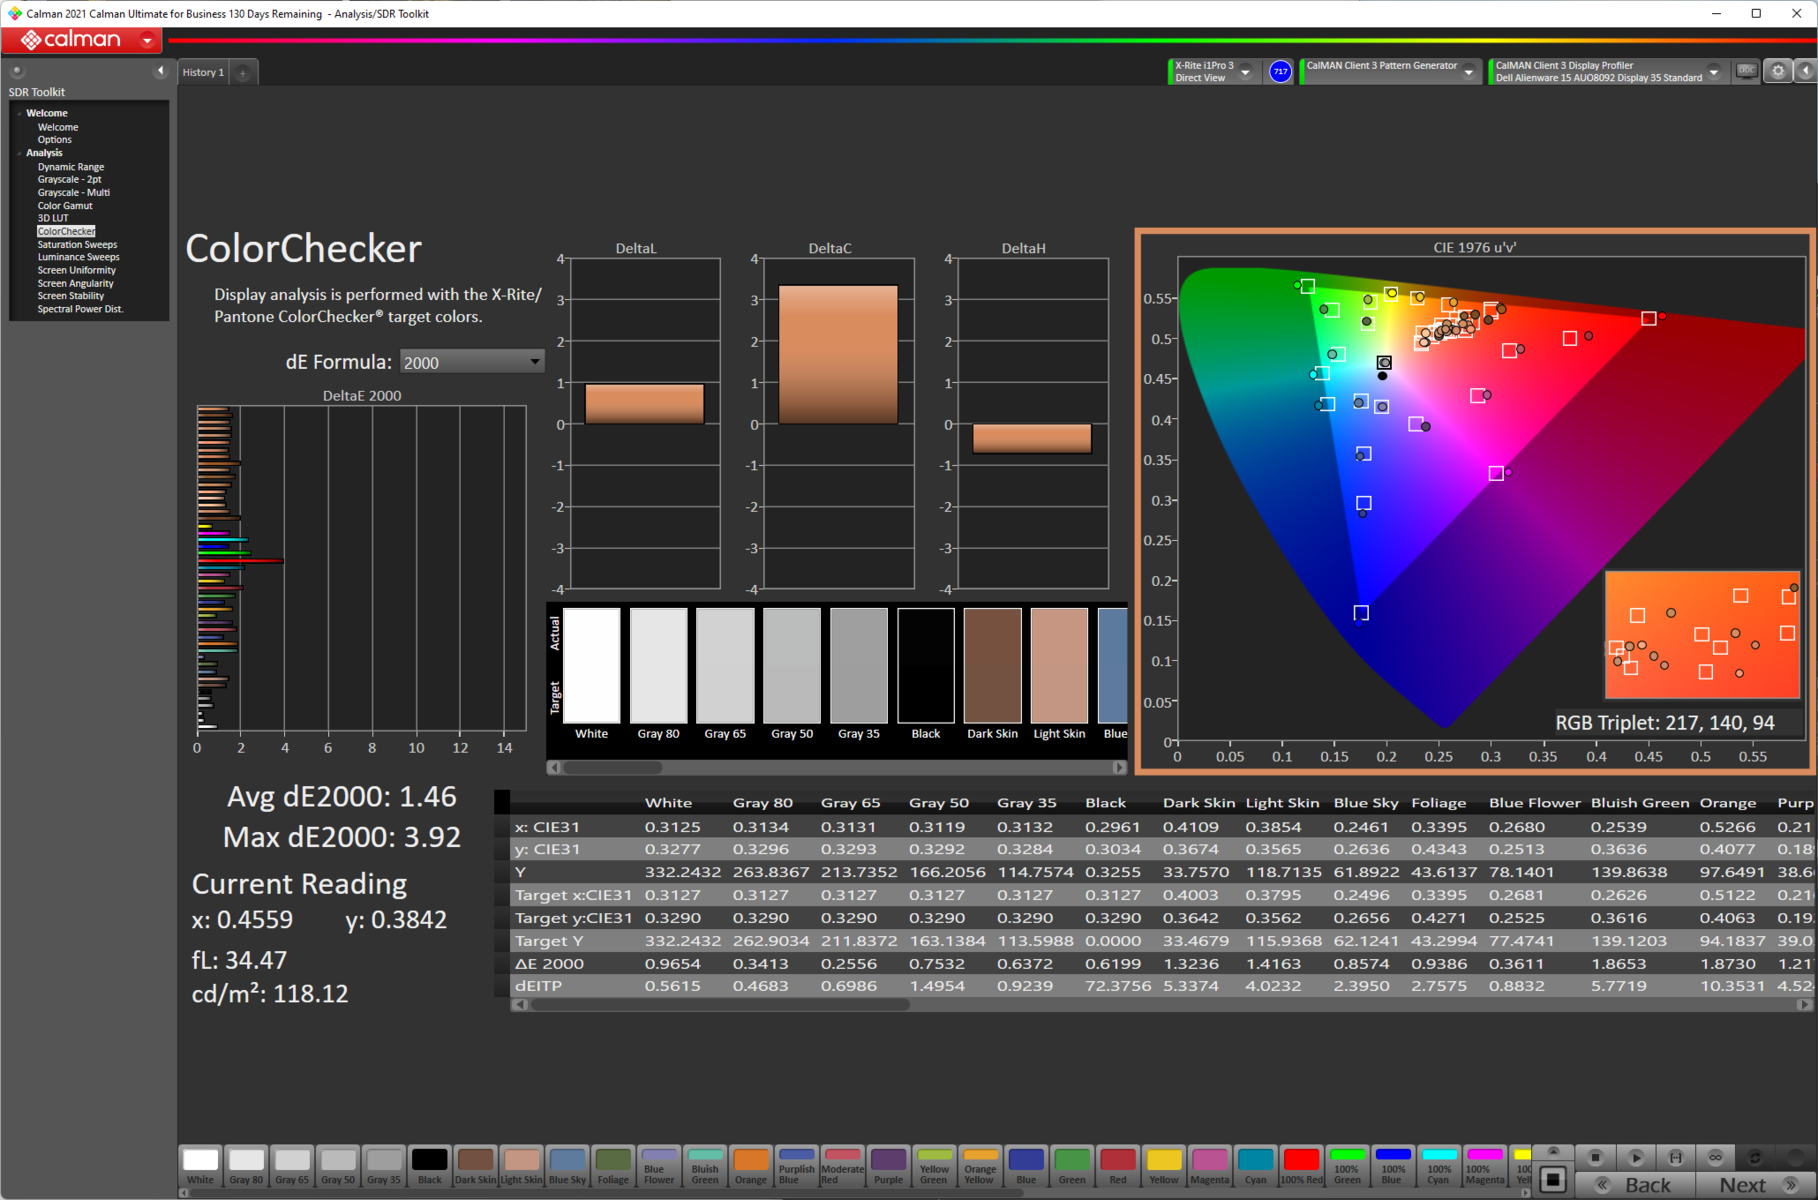
ΔE ColorChecker Calman: 2.96 | ∀{0.5-29.43 Ø4.71}
calibrated: 1.46
ΔE Greyscale Calman: 3.7 | ∀{0.09-98 Ø4.96}
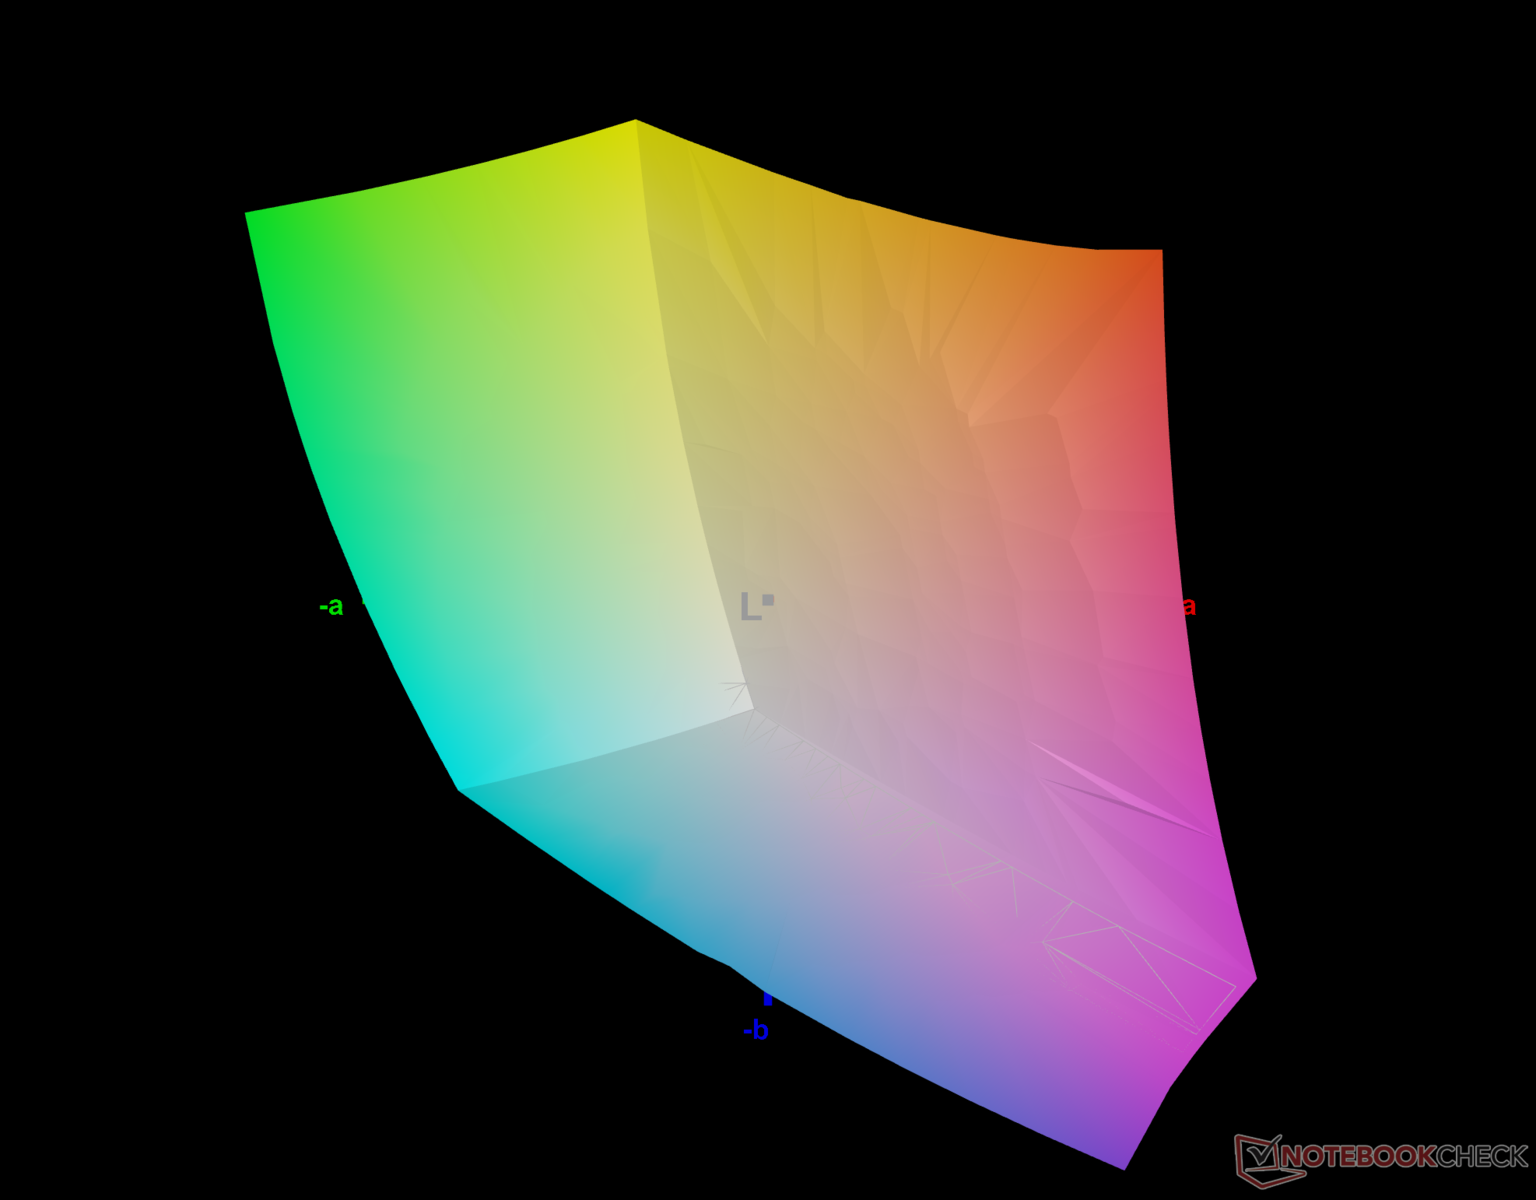
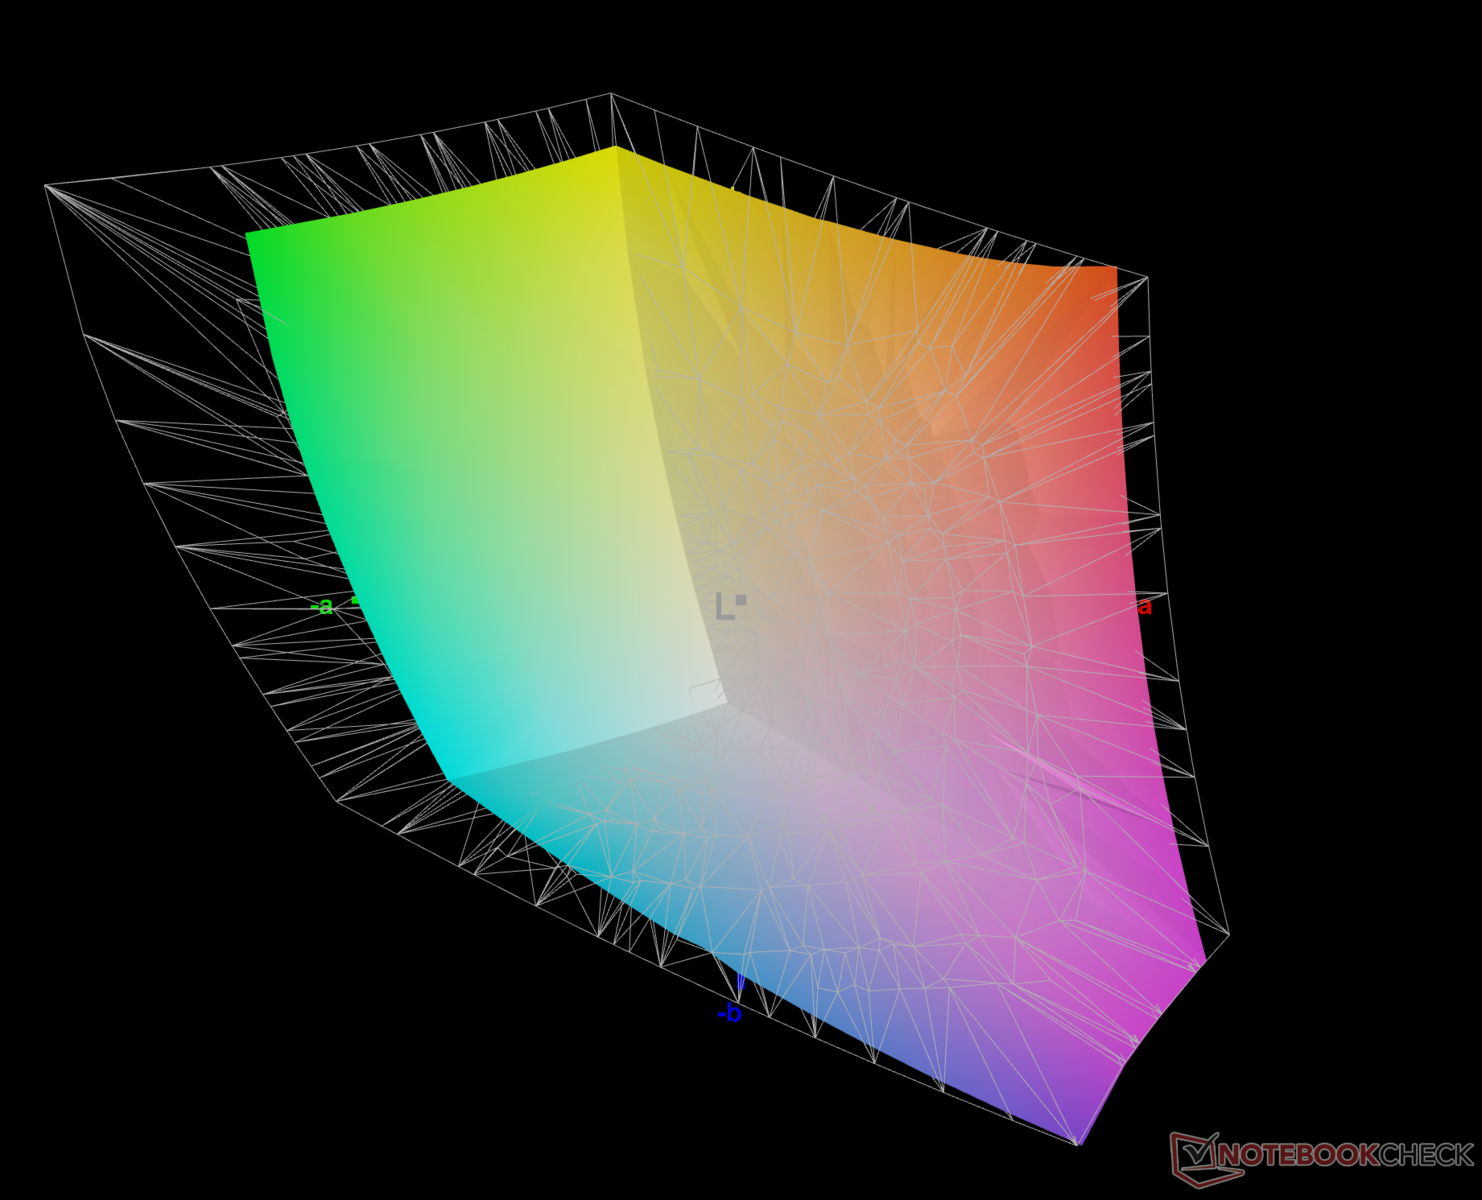
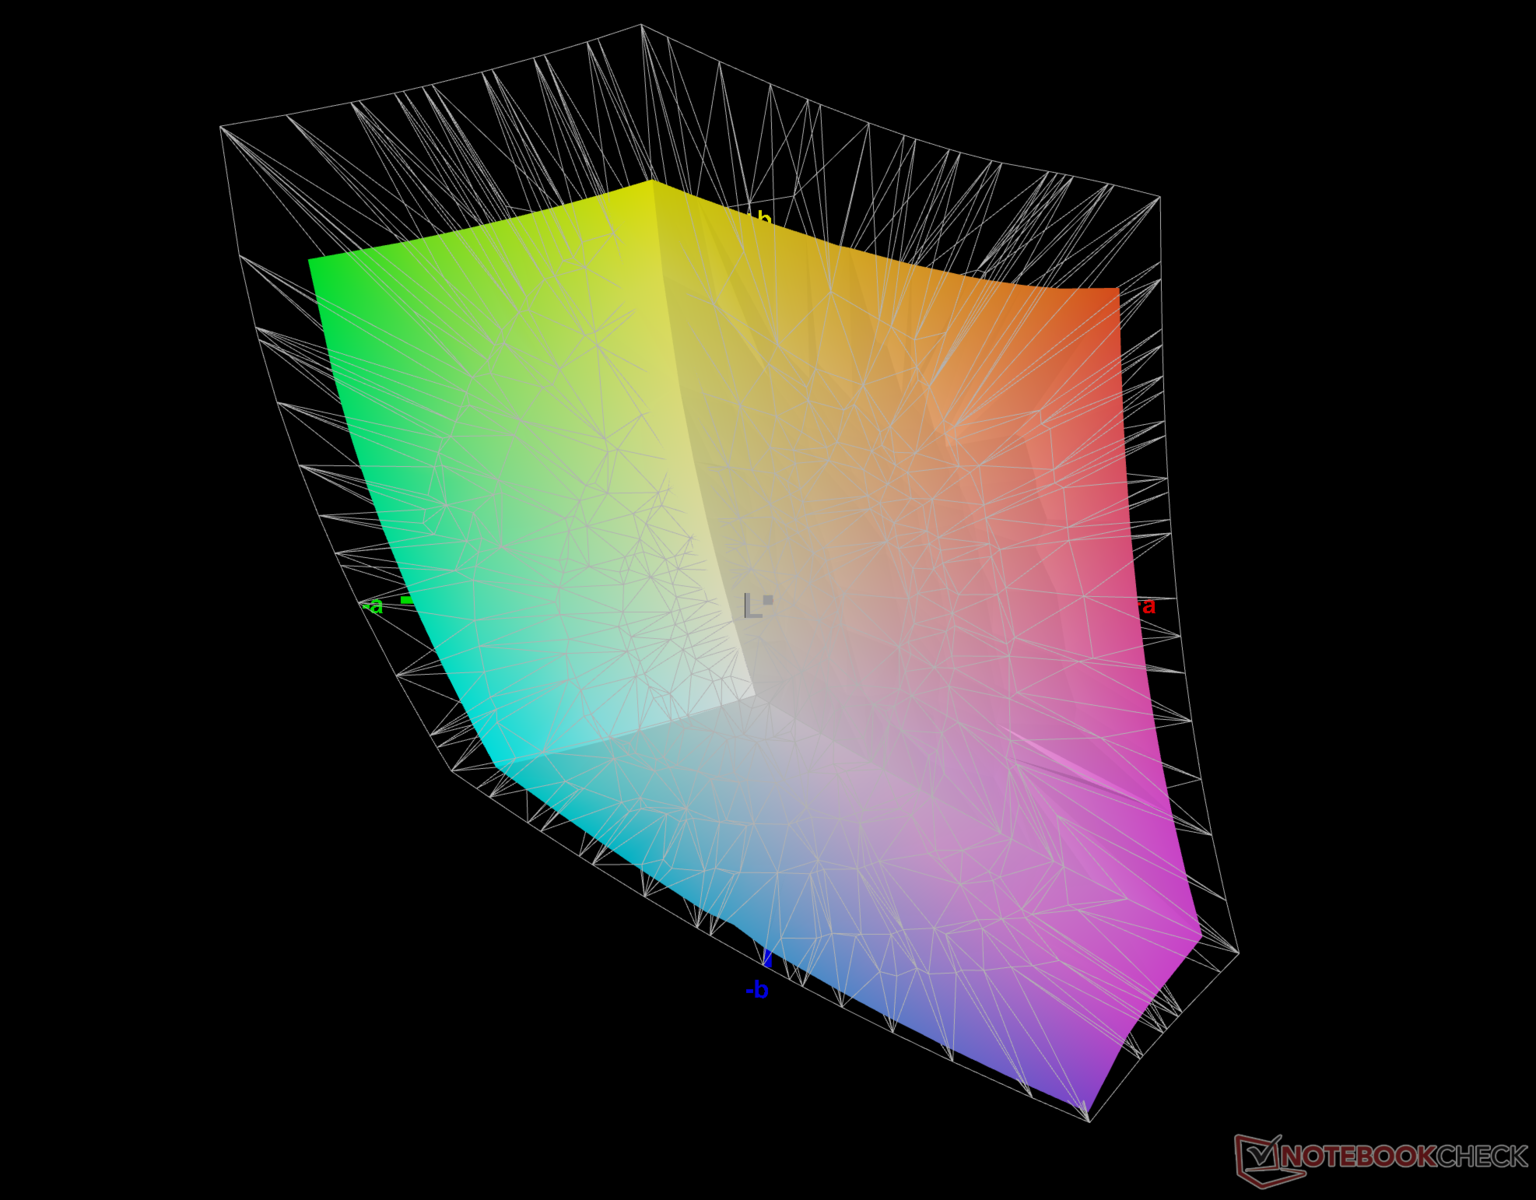
75.7% AdobeRGB 1998 (Argyll 3D)
100% sRGB (Argyll 3D)
74.7% Display P3 (Argyll 3D)
Gamma: 2.15
CCT: 6351 K
| Alienware x15 R2 P111F AU Optronics B156HAN (AUO8092), IPS, 1920x1080, 15.6" | Alienware x15 RTX 3070 P111F LG Philips 156QHG, IPS, 2560x1440, 15.6" | Asus ROG Strix Scar 15 G533ZW-LN106WS BOE CQ NE156QHM-NZ2, IPS-level, 2560x1440, 15.6" | MSI Titan GT77 12UHS Sharp SHP1544 LQ173M1JW08, IPS-Level, 1920x1080, 17.3" | MSI Vector GP66 12UGS BOE NE156FHM-NZ3, IPS, 1920x1080, 15.6" | Razer Blade 15 Advanced Model Early 2022 TL156VDXP02-0, IPS, 1920x1080, 15.6" | |
|---|---|---|---|---|---|---|
| Display | 16% | 14% | -3% | -4% | -13% | |
| Display P3 Coverage (%) | 74.7 | 97.8 31% | 96.2 29% | 70.8 -5% | 70.1 -6% | 65.3 -13% |
| sRGB Coverage (%) | 100 | 99.9 0% | 99.9 0% | 98.9 -1% | 99.5 0% | 85.1 -15% |
| AdobeRGB 1998 Coverage (%) | 75.7 | 84.5 12% | 73 -4% | 72.1 -5% | 67.4 -11% | |
| Response Times | -429% | -232% | -64% | -209% | -168% | |
| Response Time Grey 50% / Grey 80% * (ms) | 1.47 ? | 12 ? -716% | 7.86 ? -435% 4.21 ? -186% | 3.03 ? -106% | 5.8 ? -295% | 4.3 ? -193% |
| Response Time Black / White * (ms) | 4.32 ? | 10.4 ? -141% | 7.5 ? -74% | 5.28 ? -22% | 9.6 ? -122% | 10.5 ? -143% |
| PWM Frequency (Hz) | ||||||
| Screen | -4% | -24% | -7% | 4% | 30% | |
| Brightness middle (cd/m²) | 341 | 409.5 20% | 346 1% | 280 -18% | 353.1 4% | 330 -3% |
| Brightness (cd/m²) | 316 | 390 23% | 329 4% | 275 -13% | 325 3% | 315 0% |
| Brightness Distribution (%) | 82 | 88 7% | 91 11% | 79 -4% | 85 4% | 89 9% |
| Black Level * (cd/m²) | 0.33 | 0.47 -42% | 0.59 -79% | 0.4 -21% | 0.38 -15% | 0.24 27% |
| Contrast (:1) | 1033 | 871 -16% | 586 -43% | 700 -32% | 929 -10% | 1375 33% |
| Colorchecker dE 2000 * | 2.96 | 3.48 -18% | 3.06 -3% | 2.1 29% | 2.24 24% | 1.47 50% |
| Colorchecker dE 2000 max. * | 5.33 | 6.31 -18% | 5.81 -9% | 5.83 -9% | 5 6% | 2.73 49% |
| Colorchecker dE 2000 calibrated * | 1.46 | 0.89 39% | 2.57 -76% | 1.58 -8% | 1.02 30% | 0.63 57% |
| Greyscale dE 2000 * | 3.7 | 5 -35% | 3.3 11% | 4 -8% | 1.8 51% | |
| Gamma | 2.15 102% | 2.16 102% | 2.12 104% | 2.13 103% | 2.24 98% | 2.282 96% |
| CCT | 6351 102% | 6591 99% | 7021 93% | 7060 92% | 6864 95% | 6499 100% |
| Totaal Gemiddelde (Programma / Instellingen) | -139% /
-67% | -81% /
-61% | -25% /
-15% | -70% /
-28% | -50% /
-7% |
* ... kleiner is beter
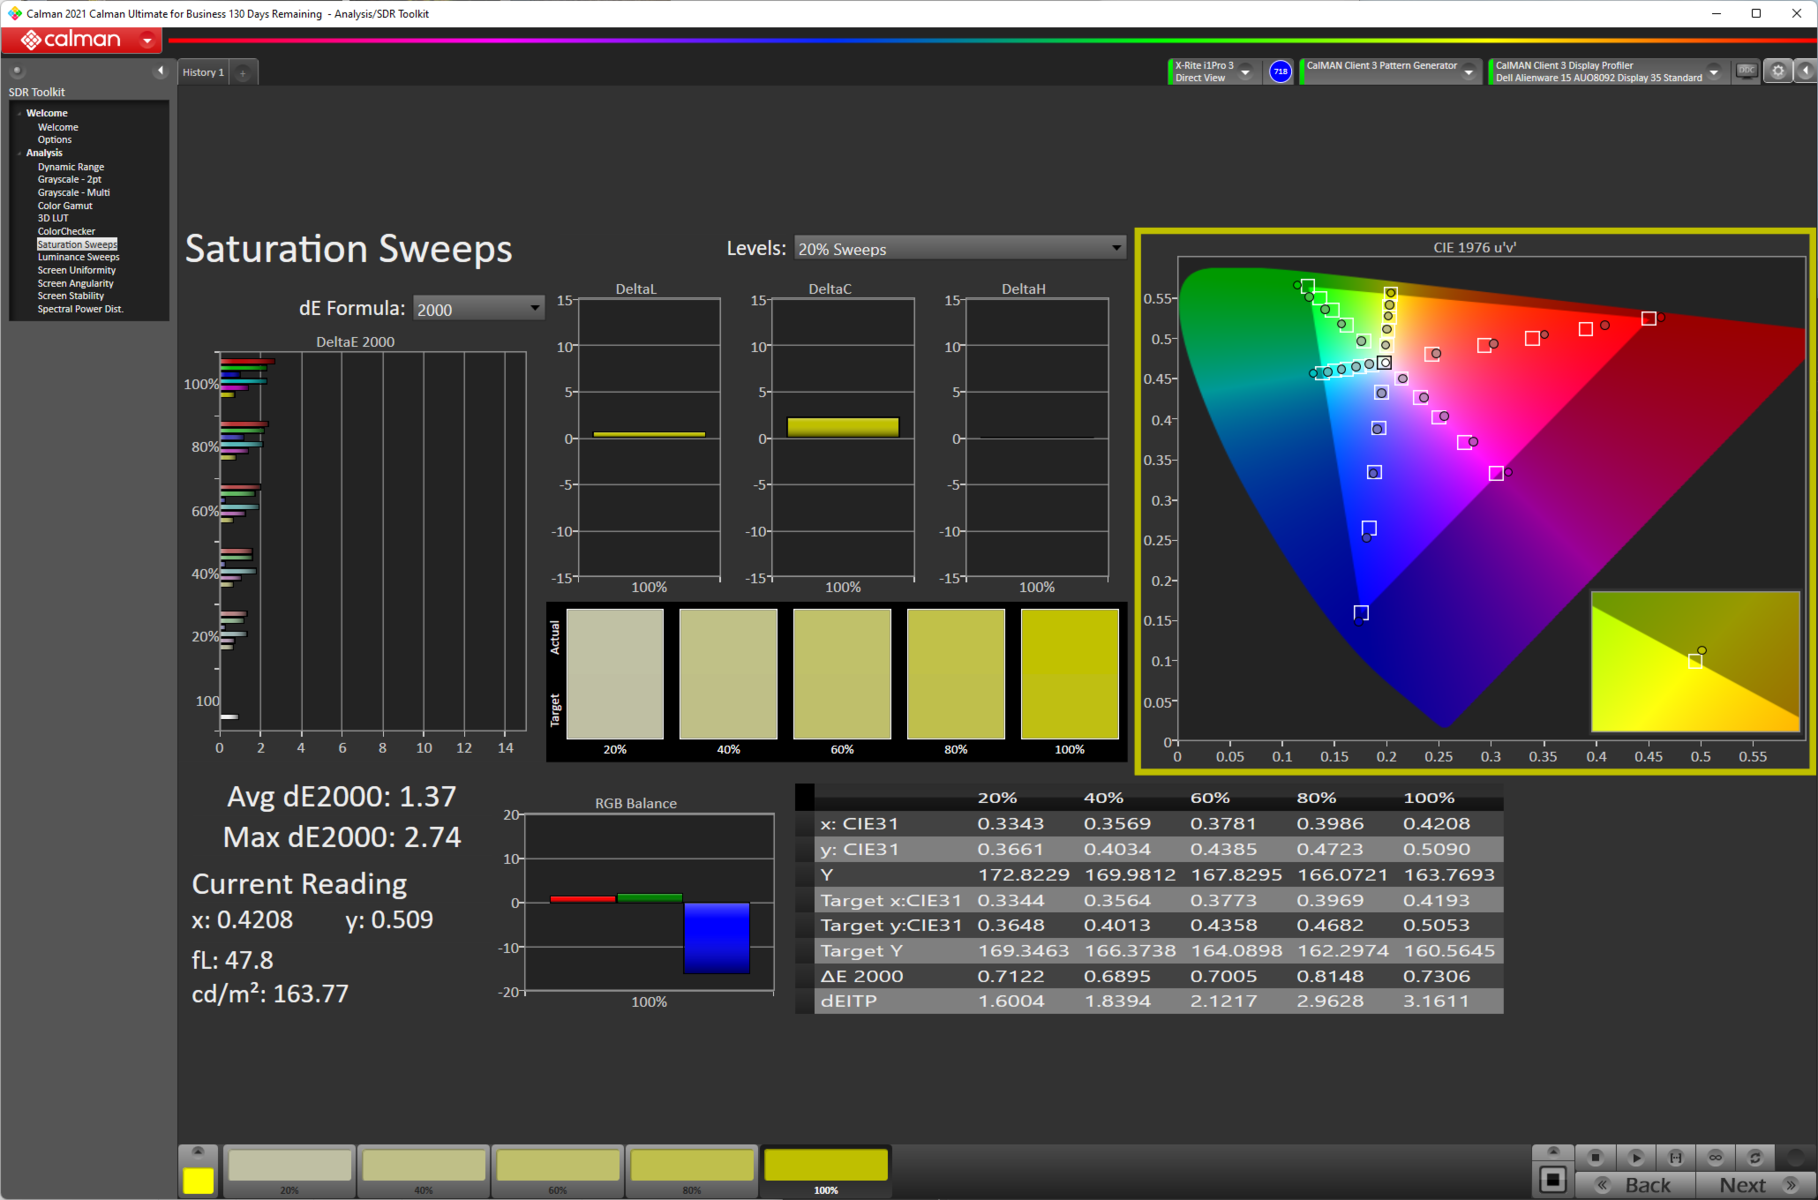
De kleurruimte dekking van de Alienware x15 R2 is goed gezien het feit dat dit voornamelijk een gaming laptop is. Het sRGB kleurengamma is volledig gedekt, en de 75,7% AdobeRGB dekking zou nog steeds bruikbaar moeten zijn voor niet-professionele content creatie. Display P3 dekking is ook fatsoenlijk met 74,7%.
De kleurnauwkeurigheid uit de doos is niet om over naar huis te schrijven, maar is niettemin bruikbaar met een gemiddelde grijswaarden Delta E van 3,7 en een gemiddelde ColorChecker Delta E van 2,96
Onze gestandaardiseerde kalibratieroutine met de X-rite i1Basic Pro 3 spectrofotometer en Calman Ultimate kleurkalibratiesoftware van Portrait Displays helpt bij merkbare verbeteringen in de kleurnauwkeurigheid door de gemiddelde grijswaarden Delta E te verlagen tot 0,7 en de gemiddelde ColorChecker Delta E tot 1,46. We zien nog steeds hogere afwijkingen in de rode kleur
Het gekalibreerde ICC-bestand kan worden gedownload via bovenstaande link.
Responstijd Scherm
| ↔ Responstijd Zwart naar Wit | ||
|---|---|---|
| 4.32 ms ... stijging ↗ en daling ↘ gecombineerd | ↗ 2.17 ms stijging | 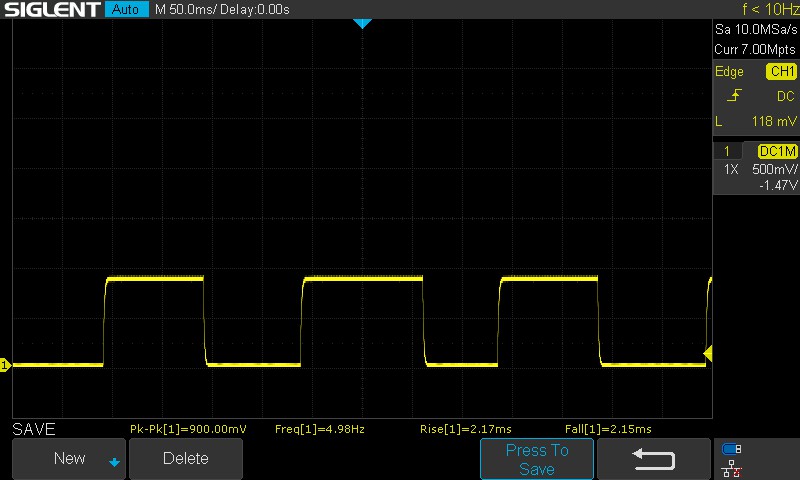 |
| ↘ 2.15 ms daling | ||
| Het scherm vertoonde erg snelle responstijden in onze tests en zou zeer geschikt moeten zijn voor snelle games. Ter vergelijking: alle testtoestellen variëren van 0.1 (minimum) tot 240 (maximum) ms. » 17 % van alle toestellen zijn beter. Dit betekent dat de gemeten responstijd beter is dan het gemiddelde (19.8 ms) van alle geteste toestellen. | ||
| ↔ Responstijd 50% Grijs naar 80% Grijs | ||
| 1.47 ms ... stijging ↗ en daling ↘ gecombineerd | ↗ 0.49 ms stijging | 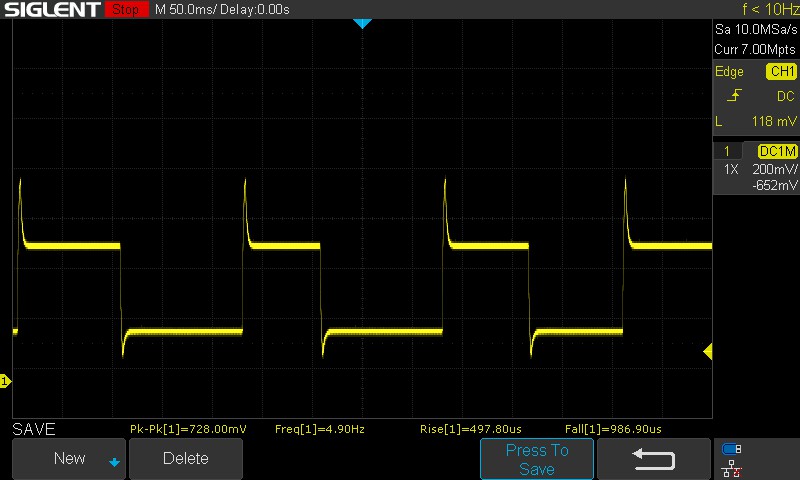 |
| ↘ 0.98 ms daling | ||
| Het scherm vertoonde erg snelle responstijden in onze tests en zou zeer geschikt moeten zijn voor snelle games. Ter vergelijking: alle testtoestellen variëren van 0.165 (minimum) tot 636 (maximum) ms. » 7 % van alle toestellen zijn beter. Dit betekent dat de gemeten responstijd beter is dan het gemiddelde (31 ms) van alle geteste toestellen. | ||
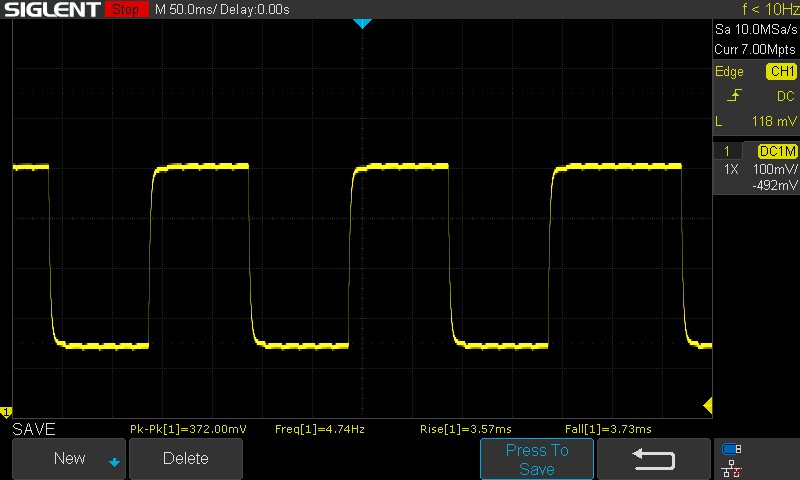
Het paneel van de Alienware x15 R2 gebruikt standaard overdrive, en dit is te zien als een "hoorn" in de 50% grijs tot 80% grijs reactietijd grafiek. Bijgevolg zien we een zeer snelle 1,47 ms gecombineerde reactietijd; het is niet OLED-niveau, maar zou een goed voorteken moeten zijn voor snelle games. De gecombineerde 100% zwart tot 100% wit reactietijd is met 4,32 ms ook behoorlijk.
Paneel overdrive wordt uitgeschakeld bij 60 Hz refresh en de gecombineerde 50% grijs tot 80% grijs reactietijd stijgt naar 7,3 ms.
Screen Flickering / PWM (Pulse-Width Modulation)
| Screen flickering / PWM niet waargenomen | 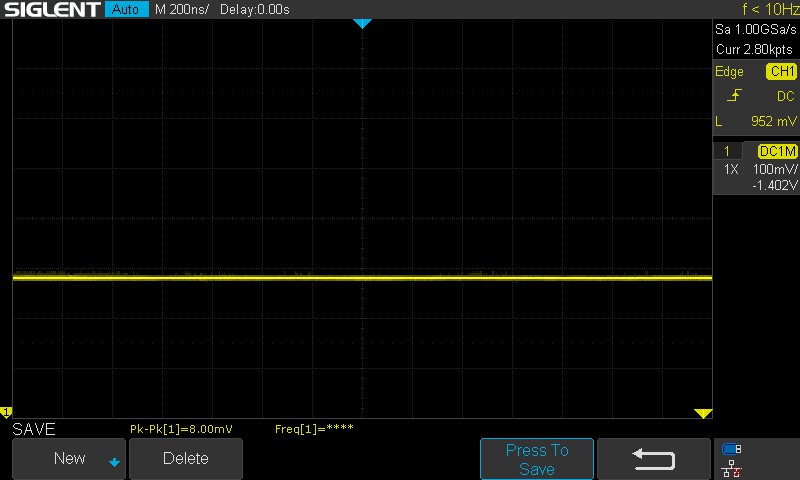 | ||
Ter vergelijking: 52 % van alle geteste toestellen maakten geen gebruik van PWM om de schermhelderheid te verlagen. Als het wel werd gebruikt, werd een gemiddelde van 7757 (minimum: 5 - maximum: 343500) Hz waargenomen. | |||
Bij alle geteste helderheidsniveaus werd geen PWM-flikkering waargenomen, wat veel goeds belooft voor minder vermoeide ogen tijdens het gamen
Zie voor meer informatie ons artikel "Waarom Pulse Width Modulation (PWM) zo'n hoofdpijn is"en bekijk ook onzePWM ranglijstvoor PWM-frequentievergelijking tussen alle beoordeelde apparaten
Ondanks de iets lagere piekhelderheid is het scherm van de Alienware x15 R2 zeer geschikt om buiten te bekijken, zolang er geen fel zonlicht rechtstreeks op het scherm valt
We hebben geen significant verlies van helderheid of kleurinformatie waargenomen bij extreme kijkhoeken.
Prestaties: Core i9-12900H biedt goede aanhoudende prestaties
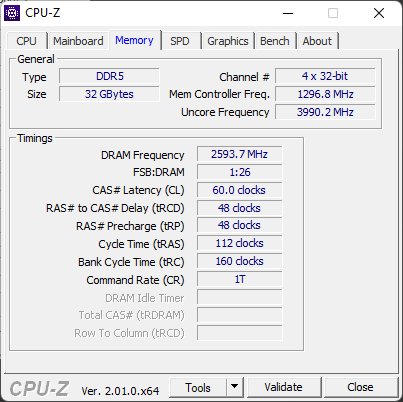
Onze Alienware x15 R2 wordt aangedreven door een Intel Core i9-12900H processor en een 140 W Nvidia GeForce RTX 3080 Ti laptop GPU. Kopers kunnen de x15 R2 ook configureren met een Core i7-12700H en een RTX 3060 of RTX 3070 Ti laptop GPU opties samen met 16 GB of 32 GB LPDDR5-5200 RAM.
Testomstandigheden
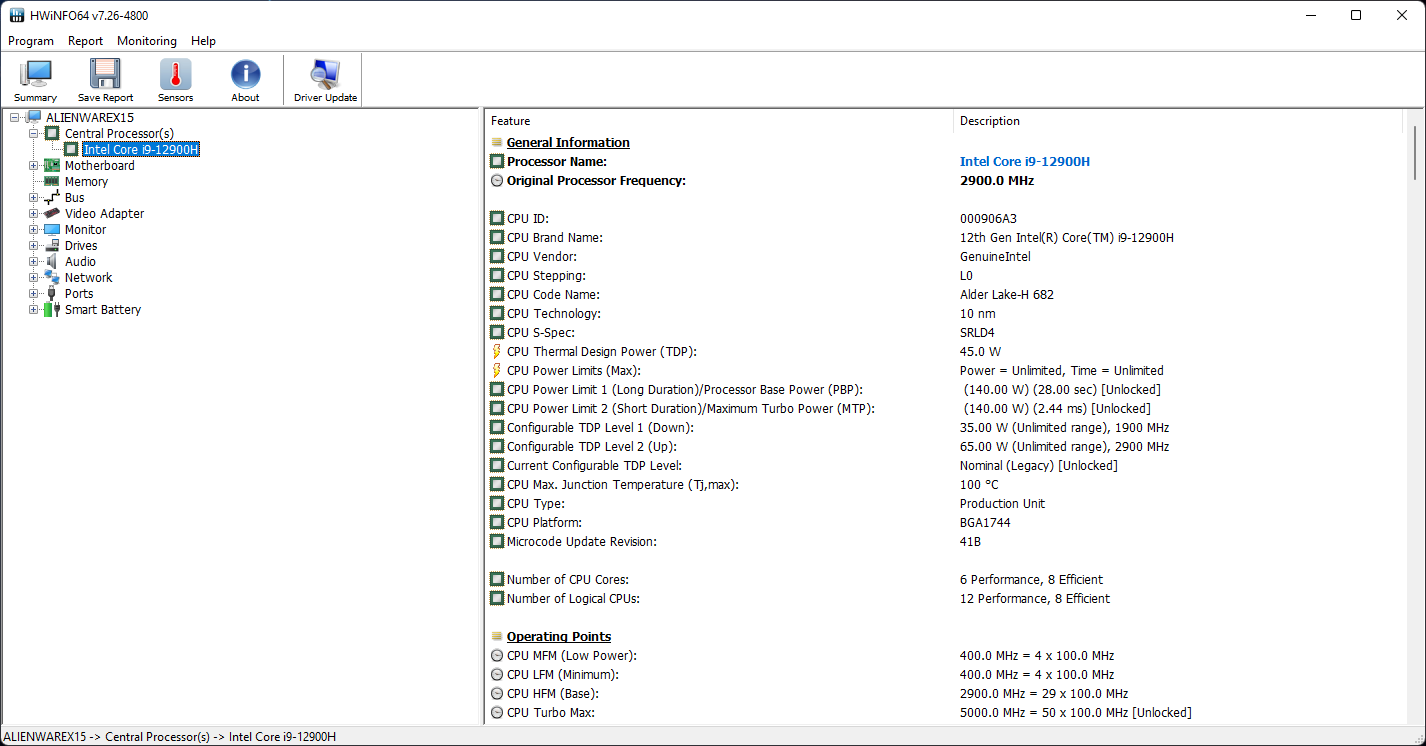
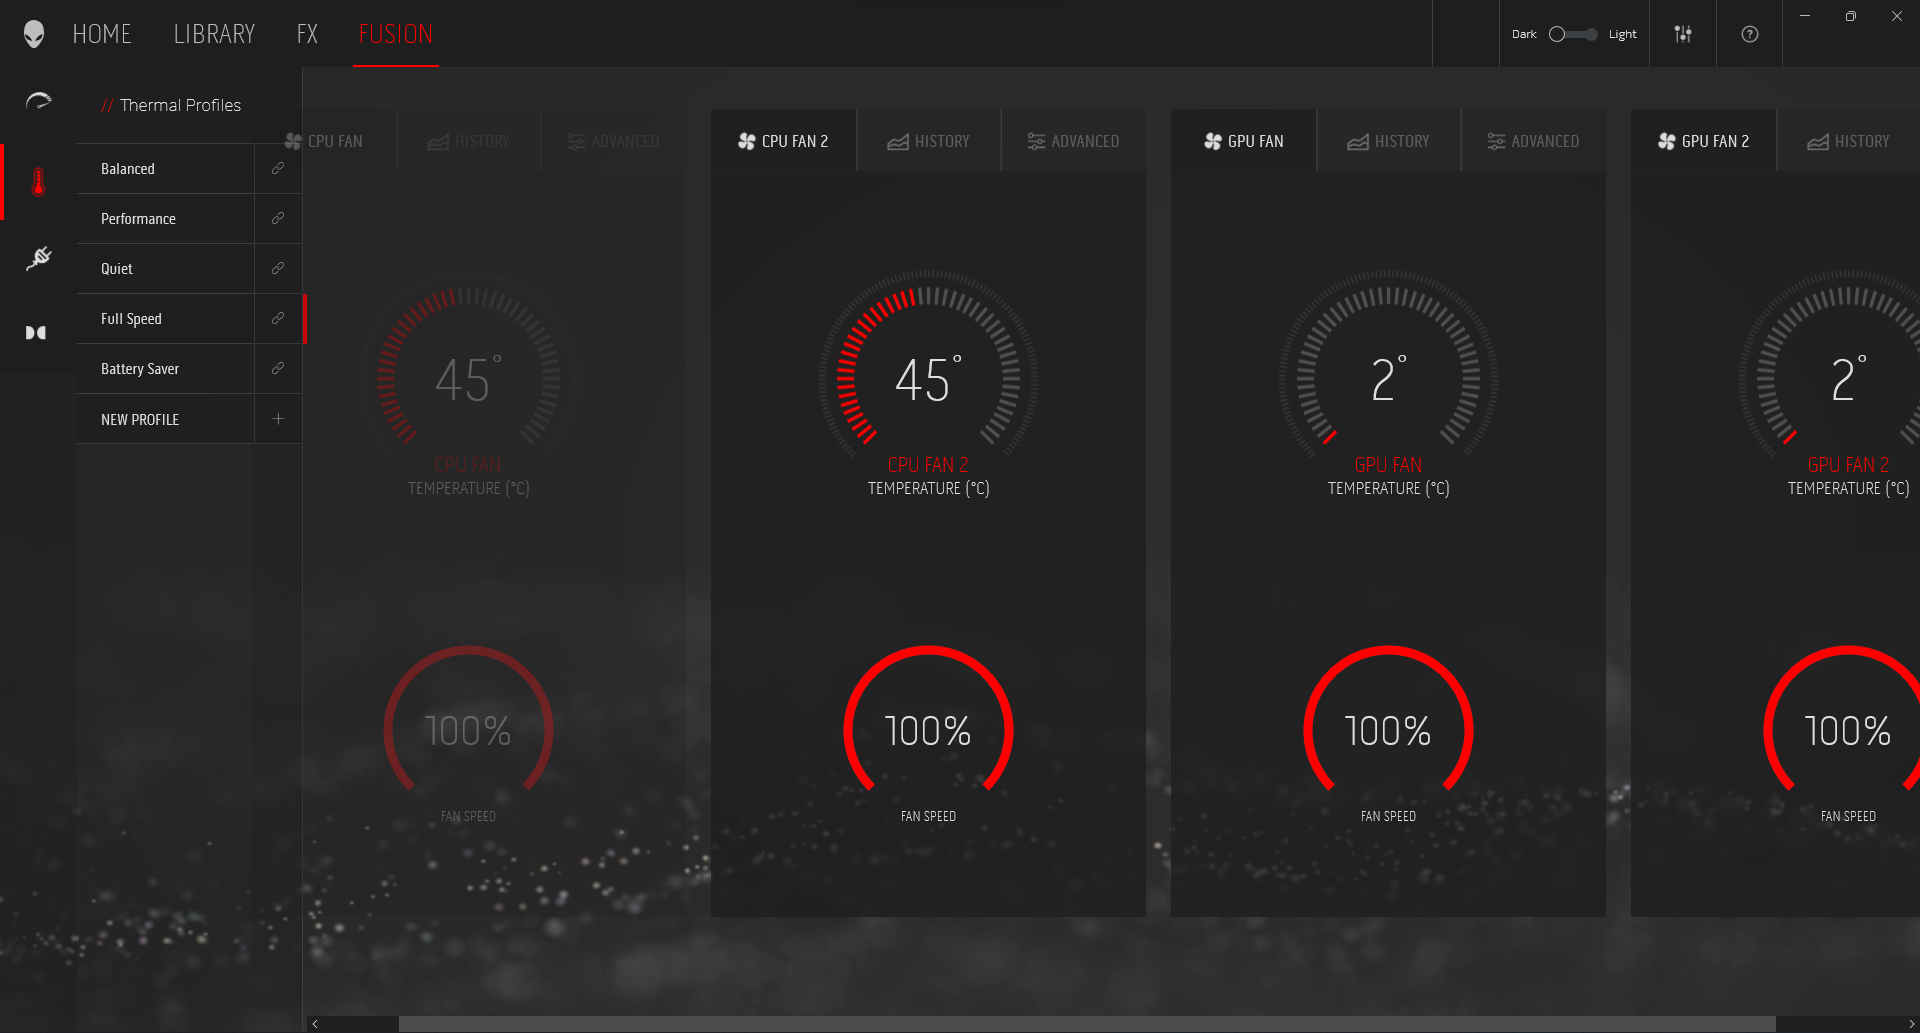
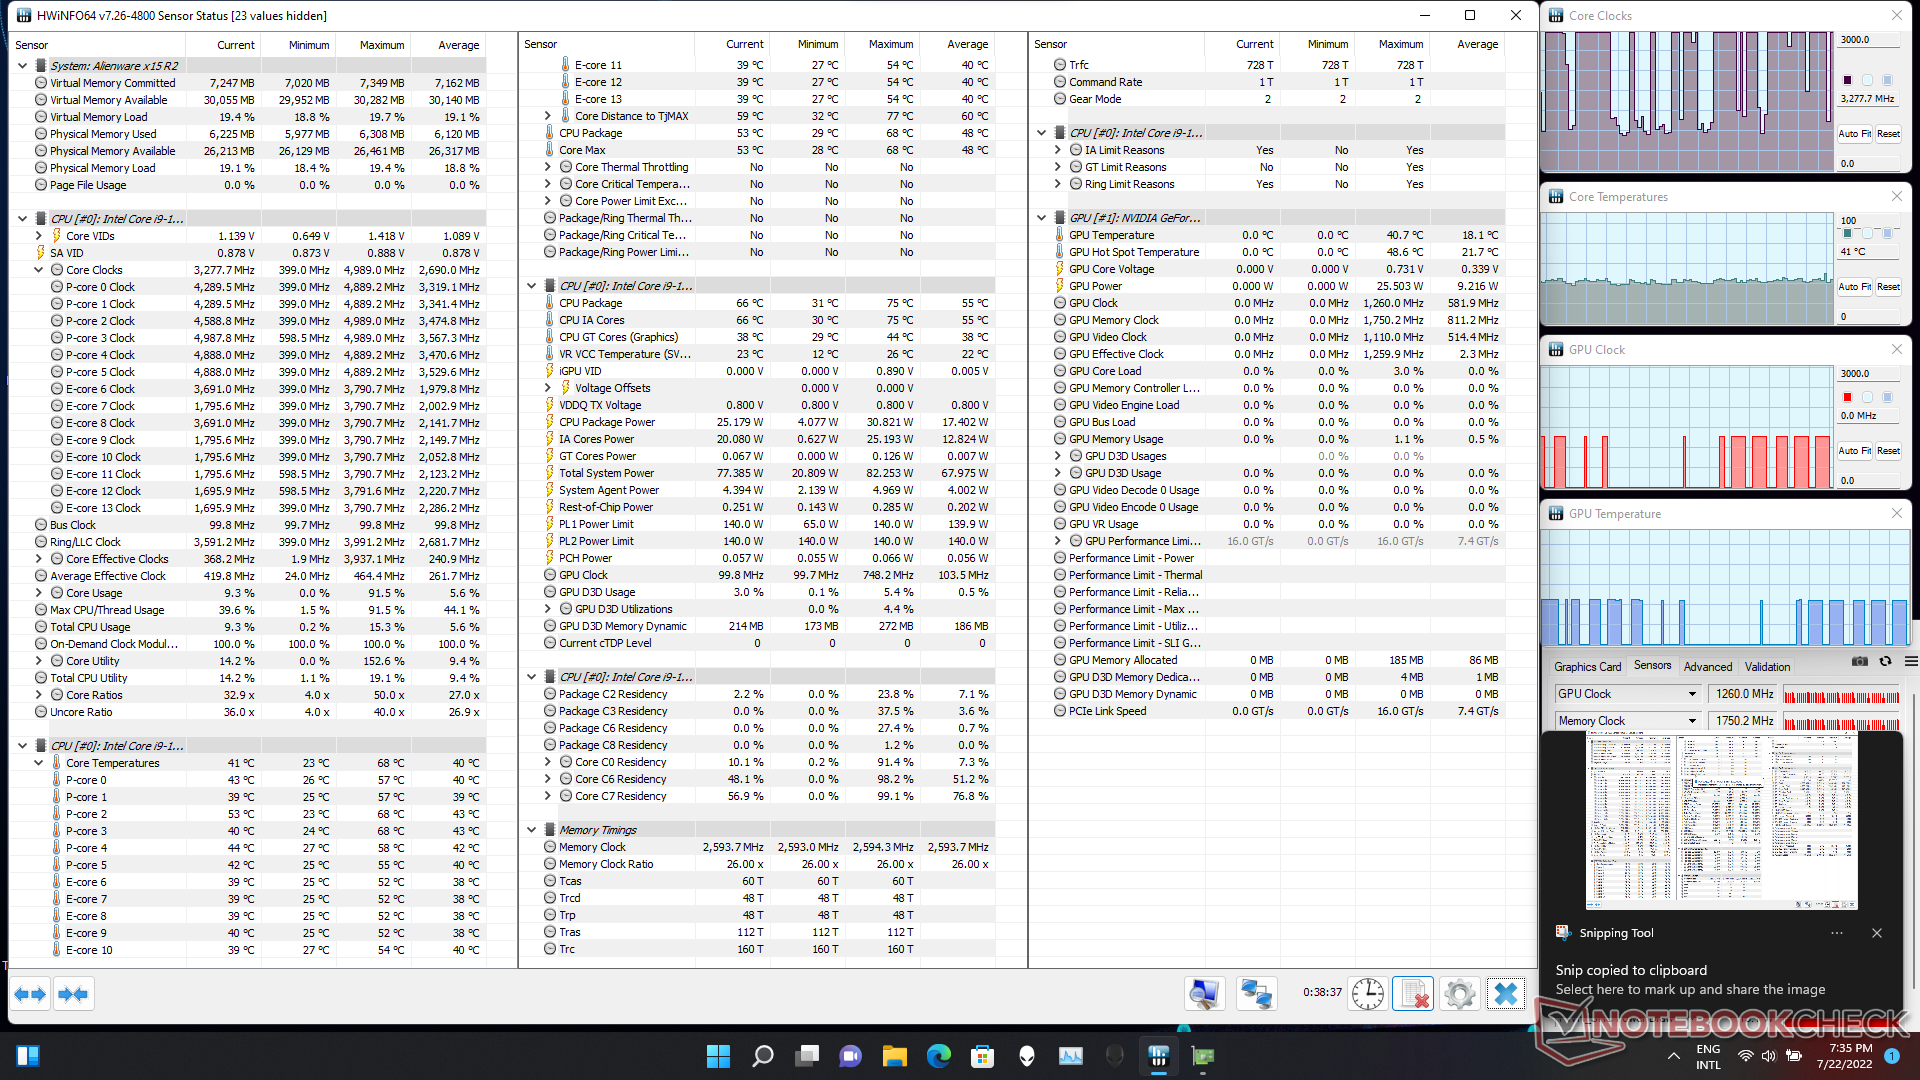
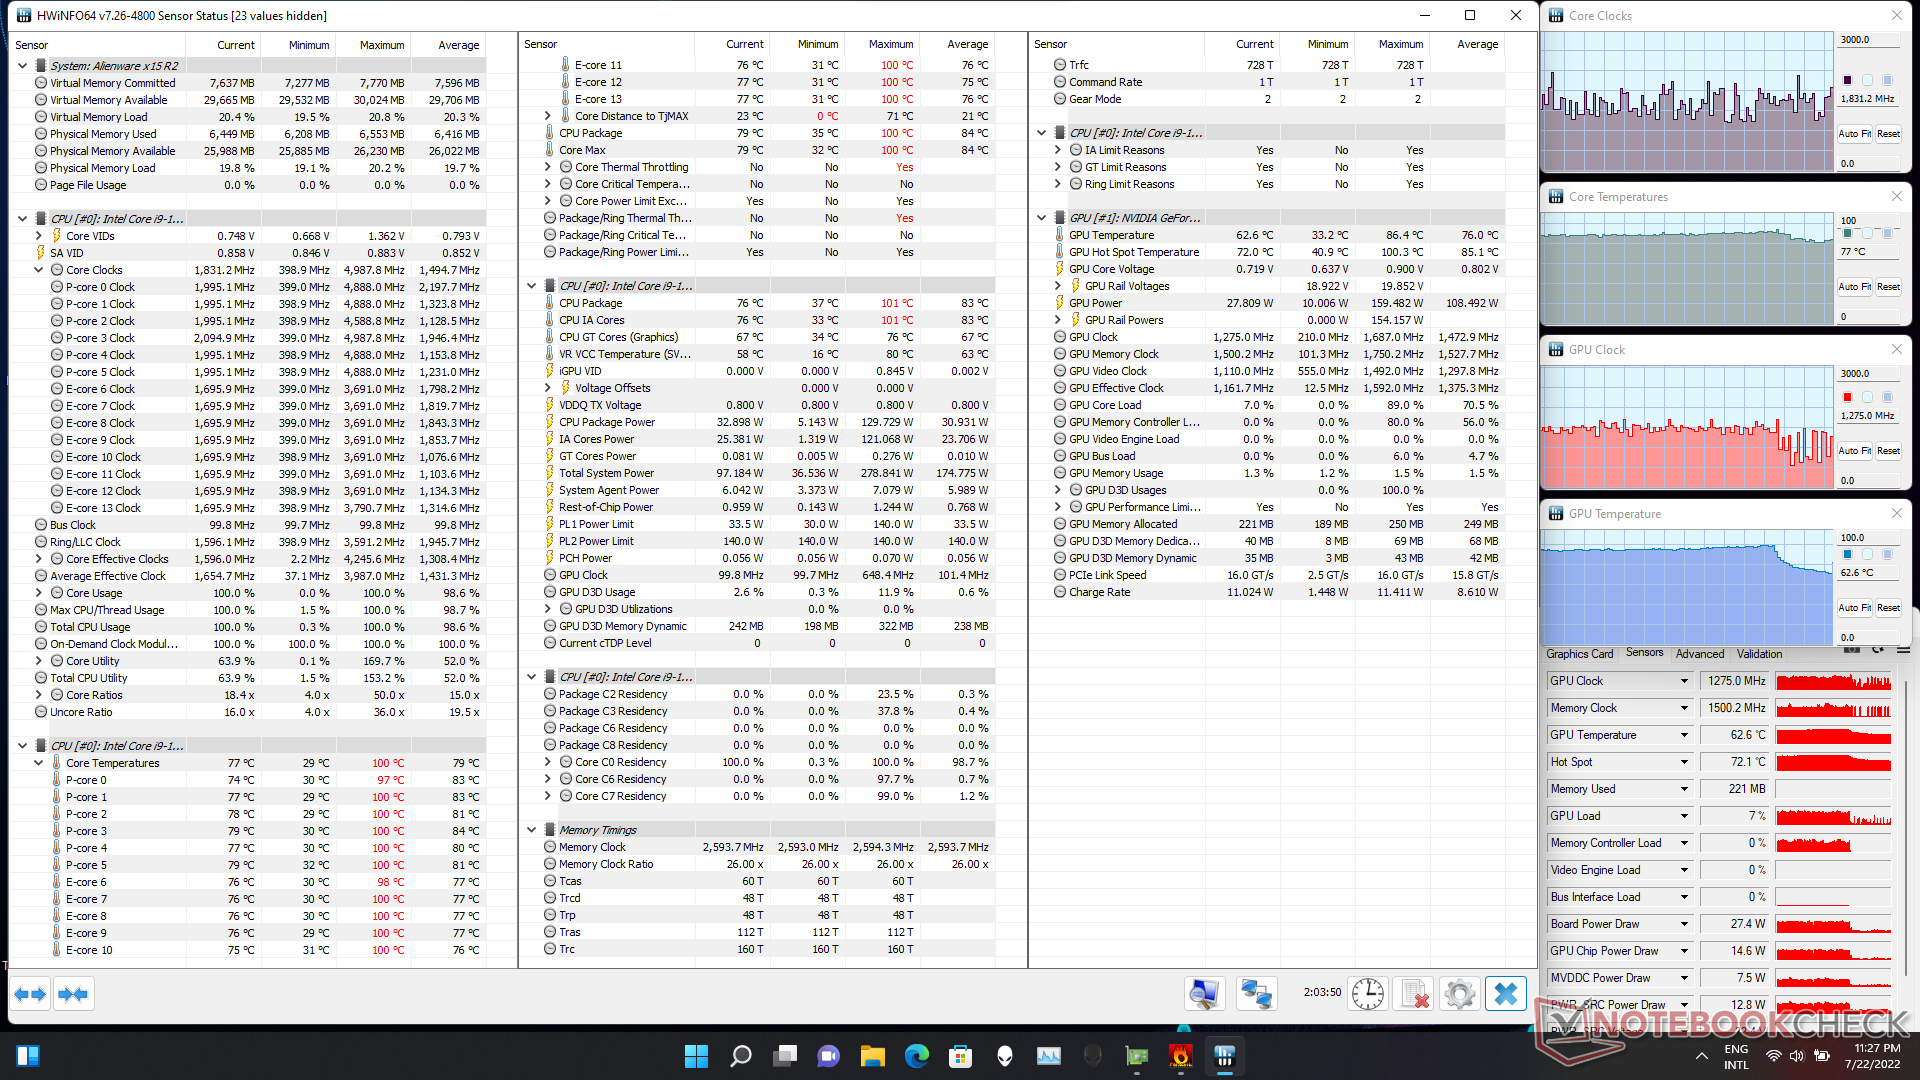
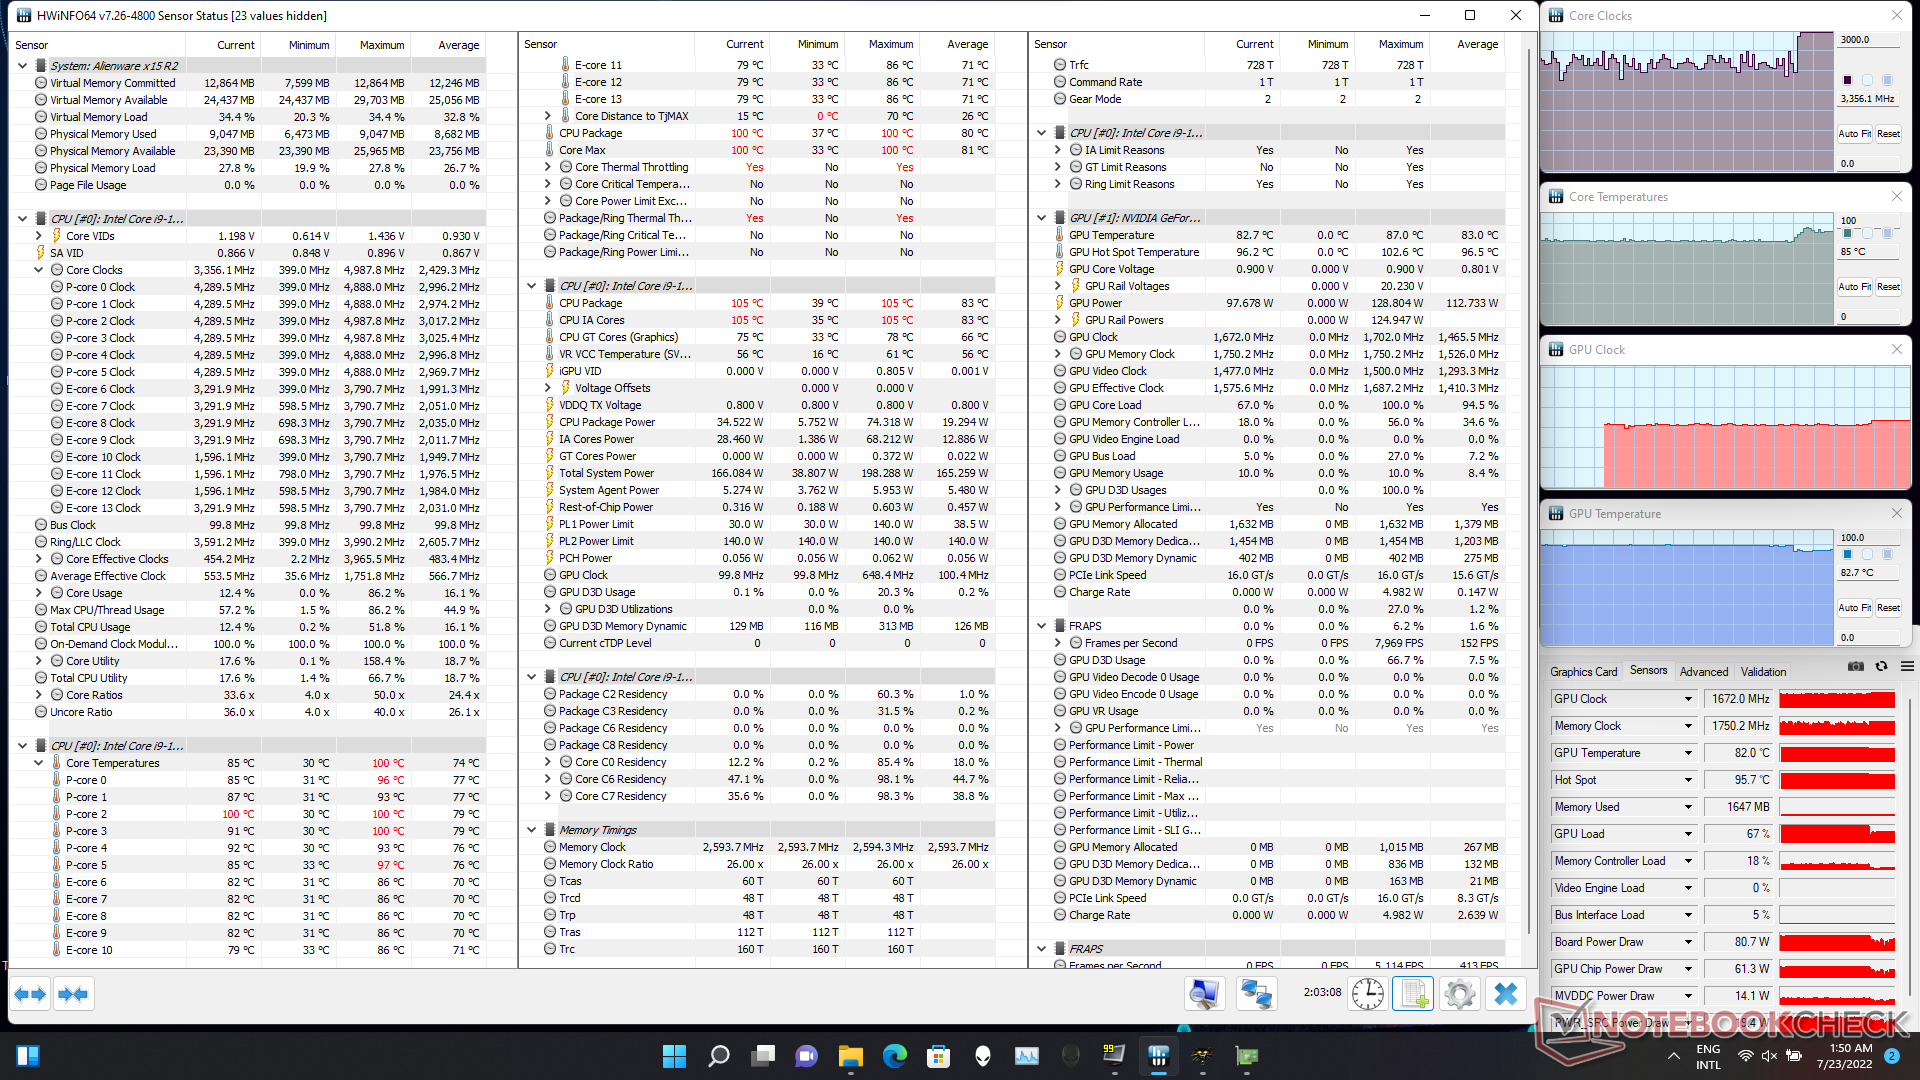
De prestaties van de laptop kunnen worden afgesteld met behulp van Alienware Command Center. We moesten de app handmatig installeren omdat deze om een of andere reden niet aanwezig was in de standaard fabrieksimage. We hebben alle tests uitgevoerd in het Full Speed thermische profiel. Dit resulteert in een unlocked processor base power (PL1) en maximum turbo power (PL2) van 140 W
De meeste thermische profielen, waaronder Balanced, gebruiken een PL1/PL2 van 140 W, terwijl de Battery Saver en Quiet-modi een PL1 van 65 W en een PL2 van 140 W gebruiken. De keuze van het thermische profiel heeft vooral invloed op het ventilatorgeluid, waar we zo op terugkomen.
De Alienware x15 R2 ondersteunt Advanced Optimus. Alle grafische tests werden uitgevoerd in de MSHybrid-modus, maar het is mogelijk om de GPU-routing te wijzigen via het BIOS of via het Nvidia Control Panel.
Processor
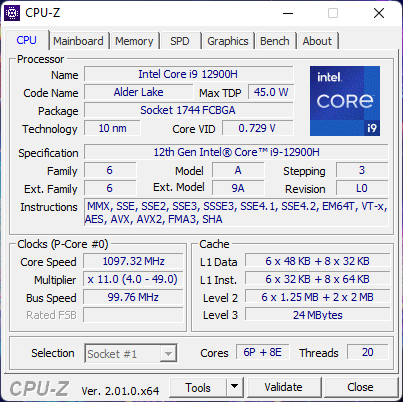
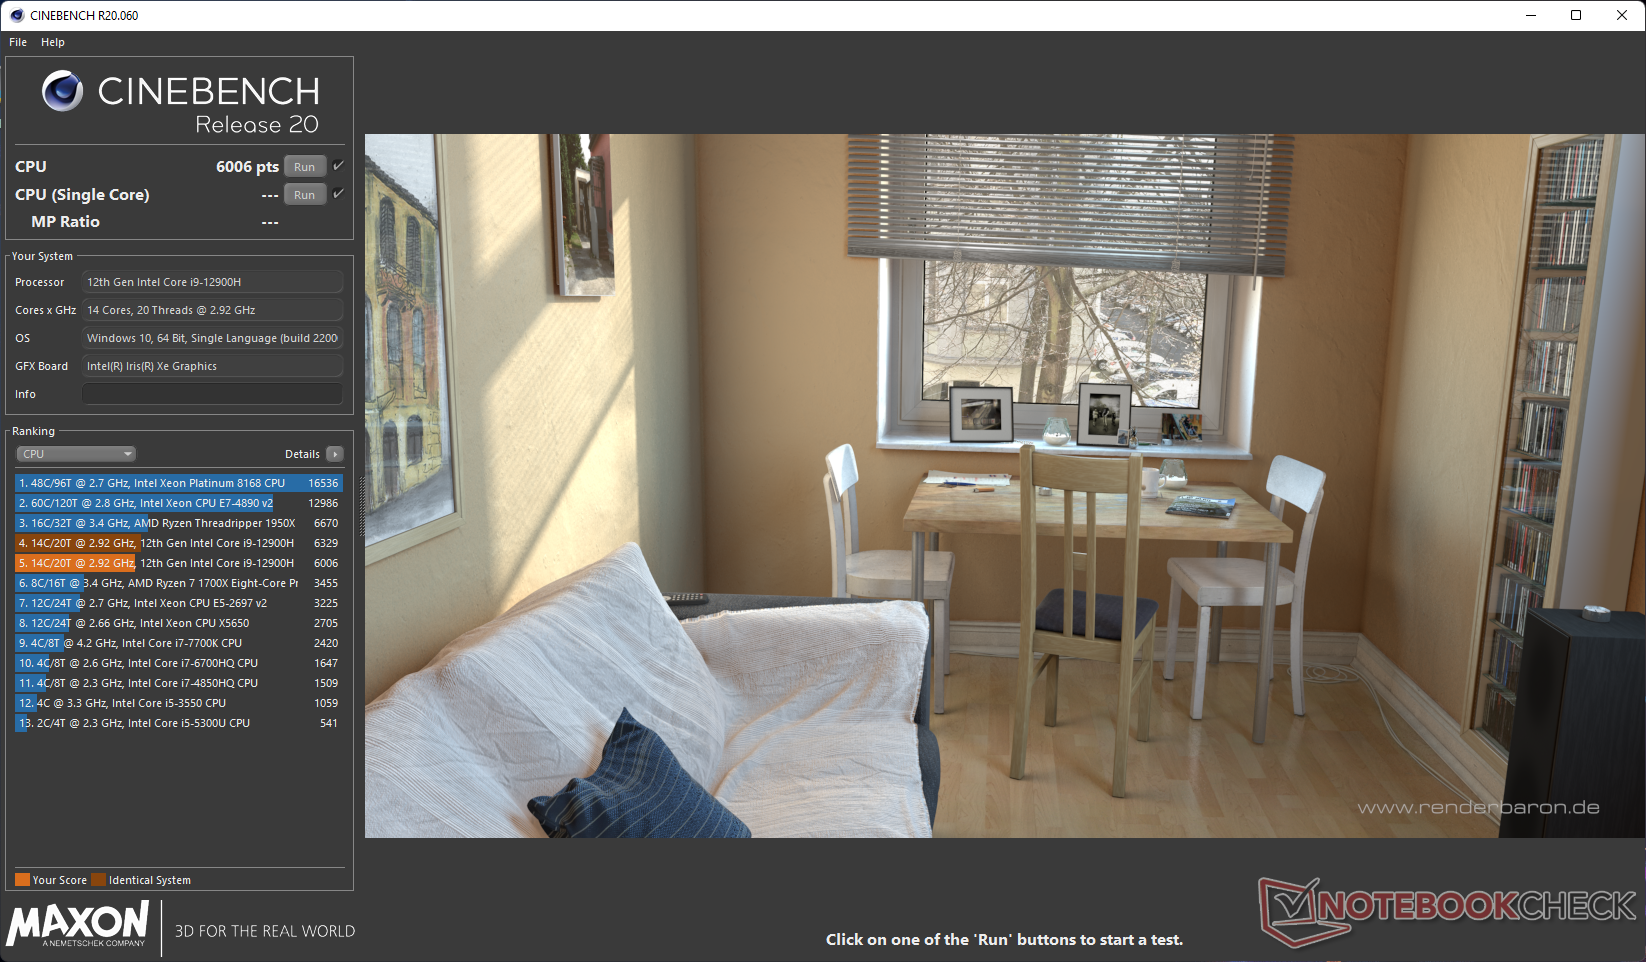
De Core i9-12900H is een 14-core 20-thread Alder Lake-H processor met boosts tot 5 GHz. Van de 14 cores zijn er acht Golden Cove performance (P) cores, terwijl de overige zes Gracemont efficiency (E) cores zijn. De P-cores ondersteunen hyperthreading.
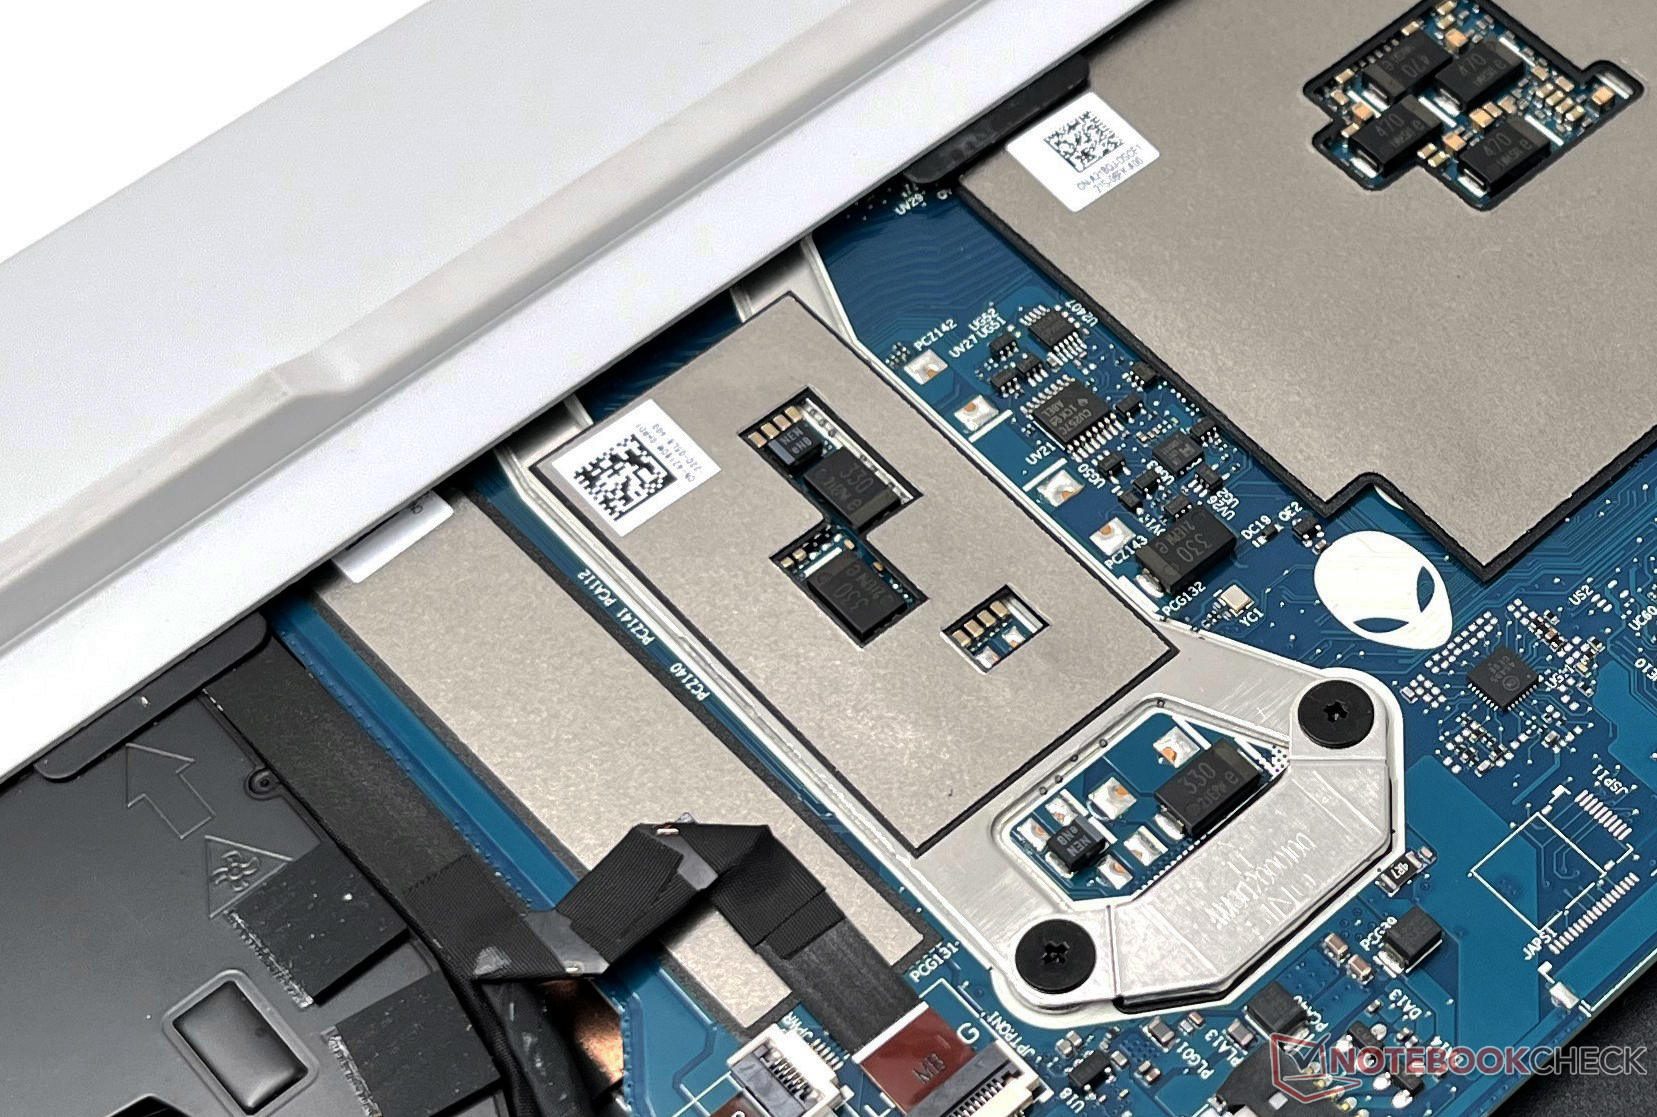
Dell's implementatie van een Element 31 (wat trouwens gallium betekent in het periodiek systeem) gallium-siliconen thermisch interface materiaal (TIM) lijkt te werken zoals geadverteerd. We zagen een goed volgehouden prestatie in de Cinebench R15 multi-core loop test gedurende de gehele duur van de run
Dat gezegd hebbende, lijkt de Alienware x15 R2 ongeveer 9% langzamer te zijn in deze test in vergelijking met de Asus ROG Strix Scar 15, die ook dezelfde processor gebruikt bij 135 W.
Cinebench R15 Multi Loop
Single-core prestaties zijn gelijk aan andere Alder Lake-H chips en zelfs de Alder Lake-HXCore i9-12900HXin deMSI Titan GT77. We zien tussen 1% en 21% voorsprong in single-core voor de Core i9-12900H in vergelijking met deAMD Ryzen 9 6900HXin deAsus ROG Zephyrus Duo 16afhankelijk van de benchmark. De Scar 15 is in staat om de X15 R2 in de meeste multi-core benchmarks voor te blijven.
We zagen een daling van 11% in Cinebench R20 multi-core prestaties op batterijvermogen, waarschijnlijk doordat de PL1 daalde naar 65 W
Over het algemeen zorgt de Alienware x15 R2 niet voor verrassingen in onze CPU benchmark suite en biedt 33% meer CPU prestaties in vergelijking met de x15 R1. Het dunne chassis kan hebben bijgedragen aan de iets lagere scores, maar Dell's thermisch beheer is in staat om goede aanhoudende prestaties te garanderen.
Cinebench R23: Multi Core | Single Core
Cinebench R20: CPU (Multi Core) | CPU (Single Core)
Cinebench R15: CPU Multi 64Bit | CPU Single 64Bit
Blender: v2.79 BMW27 CPU
7-Zip 18.03: 7z b 4 | 7z b 4 -mmt1
Geekbench 5.5: Multi-Core | Single-Core
HWBOT x265 Benchmark v2.2: 4k Preset
LibreOffice : 20 Documents To PDF
R Benchmark 2.5: Overall mean
| CPU Performance rating | |
| Gemiddelde van klas Gaming | |
| MSI Titan GT77 12UHS | |
| Asus ROG Strix Scar 15 G533ZW-LN106WS | |
| Alienware x15 R2 P111F | |
| MSI Raider GE66 12UHS | |
| MSI Vector GP66 12UGS | |
| Gemiddeld Intel Core i9-12900H | |
| Asus ROG Zephyrus Duo 16 GX650RX | |
| Razer Blade 15 Advanced Model Early 2022 | |
| Alienware x15 RTX 3070 P111F -2! | |
| Cinebench R23 / Multi Core | |
| Gemiddelde van klas Gaming (10488 - 42661, n=107, laatste 2 jaar) | |
| MSI Titan GT77 12UHS | |
| Asus ROG Strix Scar 15 G533ZW-LN106WS | |
| MSI Vector GP66 12UGS | |
| Alienware x15 R2 P111F | |
| MSI Raider GE66 12UHS | |
| Gemiddeld Intel Core i9-12900H (7359 - 19648, n=28) | |
| Asus ROG Zephyrus Duo 16 GX650RX | |
| Alienware x15 RTX 3070 P111F | |
| Razer Blade 15 Advanced Model Early 2022 | |
| Cinebench R23 / Single Core | |
| Gemiddelde van klas Gaming (1166 - 2415, n=107, laatste 2 jaar) | |
| Asus ROG Strix Scar 15 G533ZW-LN106WS | |
| MSI Titan GT77 12UHS | |
| Alienware x15 R2 P111F | |
| MSI Vector GP66 12UGS | |
| MSI Raider GE66 12UHS | |
| Gemiddeld Intel Core i9-12900H (1634 - 1930, n=28) | |
| Razer Blade 15 Advanced Model Early 2022 | |
| Asus ROG Zephyrus Duo 16 GX650RX | |
| Alienware x15 RTX 3070 P111F | |
| Cinebench R20 / CPU (Multi Core) | |
| Gemiddelde van klas Gaming (4029 - 16433, n=106, laatste 2 jaar) | |
| MSI Titan GT77 12UHS | |
| Asus ROG Strix Scar 15 G533ZW-LN106WS | |
| Alienware x15 R2 P111F | |
| MSI Vector GP66 12UGS | |
| MSI Raider GE66 12UHS | |
| Gemiddeld Intel Core i9-12900H (2681 - 7471, n=28) | |
| Asus ROG Zephyrus Duo 16 GX650RX | |
| Alienware x15 RTX 3070 P111F | |
| Razer Blade 15 Advanced Model Early 2022 | |
| Cinebench R20 / CPU (Single Core) | |
| Gemiddelde van klas Gaming (442 - 913, n=106, laatste 2 jaar) | |
| MSI Titan GT77 12UHS | |
| Alienware x15 R2 P111F | |
| MSI Vector GP66 12UGS | |
| Asus ROG Strix Scar 15 G533ZW-LN106WS | |
| MSI Raider GE66 12UHS | |
| Gemiddeld Intel Core i9-12900H (624 - 738, n=28) | |
| Razer Blade 15 Advanced Model Early 2022 | |
| Asus ROG Zephyrus Duo 16 GX650RX | |
| Alienware x15 RTX 3070 P111F | |
| Cinebench R15 / CPU Multi 64Bit | |
| Gemiddelde van klas Gaming (1578 - 6330, n=105, laatste 2 jaar) | |
| MSI Titan GT77 12UHS | |
| Asus ROG Strix Scar 15 G533ZW-LN106WS | |
| Alienware x15 R2 P111F | |
| MSI Raider GE66 12UHS | |
| Gemiddeld Intel Core i9-12900H (1395 - 3077, n=28) | |
| MSI Vector GP66 12UGS | |
| Asus ROG Zephyrus Duo 16 GX650RX | |
| Alienware x15 RTX 3070 P111F | |
| Razer Blade 15 Advanced Model Early 2022 | |
| Cinebench R15 / CPU Single 64Bit | |
| Gemiddelde van klas Gaming (188.8 - 350, n=106, laatste 2 jaar) | |
| MSI Titan GT77 12UHS | |
| Asus ROG Strix Scar 15 G533ZW-LN106WS | |
| Alienware x15 R2 P111F | |
| MSI Vector GP66 12UGS | |
| MSI Raider GE66 12UHS | |
| Gemiddeld Intel Core i9-12900H (235 - 277, n=29) | |
| Asus ROG Zephyrus Duo 16 GX650RX | |
| Razer Blade 15 Advanced Model Early 2022 | |
| Alienware x15 RTX 3070 P111F | |
| Blender / v2.79 BMW27 CPU | |
| Razer Blade 15 Advanced Model Early 2022 | |
| Gemiddeld Intel Core i9-12900H (160 - 451, n=28) | |
| Alienware x15 RTX 3070 P111F | |
| Asus ROG Zephyrus Duo 16 GX650RX | |
| MSI Vector GP66 12UGS | |
| MSI Raider GE66 12UHS | |
| Alienware x15 R2 P111F | |
| Asus ROG Strix Scar 15 G533ZW-LN106WS | |
| Gemiddelde van klas Gaming (79 - 330, n=104, laatste 2 jaar) | |
| MSI Titan GT77 12UHS | |
| 7-Zip 18.03 / 7z b 4 | |
| Gemiddelde van klas Gaming (33491 - 148086, n=105, laatste 2 jaar) | |
| MSI Titan GT77 12UHS | |
| Alienware x15 R2 P111F | |
| MSI Raider GE66 12UHS | |
| Asus ROG Strix Scar 15 G533ZW-LN106WS | |
| MSI Vector GP66 12UGS | |
| Asus ROG Zephyrus Duo 16 GX650RX | |
| Gemiddeld Intel Core i9-12900H (34684 - 76677, n=28) | |
| Alienware x15 RTX 3070 P111F | |
| Razer Blade 15 Advanced Model Early 2022 | |
| 7-Zip 18.03 / 7z b 4 -mmt1 | |
| Gemiddelde van klas Gaming (4199 - 7436, n=105, laatste 2 jaar) | |
| MSI Titan GT77 12UHS | |
| MSI Vector GP66 12UGS | |
| MSI Raider GE66 12UHS | |
| Razer Blade 15 Advanced Model Early 2022 | |
| Asus ROG Strix Scar 15 G533ZW-LN106WS | |
| Alienware x15 R2 P111F | |
| Gemiddeld Intel Core i9-12900H (5302 - 6289, n=28) | |
| Asus ROG Zephyrus Duo 16 GX650RX | |
| Alienware x15 RTX 3070 P111F | |
| Geekbench 5.5 / Multi-Core | |
| Gemiddelde van klas Gaming (6460 - 28263, n=105, laatste 2 jaar) | |
| MSI Titan GT77 12UHS | |
| Asus ROG Strix Scar 15 G533ZW-LN106WS | |
| Alienware x15 R2 P111F | |
| MSI Raider GE66 12UHS | |
| MSI Vector GP66 12UGS | |
| Gemiddeld Intel Core i9-12900H (8519 - 14376, n=31) | |
| Asus ROG Zephyrus Duo 16 GX650RX | |
| Razer Blade 15 Advanced Model Early 2022 | |
| Geekbench 5.5 / Single-Core | |
| Gemiddelde van klas Gaming (986 - 2474, n=105, laatste 2 jaar) | |
| MSI Titan GT77 12UHS | |
| MSI Vector GP66 12UGS | |
| Alienware x15 R2 P111F | |
| MSI Raider GE66 12UHS | |
| Asus ROG Strix Scar 15 G533ZW-LN106WS | |
| Razer Blade 15 Advanced Model Early 2022 | |
| Gemiddeld Intel Core i9-12900H (1631 - 1897, n=31) | |
| Asus ROG Zephyrus Duo 16 GX650RX | |
| HWBOT x265 Benchmark v2.2 / 4k Preset | |
| Gemiddelde van klas Gaming (11.5 - 44.4, n=105, laatste 2 jaar) | |
| MSI Titan GT77 12UHS | |
| Asus ROG Strix Scar 15 G533ZW-LN106WS | |
| Alienware x15 R2 P111F | |
| MSI Vector GP66 12UGS | |
| MSI Raider GE66 12UHS | |
| Asus ROG Zephyrus Duo 16 GX650RX | |
| Gemiddeld Intel Core i9-12900H (8.05 - 22.5, n=28) | |
| Alienware x15 RTX 3070 P111F | |
| Razer Blade 15 Advanced Model Early 2022 | |
| LibreOffice / 20 Documents To PDF | |
| Gemiddelde van klas Gaming (33.2 - 88.8, n=105, laatste 2 jaar) | |
| Alienware x15 RTX 3070 P111F | |
| Alienware x15 R2 P111F | |
| Asus ROG Zephyrus Duo 16 GX650RX | |
| Razer Blade 15 Advanced Model Early 2022 | |
| Gemiddeld Intel Core i9-12900H (36.8 - 59.8, n=28) | |
| MSI Vector GP66 12UGS | |
| Asus ROG Strix Scar 15 G533ZW-LN106WS | |
| MSI Titan GT77 12UHS | |
| MSI Raider GE66 12UHS | |
| R Benchmark 2.5 / Overall mean | |
| Alienware x15 RTX 3070 P111F | |
| Asus ROG Zephyrus Duo 16 GX650RX | |
| Gemiddeld Intel Core i9-12900H (0.4218 - 0.506, n=28) | |
| Razer Blade 15 Advanced Model Early 2022 | |
| MSI Raider GE66 12UHS | |
| Alienware x15 R2 P111F | |
| Asus ROG Strix Scar 15 G533ZW-LN106WS | |
| Gemiddelde van klas Gaming (0.3439 - 0.759, n=106, laatste 2 jaar) | |
| MSI Vector GP66 12UGS | |
| MSI Titan GT77 12UHS | |
* ... kleiner is beter
AIDA64: FP32 Ray-Trace | FPU Julia | CPU SHA3 | CPU Queen | FPU SinJulia | FPU Mandel | CPU AES | CPU ZLib | FP64 Ray-Trace | CPU PhotoWorxx
| Performance rating | |
| Gemiddelde van klas Gaming | |
| MSI Titan GT77 12UHS | |
| Asus ROG Zephyrus Duo 16 GX650RX | |
| Alienware x15 R2 P111F | |
| Asus ROG Strix Scar 15 G533ZW-LN106WS | |
| Gemiddeld Intel Core i9-12900H | |
| MSI Raider GE66 12UHS | |
| MSI Vector GP66 12UGS | |
| Razer Blade 15 Advanced Model Early 2022 | |
| Alienware x15 RTX 3070 P111F -9! | |
| AIDA64 / FP32 Ray-Trace | |
| Gemiddelde van klas Gaming (10227 - 85542, n=105, laatste 2 jaar) | |
| MSI Titan GT77 12UHS | |
| Asus ROG Zephyrus Duo 16 GX650RX | |
| Alienware x15 R2 P111F | |
| Gemiddeld Intel Core i9-12900H (4074 - 18289, n=29) | |
| Asus ROG Strix Scar 15 G533ZW-LN106WS | |
| MSI Raider GE66 12UHS | |
| MSI Vector GP66 12UGS | |
| Razer Blade 15 Advanced Model Early 2022 | |
| AIDA64 / FPU Julia | |
| Gemiddelde van klas Gaming (51376 - 238426, n=105, laatste 2 jaar) | |
| MSI Titan GT77 12UHS | |
| Asus ROG Zephyrus Duo 16 GX650RX | |
| Alienware x15 R2 P111F | |
| Gemiddeld Intel Core i9-12900H (22307 - 93236, n=29) | |
| Asus ROG Strix Scar 15 G533ZW-LN106WS | |
| MSI Raider GE66 12UHS | |
| MSI Vector GP66 12UGS | |
| Razer Blade 15 Advanced Model Early 2022 | |
| AIDA64 / CPU SHA3 | |
| Gemiddelde van klas Gaming (2180 - 10115, n=105, laatste 2 jaar) | |
| MSI Titan GT77 12UHS | |
| Alienware x15 R2 P111F | |
| Asus ROG Zephyrus Duo 16 GX650RX | |
| Asus ROG Strix Scar 15 G533ZW-LN106WS | |
| Gemiddeld Intel Core i9-12900H (1378 - 4215, n=29) | |
| MSI Vector GP66 12UGS | |
| MSI Raider GE66 12UHS | |
| Razer Blade 15 Advanced Model Early 2022 | |
| AIDA64 / CPU Queen | |
| Gemiddelde van klas Gaming (49785 - 173351, n=90, laatste 2 jaar) | |
| Alienware x15 R2 P111F | |
| MSI Vector GP66 12UGS | |
| MSI Raider GE66 12UHS | |
| Asus ROG Zephyrus Duo 16 GX650RX | |
| Asus ROG Strix Scar 15 G533ZW-LN106WS | |
| MSI Titan GT77 12UHS | |
| Gemiddeld Intel Core i9-12900H (78172 - 111241, n=28) | |
| Razer Blade 15 Advanced Model Early 2022 | |
| AIDA64 / FPU SinJulia | |
| Gemiddelde van klas Gaming (4424 - 33636, n=105, laatste 2 jaar) | |
| MSI Titan GT77 12UHS | |
| Asus ROG Zephyrus Duo 16 GX650RX | |
| Asus ROG Strix Scar 15 G533ZW-LN106WS | |
| Alienware x15 R2 P111F | |
| MSI Vector GP66 12UGS | |
| MSI Raider GE66 12UHS | |
| Gemiddeld Intel Core i9-12900H (5709 - 10410, n=29) | |
| Razer Blade 15 Advanced Model Early 2022 | |
| AIDA64 / FPU Mandel | |
| Gemiddelde van klas Gaming (25115 - 128721, n=105, laatste 2 jaar) | |
| Asus ROG Zephyrus Duo 16 GX650RX | |
| MSI Titan GT77 12UHS | |
| Alienware x15 R2 P111F | |
| Gemiddeld Intel Core i9-12900H (11257 - 45581, n=29) | |
| Asus ROG Strix Scar 15 G533ZW-LN106WS | |
| MSI Raider GE66 12UHS | |
| MSI Vector GP66 12UGS | |
| Razer Blade 15 Advanced Model Early 2022 | |
| AIDA64 / CPU AES | |
| MSI Titan GT77 12UHS | |
| Alienware x15 R2 P111F | |
| Asus ROG Zephyrus Duo 16 GX650RX | |
| Gemiddelde van klas Gaming (39258 - 247074, n=105, laatste 2 jaar) | |
| Asus ROG Strix Scar 15 G533ZW-LN106WS | |
| MSI Vector GP66 12UGS | |
| MSI Raider GE66 12UHS | |
| Gemiddeld Intel Core i9-12900H (31935 - 151546, n=29) | |
| Razer Blade 15 Advanced Model Early 2022 | |
| AIDA64 / CPU ZLib | |
| Gemiddelde van klas Gaming (574 - 2531, n=105, laatste 2 jaar) | |
| MSI Titan GT77 12UHS | |
| Asus ROG Strix Scar 15 G533ZW-LN106WS | |
| Alienware x15 R2 P111F | |
| MSI Vector GP66 12UGS | |
| MSI Raider GE66 12UHS | |
| Gemiddeld Intel Core i9-12900H (449 - 1193, n=29) | |
| Asus ROG Zephyrus Duo 16 GX650RX | |
| Razer Blade 15 Advanced Model Early 2022 | |
| Alienware x15 RTX 3070 P111F | |
| AIDA64 / FP64 Ray-Trace | |
| Gemiddelde van klas Gaming (5509 - 45446, n=105, laatste 2 jaar) | |
| MSI Titan GT77 12UHS | |
| Asus ROG Zephyrus Duo 16 GX650RX | |
| Alienware x15 R2 P111F | |
| Gemiddeld Intel Core i9-12900H (2235 - 10511, n=29) | |
| Asus ROG Strix Scar 15 G533ZW-LN106WS | |
| MSI Raider GE66 12UHS | |
| MSI Vector GP66 12UGS | |
| Razer Blade 15 Advanced Model Early 2022 | |
| AIDA64 / CPU PhotoWorxx | |
| Gemiddelde van klas Gaming (12271 - 89891, n=105, laatste 2 jaar) | |
| MSI Titan GT77 12UHS | |
| MSI Raider GE66 12UHS | |
| Asus ROG Strix Scar 15 G533ZW-LN106WS | |
| Alienware x15 R2 P111F | |
| Razer Blade 15 Advanced Model Early 2022 | |
| Gemiddeld Intel Core i9-12900H (20960 - 48269, n=30) | |
| Asus ROG Zephyrus Duo 16 GX650RX | |
| MSI Vector GP66 12UGS | |
Bekijk onze speciale Intel Core i9-12900H pagina voor meer benchmarks en prestatievergelijkingen.
Systeemprestaties
De Alienware x15 R2 ligt slechts 9% achter op de MSI Titan GT77 in algemene PCMark 10 prestaties, met de grootste achterstand in de Digital Content Creation component van de benchmark. CrossMark scores zijn vergelijkbaar met die van de Scar 15 en zijn ongeveer 15% hoger dan de Ryzen 9 6900HX-aangedreven Zephyrus Duo 16.
Subjectief gezien hebben we geen haperingen ervaren in de dagelijkse productiviteit en web browsing taken.
CrossMark: Overall | Productivity | Creativity | Responsiveness
| PCMark 10 / Score | |
| Gemiddelde van klas Gaming (5828 - 12414, n=93, laatste 2 jaar) | |
| MSI Titan GT77 12UHS | |
| MSI Raider GE66 12UHS | |
| MSI Vector GP66 12UGS | |
| Asus ROG Strix Scar 15 G533ZW-LN106WS | |
| Gemiddeld Intel Core i9-12900H, NVIDIA GeForce RTX 3080 Ti Laptop GPU (7139 - 8083, n=6) | |
| Alienware x15 R2 P111F | |
| Razer Blade 15 Advanced Model Early 2022 | |
| Alienware x15 RTX 3070 P111F | |
| Asus ROG Zephyrus Duo 16 GX650RX | |
| PCMark 10 / Essentials | |
| Alienware x15 R2 P111F | |
| MSI Titan GT77 12UHS | |
| MSI Raider GE66 12UHS | |
| MSI Vector GP66 12UGS | |
| Gemiddeld Intel Core i9-12900H, NVIDIA GeForce RTX 3080 Ti Laptop GPU (10254 - 11178, n=6) | |
| Asus ROG Strix Scar 15 G533ZW-LN106WS | |
| Gemiddelde van klas Gaming (8810 - 11935, n=97, laatste 2 jaar) | |
| Razer Blade 15 Advanced Model Early 2022 | |
| Alienware x15 RTX 3070 P111F | |
| Asus ROG Zephyrus Duo 16 GX650RX | |
| PCMark 10 / Productivity | |
| Gemiddelde van klas Gaming (6845 - 25323, n=95, laatste 2 jaar) | |
| Asus ROG Strix Scar 15 G533ZW-LN106WS | |
| MSI Raider GE66 12UHS | |
| Alienware x15 R2 P111F | |
| MSI Titan GT77 12UHS | |
| MSI Vector GP66 12UGS | |
| Gemiddeld Intel Core i9-12900H, NVIDIA GeForce RTX 3080 Ti Laptop GPU (9102 - 11186, n=6) | |
| Razer Blade 15 Advanced Model Early 2022 | |
| Alienware x15 RTX 3070 P111F | |
| Asus ROG Zephyrus Duo 16 GX650RX | |
| PCMark 10 / Digital Content Creation | |
| Gemiddelde van klas Gaming (7602 - 19954, n=95, laatste 2 jaar) | |
| MSI Titan GT77 12UHS | |
| MSI Raider GE66 12UHS | |
| MSI Vector GP66 12UGS | |
| Asus ROG Strix Scar 15 G533ZW-LN106WS | |
| Gemiddeld Intel Core i9-12900H, NVIDIA GeForce RTX 3080 Ti Laptop GPU (9847 - 12627, n=6) | |
| Alienware x15 RTX 3070 P111F | |
| Razer Blade 15 Advanced Model Early 2022 | |
| Alienware x15 R2 P111F | |
| Asus ROG Zephyrus Duo 16 GX650RX | |
| CrossMark / Overall | |
| MSI Titan GT77 12UHS | |
| Asus ROG Strix Scar 15 G533ZW-LN106WS | |
| Gemiddelde van klas Gaming (1366 - 2409, n=94, laatste 2 jaar) | |
| Alienware x15 R2 P111F | |
| Gemiddeld Intel Core i9-12900H, NVIDIA GeForce RTX 3080 Ti Laptop GPU (1696 - 1965, n=3) | |
| Razer Blade 15 Advanced Model Early 2022 | |
| Asus ROG Zephyrus Duo 16 GX650RX | |
| CrossMark / Productivity | |
| MSI Titan GT77 12UHS | |
| Asus ROG Strix Scar 15 G533ZW-LN106WS | |
| Alienware x15 R2 P111F | |
| Gemiddelde van klas Gaming (1386 - 2254, n=94, laatste 2 jaar) | |
| Gemiddeld Intel Core i9-12900H, NVIDIA GeForce RTX 3080 Ti Laptop GPU (1622 - 1870, n=3) | |
| Razer Blade 15 Advanced Model Early 2022 | |
| Asus ROG Zephyrus Duo 16 GX650RX | |
| CrossMark / Creativity | |
| MSI Titan GT77 12UHS | |
| Gemiddelde van klas Gaming (1343 - 2786, n=94, laatste 2 jaar) | |
| Alienware x15 R2 P111F | |
| Asus ROG Strix Scar 15 G533ZW-LN106WS | |
| Gemiddeld Intel Core i9-12900H, NVIDIA GeForce RTX 3080 Ti Laptop GPU (1855 - 2135, n=3) | |
| Razer Blade 15 Advanced Model Early 2022 | |
| Asus ROG Zephyrus Duo 16 GX650RX | |
| CrossMark / Responsiveness | |
| Asus ROG Strix Scar 15 G533ZW-LN106WS | |
| MSI Titan GT77 12UHS | |
| Alienware x15 R2 P111F | |
| Asus ROG Zephyrus Duo 16 GX650RX | |
| Gemiddelde van klas Gaming (1226 - 2334, n=94, laatste 2 jaar) | |
| Gemiddeld Intel Core i9-12900H, NVIDIA GeForce RTX 3080 Ti Laptop GPU (1483 - 1777, n=3) | |
| Razer Blade 15 Advanced Model Early 2022 | |
| PCMark 8 Home Score Accelerated v2 | 6653 punten | |
| PCMark 8 Creative Score Accelerated v2 | 10574 punten | |
| PCMark 8 Work Score Accelerated v2 | 6944 punten | |
| PCMark 10 Score | 7496 punten | |
Help | ||
| AIDA64 / Memory Copy | |
| Gemiddelde van klas Gaming (21750 - 129946, n=105, laatste 2 jaar) | |
| Alienware x15 R2 P111F | |
| MSI Titan GT77 12UHS | |
| MSI Raider GE66 12UHS | |
| Razer Blade 15 Advanced Model Early 2022 | |
| Asus ROG Strix Scar 15 G533ZW-LN106WS | |
| Gemiddeld Intel Core i9-12900H (34438 - 74264, n=29) | |
| Asus ROG Zephyrus Duo 16 GX650RX | |
| MSI Vector GP66 12UGS | |
| AIDA64 / Memory Read | |
| Gemiddelde van klas Gaming (22956 - 118858, n=105, laatste 2 jaar) | |
| MSI Raider GE66 12UHS | |
| Razer Blade 15 Advanced Model Early 2022 | |
| Alienware x15 R2 P111F | |
| Asus ROG Strix Scar 15 G533ZW-LN106WS | |
| MSI Titan GT77 12UHS | |
| Gemiddeld Intel Core i9-12900H (36365 - 74642, n=29) | |
| Asus ROG Zephyrus Duo 16 GX650RX | |
| MSI Vector GP66 12UGS | |
| AIDA64 / Memory Write | |
| Gemiddelde van klas Gaming (22297 - 135096, n=105, laatste 2 jaar) | |
| Razer Blade 15 Advanced Model Early 2022 | |
| MSI Raider GE66 12UHS | |
| Asus ROG Strix Scar 15 G533ZW-LN106WS | |
| Alienware x15 R2 P111F | |
| MSI Titan GT77 12UHS | |
| Gemiddeld Intel Core i9-12900H (32276 - 67858, n=29) | |
| Asus ROG Zephyrus Duo 16 GX650RX | |
| MSI Vector GP66 12UGS | |
| AIDA64 / Memory Latency | |
| Alienware x15 R2 P111F | |
| Gemiddelde van klas Gaming (75.3 - 259, n=105, laatste 2 jaar) | |
| Asus ROG Strix Scar 15 G533ZW-LN106WS | |
| Razer Blade 15 Advanced Model Early 2022 | |
| MSI Raider GE66 12UHS | |
| Asus ROG Zephyrus Duo 16 GX650RX | |
| MSI Vector GP66 12UGS | |
| MSI Titan GT77 12UHS | |
| Gemiddeld Intel Core i9-12900H (74.7 - 118.1, n=28) | |
| Alienware x15 RTX 3070 P111F | |
* ... kleiner is beter
DPC latentie
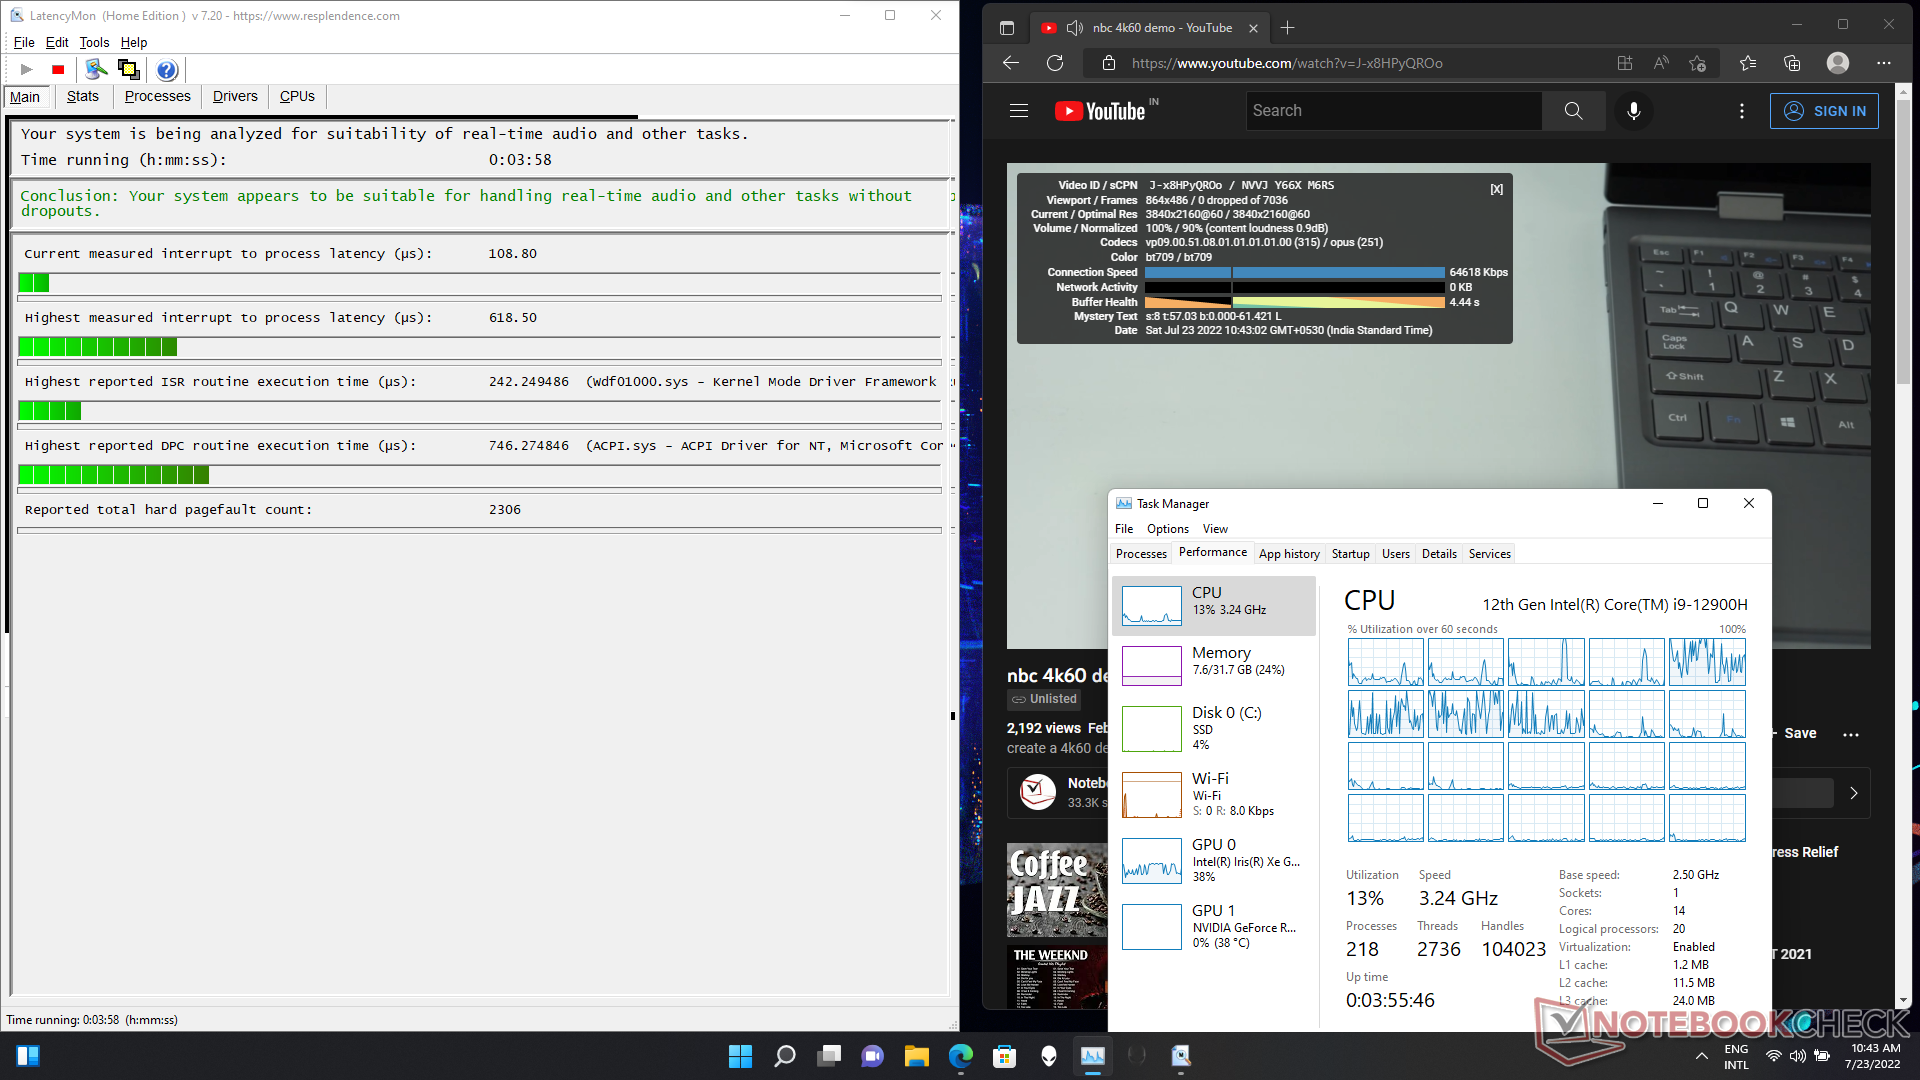
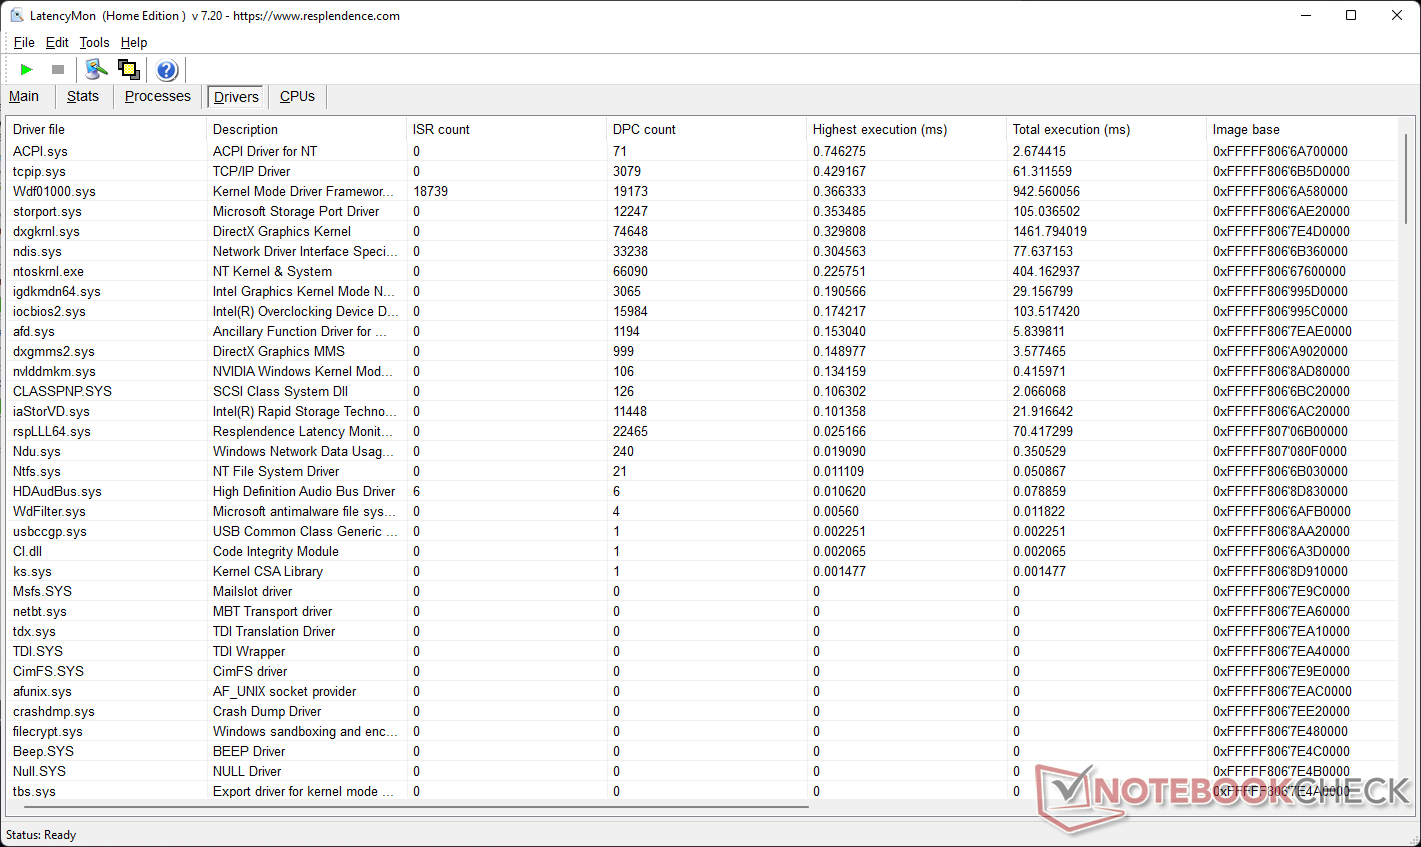
De DPC latentie van de Alienware x15 R2 is wat aan de hoge kant, maar onze LatencyMon tests geven aan dat het nog steeds geschikt zou moeten zijn voor real-time audio en video workflows. Het Windows ACPI.sys stuurprogramma lijkt bij te dragen aan de waargenomen latentie.
| DPC Latencies / LatencyMon - interrupt to process latency (max), Web, Youtube, Prime95 | |
| MSI Raider GE66 12UHS | |
| Razer Blade 15 Advanced Model Early 2022 | |
| MSI Vector GP66 12UGS | |
| MSI Titan GT77 12UHS | |
| MSI Titan GT77 12UHS | |
| Alienware x15 RTX 3070 P111F | |
| Asus ROG Strix Scar 15 G533ZW-LN106WS | |
| Alienware x15 R2 P111F | |
| Asus ROG Zephyrus Duo 16 GX650RX | |
* ... kleiner is beter
Meer vergelijkingen tussen beoordeelde apparaten vindt u op onze DPC latentie ranglijst pagina.
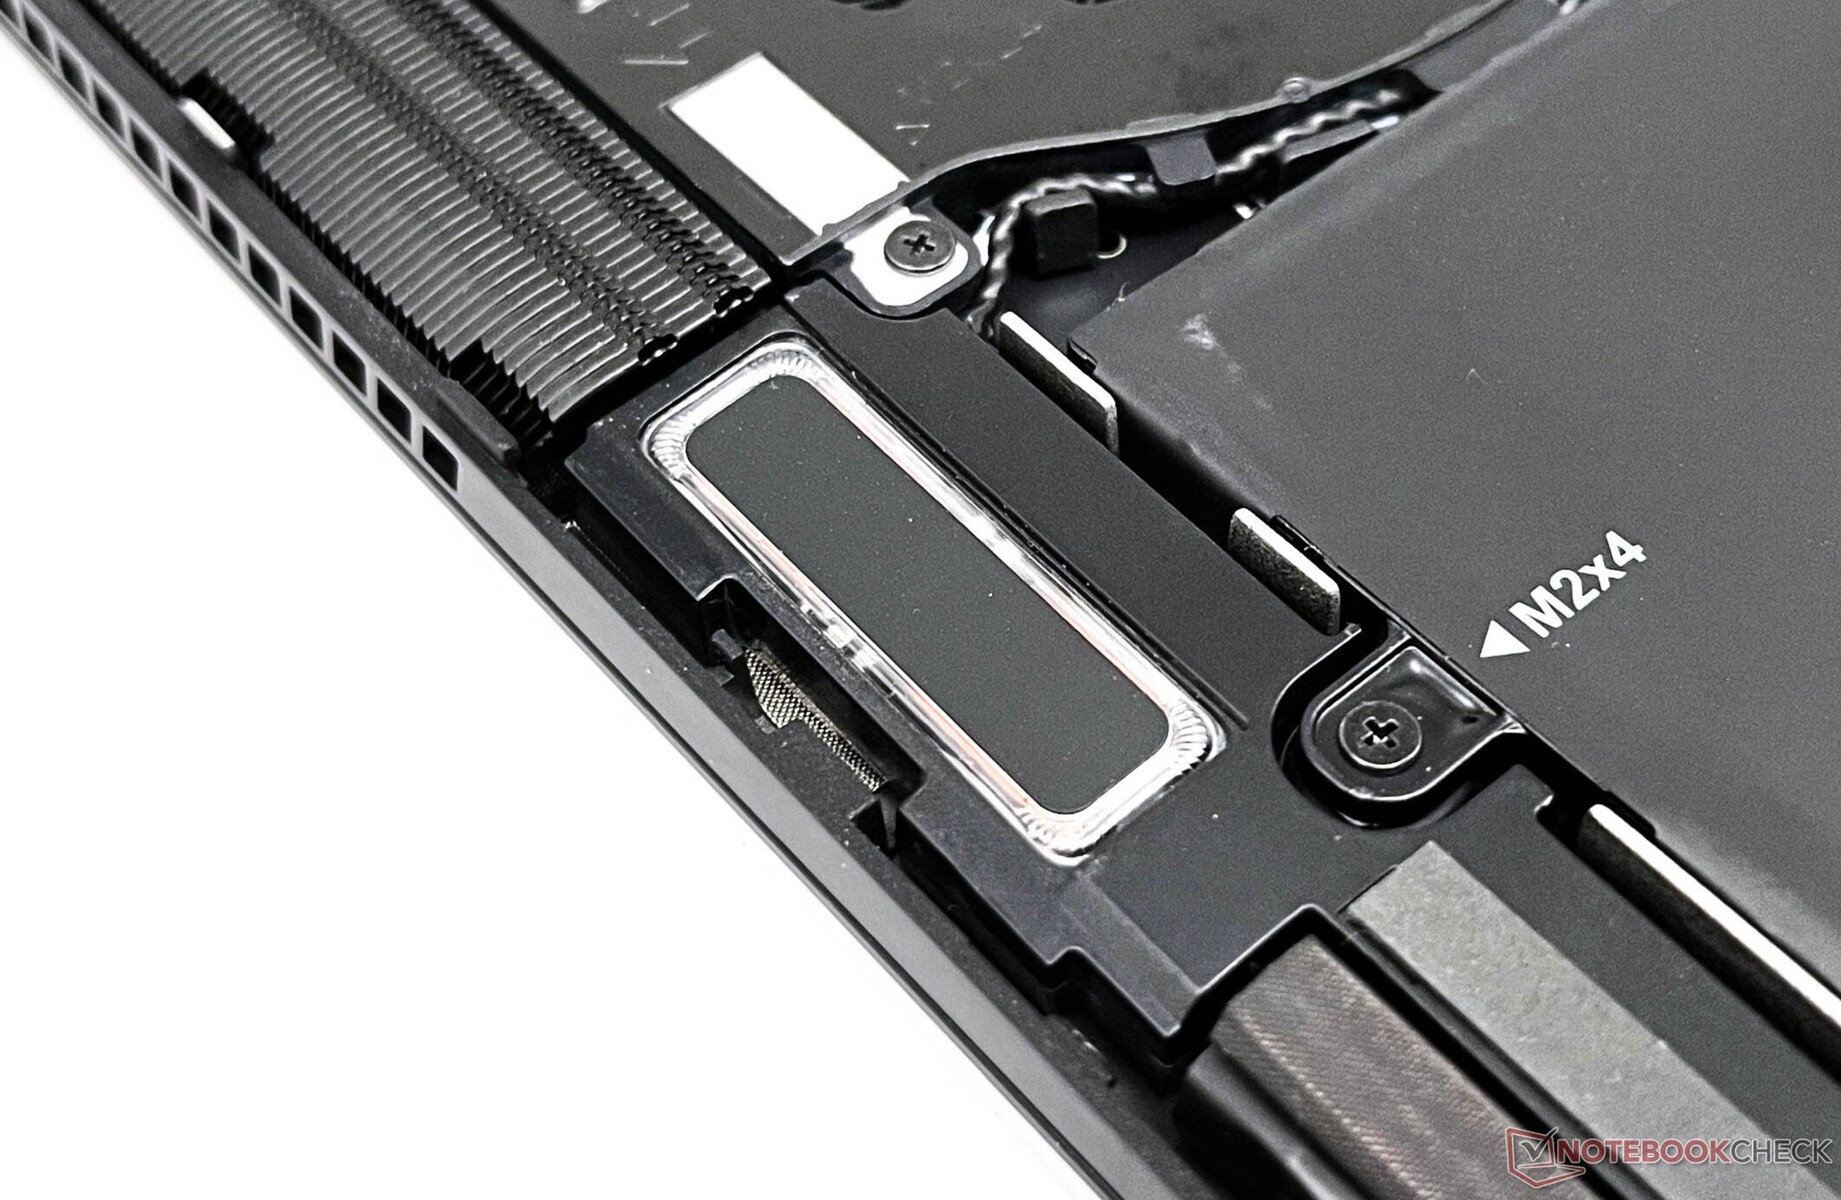
Opslagapparaten
Het opslagsubsysteem is een gebied waar de x15 R2 tekort schiet - we hebben eerder betere prestaties gezien met de Samsung PM9A1 schijf. Dat gezegd hebbende, de sequentiële Q32T1 lees- en schrijfsnelheden komen dicht in de buurt van de geadverteerde waarden voor deze schijf. De x15 R2 van dit jaar biedt 40% betere schijfprestaties dan de Western Digital SN730 SSD van de x15 R1.
Schijf throttling werd waargenomen tegen de 43e run van de DiskSpd read loop test bij een wachtrij diepte van 8. Er is geen thermische oplossing voorzien op de SSD of op het bodempaneel.
Gezien het dunne chassis biedt Dell geen ruimte voor een 2,5-inch SATA-schijf. Er is echter een voorziening om nog een M.2 NVMe SSD toe te voegen.

* ... kleiner is beter
Disk Throttling: DiskSpd Read Loop, Queue Depth 8
Onze specialeSSD- en HDD-benchmarkspagina biedt meer vergelijkingen van de prestaties van opslagapparaten.
GPU-prestaties
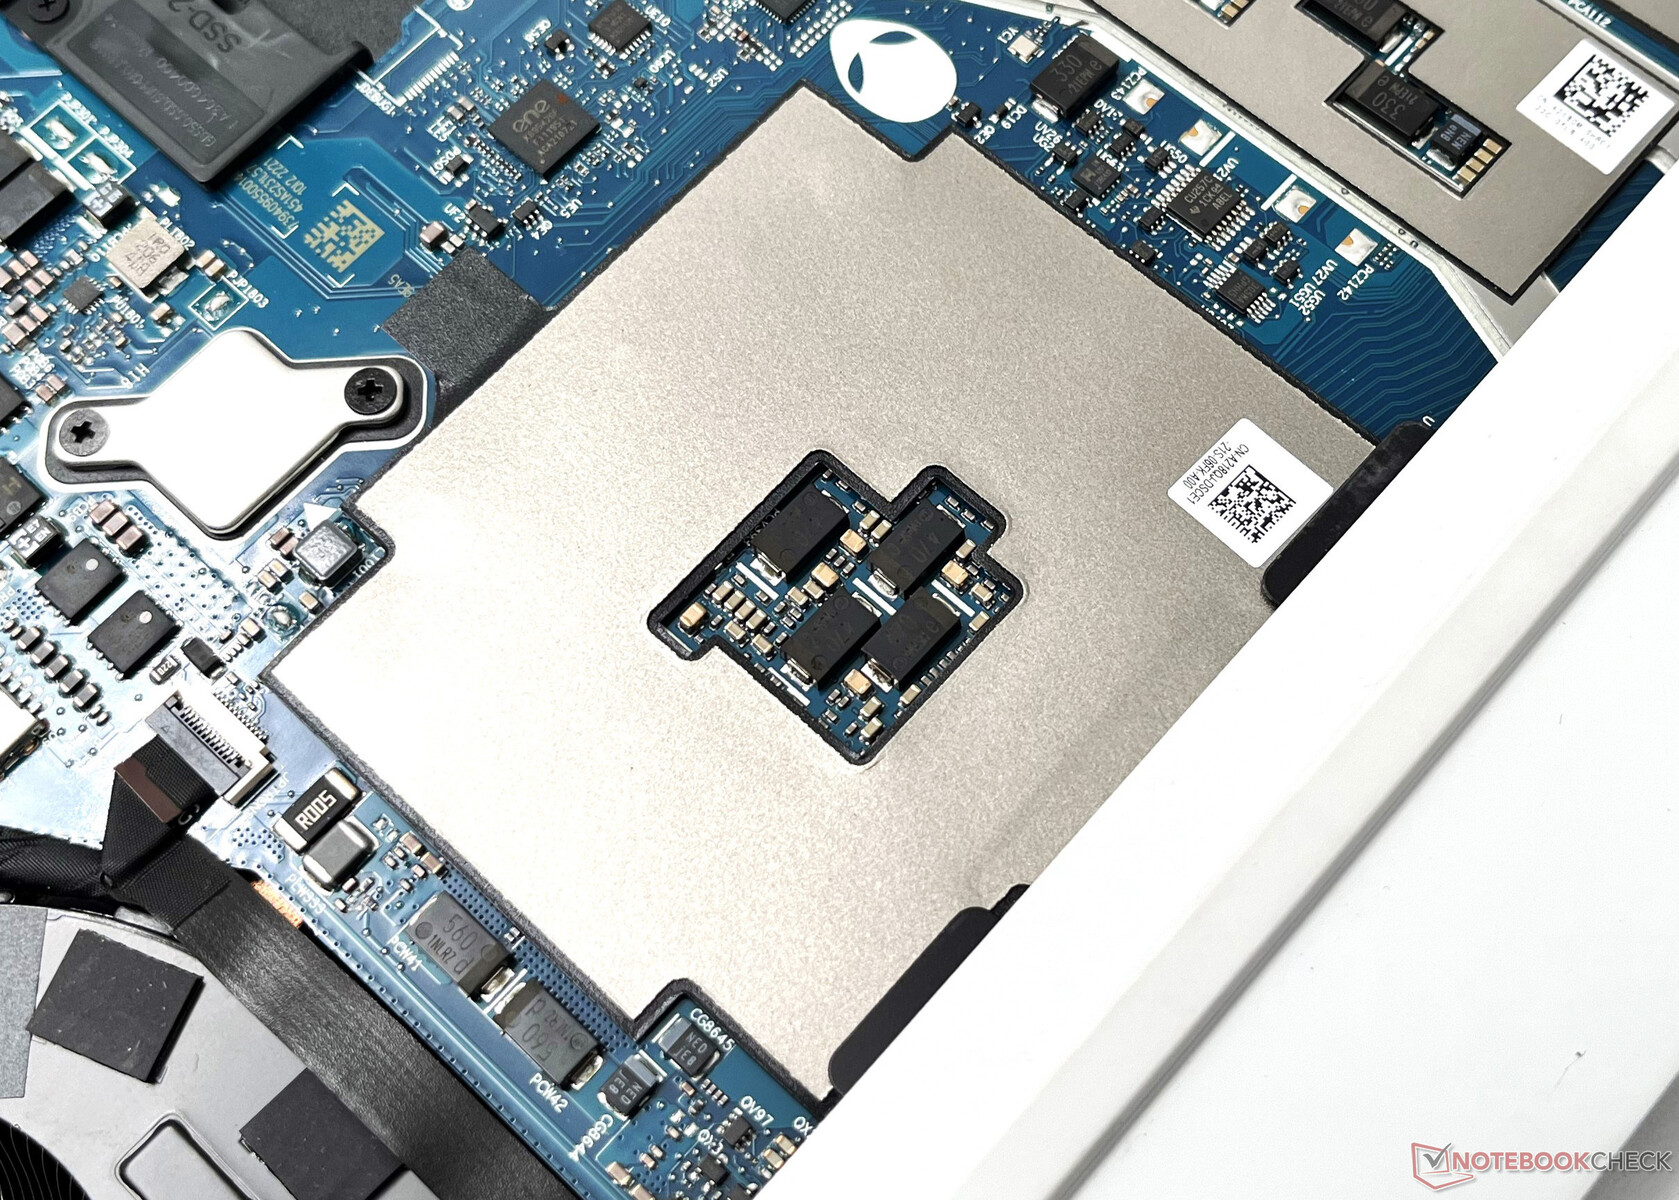
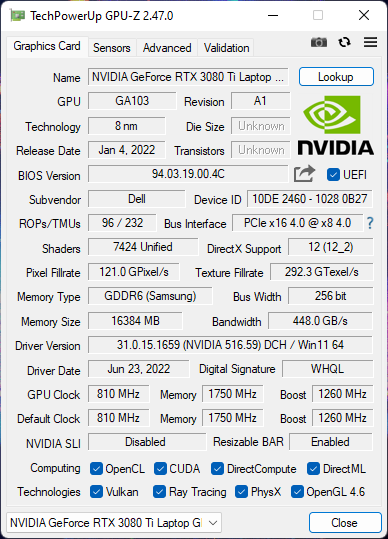
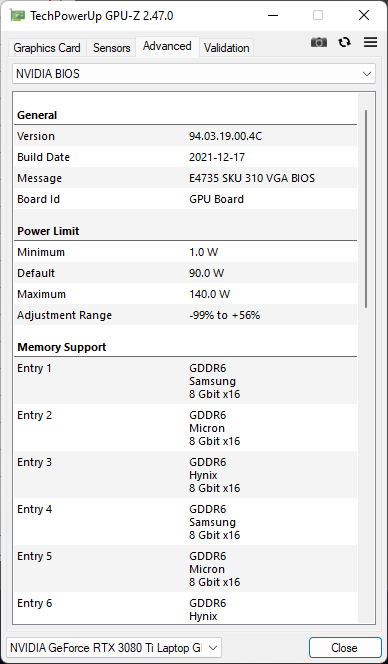
Onze Alienware x15 R2 beschikt over een Nvidia GeForce RTX 3080 Ti laptop GPU met 16 GB GDDR6 VRAM en een totaal grafisch vermogen (TGP) van 140 W. Dell specificeert niet het Dynamic Boost wattage voor deze GPU.
De algemene 3DMark-prestaties van de RTX 3080 Ti in de x15 R2 zijn vergelijkbaar met die van de MSI Raider GE66 (150 W) en de MSI Titan GT77 (175 W). De wat lagere score komt door het lagere wattage dat nodig is voor het dunne chassis. De RTX 3080 Ti van de Razer Blade 15 Advanced blijft achter door het lage vermogen van 110 W.
| 3DMark 11 Performance | 33756 punten | |
| 3DMark Ice Storm Standard Score | 265376 punten | |
| 3DMark Cloud Gate Standard Score | 62500 punten | |
| 3DMark Fire Strike Score | 24365 punten | |
| 3DMark Fire Strike Extreme Score | 14539 punten | |
| 3DMark Time Spy Score | 12393 punten | |
Help | ||
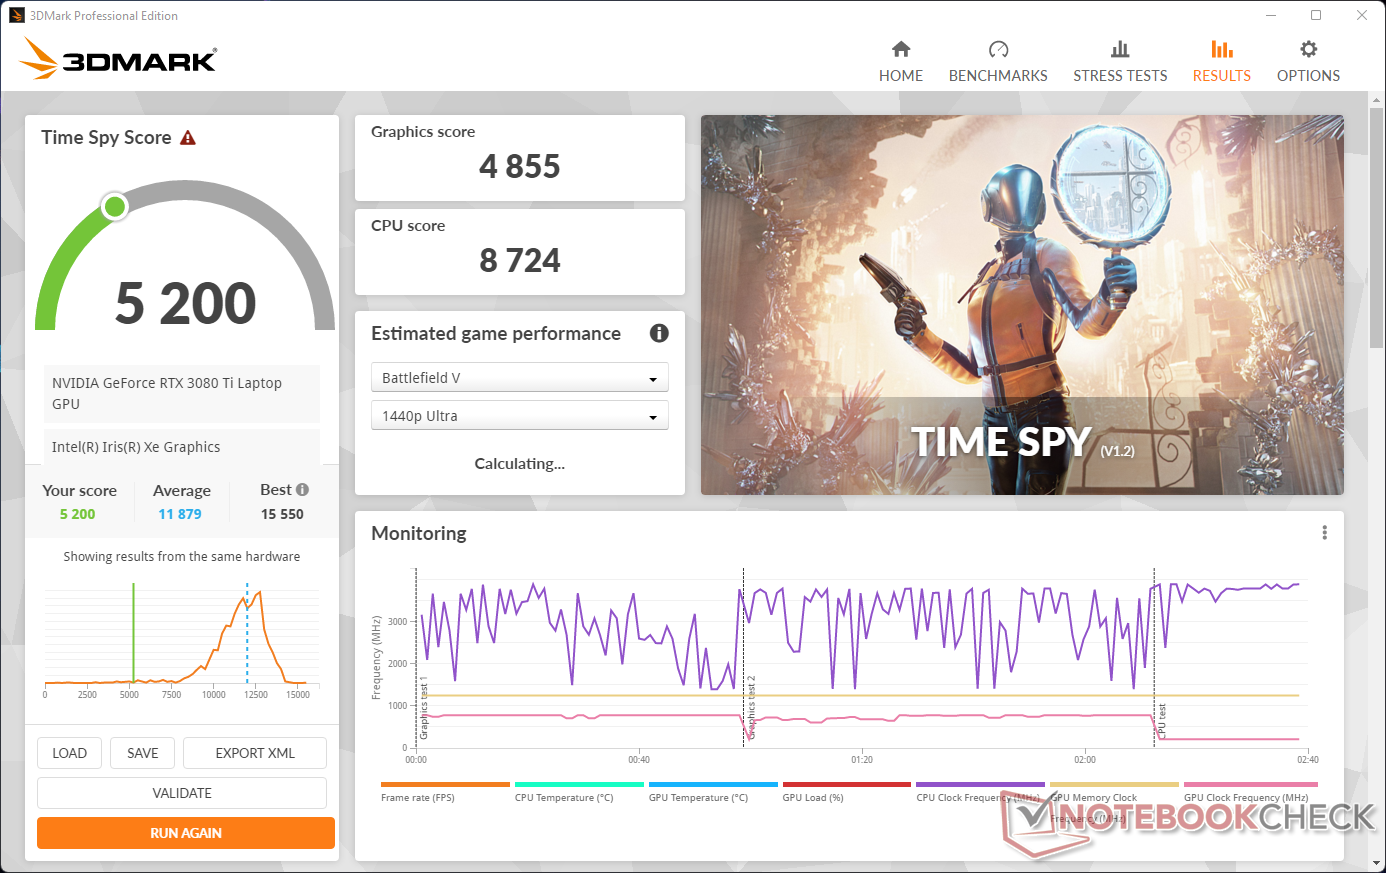
Op batterijvermogen zien we een aanzienlijke daling in 3DMark Time Spy scores. De algemene score daalt met 58%, terwijl de grafische prestaties een enorme klap van 60% krijgen
De schermverversingssnelheid schakelt automatisch over van 360 Hz naar 60 Hz wanneer hij van het lichtnet wordt losgekoppeld.
Spelprestaties
De gamingprestaties van de Alienware x15 R2 liggen in de lijn der verwachting voor de aangeboden hardware en zijn over het algemeen op gelijke hoogte met andere RTX 3080 Ti-aangedreven laptops. Bij zeer lage instellingen gaat de Asus ROG Strix Scar 15 aan kop met zijn 150 W RTX 3070 Ti laptop GPU in games zoals F1 2021, The Witcher 3 , en Cyberpunk 2077, maar de x15 R2 wint terrein zodra de grafische instellingen worden aangezwengeld.
| F1 2021 | |
| 1920x1080 High Preset AA:T AF:16x | |
| MSI Titan GT77 12UHS | |
| MSI Raider GE66 12UHS | |
| Alienware x15 R2 P111F | |
| Gemiddeld NVIDIA GeForce RTX 3080 Ti Laptop GPU (182.1 - 316, n=17) | |
| Asus ROG Strix Scar 15 G533ZW-LN106WS | |
| Asus ROG Zephyrus Duo 16 GX650RX | |
| 1920x1080 Ultra High Preset + Raytracing AA:T AF:16x | |
| MSI Titan GT77 12UHS | |
| Alienware x15 R2 P111F | |
| MSI Raider GE66 12UHS | |
| Asus ROG Strix Scar 15 G533ZW-LN106WS | |
| Asus ROG Zephyrus Duo 16 GX650RX | |
| Gemiddeld NVIDIA GeForce RTX 3080 Ti Laptop GPU (30.2 - 160.6, n=30) | |
| Watch Dogs Legion | |
| 1920x1080 Ultra Preset (DX12) | |
| MSI Titan GT77 12UHS | |
| Gemiddeld NVIDIA GeForce RTX 3080 Ti Laptop GPU (78.2 - 87, n=4) | |
| Alienware x15 R2 P111F | |
| 1920x1080 Ultra Preset + Ultra Ray Tracing (DX12) | |
| Gemiddeld NVIDIA GeForce RTX 3080 Ti Laptop GPU (50 - 70, n=3) | |
| MSI Titan GT77 12UHS | |
| Alienware x15 R2 P111F | |
| Tiny Tina's Wonderlands | |
| 1920x1080 High Preset (DX12) | |
| Gemiddeld NVIDIA GeForce RTX 3080 Ti Laptop GPU (123.5 - 137.1, n=4) | |
| Asus ROG Zephyrus Duo 16 GX650RX | |
| Alienware x15 R2 P111F | |
| Gemiddelde van klas Gaming (72.1 - 203, n=4, laatste 2 jaar) | |
| 1920x1080 Badass Preset (DX12) | |
| Gemiddeld NVIDIA GeForce RTX 3080 Ti Laptop GPU (100.7 - 110.5, n=4) | |
| Asus ROG Zephyrus Duo 16 GX650RX | |
| Alienware x15 R2 P111F | |
| Gemiddelde van klas Gaming (55 - 159.4, n=4, laatste 2 jaar) | |
De Witcher 3 FPS grafiek
Aanhoudende prestaties in The Witcher 3 op 1080p Ultra zijn fatsoenlijk, hoewel we framerate schommelingen zien. Er is een lichte dip in fps tegen het einde van de run, maar de x15 R2 weet zich snel te herstellen.
| lage | gem. | hoge | ultra | |
|---|---|---|---|---|
| The Witcher 3 (2015) | 391 | 345 | 229 | 116 |
| Dota 2 Reborn (2015) | 174.7 | 162.2 | 151.6 | 145.7 |
| Final Fantasy XV Benchmark (2018) | 209 | 156.4 | 120.5 | |
| X-Plane 11.11 (2018) | 146.9 | 137.7 | 105.5 | |
| Far Cry 5 (2018) | 172 | 152 | 143 | 135 |
| Strange Brigade (2018) | 458 | 246 | 200 | 180.5 |
| Watch Dogs Legion (2020) | 133.2 | 122.4 | 107.4 | 78.2 |
| F1 2021 (2021) | 361 | 319 | 248 | 146.9 |
| Cyberpunk 2077 1.6 (2022) | 133.7 | 124.6 | 102.6 | 86.1 |
| Tiny Tina's Wonderlands (2022) | 209 | 178.2 | 126.6 | 100.7 |
| Call of Duty Modern Warfare 2 2022 (2022) | 96 |
Bekijk onze Nvidia GeForce RTX 3080 Ti Laptop GPU voor meer informatie en benchmark vergelijkingen.
Emissies: Deze hot rod loopt heet
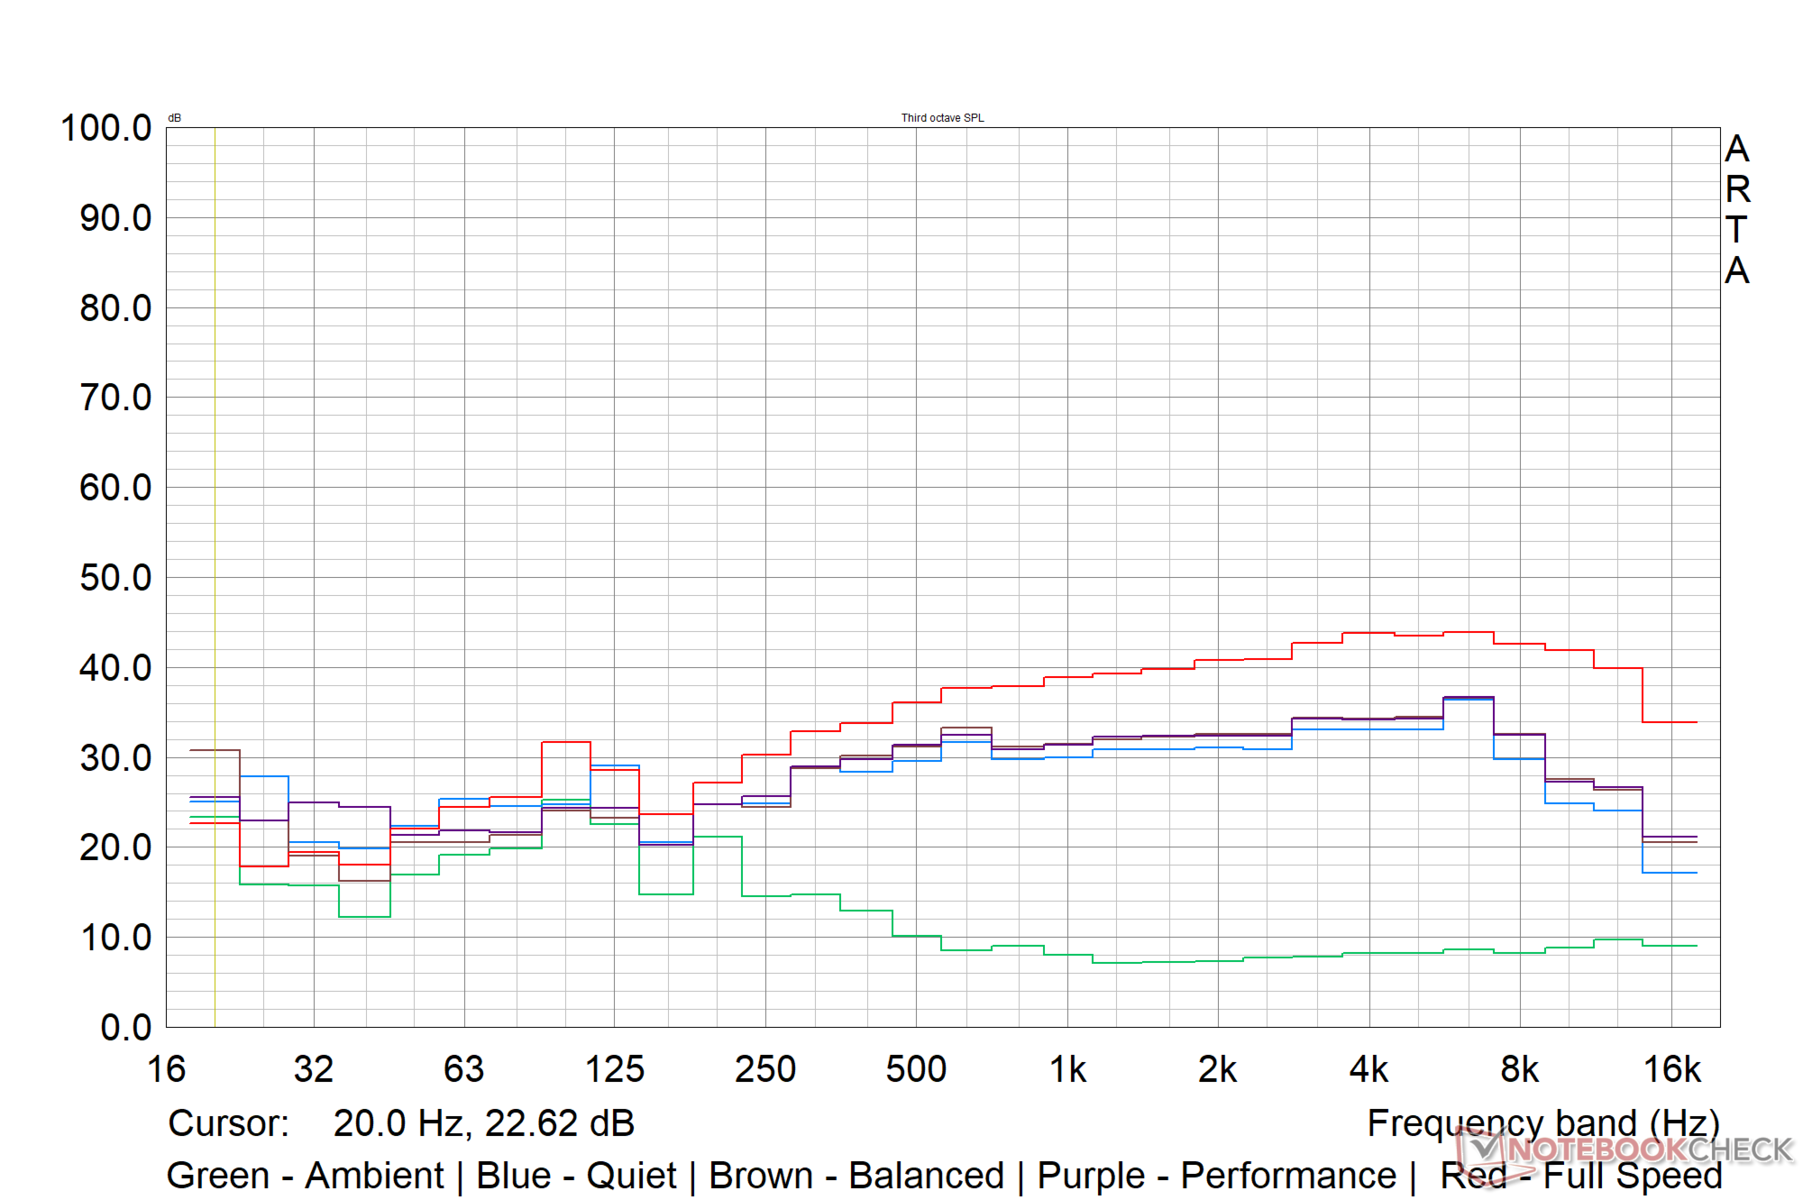
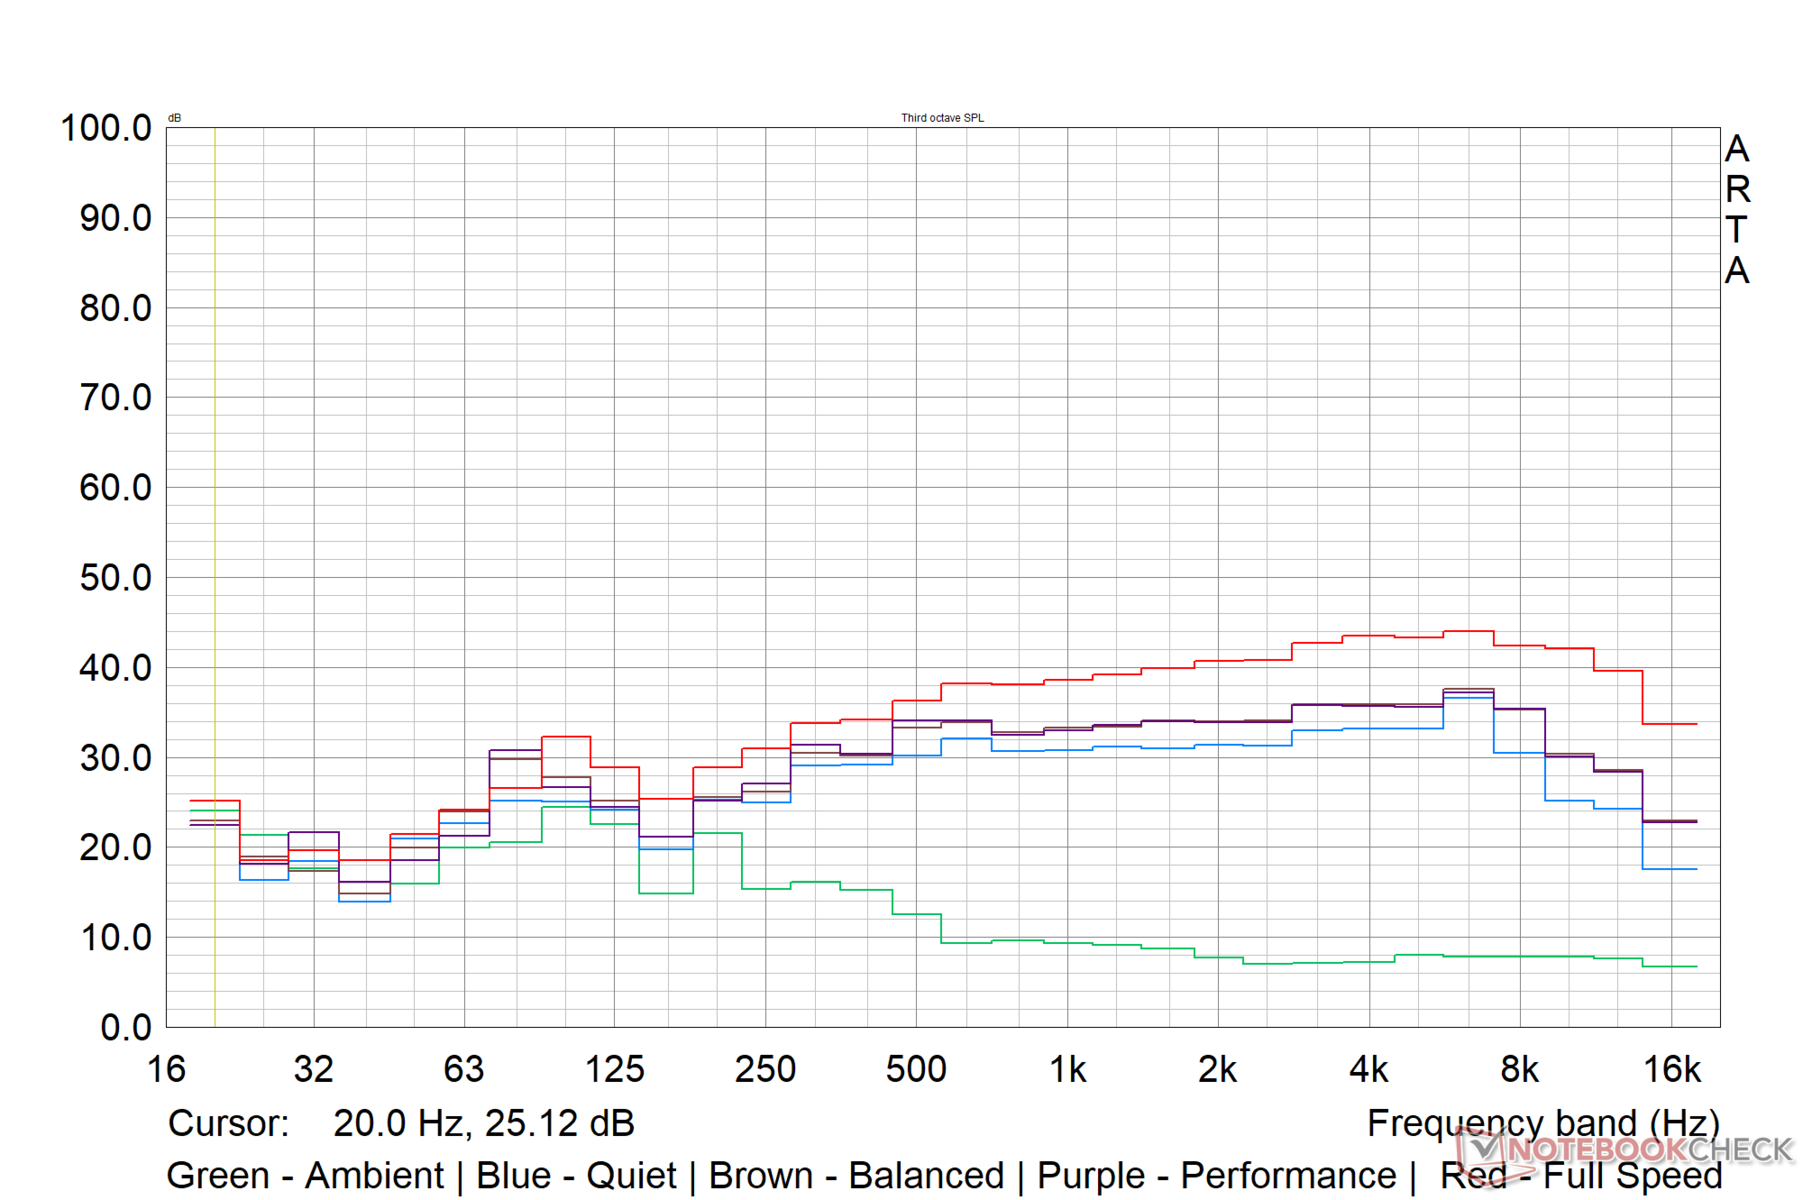
Systeemgeluid
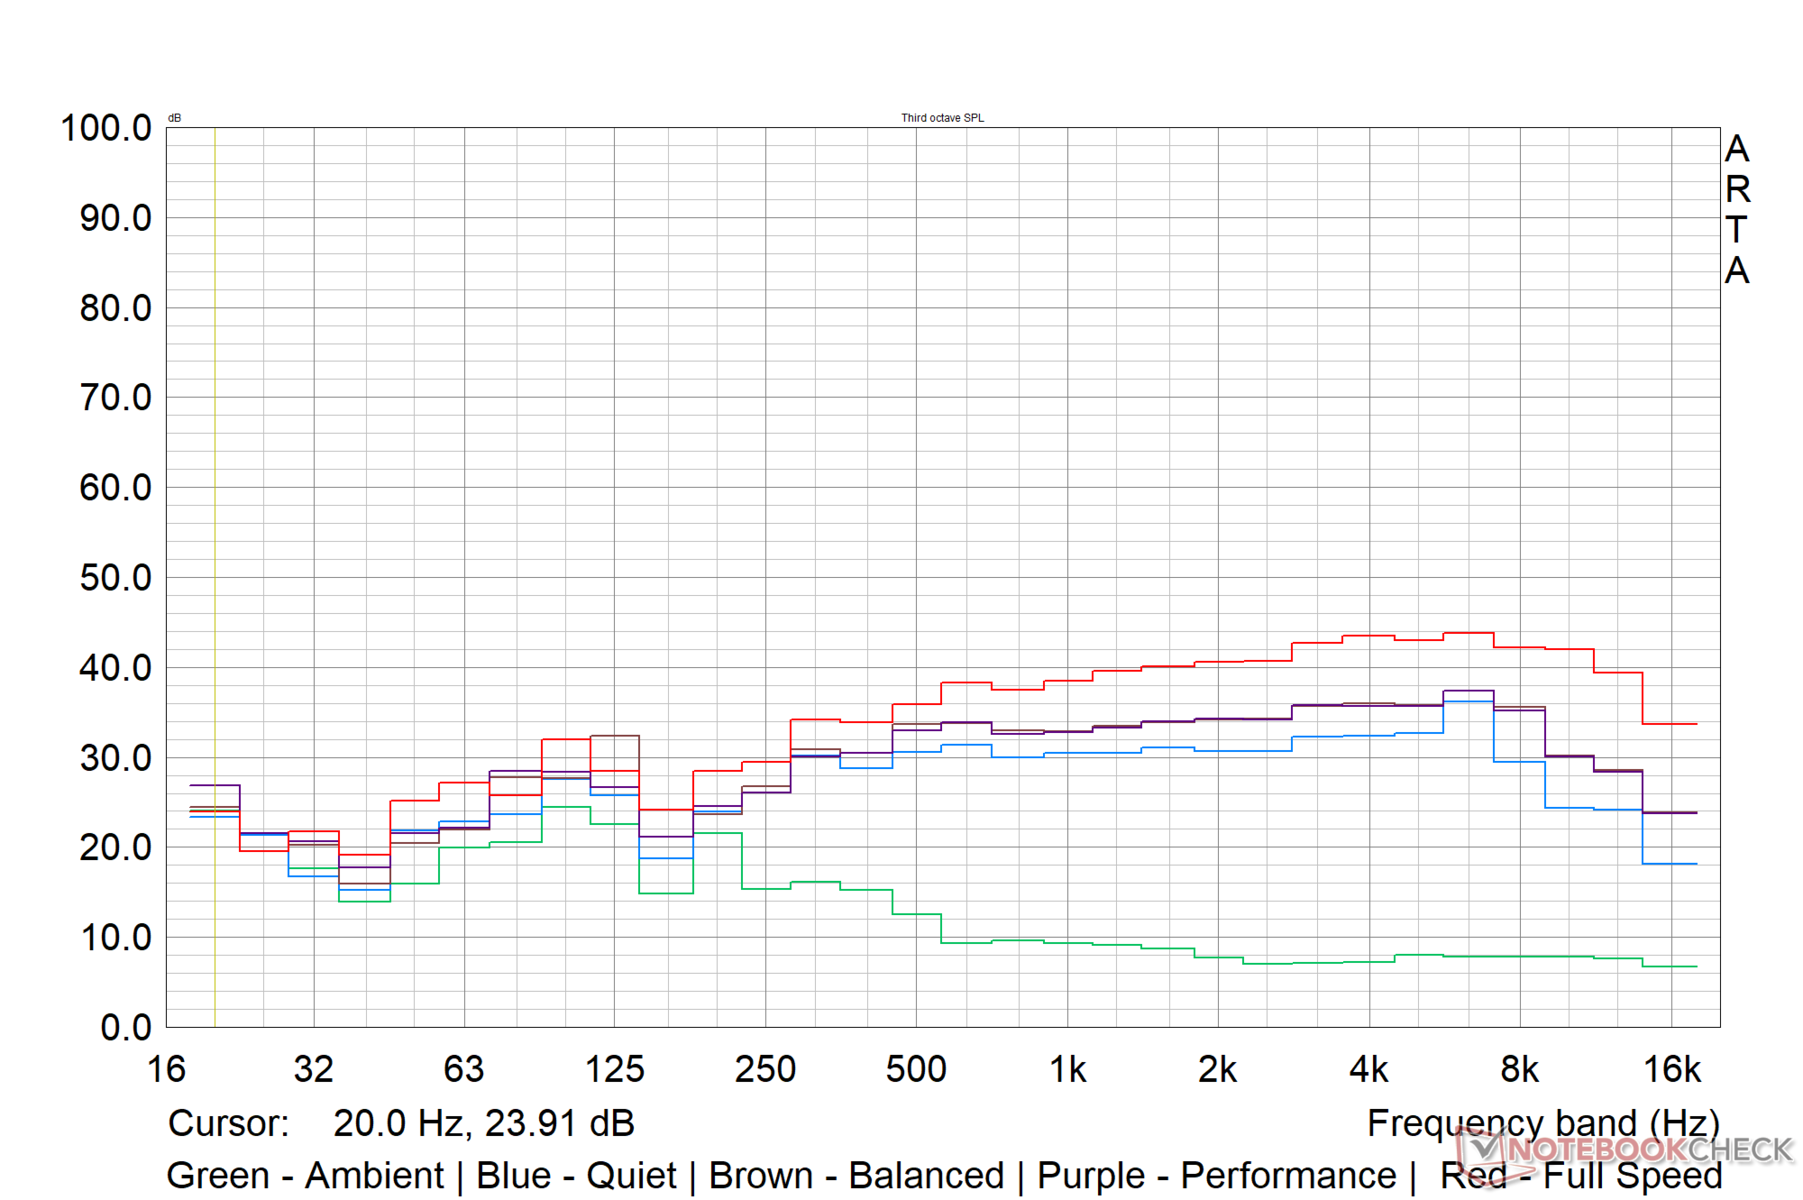
Zoals eerder besproken, biedt Dell vier thermische profielen om uit te kiezen. Voor de meeste doeleinden doen de Balanced en Performance modi het goed. De Full Speed-modus is alleen nodig als u absoluut ongehinderd wilt koelen.
In de stille modus beperkt Dell het ventilatorgeluid tot 45 dB(A), ongeacht de belasting. We registreerden bijna 47 db(A) ventilatorgeluid tijdens het draaien van The Witcher 3 in 1080p Ultra in zowel de Balanced als de Performance modus.
We hebben het geluidsniveau van de ventilator gemeten in de gebalanceerde modus. Dell lijkt het geluidsniveau van de ventilator te hebben ingesteld op 53 db(A) in de modus Full Speed, ongeacht de belasting en zelfs tijdens stationair draaien.
Geluidsniveau
| Onbelast |
| 21.94 / 21.94 / 21.94 dB (A) |
| Belasting |
| 45.1 / 45.58 dB (A) |
 | ||
30 dB stil 40 dB(A) hoorbaar 50 dB(A) luid |
||
min: | ||
| Alienware x15 R2 P111F Intel Core i9-12900H, NVIDIA GeForce RTX 3080 Ti Laptop GPU | Asus ROG Strix Scar 15 G533ZW-LN106WS Intel Core i9-12900H, NVIDIA GeForce RTX 3070 Ti Laptop GPU | Asus ROG Zephyrus Duo 16 GX650RX AMD Ryzen 9 6900HX, NVIDIA GeForce RTX 3080 Ti Laptop GPU | MSI Vector GP66 12UGS Intel Core i9-12900H, NVIDIA GeForce RTX 3070 Ti Laptop GPU | Razer Blade 15 Advanced Model Early 2022 Intel Core i7-12800H, NVIDIA GeForce RTX 3080 Ti Laptop GPU | |
|---|---|---|---|---|---|
| Noise | -46% | -14% | -11% | -10% | |
| uit / omgeving * (dB) | 21.79 | 26.86 -23% | 26 -19% | 22.9 -5% | 26 -19% |
| Idle Minimum * (dB) | 21.94 | 39.07 -78% | 26 -19% | 23.4 -7% | 26 -19% |
| Idle Average * (dB) | 21.94 | 39.07 -78% | 27 -23% | 23.4 -7% | 27 -23% |
| Idle Maximum * (dB) | 21.94 | 39.07 -78% | 29 -32% | 27.4 -25% | 29 -32% |
| Load Average * (dB) | 45.1 | 53.34 -18% | 41 9% | 36 20% | 37 18% |
| Witcher 3 ultra * (dB) | 46.56 | 56.6 -22% | 48 -3% | 58.2 -25% | 44 5% |
| Load Maximum * (dB) | 45.58 | 56.6 -24% | 50 -10% | 58 -27% | 45 1% |
* ... kleiner is beter
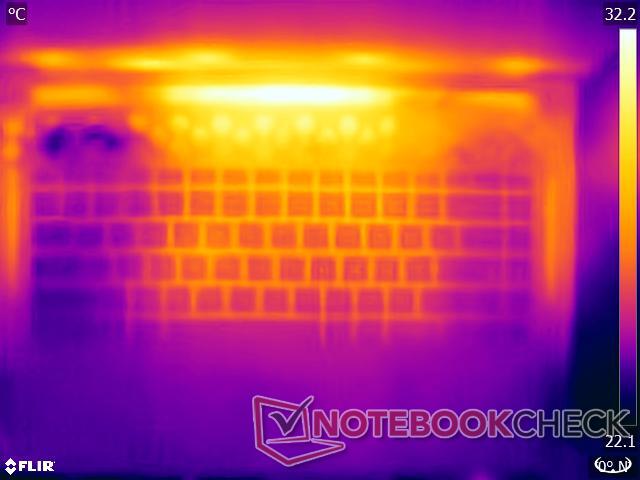
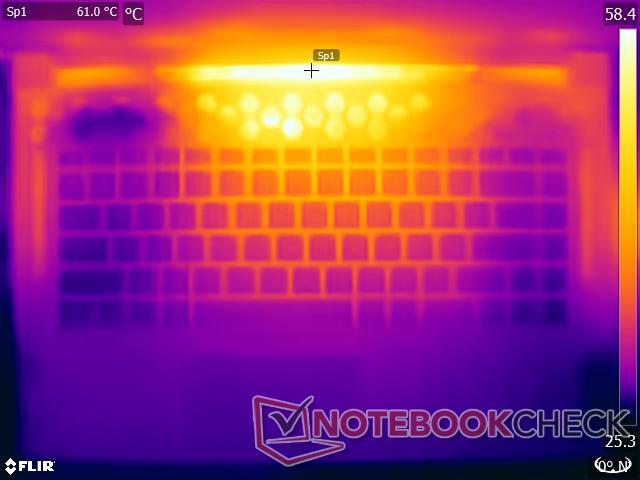
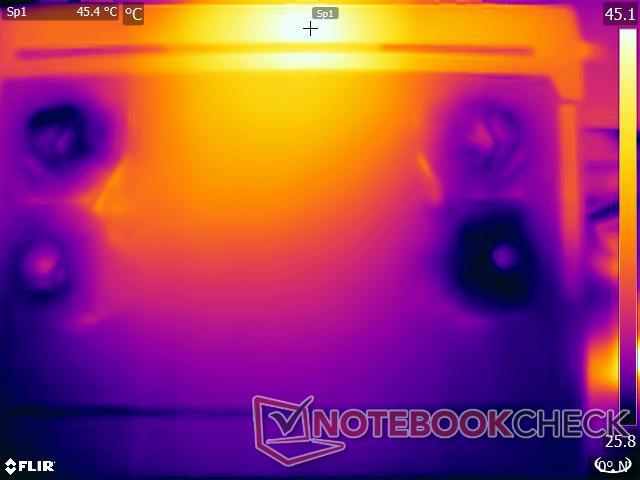
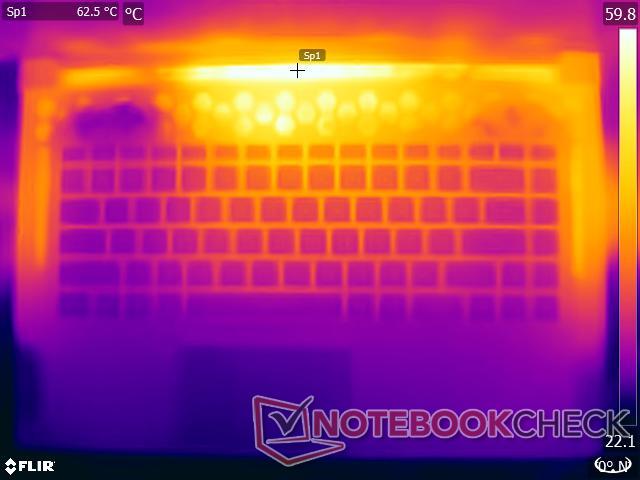
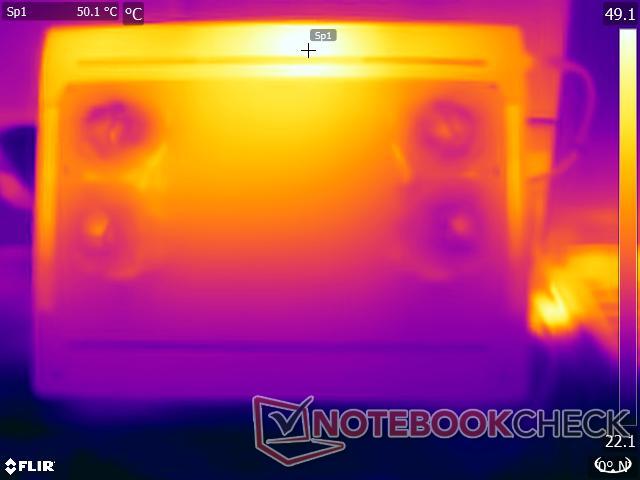
Temperatuur
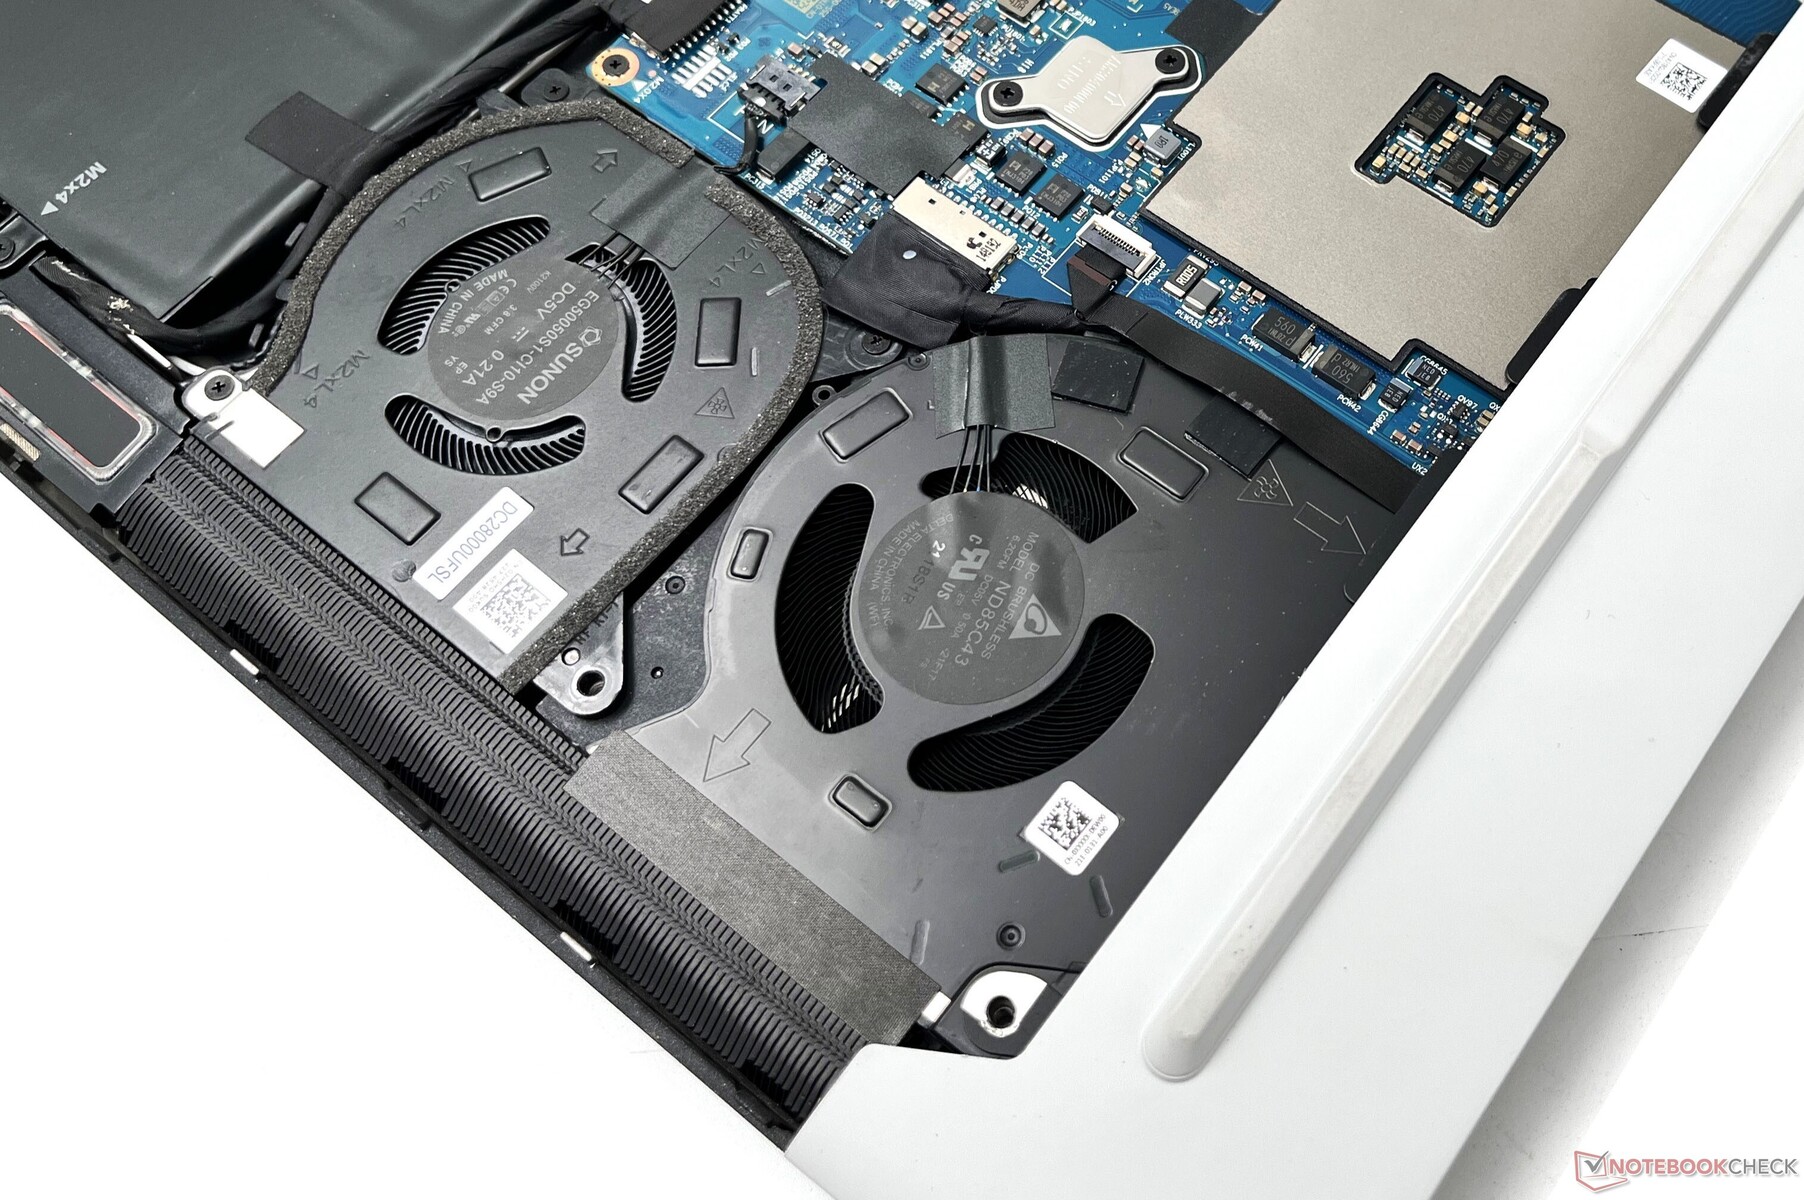
Zelfs met vier onafhankelijk geregelde ventilatoren en vier heatpipes die in het Full Speed profiel draaien, zagen we oppervlaktetemperaturen die opliepen tot 66,2 °C tijdens The Witcher 3 stresstest. Dat gezegd hebbende, de palmsteunen zijn relatief koel, zelfs onder belasting.
(-) De maximumtemperatuur aan de bovenzijde bedraagt 58.6 °C / 137 F, vergeleken met het gemiddelde van 40.4 °C / 105 F, variërend van 21.2 tot 68.8 °C voor de klasse Gaming.
(-) De bodem warmt op tot een maximum van 51.8 °C / 125 F, vergeleken met een gemiddelde van 43.2 °C / 110 F
(+) Bij onbelast gebruik bedraagt de gemiddelde temperatuur voor de bovenzijde 31.4 °C / 89 F, vergeleken met het apparaatgemiddelde van 33.9 °C / 93 F.
(-) Bij het spelen van The Witcher 3 is de gemiddelde temperatuur voor de bovenzijde 46.9 °C / 116 F, vergeleken met het apparaatgemiddelde van 33.9 °C / 93 F.
(+) De handpalmsteunen en het touchpad bereiken maximaal de huidtemperatuur (33.4 °C / 92.1 F) en zijn dus niet heet.
(-) De gemiddelde temperatuur van de handpalmsteun van soortgelijke toestellen bedroeg 28.8 °C / 83.8 F (-4.6 °C / -8.3 F).
Onze stresstests vertegenwoordigen extreme scenario's, maar we raden aan de x15 R2 alleen op schoot te gebruiken als hij in de Quiet of Balanced thermische profielen zonder veel stress draait, om te zorgen voor aanvaardbare oppervlaktetemperaturen.
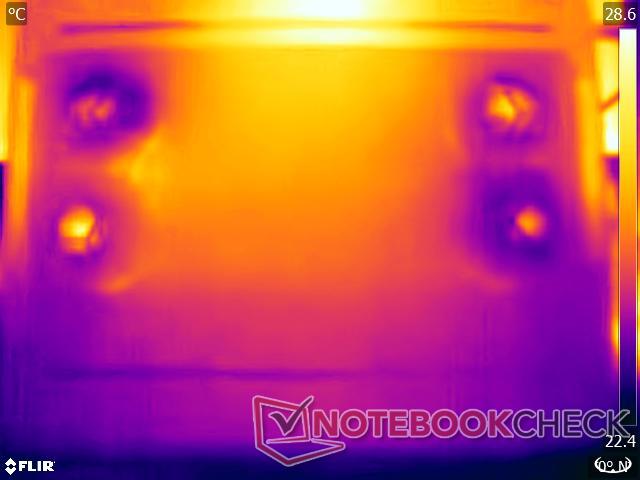
| Alienware x15 R2 P111F Intel Core i9-12900H, NVIDIA GeForce RTX 3080 Ti Laptop GPU | Asus ROG Strix Scar 15 G533ZW-LN106WS Intel Core i9-12900H, NVIDIA GeForce RTX 3070 Ti Laptop GPU | Asus ROG Zephyrus Duo 16 GX650RX AMD Ryzen 9 6900HX, NVIDIA GeForce RTX 3080 Ti Laptop GPU | MSI Vector GP66 12UGS Intel Core i9-12900H, NVIDIA GeForce RTX 3070 Ti Laptop GPU | Razer Blade 15 Advanced Model Early 2022 Intel Core i7-12800H, NVIDIA GeForce RTX 3080 Ti Laptop GPU | |
|---|---|---|---|---|---|
| Heat | 0% | 7% | 8% | -4% | |
| Maximum Upper Side * (°C) | 58.6 | 42.6 27% | 45 23% | 40.2 31% | 53 10% |
| Maximum Bottom * (°C) | 51.8 | 50.2 3% | 50 3% | 43.8 15% | 53 -2% |
| Idle Upper Side * (°C) | 36.4 | 36.2 1% | 33 9% | 34.8 4% | 36 1% |
| Idle Bottom * (°C) | 31 | 40.2 -30% | 33 -6% | 37 -19% | 38 -23% |
* ... kleiner is beter
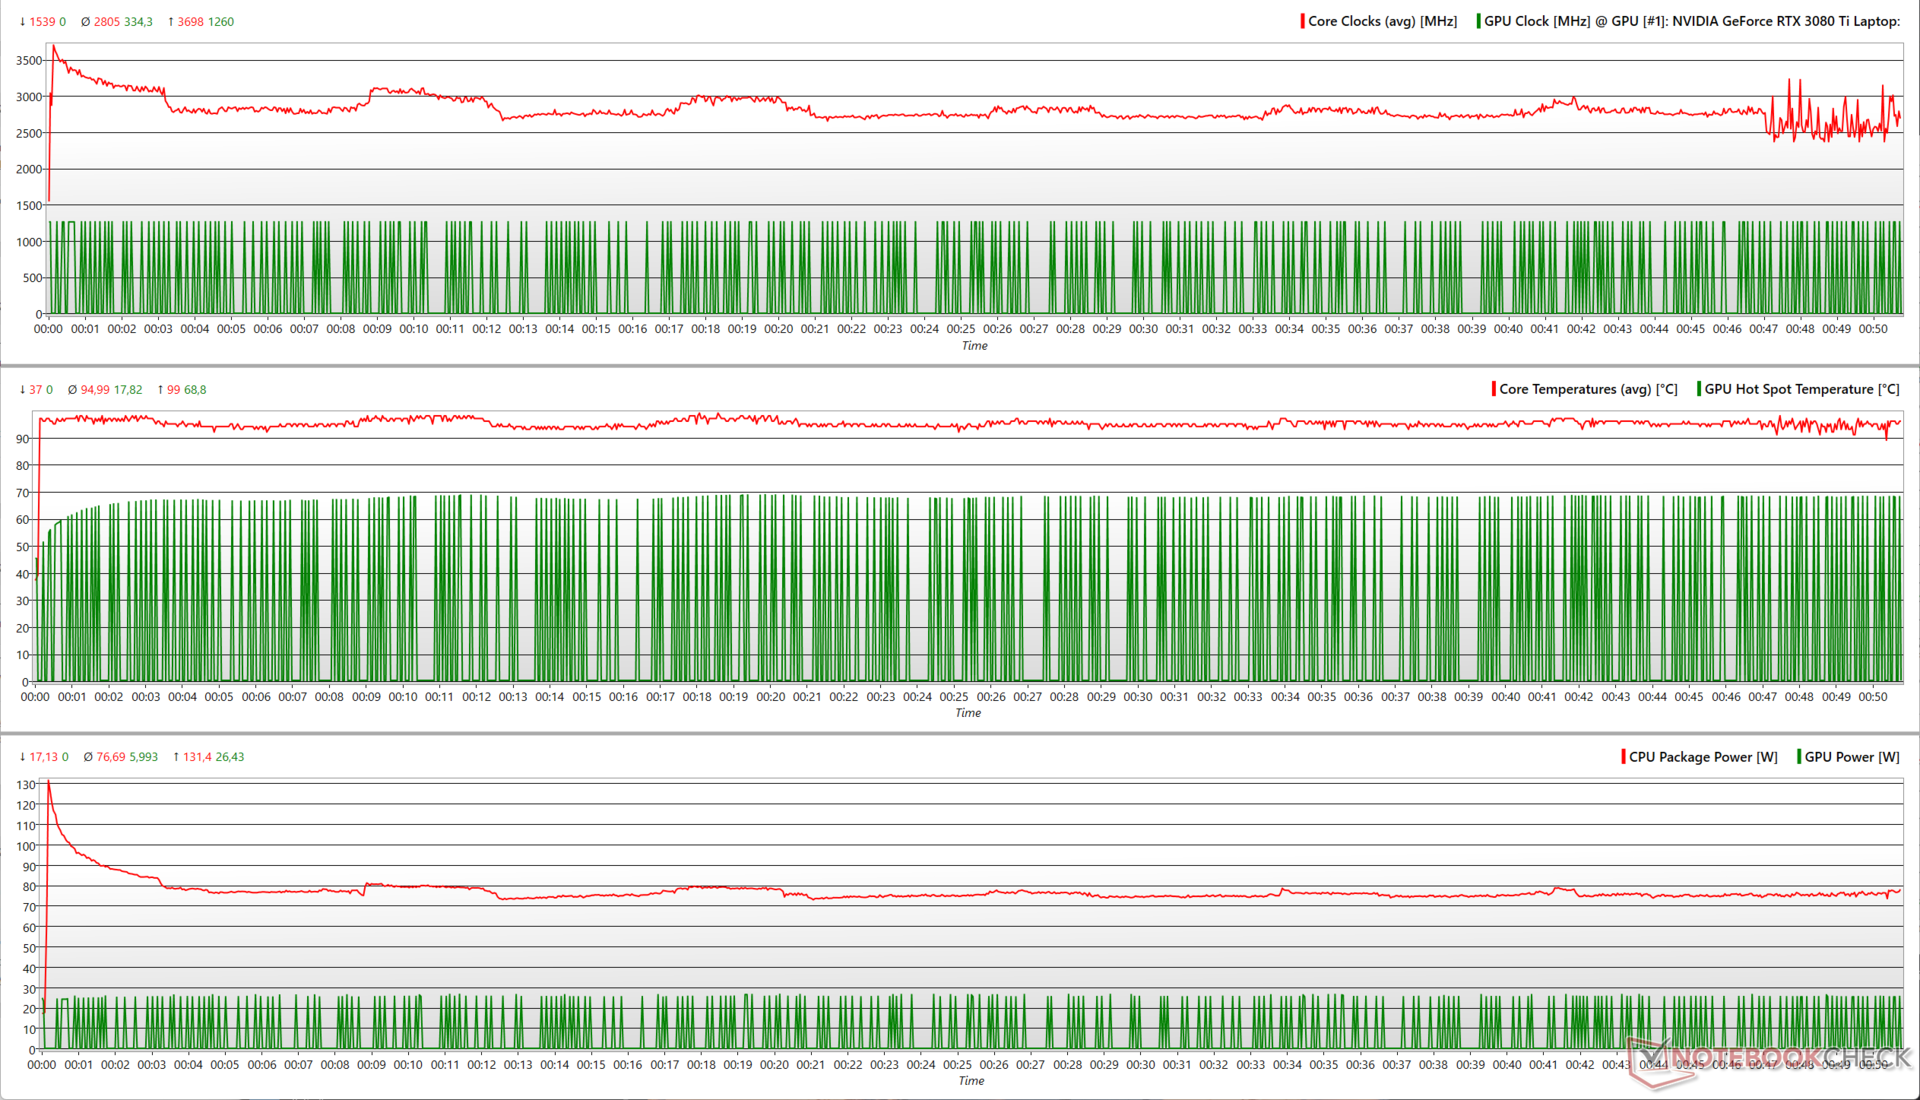
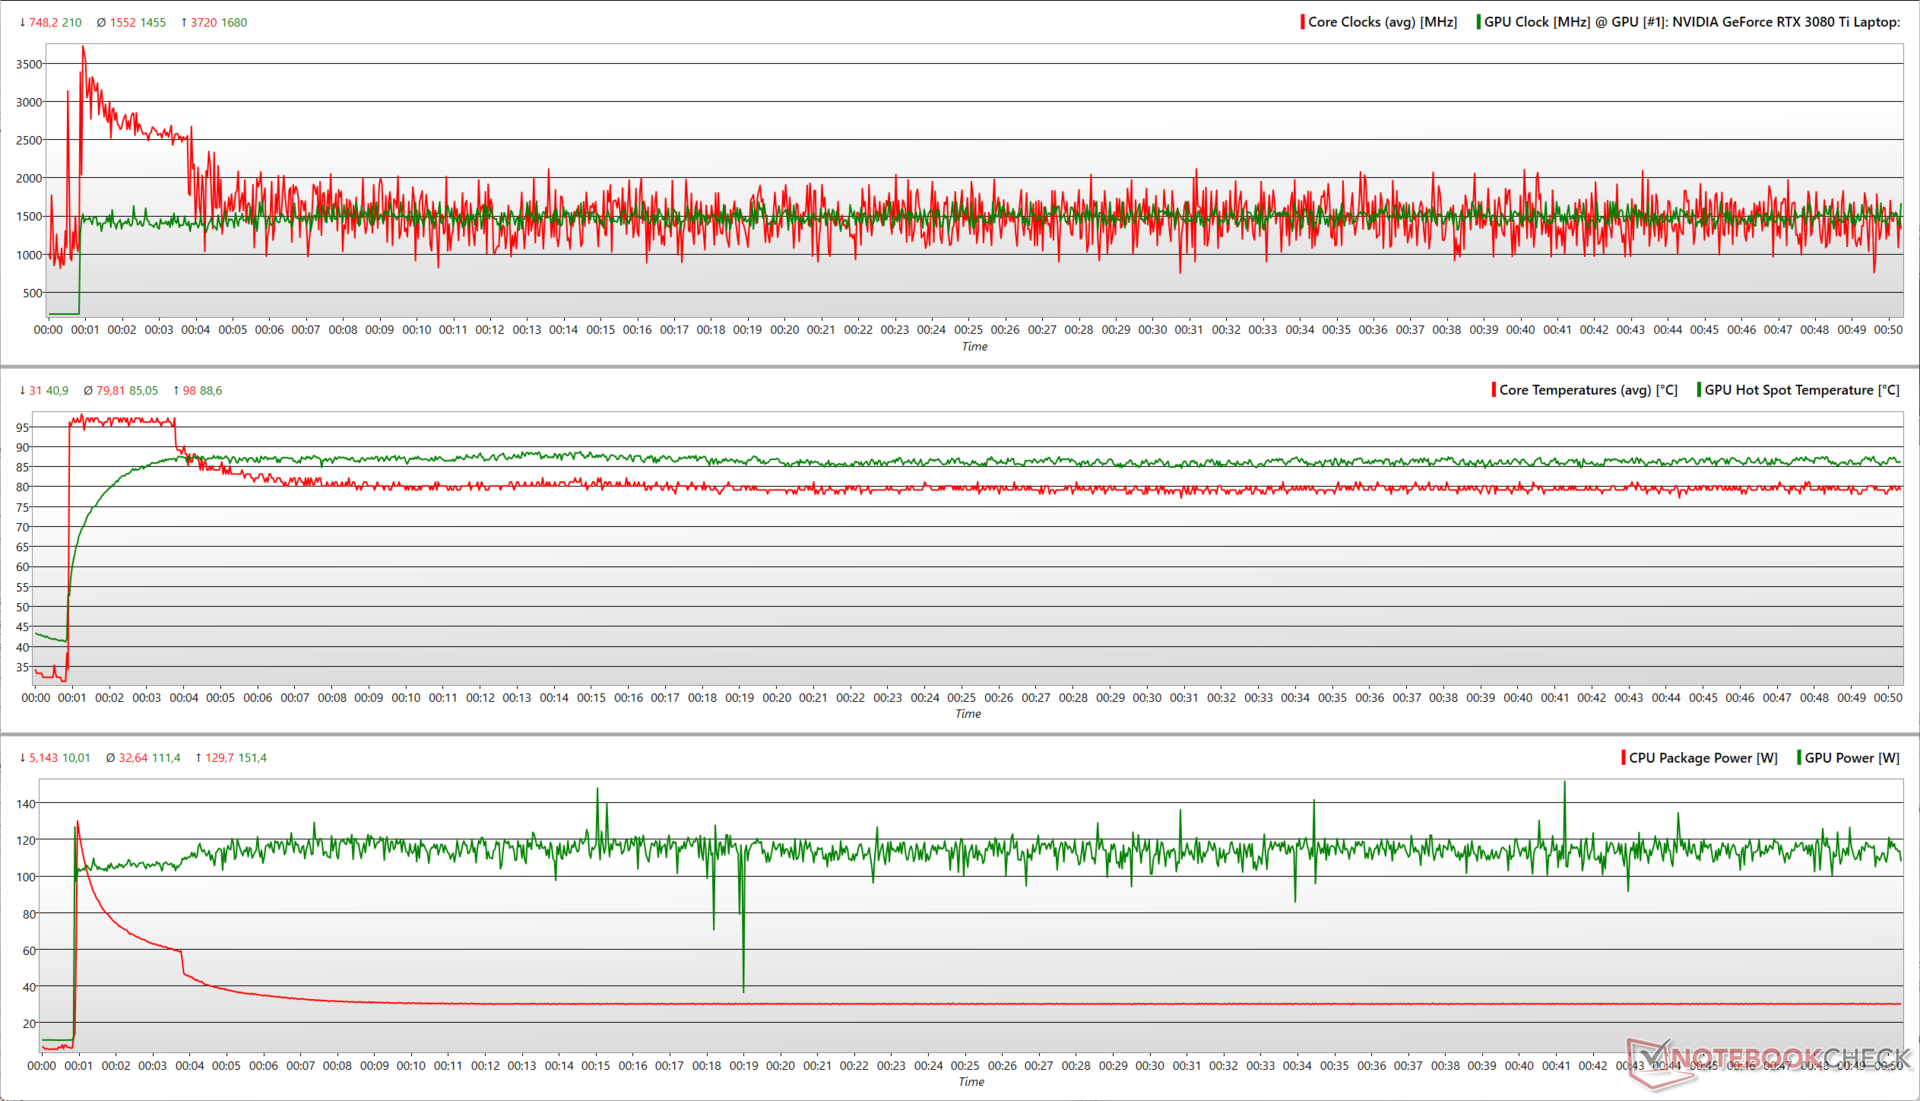
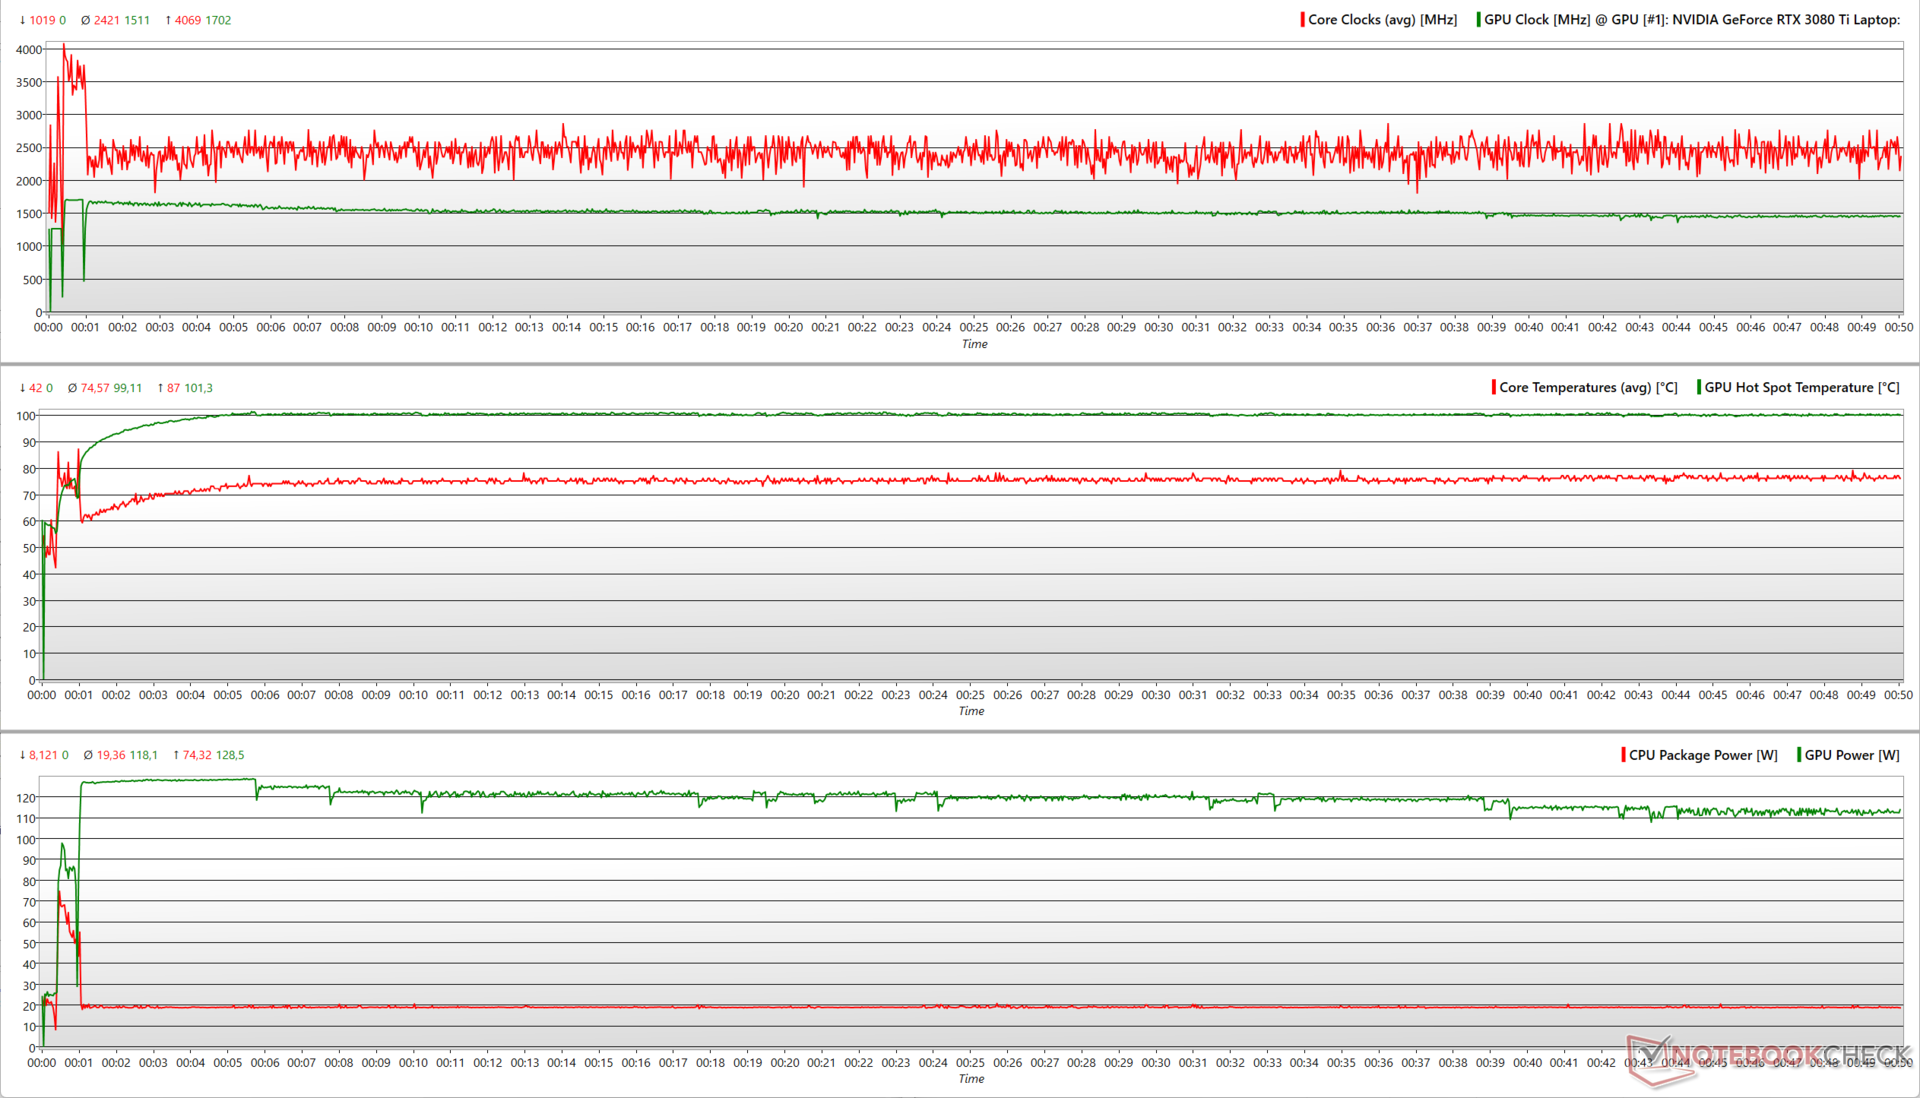
Stresstest
Stress tests van de Alienware x15 R2 vertellen ons hoe verschillende CPU en GPU parameters variëren onder verschillende belastingen
Met alleen Prime95 in-place FFT's bereikt de Core i9-12900H aanvankelijk een piekklok in de buurt van 3,7 GHz, terwijl hij 131 W verbruikt. Vervolgens schommelen de klokken tussen 2,6 GHz en 3 GHz, wat overeenkomt met 75 W en 80 W PL1.
| Stresstest | CPU Klok (GHz) | GPU Klok (MHz) | Gemiddelde CPU Temperatuur (°C) | Gemiddelde GPU Temperatuur (°C) |
| Systeem Idle | 3.2 | - | 40 | - - |
| Prime95 | 2.69 | - | 95 | 57.2 |
| Prime95 + FurMark | 1.83 | 1.275 | 79 | 76 |
| De Witcher 3 | 3.35 | 1.672 | 74 | 83 |
Als we FurMark aan de mix toevoegen, zien we dat de Core i9-12900H in staat is 130 W te halen, maar snel daalt naar 60 W en vervolgens geleidelijk naar 30 W. Dit is om de 120 W stroombehoefte van de RTX 3080 Ti, die af en toe pieken tot 150 W vertoont, op te vangen
Het belasten met De Witcher 3 presenteert een meer realistisch scenario, en we vinden CPU-klokken die pieken op 4 GHz en zich al snel vestigen rond de 2,5 GHz, terwijl de RTX 3080 Ti daalt van een aanvankelijke hoogte van 1.702 MHz en zich stabiliseert rond de 1.500 MHz. De RTX 3080 Ti verbruikt aanvankelijk bijna 130 W, maar daalt al snel naar 120 W. De Core i9-12900H daalt tijdens de run van ongeveer 75 W naar 20 W.
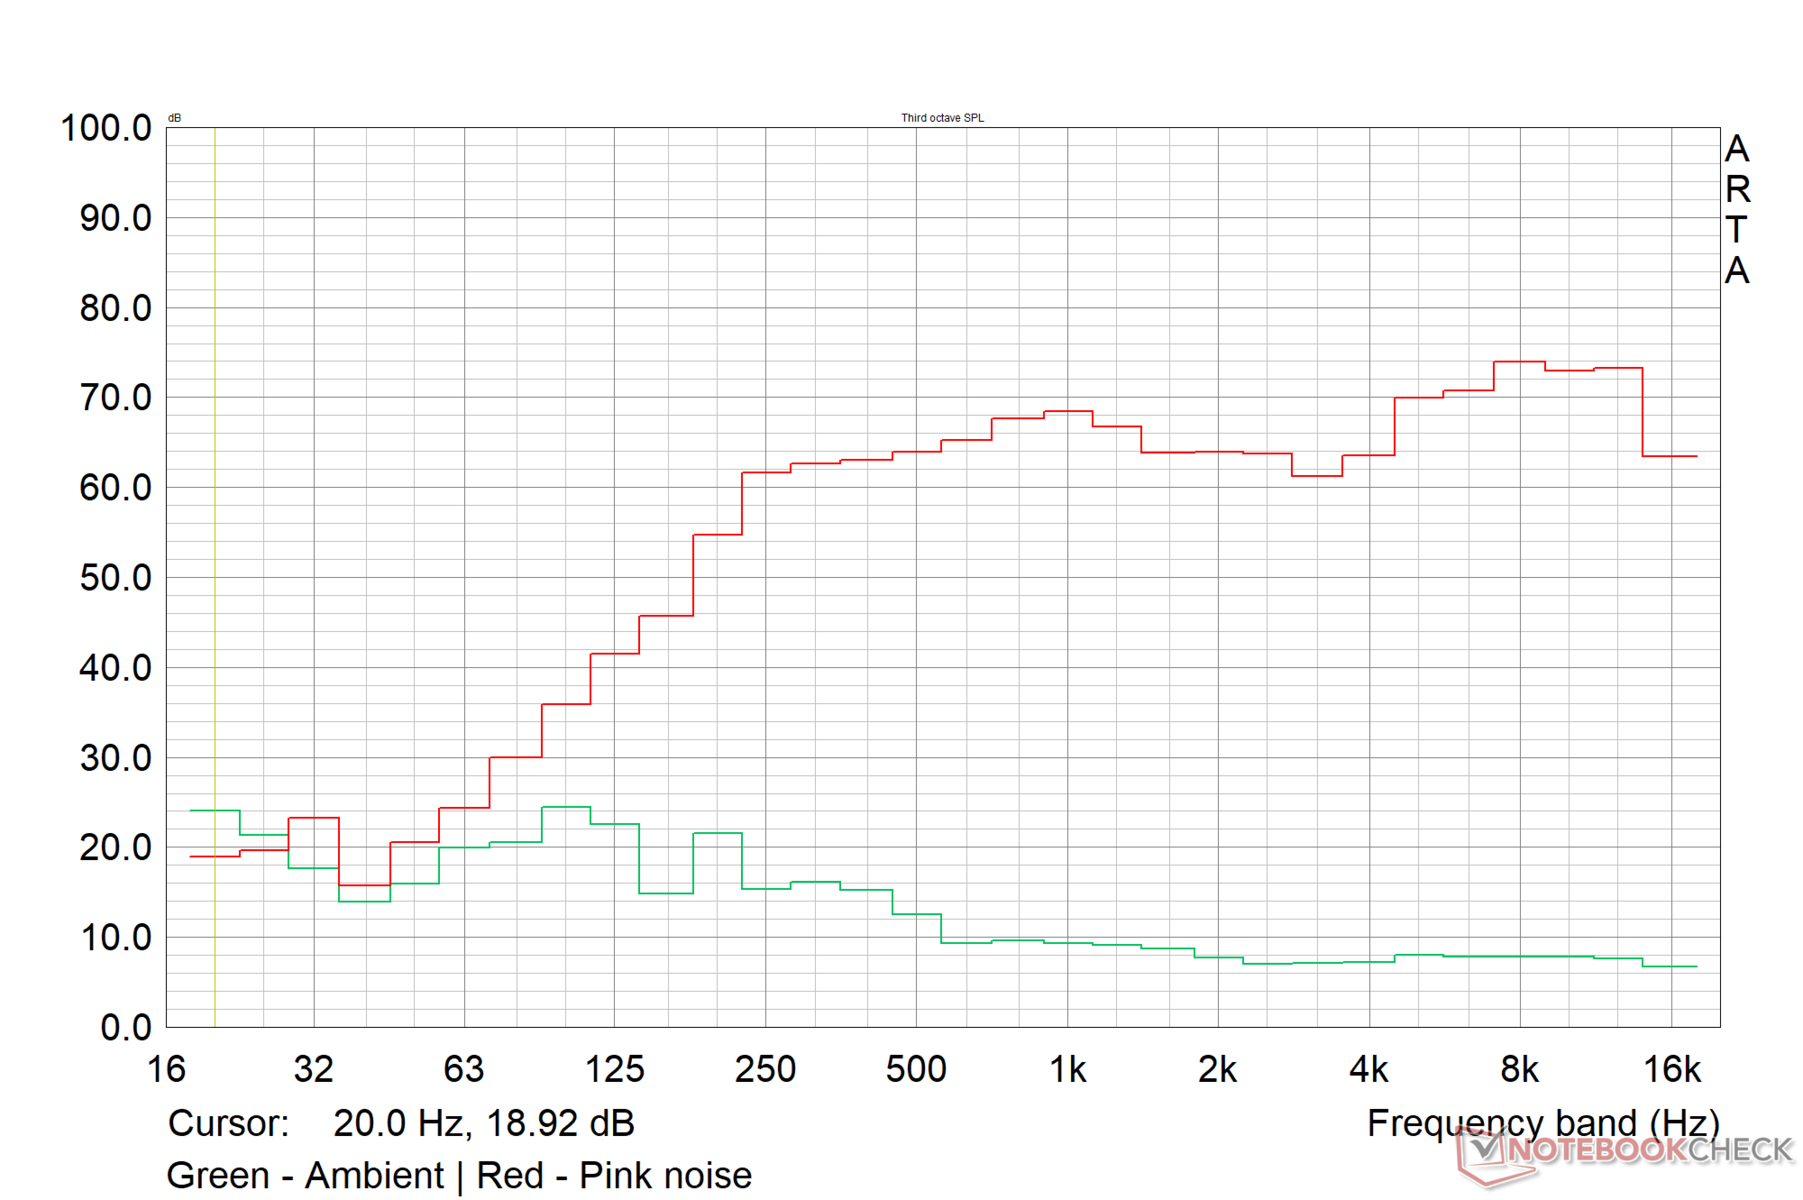
Luidsprekers
Voor een dun chassis is de onboard audio van de Alienware x15 R2 heel behoorlijk. De 2x 2 W luidsprekers produceren 80,2 db(A) luidheid, wat waarneembaar zou moeten zijn in een kamer van gemiddelde grootte. Alle Alienware 2022 lanceringen zijn Dolby Atmos-gecertificeerd.
De basweergave is strikt in orde, maar de midden- en hoge tonen zijn duidelijker gedefinieerd. Er is geen waarneembare vervorming bij hogere volumes. Subjectief gezien kan de onboard audio de klus klaren voor het meeste reguliere werk.
Gamers kunnen een beter paar cans aansluiten via Bluetooth 5.2 of de 3,5 mm combo audio-aansluiting.
Alienware x15 R2 P111F audioanalyse
(±) | luidspreker luidheid is gemiddeld maar goed (80.2 dB)
Bas 100 - 315 Hz
(±) | verminderde zeebaars - gemiddeld 13.5% lager dan de mediaan
(±) | lineariteit van de lage tonen is gemiddeld (9.9% delta ten opzichte van de vorige frequentie)
Midden 400 - 2000 Hz
(+) | evenwichtige middens - slechts 1.7% verwijderd van de mediaan
(+) | de middentonen zijn lineair (2.4% delta ten opzichte van de vorige frequentie)
Hoog 2 - 16 kHz
(±) | higher highs - on average 5% higher than median
(+) | de hoge tonen zijn lineair (4.3% delta naar de vorige frequentie)
Algemeen 100 - 16.000 Hz
(+) | het totale geluid is lineair (12.6% verschil met de mediaan)
Vergeleken met dezelfde klasse
» 16% van alle geteste apparaten in deze klasse waren beter, 4% vergelijkbaar, 81% slechter
» De beste had een delta van 6%, het gemiddelde was 18%, de slechtste was 132%
Vergeleken met alle geteste toestellen
» 11% van alle geteste apparaten waren beter, 3% gelijk, 86% slechter
» De beste had een delta van 4%, het gemiddelde was 23%, de slechtste was 134%
Apple MacBook Pro 16 2021 M1 Pro audioanalyse
(+) | luidsprekers kunnen relatief luid spelen (84.7 dB)
Bas 100 - 315 Hz
(+) | goede baars - slechts 3.8% verwijderd van de mediaan
(+) | de lage tonen zijn lineair (5.2% delta naar de vorige frequentie)
Midden 400 - 2000 Hz
(+) | evenwichtige middens - slechts 1.3% verwijderd van de mediaan
(+) | de middentonen zijn lineair (2.1% delta ten opzichte van de vorige frequentie)
Hoog 2 - 16 kHz
(+) | evenwichtige hoogtepunten - slechts 1.9% verwijderd van de mediaan
(+) | de hoge tonen zijn lineair (2.7% delta naar de vorige frequentie)
Algemeen 100 - 16.000 Hz
(+) | het totale geluid is lineair (4.6% verschil met de mediaan)
Vergeleken met dezelfde klasse
» 0% van alle geteste apparaten in deze klasse waren beter, 0% vergelijkbaar, 100% slechter
» De beste had een delta van 5%, het gemiddelde was 17%, de slechtste was 45%
Vergeleken met alle geteste toestellen
» 0% van alle geteste apparaten waren beter, 0% gelijk, 100% slechter
» De beste had een delta van 4%, het gemiddelde was 23%, de slechtste was 134%
Energiebeheer: Zuinig bij maximale belasting
Stroomverbruik
De meegeleverde 240 W voedingsadapter is voldoende om de 15 R2 bij verschillende werklasten van stroom te voorzien. Het stroomverbruik is aan de hoge kant, maar ligt in de lijn der verwachting gezien de internals. We merken op dat het stroomverbruik bij maximale belasting kan oplopen tot bijna 242 W, voordat het in de buurt van de 180 W komt
Niettemin is het stroomverbruik van de x15 R2 nog steeds zuinig in vergelijking met de concurrentie, vooral bij maximale belasting. De Razer Blade 15 Advanced heeft een lagere energiebehoefte over het geheel genomen, waarschijnlijk dankzij de 110 W RTX 3080 Ti.
| Uit / Standby | |
| Inactief | |
| Belasting |
|
Key:
min: | |
| Alienware x15 R2 P111F i9-12900H, GeForce RTX 3080 Ti Laptop GPU, IPS, 1920x1080 | Asus ROG Strix Scar 15 G533ZW-LN106WS i9-12900H, GeForce RTX 3070 Ti Laptop GPU, IPS-level, 2560x1440 | Asus ROG Zephyrus Duo 16 GX650RX R9 6900HX, GeForce RTX 3080 Ti Laptop GPU, IPS-Level, 3840x2400 | MSI Vector GP66 12UGS i9-12900H, GeForce RTX 3070 Ti Laptop GPU, IPS, 1920x1080 | Razer Blade 15 Advanced Model Early 2022 i7-12800H, GeForce RTX 3080 Ti Laptop GPU, IPS, 1920x1080 | Gemiddeld NVIDIA GeForce RTX 3080 Ti Laptop GPU | Gemiddelde van klas Gaming | |
|---|---|---|---|---|---|---|---|
| Power Consumption | 15% | -11% | -24% | 8% | -16% | 2% | |
| Idle Minimum * (Watt) | 16.2 | 7.56 53% | 19 -17% | 17.5 -8% | 17 -5% | 17.2 ? -6% | 13 ? 20% |
| Idle Average * (Watt) | 20 | 13.5 32% | 24 -20% | 20.1 -1% | 19 5% | 23.3 ? -17% | 19 ? 5% |
| Idle Maximum * (Watt) | 21.2 | 16.87 20% | 31 -46% | 47.3 -123% | 25 -18% | 30.8 ? -45% | 24.6 ? -16% |
| Load Average * (Watt) | 122.1 | 128.9 -6% | 104 15% | 107.3 12% | 108 12% | 121.2 ? 1% | 110.7 ? 9% |
| Witcher 3 ultra * (Watt) | 207 | 196.2 5% | 186.5 10% | 225 -9% | 150 28% | ||
| Load Maximum * (Watt) | 241.9 | 274.86 -14% | 256 -6% | 277.7 -15% | 179 26% | 276 ? -14% | 259 ? -7% |
* ... kleiner is beter
Power Consumption - The Witcher 3 / Stress test
Power Consumption - External monitor
Levensduur van de batterij
We hebben ons gestandaardiseerde script voor webpagina's gebruikt om de batterijlevensduur te beoordelen bij zowel volledige helderheid als 150 cd/m2 instellingen. De batterijduurtests werden uitgevoerd in de MSHybrid-modus bij een schermverversing van 60 Hz.
De 87 WHr batterij van de x15 R2 kon iets meer dan zes uur meegaan bij 150 cd/m2. Vergelijkbare looptijden werden ook waargenomen bij volledige helderheid. In de dGPU-modus konden we slechts 3 uur en 36 minuten batterijduur realiseren bij 150 cd/m2 helderheid.
| Alienware x15 R2 P111F i9-12900H, GeForce RTX 3080 Ti Laptop GPU, 87 Wh | Alienware x15 RTX 3070 P111F i7-11800H, GeForce RTX 3070 Laptop GPU, 87 Wh | Asus ROG Strix Scar 15 G533ZW-LN106WS i9-12900H, GeForce RTX 3070 Ti Laptop GPU, 90 Wh | Asus ROG Zephyrus Duo 16 GX650RX R9 6900HX, GeForce RTX 3080 Ti Laptop GPU, 90 Wh | Razer Blade 15 Advanced Model Early 2022 i7-12800H, GeForce RTX 3080 Ti Laptop GPU, 80 Wh | Gemiddelde van klas Gaming | |
|---|---|---|---|---|---|---|
| Batterijduur | 2% | 40% | 30% | -18% | 19% | |
| WiFi v1.3 (h) | 6 | 6.1 2% | 8.4 40% | 7.8 30% | 4.9 -18% | 7.11 ? 19% |
| Reader / Idle (h) | 9.7 | 12.5 | 8.1 | 8.27 ? | ||
| Load (h) | 0.9 | 0.9 | 1 | 2 | 1.502 ? | |
| H.264 (h) | 8.5 | 9.3 | 5.9 | 8.32 ? | ||
| Witcher 3 ultra (h) | 1.2 |
Pro
Contra
Verdict: Deze alien voldoet aan de meeste eisen
De Alienware x15 R2 is een evolutie van de x15 R1 van vorig jaar en brengt geen revolutionaire veranderingen op tafel. Er zijn een aantal standaard functies in alle Alienware configuraties van dit jaar, zoals Dolby Vision en Dolby Atmos certificeringen, Element 31 TIM, en Advanced Optimus om er een paar te noemen
Het ultrabook-achtige chassis komt duidelijk over als Alienware met alle relevante insignes. Poort plaatsing is niet de meest ideale, maar de essentie is gedekt. Webcam kwaliteit blijft een bijzaak. Het toetsenbord biedt goede tactiele feedback, maar secundaire functies blijven onverlicht.
Beeldschermkwaliteit is goed voor zijn primaire toepassing als gaming laptop. De meeste kopers zouden echter willen kiezen voor de QHD variant gezien de krachtige internals. Er is geen PWM, en de reactietijden zijn goed wanneer overdrive is ingeschakeld op 360 Hz.
De Alienware x15 R2 zou hoog op uw lijst van verdiensten moeten staan als u op zoek bent naar een gaming laptop die effectief een ultrabook-achtige vormfactor met top-of-the-line moderne hardware combineert, zolang de hogere warmte- en geluidsemissies geen ernstige zorgen zijn."
Ondanks het dunne chassis heeft Dell goed werk geleverd met de thermiek om ervoor te zorgen dat er geen significante throttling is onder belasting. Andere concurrenten zoals de MSI Vector GP66 en de Asus ROG Strix Scar 15 met de Core i9-12900H hebben iets hogere scores, maar de x15 R2 houdt goed stand. De prestatieverhoging ten opzichte van de x15 R1 is vrij aanzienlijk
Misschien wel het grootste probleem met de Alienware x15 R2 is zijn hoge warmte- en geluidsemissie. Hoewel het geluidsniveau van de ventilator tot op zekere hoogte kan worden beheerst door het juiste thermische profiel te kiezen, lijken de oppervlaktetemperaturen zeker aan de hogere kant. Stroomverbruik en batterijduur zijn op verwachte lijnen voor deze configuratie, hoewel de Scar 15 en de Razer Blade 15 Advanced zuinigere energievreters zijn
De Alienware x15 R2 biedt een unieke combinatie van esthetiek en topprestaties waar veel andere laptops naar streven. Met een prijs van ₹3.68.190 (~US$4.500 of €4.583) is de Alienware x15 R2 echter niet concurrerend geprijsd op de Indiase markt, vooral wanneer er opties zoals de Asus ROG Strix Scar 15 G533 bestaan.
Prijs en beschikbaarheid
De geteste Alienware x15 R2 configuratie is beschikbaar voor ~US$4,137 op Amazon India, Amazon US, en Dell.com. Een Core i7-12700H en RTX 3070 Ti-aangedreven variant van de x15 R2 is beschikbaar op Best Buy voor US$2,700.
Alienware x15 R2 P111F
- 04-10-2022 v7 (old)
Vaidyanathan Subramaniam
Price comparison

