Alienware x17 R2 laptop review: Piek 175 W GeForce RTX 3080 Ti prestaties
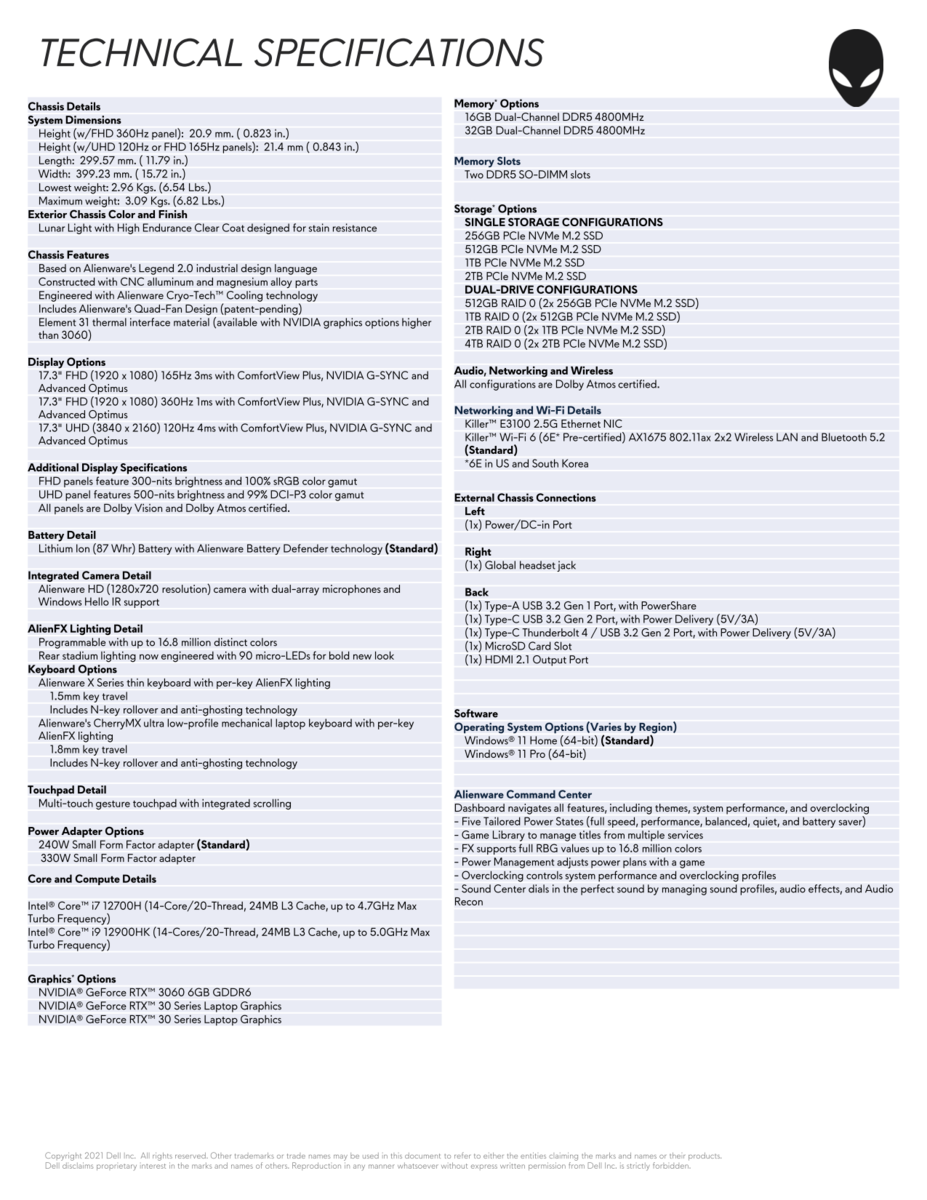
Dell introduceerde zijn Alienware x17-serie eind vorig jaar met een volledig nieuw chassisontwerp om hem te onderscheiden van de bestaande Alienware m17-serie. Voor dit jaar heeft de fabrikant de line-up opgefrist met de lancering van de Alienware x17 R2, compleet met 12e generatie Intel Alder Lake-P CPU's en GeForce RTX 3070/3080 Ti graphics ter vervanging van de 11e generatie Tiger Lake-H en RTX 3070/3080 opties van vorig jaar, respectievelijk. Andere updates zijn ook aanwezig, waaronder het snellere RAM (DDR4-3466 naar DDR5-4800), nieuwere schermopties, en ondersteuning voor MUX en Advanced Optimus.
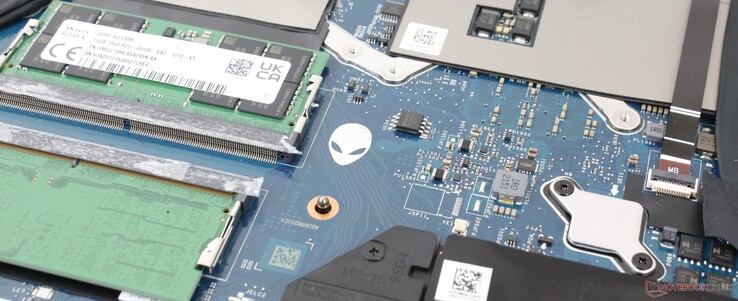
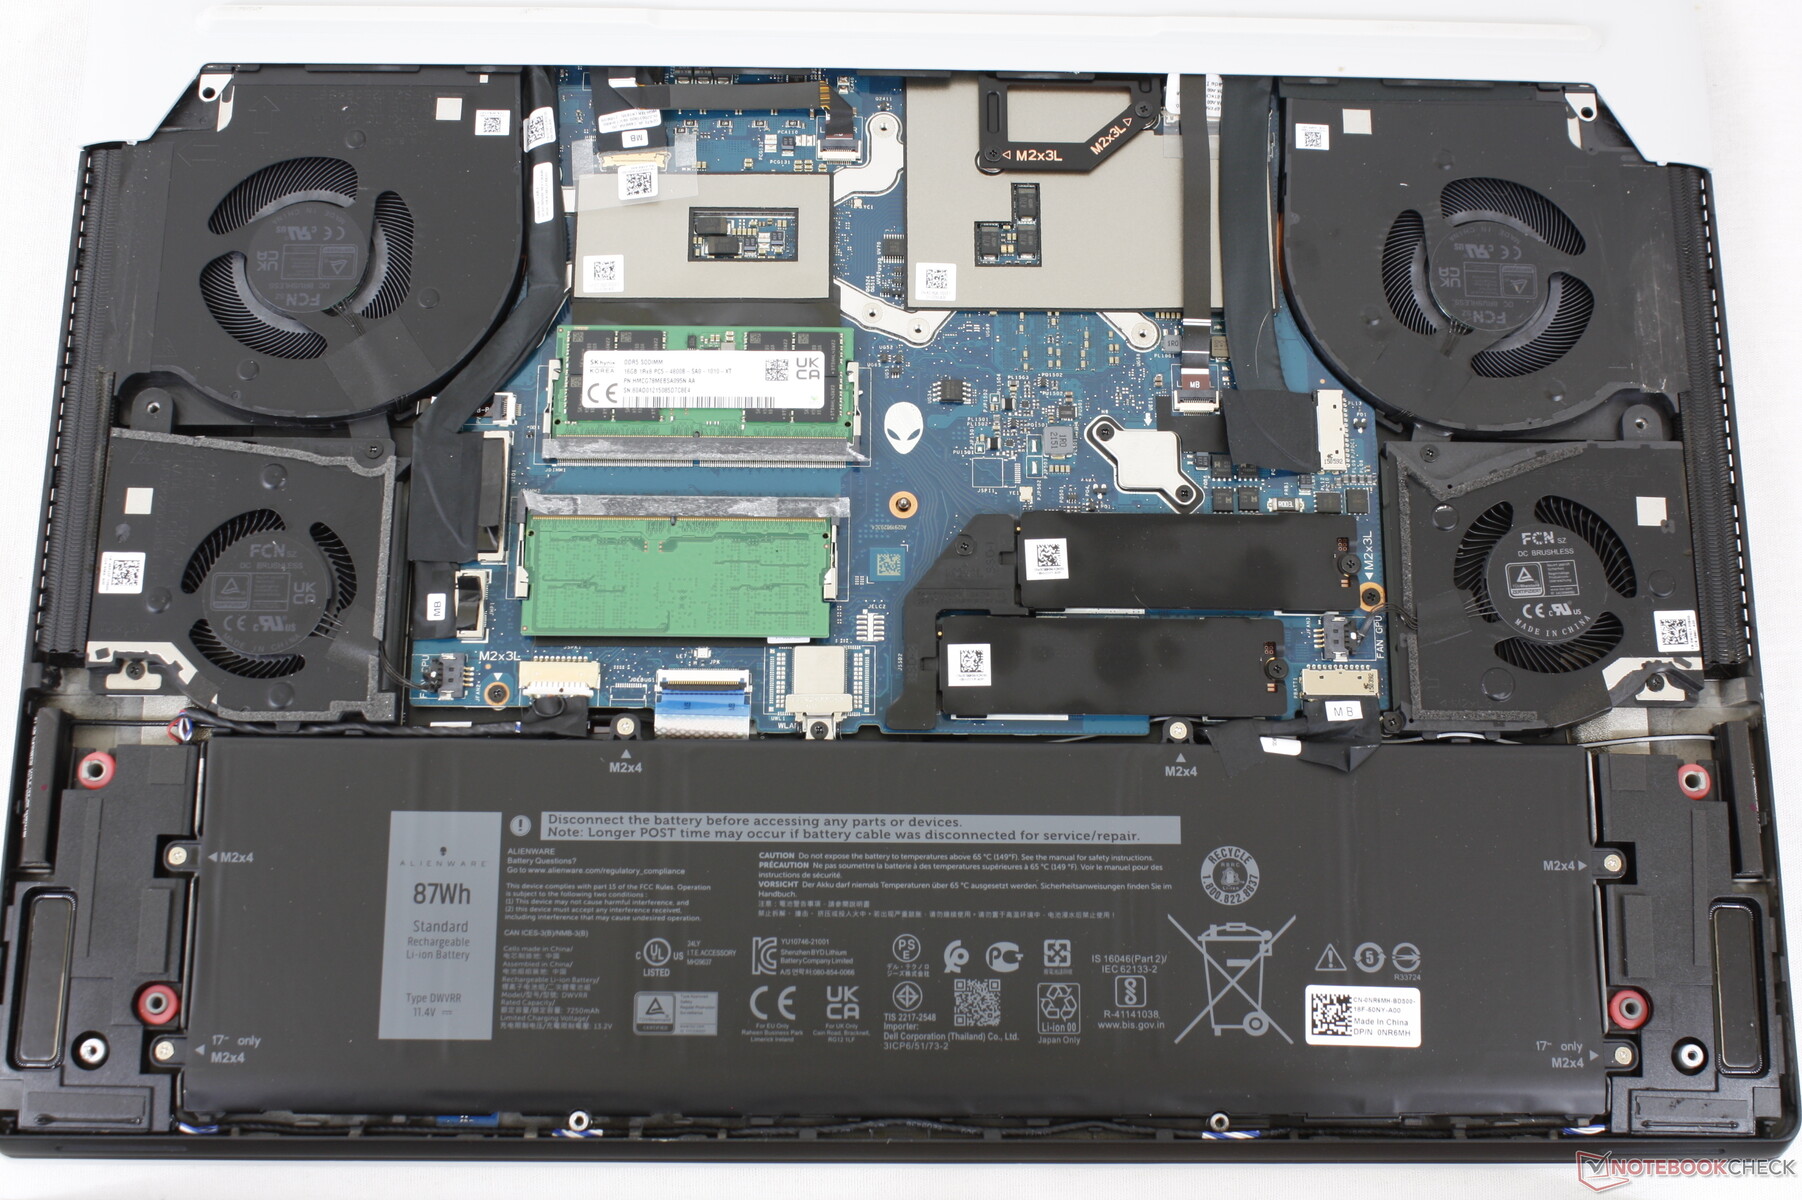
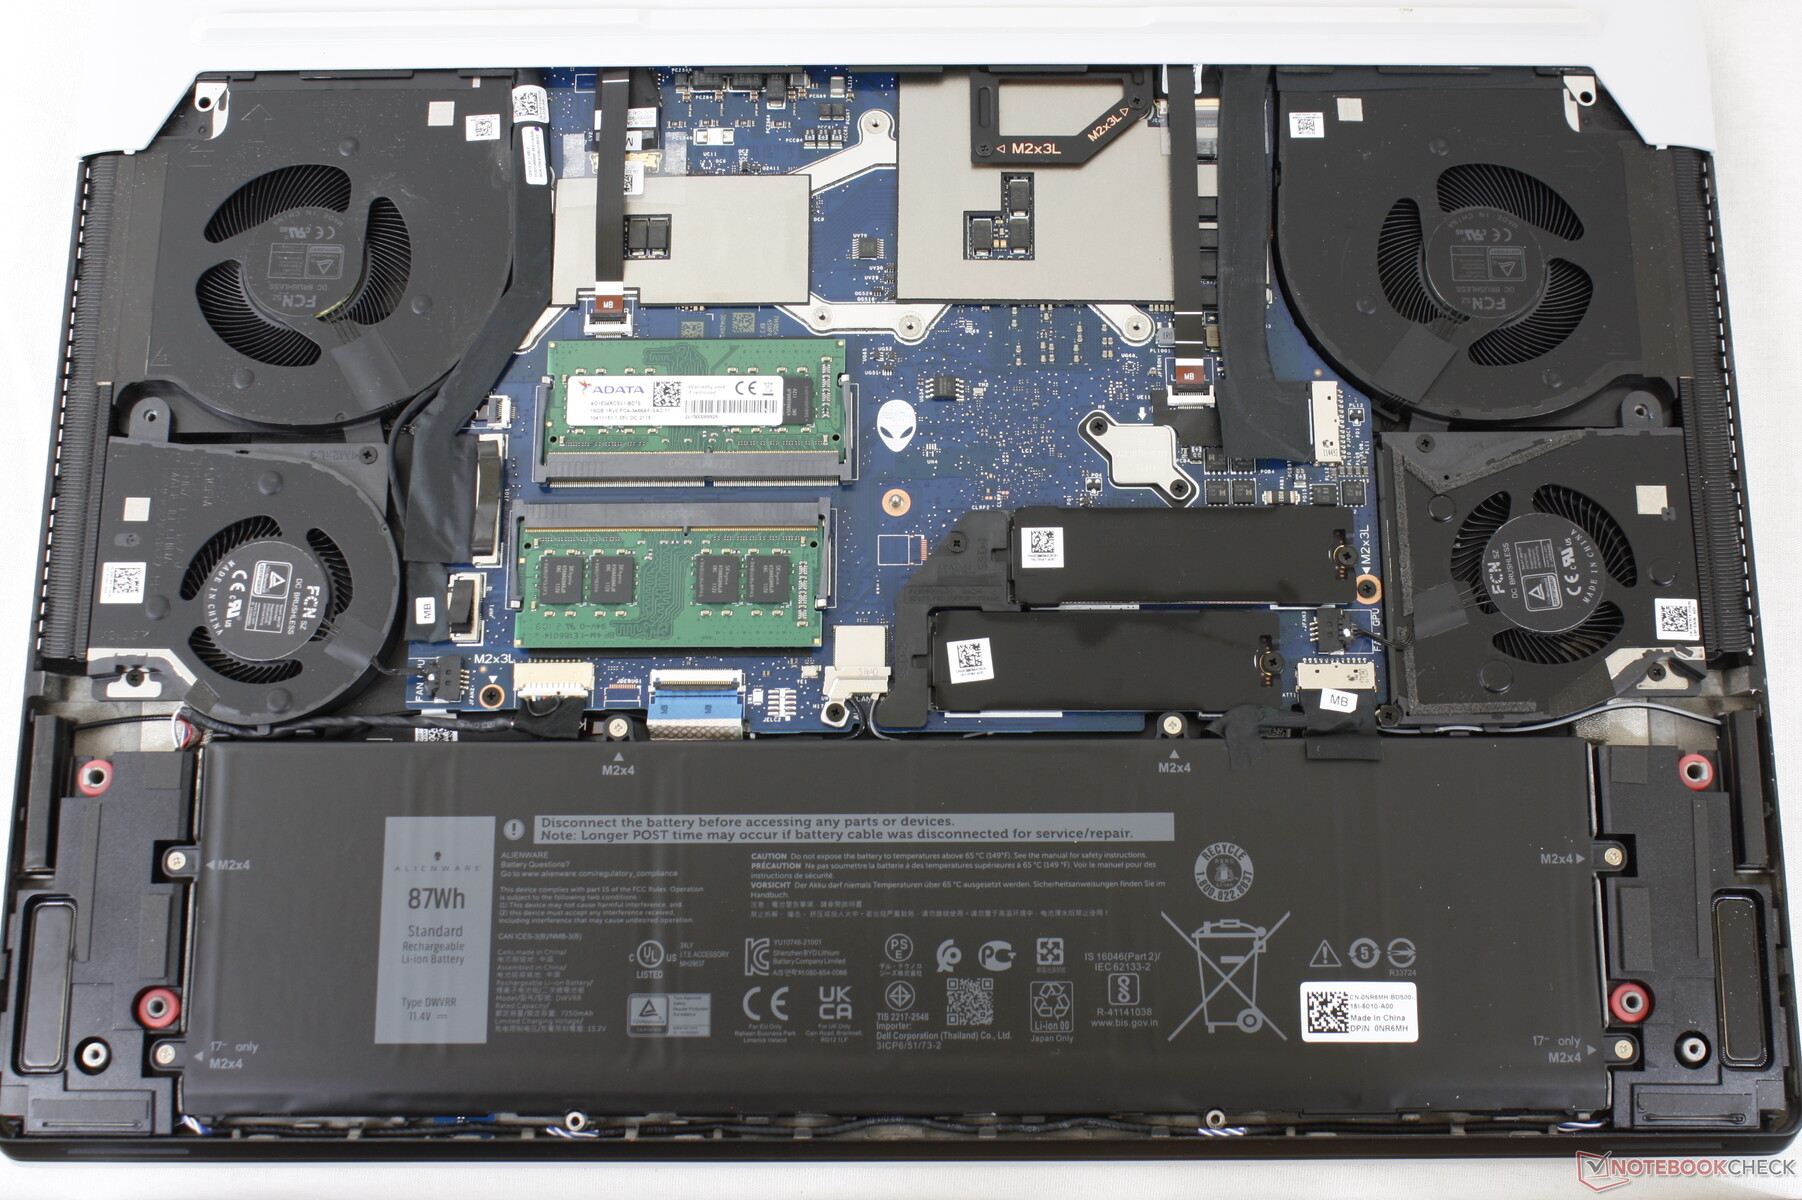
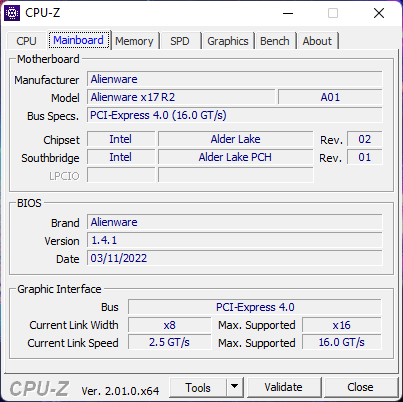
Afgezien van de bovengenoemde interne updates, maakt de Alienware x17 R2 gebruik van hetzelfde chassis als de Alienware x17 R1. We raden u aan onze review van de x17 R1 aangezien onze bestaande opmerkingen over het chassis, Cherry mechanisch toetsenbord, en poorten ook relevant zijn voor de x17 R2.
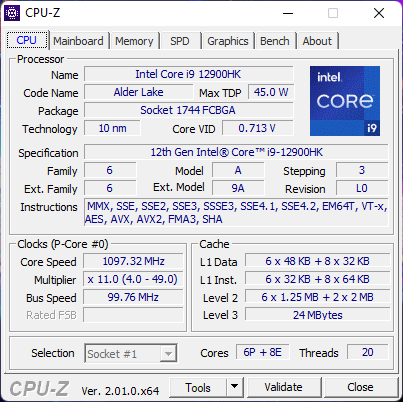
Zie de officiële technische specificaties hieronder voor alle configureerbare opties. Onze specifieke testeenheid is een high-end SKU met de Core i9-12900HK, 360 Hz 1080p beeldscherm, en 175 W GeForce RTX 3080 Ti graphics voor iets minder dan $4000 USD. Concurrenten in deze ruimte zijn andere ultradunne 17,3-inch gaming laptops zoals de MSI GS77, Razer Blade 17, en Asus Zephyrus S17.
Meer Alienware reviews:
Potentiële concurrenten in vergelijking
Evaluatie | Datum | Model | Gewicht | Hoogte | Formaat | Resolutie | Beste prijs |
|---|---|---|---|---|---|---|---|
| 89.2 % v7 (old) | 05-2022 | Alienware x17 R2 P48E i9-12900HK, GeForce RTX 3080 Ti Laptop GPU | 3.1 kg | 20.9 mm | 17.30" | 1920x1080 | |
| 89 % v7 (old) | 09-2021 | Alienware x17 RTX 3080 P48E i7-11800H, GeForce RTX 3080 Laptop GPU | 3.2 kg | 21.4 mm | 17.30" | 3840x2160 | |
| 90.1 % v7 (old) | 07-2021 | Asus ROG Zephyrus S17 GX703HSD i9-11900H, GeForce RTX 3080 Laptop GPU | 2.8 kg | 19.9 mm | 17.30" | 2560x1440 | |
| 87.2 % v7 (old) | 04-2022 | MSI Stealth GS77 12UHS-083US i7-12700H, GeForce RTX 3080 Ti Laptop GPU | 2.9 kg | 20.8 mm | 17.30" | 2560x1440 | |
| 87.4 % v7 (old) | 10-2020 | MSI GT76 Titan DT 10SGS i9-10900K, GeForce RTX 2080 Super Mobile | 4.2 kg | 42 mm | 17.30" | 3840x2160 | |
| 83.2 % v7 (old) | 10-2021 | Gigabyte A7 X1 R9 5900HX, GeForce RTX 3070 Laptop GPU | 2.5 kg | 34 mm | 17.30" | 1920x1080 |
Zaak
Hoewel het op de markt wordt gebracht als een ultradunne gaminglaptop, is het Alienware x17 R2-chassis nog steeds merkbaar zwaarder en groter dan alternatieven zoals de Asus Zephyrus S17, MSI GS77, of Razer Blade 17. In ruil daarvoor kan het Alienware-systeem een krachtigere GPU van 175 W dragen, terwijl de meeste andere ultradunne gaminglaptops beperkt zijn tot 140 W of minder.
SD-kaartlezer
| SD Card Reader | |
| average JPG Copy Test (av. of 3 runs) | |
| MSI GT76 Titan DT 10SGS (Toshiba Exceria Pro M501 UHS-II) | |
| Asus ROG Zephyrus S17 GX703HSD | |
| Alienware x17 R2 P48E (AV Pro V60) | |
| Alienware x17 RTX 3080 P48E (AV Pro V60) | |
| MSI Stealth GS77 12UHS-083US (AV Pro V60) | |
| maximum AS SSD Seq Read Test (1GB) | |
| Asus ROG Zephyrus S17 GX703HSD | |
| Alienware x17 RTX 3080 P48E (AV Pro V60) | |
| Alienware x17 R2 P48E (AV Pro V60) | |
| MSI GT76 Titan DT 10SGS (Toshiba Exceria Pro M501 UHS-II) | |
| MSI Stealth GS77 12UHS-083US (AV Pro V60) | |
Communicatie
Webcam
De webcam blijft 720p zonder fysieke privacy shutter in vergelijking met 1080p op de nieuwste Razer Blade 17. Windows Hello wordt ondersteund.

")
")
Onderhoud
Weergave
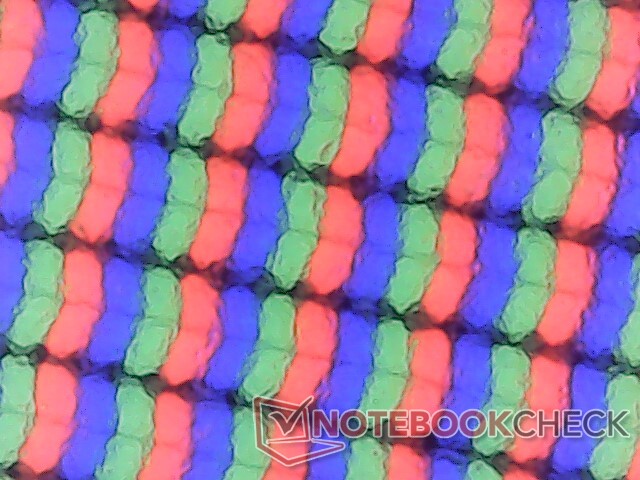
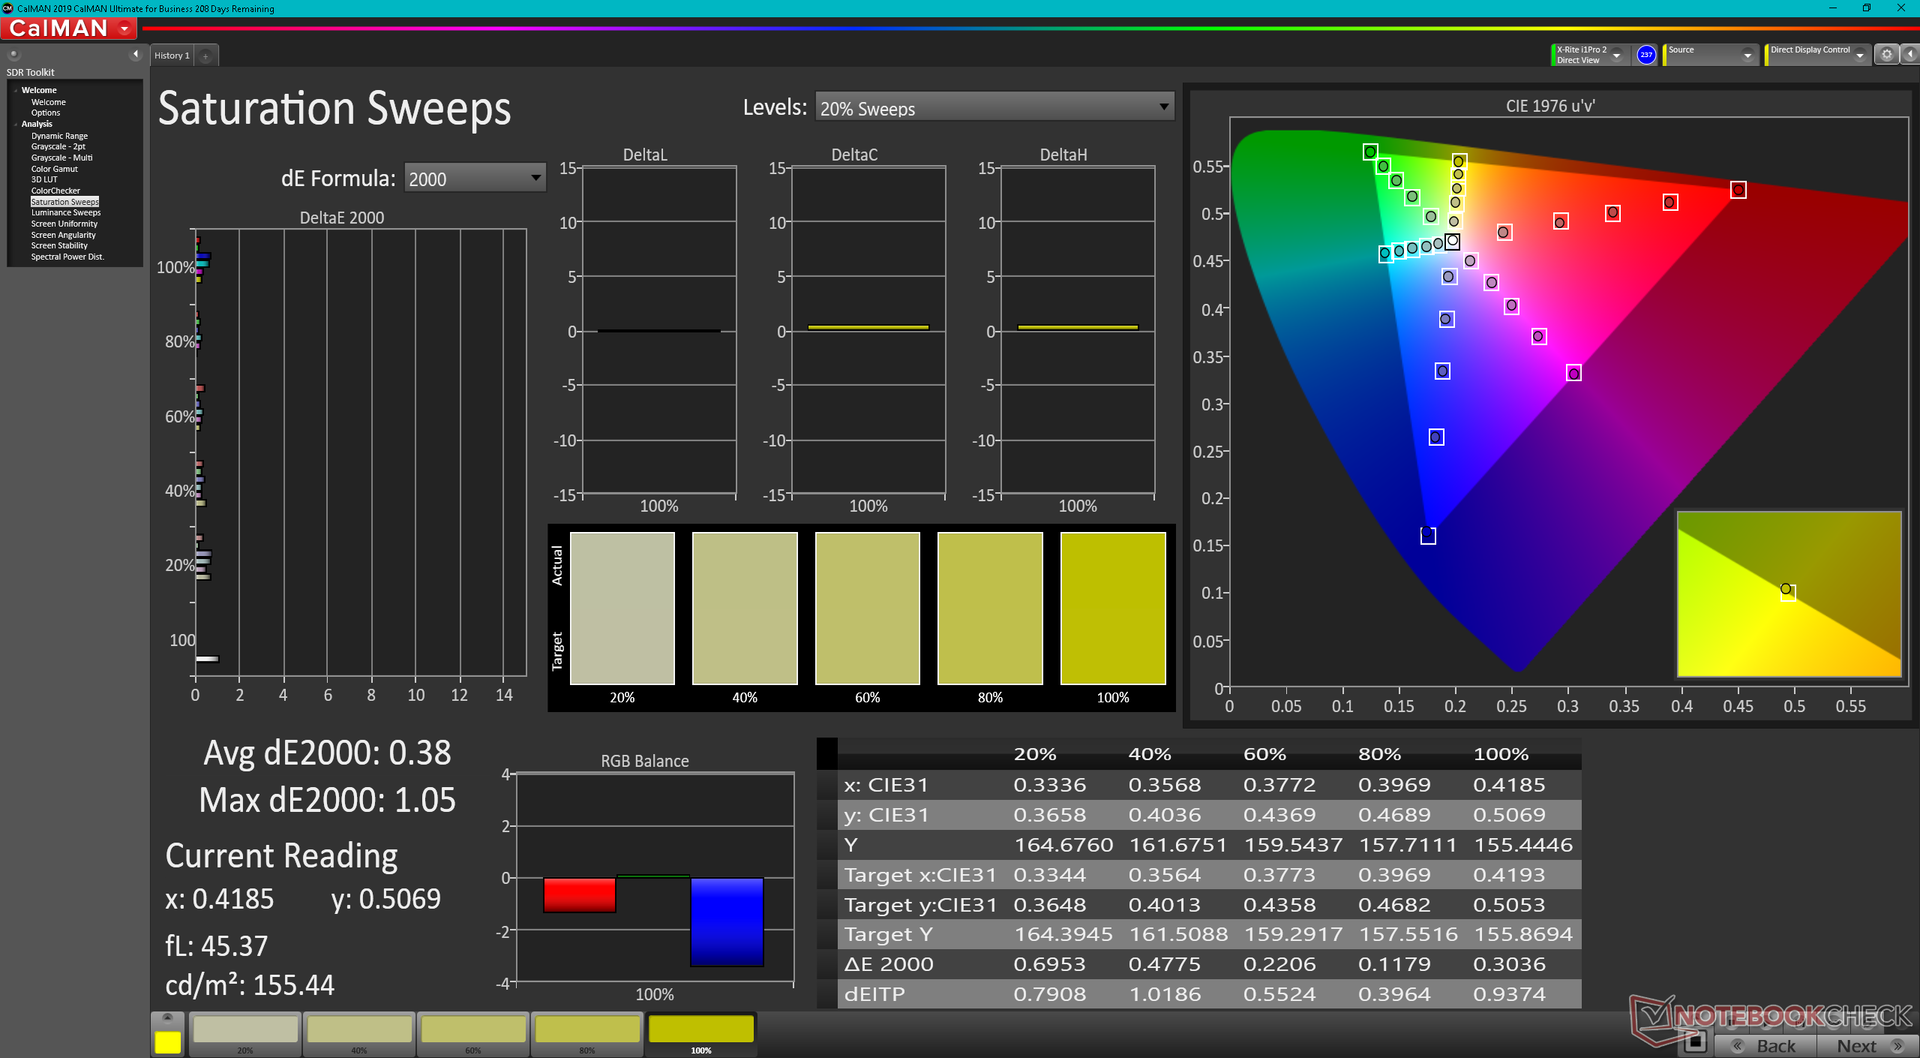
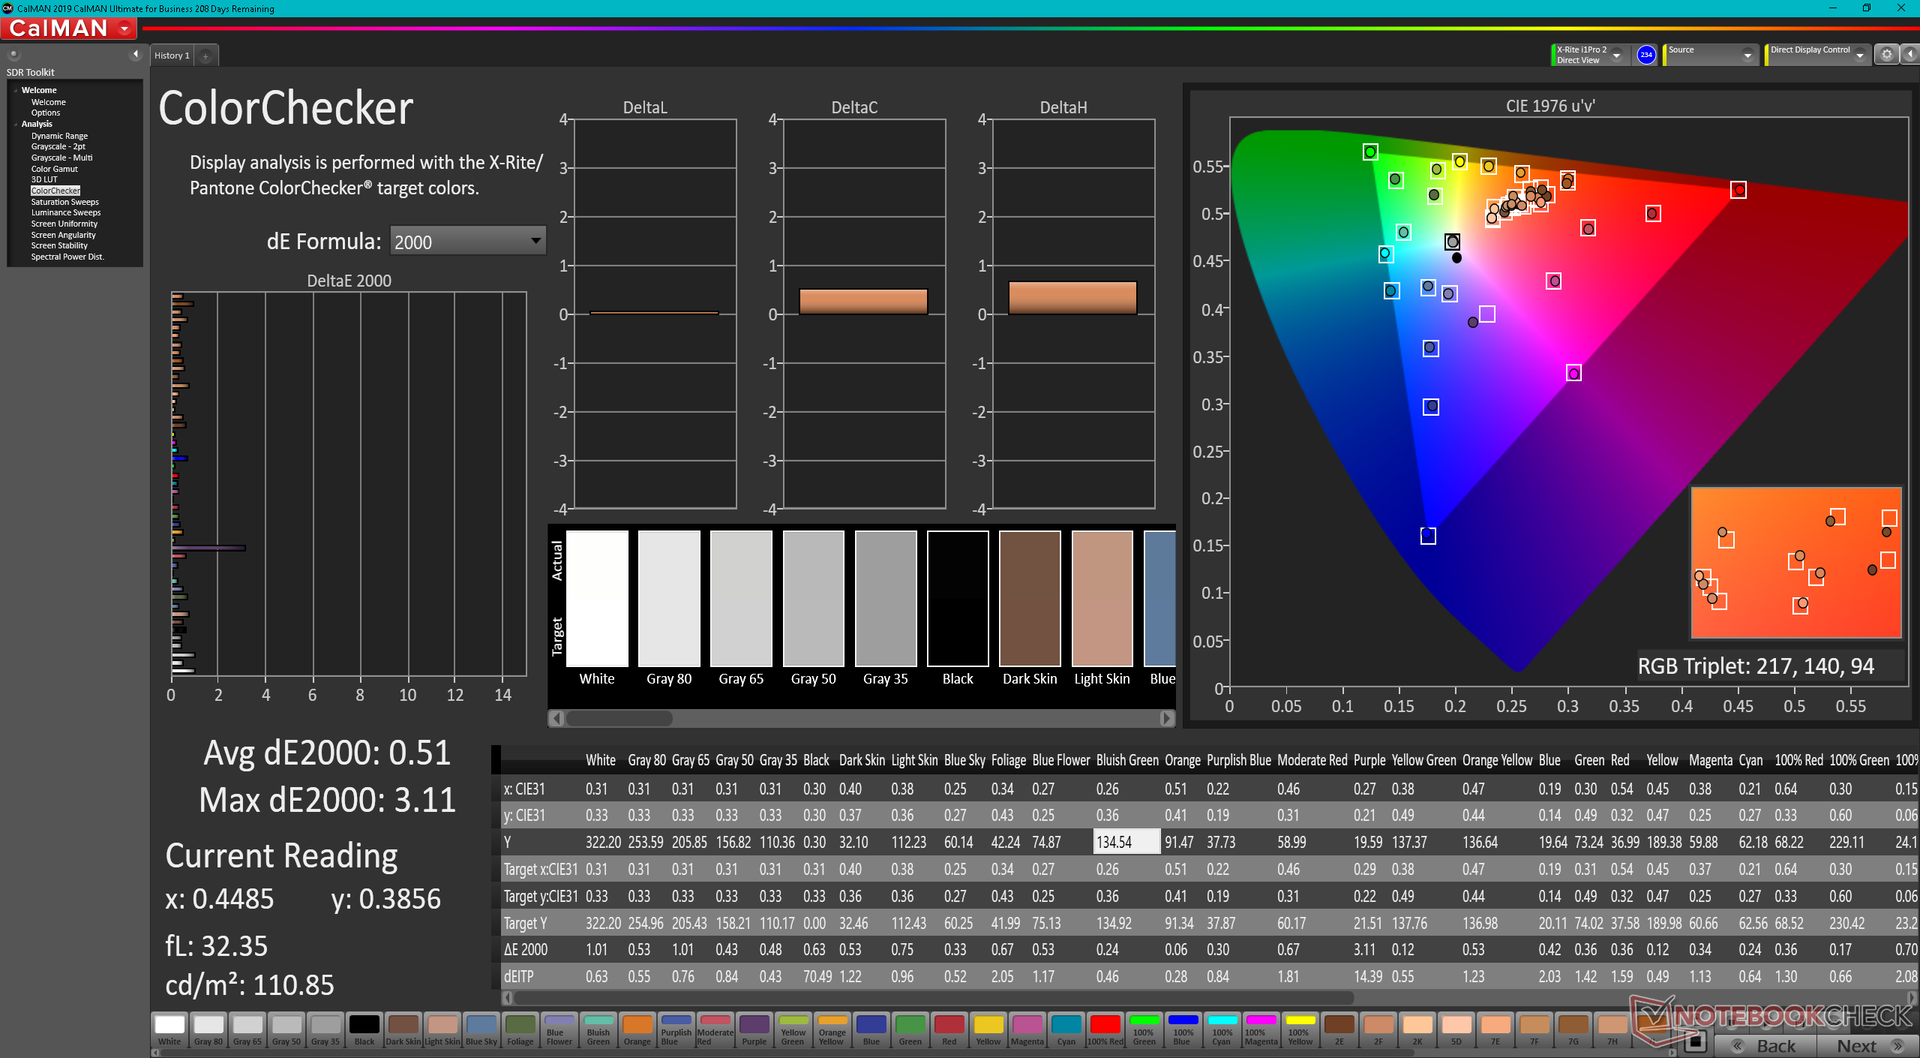
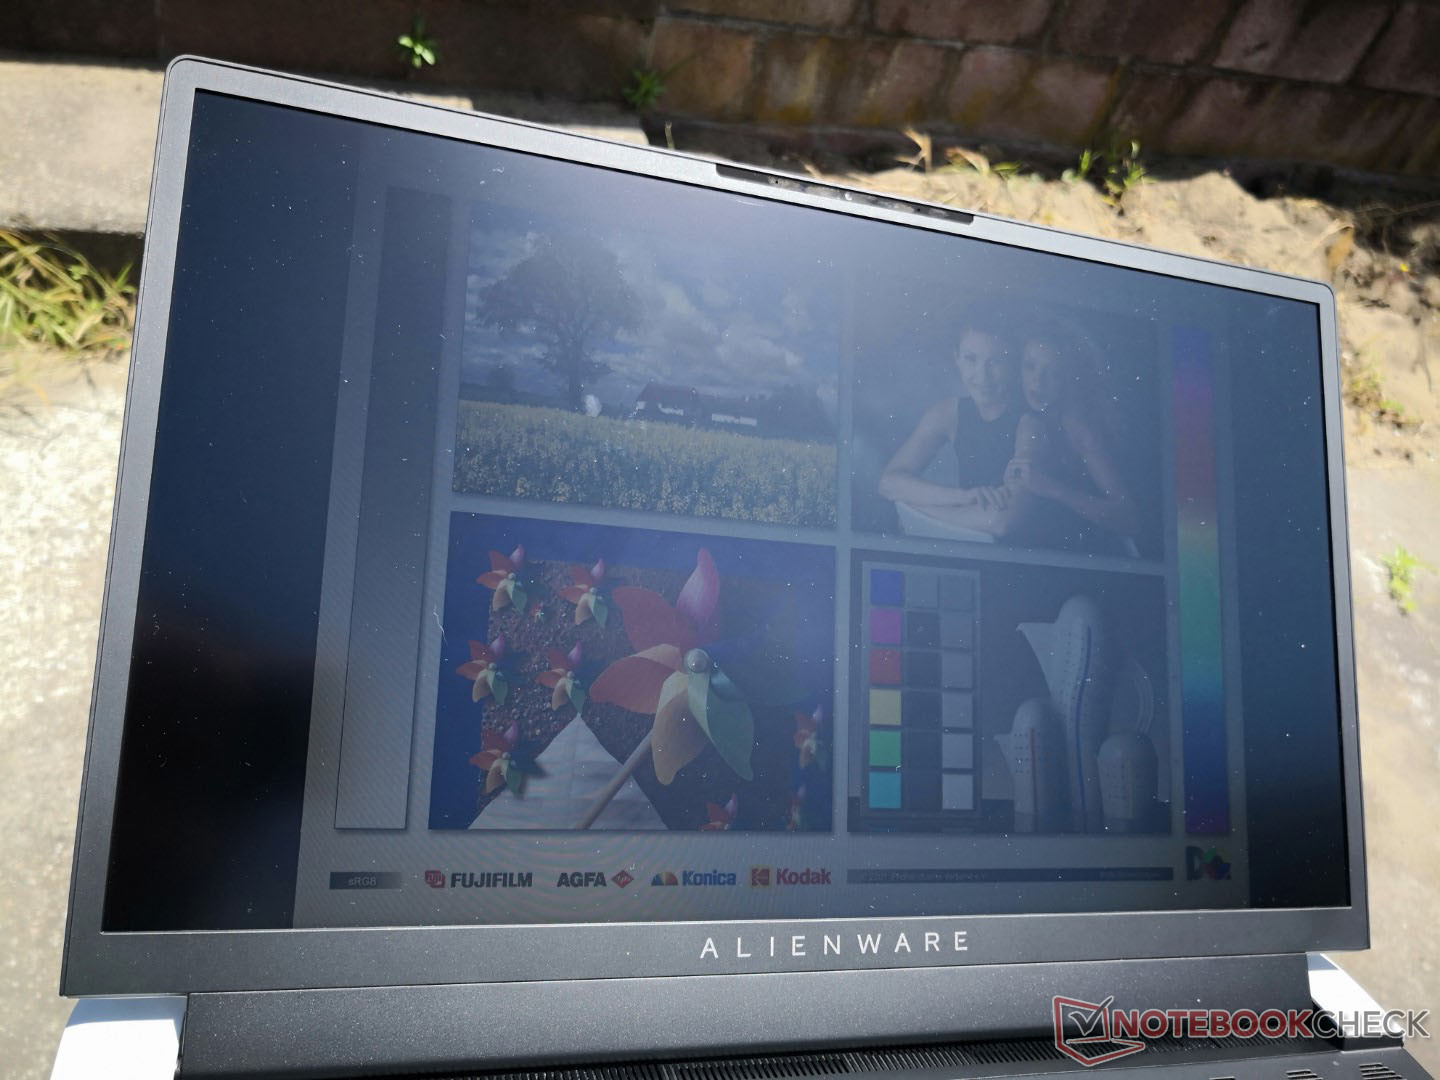
Ons AU Optronics B173HAN IPS-paneel voldoet aan bijna alle eisen, waaronder een snelle 360 Hz verversingssnelheid, snelle zwart-wit en grijs-grijs responstijden, en volledige sRGB-dekking om geschikt te zijn voor zowel gaming als de meeste grafische bewerkingen. Andere laptopfabrikanten met 17,3-inch 1080p 360 Hz beeldschermopties zullen waarschijnlijk hetzelfde AU Optronics paneel gebruiken als dat op onze Alienware. Een high-end 4K 120 Hz optie is ook beschikbaar, allemaal met G-Sync ondersteuning.
Er zijn momenteel geen OLED-opties, die een bredere DCI-P3 kleurdekking en diepere zwartniveaus zouden hebben geboden dan de gebruikelijke IPS-oplossing.
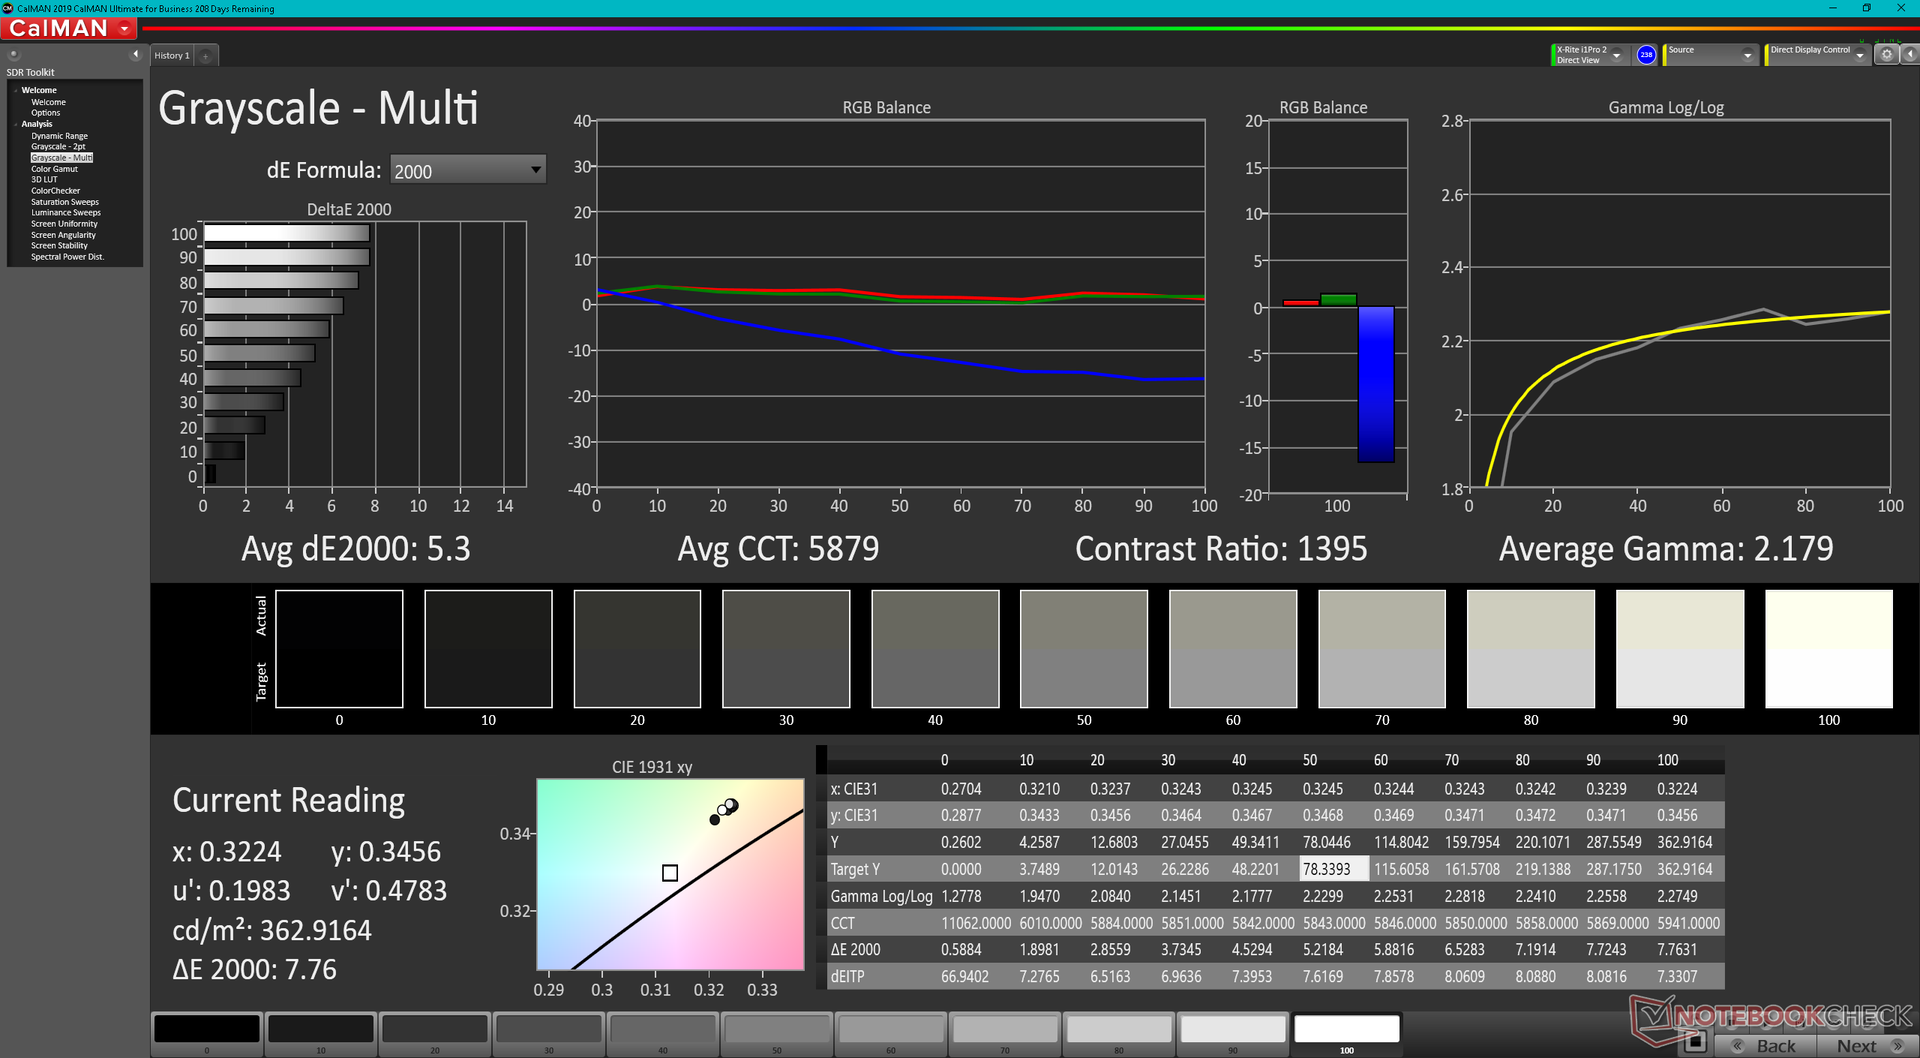
Interessant is dat ons FHD paneel niet zo helder is als het 4K UHD paneel op de originele x17 R1. We kunnen hier een maximale helderheid van 365 nits meten, vergeleken met 439 nits op de 4K x17 R1.
| |||||||||||||||||||||||||
Helderheidsverdeling: 85 %
Helderheid in Batterij-modus: 365.4 cd/m²
Contrast: 1260:1 (Zwart: 0.29 cd/m²)
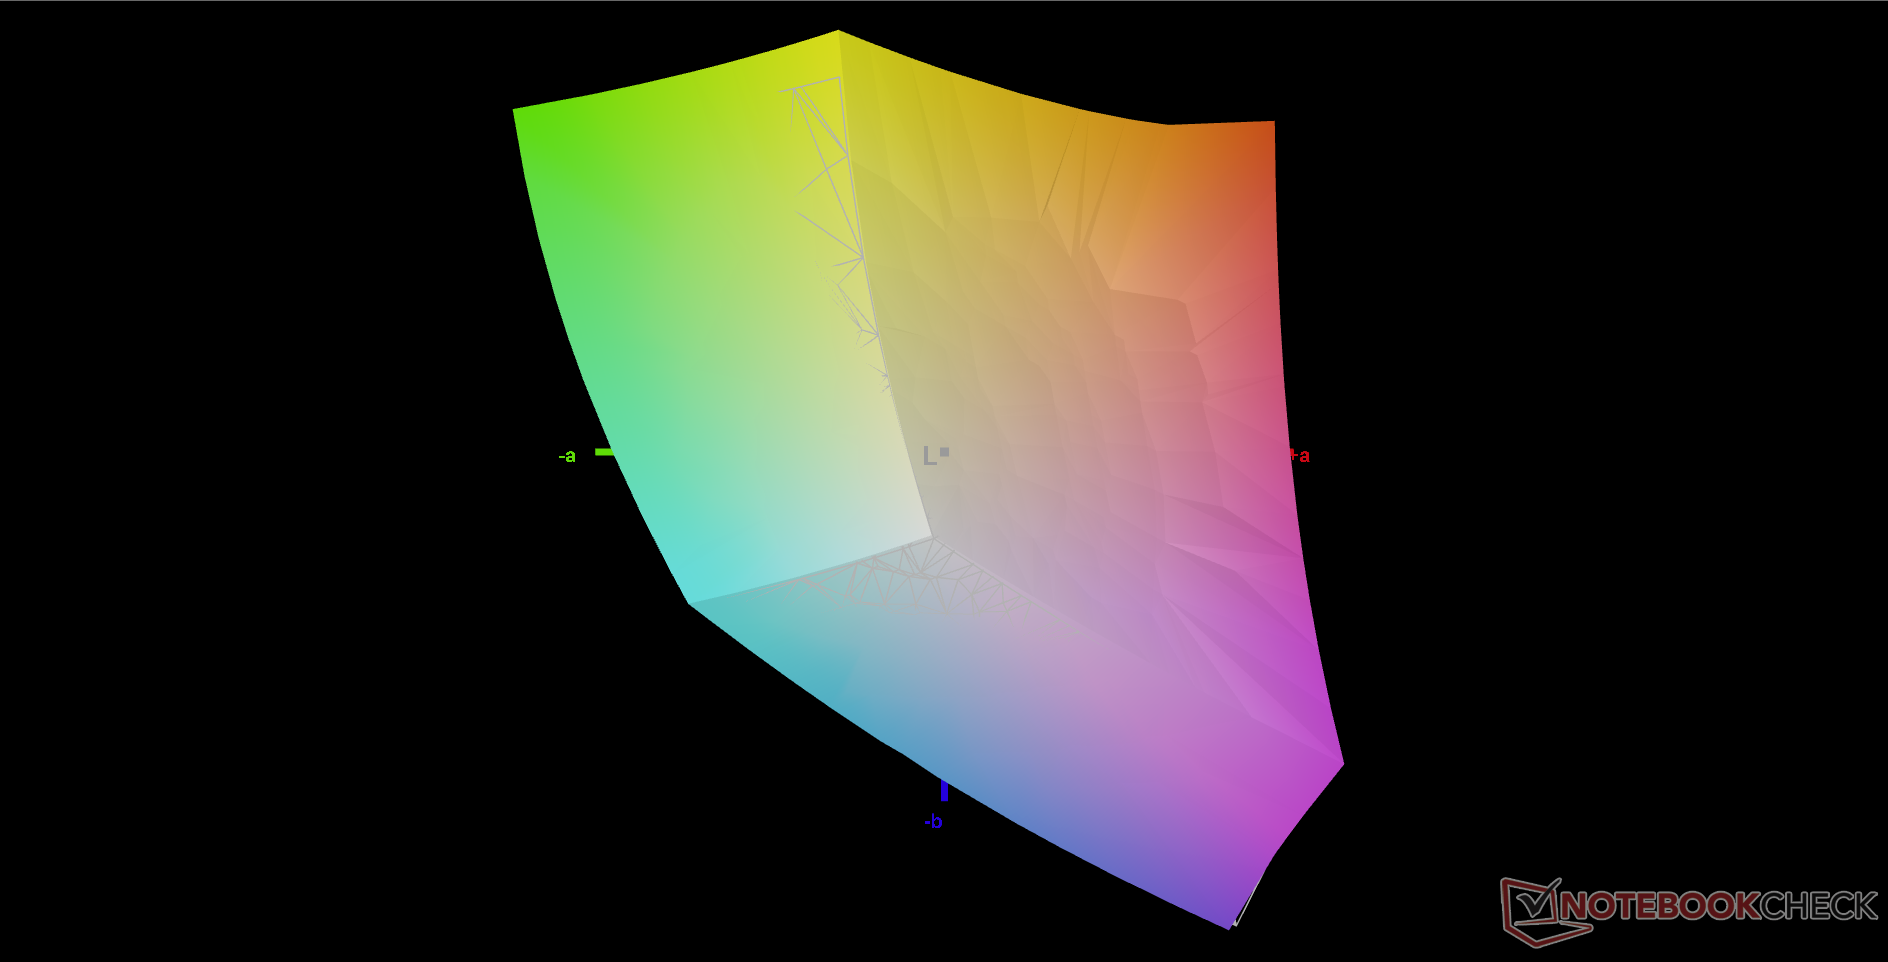
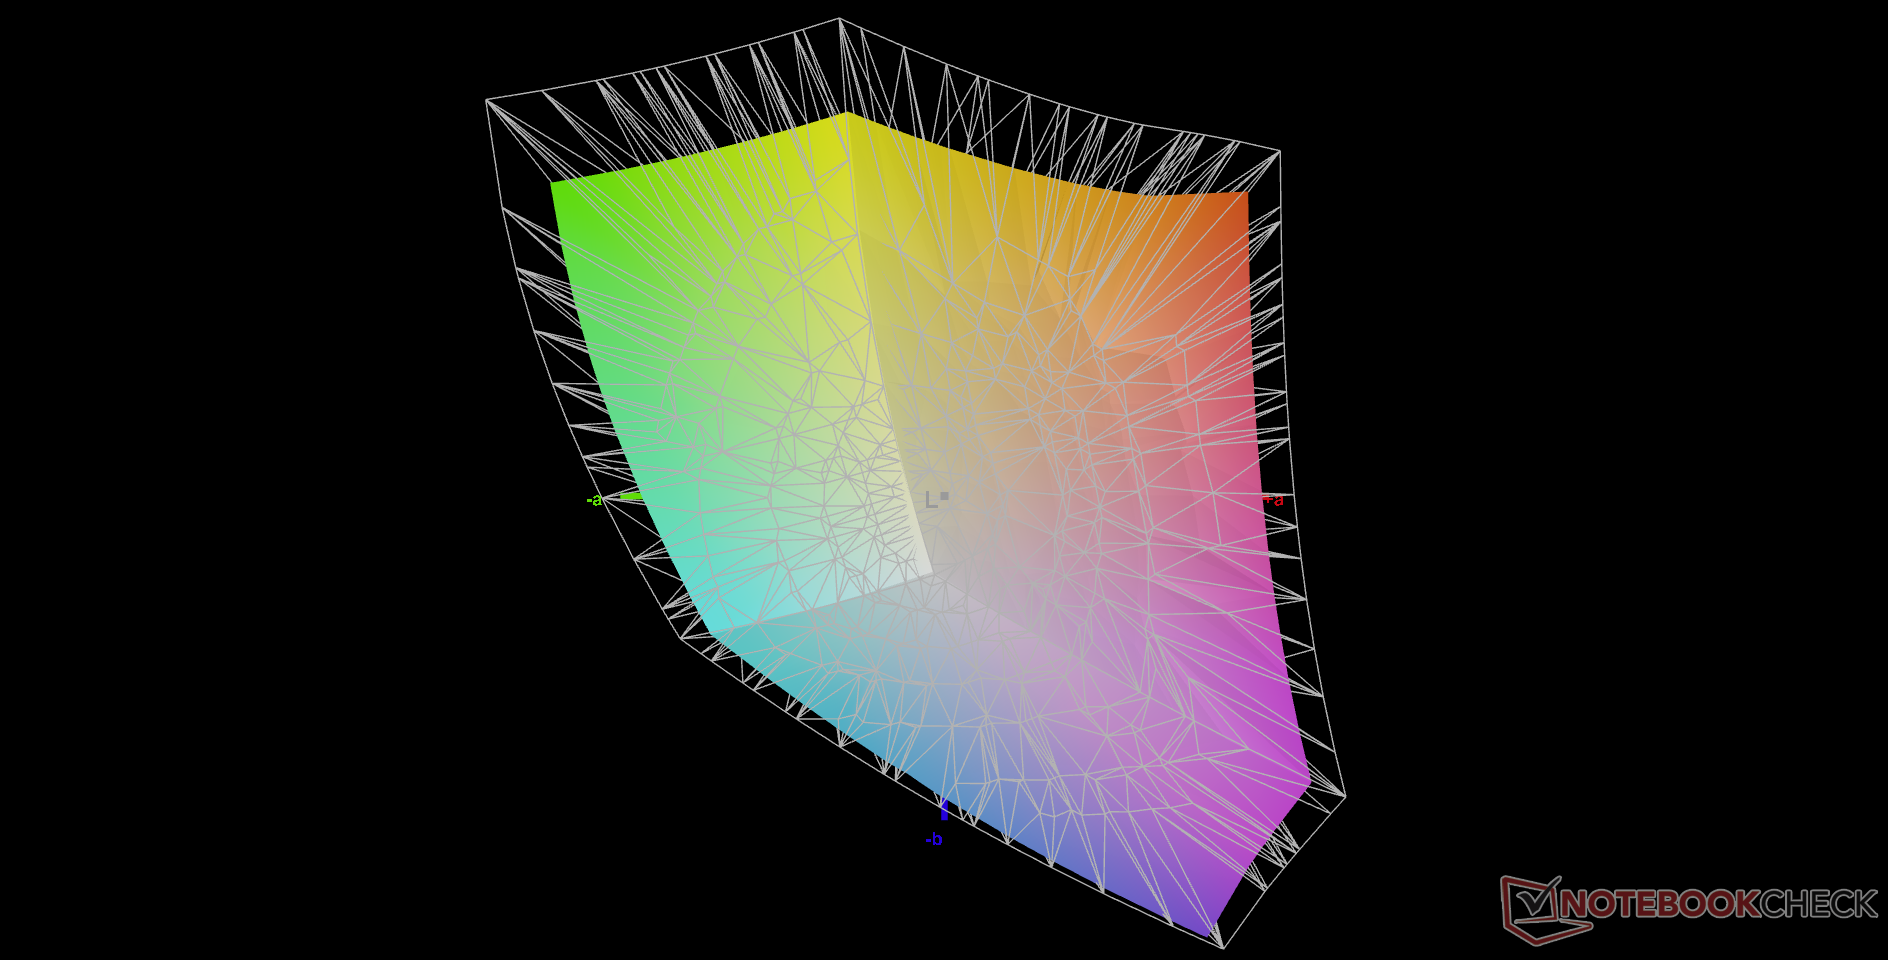
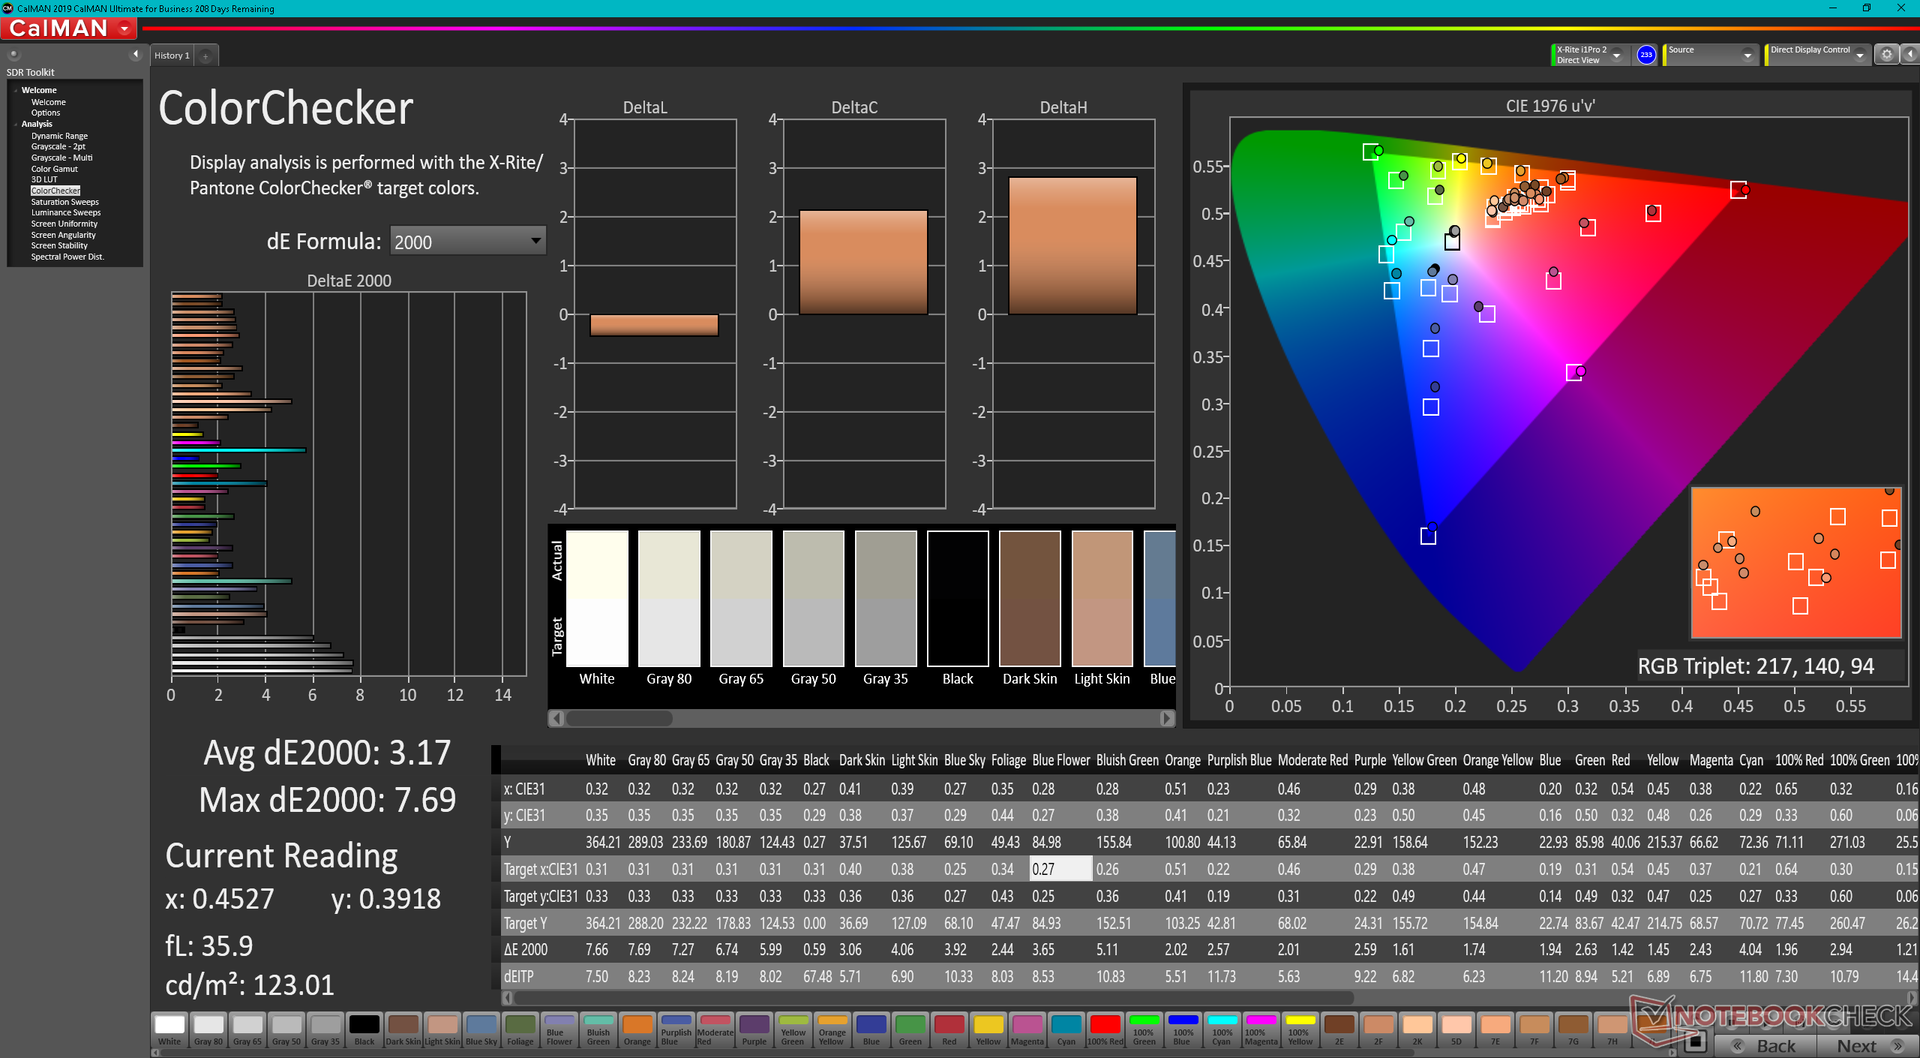
ΔE ColorChecker Calman: 3.17 | ∀{0.5-29.43 Ø4.71}
calibrated: 0.51
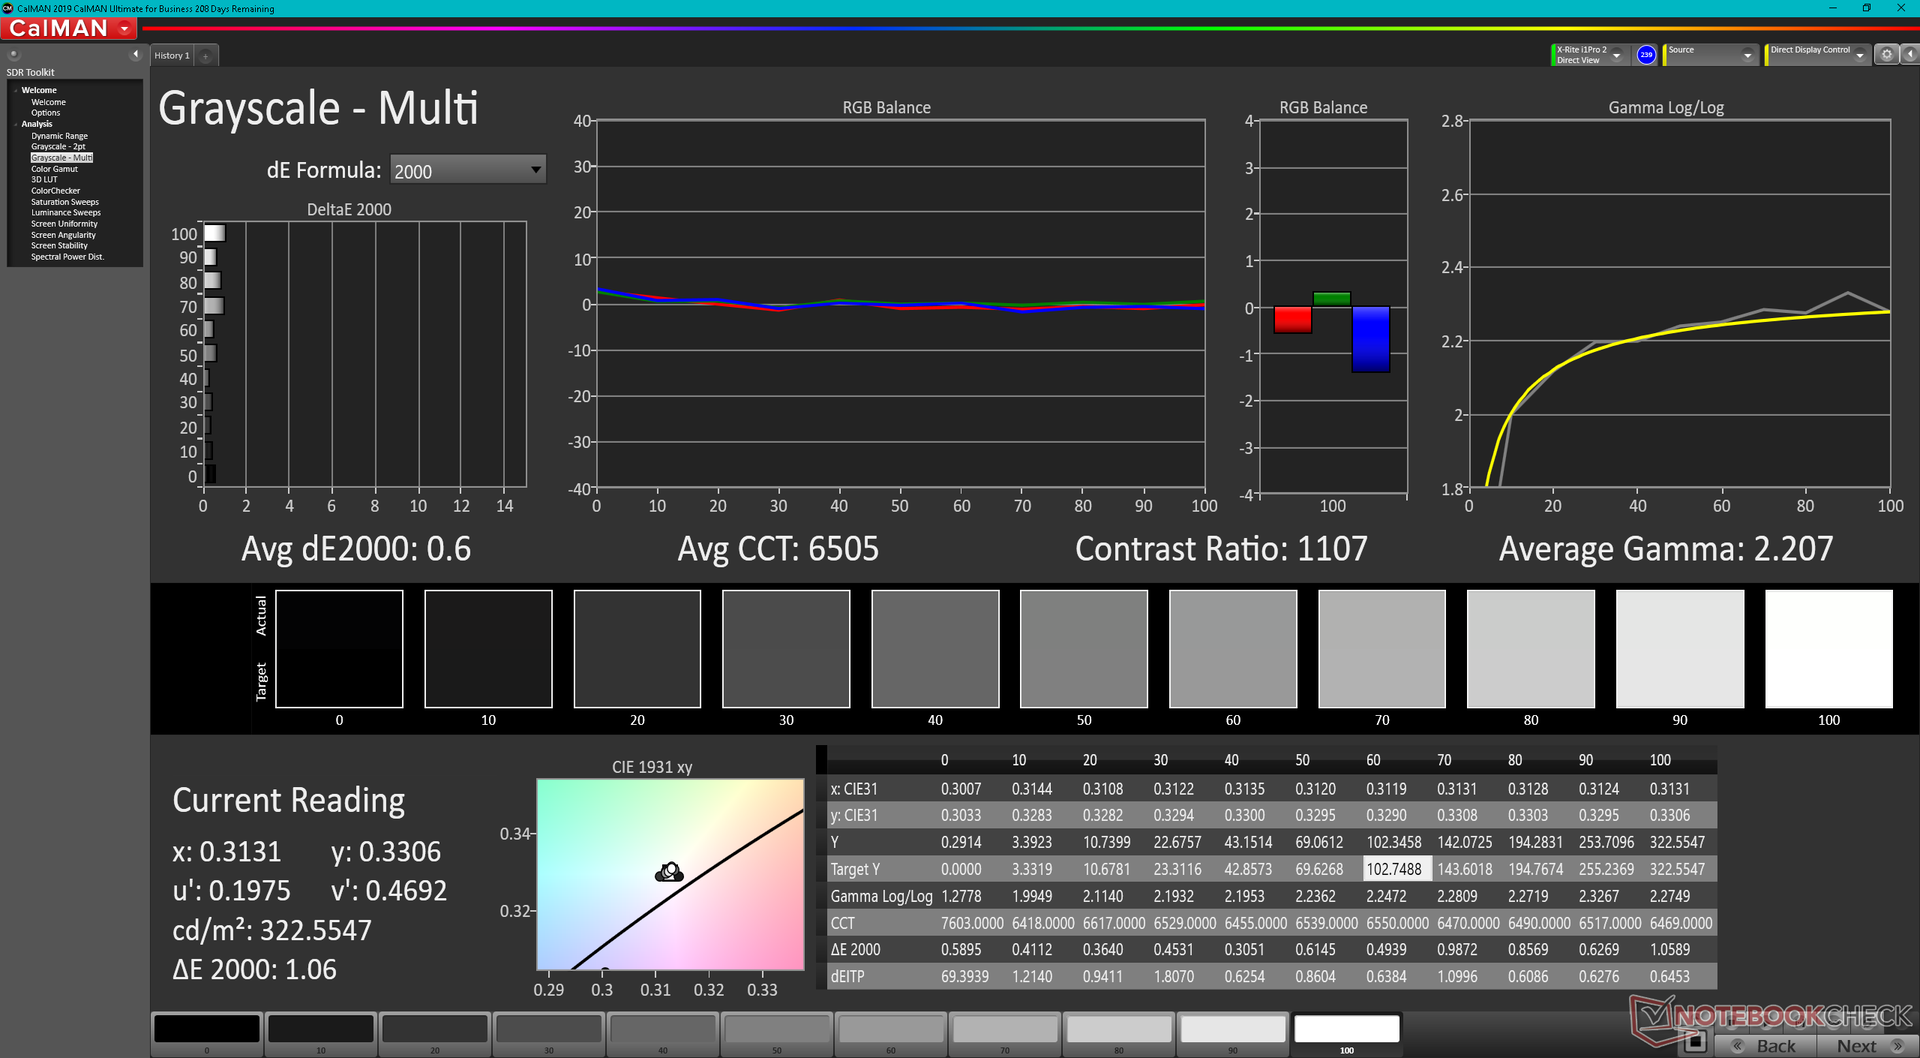
ΔE Greyscale Calman: 5.3 | ∀{0.09-98 Ø4.96}
79.6% AdobeRGB 1998 (Argyll 3D)
99.8% sRGB (Argyll 3D)
79.2% Display P3 (Argyll 3D)
Gamma: 2.18
CCT: 5879 K
| Alienware x17 R2 P48E AU Optronics B173HAN, IPS, 1920x1080, 17.3" | Alienware x17 RTX 3080 P48E AU Optronics B173ZAN, IPS, 3840x2160, 17.3" | Asus ROG Zephyrus S17 GX703HSD BOE099D (BOE CQ NE173QHM-NY3), IPS, 2560x1440, 17.3" | MSI Stealth GS77 12UHS-083US BOE NE173QHM-NZ1, IPS, 2560x1440, 17.3" | MSI GT76 Titan DT 10SGS AU Optronics B173ZAN03.3, IPS, 3840x2160, 17.3" | Gigabyte A7 X1 AU Optronics AUO8E8D, IPS, 1920x1080, 17.3" | |
|---|---|---|---|---|---|---|
| Display | 12% | 8% | 10% | 8% | -17% | |
| Display P3 Coverage (%) | 79.2 | 88.3 11% | 94.2 19% | 96.2 21% | 82.5 4% | 61.5 -22% |
| sRGB Coverage (%) | 99.8 | 100 0% | 98.7 -1% | 99.7 0% | 98 -2% | 90.9 -9% |
| AdobeRGB 1998 Coverage (%) | 79.6 | 100 26% | 84.4 6% | 85.8 8% | 96.6 21% | 63.2 -21% |
| Response Times | -15% | 37% | -41% | -57% | -23% | |
| Response Time Grey 50% / Grey 80% * (ms) | 12.4 ? | 14.4 ? -16% | 4.8 61% | 17.6 ? -42% | 23.2 ? -87% | 16 ? -29% |
| Response Time Black / White * (ms) | 9.2 ? | 10.4 ? -13% | 8 13% | 12.8 ? -39% | 11.6 ? -26% | 10.8 ? -17% |
| PWM Frequency (Hz) | ||||||
| Screen | -6% | -29% | -12% | -55% | -39% | |
| Brightness middle (cd/m²) | 365.4 | 438.7 20% | 322 -12% | 334.8 -8% | 419.5 15% | 325 -11% |
| Brightness (cd/m²) | 344 | 435 26% | 288 -16% | 305 -11% | 413 20% | 318 -8% |
| Brightness Distribution (%) | 85 | 91 7% | 72 -15% | 79 -7% | 93 9% | 95 12% |
| Black Level * (cd/m²) | 0.29 | 0.48 -66% | 0.3 -3% | 0.34 -17% | 0.4 -38% | 0.29 -0% |
| Contrast (:1) | 1260 | 914 -27% | 1073 -15% | 985 -22% | 1049 -17% | 1121 -11% |
| Colorchecker dE 2000 * | 3.17 | 4.34 -37% | 3.05 4% | 4.1 -29% | 3.4 -7% | 4.33 -37% |
| Colorchecker dE 2000 max. * | 7.69 | 7.3 5% | 5.23 32% | 7.28 5% | 7.4 4% | 8.6 -12% |
| Colorchecker dE 2000 calibrated * | 0.51 | 0.72 -41% | 1.92 -276% | 3.28 -543% | 1.95 -282% | |
| Greyscale dE 2000 * | 5.3 | 2.4 55% | 3.11 41% | 5.6 -6% | 2 62% | 5.5 -4% |
| Gamma | 2.18 101% | 2.09 105% | 2.13 103% | 2.16 102% | 2.14 103% | 2.142 103% |
| CCT | 5879 111% | 6413 101% | 6553 99% | 6314 103% | 6858 95% | 7893 82% |
| Color Space (Percent of AdobeRGB 1998) (%) | 84 | 84.6 | ||||
| Color Space (Percent of sRGB) (%) | 99 | 97.9 | ||||
| Totaal Gemiddelde (Programma / Instellingen) | -3% /
-4% | 5% /
-12% | -14% /
-11% | -35% /
-42% | -26% /
-32% |
* ... kleiner is beter
Het scherm is uit de doos niet erg goed gekalibreerd, vooral omdat de kleurtemperatuur te warm is. Eenmaal goed gekalibreerd tegen sRGB, zijn we echter in staat om gemiddelde grijswaarden en kleur deltaE waarden te bereiken van respectievelijk slechts 0,6 en 0,51.
Responstijd Scherm
| ↔ Responstijd Zwart naar Wit | ||
|---|---|---|
| 9.2 ms ... stijging ↗ en daling ↘ gecombineerd | ↗ 5.2 ms stijging | 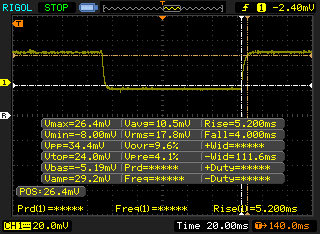 |
| ↘ 4 ms daling | ||
| Het scherm vertoonde snelle responstijden in onze tests en zou geschikt moeten zijn voor games. Ter vergelijking: alle testtoestellen variëren van 0.1 (minimum) tot 240 (maximum) ms. » 26 % van alle toestellen zijn beter. Dit betekent dat de gemeten responstijd beter is dan het gemiddelde (19.8 ms) van alle geteste toestellen. | ||
| ↔ Responstijd 50% Grijs naar 80% Grijs | ||
| 12.4 ms ... stijging ↗ en daling ↘ gecombineerd | ↗ 6.4 ms stijging | 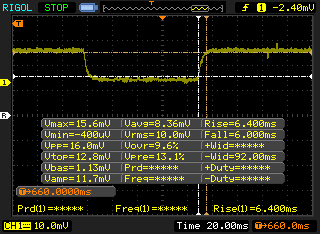 |
| ↘ 6 ms daling | ||
| Het scherm vertoonde prima responstijden in onze tests maar is misschien wat te traag voor competitieve games. Ter vergelijking: alle testtoestellen variëren van 0.165 (minimum) tot 636 (maximum) ms. » 26 % van alle toestellen zijn beter. Dit betekent dat de gemeten responstijd beter is dan het gemiddelde (31 ms) van alle geteste toestellen. | ||
Screen Flickering / PWM (Pulse-Width Modulation)
| Screen flickering / PWM niet waargenomen | 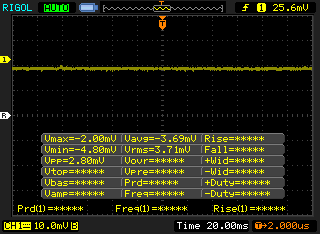 | ||
Ter vergelijking: 52 % van alle geteste toestellen maakten geen gebruik van PWM om de schermhelderheid te verlagen. Als het wel werd gebruikt, werd een gemiddelde van 7754 (minimum: 5 - maximum: 343500) Hz waargenomen. | |||

Prestaties
Testomstandigheden
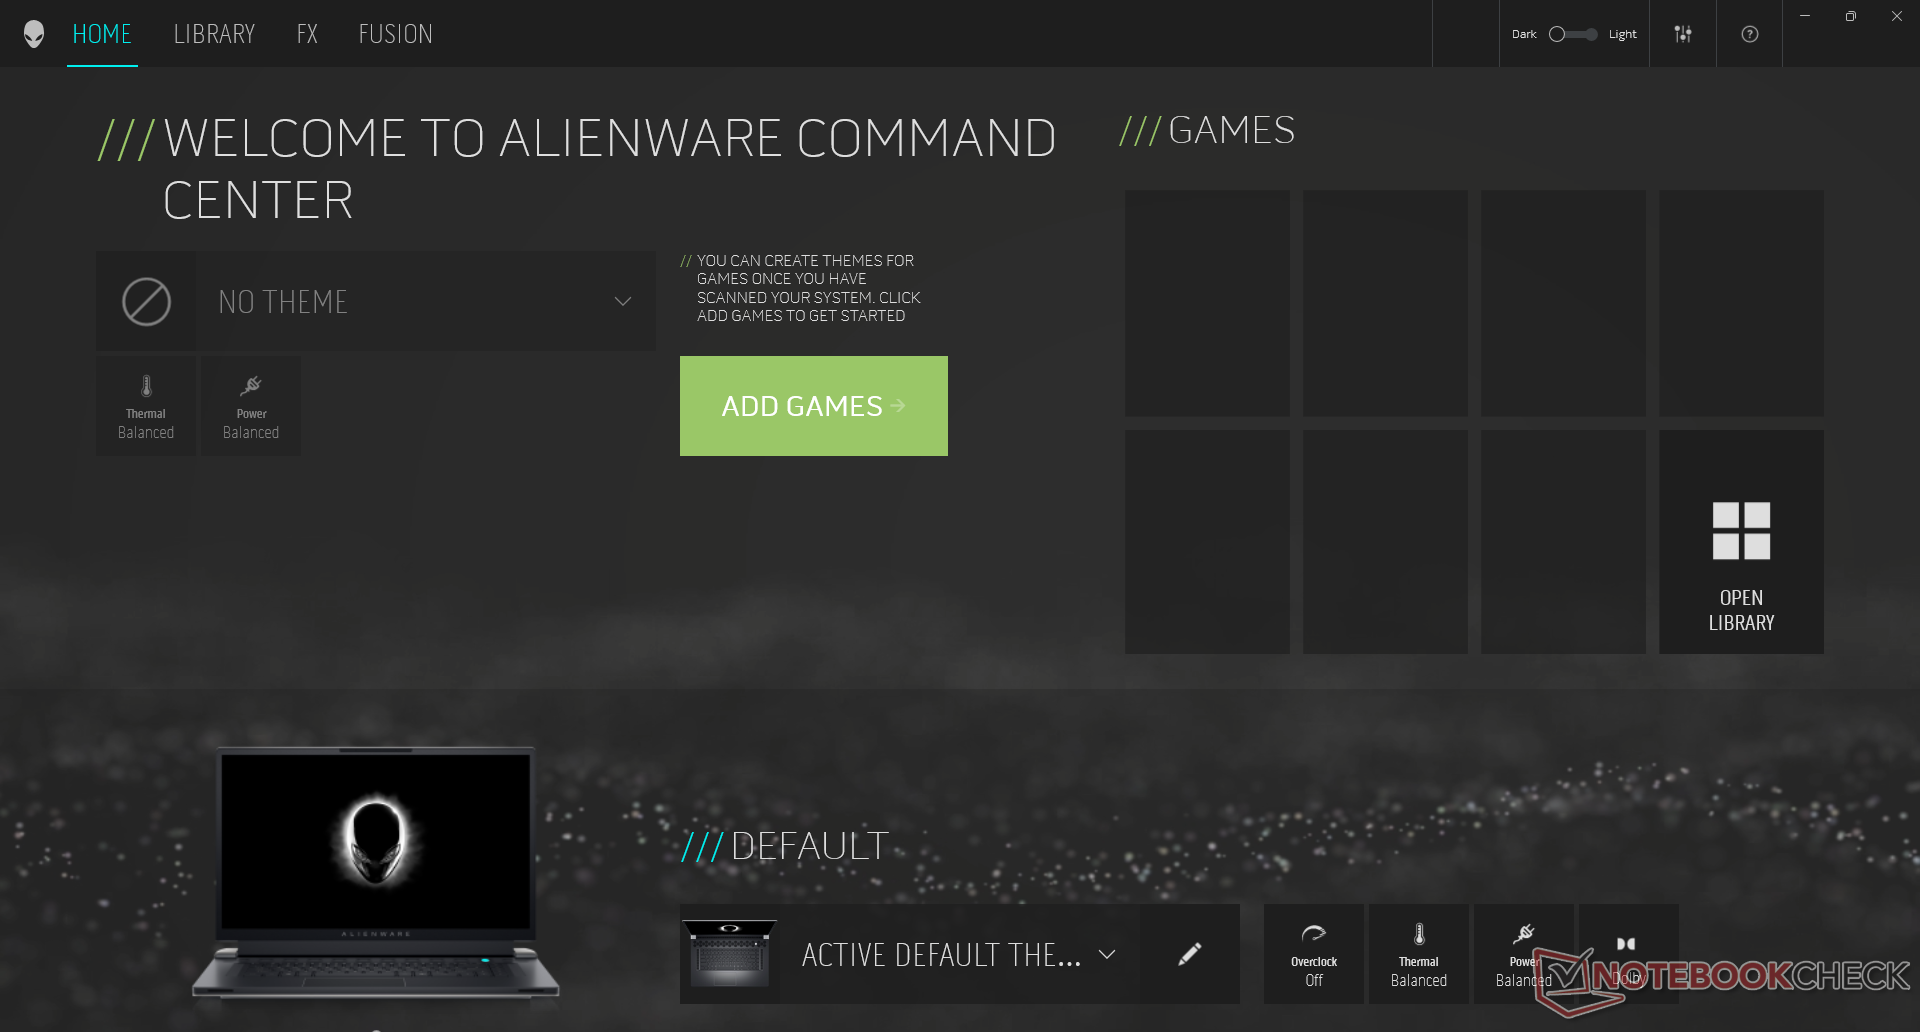
We hebben ons toestel ingesteld op Hoge Prestaties modus en met de discrete GPU actief voordat we onderstaande prestatiebenchmarks uitvoerden voor de hoogst mogelijke scores. De modus Hoge prestaties kan eenvoudig worden omgeschakeld via Fn+F1, terwijl de MUX-schakelaar kan worden geopend via het Nvidia Configuratiescherm. We raden gebruikers ten zeerste aan vertrouwd te raken met de Alienware Command Center software, aangezien de energieprofielen, RGB-instellingen, real-time monitoring en andere functies hier te vinden zijn.
Processor
De ruwe CPU-prestaties zijn ongeveer 10 tot 15 procent sneller dan de gemiddelde laptop in onze database met dezelfde Core i9-12900HK. Het is een behoorlijke boost ten opzichte van de Core i7-12800H of de laatste generatie Core i7-11800H met elk tot 30 procent in multi-threaded werkbelastingen. AMD's nieuwste Zen 3+ CPU, de Ryzen 9 6900HXis ook consistent langzamer in onbewerkte CineBench benchmarks, maar presteert beter dan de Core i9-12900HK in bepaalde AIDA64 benchmarks.
Cinebench R15 Multi Loop
Cinebench R23: Multi Core | Single Core
Cinebench R15: CPU Multi 64Bit | CPU Single 64Bit
Blender: v2.79 BMW27 CPU
7-Zip 18.03: 7z b 4 | 7z b 4 -mmt1
Geekbench 5.5: Multi-Core | Single-Core
HWBOT x265 Benchmark v2.2: 4k Preset
LibreOffice : 20 Documents To PDF
R Benchmark 2.5: Overall mean
| Cinebench R20 / CPU (Multi Core) | |
| AMD Radeon RX 6800 XT | |
| Corsair One i300 | |
| Alienware x17 R2 P48E | |
| Gemiddeld Intel Core i9-12900HK (1828 - 7366, n=14) | |
| Razer Blade 14 Ryzen 9 6900HX | |
| Alienware x17 RTX 3080 P48E | |
| Razer Blade 17 (i7-12800H, RTX 3070 Ti) | |
| Gigabyte A7 X1 | |
| Razer Blade Pro 17 2021 (QHD Touch) | |
| Lenovo Legion Y740-17IRHg-81UJ001VGE | |
| Cinebench R20 / CPU (Single Core) | |
| Corsair One i300 | |
| Alienware x17 R2 P48E | |
| Razer Blade 17 (i7-12800H, RTX 3070 Ti) | |
| Gemiddeld Intel Core i9-12900HK (316 - 739, n=14) | |
| AMD Radeon RX 6800 XT | |
| Razer Blade 14 Ryzen 9 6900HX | |
| Alienware x17 RTX 3080 P48E | |
| Gigabyte A7 X1 | |
| Razer Blade Pro 17 2021 (QHD Touch) | |
| Lenovo Legion Y740-17IRHg-81UJ001VGE | |
| Cinebench R23 / Multi Core | |
| Corsair One i300 | |
| AMD Radeon RX 6800 XT | |
| Alienware x17 R2 P48E | |
| Gemiddeld Intel Core i9-12900HK (4796 - 19282, n=14) | |
| Razer Blade 17 (i7-12800H, RTX 3070 Ti) | |
| Razer Blade 14 Ryzen 9 6900HX | |
| Alienware x17 RTX 3080 P48E | |
| Gigabyte A7 X1 | |
| Razer Blade Pro 17 2021 (QHD Touch) | |
| Cinebench R23 / Single Core | |
| Corsair One i300 | |
| Alienware x17 R2 P48E | |
| Razer Blade 17 (i7-12800H, RTX 3070 Ti) | |
| Gemiddeld Intel Core i9-12900HK (819 - 1940, n=15) | |
| AMD Radeon RX 6800 XT | |
| Razer Blade 14 Ryzen 9 6900HX | |
| Alienware x17 RTX 3080 P48E | |
| Gigabyte A7 X1 | |
| Razer Blade Pro 17 2021 (QHD Touch) | |
| Cinebench R15 / CPU Multi 64Bit | |
| AMD Radeon RX 6800 XT | |
| Corsair One i300 | |
| Alienware x17 R2 P48E | |
| Razer Blade 17 (i7-12800H, RTX 3070 Ti) | |
| Gemiddeld Intel Core i9-12900HK (965 - 2944, n=14) | |
| Razer Blade 14 Ryzen 9 6900HX | |
| Alienware x17 RTX 3080 P48E | |
| Gigabyte A7 X1 | |
| Razer Blade Pro 17 2021 (QHD Touch) | |
| Lenovo Legion Y740-17IRHg-81UJ001VGE | |
| Cinebench R15 / CPU Single 64Bit | |
| Corsair One i300 | |
| Alienware x17 R2 P48E | |
| Razer Blade 17 (i7-12800H, RTX 3070 Ti) | |
| AMD Radeon RX 6800 XT | |
| Razer Blade 14 Ryzen 9 6900HX | |
| Gigabyte A7 X1 | |
| Gemiddeld Intel Core i9-12900HK (119 - 279, n=14) | |
| Alienware x17 RTX 3080 P48E | |
| Razer Blade Pro 17 2021 (QHD Touch) | |
| Lenovo Legion Y740-17IRHg-81UJ001VGE | |
| Blender / v2.79 BMW27 CPU | |
| Lenovo Legion Y740-17IRHg-81UJ001VGE | |
| Razer Blade Pro 17 2021 (QHD Touch) | |
| Gigabyte A7 X1 | |
| Gemiddeld Intel Core i9-12900HK (172.5 - 483, n=13) | |
| Razer Blade 14 Ryzen 9 6900HX | |
| Razer Blade 17 (i7-12800H, RTX 3070 Ti) | |
| Alienware x17 RTX 3080 P48E | |
| Alienware x17 R2 P48E | |
| Corsair One i300 | |
| AMD Radeon RX 6800 XT | |
| 7-Zip 18.03 / 7z b 4 | |
| AMD Radeon RX 6800 XT | |
| Corsair One i300 | |
| Alienware x17 R2 P48E | |
| Razer Blade 17 (i7-12800H, RTX 3070 Ti) | |
| Razer Blade 14 Ryzen 9 6900HX | |
| Gemiddeld Intel Core i9-12900HK (25736 - 75564, n=14) | |
| Gigabyte A7 X1 | |
| Alienware x17 RTX 3080 P48E | |
| Razer Blade Pro 17 2021 (QHD Touch) | |
| Lenovo Legion Y740-17IRHg-81UJ001VGE | |
| 7-Zip 18.03 / 7z b 4 -mmt1 | |
| AMD Radeon RX 6800 XT | |
| Corsair One i300 | |
| Razer Blade 14 Ryzen 9 6900HX | |
| Alienware x17 R2 P48E | |
| Razer Blade 17 (i7-12800H, RTX 3070 Ti) | |
| Gigabyte A7 X1 | |
| Gemiddeld Intel Core i9-12900HK (2898 - 6186, n=14) | |
| Alienware x17 RTX 3080 P48E | |
| Razer Blade Pro 17 2021 (QHD Touch) | |
| Lenovo Legion Y740-17IRHg-81UJ001VGE | |
| Geekbench 5.5 / Multi-Core | |
| Corsair One i300 | |
| AMD Radeon RX 6800 XT | |
| Alienware x17 R2 P48E | |
| Razer Blade 17 (i7-12800H, RTX 3070 Ti) | |
| Gemiddeld Intel Core i9-12900HK (5869 - 14294, n=13) | |
| Razer Blade 14 Ryzen 9 6900HX | |
| Razer Blade Pro 17 2021 (QHD Touch) | |
| Gigabyte A7 X1 | |
| Lenovo Legion Y740-17IRHg-81UJ001VGE | |
| Geekbench 5.5 / Single-Core | |
| Corsair One i300 | |
| Alienware x17 R2 P48E | |
| Razer Blade 17 (i7-12800H, RTX 3070 Ti) | |
| Gemiddeld Intel Core i9-12900HK (843 - 1918, n=13) | |
| AMD Radeon RX 6800 XT | |
| Razer Blade 14 Ryzen 9 6900HX | |
| Gigabyte A7 X1 | |
| Razer Blade Pro 17 2021 (QHD Touch) | |
| Lenovo Legion Y740-17IRHg-81UJ001VGE | |
| HWBOT x265 Benchmark v2.2 / 4k Preset | |
| AMD Radeon RX 6800 XT | |
| Corsair One i300 | |
| Alienware x17 R2 P48E | |
| Razer Blade 14 Ryzen 9 6900HX | |
| Alienware x17 RTX 3080 P48E | |
| Gemiddeld Intel Core i9-12900HK (5.33 - 21.6, n=14) | |
| Razer Blade 17 (i7-12800H, RTX 3070 Ti) | |
| Gigabyte A7 X1 | |
| Razer Blade Pro 17 2021 (QHD Touch) | |
| Lenovo Legion Y740-17IRHg-81UJ001VGE | |
| LibreOffice / 20 Documents To PDF | |
| Gigabyte A7 X1 | |
| AMD Radeon RX 6800 XT | |
| Razer Blade 14 Ryzen 9 6900HX | |
| Gemiddeld Intel Core i9-12900HK (34.8 - 89.1, n=14) | |
| Alienware x17 RTX 3080 P48E | |
| Razer Blade Pro 17 2021 (QHD Touch) | |
| Razer Blade 17 (i7-12800H, RTX 3070 Ti) | |
| Alienware x17 R2 P48E | |
| Corsair One i300 | |
| R Benchmark 2.5 / Overall mean | |
| Lenovo Legion Y740-17IRHg-81UJ001VGE | |
| Razer Blade Pro 17 2021 (QHD Touch) | |
| Alienware x17 RTX 3080 P48E | |
| Gemiddeld Intel Core i9-12900HK (0.4155 - 0.994, n=14) | |
| Gigabyte A7 X1 | |
| Razer Blade 14 Ryzen 9 6900HX | |
| AMD Radeon RX 6800 XT | |
| Razer Blade 17 (i7-12800H, RTX 3070 Ti) | |
| Alienware x17 R2 P48E | |
| Corsair One i300 | |
* ... kleiner is beter
AIDA64: FP32 Ray-Trace | FPU Julia | CPU SHA3 | CPU Queen | FPU SinJulia | FPU Mandel | CPU AES | CPU ZLib | FP64 Ray-Trace | CPU PhotoWorxx
| Performance rating | |
| Razer Blade 14 Ryzen 9 6900HX | |
| Gigabyte A7 X1 | |
| Alienware x17 R2 P48E | |
| MSI Stealth GS77 12UHS-083US | |
| Gemiddeld Intel Core i9-12900HK | |
| AIDA64 / FP32 Ray-Trace | |
| Razer Blade 14 Ryzen 9 6900HX | |
| Gigabyte A7 X1 | |
| Alienware x17 R2 P48E | |
| Gemiddeld Intel Core i9-12900HK (2677 - 13948, n=15) | |
| MSI Stealth GS77 12UHS-083US | |
| AIDA64 / FPU Julia | |
| Razer Blade 14 Ryzen 9 6900HX | |
| Gigabyte A7 X1 | |
| Gemiddeld Intel Core i9-12900HK (12762 - 70764, n=15) | |
| Alienware x17 R2 P48E | |
| MSI Stealth GS77 12UHS-083US | |
| AIDA64 / CPU SHA3 | |
| Alienware x17 R2 P48E | |
| Razer Blade 14 Ryzen 9 6900HX | |
| Gigabyte A7 X1 | |
| MSI Stealth GS77 12UHS-083US | |
| Gemiddeld Intel Core i9-12900HK (841 - 3504, n=15) | |
| AIDA64 / CPU Queen | |
| Alienware x17 R2 P48E | |
| Razer Blade 14 Ryzen 9 6900HX | |
| Gigabyte A7 X1 | |
| MSI Stealth GS77 12UHS-083US | |
| Gemiddeld Intel Core i9-12900HK (60202 - 107161, n=15) | |
| AIDA64 / FPU SinJulia | |
| Razer Blade 14 Ryzen 9 6900HX | |
| Gigabyte A7 X1 | |
| Alienware x17 R2 P48E | |
| MSI Stealth GS77 12UHS-083US | |
| Gemiddeld Intel Core i9-12900HK (3225 - 10402, n=15) | |
| AIDA64 / FPU Mandel | |
| Razer Blade 14 Ryzen 9 6900HX | |
| Gigabyte A7 X1 | |
| Alienware x17 R2 P48E | |
| Gemiddeld Intel Core i9-12900HK (7417 - 34233, n=15) | |
| MSI Stealth GS77 12UHS-083US | |
| AIDA64 / CPU AES | |
| Razer Blade 14 Ryzen 9 6900HX | |
| Gigabyte A7 X1 | |
| Alienware x17 R2 P48E | |
| MSI Stealth GS77 12UHS-083US | |
| Gemiddeld Intel Core i9-12900HK (32382 - 112498, n=15) | |
| AIDA64 / CPU ZLib | |
| Alienware x17 R2 P48E | |
| MSI Stealth GS77 12UHS-083US | |
| Gemiddeld Intel Core i9-12900HK (314 - 1209, n=15) | |
| Razer Blade 14 Ryzen 9 6900HX | |
| Gigabyte A7 X1 | |
| AIDA64 / FP64 Ray-Trace | |
| Razer Blade 14 Ryzen 9 6900HX | |
| Gigabyte A7 X1 | |
| Alienware x17 R2 P48E | |
| Gemiddeld Intel Core i9-12900HK (1501 - 7616, n=15) | |
| MSI Stealth GS77 12UHS-083US | |
| AIDA64 / CPU PhotoWorxx | |
| MSI Stealth GS77 12UHS-083US | |
| Gemiddeld Intel Core i9-12900HK (24446 - 42462, n=15) | |
| Alienware x17 R2 P48E | |
| Razer Blade 14 Ryzen 9 6900HX | |
| Gigabyte A7 X1 | |
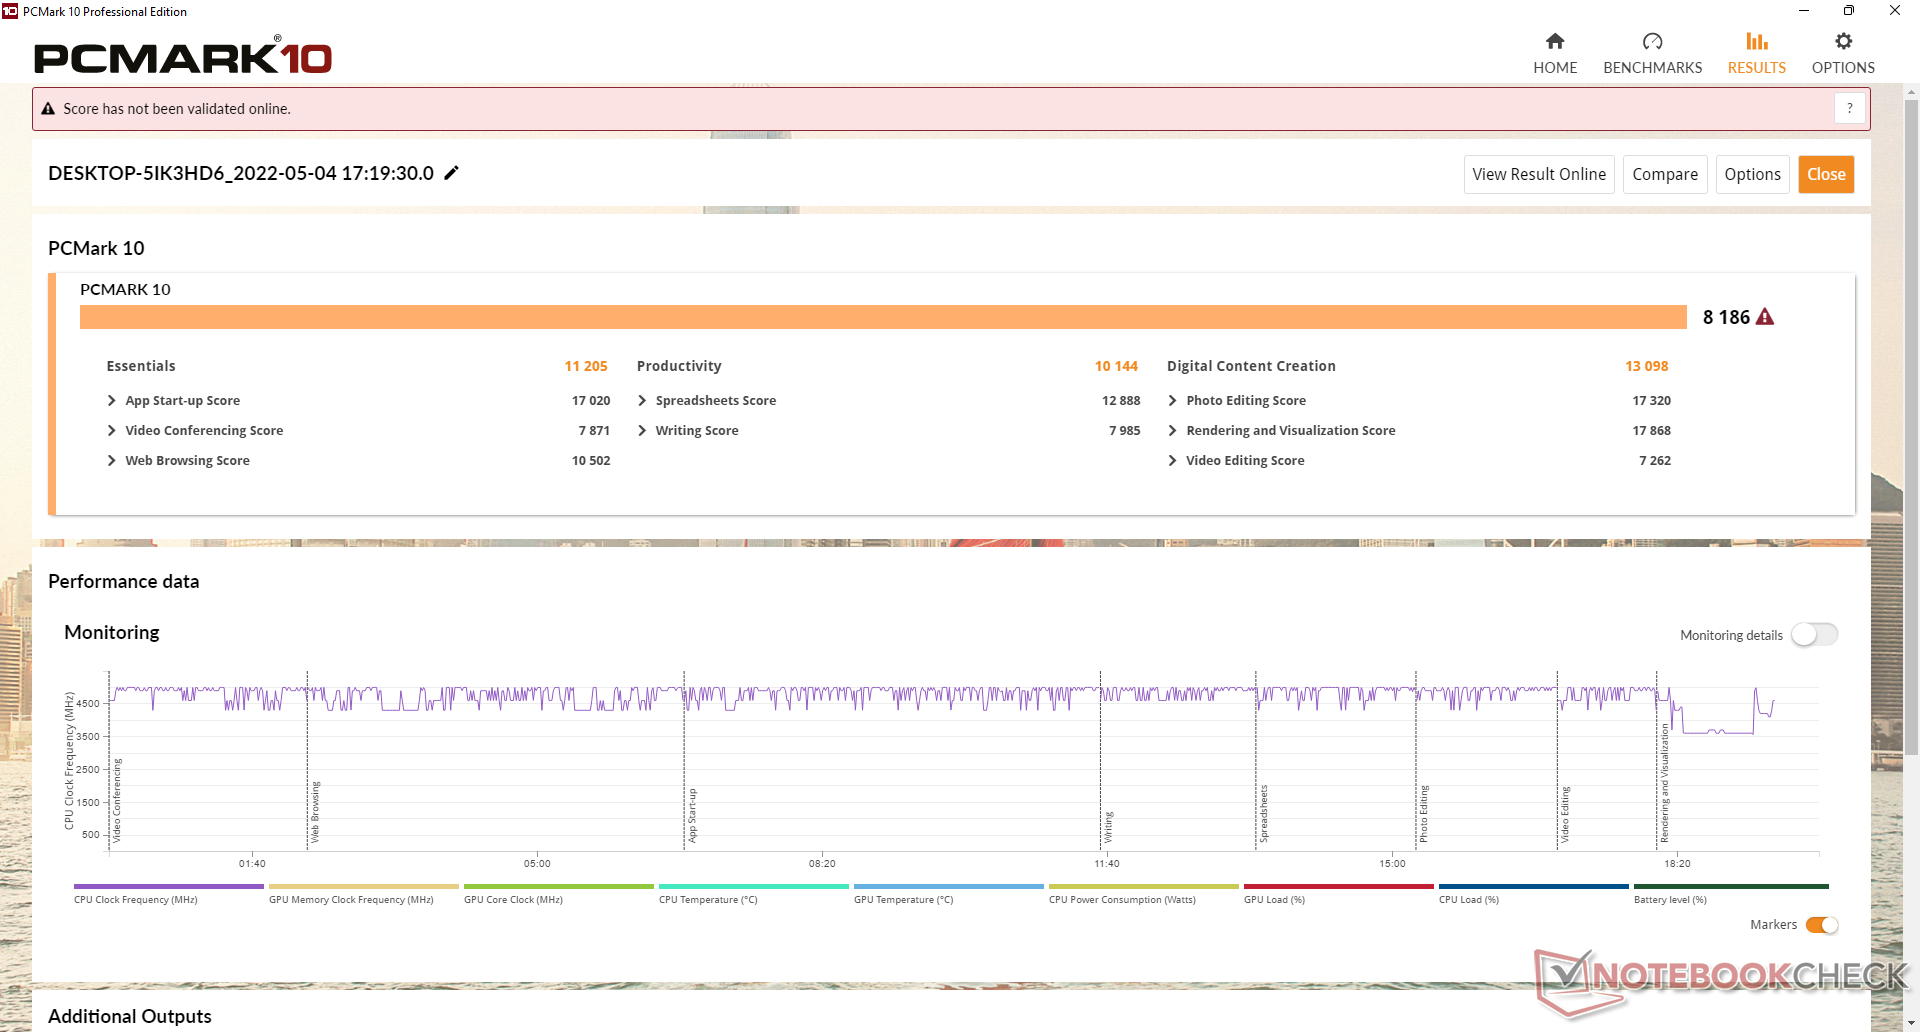
Systeemprestaties
PCMark resultaten zijn consistent hoger dan wat we registreerden op de x17 R1 van vorig jaar, met relatief kleine marges.
Het is vermeldenswaard dat de laptop veel stroom verbruikt, zelfs in stand-by of slaapstand. We registreren een verbruik van bijna 12 W in de slaapstand, vergeleken met <2 W op de meeste andere laptops. Bovendien waren de ventilatoren in onze testunit soms actief, zelfs in de slaapstand, en had de unit soms ook moeite om goed wakker te worden.
CrossMark: Overall | Productivity | Creativity | Responsiveness
| PCMark 10 / Score | |
| Alienware x17 R2 P48E | |
| Gemiddeld Intel Core i9-12900HK, NVIDIA GeForce RTX 3080 Ti Laptop GPU (7149 - 8186, n=5) | |
| Alienware x17 RTX 3080 P48E | |
| MSI Stealth GS77 12UHS-083US | |
| MSI GT76 Titan DT 10SGS | |
| Asus ROG Zephyrus S17 GX703HSD | |
| Gigabyte A7 X1 | |
| PCMark 10 / Essentials | |
| Alienware x17 R2 P48E | |
| Gemiddeld Intel Core i9-12900HK, NVIDIA GeForce RTX 3080 Ti Laptop GPU (9870 - 11205, n=5) | |
| Asus ROG Zephyrus S17 GX703HSD | |
| MSI GT76 Titan DT 10SGS | |
| MSI Stealth GS77 12UHS-083US | |
| Alienware x17 RTX 3080 P48E | |
| Gigabyte A7 X1 | |
| PCMark 10 / Productivity | |
| Alienware x17 R2 P48E | |
| Gemiddeld Intel Core i9-12900HK, NVIDIA GeForce RTX 3080 Ti Laptop GPU (9173 - 10422, n=5) | |
| Alienware x17 RTX 3080 P48E | |
| MSI Stealth GS77 12UHS-083US | |
| Gigabyte A7 X1 | |
| Asus ROG Zephyrus S17 GX703HSD | |
| MSI GT76 Titan DT 10SGS | |
| PCMark 10 / Digital Content Creation | |
| Alienware x17 R2 P48E | |
| Gemiddeld Intel Core i9-12900HK, NVIDIA GeForce RTX 3080 Ti Laptop GPU (10951 - 13098, n=5) | |
| MSI GT76 Titan DT 10SGS | |
| Alienware x17 RTX 3080 P48E | |
| MSI Stealth GS77 12UHS-083US | |
| Asus ROG Zephyrus S17 GX703HSD | |
| Gigabyte A7 X1 | |
| CrossMark / Overall | |
| Alienware x17 R2 P48E | |
| Gemiddeld Intel Core i9-12900HK, NVIDIA GeForce RTX 3080 Ti Laptop GPU (970 - 2138, n=5) | |
| CrossMark / Productivity | |
| Alienware x17 R2 P48E | |
| Gemiddeld Intel Core i9-12900HK, NVIDIA GeForce RTX 3080 Ti Laptop GPU (921 - 2038, n=5) | |
| CrossMark / Creativity | |
| Alienware x17 R2 P48E | |
| Gemiddeld Intel Core i9-12900HK, NVIDIA GeForce RTX 3080 Ti Laptop GPU (1007 - 2210, n=5) | |
| CrossMark / Responsiveness | |
| Gemiddeld Intel Core i9-12900HK, NVIDIA GeForce RTX 3080 Ti Laptop GPU (1012 - 2234, n=5) | |
| Alienware x17 R2 P48E | |
| PCMark 10 Score | 8186 punten | |
Help | ||
| AIDA64 / Memory Copy | |
| MSI Stealth GS77 12UHS-083US | |
| Gemiddeld Intel Core i9-12900HK (42967 - 62959, n=15) | |
| Alienware x17 R2 P48E | |
| Gigabyte A7 X1 | |
| AIDA64 / Memory Read | |
| MSI Stealth GS77 12UHS-083US | |
| Gemiddeld Intel Core i9-12900HK (44419 - 66989, n=15) | |
| Alienware x17 R2 P48E | |
| Gigabyte A7 X1 | |
| AIDA64 / Memory Write | |
| MSI Stealth GS77 12UHS-083US | |
| Gemiddeld Intel Core i9-12900HK (42144 - 65268, n=15) | |
| Alienware x17 R2 P48E | |
| Gigabyte A7 X1 | |
| AIDA64 / Memory Latency | |
| Alienware x17 R2 P48E | |
| MSI Stealth GS77 12UHS-083US | |
| Gigabyte A7 X1 | |
| Gemiddeld Intel Core i9-12900HK (79.9 - 109, n=15) | |
| Asus ROG Zephyrus S17 GX703HSD | |
| Alienware x17 RTX 3080 P48E | |
* ... kleiner is beter
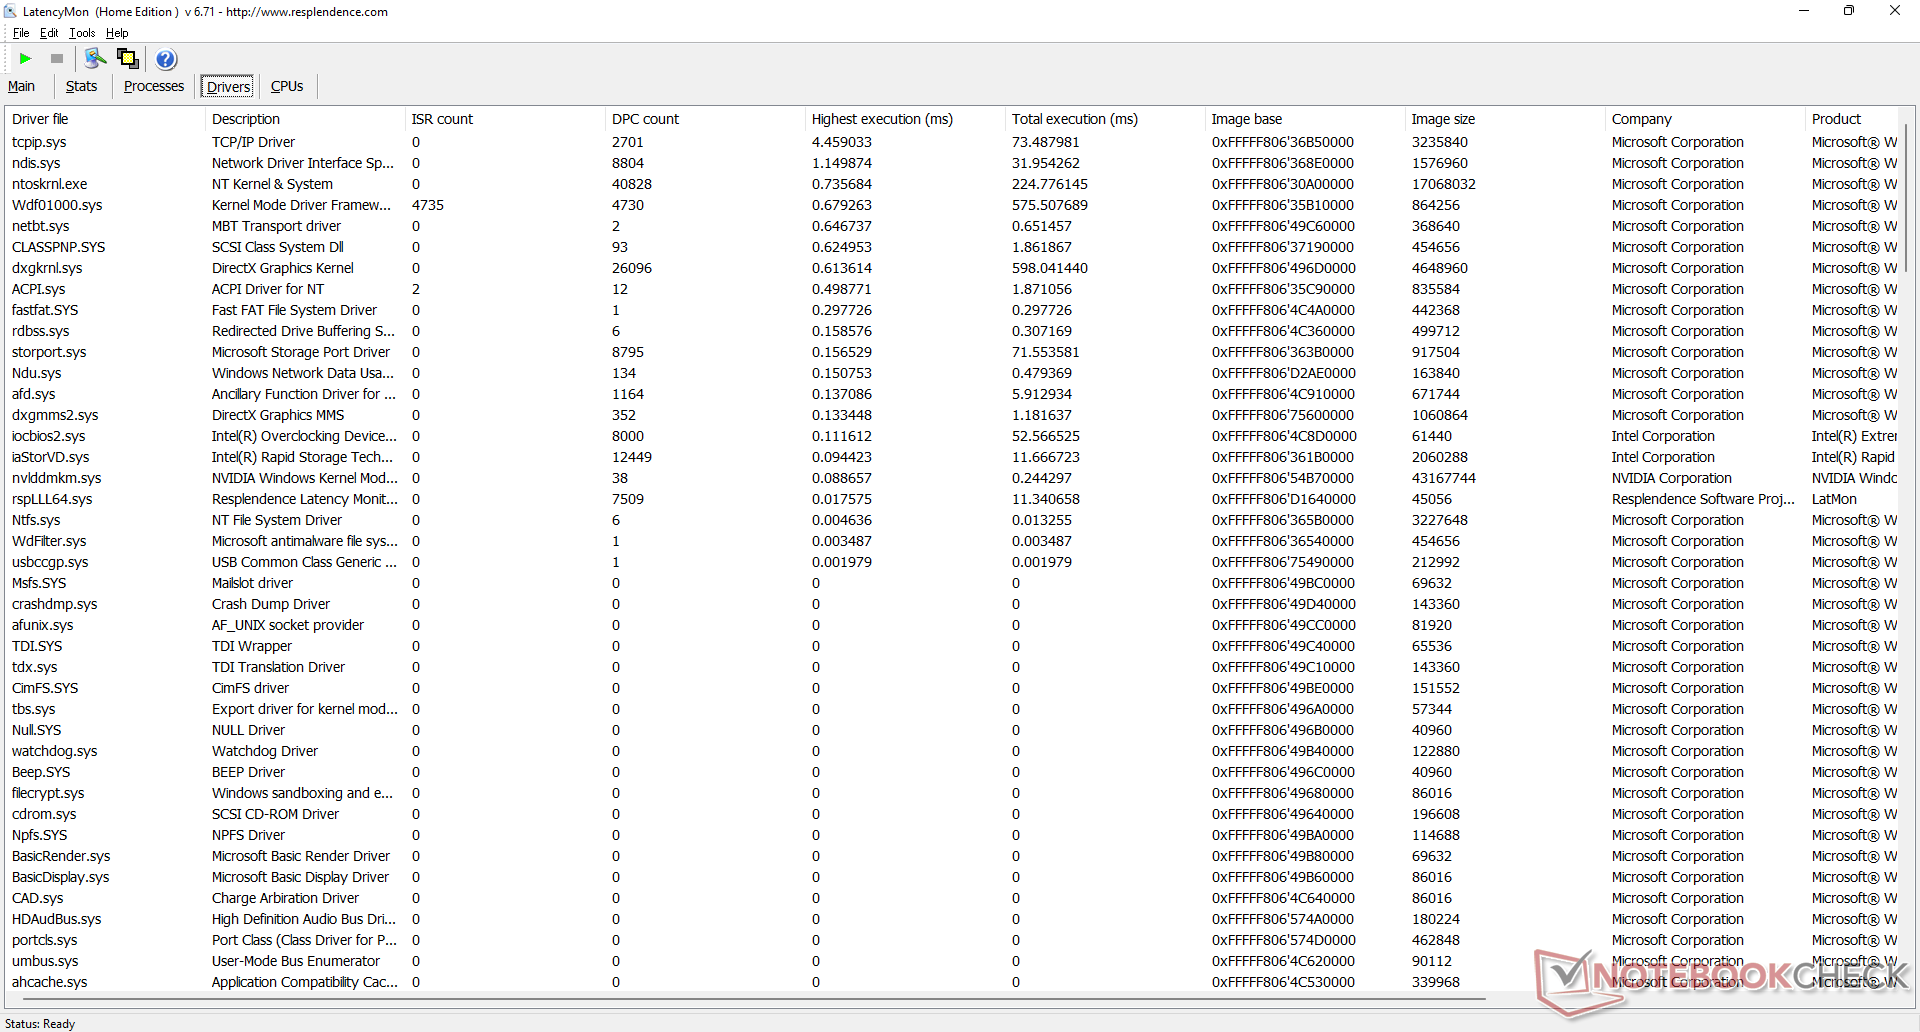
DPC latentie
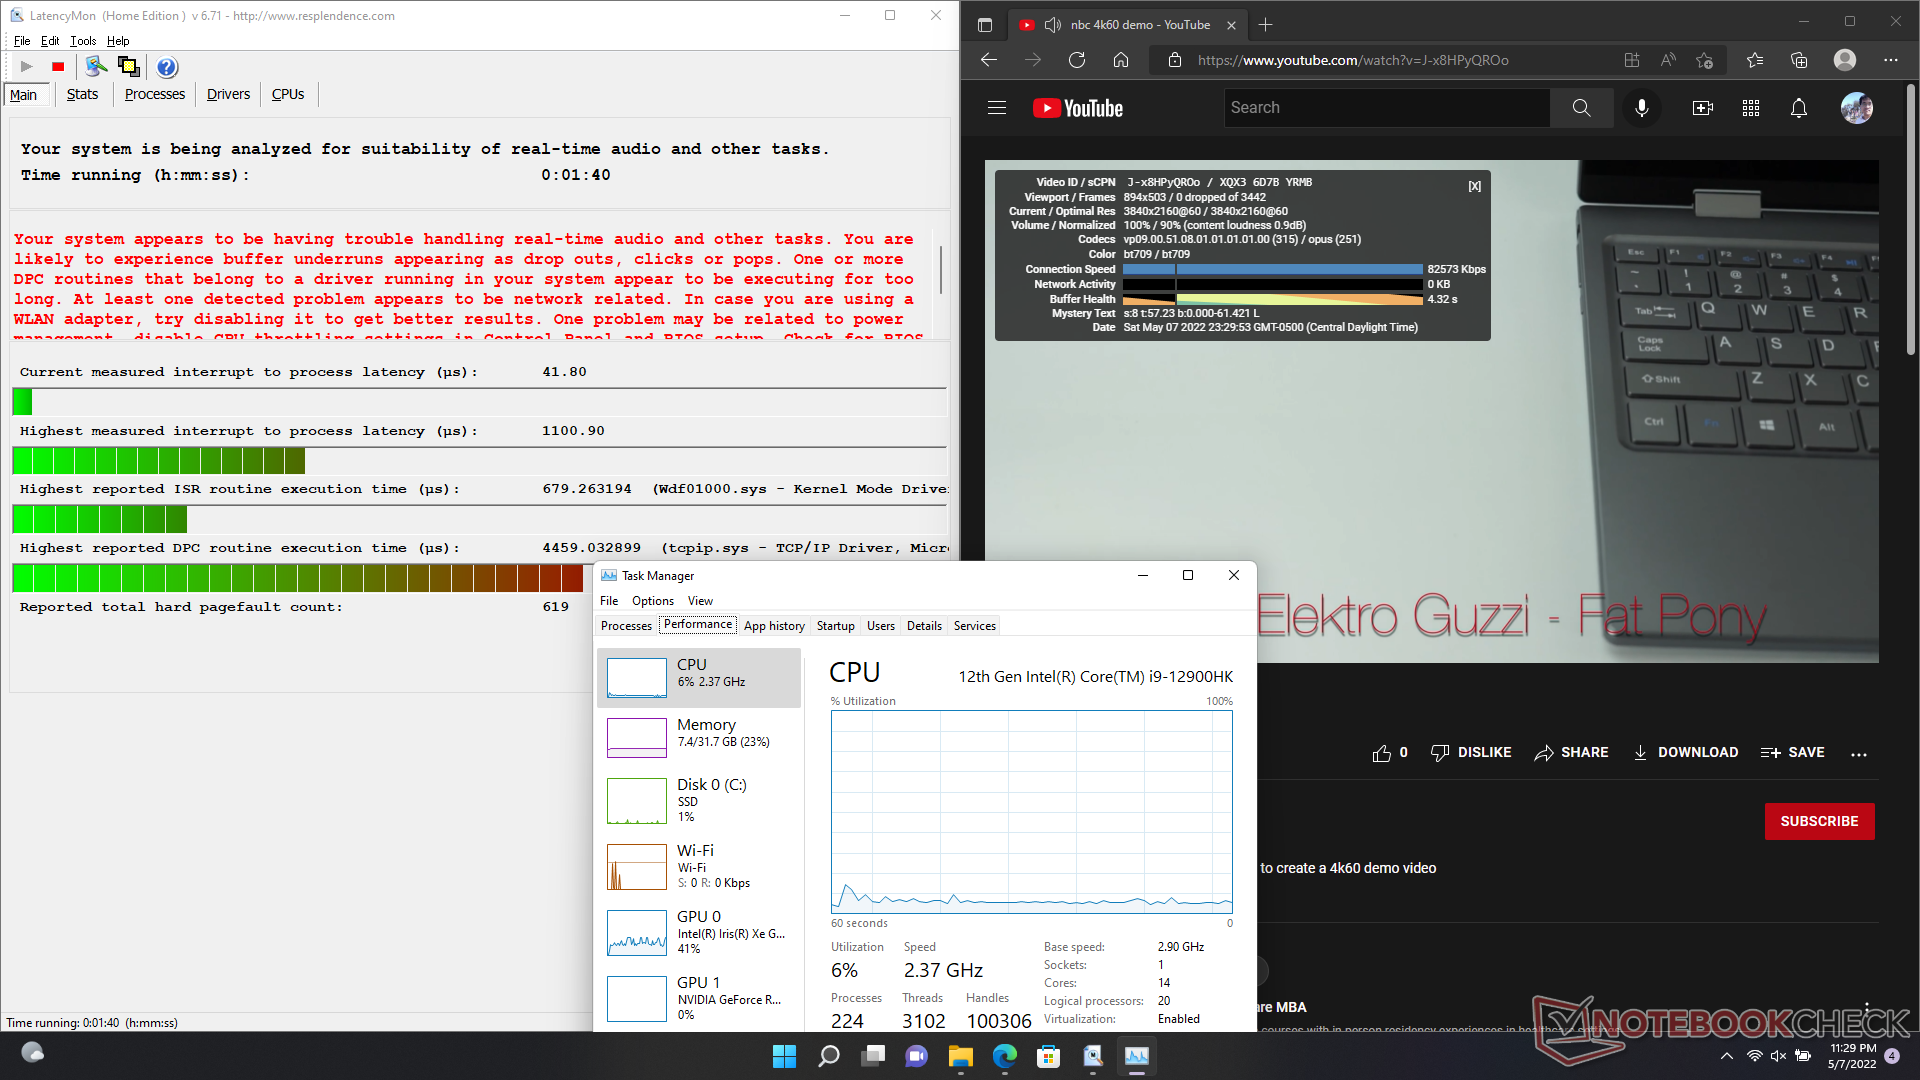
LatencyMon onthult DPC-problemen bij het openen van meerdere browsertabbladen van de startpagina. het afspelen van 4K-video's met 60 FPS verloopt verder vloeiend en zonder dropped frames.
| DPC Latencies / LatencyMon - interrupt to process latency (max), Web, Youtube, Prime95 | |
| MSI GT76 Titan DT 10SGS | |
| Alienware x17 RTX 3080 P48E | |
| MSI Stealth GS77 12UHS-083US | |
| Asus ROG Zephyrus S17 GX703HSD | |
| Alienware x17 R2 P48E | |
| Gigabyte A7 X1 | |
* ... kleiner is beter
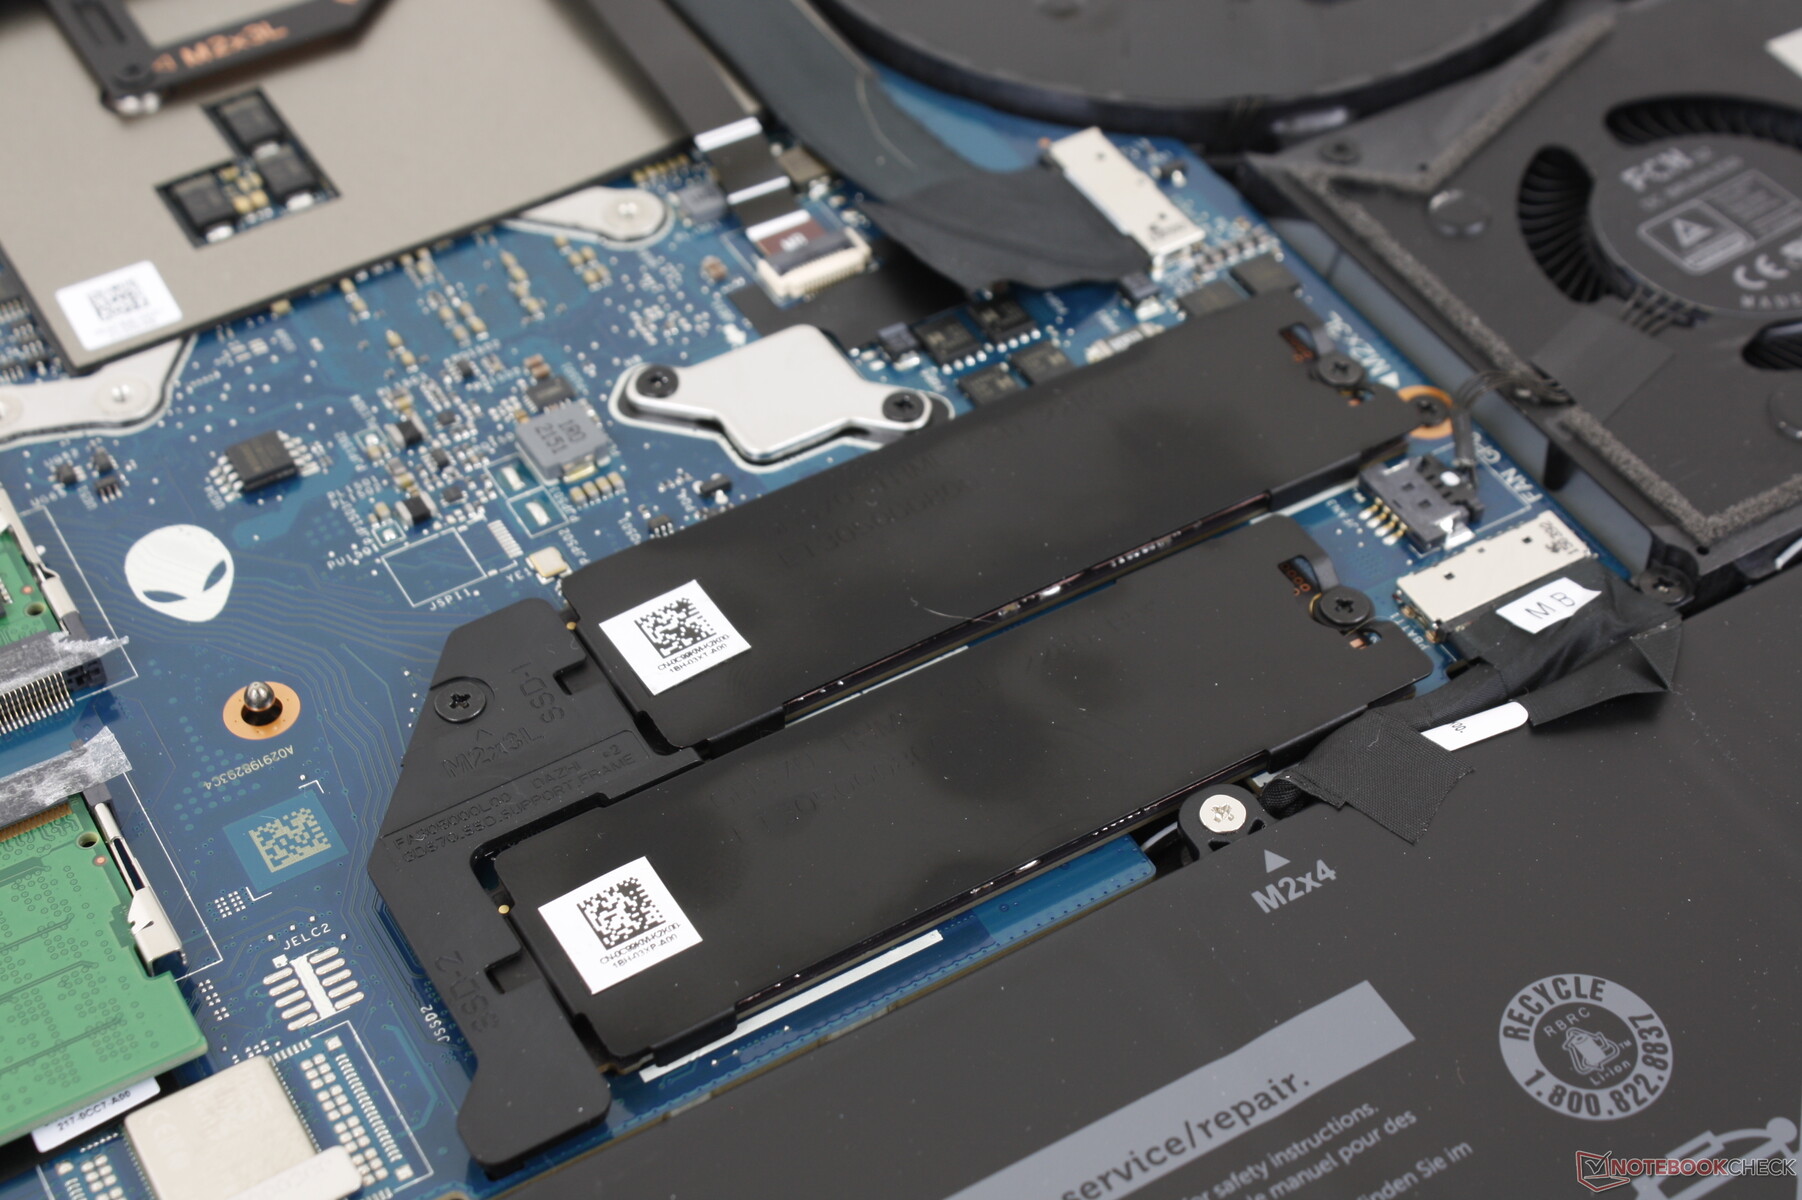
Opslagapparaten
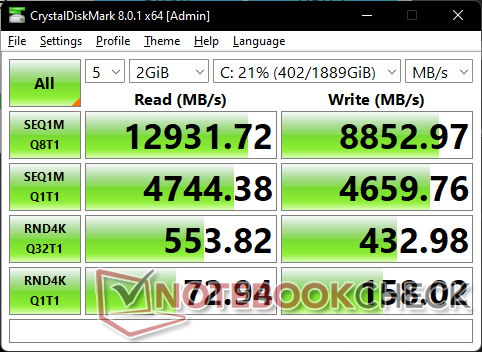
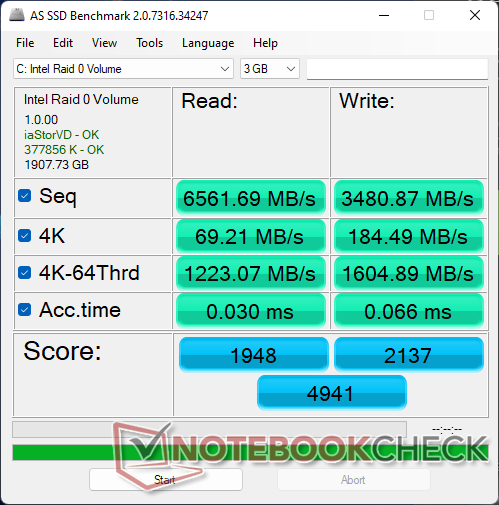

* ... kleiner is beter
Disk Throttling: DiskSpd Read Loop, Queue Depth 8
GPU prestatie
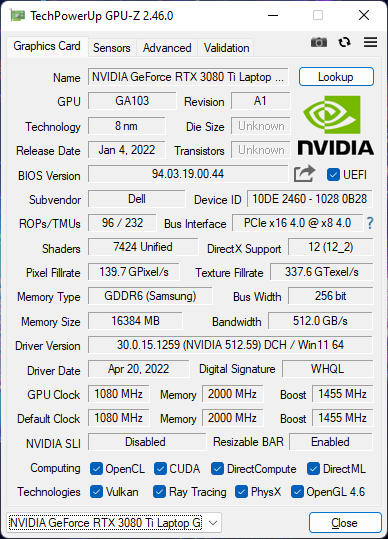
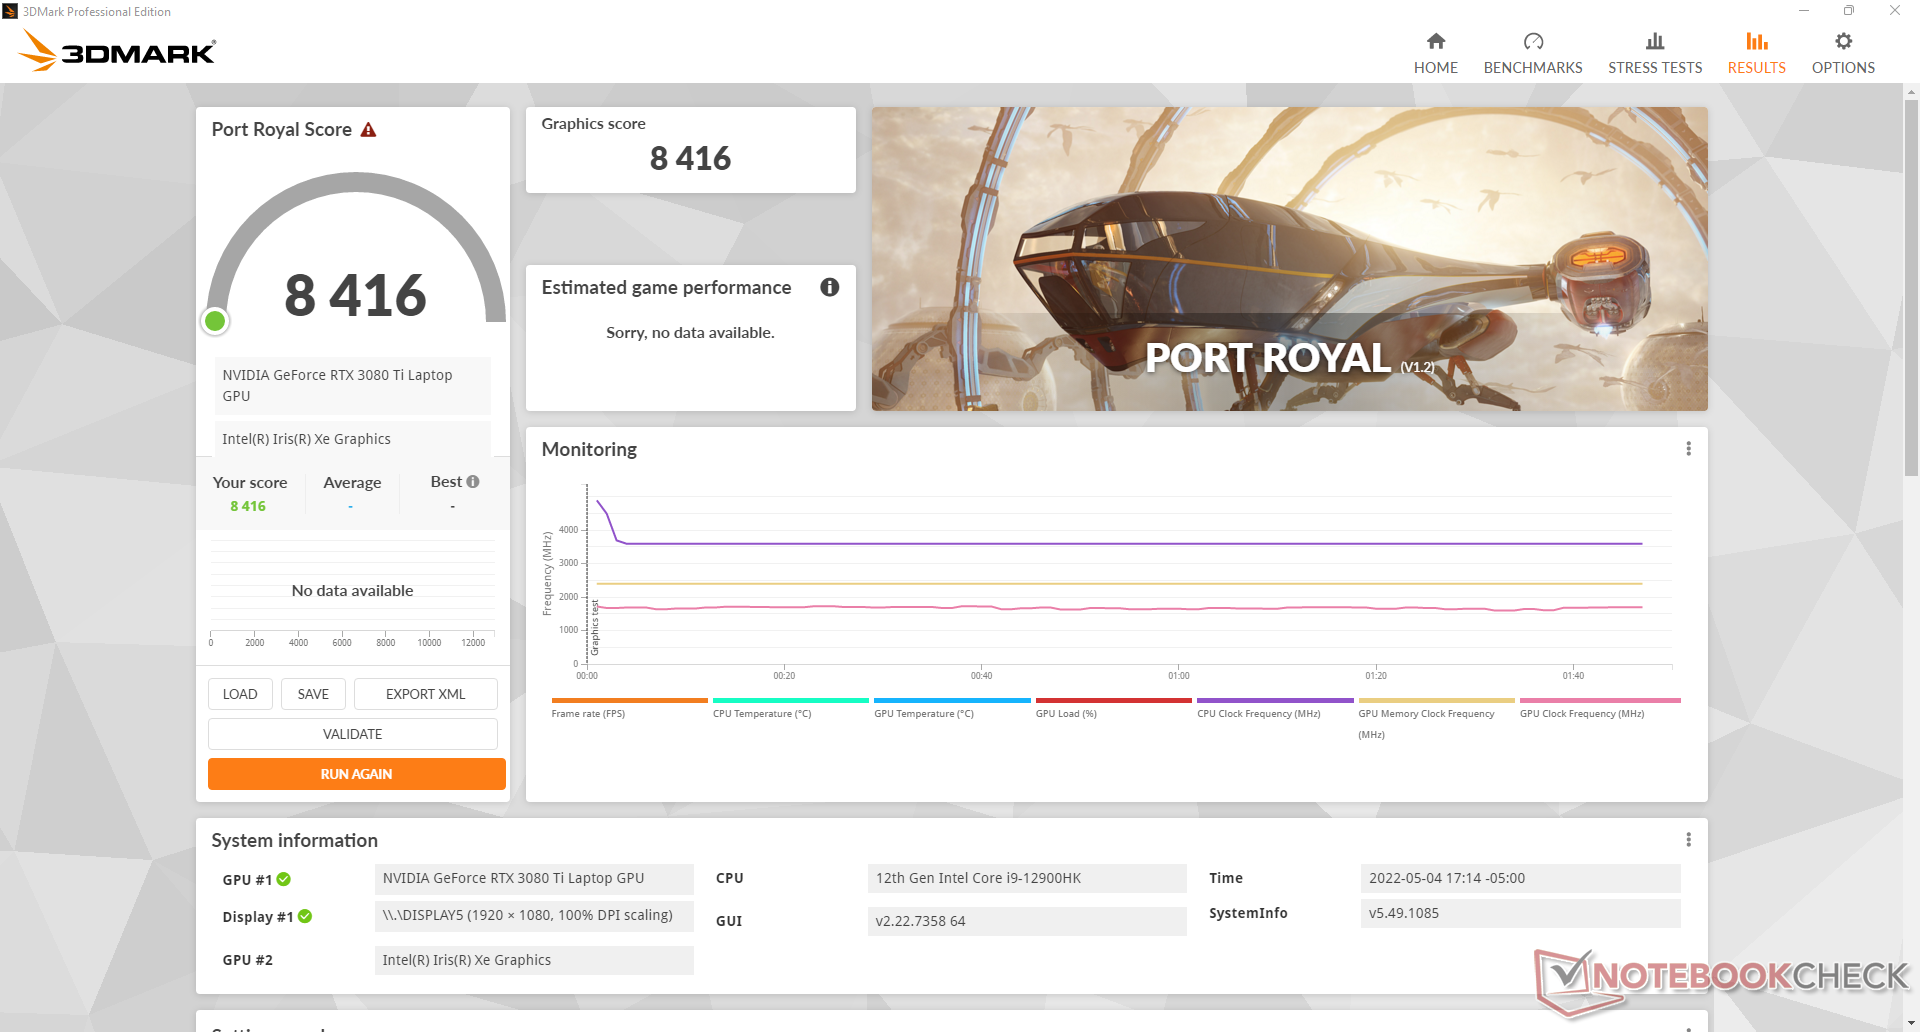
Met zijn zeer hoge TGP-doelstelling van 175 W zijn de grafische prestaties een van de snelste op elke gaming laptop. De 2022 Razer Blade 15, bijvoorbeeld, wordt geleverd met dezelfde GeForce RTX 3080 Ti GPU, zij het met een lager 110 W TGP-doel voor 25 tot 30 procent tragere prestaties. Vergelijkbare tekortkomingen kunnen worden waargenomen wanneer de GPU in de Alienware wordt vergeleken met dezelfde GPU in de MSI GS77 ook. In combinatie met de sneller dan gemiddelde CPU, kunnen gebruikers framerates verwachten die iets hoger liggen dan die van de meeste andere gaming laptops uitgerust met GeForce RTX 3080 graphics.
De mobiele RTX 3080 Ti in onze Alienware x17 R2 is het meest vergelijkbaar met de desktop GeForce RTX 3070. A desktop RTX 3080 Ti kan nog steeds bijna 50 procent snellere prestaties bieden dan onze mobiele Alienware-versie.
Houd er rekening mee dat de grafische prestaties langzamer zijn als je werkt op de Balanced-modus in plaats van de maximale ventilator-modus. Fire Strike De grafische score zou ongeveer 8 tot 9 procent lager zijn wanneer op het Balanced power profiel.
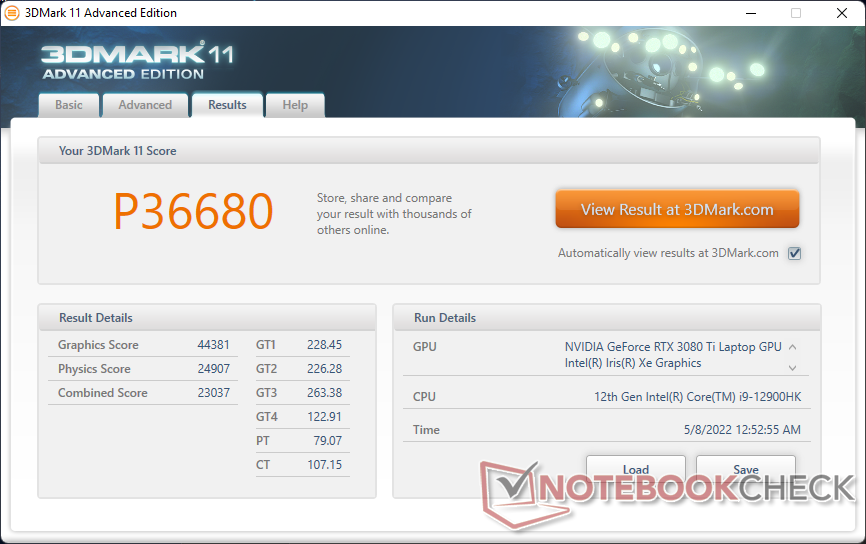
| 3DMark 11 Performance | 36680 punten | |
| 3DMark Cloud Gate Standard Score | 63911 punten | |
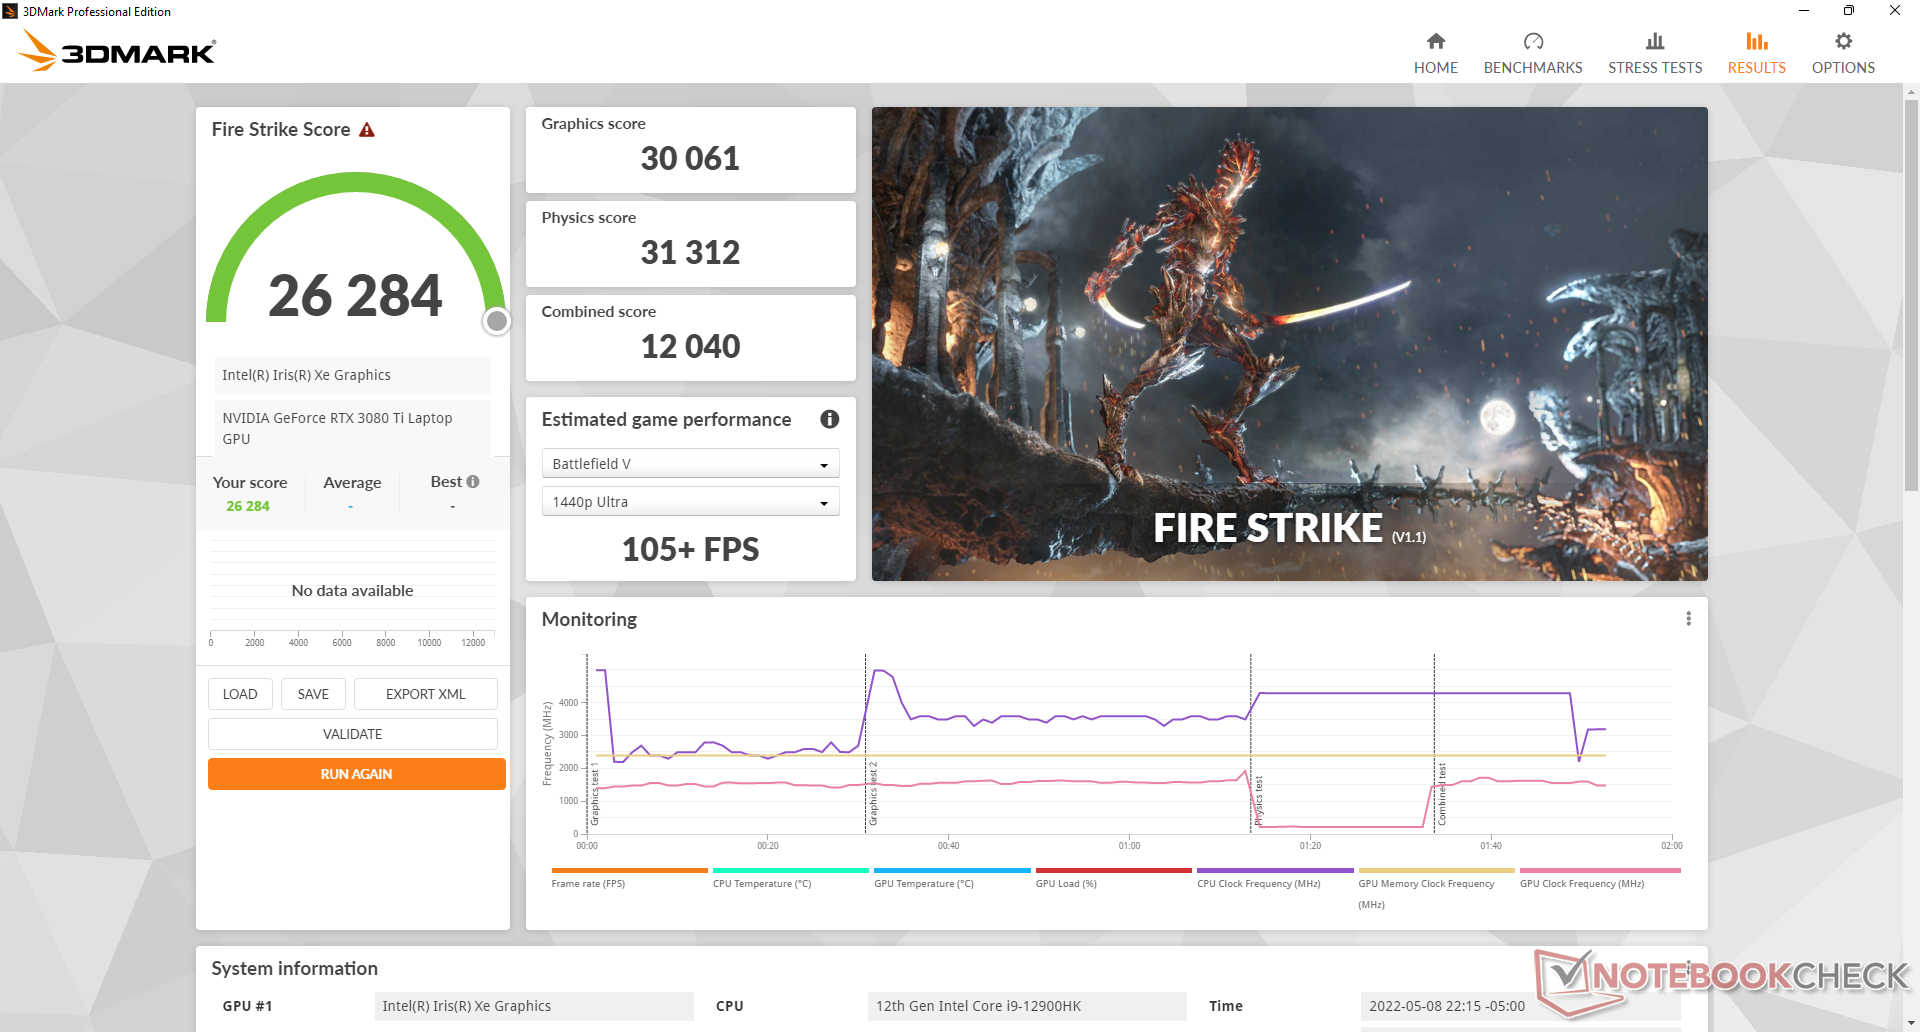
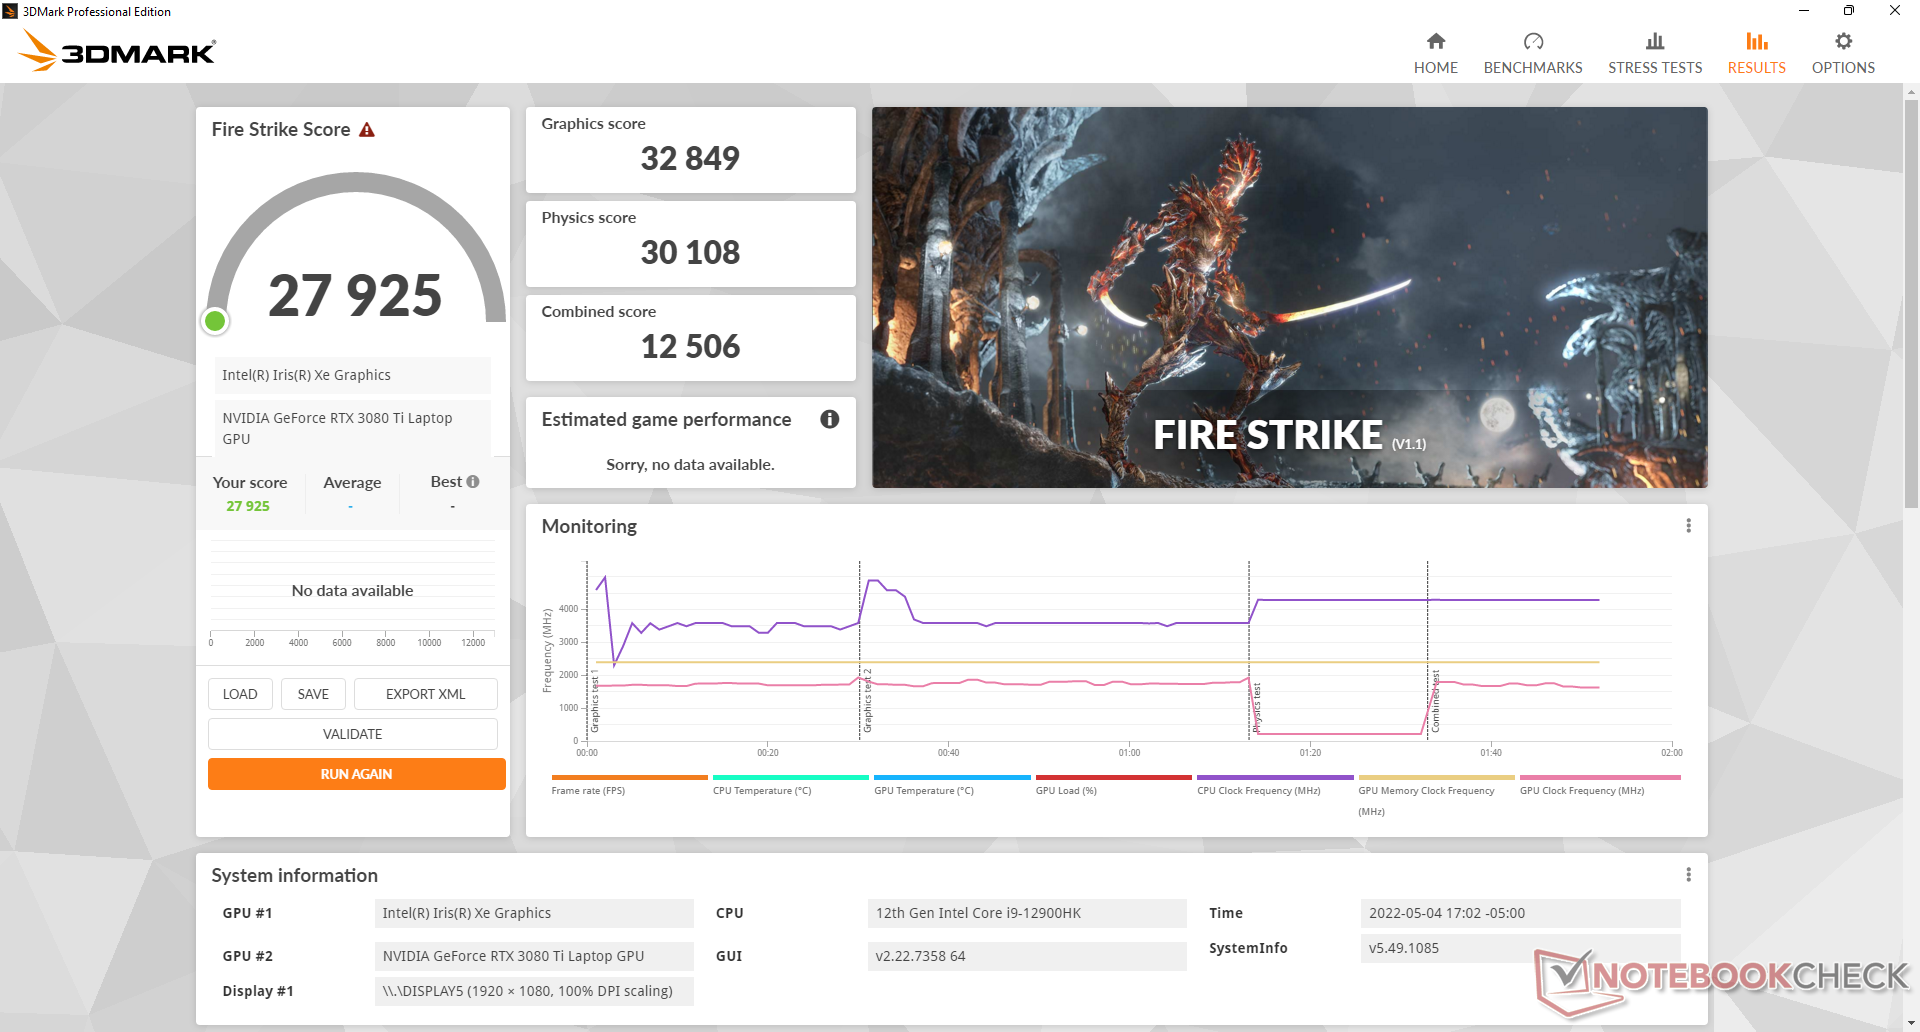
| 3DMark Fire Strike Score | 27925 punten | |
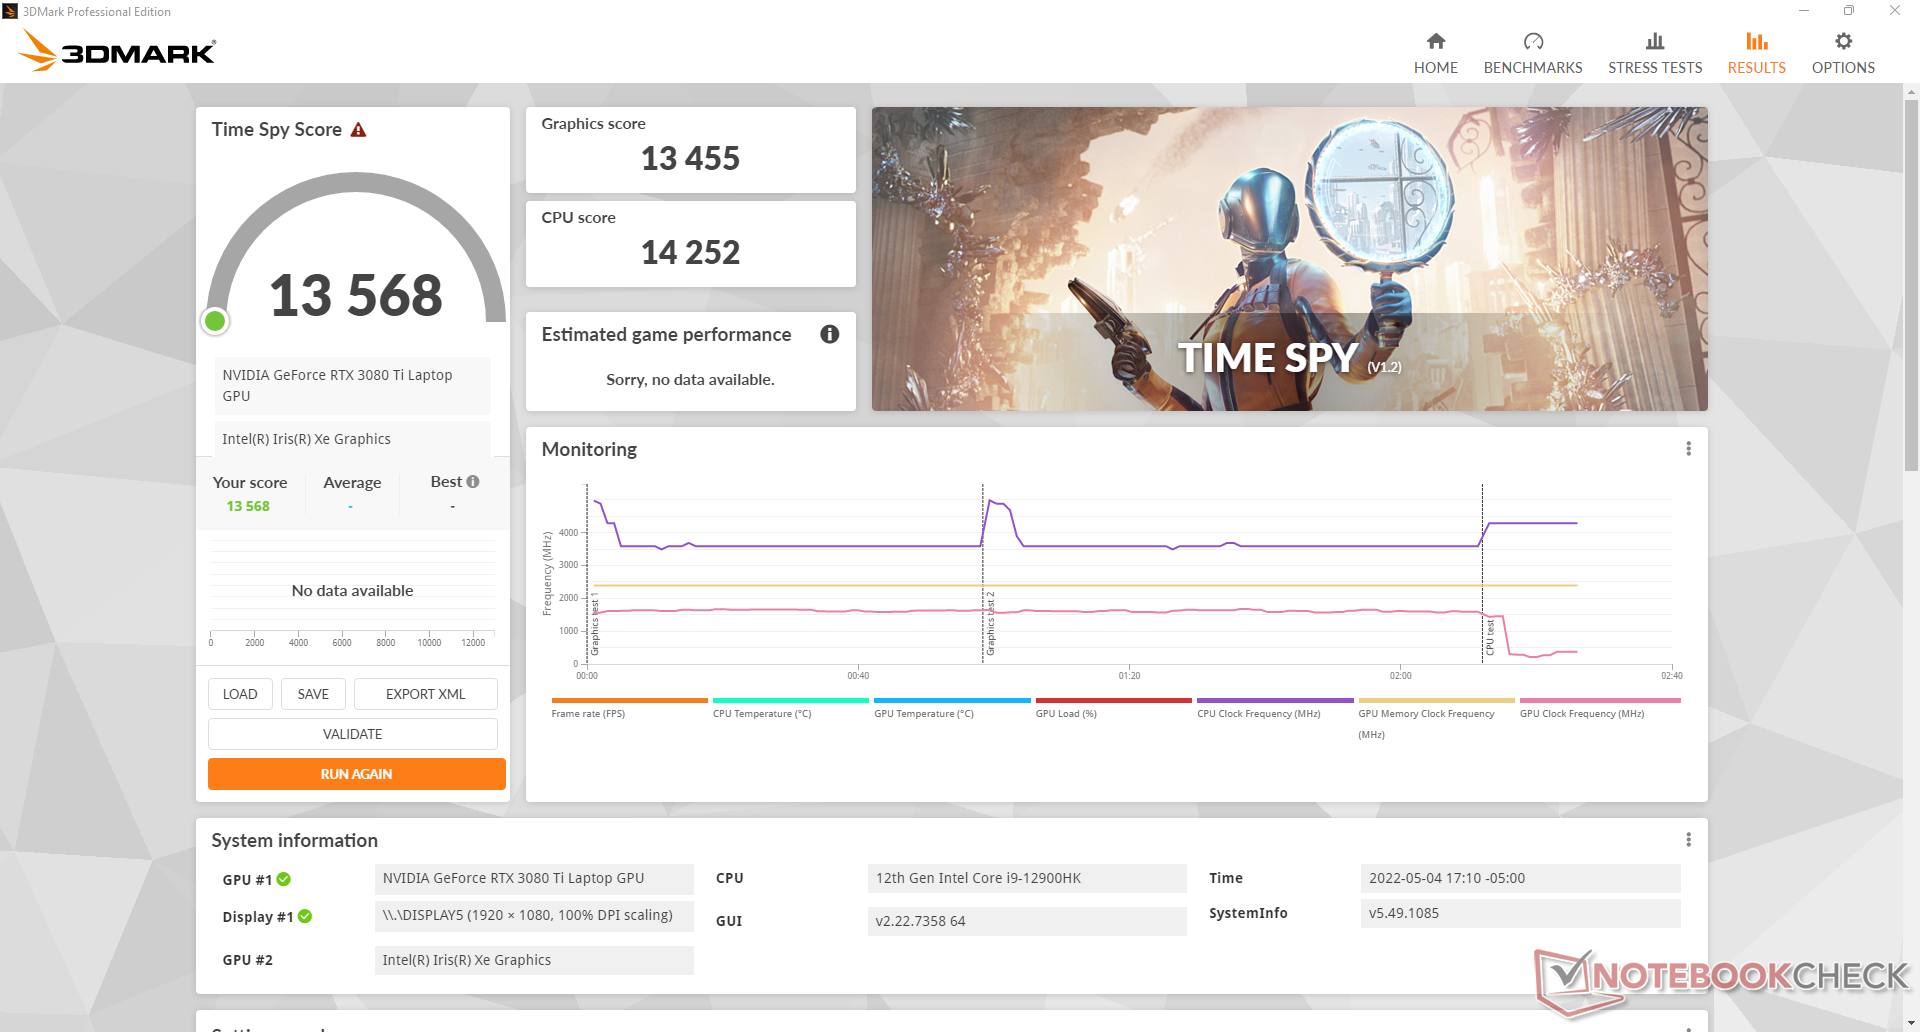
| 3DMark Time Spy Score | 13568 punten | |
Help | ||
Witcher 3 FPS Chart
| lage | gem. | hoge | ultra | |
|---|---|---|---|---|
| GTA V (2015) | 187 | 185.1 | 180.8 | 126.3 |
| The Witcher 3 (2015) | 500.9 | 388.5 | 267.7 | 128 |
| Dota 2 Reborn (2015) | 186.1 | 172.3 | 166.6 | 158.9 |
| Final Fantasy XV Benchmark (2018) | 215 | 167.8 | 127.8 | |
| X-Plane 11.11 (2018) | 161 | 143.9 | 112.9 | |
| Strange Brigade (2018) | 474 | 300 | 243 | 213 |
| Cyberpunk 2077 1.6 (2022) | 167.7 | 142 | 116.2 | 115.7 |
Emissies
Systeemgeluid
Het geluid van de ventilator is afhankelijk van de instellingen van het Alienware Command Center. De ventilatoren van de Alienware hebben de neiging regelmatig te pulseren wanneer ze op Balanced mode of hoger staan, dus wordt de stille modus aangeraden tijdens het browsen, e-mailen of streamen. Ons apparaat zou zelden meer dan 32 dB(A) produceren wanneer het zulke weinig veeleisende belastingen uitvoert, zodat het wel merkbaar is, maar niet storend.
Bij gamen in de gebalanceerde modus stabiliseert het ventilatorgeluid zich rond 43,3 dB(A) tegenover 52,5 dB(A) in de maximale ventilatormodus. Gebruikers zullen wellicht willen gamen op de gebalanceerde modus voor het aanzienlijk stillere ventilatorgeluid, ondanks het eerder genoemde tekort aan prestaties dat dit met zich meebrengt.
Geluidsniveau
| Onbelast |
| 23.1 / 23.1 / 23.1 dB (A) |
| Belasting |
| 31.9 / 52.5 dB (A) |
 | ||
30 dB stil 40 dB(A) hoorbaar 50 dB(A) luid |
||
min: | ||
| Alienware x17 R2 P48E GeForce RTX 3080 Ti Laptop GPU, i9-12900HK, 2x Samsung PM9A1 1TB (RAID 0) | Alienware x17 RTX 3080 P48E GeForce RTX 3080 Laptop GPU, i7-11800H, 2x WDC PC SN730 SDBPNTY-1T00 (RAID 0) | Asus ROG Zephyrus S17 GX703HSD GeForce RTX 3080 Laptop GPU, i9-11900H, Samsung PM9A1 MZVL22T0HBLB | MSI Stealth GS77 12UHS-083US GeForce RTX 3080 Ti Laptop GPU, i7-12700H, Micron 3400 1TB MTFDKBA1T0TFH | MSI GT76 Titan DT 10SGS GeForce RTX 2080 Super Mobile, i9-10900K, 2x WDC PC SN730 SDBPNTY-1T00 (RAID 0) | Gigabyte A7 X1 GeForce RTX 3070 Laptop GPU, R9 5900HX, ESR512GTLCG-EAC-4 | |
|---|---|---|---|---|---|---|
| Noise | -7% | -2% | -8% | -18% | -28% | |
| uit / omgeving * (dB) | 22.7 | 24.9 -10% | 23 -1% | 24.5 -8% | 26.4 -16% | 24 -6% |
| Idle Minimum * (dB) | 23.1 | 24.9 -8% | 23 -0% | 24.5 -6% | 27.5 -19% | 25 -8% |
| Idle Average * (dB) | 23.1 | 24.9 -8% | 23 -0% | 24.5 -6% | 27.5 -19% | 29 -26% |
| Idle Maximum * (dB) | 23.1 | 29.6 -28% | 23 -0% | 30.8 -33% | 29.8 -29% | 35 -52% |
| Load Average * (dB) | 31.9 | 31.1 3% | 41 -29% | 34.6 -8% | 30.9 3% | 58 -82% |
| Witcher 3 ultra * (dB) | 52.5 | 49.7 5% | 45 14% | 46.2 12% | 60.7 -16% | 57 -9% |
| Load Maximum * (dB) | 52.5 | 54.8 -4% | 52 1% | 56.8 -8% | 66.6 -27% | 59 -12% |
* ... kleiner is beter
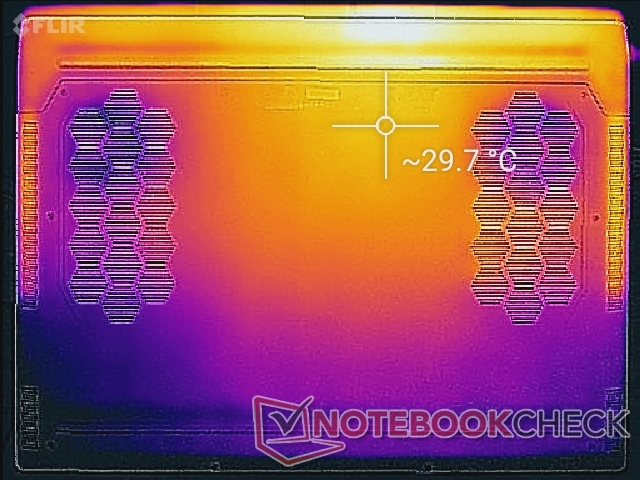
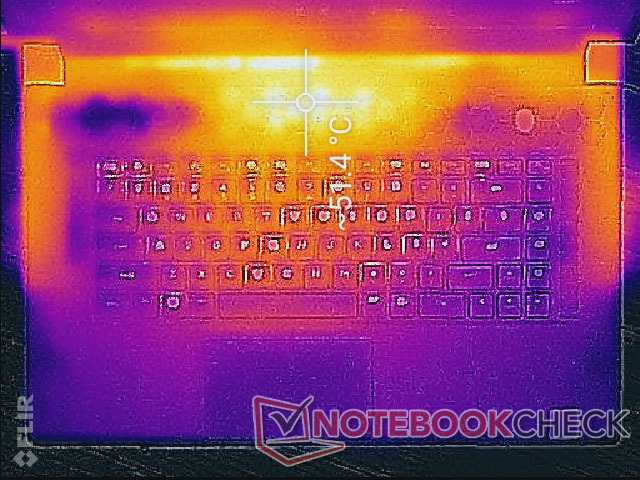
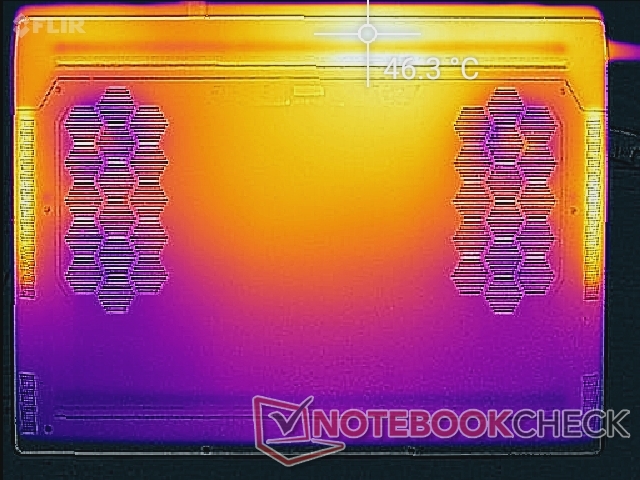
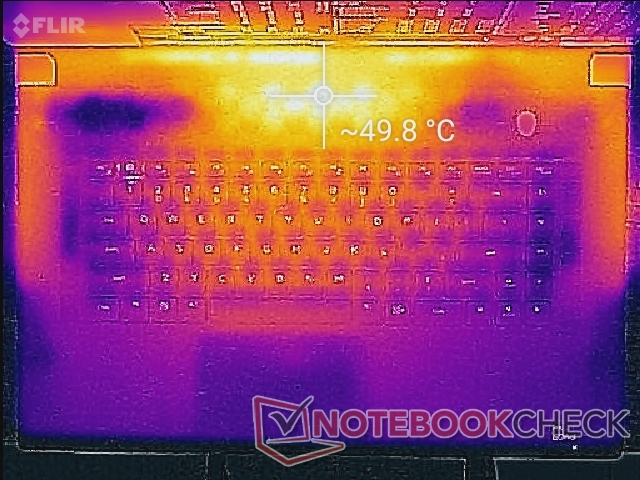
Temperatuur
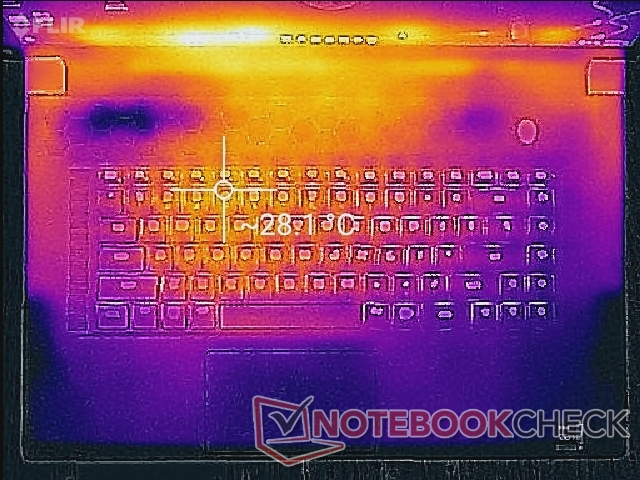
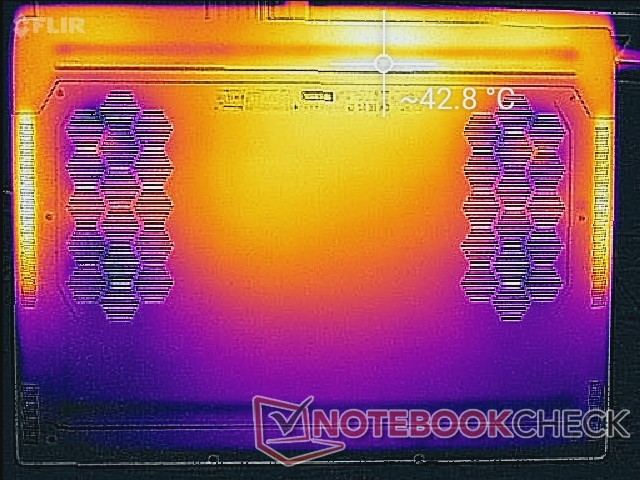
De oppervlaktetemperaturen zijn over het algemeen koeler dan we hadden verwacht, gezien de extreme prestatieniveaus waar Dell op mikt met zo'n dun ontwerp. Hete plekken kunnen oplopen tot meer dan 45 C of 50 C bij hoge belasting, maar deze gebieden bevinden zich aan de achterkant van het chassis en uit de buurt van de toetsen van het toetsenbord en de palmsteunen. Het systeem is warm, maar nooit oncomfortabel warm tijdens het gamen.
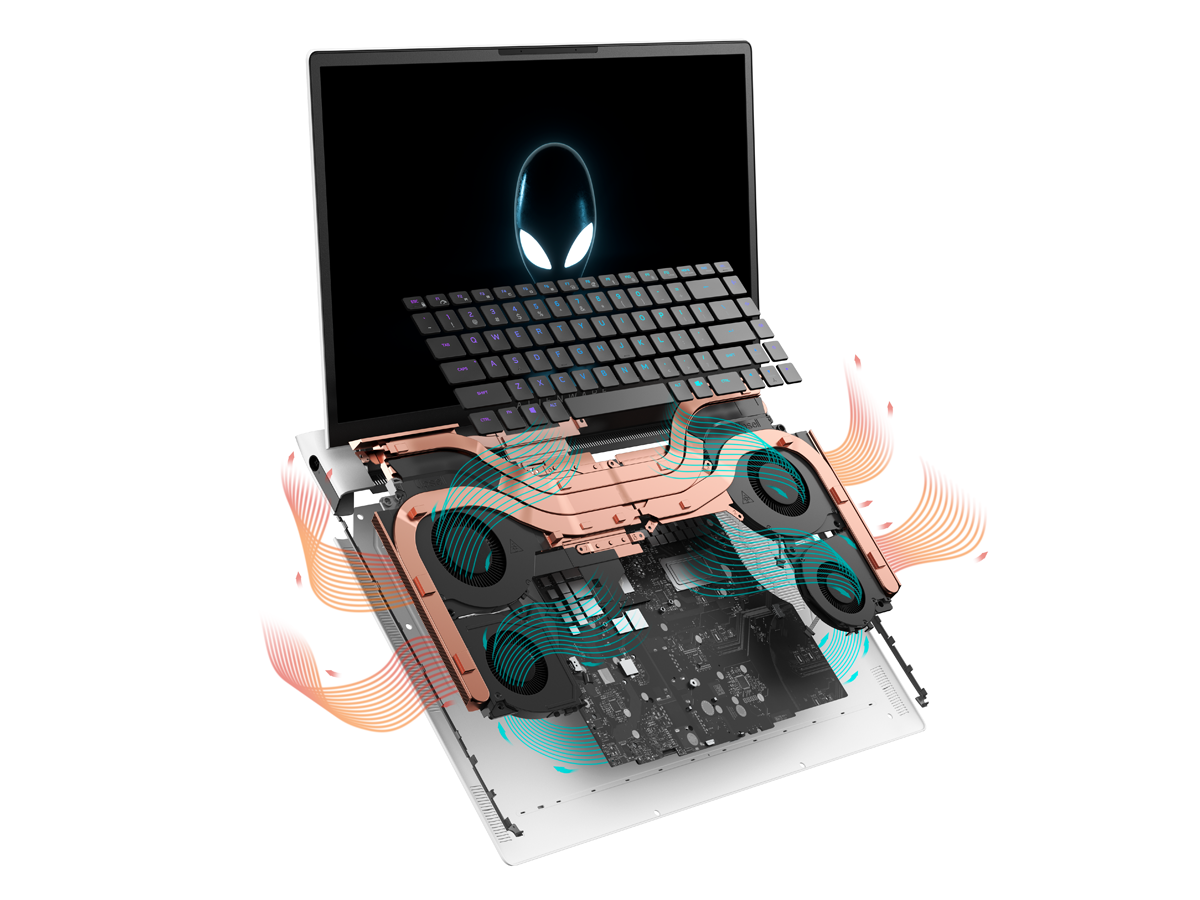
Houd er rekening mee dat er veel ventilatieroosters aan bijna alle kanten van het systeem zitten. Met CPU temperaturen die zo hoog oplopen als onder belasting, is het belangrijk om openingen zo min mogelijk te blokkeren.
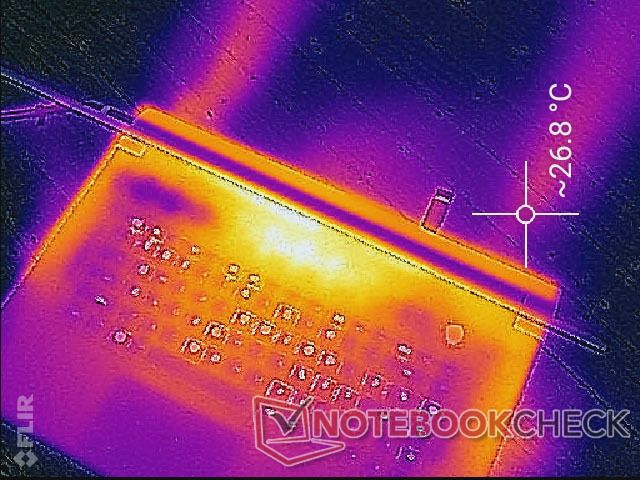
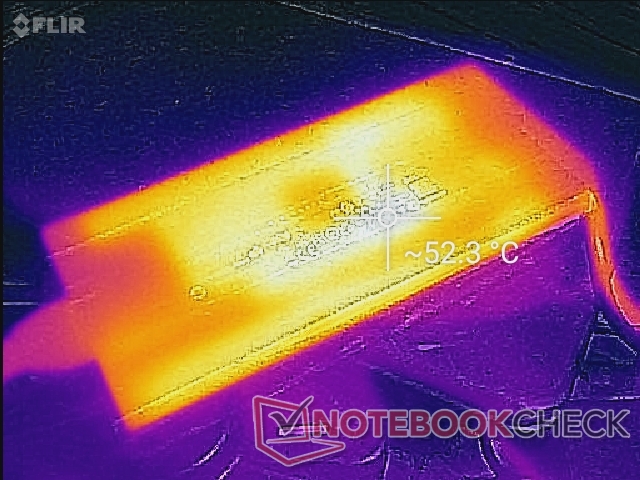
(-) De maximumtemperatuur aan de bovenzijde bedraagt 49.6 °C / 121 F, vergeleken met het gemiddelde van 40.4 °C / 105 F, variërend van 21.2 tot 68.8 °C voor de klasse Gaming.
(±) De bodem warmt op tot een maximum van 42.4 °C / 108 F, vergeleken met een gemiddelde van 43.2 °C / 110 F
(+) Bij onbelast gebruik bedraagt de gemiddelde temperatuur voor de bovenzijde 26.1 °C / 79 F, vergeleken met het apparaatgemiddelde van 33.9 °C / 93 F.
(±) Bij het spelen van The Witcher 3 is de gemiddelde temperatuur voor de bovenzijde 34.7 °C / 94 F, vergeleken met het apparaatgemiddelde van 33.9 °C / 93 F.
(+) De palmsteunen en het touchpad zijn met een maximum van ###max## °C / 84.6 F koeler dan de huidtemperatuur en voelen daarom koel aan.
(±) De gemiddelde temperatuur van de handpalmsteun van soortgelijke toestellen bedroeg 28.8 °C / 83.8 F (-0.4 °C / -0.8 F).
| Alienware x17 R2 P48E Intel Core i9-12900HK, NVIDIA GeForce RTX 3080 Ti Laptop GPU | Alienware x17 RTX 3080 P48E Intel Core i7-11800H, NVIDIA GeForce RTX 3080 Laptop GPU | Asus ROG Zephyrus S17 GX703HSD Intel Core i9-11900H, NVIDIA GeForce RTX 3080 Laptop GPU | MSI Stealth GS77 12UHS-083US Intel Core i7-12700H, NVIDIA GeForce RTX 3080 Ti Laptop GPU | MSI GT76 Titan DT 10SGS Intel Core i9-10900K, NVIDIA GeForce RTX 2080 Super Mobile | Gigabyte A7 X1 AMD Ryzen 9 5900HX, NVIDIA GeForce RTX 3070 Laptop GPU | |
|---|---|---|---|---|---|---|
| Heat | -14% | -18% | -16% | 7% | 2% | |
| Maximum Upper Side * (°C) | 49.6 | 58.4 -18% | 59 -19% | 50.6 -2% | 36.4 27% | 44 11% |
| Maximum Bottom * (°C) | 42.4 | 49 -16% | 53 -25% | 59.6 -41% | 43 -1% | 49 -16% |
| Idle Upper Side * (°C) | 29.2 | 33.6 -15% | 35 -20% | 30 -3% | 28 4% | 27 8% |
| Idle Bottom * (°C) | 32 | 34.6 -8% | 35 -9% | 37.4 -17% | 33.4 -4% | 30 6% |
* ... kleiner is beter
Stresstest
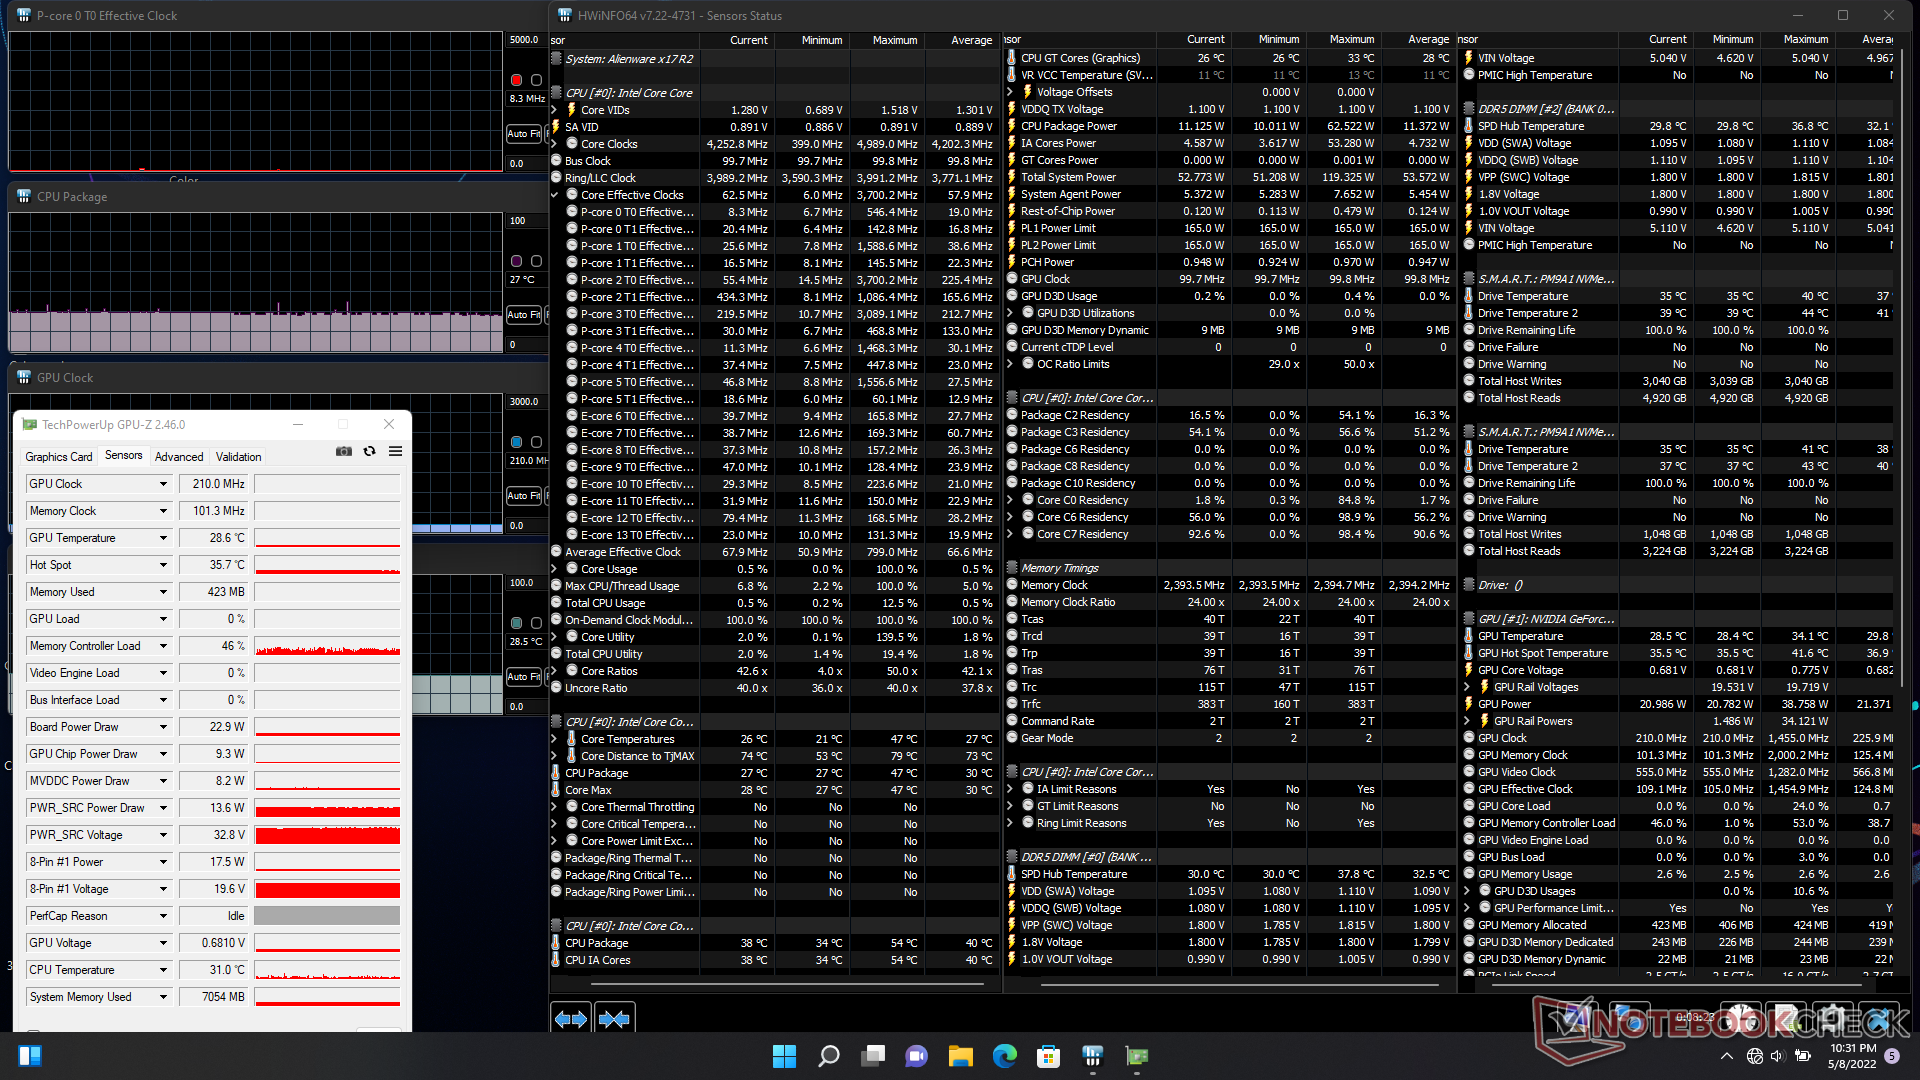
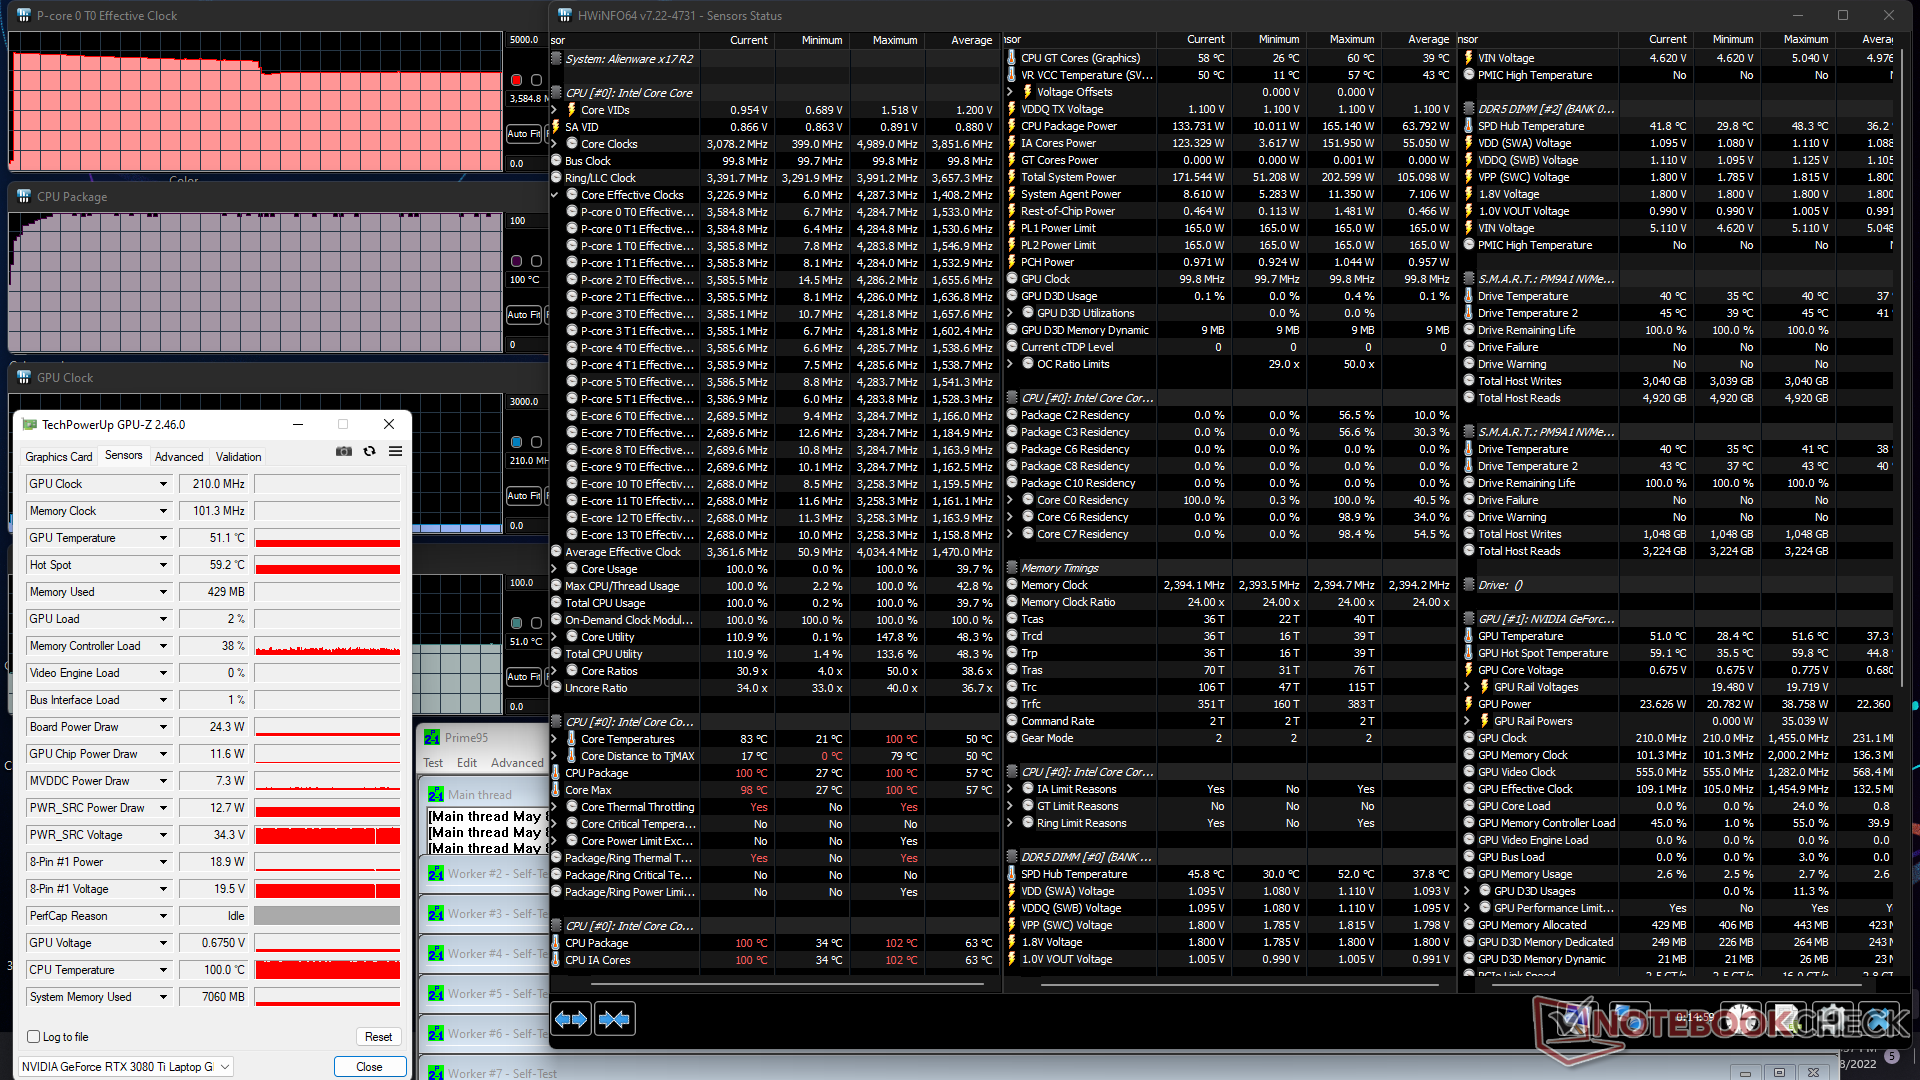
Tijdens het draaien van Prime95, steeg de CPU kloksnelheid naar 4,3 GHz gedurende slechts een paar seconden voordat de kerntemperatuur opliep tot 100 C. De kloksnelheid stabiliseerde zich uiteindelijk op 3,6 GHz terwijl de kerntemperatuur net onder de 100 C bleef. Ondertussen liep het stroomverbruik van het CPU-pakket op tot 165 W tijdens het begin van de test voordat het stabiliseerde op 134 W vanwege thermische beperkingen. Het is duidelijk dat de CPU zo snel en zo goed mogelijk draait binnen de beperkingen van de Alienware koeloplossing. Ter vergelijking, de Core i7-12700H in de MSI GS77 zou stabiliseren op een langzamere 2,7 tot 3 GHz onder vergelijkbare omstandigheden.
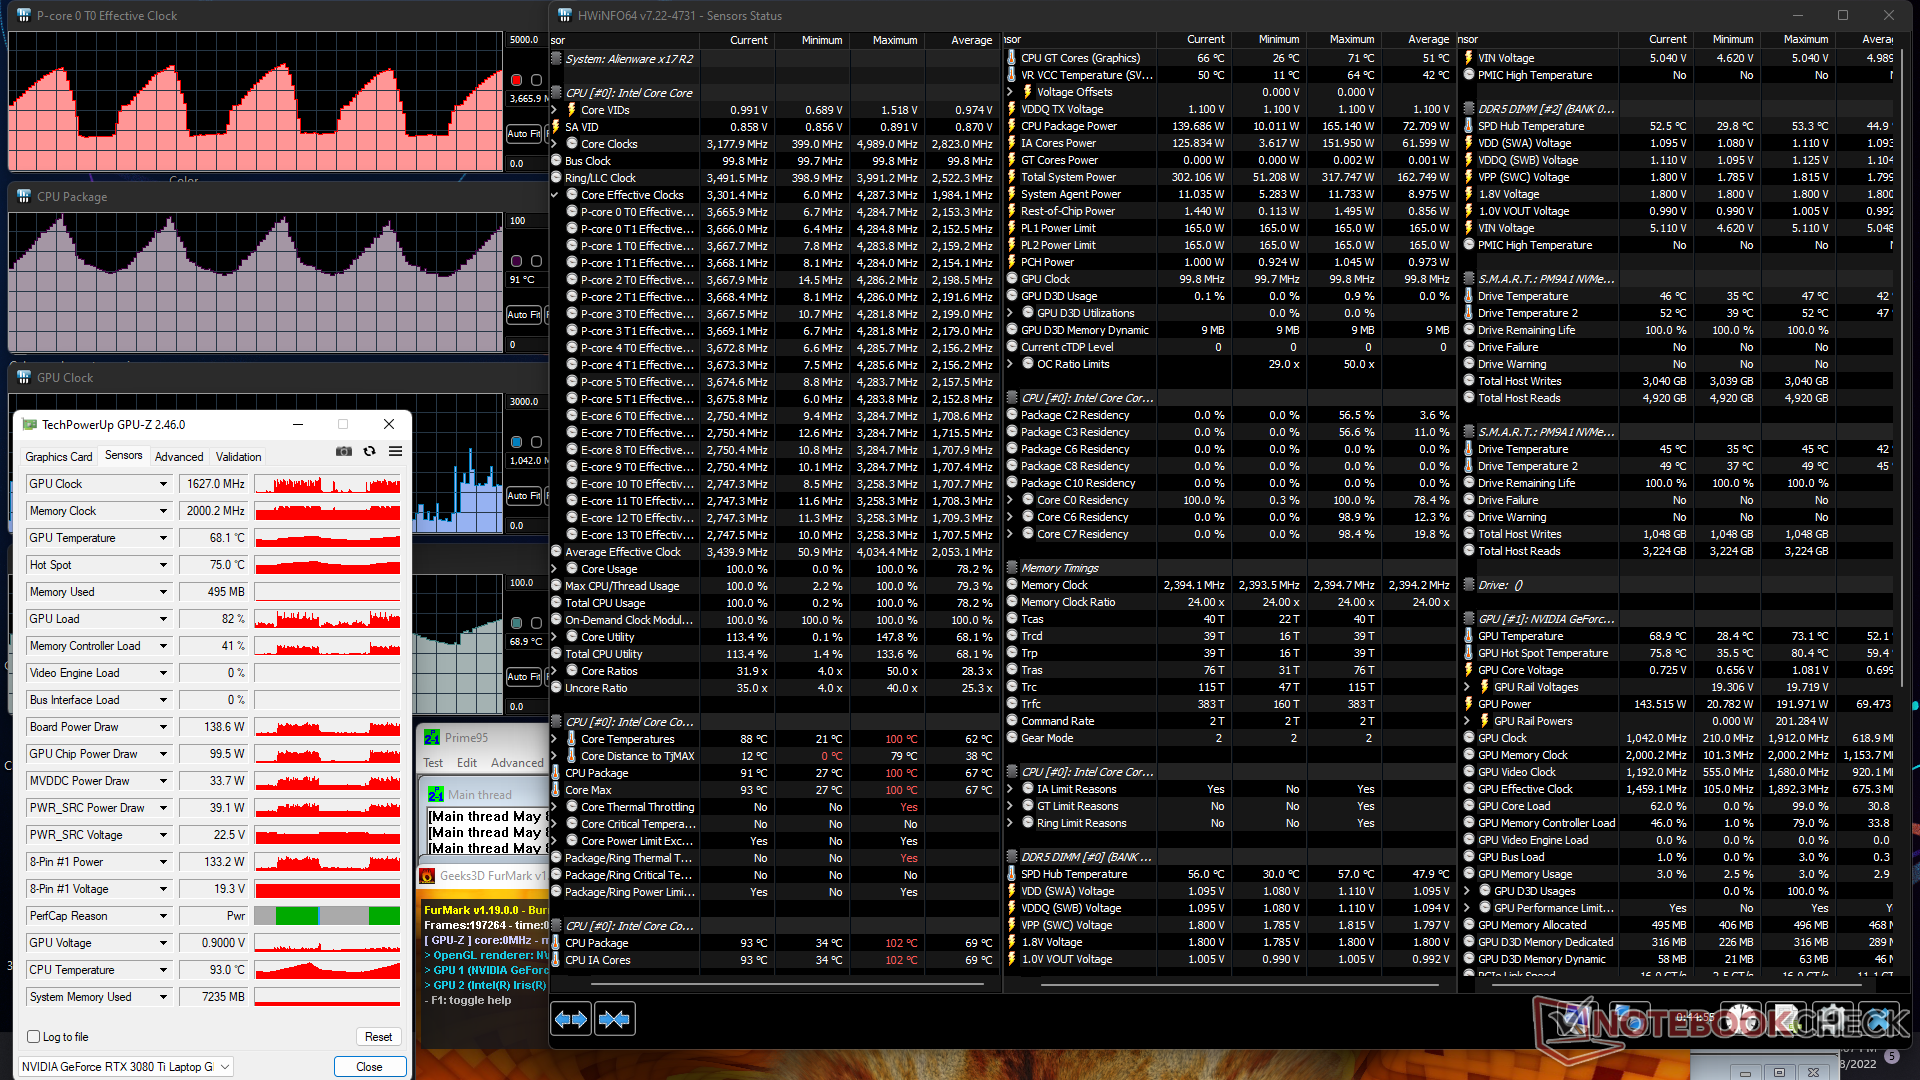
GPU kloksnelheid, geheugenklok en stroomverbruik van het bord zouden stabiliseren op respectievelijk 1695 MHz, 2000 MHz en 167 W, wanneer Witcher 3 op maximale ventilatormodus. In de gebalanceerde modus zouden de GPU-klok en het opgenomen vermogen dalen tot respectievelijk 1477 MHz en 141 W. Gebruikers moeten dus de maximale ventilatormodus verdragen als ze het volledige prestatiepotentieel van de x17 R2 willen benutten. Het uitvoeren van dezelfde test op de MSI GS77 zou resulteren in een langzamere GPU kloksnelheid en geheugenklok van respectievelijk 1432 MHz en 1750 MHz.
Draaien op batterijvoeding zal de prestaties aanzienlijk beperken. Een Fire Strike test op batterijen zou een Natuurkunde en Grafische score opleveren van respectievelijk 27369 en 12095 punten, vergeleken met 30108 en 32849 punten op netstroom.
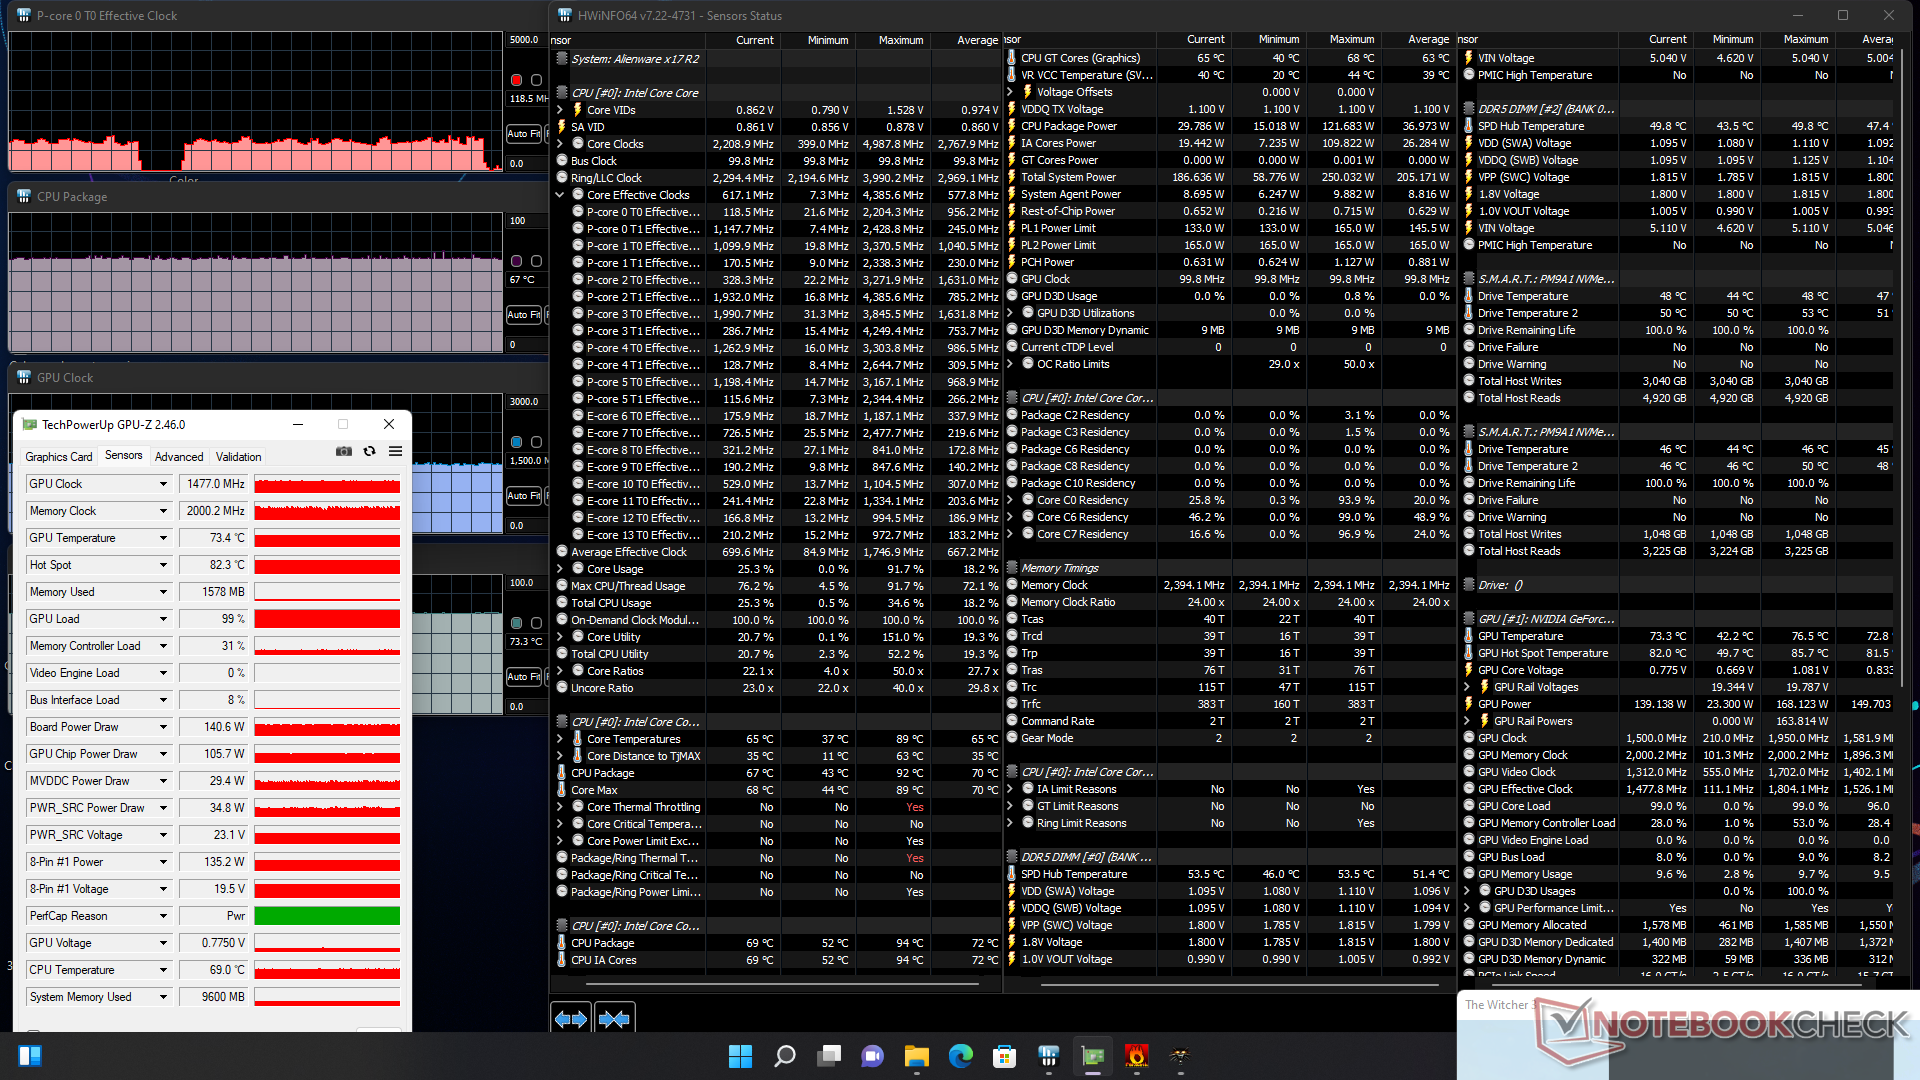
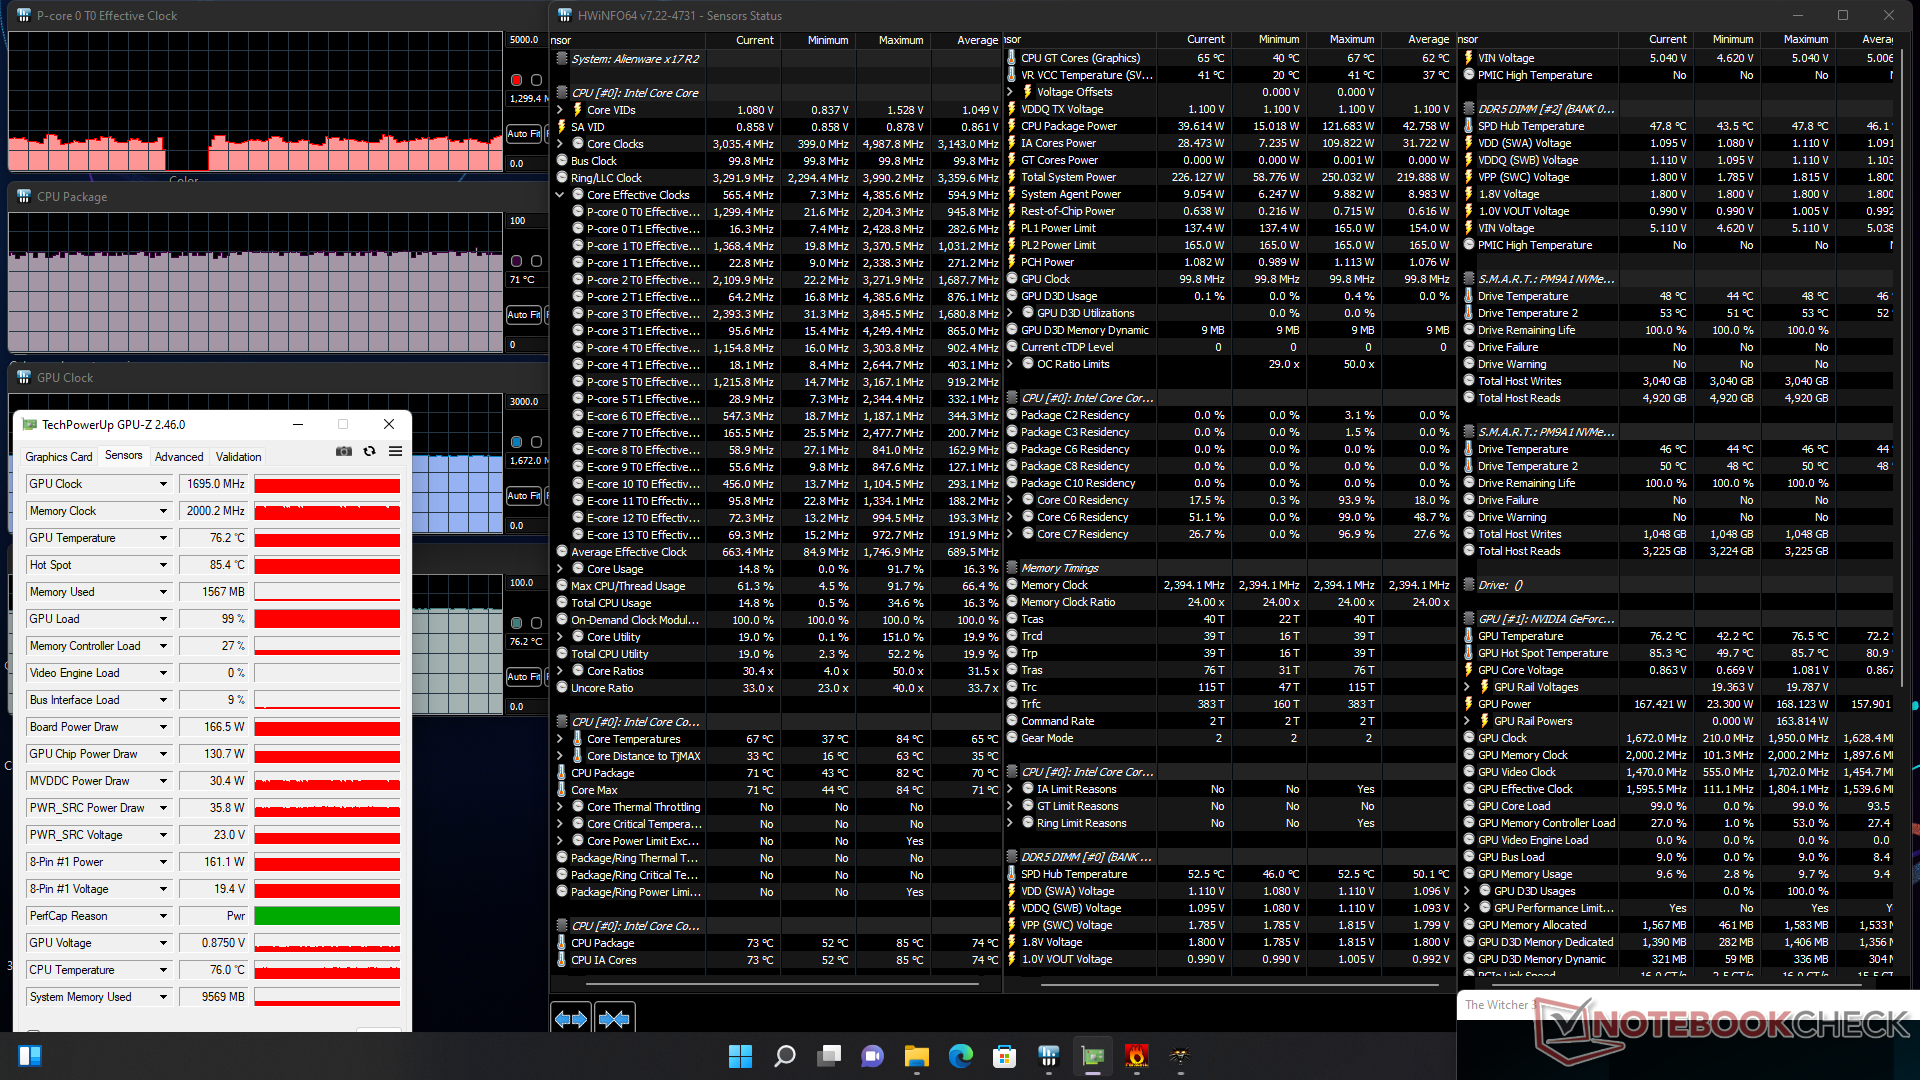
| CPU Klok (GHz) | GPU Klok (MHz) | Gemiddelde CPU Temperatuur (°C) | Gemiddelde GPU Temperatuur (°C) | |
| Systeem in rust (maximale ventilatormodus) | -- | -- | 27 | 29 |
| Prime95 Stress (maximaleventilatormodus) | 3.6 | -- | -- | 100 |
| Prime95 + FurMark Stress (maximale ventilatormodus) | 1.4 - 3.7 | 337 - 1770 | 53 - 100 | 49 - 71 |
| Witcher 3 Stress(gebalanceerde modus) | ~0.6 | 1477 | 67 | 73 |
| Witcher 3 Stress(maximale ventilatormodus) | ~1.3 | 1695 | 71 | 76 |
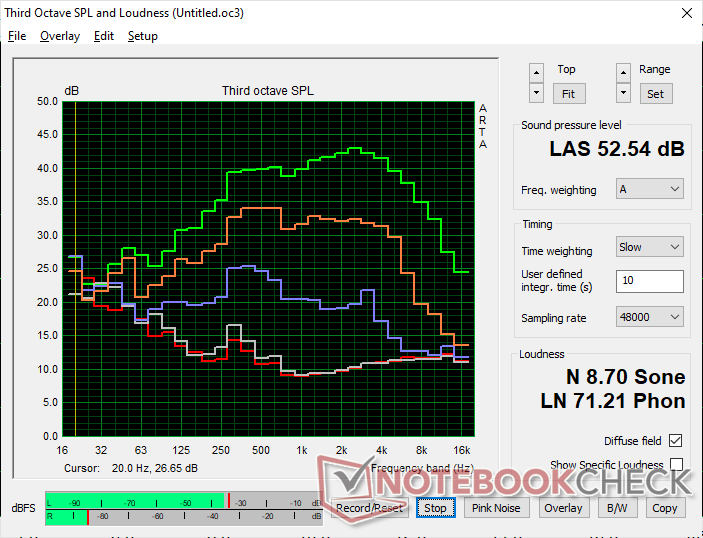
Sprekers
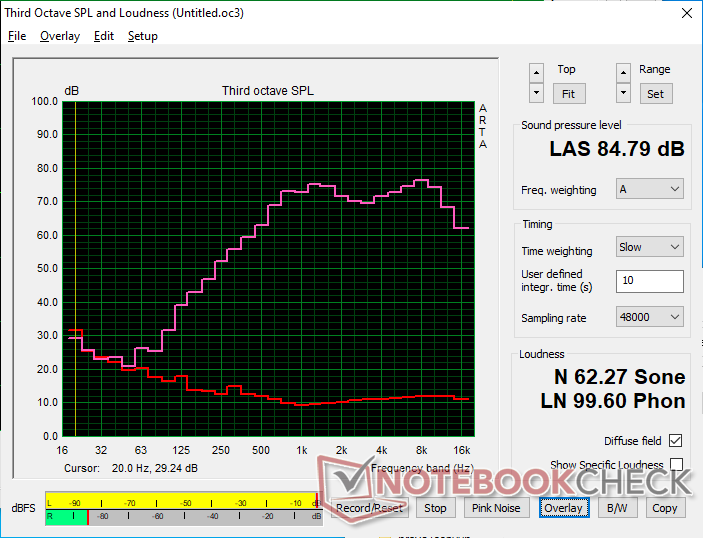
Alienware x17 R2 P48E audioanalyse
(+) | luidsprekers kunnen relatief luid spelen (84.3 dB)
Bas 100 - 315 Hz
(±) | verminderde zeebaars - gemiddeld 9.7% lager dan de mediaan
(+) | de lage tonen zijn lineair (5.5% delta naar de vorige frequentie)
Midden 400 - 2000 Hz
(+) | evenwichtige middens - slechts 1.6% verwijderd van de mediaan
(+) | de middentonen zijn lineair (3% delta ten opzichte van de vorige frequentie)
Hoog 2 - 16 kHz
(±) | higher highs - on average 5% higher than median
(±) | lineariteit van de hoogtepunten is gemiddeld (7.6% delta ten opzichte van de vorige frequentie)
Algemeen 100 - 16.000 Hz
(+) | het totale geluid is lineair (9.3% verschil met de mediaan)
Vergeleken met dezelfde klasse
» 3% van alle geteste apparaten in deze klasse waren beter, 2% vergelijkbaar, 95% slechter
» De beste had een delta van 6%, het gemiddelde was 18%, de slechtste was 132%
Vergeleken met alle geteste toestellen
» 3% van alle geteste apparaten waren beter, 1% gelijk, 96% slechter
» De beste had een delta van 4%, het gemiddelde was 23%, de slechtste was 134%
Apple MacBook Pro 16 2021 M1 Pro audioanalyse
(+) | luidsprekers kunnen relatief luid spelen (84.7 dB)
Bas 100 - 315 Hz
(+) | goede baars - slechts 3.8% verwijderd van de mediaan
(+) | de lage tonen zijn lineair (5.2% delta naar de vorige frequentie)
Midden 400 - 2000 Hz
(+) | evenwichtige middens - slechts 1.3% verwijderd van de mediaan
(+) | de middentonen zijn lineair (2.1% delta ten opzichte van de vorige frequentie)
Hoog 2 - 16 kHz
(+) | evenwichtige hoogtepunten - slechts 1.9% verwijderd van de mediaan
(+) | de hoge tonen zijn lineair (2.7% delta naar de vorige frequentie)
Algemeen 100 - 16.000 Hz
(+) | het totale geluid is lineair (4.6% verschil met de mediaan)
Vergeleken met dezelfde klasse
» 0% van alle geteste apparaten in deze klasse waren beter, 0% vergelijkbaar, 100% slechter
» De beste had een delta van 5%, het gemiddelde was 17%, de slechtste was 45%
Vergeleken met alle geteste toestellen
» 0% van alle geteste apparaten waren beter, 0% gelijk, 100% slechter
» De beste had een delta van 4%, het gemiddelde was 23%, de slechtste was 134%
Energiebeheer
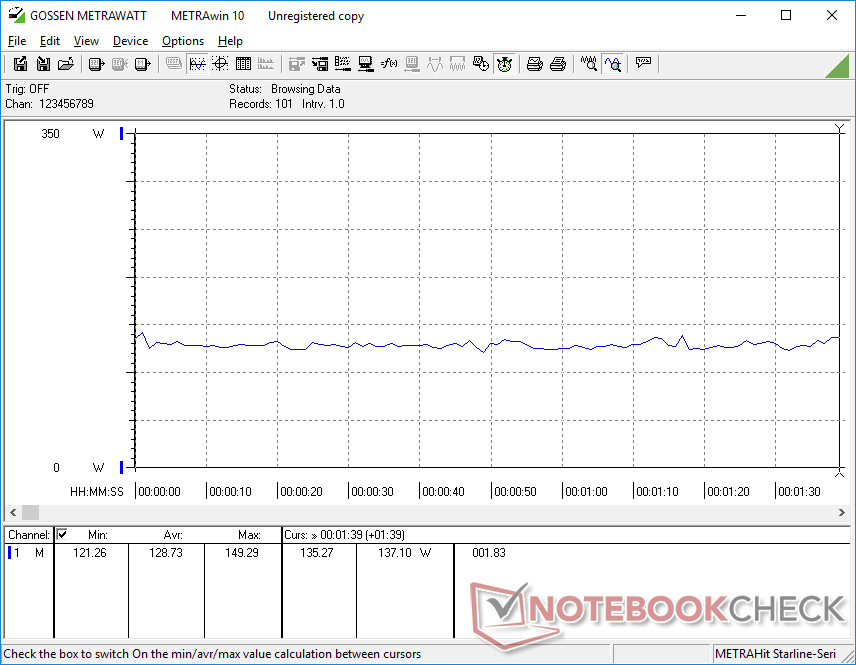
Stroomverbruik
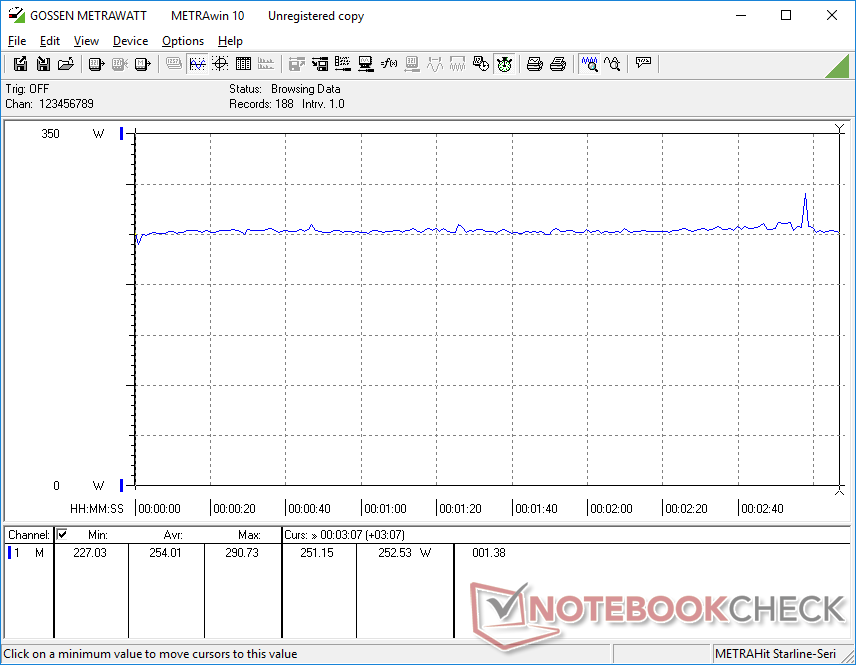
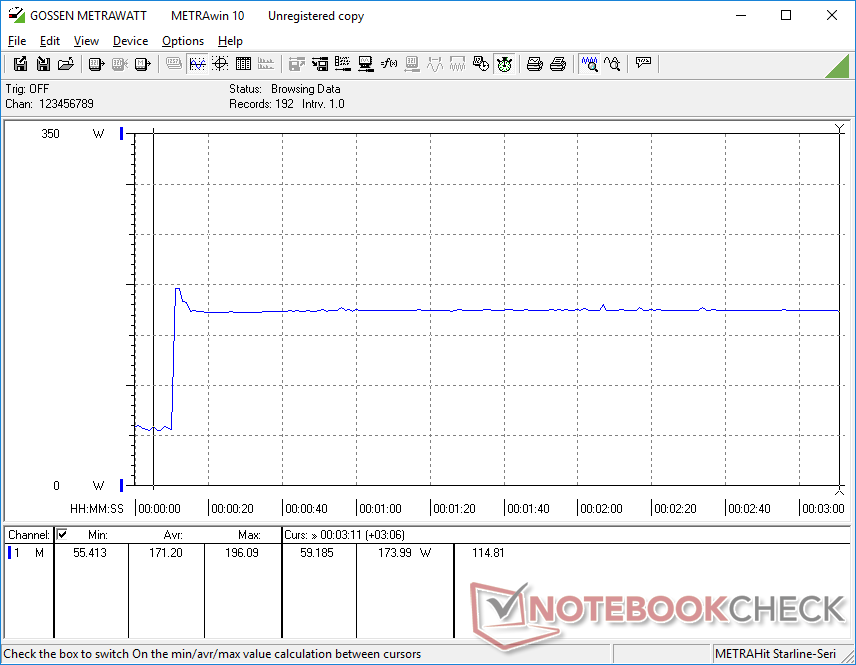
Alienware-laptops hebben altijd al meer energie gevraagd dan concurrerende alternatieven en de x17 R2 is niet anders. Gewoon stationair draaien op het bureaublad kan tot 60 W vragen wanneer het is ingesteld op de modus Hoge prestaties, wat meer is dan de meeste Ultrabooks met U-serie onder belasting. Het zeer hoge verbruik is waarschijnlijk verantwoordelijk voor de slechte batterijlevensduur die in de volgende sectie wordt beschreven.
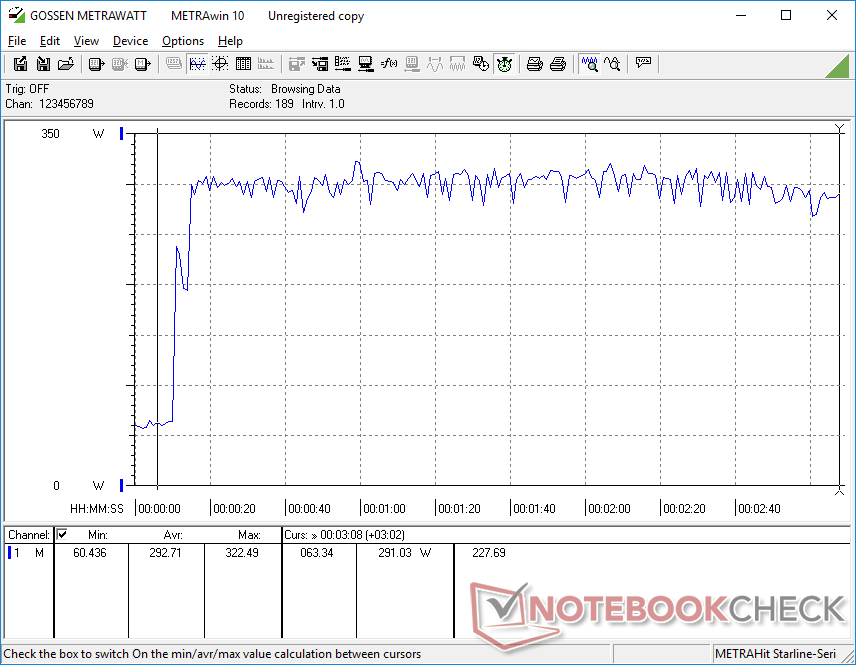
Met Witcher 3 verbruikt 54 procent meer stroom dan op de MSI GS77, ook al zijn beide uitgerust met 12e generatie Core-H CPU's en dezelfde GeForce RTX 3080 Ti GPU. In ruil daarvoor is het Alienware systeem in staat om tot 15 procent en 25 procent snellere CPU prestaties en grafische prestaties te bieden, respectievelijk, dan de concurrerende MSI.
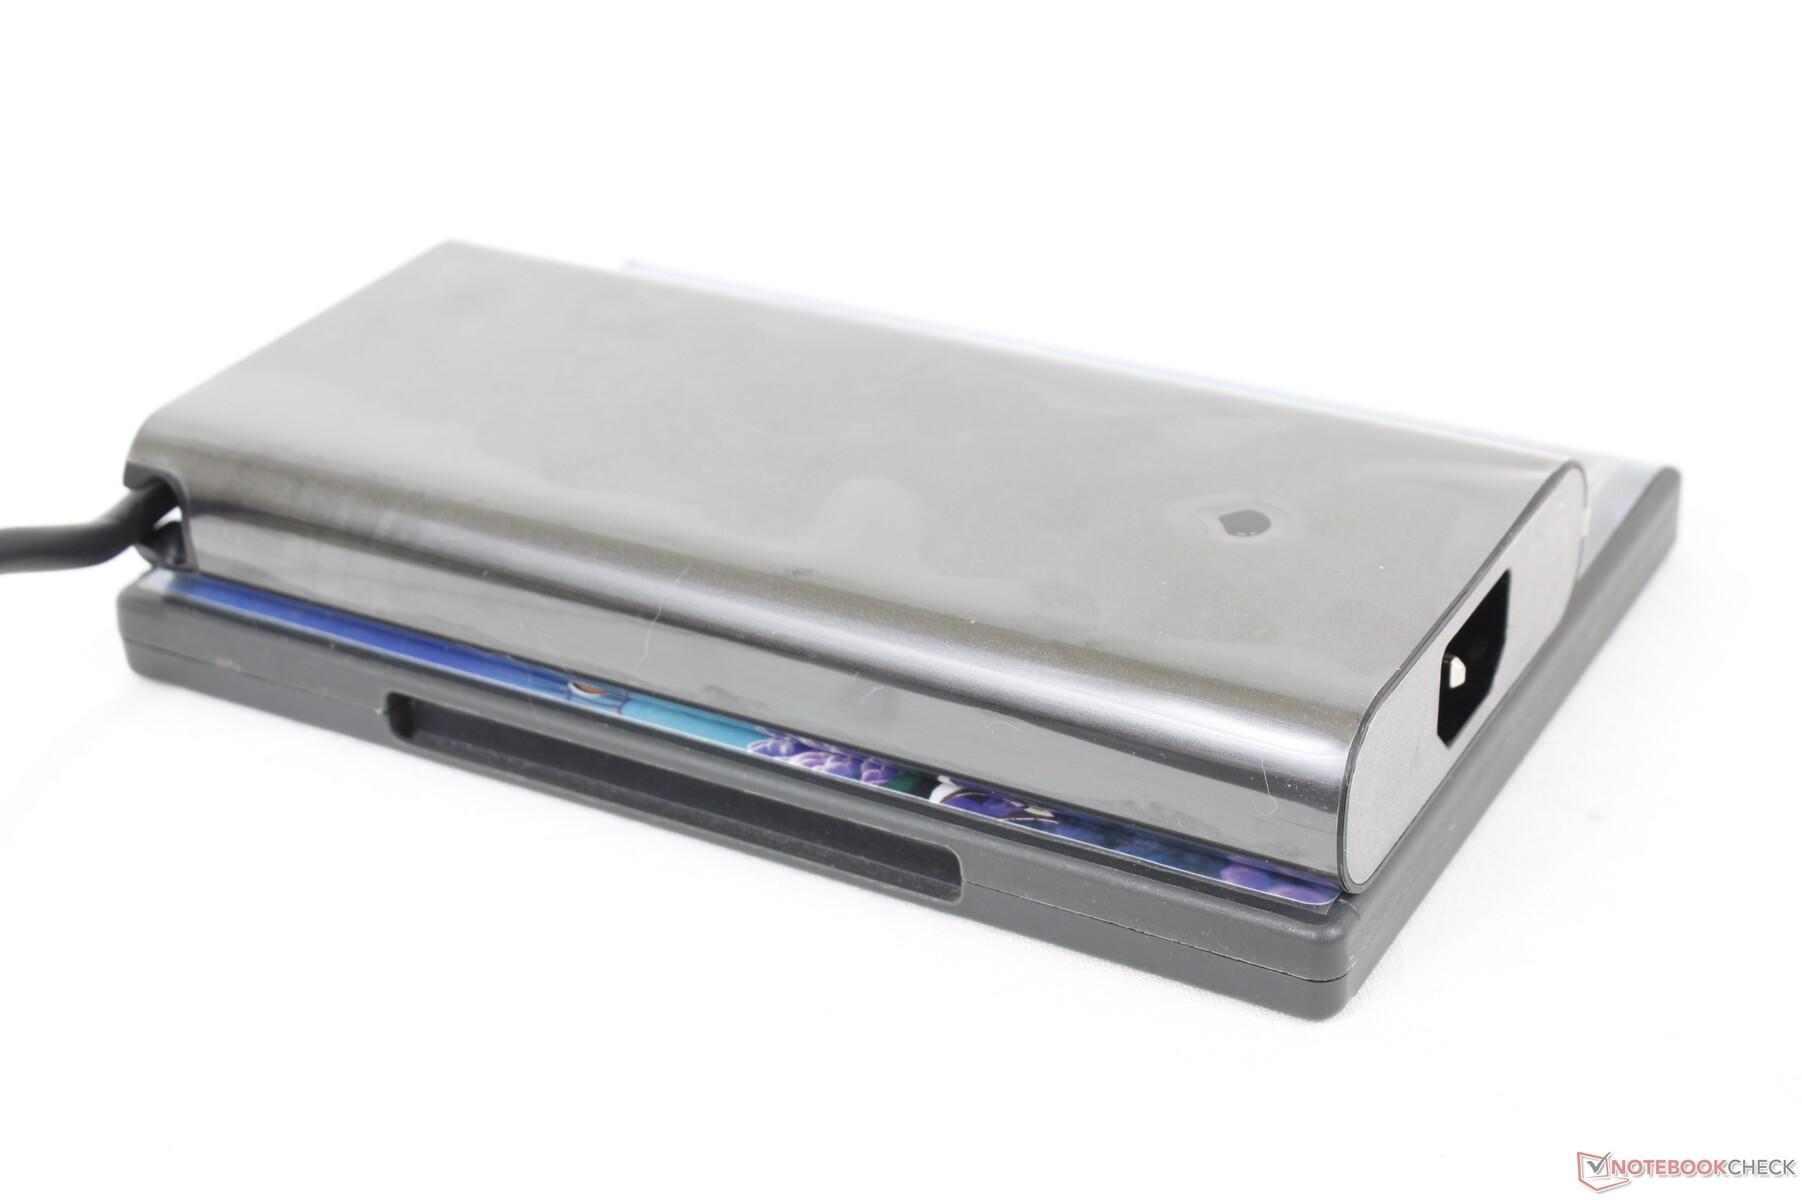
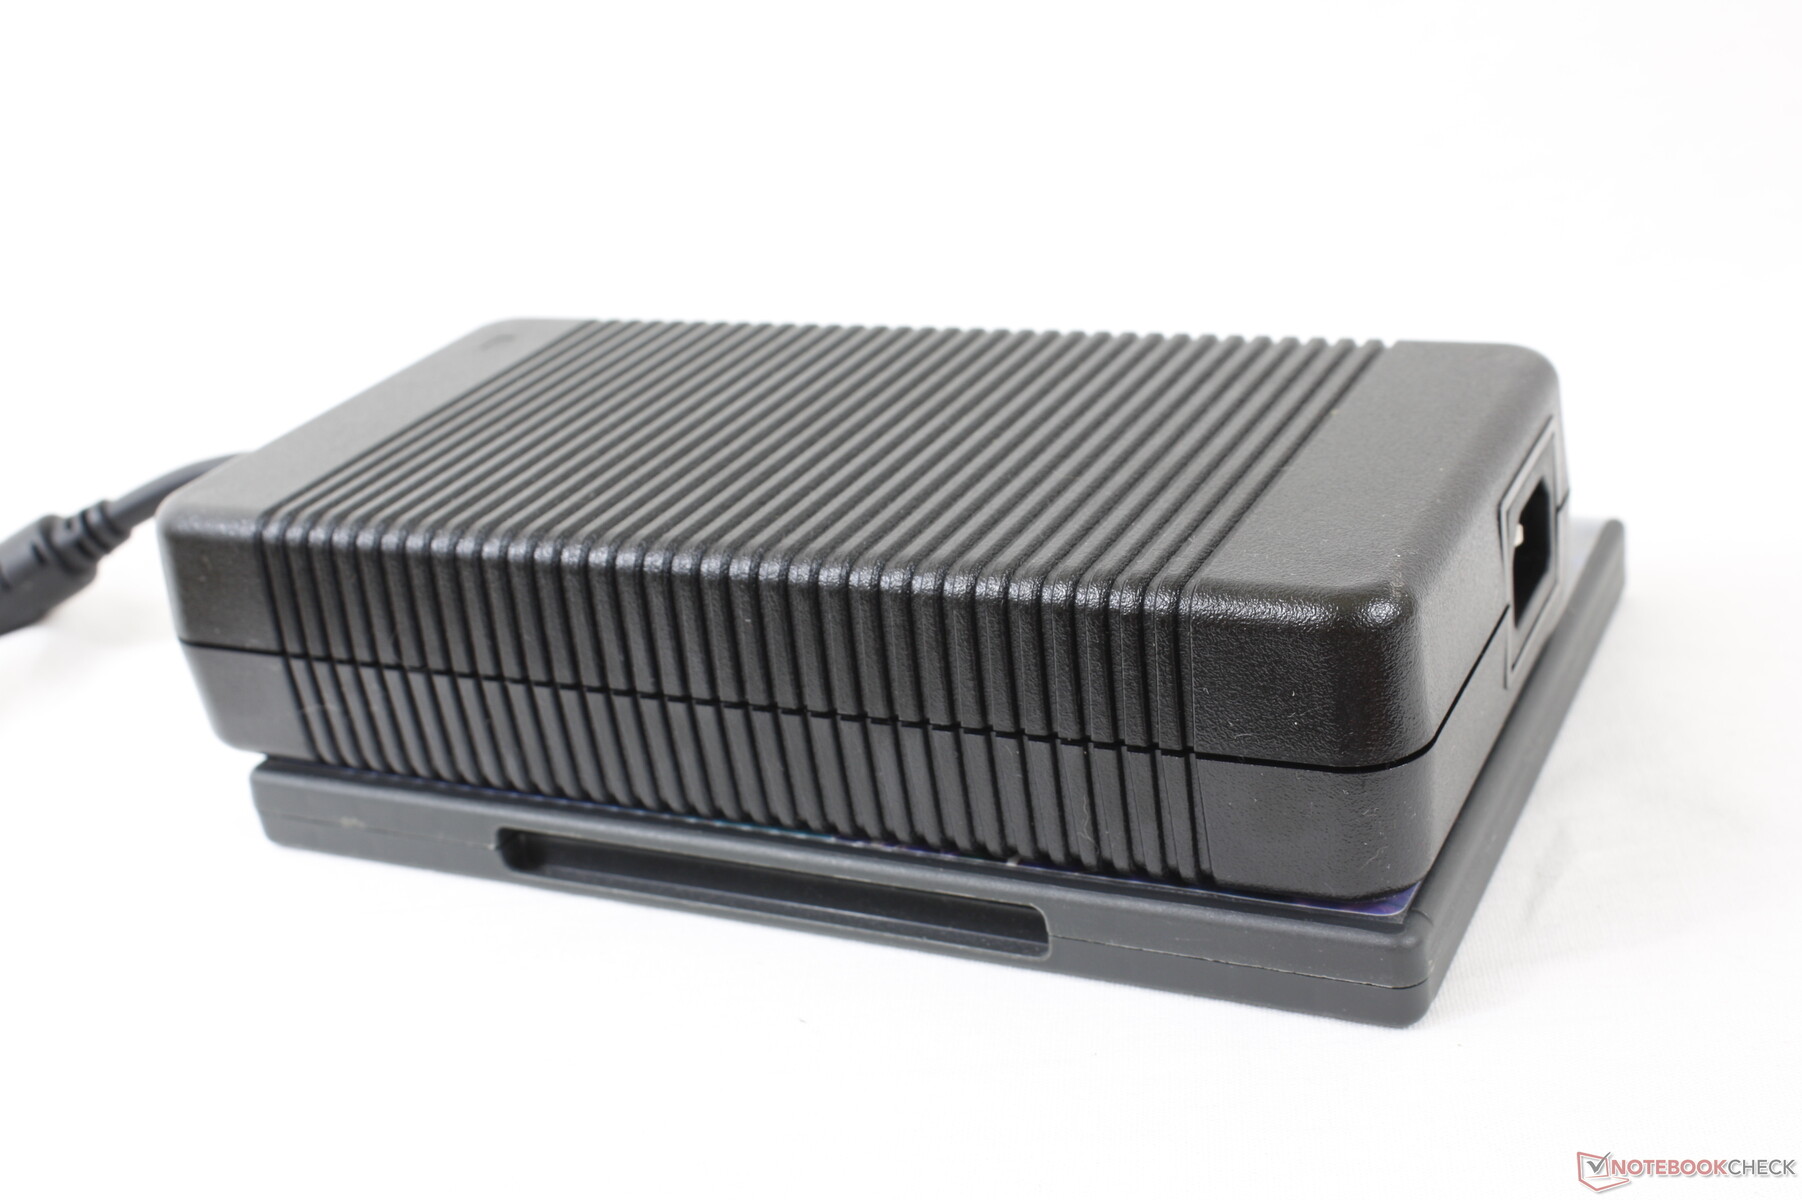
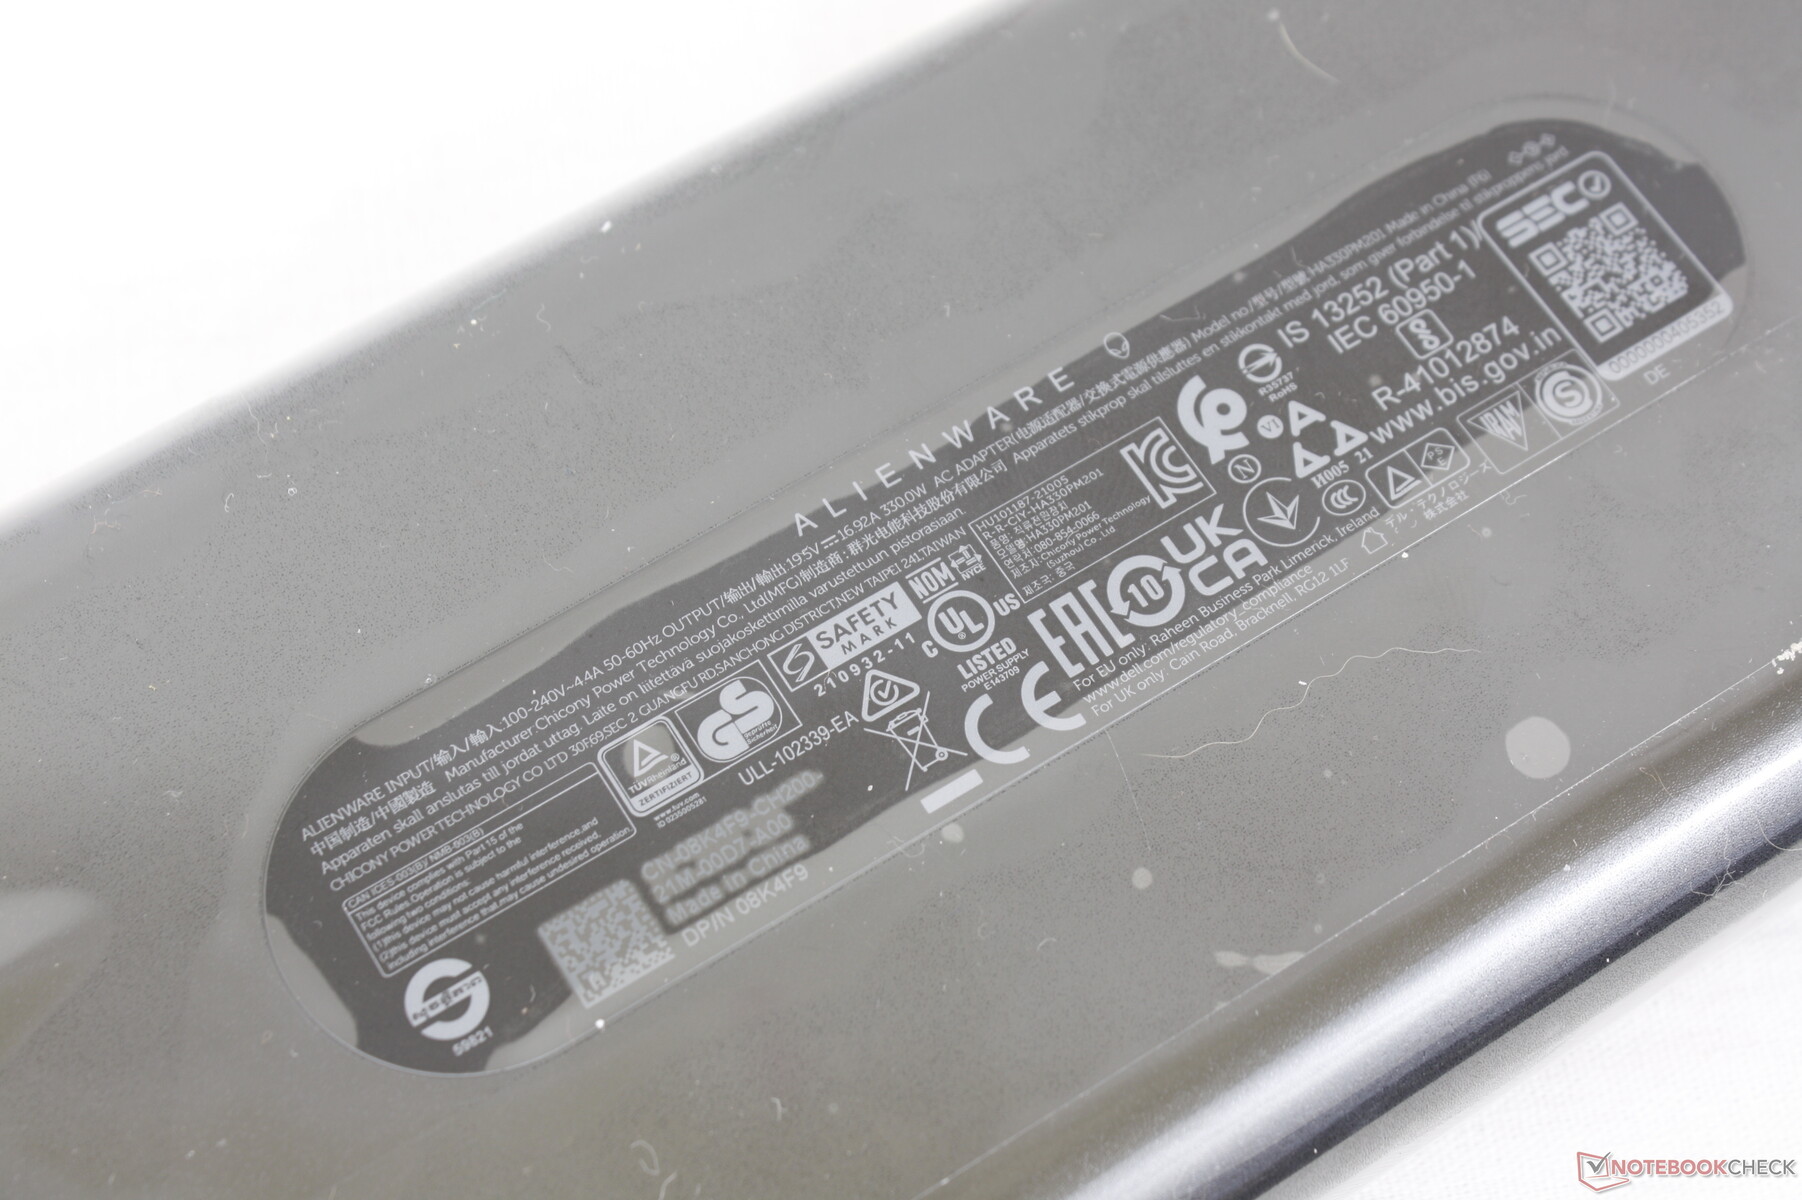
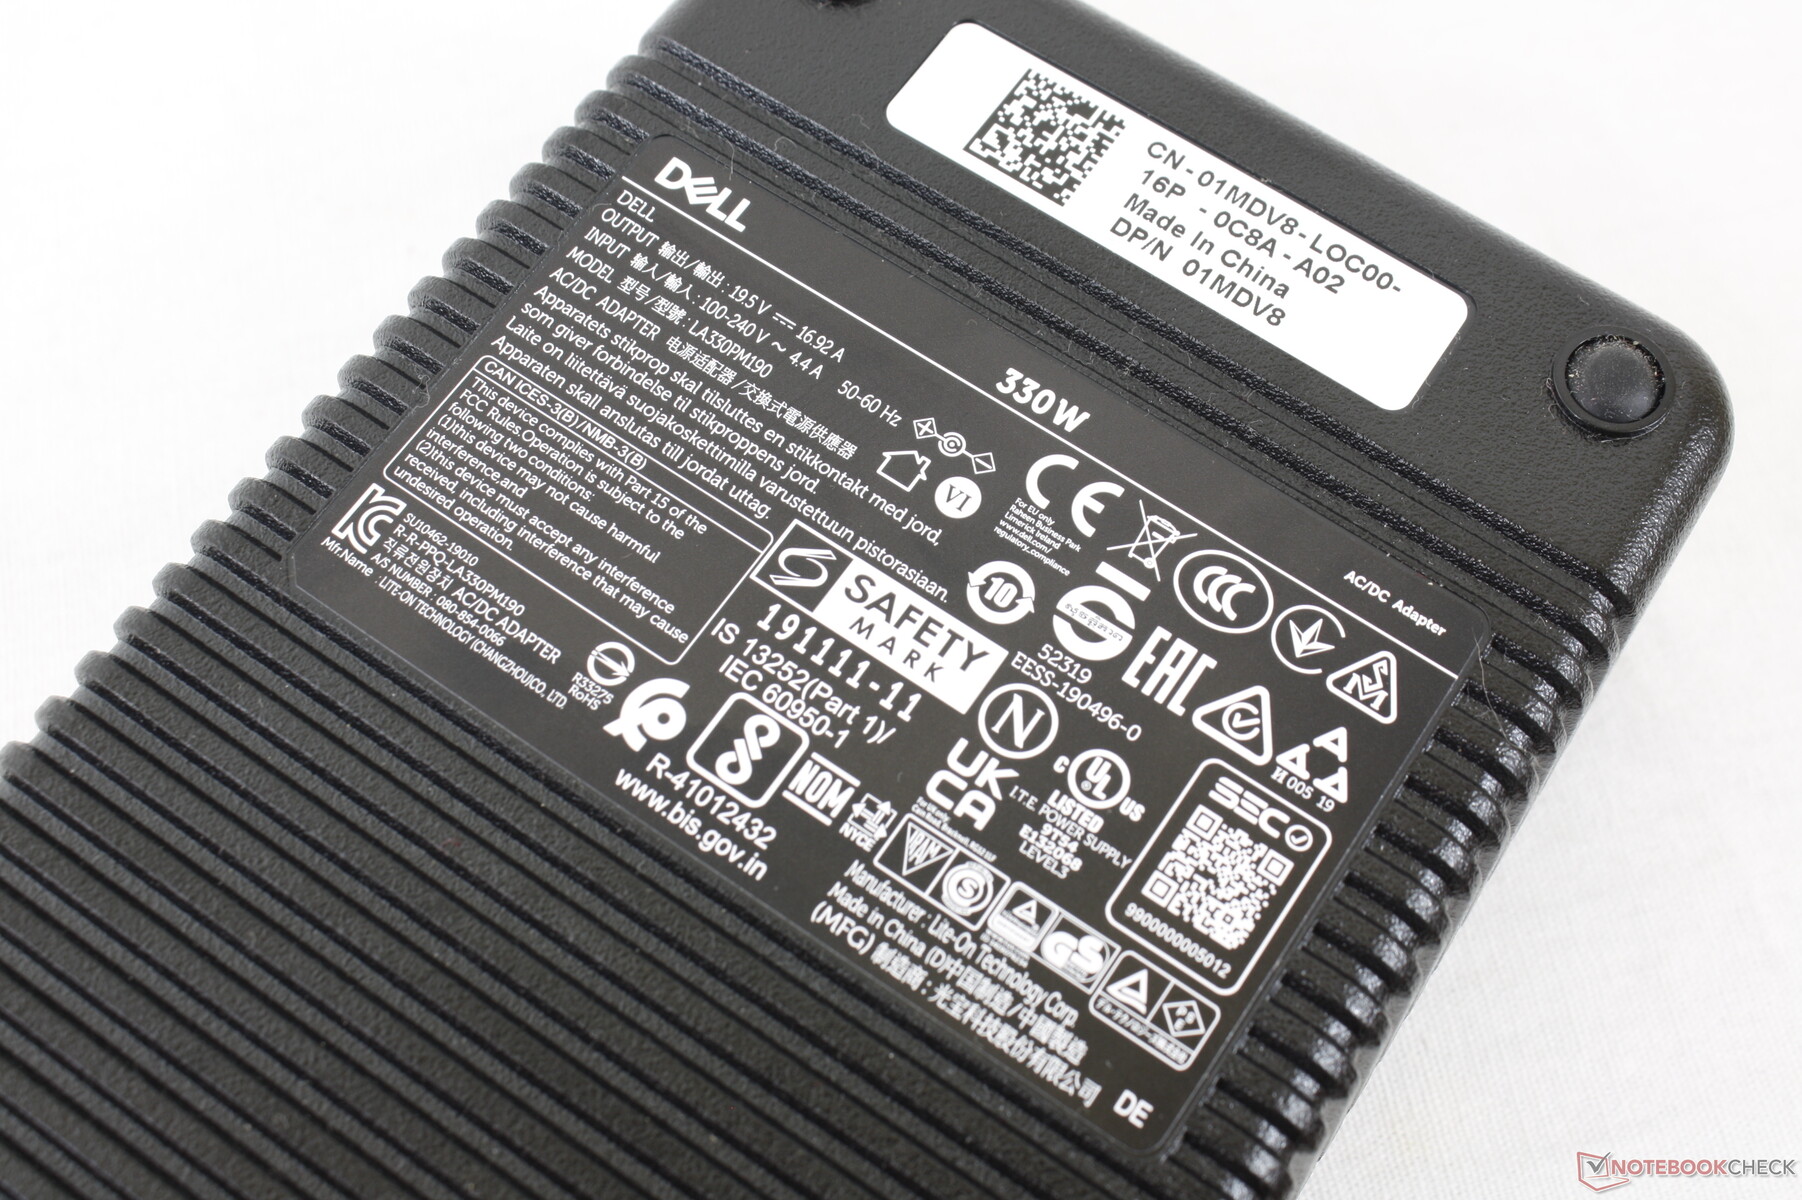
We kunnen een maximaal verbruik van 323 W registreren van de 330 W AC adapter wanneer zowel de CPU als de GPU op 100 procent gebruik staan. De AC-adapter is ditmaal kleiner in vergelijking met de adapter die werd meegeleverd met de x17 R1 van vorig jaar (~18,3 x 8,7 x 2,5 cm vs. ~20 x 9,9 x 4,3 cm). Merk op dat de meeste andere gaminglaptops worden geleverd met kleinere AC-adapters van ver onder de 280 W. Lagere Alienware x17 R2-configuraties worden mogelijk geleverd met nog kleinere AC-adapters.
| Uit / Standby | |
| Inactief | |
| Belasting |
|
Key:
min: | |
| Alienware x17 R2 P48E i9-12900HK, GeForce RTX 3080 Ti Laptop GPU, 2x Samsung PM9A1 1TB (RAID 0), IPS, 1920x1080, 17.3" | Alienware x17 RTX 3080 P48E i7-11800H, GeForce RTX 3080 Laptop GPU, 2x WDC PC SN730 SDBPNTY-1T00 (RAID 0), IPS, 3840x2160, 17.3" | Asus ROG Zephyrus S17 GX703HSD i9-11900H, GeForce RTX 3080 Laptop GPU, Samsung PM9A1 MZVL22T0HBLB, IPS, 2560x1440, 17.3" | MSI Stealth GS77 12UHS-083US i7-12700H, GeForce RTX 3080 Ti Laptop GPU, Micron 3400 1TB MTFDKBA1T0TFH, IPS, 2560x1440, 17.3" | MSI GT76 Titan DT 10SGS i9-10900K, GeForce RTX 2080 Super Mobile, 2x WDC PC SN730 SDBPNTY-1T00 (RAID 0), IPS, 3840x2160, 17.3" | Gigabyte A7 X1 R9 5900HX, GeForce RTX 3070 Laptop GPU, ESR512GTLCG-EAC-4, IPS, 1920x1080, 17.3" | |
|---|---|---|---|---|---|---|
| Power Consumption | 22% | 22% | 30% | -15% | 38% | |
| Idle Minimum * (Watt) | 24.1 | 10.2 58% | 21.7 10% | 20 17% | 25.9 -7% | 12 50% |
| Idle Average * (Watt) | 28.5 | 21.2 26% | 27 5% | 21.4 25% | 38 -33% | 14 51% |
| Idle Maximum * (Watt) | 60 | 48.4 19% | 33 45% | 27 55% | 53.2 11% | 19 68% |
| Load Average * (Watt) | 128.7 | 118.7 8% | 108 16% | 100.5 22% | 123.8 4% | 118 8% |
| Witcher 3 ultra * (Watt) | 254 | 249 2% | 195 23% | 165 35% | 312.5 -23% | 205 19% |
| Load Maximum * (Watt) | 323 | 262 19% | 210 35% | 247.1 23% | 459.8 -42% | 229 29% |
* ... kleiner is beter
Power Consumption Witcher 3 / Stresstest
Power Consumption external Monitor
Levensduur batterij
De batterijduur is een van de slechtste die we ooit op een gaming laptop hebben gezien. Zelfs stationair draaien op desktop met de laagste helderheidsinstelling, het laagste stroomprofiel en Optimus grafische weergave actief houdt het maar net iets minder dan 4 uur vol. Verwacht slechts 2 uur browsen via WLAN in de echte wereld, vergeleken met meer dan 7 uur van de Asus ROG Zephyrus S17.
Opladen van leeg naar volledig duurt ongeveer 100 minuten. Gebruikers kunnen ook opladen met USB-C adapters van derden.
| Alienware x17 R2 P48E i9-12900HK, GeForce RTX 3080 Ti Laptop GPU, 87 Wh | Alienware x17 RTX 3080 P48E i7-11800H, GeForce RTX 3080 Laptop GPU, 87 Wh | Asus ROG Zephyrus S17 GX703HSD i9-11900H, GeForce RTX 3080 Laptop GPU, 90 Wh | MSI Stealth GS77 12UHS-083US i7-12700H, GeForce RTX 3080 Ti Laptop GPU, 99 Wh | MSI GT76 Titan DT 10SGS i9-10900K, GeForce RTX 2080 Super Mobile, 90 Wh | Gigabyte A7 X1 R9 5900HX, GeForce RTX 3070 Laptop GPU, 48.96 Wh | |
|---|---|---|---|---|---|---|
| Batterijduur | 91% | 257% | 154% | 20% | 93% | |
| Reader / Idle (h) | 3.9 | 7 79% | 10.8 177% | |||
| WiFi v1.3 (h) | 2 | 5.9 195% | 7.5 275% | 6.2 210% | 2.4 20% | 4.7 135% |
| Load (h) | 0.8 | 0.8 0% | 2.7 238% | 1.4 75% | 1.2 50% | |
| H.264 (h) | 7.2 | |||||
| Witcher 3 ultra (h) | 1 |
Pro
Contra
Verdict - Hogere TGP betekent hogere prestaties
Toen Nvidia de GeForce RTX 3080 Ti voor laptops aankondigde, waren we teleurgesteld dat sommige modellen zich zouden richten op zeer lage TGP-ratings van slechts ongeveer 100 W. Hoewel een dergelijke aanpak superdunne ontwerpen mogelijk zou maken, leverde het onderweg ook prestaties op, omdat de GPU effectief zou worden ondergeklokt. De Alienware x17 R2 erkent deze afweging en mikt in plaats daarvan op een aanzienlijk hogere TGP van 175 W voor een prestatieboost van ruwweg 30 procent ten opzichte van laptops die draaien op de ~100 W GeForce RTX 3080 Ti zoals de Razer Blade 15 of Gigabyte Aero YE5. Vergelijkbare resultaten kunnen ook worden gevonden via de CPU. Dit enkele aspect van de Alienware is misschien wel de grootste onderscheidende factor tussen het en andere ultradunne gaming laptops.
Natuurlijk heeft de "prestaties tot elke prijs"-benadering ook nadelen. Met name het stroomverbruik gaat door het dak en de batterijduur lijdt eronder, zelfs bij de laagste prestatie-instellingen. Het systeem is ook merkbaar zwaarder en groter dan andere ultradunne gaming laptops, ook al wordt het chassis nog steeds als ultradun beschouwd. Ook aan de plaatsing van de poorten moet je even wennen.
als je de prestaties wilt maximaliseren zonder genoegen te nemen met enorme gaming laptops zoals de MSI GT serie, Asus ROG Chimera serieof de Alienware Area-51m serie, dan zijn de Alienware x17 R2 en zijn verrassend bevredigende mechanische toetsenbord het overwegen waard.
Prijs en beschikbaarheid
De Alienware x17 R2 wordt nu geleverd op Amazon in meerdere SKU's, hoewel geen enkele onze exacte configuratie is. Als alternatief kunnen gebruikers rechtstreeks bij Dell kopen.
Alienware x17 R2 P48E
- 11-05-2022 v7 (old)
Allen Ngo
Price comparison

