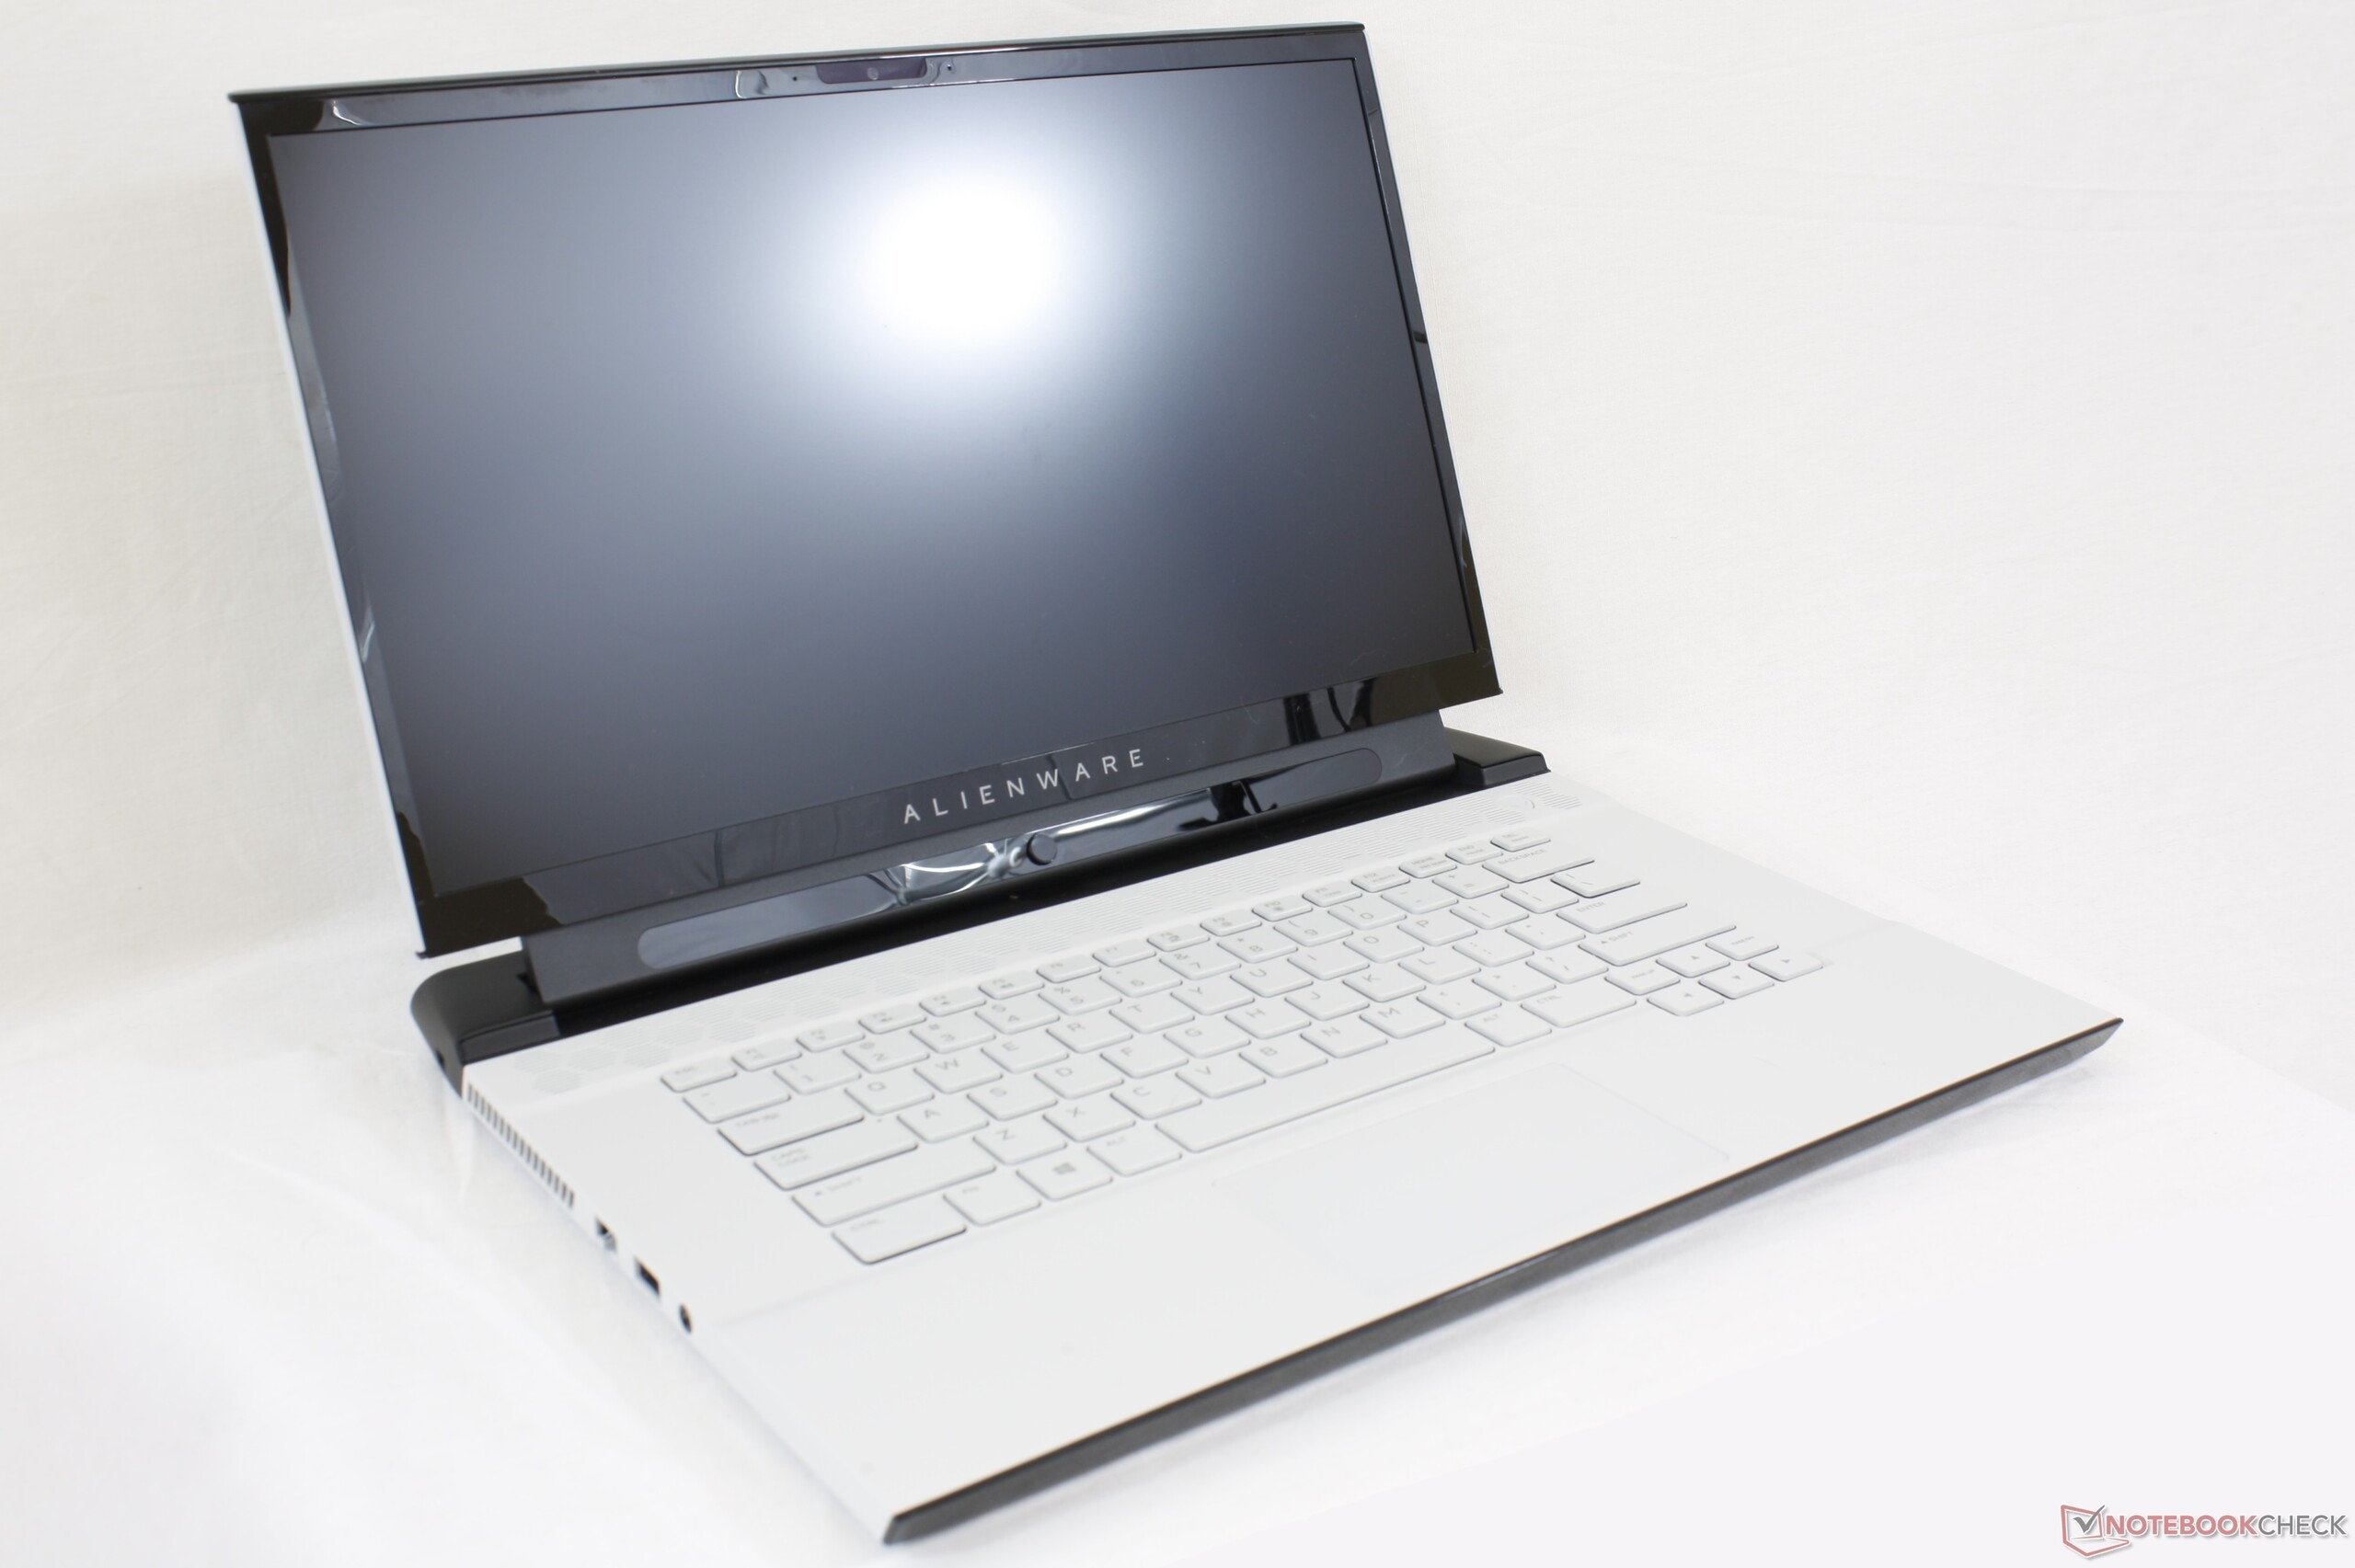
Kort testrapport Dell Alienware m15 R2 Laptop: de Area-51m mini-me
| |||||||||||||||||||||||||
Helderheidsverdeling: 90 %
Helderheid in Batterij-modus: 324.2 cd/m²
Contrast: 853:1 (Zwart: 0.38 cd/m²)
ΔE ColorChecker Calman: 5.01 | ∀{0.5-29.43 Ø4.72}
calibrated: 1.64
ΔE Greyscale Calman: 7.9 | ∀{0.09-98 Ø4.97}
95.5% sRGB (Argyll 1.6.3 3D)
60.8% AdobeRGB 1998 (Argyll 1.6.3 3D)
65.9% AdobeRGB 1998 (Argyll 3D)
95.1% sRGB (Argyll 3D)
65.3% Display P3 (Argyll 3D)
Gamma: 2.35
CCT: 8455 K
| Alienware m15 R2 P87F Sharp LQ156M1, IPS, 15.6", 1920x1080 | Razer Blade 15 RTX 2080 Max-Q Sharp LQ156M1JW03 (SHP14C5), IPS, 15.6", 1920x1080 | Asus Zephyrus S GX531GX AU Optronics B156HAN08.2, IPS, 15.6", 1920x1080 | MSI GS65 Stealth 9SG Sharp LQ156M1JW03 (SHP14C5), IPS, 15.6", 1920x1080 | Lenovo Legion Y740-15ICHg LP156WFG-SPB2, IPS, 15.6", 1920x1080 | Alienware m15 GTX 1070 Max-Q AU Optronics B156HAN, IPS, 15.6", 1920x1080 | |
|---|---|---|---|---|---|---|
| Display | 3% | -0% | 4% | -3% | -4% | |
| Display P3 Coverage (%) | 65.3 | 66.9 2% | 65.6 0% | 67.6 4% | 63.5 -3% | 63.5 -3% |
| sRGB Coverage (%) | 95.1 | 98.1 3% | 92.2 -3% | 97.5 3% | 92.4 -3% | 89.4 -6% |
| AdobeRGB 1998 Coverage (%) | 65.9 | 68.5 4% | 66.9 2% | 68.9 5% | 64.7 -2% | 64.5 -2% |
| Response Times | 2% | 24% | -10% | -33% | -23% | |
| Response Time Grey 50% / Grey 80% * (ms) | 16.4 ? | 12.8 ? 22% | 7 ? 57% | 13.6 ? 17% | 18.8 ? -15% | 18 ? -10% |
| Response Time Black / White * (ms) | 8.8 ? | 10.4 ? -18% | 9.6 ? -9% | 12 ? -36% | 13.2 ? -50% | 12 ? -36% |
| PWM Frequency (Hz) | 23810 ? | 23810 ? | 23260 ? | |||
| Screen | 24% | 13% | 25% | 6% | 5% | |
| Brightness middle (cd/m²) | 324.2 | 293 -10% | 323.6 0% | 282.3 -13% | 320.4 -1% | 353.6 9% |
| Brightness (cd/m²) | 304 | 270 -11% | 315 4% | 269 -12% | 298 -2% | 346 14% |
| Brightness Distribution (%) | 90 | 87 -3% | 91 1% | 90 0% | 85 -6% | 86 -4% |
| Black Level * (cd/m²) | 0.38 | 0.29 24% | 0.29 24% | 0.32 16% | 0.42 -11% | 0.3 21% |
| Contrast (:1) | 853 | 1010 18% | 1116 31% | 882 3% | 763 -11% | 1179 38% |
| Colorchecker dE 2000 * | 5.01 | 1.69 66% | 3.31 34% | 1.17 77% | 3.21 36% | 4.55 9% |
| Colorchecker dE 2000 max. * | 12.7 | 3.37 73% | 5.74 55% | 3.29 74% | 5.54 56% | 7.91 38% |
| Colorchecker dE 2000 calibrated * | 1.64 | 1.24 24% | 2.73 -66% | 1.06 35% | 2.36 -44% | 3.37 -105% |
| Greyscale dE 2000 * | 7.9 | 2.3 71% | 2.9 63% | 1.3 84% | 3.6 54% | 4.1 48% |
| Gamma | 2.35 94% | 2.3 96% | 2.29 96% | 2.2 100% | 2.27 97% | 2.27 97% |
| CCT | 8455 77% | 6758 96% | 6765 96% | 6643 98% | 6503 100% | 7434 87% |
| Color Space (Percent of AdobeRGB 1998) (%) | 60.8 | 63 4% | 59.7 -2% | 63.8 5% | 59 -3% | 57.9 -5% |
| Color Space (Percent of sRGB) (%) | 95.5 | 98.5 3% | 91.8 -4% | 97.5 2% | 92 -4% | 88.9 -7% |
| Totaal Gemiddelde (Programma / Instellingen) | 10% /
17% | 12% /
12% | 6% /
17% | -10% /
-1% | -7% /
-0% |
* ... kleiner is beter
Responstijd Scherm
| ↔ Responstijd Zwart naar Wit | ||
|---|---|---|
| 8.8 ms ... stijging ↗ en daling ↘ gecombineerd | ↗ 4.4 ms stijging | 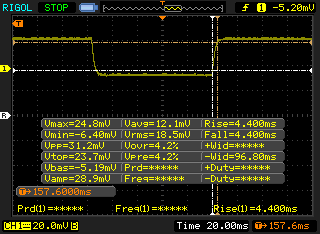 |
| ↘ 4.4 ms daling | ||
| Het scherm vertoonde snelle responstijden in onze tests en zou geschikt moeten zijn voor games. Ter vergelijking: alle testtoestellen variëren van 0.1 (minimum) tot 240 (maximum) ms. » 24 % van alle toestellen zijn beter. Dit betekent dat de gemeten responstijd beter is dan het gemiddelde (19.8 ms) van alle geteste toestellen. | ||
| ↔ Responstijd 50% Grijs naar 80% Grijs | ||
| 16.4 ms ... stijging ↗ en daling ↘ gecombineerd | ↗ 7.6 ms stijging | 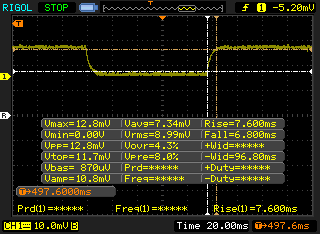 |
| ↘ 6.8 ms daling | ||
| Het scherm vertoonde prima responstijden in onze tests maar is misschien wat te traag voor competitieve games. Ter vergelijking: alle testtoestellen variëren van 0.165 (minimum) tot 636 (maximum) ms. » 31 % van alle toestellen zijn beter. Dit betekent dat de gemeten responstijd beter is dan het gemiddelde (31 ms) van alle geteste toestellen. | ||
Screen Flickering / PWM (Pulse-Width Modulation)
| Screen flickering / PWM waargenomen | 23810 Hz | ≤ 24 % helderheid instelling | 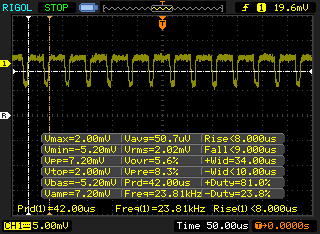 |
De achtergrondverlichting van het scherm flikkert op 23810 Hz (in het slechtste geval, bijvoorbeeld bij gebruik van PWM) aan een helderheid van 24 % en lager. Boven deze helderheid zou er geen flickering / PWM mogen optreden. De frequentie van 23810 Hz is redelijk hoog en de meeste mensen die gevoelig zijn aan flickering zouden dit dus niet mogen waarnemen of geïrriteerde ogen krijgen. Ter vergelijking: 52 % van alle geteste toestellen maakten geen gebruik van PWM om de schermhelderheid te verlagen. Als het wel werd gebruikt, werd een gemiddelde van 7769 (minimum: 5 - maximum: 343500) Hz waargenomen. | |||
| Cinebench R15 | |
| CPU Single 64Bit | |
| Alienware Area-51m i9-9900K RTX 2080 | |
| Eurocom Nightsky RX15 | |
| Alienware m17 P37E | |
| MSI GE75 9SG | |
| Gemiddeld Intel Core i7-9750H (170 - 194, n=82) | |
| Alienware m15 R2 P87F | |
| MSI GF63 8RC-040XPL | |
| Lenovo Legion Y540-17IRH | |
| Alienware m15 P79F | |
| Asus VivoBook S15 S532F | |
| Asus FX503VM-EH73 | |
| Asus ROG Zephyrus G15 GA502DU | |
| CPU Multi 64Bit | |
| Alienware Area-51m i9-9900K RTX 2080 | |
| Eurocom Nightsky RX15 | |
| MSI GE75 9SG | |
| Alienware m17 P37E | |
| Alienware m15 P79F | |
| Gemiddeld Intel Core i7-9750H (952 - 1306, n=85) | |
| Alienware m15 R2 P87F | |
| Lenovo Legion Y540-17IRH | |
| MSI GF63 8RC-040XPL | |
| Asus ROG Zephyrus G15 GA502DU | |
| Asus FX503VM-EH73 | |
| Asus VivoBook S15 S532F | |
| PCMark 8 Home Score Accelerated v2 | 4207 punten | |
| PCMark 8 Work Score Accelerated v2 | 5706 punten | |
| PCMark 10 Score | 5374 punten | |
Help | ||
| Alienware m15 R2 P87F 2x Toshiba XG6 KXG60ZNV512G (RAID 0) | Alienware m15 P79F Toshiba XG5 KXG50ZNV512G | Razer Blade 15 RTX 2080 Max-Q Samsung SSD PM981 MZVLB512HAJQ | Asus Zephyrus S GX531GX Intel SSD 660p SSDPEKNW512G8 | MSI GS65 Stealth 9SG Samsung SSD PM981 MZVLB512HAJQ | Dell Latitude 7400 2-in-1 Toshiba XG6 KXG60ZNV512G | |
|---|---|---|---|---|---|---|
| AS SSD | -12% | 12% | -26% | 20% | -49% | |
| Seq Read (MB/s) | 1925 | 1937 1% | 1832 -5% | 1239 -36% | 2005 4% | 2289 19% |
| Seq Write (MB/s) | 2371 | 1066 -55% | 1864 -21% | 920 -61% | 1580 -33% | 1163 -51% |
| 4K Read (MB/s) | 37.2 | 31.76 -15% | 52.1 40% | 45.74 23% | 49.33 33% | 22.29 -40% |
| 4K Write (MB/s) | 108.9 | 102.6 -6% | 108.3 -1% | 95.7 -12% | 103.8 -5% | 28.92 -73% |
| 4K-64 Read (MB/s) | 1177 | 1140 -3% | 1159 -2% | 322 -73% | 1241 5% | 415.6 -65% |
| 4K-64 Write (MB/s) | 1135 | 938 -17% | 1807 59% | 722 -36% | 1730 52% | 199.5 -82% |
| Access Time Read * (ms) | 0.065 | 0.058 11% | 0.05 23% | 0.073 -12% | 0.054 17% | 0.122 -88% |
| Access Time Write * (ms) | 0.108 | 0.04 63% | 0.034 69% | 0.047 56% | 0.036 67% | 0.143 -32% |
| Score Read (Points) | 1407 | 1366 -3% | 1394 -1% | 492 -65% | 1490 6% | 667 -53% |
| Score Write (Points) | 1481 | 1147 -23% | 2102 42% | 910 -39% | 1991 34% | 345 -77% |
| Score Total (Points) | 3633 | 3168 -13% | 4221 16% | 1654 -54% | 4230 16% | 1300 -64% |
| Copy ISO MB/s (MB/s) | 2073 | 946 -54% | 2083 0% | 1236 -40% | 3025 46% | 1767 -15% |
| Copy Program MB/s (MB/s) | 576 | 452.8 -21% | 496.5 -14% | 703 22% | 713 24% | 379.4 -34% |
| Copy Game MB/s (MB/s) | 1426 | 1013 -29% | 977 -31% | 812 -43% | 1554 9% | 1055 -26% |
* ... kleiner is beter

| 3DMark 11 Performance | 19885 punten | |
| 3DMark Cloud Gate Standard Score | 33900 punten | |
| 3DMark Fire Strike Score | 17504 punten | |
| 3DMark Time Spy Score | 7785 punten | |
Help | ||
| lage | gem. | hoge | ultra | |
|---|---|---|---|---|
| BioShock Infinite (2013) | 314.6 | 273.1 | 251.7 | 166.5 |
| The Witcher 3 (2015) | 274.5 | 215.4 | 144.5 | 81.3 |
| Rocket League (2017) | 248.7 | 239.3 | 218.5 | |
| Shadow of the Tomb Raider (2018) | 114 | 91 | 89 | 87 |
| Alienware m15 R2 P87F GeForce RTX 2080 Max-Q, i7-9750H, 2x Toshiba XG6 KXG60ZNV512G (RAID 0) | Alienware m15 P79F GeForce RTX 2070 Max-Q, i7-8750H, Toshiba XG5 KXG50ZNV512G | Razer Blade 15 RTX 2080 Max-Q GeForce RTX 2080 Max-Q, i7-9750H, Samsung SSD PM981 MZVLB512HAJQ | Asus Zephyrus S GX531GX GeForce RTX 2080 Max-Q, i7-8750H, Intel SSD 660p SSDPEKNW512G8 | MSI GS65 Stealth 9SG GeForce RTX 2080 Max-Q, i7-9750H, Samsung SSD PM981 MZVLB512HAJQ | Lenovo Legion Y740-15ICHg GeForce RTX 2070 Max-Q, i7-8750H, Samsung SSD PM981 MZVLB256HAHQ | |
|---|---|---|---|---|---|---|
| Noise | -4% | 14% | 1% | 8% | 10% | |
| uit / omgeving * (dB) | 28.3 | 28.2 -0% | 28.3 -0% | 28.7 -1% | 28.3 -0% | 28 1% |
| Idle Minimum * (dB) | 28.5 | 30.3 -6% | 28.8 -1% | 29.8 -5% | 30.4 -7% | 32.6 -14% |
| Idle Average * (dB) | 28.5 | 35.4 -24% | 28.8 -1% | 32.4 -14% | 30.5 -7% | 32.7 -15% |
| Idle Maximum * (dB) | 49 | 50.3 -3% | 29 41% | 38 22% | 30.6 38% | 32.7 33% |
| Load Average * (dB) | 49 | 50.3 -3% | 33.5 32% | 38.2 22% | 37.6 23% | 33.3 32% |
| Witcher 3 ultra * (dB) | 49 | 50.2 -2% | 45 8% | 56.6 -16% | 46 6% | 41.6 15% |
| Load Maximum * (dB) | 55 | 50.2 9% | 45.2 18% | 56.6 -3% | 55.1 -0% | 45.2 18% |
* ... kleiner is beter
Geluidsniveau
| Onbelast |
| 28.5 / 28.5 / 49 dB (A) |
| Belasting |
| 49 / 55 dB (A) |
 | ||
30 dB stil 40 dB(A) hoorbaar 50 dB(A) luid |
||
min: | ||
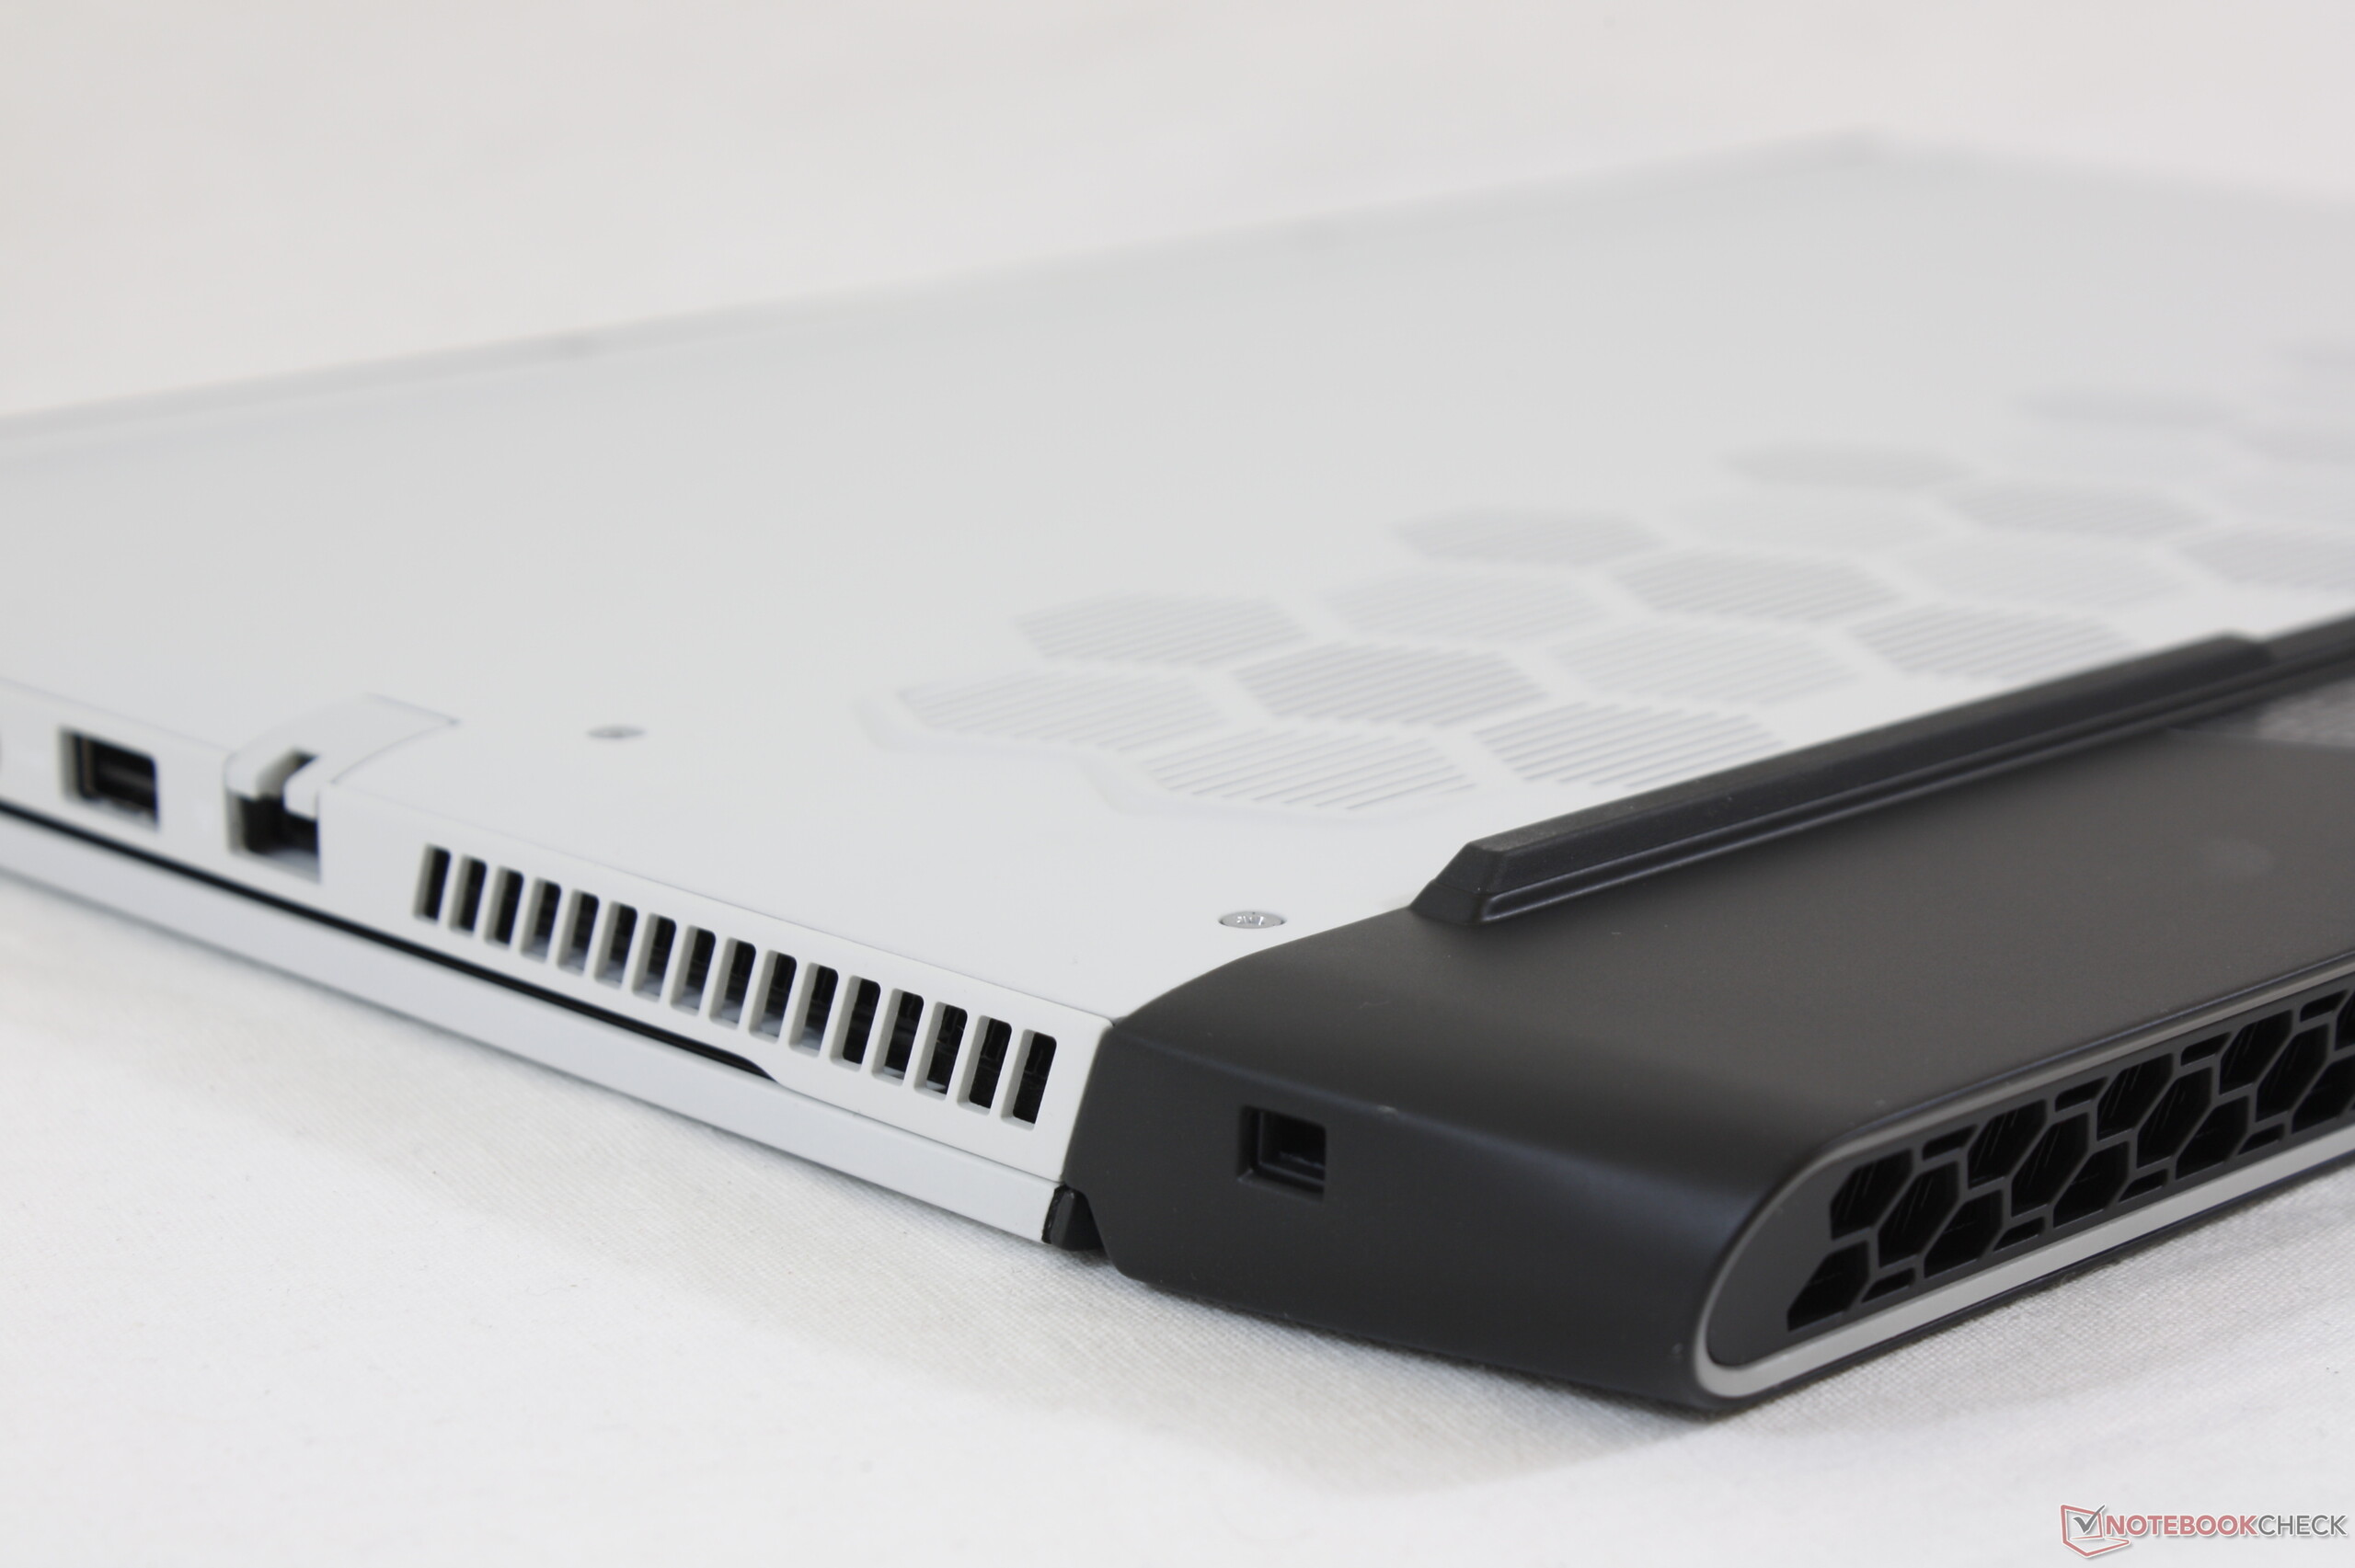
(-) De maximumtemperatuur aan de bovenzijde bedraagt 53.8 °C / 129 F, vergeleken met het gemiddelde van 40.4 °C / 105 F, variërend van 21.2 tot 68.8 °C voor de klasse Gaming.
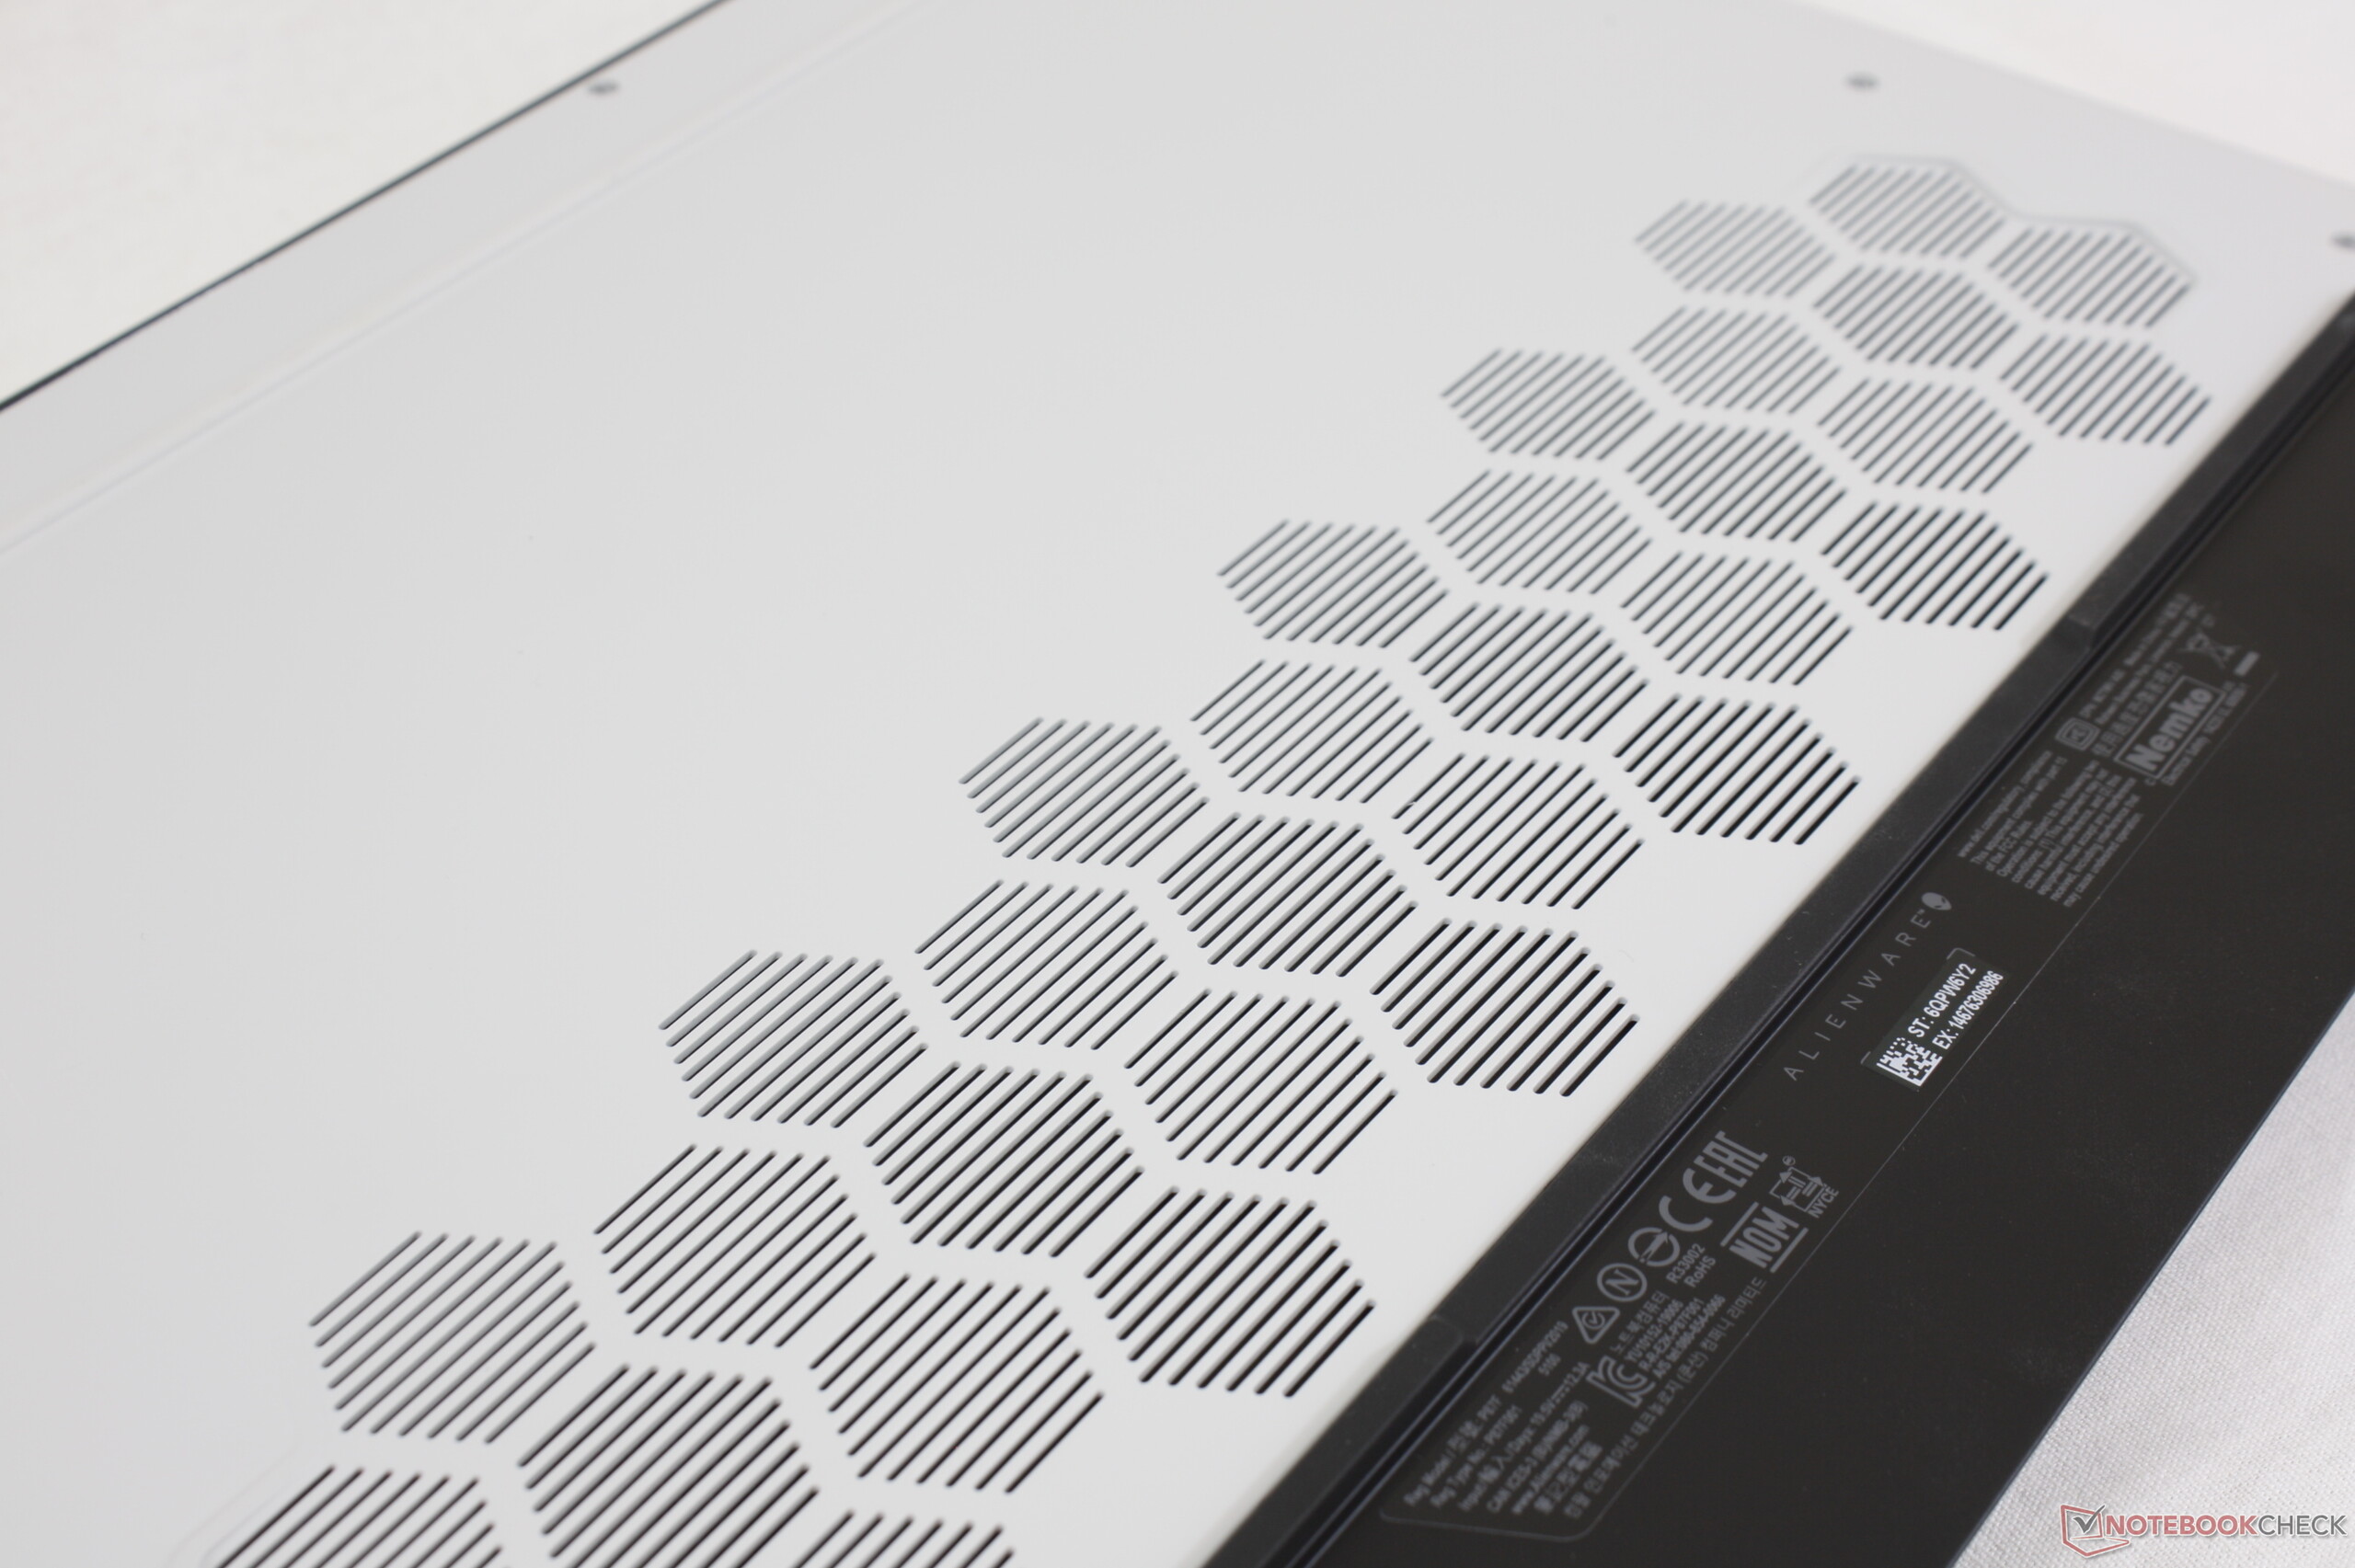
(-) De bodem warmt op tot een maximum van 58 °C / 136 F, vergeleken met een gemiddelde van 43.2 °C / 110 F
(+) Bij onbelast gebruik bedraagt de gemiddelde temperatuur voor de bovenzijde 28 °C / 82 F, vergeleken met het apparaatgemiddelde van 33.9 °C / 93 F.
(±) Bij het spelen van The Witcher 3 is de gemiddelde temperatuur voor de bovenzijde 36.3 °C / 97 F, vergeleken met het apparaatgemiddelde van 33.9 °C / 93 F.
(+) De handpalmsteunen en het touchpad bereiken maximaal de huidtemperatuur (32.2 °C / 90 F) en zijn dus niet heet.
(-) De gemiddelde temperatuur van de handpalmsteun van soortgelijke toestellen bedroeg 28.8 °C / 83.8 F (-3.4 °C / -6.2 F).
Alienware m15 R2 P87F audioanalyse
(+) | luidsprekers kunnen relatief luid spelen (84 dB)
Bas 100 - 315 Hz
(-) | bijna geen lage tonen - gemiddeld 18.8% lager dan de mediaan
(±) | lineariteit van de lage tonen is gemiddeld (11.9% delta ten opzichte van de vorige frequentie)
Midden 400 - 2000 Hz
(+) | evenwichtige middens - slechts 4.8% verwijderd van de mediaan
(+) | de middentonen zijn lineair (6.6% delta ten opzichte van de vorige frequentie)
Hoog 2 - 16 kHz
(+) | evenwichtige hoogtepunten - slechts 1.3% verwijderd van de mediaan
(±) | lineariteit van de hoogtepunten is gemiddeld (7.4% delta ten opzichte van de vorige frequentie)
Algemeen 100 - 16.000 Hz
(±) | lineariteit van het totale geluid is gemiddeld (19.8% verschil met de mediaan)
Vergeleken met dezelfde klasse
» 70% van alle geteste apparaten in deze klasse waren beter, 6% vergelijkbaar, 24% slechter
» De beste had een delta van 6%, het gemiddelde was 18%, de slechtste was 132%
Vergeleken met alle geteste toestellen
» 50% van alle geteste apparaten waren beter, 7% gelijk, 42% slechter
» De beste had een delta van 4%, het gemiddelde was 24%, de slechtste was 134%
Apple MacBook 12 (Early 2016) 1.1 GHz audioanalyse
(+) | luidsprekers kunnen relatief luid spelen (83.6 dB)
Bas 100 - 315 Hz
(±) | verminderde zeebaars - gemiddeld 11.3% lager dan de mediaan
(±) | lineariteit van de lage tonen is gemiddeld (14.2% delta ten opzichte van de vorige frequentie)
Midden 400 - 2000 Hz
(+) | evenwichtige middens - slechts 2.4% verwijderd van de mediaan
(+) | de middentonen zijn lineair (5.5% delta ten opzichte van de vorige frequentie)
Hoog 2 - 16 kHz
(+) | evenwichtige hoogtepunten - slechts 2% verwijderd van de mediaan
(+) | de hoge tonen zijn lineair (4.5% delta naar de vorige frequentie)
Algemeen 100 - 16.000 Hz
(+) | het totale geluid is lineair (10.2% verschil met de mediaan)
Vergeleken met dezelfde klasse
» 7% van alle geteste apparaten in deze klasse waren beter, 2% vergelijkbaar, 91% slechter
» De beste had een delta van 5%, het gemiddelde was 18%, de slechtste was 53%
Vergeleken met alle geteste toestellen
» 5% van alle geteste apparaten waren beter, 1% gelijk, 94% slechter
» De beste had een delta van 4%, het gemiddelde was 24%, de slechtste was 134%
| Uit / Standby | |
| Inactief | |
| Belasting |
|
Key:
min: | |
| Alienware m15 R2 P87F i7-9750H, GeForce RTX 2080 Max-Q, 2x Toshiba XG6 KXG60ZNV512G (RAID 0), IPS, 1920x1080, 15.6" | Alienware m15 P79F i7-8750H, GeForce RTX 2070 Max-Q, Toshiba XG5 KXG50ZNV512G, OLED, 3840x2160, 15.6" | Razer Blade 15 RTX 2080 Max-Q i7-9750H, GeForce RTX 2080 Max-Q, Samsung SSD PM981 MZVLB512HAJQ, IPS, 1920x1080, 15.6" | Lenovo Legion Y740-15ICHg i7-8750H, GeForce RTX 2070 Max-Q, Samsung SSD PM981 MZVLB256HAHQ, IPS, 1920x1080, 15.6" | MSI GP65 Leopard 9SE-225US i7-9750H, GeForce RTX 2060 Mobile, Toshiba KBG30ZMT512G, IPS, 1920x1080, 15.6" | Alienware 15 R3 Max-Q i7-7820HK, GeForce GTX 1080 Max-Q, LiteOn CX2-8B256, IPS, 1920x1080, 15.6" | |
|---|---|---|---|---|---|---|
| Power Consumption | 35% | 34% | 24% | 31% | 18% | |
| Idle Minimum * (Watt) | 19 | 10.9 43% | 12.5 34% | 22.9 -21% | 13.6 28% | 22 -16% |
| Idle Average * (Watt) | 40.5 | 12.3 70% | 15.3 62% | 27.2 33% | 17.9 56% | 26 36% |
| Idle Maximum * (Watt) | 52 | 19 63% | 20.7 60% | 27.5 47% | 20.6 60% | 33 37% |
| Load Average * (Watt) | 132.3 | 96 27% | 90.2 32% | 83.4 37% | 96 27% | 86 35% |
| Witcher 3 ultra * (Watt) | 183.3 | 161.7 12% | 162 12% | 143.6 22% | 154.6 16% | 159 13% |
| Load Maximum * (Watt) | 217.2 | 229.1 -5% | 209.3 4% | 160.5 26% | 218.6 -1% | 215 1% |
* ... kleiner is beter
| Alienware m15 R2 P87F i7-9750H, GeForce RTX 2080 Max-Q, 76 Wh | Alienware m15 P79F i7-8750H, GeForce RTX 2070 Max-Q, 90 Wh | Razer Blade 15 RTX 2080 Max-Q i7-9750H, GeForce RTX 2080 Max-Q, 80 Wh | Asus Zephyrus S GX531GX i7-8750H, GeForce RTX 2080 Max-Q, 50 Wh | MSI GS65 Stealth 9SG i7-9750H, GeForce RTX 2080 Max-Q, 82 Wh | Lenovo Legion Y740-15ICHg i7-8750H, GeForce RTX 2070 Max-Q, 57 Wh | |
|---|---|---|---|---|---|---|
| Batterijduur | -5% | 79% | -45% | 9% | -31% | |
| Reader / Idle (h) | 9.2 | 15.9 73% | 3.9 -58% | |||
| WiFi v1.3 (h) | 5.5 | 5.2 -5% | 6.6 20% | 3 -45% | 6 9% | 2.8 -49% |
| Load (h) | 0.7 | 1.7 143% | 0.8 14% |
Pro
Contra
Dit is de verkorte versie van het originele artikel. Het volledige, Engelse testrapport vind je hier.
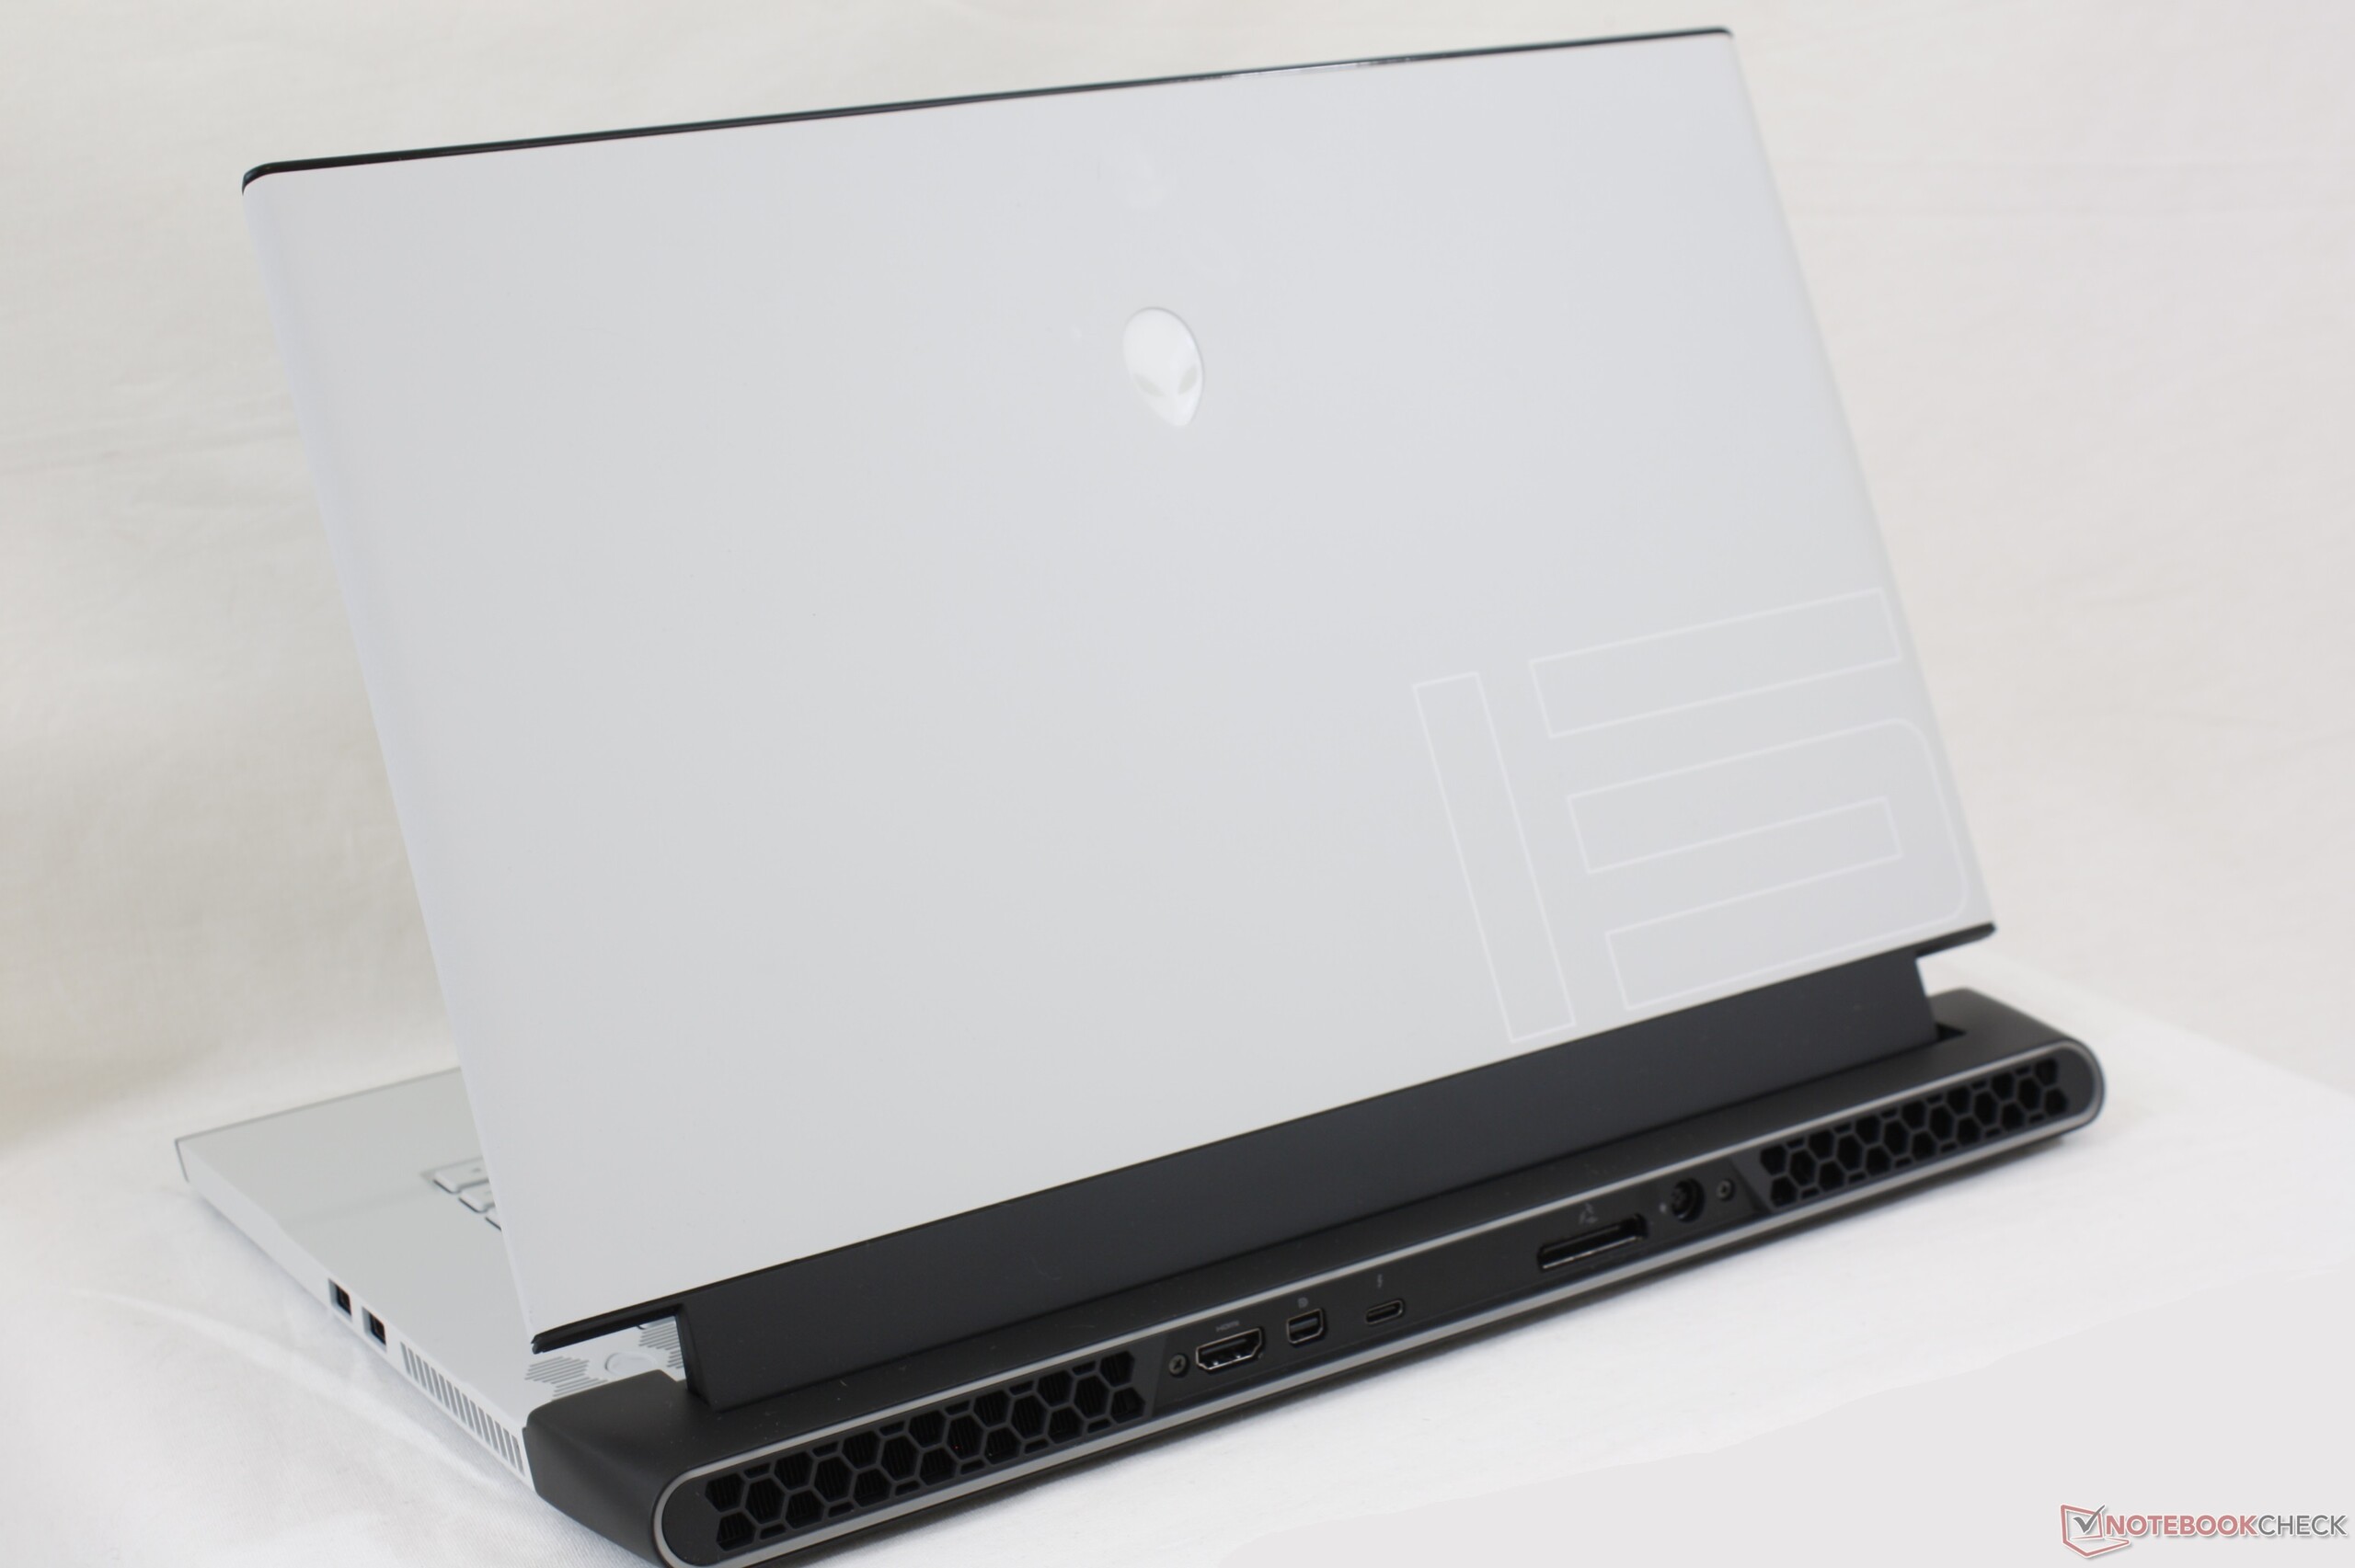
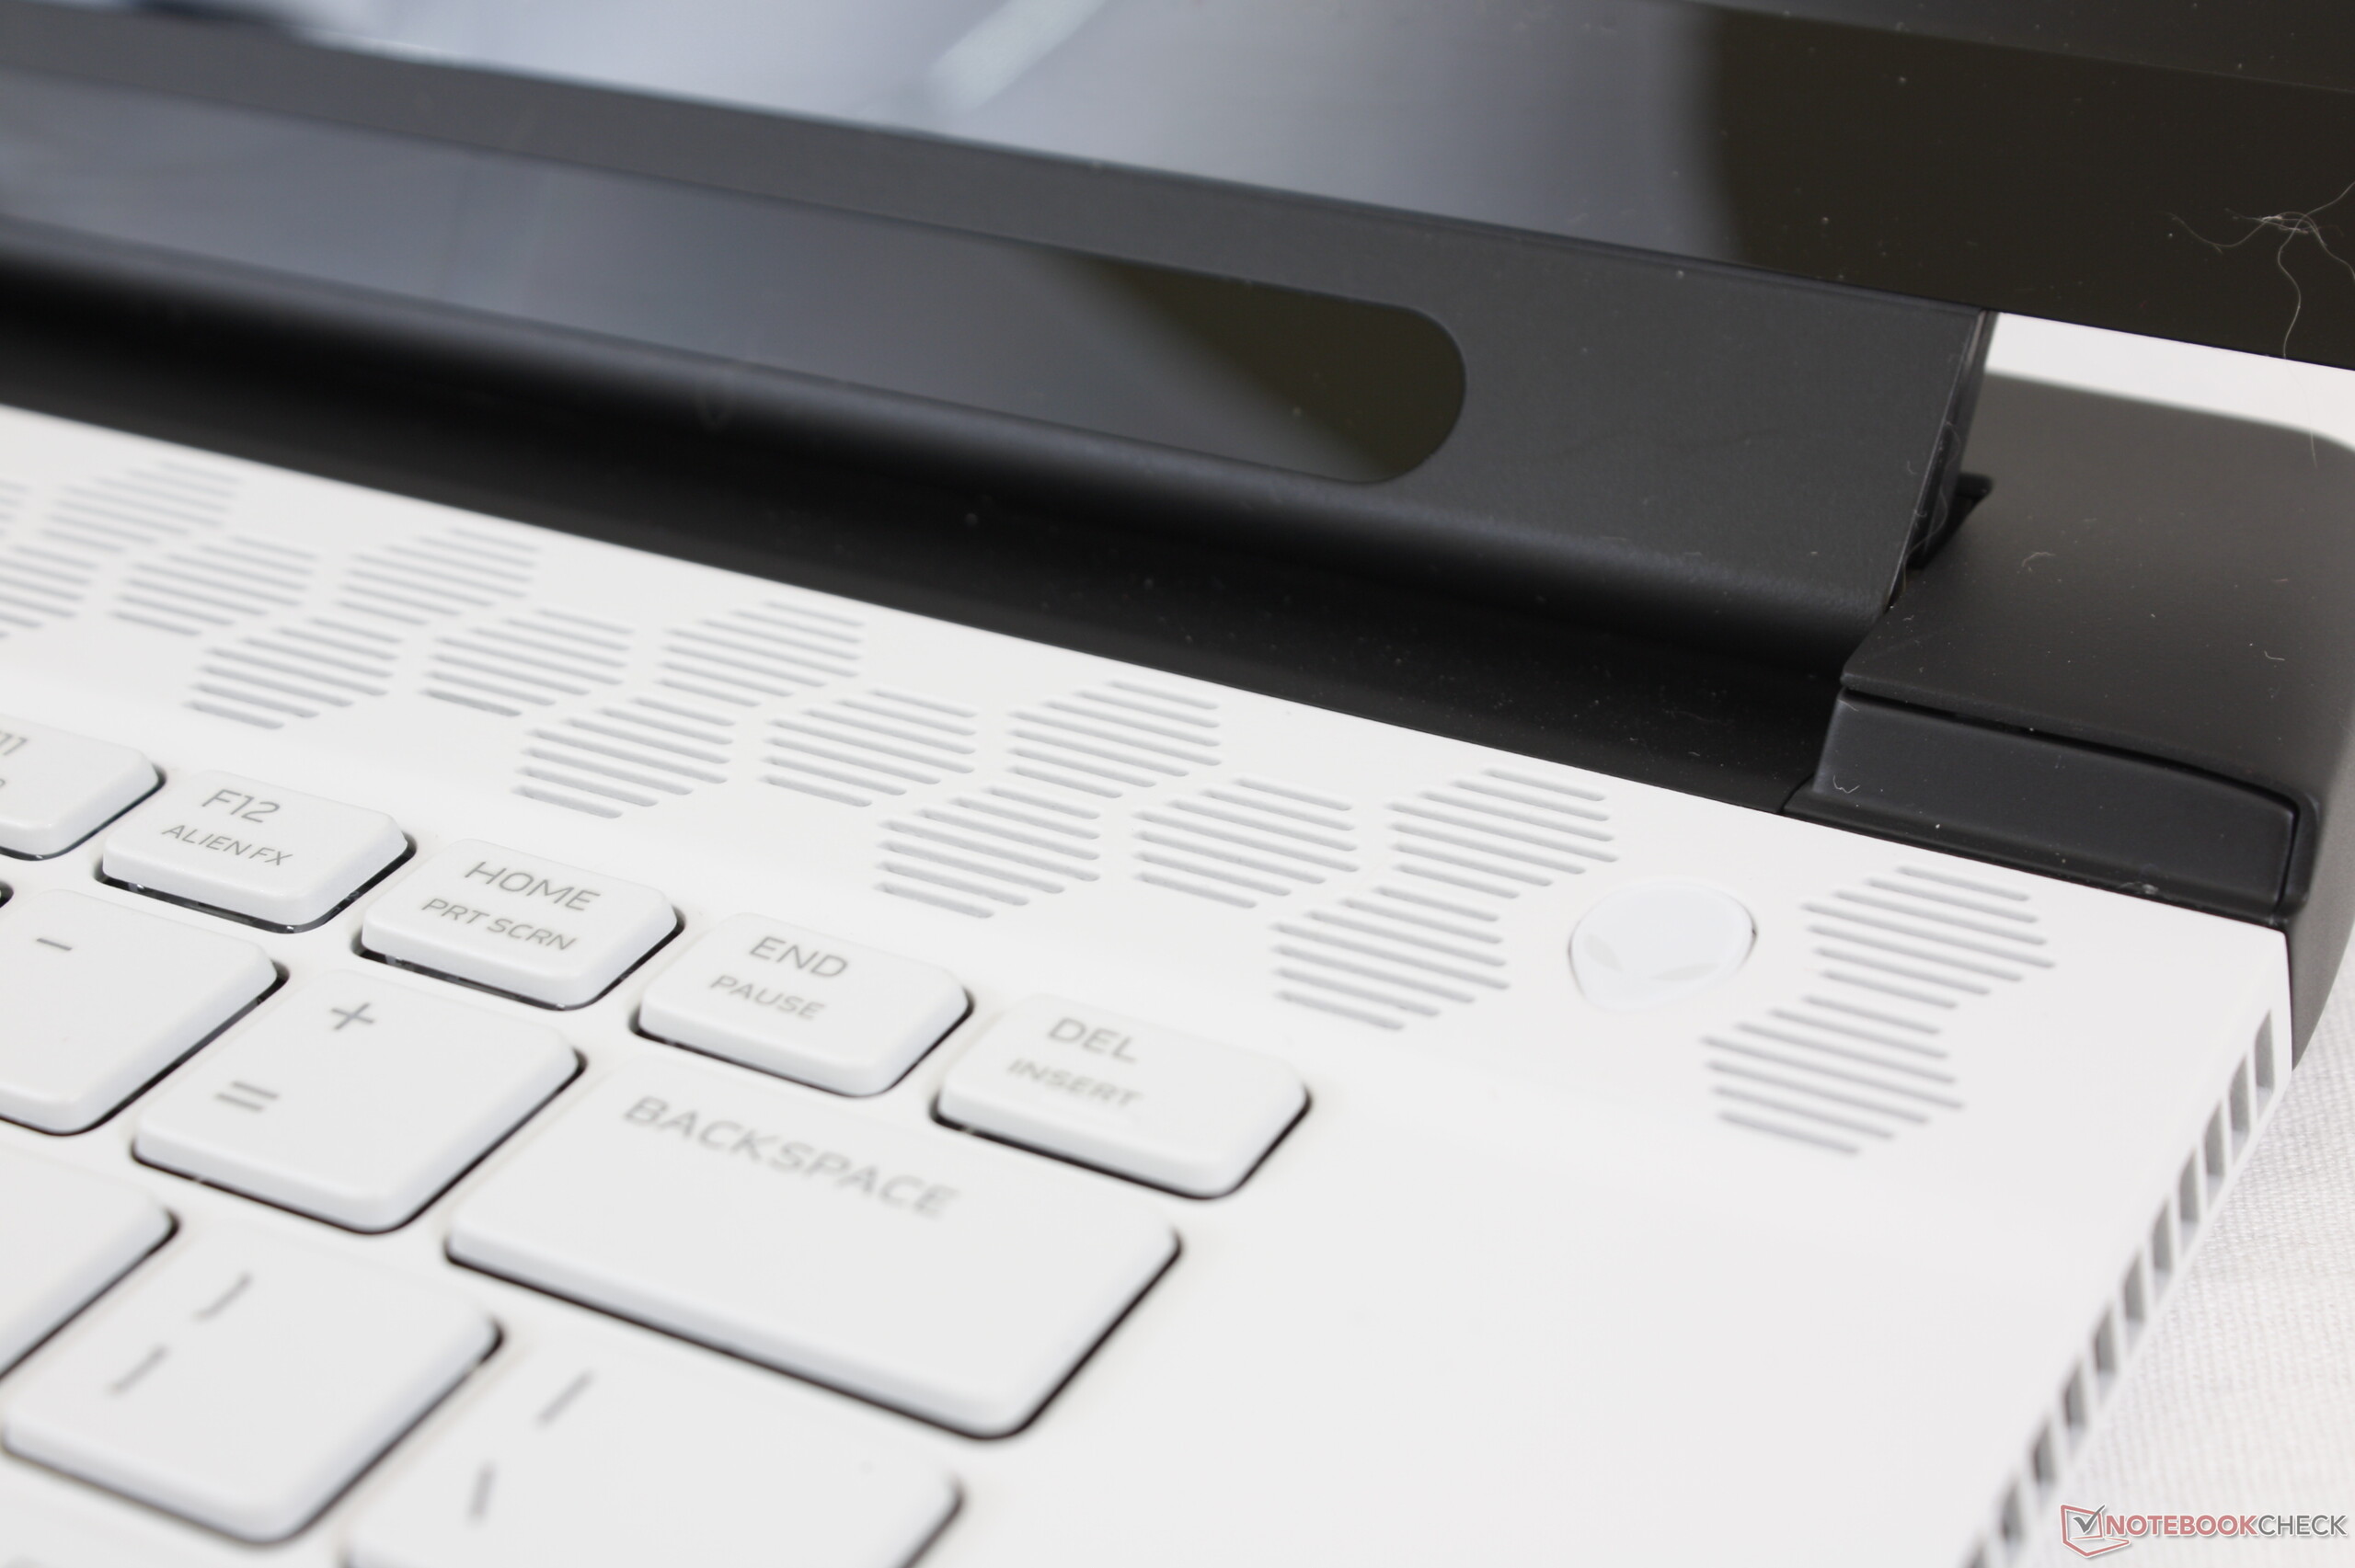
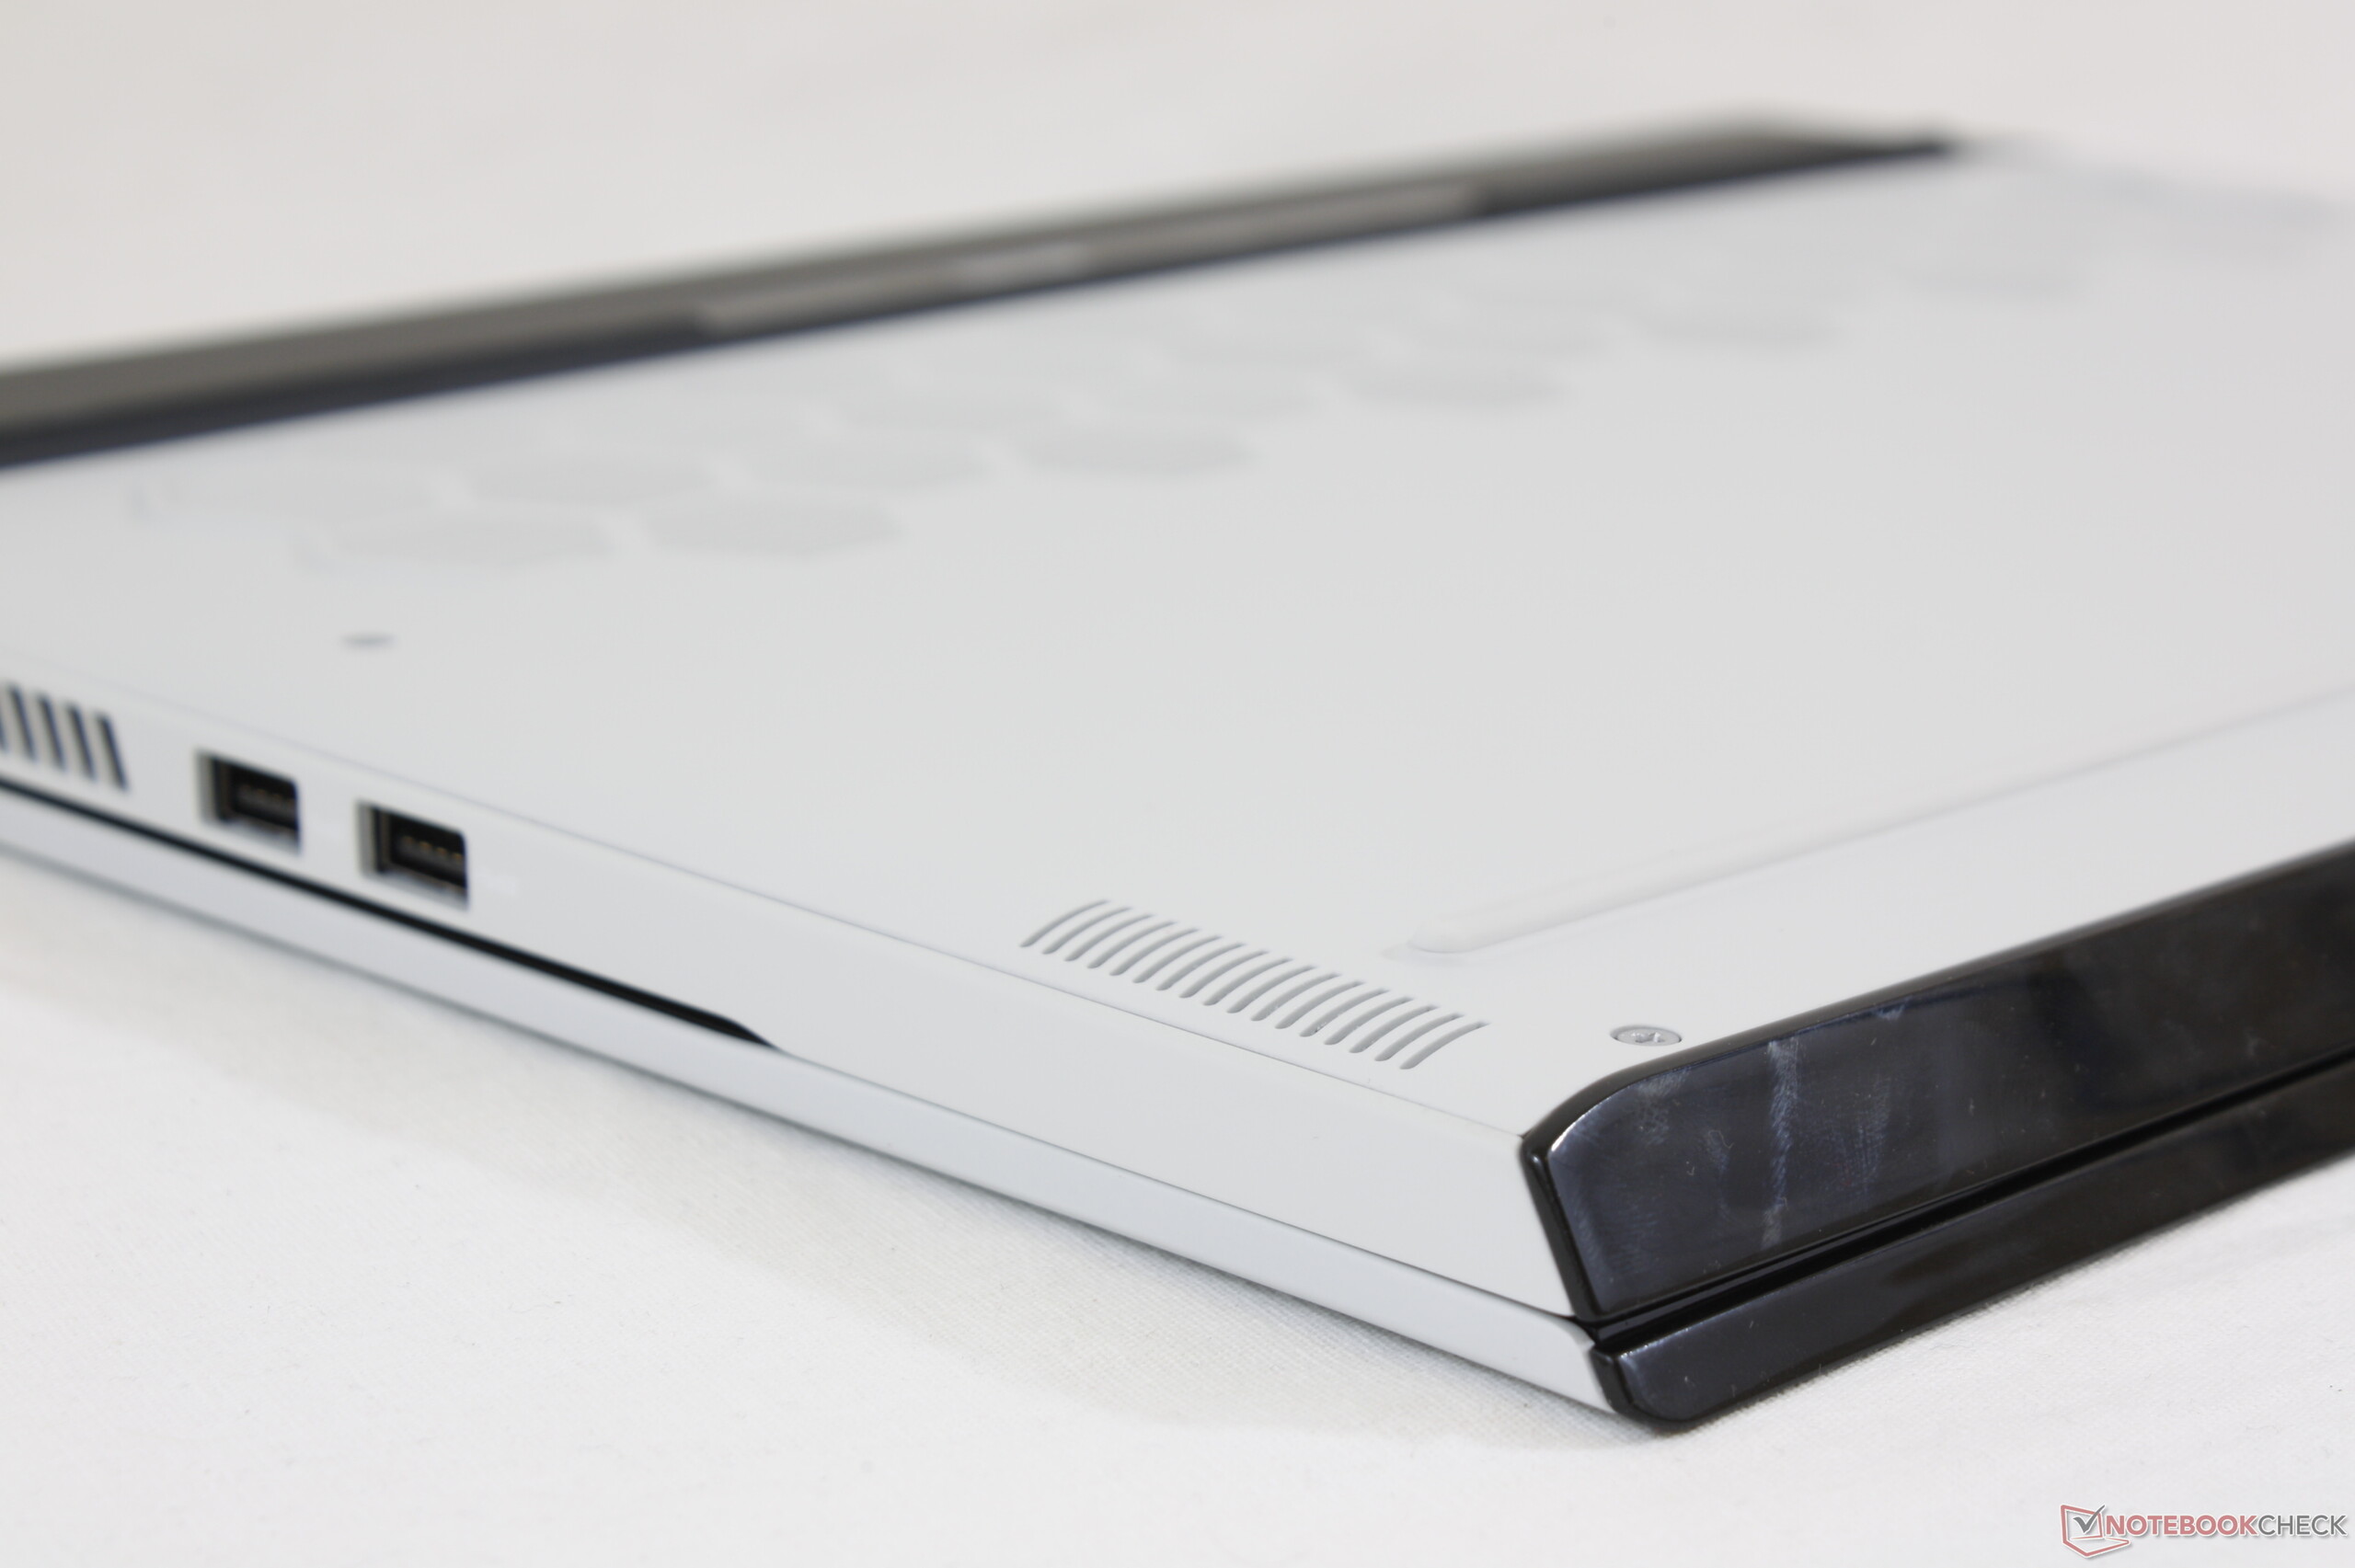
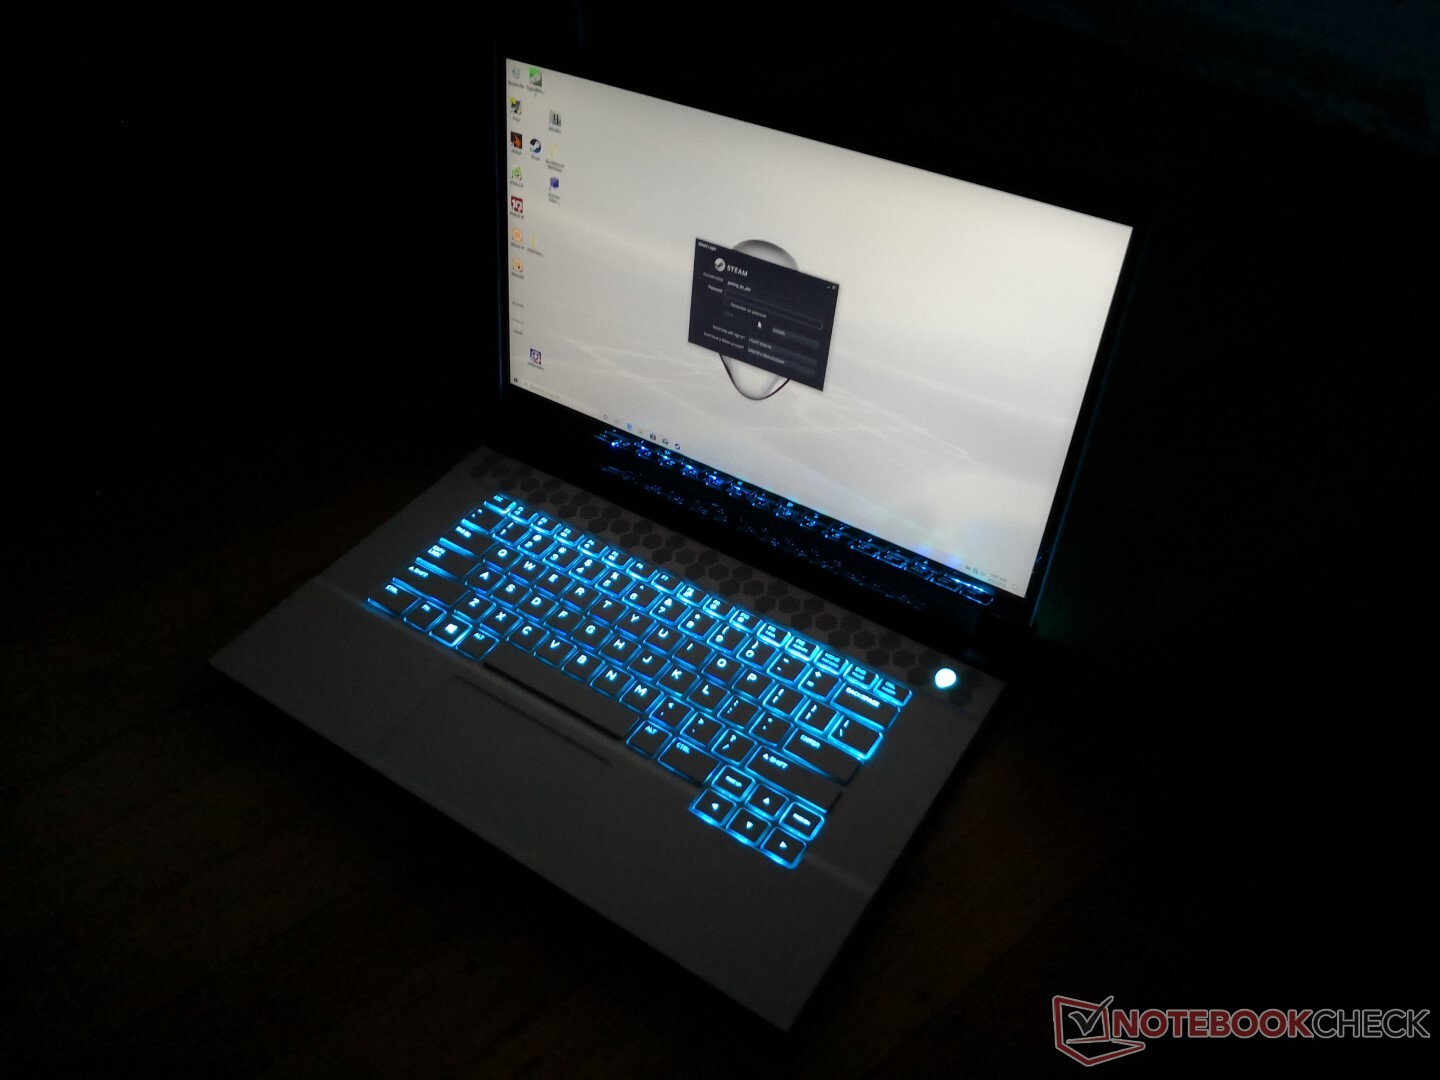
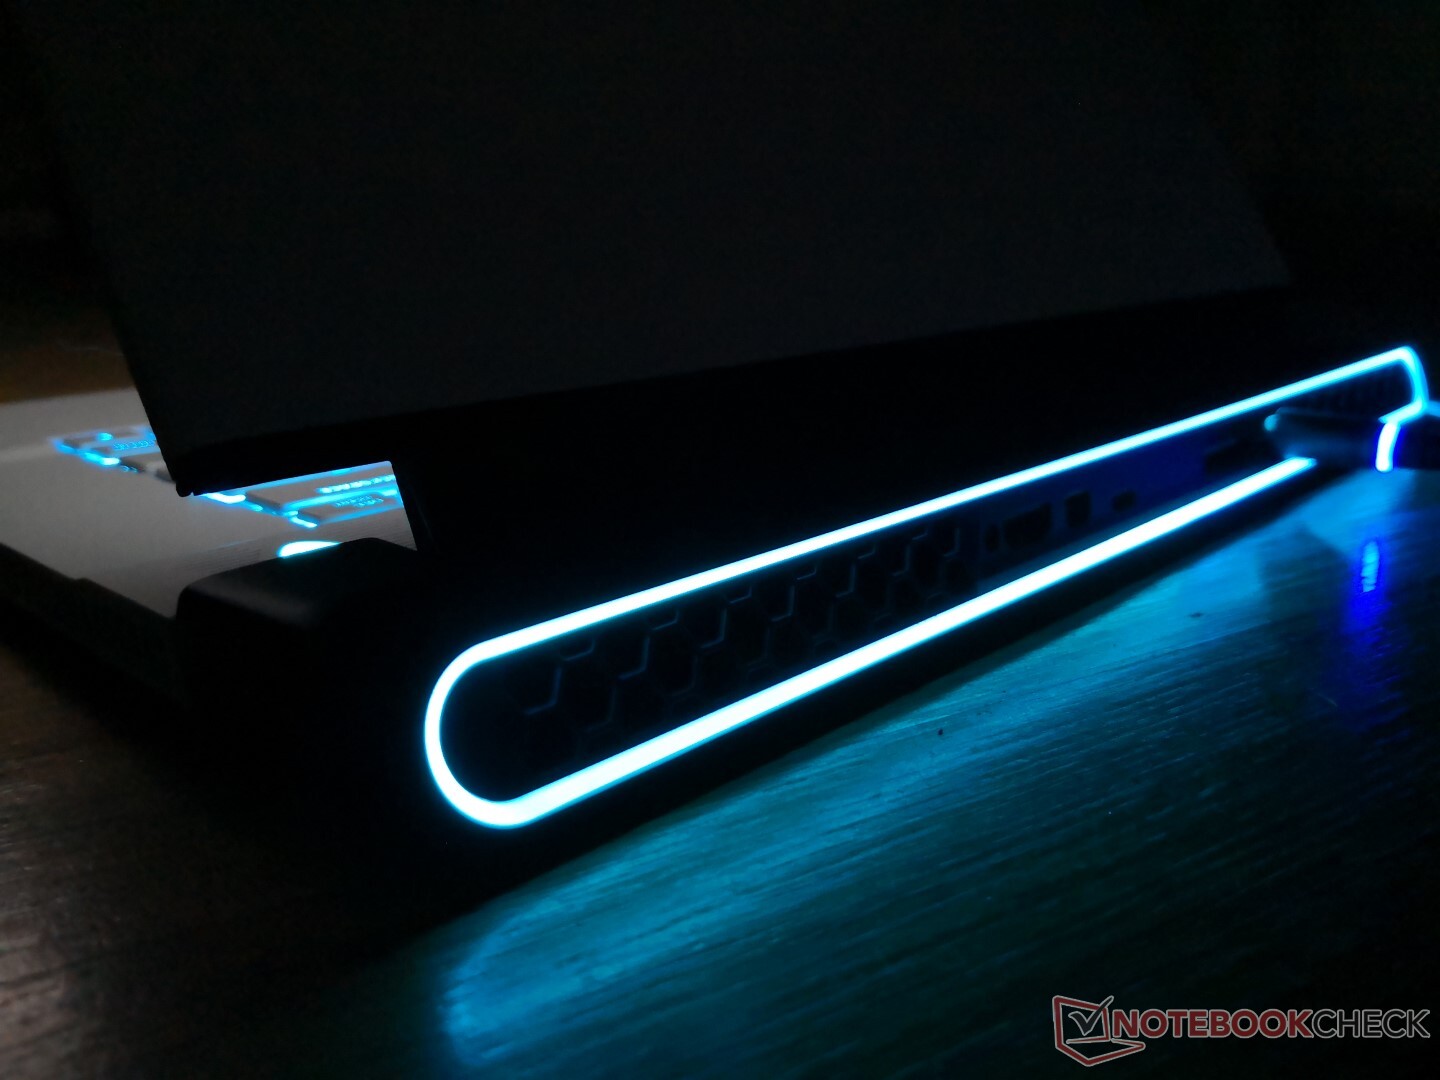
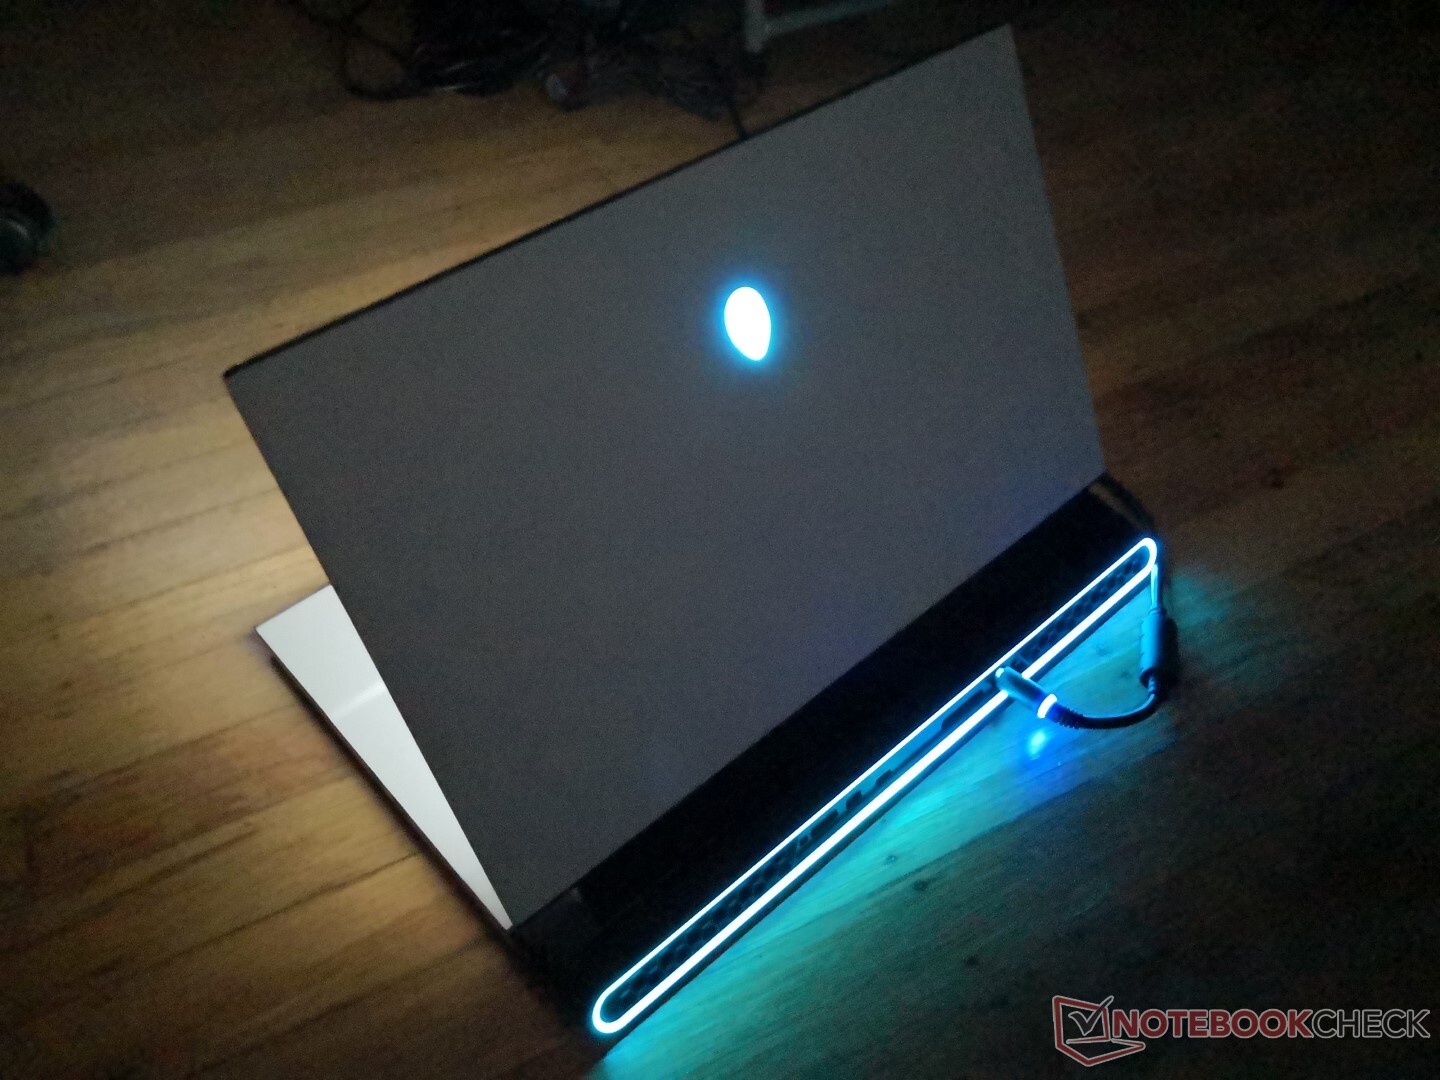
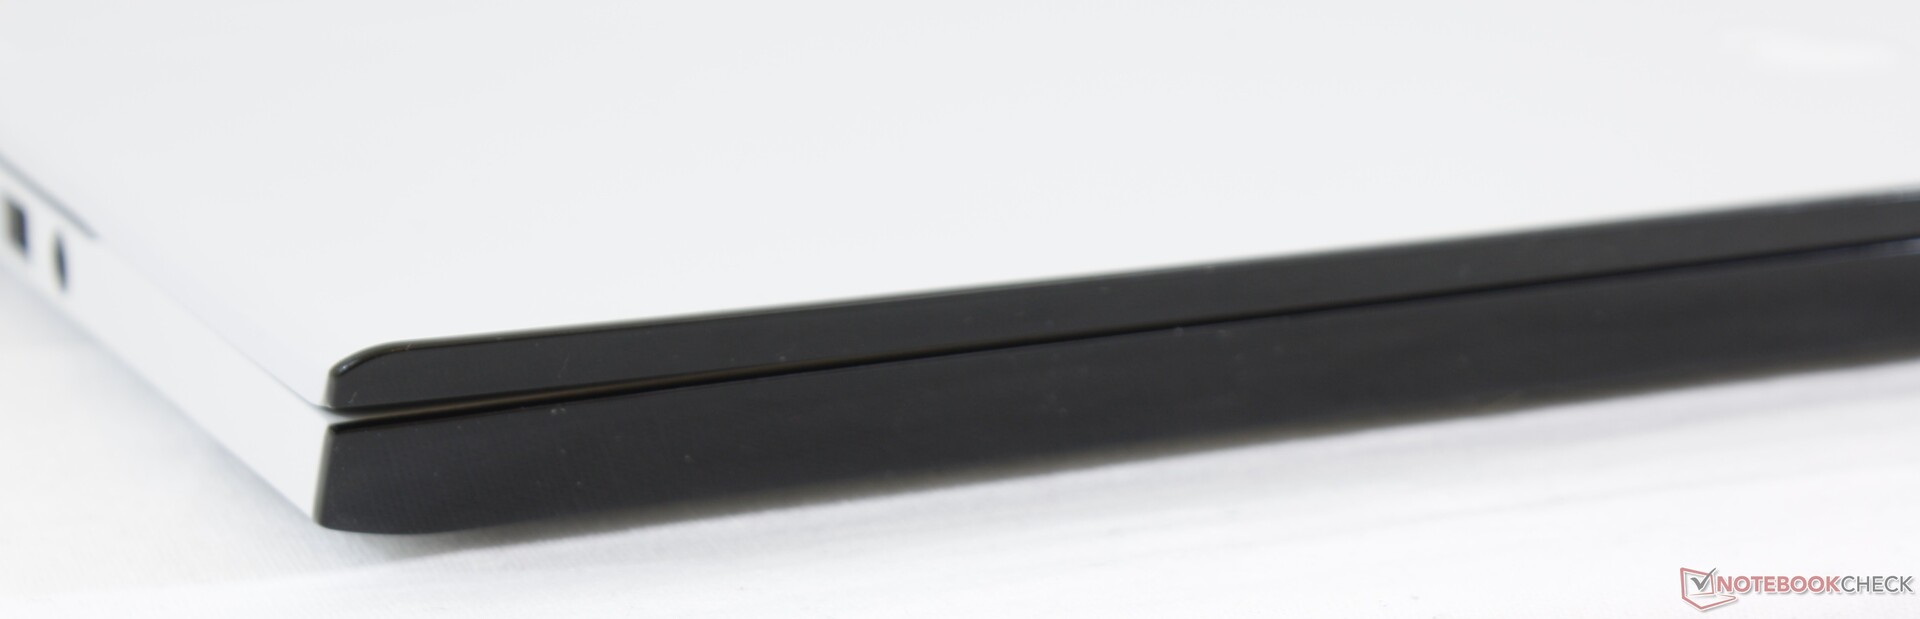
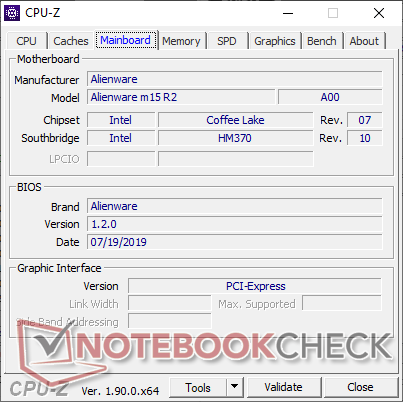
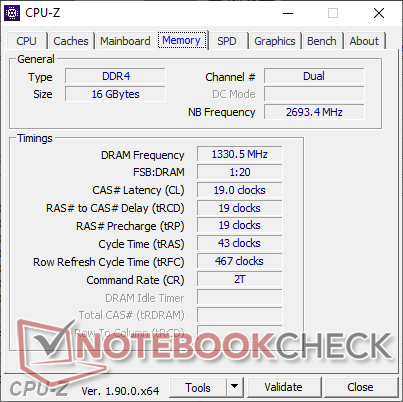
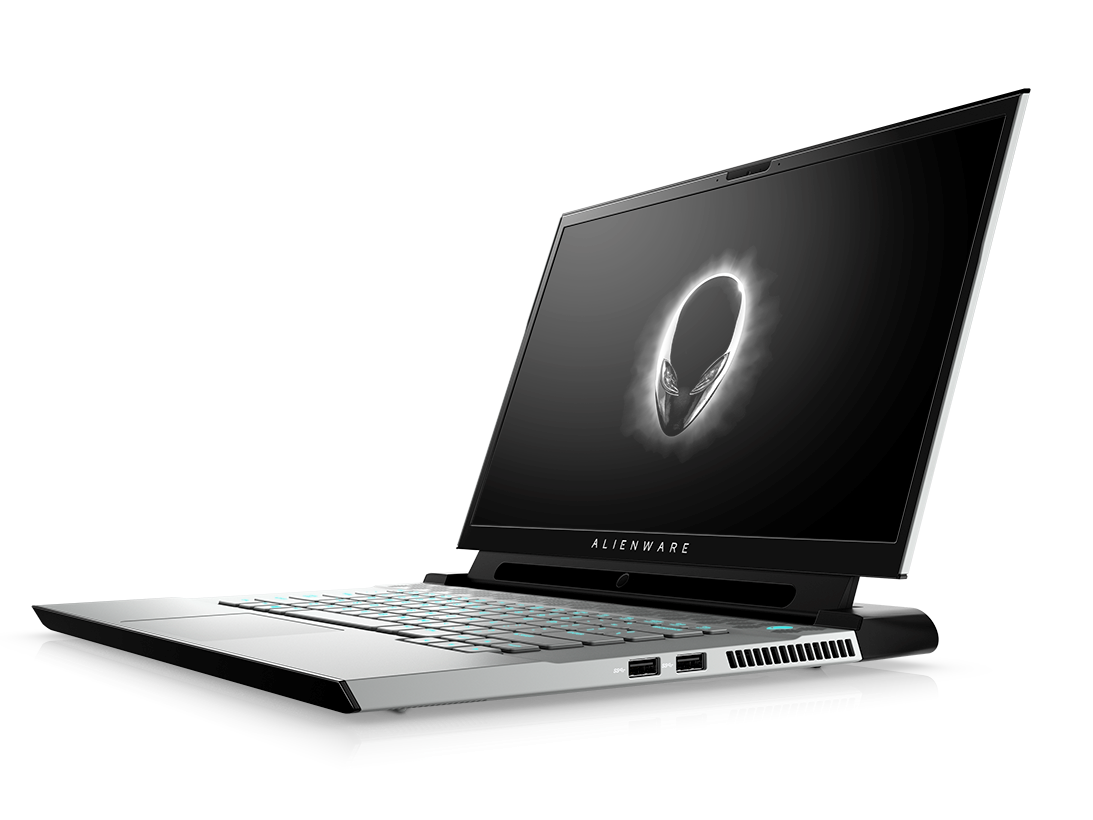
Als tweede generatie model in de serie hadden we van de Alienware m15 R2 verwacht dat deze op alle vlakken objectief beter was dan de eerste generatie Alienware m15 R1. Dit is zelfs op papier niet altijd het geval; zowel RAM als WLAN zijn nu gesoldeerd en de batterijcapaciteit is kleiner. Daar krijgen gebruikers wel 2.5 GBit Ethernet, verbeterd toetsenbord feedback, optioneel Wi-Fi 6, individueel RGB verlichte toetsen en een naar onze mening fraaier ontwerp voor terug. Deze laatste lijkt niet sterker of zwakker dan het voorgaande ontwerp en dit pluspunt is dan ook een kwestie van smaak.
Wanneer je de m15 R2 nader bekijkt worden de nadelen duidelijker. Met name de CPU temperaturen tijdens gamen zijn met bijna 100 °C te hoog om comfortabel te zijn, zelfs met de ventilatoren op volle snelheid. We hadden vergevingsgezinder kunnen zijn naar de hoge temperaturen als dit samen gekomen was met stillere koeling of betere prestaties dan de concurrentie, maar dat is niet het geval. Alternatieven zoals de Asus Zephyrus S GX531, HP Omen 15, Razer Blade 15 of MSI GS65 blijven allen ongeveer 20 °C koeler en er lijkt dan ook geen goede reden waarom de Alienware m15 R2 dat niet zou kunnen. We zagen dit helaas ook al in de oudere Alienware m15 R1 waarmee het erop lijkt dat de m15 R2 behuizing niet ons voornaamste punt van kritiek opgelost heeft.
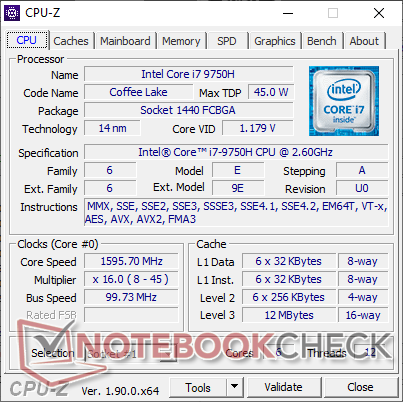
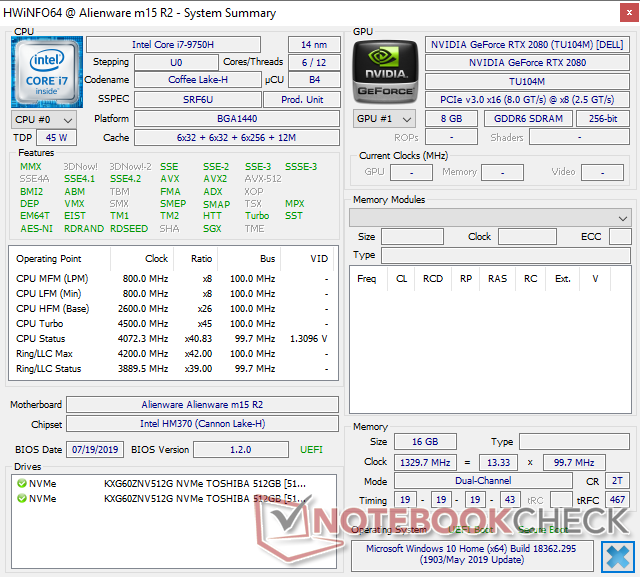
Wellicht is het een resultaat van de hoge CPU temperaturen, maar de Core i7-9750H in de m15 R2 presteert iets lager dan de gemiddelde i7-9750H in onze database, en zelfs lager dan de Core i7-8750H in de Alienware m15 R1. De CPU kloksnelheden variëren meer dan verwacht en de framerates in games zijn dan ook lager wanneer de CPU zwaar belast wordt.
Als je op zoek bent naar een Alienware notebook kun je prima de oudere Alienware m15 R1 ook in overweging nemen, omdat de m15 R2 meer een horizontale stap is qua prestaties, uitbreidbaarheid en features. We raden aan om te investeren in een beeldscherm met een hoge verversingsfrequentie, en configuratie met Core i9 of de standaard 8 GB RAM links te laten liggen.
De nieuwe upgrades ten opzicht van de Alienware m15 R1 blijken erg oppervlakkig. Hoewel de Alienware m15 R2 er strakker uitziet en individueel RGB verlichte toetsen heeft, zijn interne eigenschappen zoals systeemgeluid en erg hoge CPU temperaturen niet echt veranderd.
Alienware m15 R2 P87F
- 05-09-2019 v7 (old)
Allen Ngo
Price comparison
