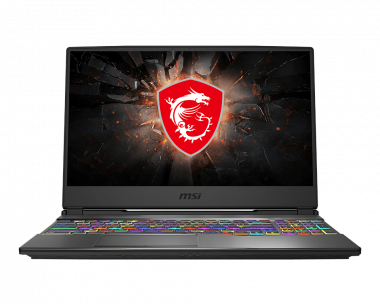
Kort testrapport MSI GP65 Leopard 9SE Laptop - beste beeldscherm in een middenklasse game notebook
| SD Card Reader | |
| average JPG Copy Test (av. of 3 runs) | |
| Eurocom Nightsky Ti15 (Toshiba Exceria Pro SDXC 64 GB UHS-II) | |
| Gemiddelde van klas Gaming (20.9 - 210, n=54, laatste 2 jaar) | |
| CUK Model Z GK5CQ7Z (Toshiba Exceria Pro SDXC 64 GB UHS-II) | |
| HP Omen 15-dc1303ng (Toshiba Exceria Pro SDXC 64 GB UHS-II) | |
| MSI GP65 Leopard 9SE-225US | |
| maximum AS SSD Seq Read Test (1GB) | |
| Eurocom Nightsky Ti15 (Toshiba Exceria Pro SDXC 64 GB UHS-II) | |
| Gemiddelde van klas Gaming (25.5 - 261, n=51, laatste 2 jaar) | |
| CUK Model Z GK5CQ7Z (Toshiba Exceria Pro SDXC 64 GB UHS-II) | |
| HP Omen 15-dc1303ng (Toshiba Exceria Pro SDXC 64 GB UHS-II) | |
| MSI GP65 Leopard 9SE-225US | |
| Networking | |
| iperf3 transmit AX12 | |
| Eurocom Nightsky Ti15 | |
| MSI GP65 Leopard 9SE-225US | |
| Lenovo Legion Y540-15IRH-81SX00B2GE | |
| CUK Model Z GK5CQ7Z | |
| HP Omen 15-dc1303ng | |
| Asus Strix GL531GV-PB74 | |
| iperf3 receive AX12 | |
| MSI GP65 Leopard 9SE-225US | |
| Eurocom Nightsky Ti15 | |
| HP Omen 15-dc1303ng | |
| Asus Strix GL531GV-PB74 | |
| CUK Model Z GK5CQ7Z | |
| Lenovo Legion Y540-15IRH-81SX00B2GE | |
| |||||||||||||||||||||||||
Helderheidsverdeling: 85 %
Helderheid in Batterij-modus: 348.3 cd/m²
Contrast: 871:1 (Zwart: 0.4 cd/m²)
ΔE ColorChecker Calman: 1.6 | ∀{0.5-29.43 Ø4.72}
calibrated: 1
ΔE Greyscale Calman: 2.3 | ∀{0.09-98 Ø4.97}
96% sRGB (Argyll 1.6.3 3D)
61% AdobeRGB 1998 (Argyll 1.6.3 3D)
66.3% AdobeRGB 1998 (Argyll 3D)
96.2% sRGB (Argyll 3D)
64.8% Display P3 (Argyll 3D)
Gamma: 2.203
CCT: 6707 K
| MSI GP65 Leopard 9SE-225US LG Philips LGD0625, IPS, 15.6", 1920x1080 | HP Omen 15-dc1303ng LG Philips LGD05C0, IPS, 15.6", 1920x1080 | Lenovo Legion Y540-15IRH-81SX00B2GE BOE 084D, IPS, 15.6", 1920x1080 | Asus Strix GL531GV-PB74 Panda LM156LF-GL02, IPS, 15.6", 1920x1080 | CUK Model Z GK5CQ7Z LG Philips LGD05C0, IPS, 15.6", 1920x1080 | Eurocom Nightsky Ti15 AU Optronics B156HAN, IPS, 15.6", 1920x1080 | |
|---|---|---|---|---|---|---|
| Display | -2% | -3% | -37% | -1% | -2% | |
| Display P3 Coverage (%) | 64.8 | 63.8 -2% | 63.6 -2% | 40.13 -38% | 64.5 0% | 65.2 1% |
| sRGB Coverage (%) | 96.2 | 93.4 -3% | 91.7 -5% | 60.3 -37% | 93 -3% | 90.9 -6% |
| AdobeRGB 1998 Coverage (%) | 66.3 | 65 -2% | 65.2 -2% | 41.48 -37% | 65.7 -1% | 66.3 0% |
| Response Times | -26% | -4% | -159% | -29% | -21% | |
| Response Time Grey 50% / Grey 80% * (ms) | 9.6 ? | 14 ? -46% | 8.8 ? 8% | 26 ? -171% | 13.6 ? -42% | 14.4 ? -50% |
| Response Time Black / White * (ms) | 10.4 ? | 11 ? -6% | 12 ? -15% | 25.6 ? -146% | 12 ? -15% | 9.6 ? 8% |
| PWM Frequency (Hz) | ||||||
| Screen | -17% | -30% | -99% | -26% | -45% | |
| Brightness middle (cd/m²) | 348.3 | 316 -9% | 299 -14% | 290.1 -17% | 306.8 -12% | 331 -5% |
| Brightness (cd/m²) | 327 | 295 -10% | 290 -11% | 274 -16% | 309 -6% | 327 0% |
| Brightness Distribution (%) | 85 | 84 -1% | 89 5% | 86 1% | 87 2% | 83 -2% |
| Black Level * (cd/m²) | 0.4 | 0.42 -5% | 0.29 28% | 0.54 -35% | 0.38 5% | 0.35 13% |
| Contrast (:1) | 871 | 752 -14% | 1031 18% | 537 -38% | 807 -7% | 946 9% |
| Colorchecker dE 2000 * | 1.6 | 2.7 -69% | 3.7 -131% | 5.16 -223% | 3.16 -98% | 4.22 -164% |
| Colorchecker dE 2000 max. * | 5.07 | 5.65 -11% | 7 -38% | 18.09 -257% | 6.05 -19% | 6.95 -37% |
| Colorchecker dE 2000 calibrated * | 1 | 1.58 -58% | 2 -100% | 4.35 -335% | 2.4 -140% | 3.27 -227% |
| Greyscale dE 2000 * | 2.3 | 2.35 -2% | 4.1 -78% | 4.4 -91% | 2.3 -0% | 3.9 -70% |
| Gamma | 2.203 100% | 2.41 91% | 2.19 100% | 2.1 105% | 2.17 101% | 2.26 97% |
| CCT | 6707 97% | 6904 94% | 7166 91% | 7362 88% | 6557 99% | 7392 88% |
| Color Space (Percent of AdobeRGB 1998) (%) | 61 | 60 -2% | 59.3 -3% | 38.1 -38% | 60 -2% | 59 -3% |
| Color Space (Percent of sRGB) (%) | 96 | 93 -3% | 91.5 -5% | 60 -37% | 92.6 -4% | 90.5 -6% |
| Totaal Gemiddelde (Programma / Instellingen) | -15% /
-15% | -12% /
-22% | -98% /
-95% | -19% /
-21% | -23% /
-34% |
* ... kleiner is beter
Responstijd Scherm
| ↔ Responstijd Zwart naar Wit | ||
|---|---|---|
| 10.4 ms ... stijging ↗ en daling ↘ gecombineerd | ↗ 6 ms stijging | 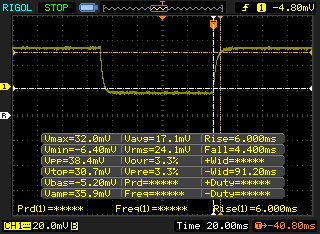 |
| ↘ 4.4 ms daling | ||
| Het scherm vertoonde prima responstijden in onze tests maar is misschien wat te traag voor competitieve games. Ter vergelijking: alle testtoestellen variëren van 0.1 (minimum) tot 240 (maximum) ms. » 28 % van alle toestellen zijn beter. Dit betekent dat de gemeten responstijd beter is dan het gemiddelde (19.8 ms) van alle geteste toestellen. | ||
| ↔ Responstijd 50% Grijs naar 80% Grijs | ||
| 9.6 ms ... stijging ↗ en daling ↘ gecombineerd | ↗ 6 ms stijging | 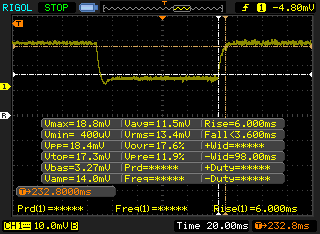 |
| ↘ 3.6 ms daling | ||
| Het scherm vertoonde snelle responstijden in onze tests en zou geschikt moeten zijn voor games. Ter vergelijking: alle testtoestellen variëren van 0.165 (minimum) tot 636 (maximum) ms. » 23 % van alle toestellen zijn beter. Dit betekent dat de gemeten responstijd beter is dan het gemiddelde (31 ms) van alle geteste toestellen. | ||
Screen Flickering / PWM (Pulse-Width Modulation)
| Screen flickering / PWM niet waargenomen | 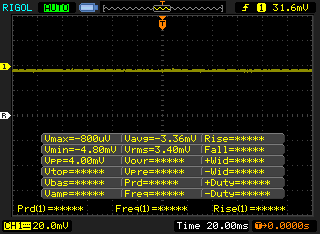 | ||
Ter vergelijking: 52 % van alle geteste toestellen maakten geen gebruik van PWM om de schermhelderheid te verlagen. Als het wel werd gebruikt, werd een gemiddelde van 7763 (minimum: 5 - maximum: 343500) Hz waargenomen. | |||
| Cinebench R15 | |
| CPU Single 64Bit | |
| Gemiddelde van klas Gaming (188.8 - 343, n=109, laatste 2 jaar) | |
| Lenovo ThinkPad P1 2019-20QT000RGE | |
| MSI GP65 Leopard 9SE-225US | |
| Schenker Slim 15 Comet Lake U | |
| Gemiddeld Intel Core i7-9750H (170 - 194, n=82) | |
| Dell Inspiron 7390 2-in-1 | |
| Lenovo Legion Y540-17IRH | |
| Schenker Key 16 | |
| Eurocom Nightsky Ti15 | |
| Asus TUF FX505DT-EB73 | |
| CPU Multi 64Bit | |
| Gemiddelde van klas Gaming (1578 - 6271, n=108, laatste 2 jaar) | |
| Eurocom Nightsky Ti15 | |
| MSI GP65 Leopard 9SE-225US | |
| Gemiddeld Intel Core i7-9750H (952 - 1306, n=85) | |
| Schenker Key 16 | |
| Lenovo ThinkPad P1 2019-20QT000RGE | |
| Lenovo Legion Y540-17IRH | |
| Asus TUF FX505DT-EB73 | |
| Schenker Slim 15 Comet Lake U | |
| Schenker Slim 15 Comet Lake U | |
| Schenker Slim 15 Comet Lake U | |
| Dell Inspiron 7390 2-in-1 | |
| Cinebench R11.5 | |
| CPU Single 64Bit | |
| Gemiddelde van klas Gaming (3.3 - 3.98, n=8, laatste 2 jaar) | |
| Lenovo ThinkPad P1 2019-20QT000RGE | |
| Gemiddeld Intel Core i7-9750H (1.96 - 2.19, n=10) | |
| Eurocom Nightsky Ti15 | |
| CPU Multi 64Bit | |
| Gemiddelde van klas Gaming (29.8 - 70.7, n=8, laatste 2 jaar) | |
| Eurocom Nightsky Ti15 | |
| Gemiddeld Intel Core i7-9750H (11.3 - 14.1, n=10) | |
| Lenovo ThinkPad P1 2019-20QT000RGE | |
| wPrime 2.10 - 1024m | |
| Lenovo ThinkPad P1 2019-20QT000RGE | |
| Gemiddeld Intel Core i7-9750H (n=1) | |
| Gemiddelde van klas Gaming (33 - 210, n=5, laatste 2 jaar) | |
* ... kleiner is beter
| PCMark 8 | |
| Home Score Accelerated v2 | |
| Gemiddelde van klas Gaming (n=1laatste 2 jaar) | |
| HP Omen 15-dc1303ng | |
| Lenovo Legion Y540-15IRH-81SX00B2GE | |
| CUK Model Z GK5CQ7Z | |
| MSI GP65 Leopard 9SE-225US | |
| Gemiddeld Intel Core i7-9750H, NVIDIA GeForce RTX 2060 Mobile (3533 - 5185, n=11) | |
| Asus Strix GL531GV-PB74 | |
| Eurocom Nightsky Ti15 | |
| Work Score Accelerated v2 | |
| HP Omen 15-dc1303ng | |
| MSI GP65 Leopard 9SE-225US | |
| CUK Model Z GK5CQ7Z | |
| Gemiddeld Intel Core i7-9750H, NVIDIA GeForce RTX 2060 Mobile (4450 - 5931, n=11) | |
| Eurocom Nightsky Ti15 | |
| Asus Strix GL531GV-PB74 | |
| Lenovo Legion Y540-15IRH-81SX00B2GE | |
| Gemiddelde van klas Gaming (n=1laatste 2 jaar) | |
| PCMark 8 Home Score Accelerated v2 | 4456 punten | |
| PCMark 8 Work Score Accelerated v2 | 5808 punten | |
| PCMark 10 Score | 5834 punten | |
Help | ||
| MSI GP65 Leopard 9SE-225US Toshiba KBG30ZMT512G | HP Omen 15-dc1303ng Samsung SSD PM981 MZVLB256HAHQ | Lenovo Legion Y540-15IRH-81SX00B2GE WDC PC SN720 SDAPNTW-512G | Asus Strix GL531GV-PB74 Intel SSD 660p SSDPEKNW512G8 | CUK Model Z GK5CQ7Z Intel SSD 660p 2TB SSDPEKNW020T8 | Eurocom Nightsky Ti15 Samsung SSD 970 Pro 512GB | Gemiddeld Toshiba KBG30ZMT512G | |
|---|---|---|---|---|---|---|---|
| AS SSD | 119% | 151% | 55% | 89% | 196% | 12% | |
| Seq Read (MB/s) | 1307 | 2485 90% | 2927 124% | 1280 -2% | 1283 -2% | 2168 66% | 1326 ? 1% |
| Seq Write (MB/s) | 730 | 1575 116% | 2149 194% | 905 24% | 1730 137% | 2194 201% | 755 ? 3% |
| 4K Read (MB/s) | 27.58 | 53.4 94% | 42.43 54% | 48.73 77% | 49.89 81% | 53.2 93% | 39 ? 41% |
| 4K Write (MB/s) | 80.3 | 113.5 41% | 147.1 83% | 107 33% | 110.1 37% | 128.5 60% | 92.6 ? 15% |
| 4K-64 Read (MB/s) | 878 | 725 -17% | 1286 46% | 321.1 -63% | 904 3% | 1320 50% | 873 ? -1% |
| 4K-64 Write (MB/s) | 246.8 | 1371 456% | 1432 480% | 761 208% | 792 221% | 2162 776% | 349 ? 41% |
| Access Time Read * (ms) | 0.231 | 0.059 74% | 0.065 72% | 0.058 75% | 0.036 84% | 0.04 83% | 0.1463 ? 37% |
| Access Time Write * (ms) | 0.223 | 0.032 86% | 0.026 88% | 0.046 79% | 0.042 81% | 0.029 87% | 0.2073 ? 7% |
| Score Read (Points) | 1036 | 1027 -1% | 1621 56% | 498 -52% | 1082 4% | 1590 53% | 1045 ? 1% |
| Score Write (Points) | 400 | 1642 311% | 1794 349% | 958 140% | 1075 169% | 2510 528% | 517 ? 29% |
| Score Total (Points) | 1940 | 3163 63% | 4208 117% | 1711 -12% | 2745 41% | 4924 154% | 2075 ? 7% |
| Copy ISO MB/s (MB/s) | 993 | 1519 53% | 3089 211% | 935 ? -6% | |||
| Copy Program MB/s (MB/s) | 309.5 | 749 142% | 549 77% | 260 ? -16% | |||
| Copy Game MB/s (MB/s) | 582 | 943 62% | 1171 101% | 591 ? 2% |
* ... kleiner is beter

| 3DMark 11 | |
| 1280x720 Performance GPU | |
| Gemiddelde van klas Gaming (21841 - 80022, n=106, laatste 2 jaar) | |
| HP Omen 17-cb0020ng | |
| Origin PC EVO16-S i7-9750H RTX 2080 Max-Q | |
| Eurocom Nightsky RX15 | |
| Acer Predator Triton 500 PT515-51-71PZ | |
| MSI GP65 Leopard 9SE-225US | |
| Gemiddeld NVIDIA GeForce RTX 2060 Mobile (19143 - 24662, n=40) | |
| Eurocom Nightsky Ti15 | |
| Lenovo Legion Y530-15ICH | |
| HP Omen 15-dc1020ng | |
| Dell XPS 15 7590 9980HK GTX 1650 | |
| Asus VivoBook 15 X512FL-EJ205T | |
| 1280x720 Performance Combined | |
| Gemiddelde van klas Gaming (10258 - 30851, n=106, laatste 2 jaar) | |
| Eurocom Nightsky RX15 | |
| HP Omen 17-cb0020ng | |
| MSI GP65 Leopard 9SE-225US | |
| Acer Predator Triton 500 PT515-51-71PZ | |
| Eurocom Nightsky Ti15 | |
| Origin PC EVO16-S i7-9750H RTX 2080 Max-Q | |
| Gemiddeld NVIDIA GeForce RTX 2060 Mobile (1107 - 14726, n=40) | |
| Lenovo Legion Y530-15ICH | |
| HP Omen 15-dc1020ng | |
| Dell XPS 15 7590 9980HK GTX 1650 | |
| Asus VivoBook 15 X512FL-EJ205T | |
| 3DMark 11 Performance | 18447 punten | |
| 3DMark Cloud Gate Standard Score | 37504 punten | |
| 3DMark Fire Strike Score | 15252 punten | |
| 3DMark Time Spy Score | 6117 punten | |
Help | ||
| Rocket League | |
| 1280x720 Performance | |
| MSI GP65 Leopard 9SE-225US | |
| Gemiddeld NVIDIA GeForce RTX 2060 Mobile (244 - 252, n=4) | |
| 1920x1080 Quality AA:Medium FX | |
| MSI GP65 Leopard 9SE-225US | |
| Gemiddeld NVIDIA GeForce RTX 2060 Mobile (242 - 250, n=5) | |
| 1920x1080 High Quality AA:High FX | |
| MSI GP65 Leopard 9SE-225US | |
| Gemiddeld NVIDIA GeForce RTX 2060 Mobile (180.6 - 247, n=5) | |
| Monster Hunter World | |
| 1280x720 Low Preset (Image Quality High) | |
| MSI GP65 Leopard 9SE-225US | |
| Gemiddeld NVIDIA GeForce RTX 2060 Mobile (n=1) | |
| 1920x1080 Mid Preset (Image Quality High) | |
| Gemiddeld NVIDIA GeForce RTX 2060 Mobile (102 - 104, n=2) | |
| MSI GP65 Leopard 9SE-225US | |
| 1920x1080 High Preset (Image Quality High) | |
| MSI GP65 Leopard 9SE-225US | |
| Gemiddeld NVIDIA GeForce RTX 2060 Mobile (89.9 - 96, n=2) | |
| 1920x1080 Highest Preset (Image Quality High) | |
| Gemiddeld NVIDIA GeForce RTX 2060 Mobile (70 - 70.2, n=2) | |
| MSI GP65 Leopard 9SE-225US | |
| Hitman 2 | |
| 1280x720 Low AF:Trilinear | |
| MSI GP65 Leopard 9SE-225US | |
| Gemiddeld NVIDIA GeForce RTX 2060 Mobile (n=1) | |
| 1920x1080 Medium AF:4x | |
| MSI GP65 Leopard 9SE-225US | |
| Gemiddeld NVIDIA GeForce RTX 2060 Mobile (89.4 - 90, n=2) | |
| 1920x1080 High AF:8x | |
| MSI GP65 Leopard 9SE-225US | |
| Gemiddeld NVIDIA GeForce RTX 2060 Mobile (81.4 - 85, n=2) | |
| 1920x1080 Ultra AF:16x | |
| Gemiddeld NVIDIA GeForce RTX 2060 Mobile (74 - 78.4, n=2) | |
| MSI GP65 Leopard 9SE-225US | |
| F1 2019 | |
| 1280x720 Ultra Low Preset | |
| Gemiddeld NVIDIA GeForce RTX 2060 Mobile (166 - 231, n=4) | |
| MSI GP65 Leopard 9SE-225US | |
| 1920x1080 Medium Preset AA:T AF:16x | |
| Gemiddeld NVIDIA GeForce RTX 2060 Mobile (146 - 177, n=4) | |
| MSI GP65 Leopard 9SE-225US | |
| 1920x1080 High Preset AA:T AF:16x | |
| Gemiddeld NVIDIA GeForce RTX 2060 Mobile (122 - 149, n=4) | |
| MSI GP65 Leopard 9SE-225US | |
| 1920x1080 Ultra High Preset AA:T AF:16x | |
| Gemiddeld NVIDIA GeForce RTX 2060 Mobile (97 - 127, n=4) | |
| MSI GP65 Leopard 9SE-225US | |
| lage | gem. | hoge | ultra | |
|---|---|---|---|---|
| The Witcher 3 (2015) | 252 | 178 | 111 | 59 |
| Rocket League (2017) | 250 | 250 | 244 | |
| Monster Hunter World (2018) | 141 | 102 | 96 | 70 |
| Shadow of the Tomb Raider (2018) | 116 | 70 | 66 | 54 |
| Hitman 2 (2018) | 116 | 90 | 85 | 74 |
| F1 2019 (2019) | 166 | 146 | 122 | 104 |
| MSI GP65 Leopard 9SE-225US GeForce RTX 2060 Mobile, i7-9750H, Toshiba KBG30ZMT512G | HP Omen 15-dc1303ng GeForce RTX 2070 Max-Q, i7-8750H, Samsung SSD PM981 MZVLB256HAHQ | Lenovo Legion Y540-15IRH-81SX00B2GE GeForce GTX 1660 Ti Mobile, i7-9750H, WDC PC SN720 SDAPNTW-512G | Asus Strix GL531GV-PB74 GeForce RTX 2060 Mobile, i7-9750H, Intel SSD 660p SSDPEKNW512G8 | CUK Model Z GK5CQ7Z GeForce RTX 2070 Max-Q, i7-9750H, Intel SSD 660p 2TB SSDPEKNW020T8 | Eurocom Nightsky Ti15 GeForce GTX 1660 Ti Mobile, i7-9750H, Samsung SSD 970 Pro 512GB | |
|---|---|---|---|---|---|---|
| Noise | -10% | 1% | -9% | -12% | -8% | |
| uit / omgeving * (dB) | 28.2 | 30.5 -8% | 29.3 -4% | 28.2 -0% | 28.6 -1% | 28.4 -1% |
| Idle Minimum * (dB) | 29.5 | 32.8 -11% | 29.3 1% | 28.8 2% | 30.8 -4% | 28.6 3% |
| Idle Average * (dB) | 29.6 | 32.8 -11% | 29.3 1% | 31.4 -6% | 30.8 -4% | 28.6 3% |
| Idle Maximum * (dB) | 29.6 | 32.8 -11% | 29.3 1% | 33.3 -12% | 35 -18% | 28.6 3% |
| Load Average * (dB) | 33 | 42.5 -29% | 35.7 -8% | 46.2 -40% | 45 -36% | 47.8 -45% |
| Witcher 3 ultra * (dB) | 47.2 | 44.2 6% | 50.5 -7% | 51.6 -9% | 53.7 -14% | |
| Load Maximum * (dB) | 52 | 47.5 9% | 45.6 12% | 51.3 1% | 57.8 -11% | 53.7 -3% |
* ... kleiner is beter
Geluidsniveau
| Onbelast |
| 29.5 / 29.6 / 29.6 dB (A) |
| Belasting |
| 33 / 52 dB (A) |
 | ||
30 dB stil 40 dB(A) hoorbaar 50 dB(A) luid |
||
min: | ||
(-) De maximumtemperatuur aan de bovenzijde bedraagt 48.8 °C / 120 F, vergeleken met het gemiddelde van 40.4 °C / 105 F, variërend van 21.2 tot 68.8 °C voor de klasse Gaming.
(-) De bodem warmt op tot een maximum van 54 °C / 129 F, vergeleken met een gemiddelde van 43.2 °C / 110 F
(±) Bij onbelast gebruik bedraagt de gemiddelde temperatuur voor de bovenzijde 32.4 °C / 90 F, vergeleken met het apparaatgemiddelde van 33.9 °C / 93 F.
(±) Bij het spelen van The Witcher 3 is de gemiddelde temperatuur voor de bovenzijde 35.8 °C / 96 F, vergeleken met het apparaatgemiddelde van 33.9 °C / 93 F.
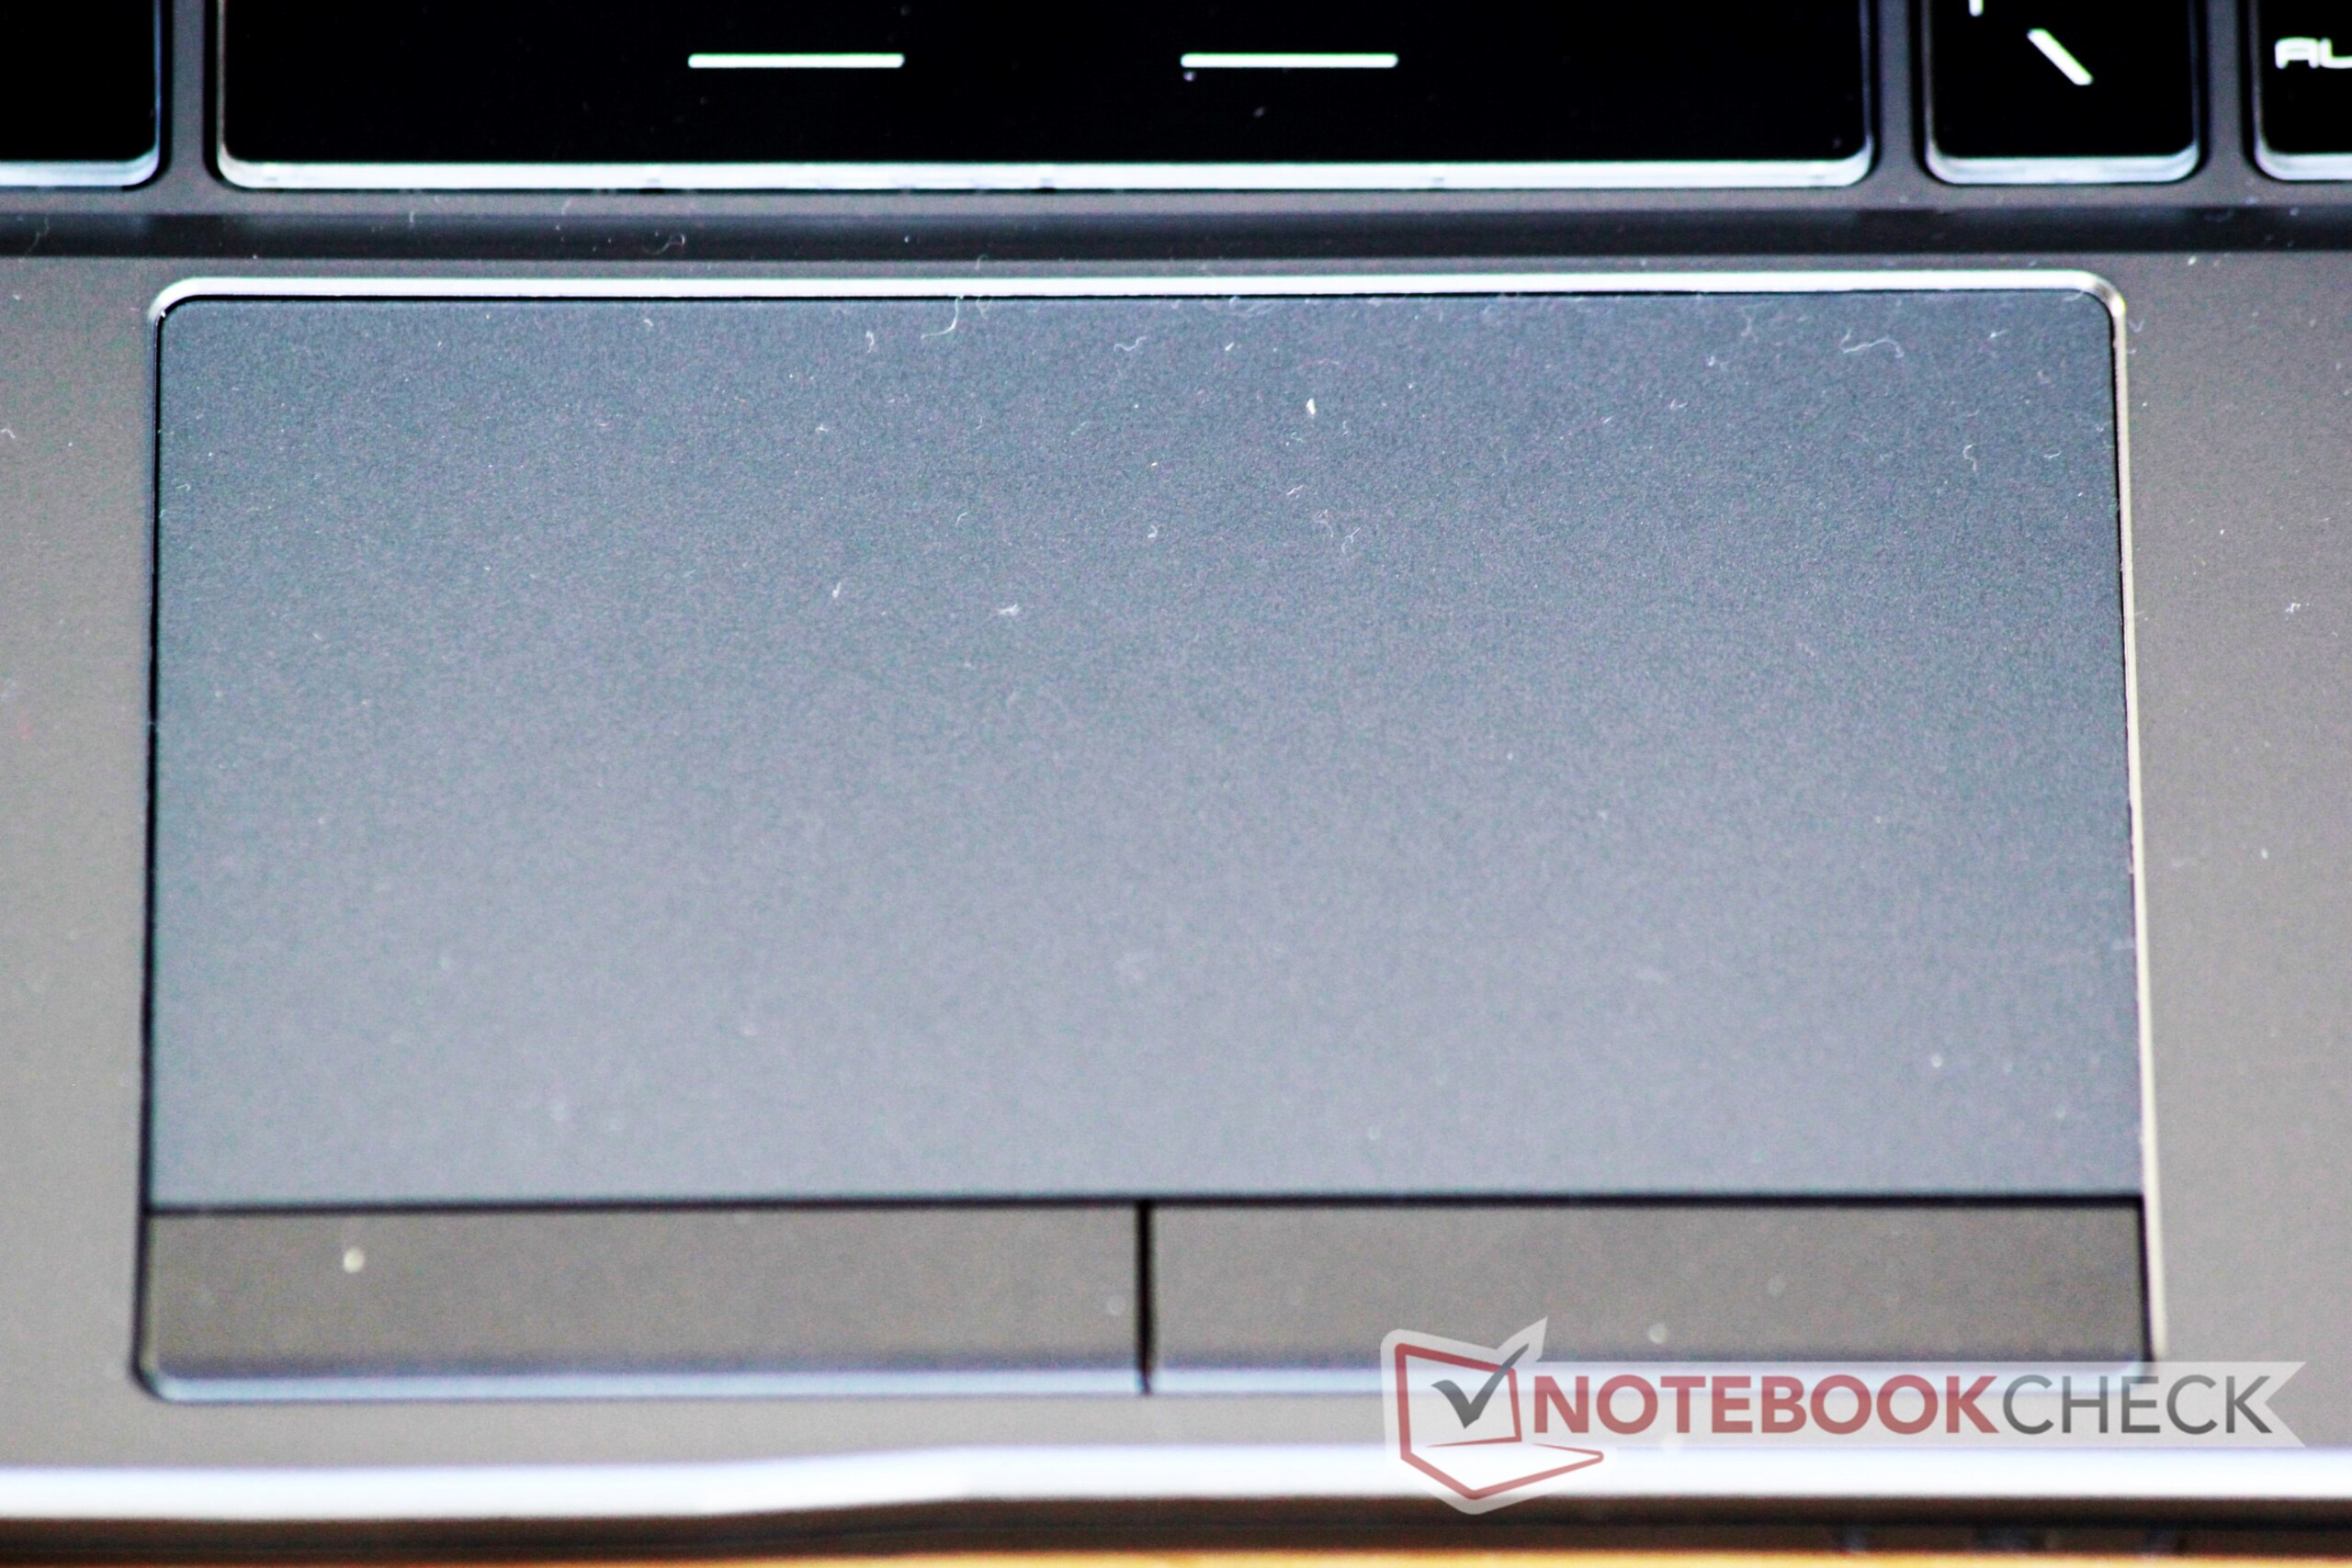
(+) De handpalmsteunen en het touchpad bereiken maximaal de huidtemperatuur (34 °C / 93.2 F) en zijn dus niet heet.
(-) De gemiddelde temperatuur van de handpalmsteun van soortgelijke toestellen bedroeg 28.8 °C / 83.8 F (-5.2 °C / -9.4 F).
MSI GP65 Leopard 9SE-225US audioanalyse
(±) | luidspreker luidheid is gemiddeld maar goed (81 dB)
Bas 100 - 315 Hz
(-) | bijna geen lage tonen - gemiddeld 36.8% lager dan de mediaan
(+) | de lage tonen zijn lineair (5.9% delta naar de vorige frequentie)
Midden 400 - 2000 Hz
(±) | lagere middens - gemiddeld 9.7% lager dan de mediaan
(±) | lineariteit van de middentonen is gemiddeld (9% delta ten opzichte van de vorige frequentie)
Hoog 2 - 16 kHz
(+) | evenwichtige hoogtepunten - slechts 2.2% verwijderd van de mediaan
(+) | de hoge tonen zijn lineair (4% delta naar de vorige frequentie)
Algemeen 100 - 16.000 Hz
(±) | lineariteit van het totale geluid is gemiddeld (29.1% verschil met de mediaan)
Vergeleken met dezelfde klasse
» 94% van alle geteste apparaten in deze klasse waren beter, 2% vergelijkbaar, 4% slechter
» De beste had een delta van 6%, het gemiddelde was 18%, de slechtste was 132%
Vergeleken met alle geteste toestellen
» 87% van alle geteste apparaten waren beter, 2% gelijk, 11% slechter
» De beste had een delta van 4%, het gemiddelde was 24%, de slechtste was 134%
HP Omen 15-dc1303ng audioanalyse
(-) | niet erg luide luidsprekers (67.3 dB)
Bas 100 - 315 Hz
(-) | bijna geen lage tonen - gemiddeld 20.2% lager dan de mediaan
(±) | lineariteit van de lage tonen is gemiddeld (11.4% delta ten opzichte van de vorige frequentie)
Midden 400 - 2000 Hz
(+) | evenwichtige middens - slechts 2.2% verwijderd van de mediaan
(±) | lineariteit van de middentonen is gemiddeld (8.2% delta ten opzichte van de vorige frequentie)
Hoog 2 - 16 kHz
(+) | evenwichtige hoogtepunten - slechts 2.5% verwijderd van de mediaan
(+) | de hoge tonen zijn lineair (5.9% delta naar de vorige frequentie)
Algemeen 100 - 16.000 Hz
(±) | lineariteit van het totale geluid is gemiddeld (20.3% verschil met de mediaan)
Vergeleken met dezelfde klasse
» 72% van alle geteste apparaten in deze klasse waren beter, 6% vergelijkbaar, 23% slechter
» De beste had een delta van 6%, het gemiddelde was 18%, de slechtste was 132%
Vergeleken met alle geteste toestellen
» 53% van alle geteste apparaten waren beter, 8% gelijk, 39% slechter
» De beste had een delta van 4%, het gemiddelde was 24%, de slechtste was 134%
Lenovo Legion Y540-15IRH-81SX00B2GE audioanalyse
(±) | luidspreker luidheid is gemiddeld maar goed (77.4 dB)
Bas 100 - 315 Hz
(-) | bijna geen lage tonen - gemiddeld 17.7% lager dan de mediaan
(±) | lineariteit van de lage tonen is gemiddeld (11.6% delta ten opzichte van de vorige frequentie)
Midden 400 - 2000 Hz
(+) | evenwichtige middens - slechts 3.7% verwijderd van de mediaan
(+) | de middentonen zijn lineair (4.5% delta ten opzichte van de vorige frequentie)
Hoog 2 - 16 kHz
(+) | evenwichtige hoogtepunten - slechts 3.3% verwijderd van de mediaan
(+) | de hoge tonen zijn lineair (5.9% delta naar de vorige frequentie)
Algemeen 100 - 16.000 Hz
(±) | lineariteit van het totale geluid is gemiddeld (18.1% verschil met de mediaan)
Vergeleken met dezelfde klasse
» 57% van alle geteste apparaten in deze klasse waren beter, 8% vergelijkbaar, 35% slechter
» De beste had een delta van 6%, het gemiddelde was 18%, de slechtste was 132%
Vergeleken met alle geteste toestellen
» 38% van alle geteste apparaten waren beter, 8% gelijk, 54% slechter
» De beste had een delta van 4%, het gemiddelde was 24%, de slechtste was 134%
| Uit / Standby | |
| Inactief | |
| Belasting |
|
Key:
min: | |
| MSI GP65 Leopard 9SE-225US i7-9750H, GeForce RTX 2060 Mobile, Toshiba KBG30ZMT512G, IPS, 1920x1080, 15.6" | HP Omen 15-dc1303ng i7-8750H, GeForce RTX 2070 Max-Q, Samsung SSD PM981 MZVLB256HAHQ, IPS, 1920x1080, 15.6" | Lenovo Legion Y540-15IRH-81SX00B2GE i7-9750H, GeForce GTX 1660 Ti Mobile, WDC PC SN720 SDAPNTW-512G, IPS, 1920x1080, 15.6" | Asus Strix GL531GV-PB74 i7-9750H, GeForce RTX 2060 Mobile, Intel SSD 660p SSDPEKNW512G8, IPS, 1920x1080, 15.6" | CUK Model Z GK5CQ7Z i7-9750H, GeForce RTX 2070 Max-Q, Intel SSD 660p 2TB SSDPEKNW020T8, IPS, 1920x1080, 15.6" | Eurocom Nightsky Ti15 i7-9750H, GeForce GTX 1660 Ti Mobile, Samsung SSD 970 Pro 512GB, IPS, 1920x1080, 15.6" | |
|---|---|---|---|---|---|---|
| Power Consumption | 6% | 5% | -6% | -30% | -18% | |
| Idle Minimum * (Watt) | 13.6 | 14.7 -8% | 14.5 -7% | 10.9 20% | 23.5 -73% | 16.8 -24% |
| Idle Average * (Watt) | 17.9 | 18.6 -4% | 18.5 -3% | 14.7 18% | 28 -56% | 29 -62% |
| Idle Maximum * (Watt) | 20.6 | 22.6 -10% | 20 3% | 32.4 -57% | 32 -55% | 30.8 -50% |
| Load Average * (Watt) | 96 | 90 6% | 81.6 15% | 121.9 -27% | 102.4 -7% | 89.2 7% |
| Witcher 3 ultra * (Watt) | 154.6 | 132 15% | 143.5 7% | 142.8 8% | 141.1 9% | |
| Load Maximum * (Watt) | 218.6 | 120 45% | 208.1 5% | 209.6 4% | 209 4% | 192.3 12% |
* ... kleiner is beter
| MSI GP65 Leopard 9SE-225US i7-9750H, GeForce RTX 2060 Mobile, 51 Wh | HP Omen 15-dc1303ng i7-8750H, GeForce RTX 2070 Max-Q, 70 Wh | Lenovo Legion Y540-15IRH-81SX00B2GE i7-9750H, GeForce GTX 1660 Ti Mobile, 57 Wh | Asus Strix GL531GV-PB74 i7-9750H, GeForce RTX 2060 Mobile, 66 Wh | CUK Model Z GK5CQ7Z i7-9750H, GeForce RTX 2070 Max-Q, 46.74 Wh | Eurocom Nightsky Ti15 i7-9750H, GeForce GTX 1660 Ti Mobile, 62 Wh | |
|---|---|---|---|---|---|---|
| Batterijduur | -8% | -18% | -51% | -23% | -8% | |
| Reader / Idle (h) | 6 | 5 -17% | 4 -33% | |||
| WiFi v1.3 (h) | 3.9 | 3.3 -15% | 2.4 -38% | 1.9 -51% | 3 -23% | 3.6 -8% |
| Load (h) | 1.1 | 1.2 9% | 1.3 18% |
Pro
Contra
Dit is de verkorte versie van het originele artikel. Het volledige, Engelse testrapport vind je hier.
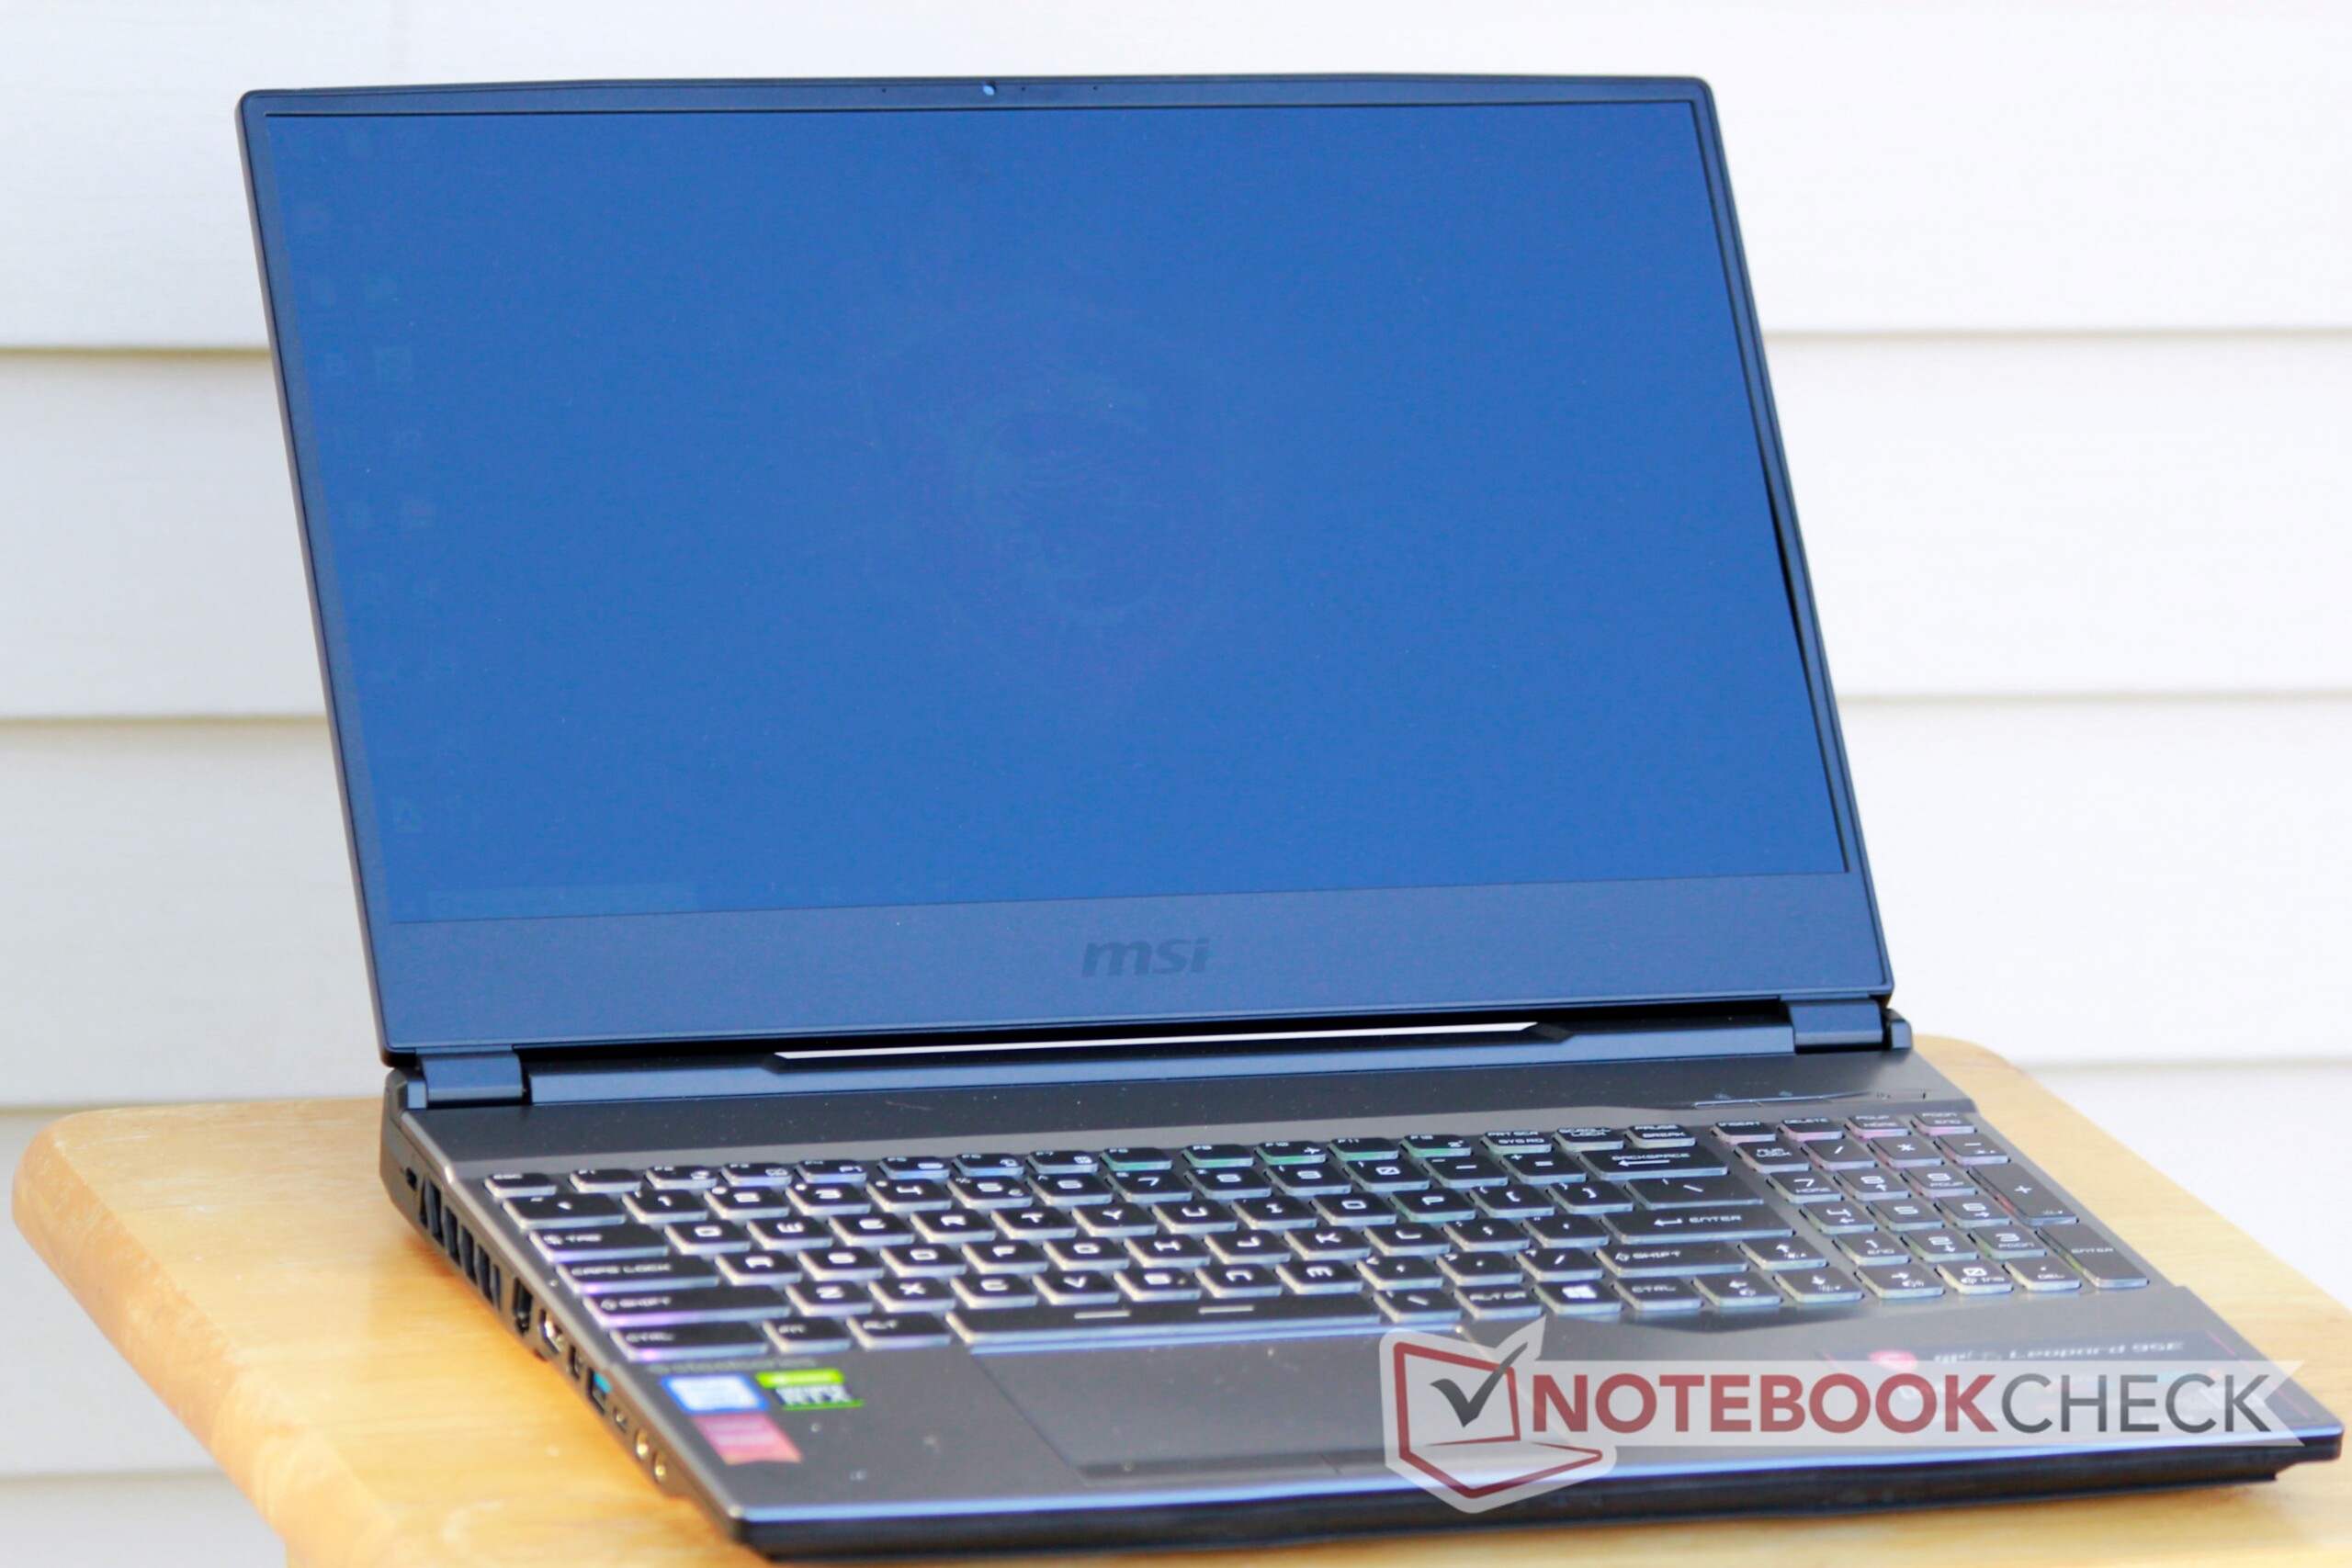
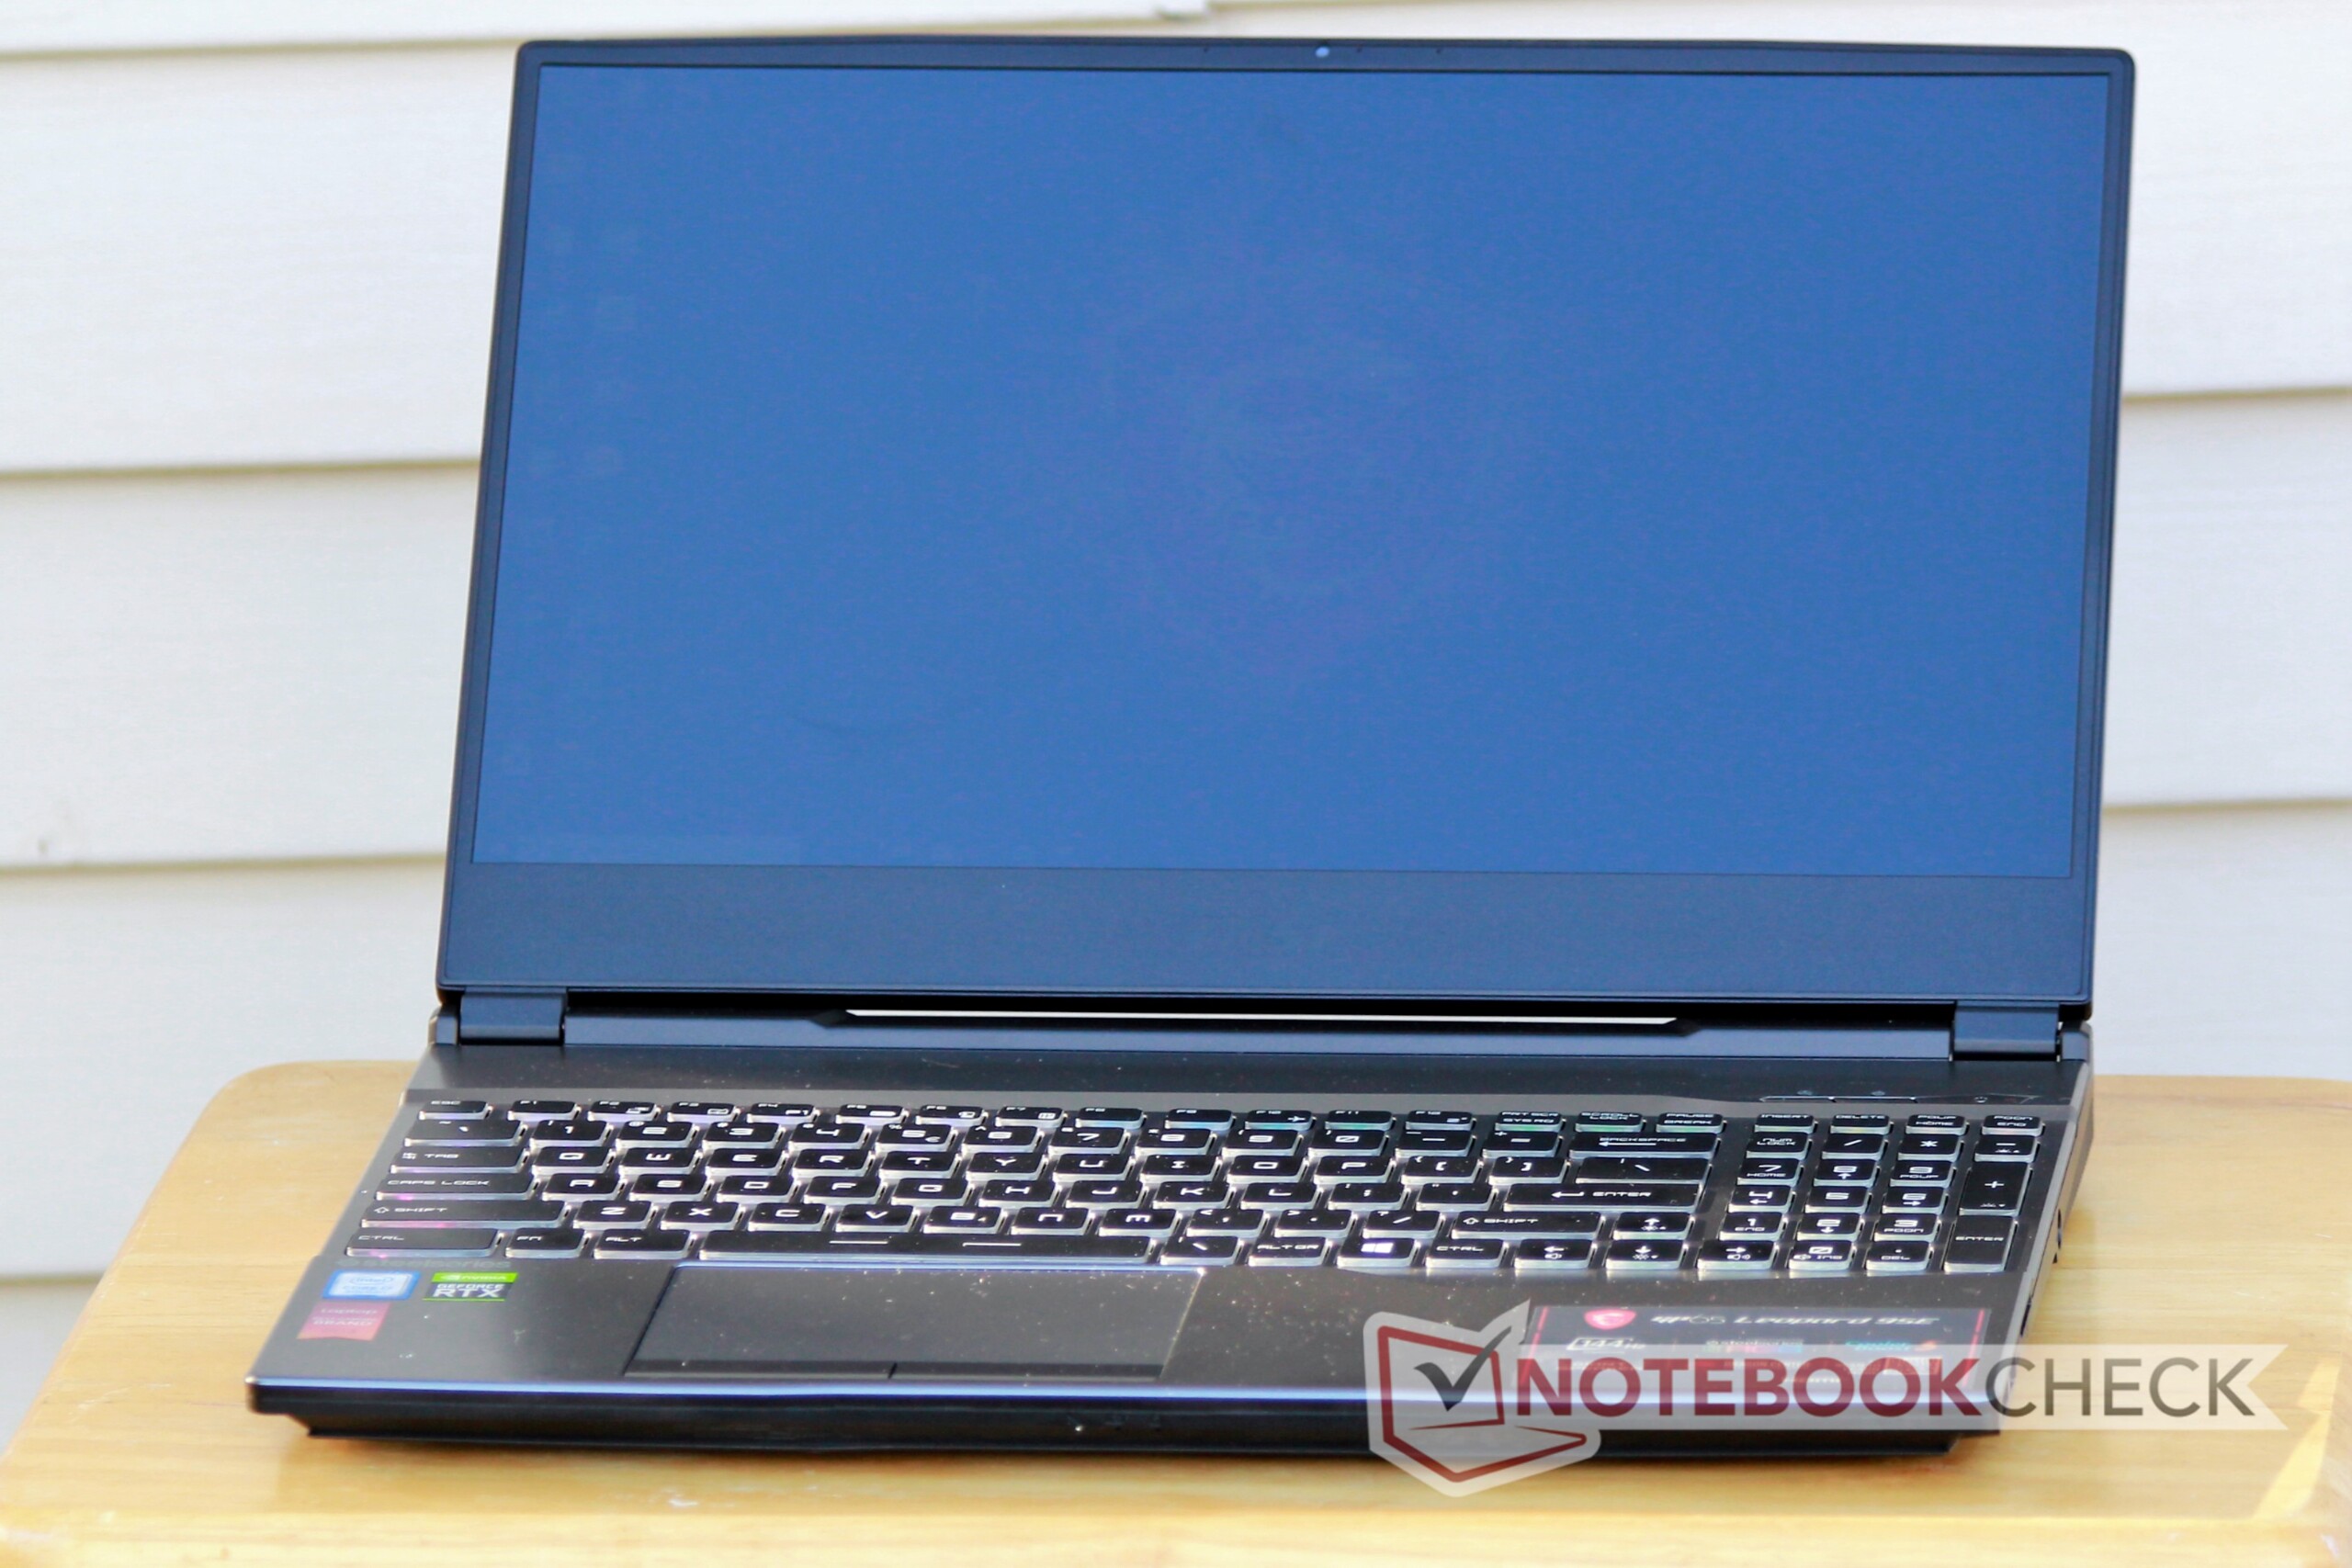
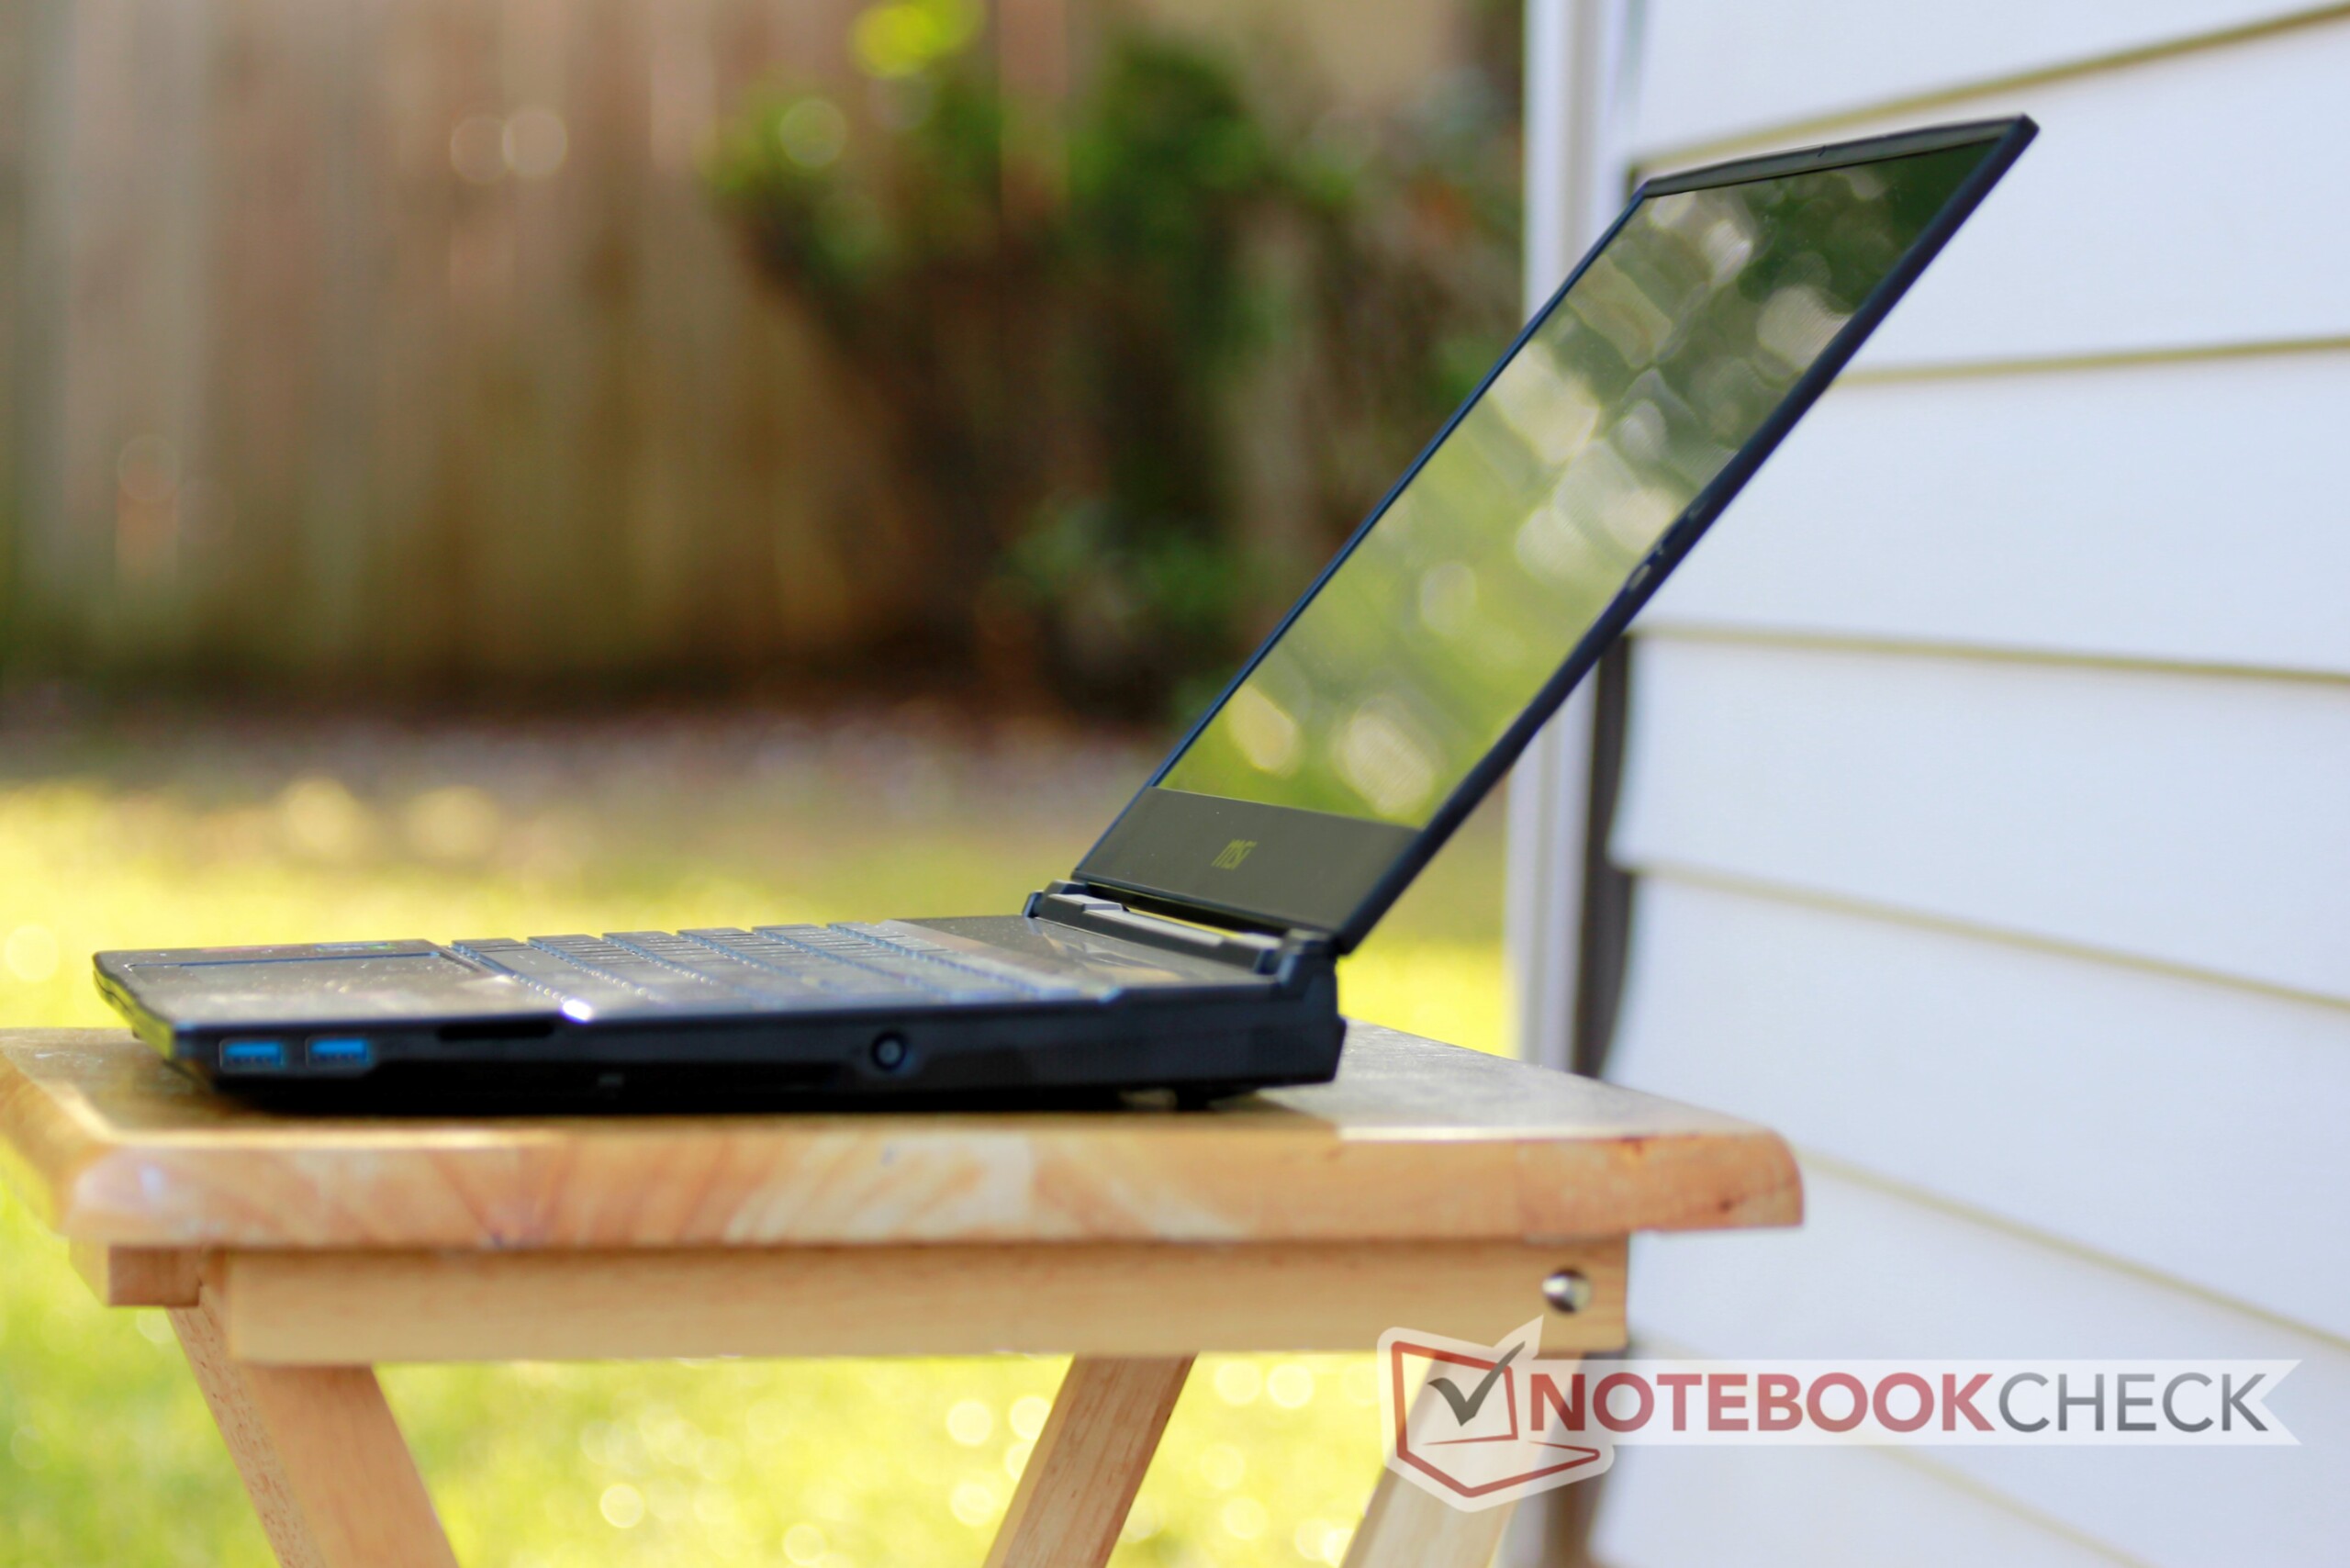
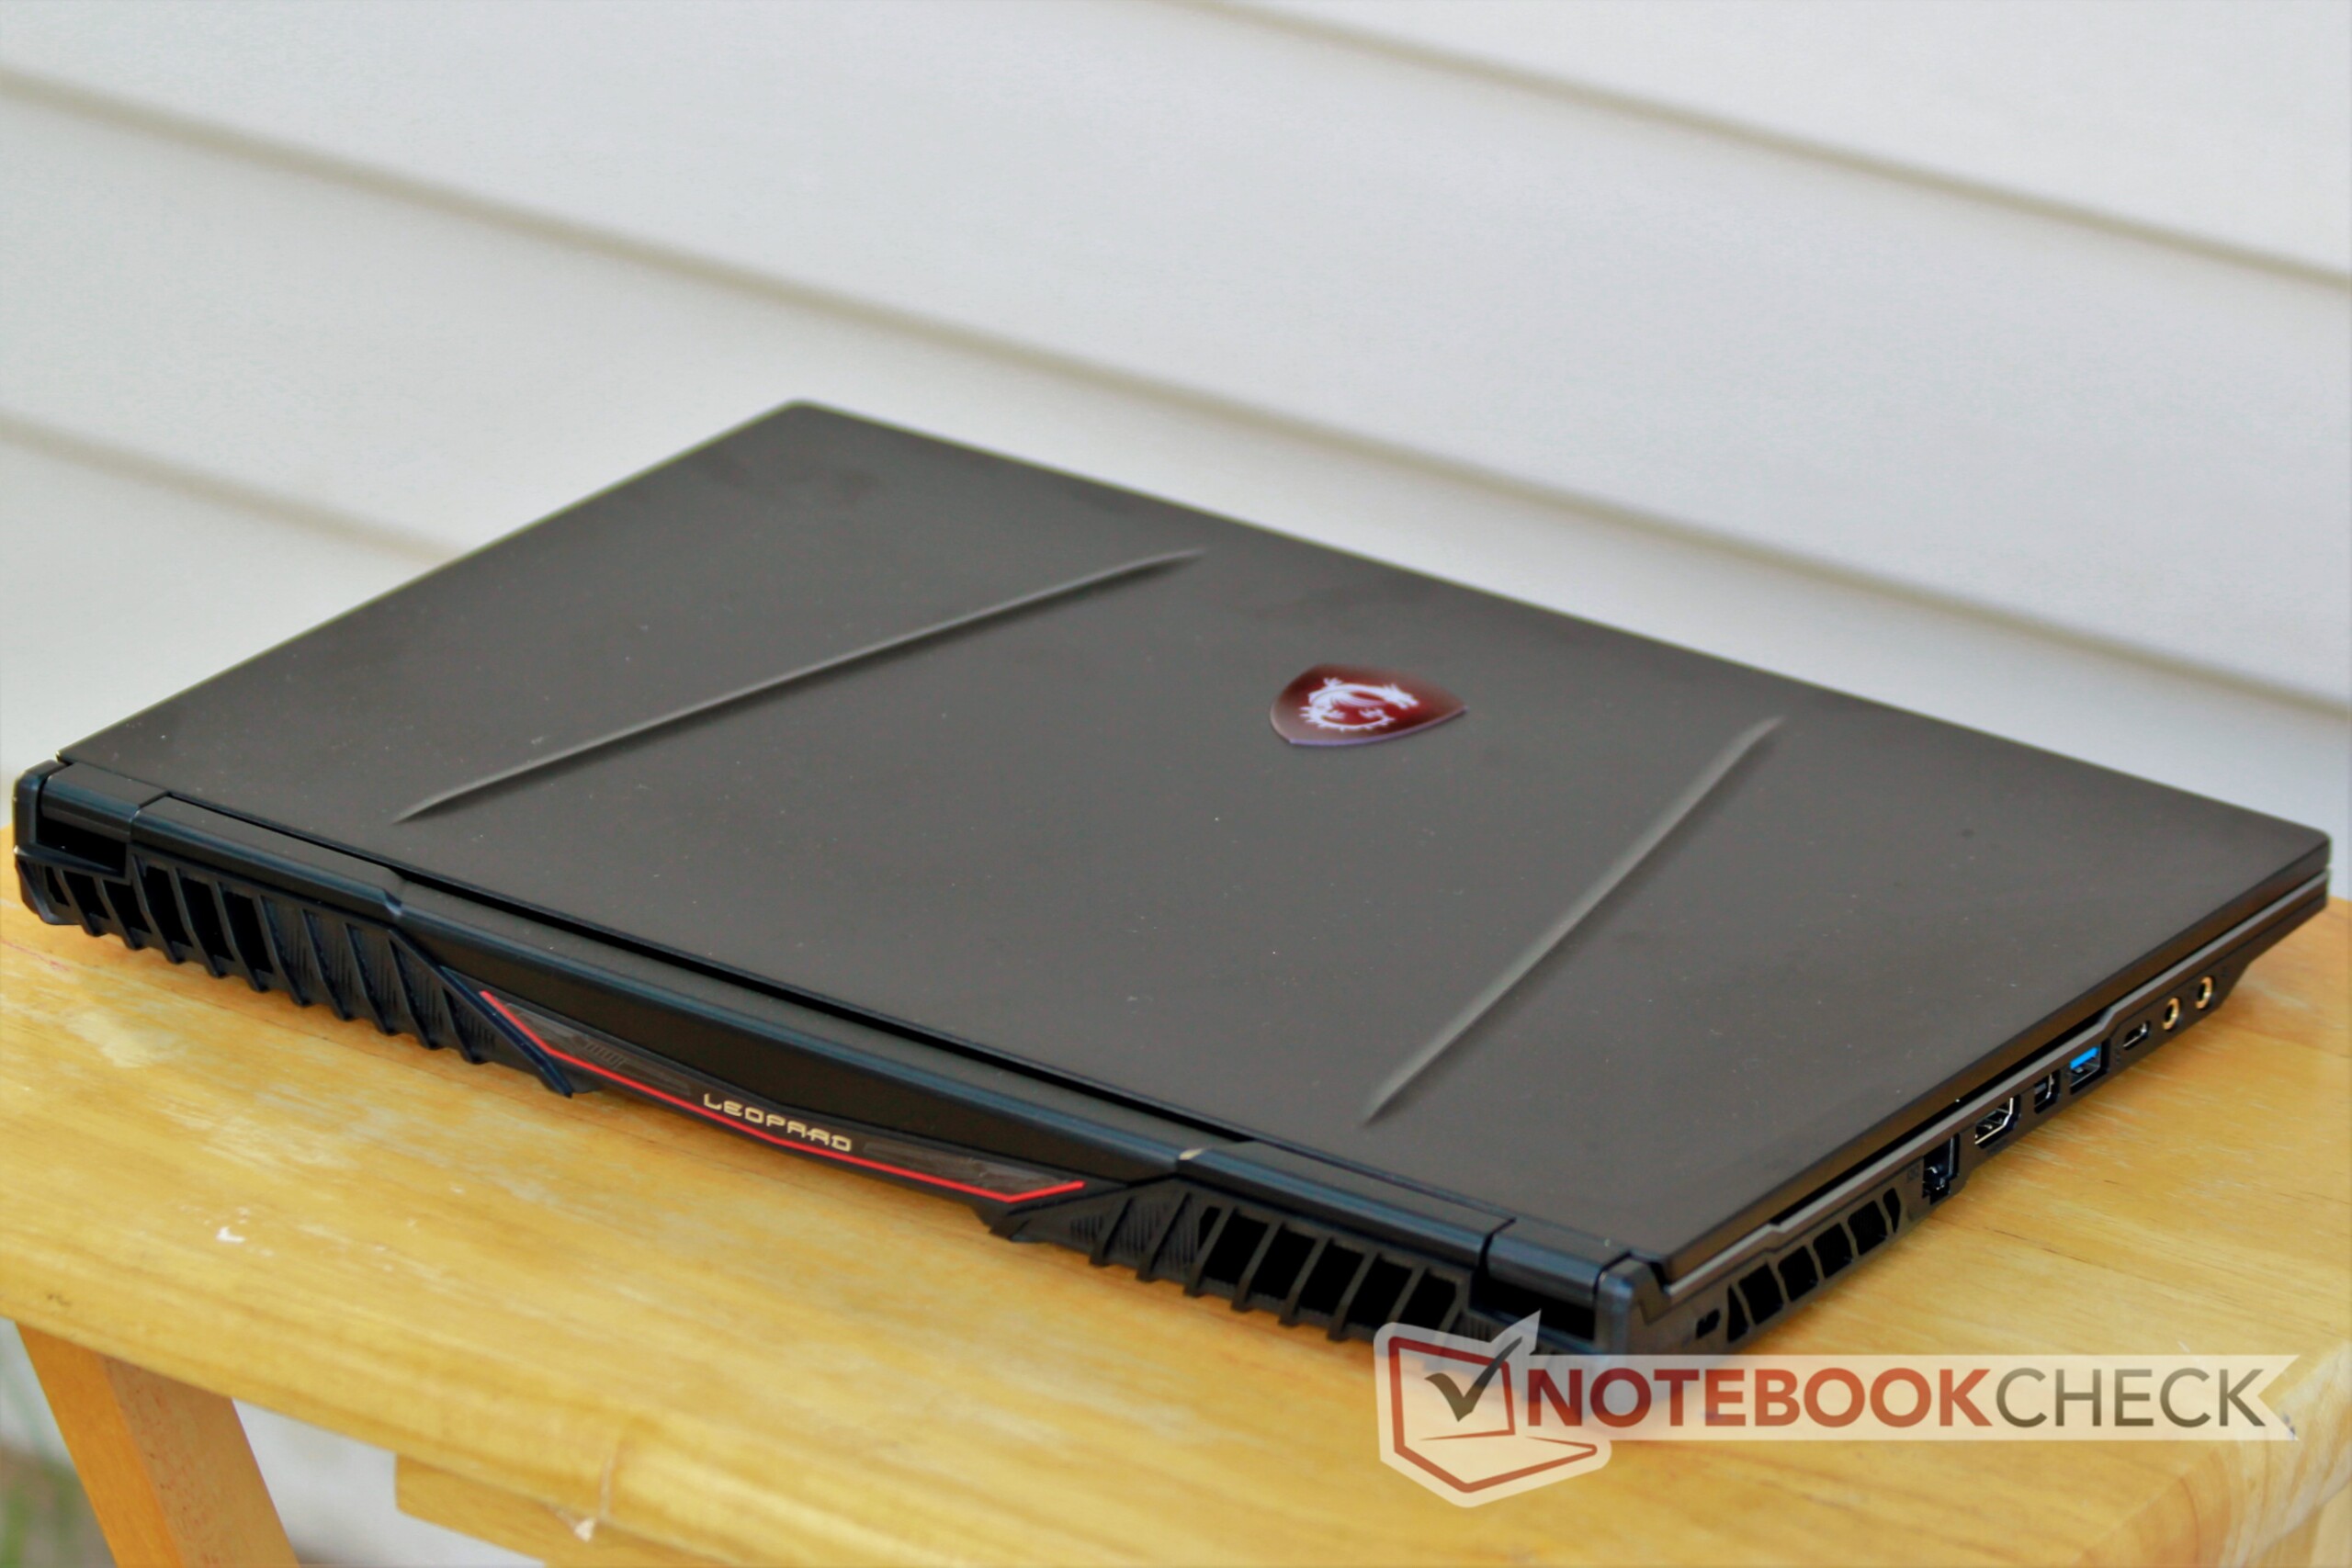
De MSI GP65 Leopard gaat verder waar de GP62 en GP63 gebleven waren. Terwijl de chassis er goedkoop uitziet en aanvoelt, is de hardware onder de motorkap fantastisch voor de prijs. Het 144 Hz beeldscherm in het bijzonder is het absolute hoogtepunt van de laptop. Het scherm biedt niet alleen vloeiende gameplay, maar is ook ontzettend kleuraccuraat, wat eigenlijk ongehoord is in middenklasse game notebooks.
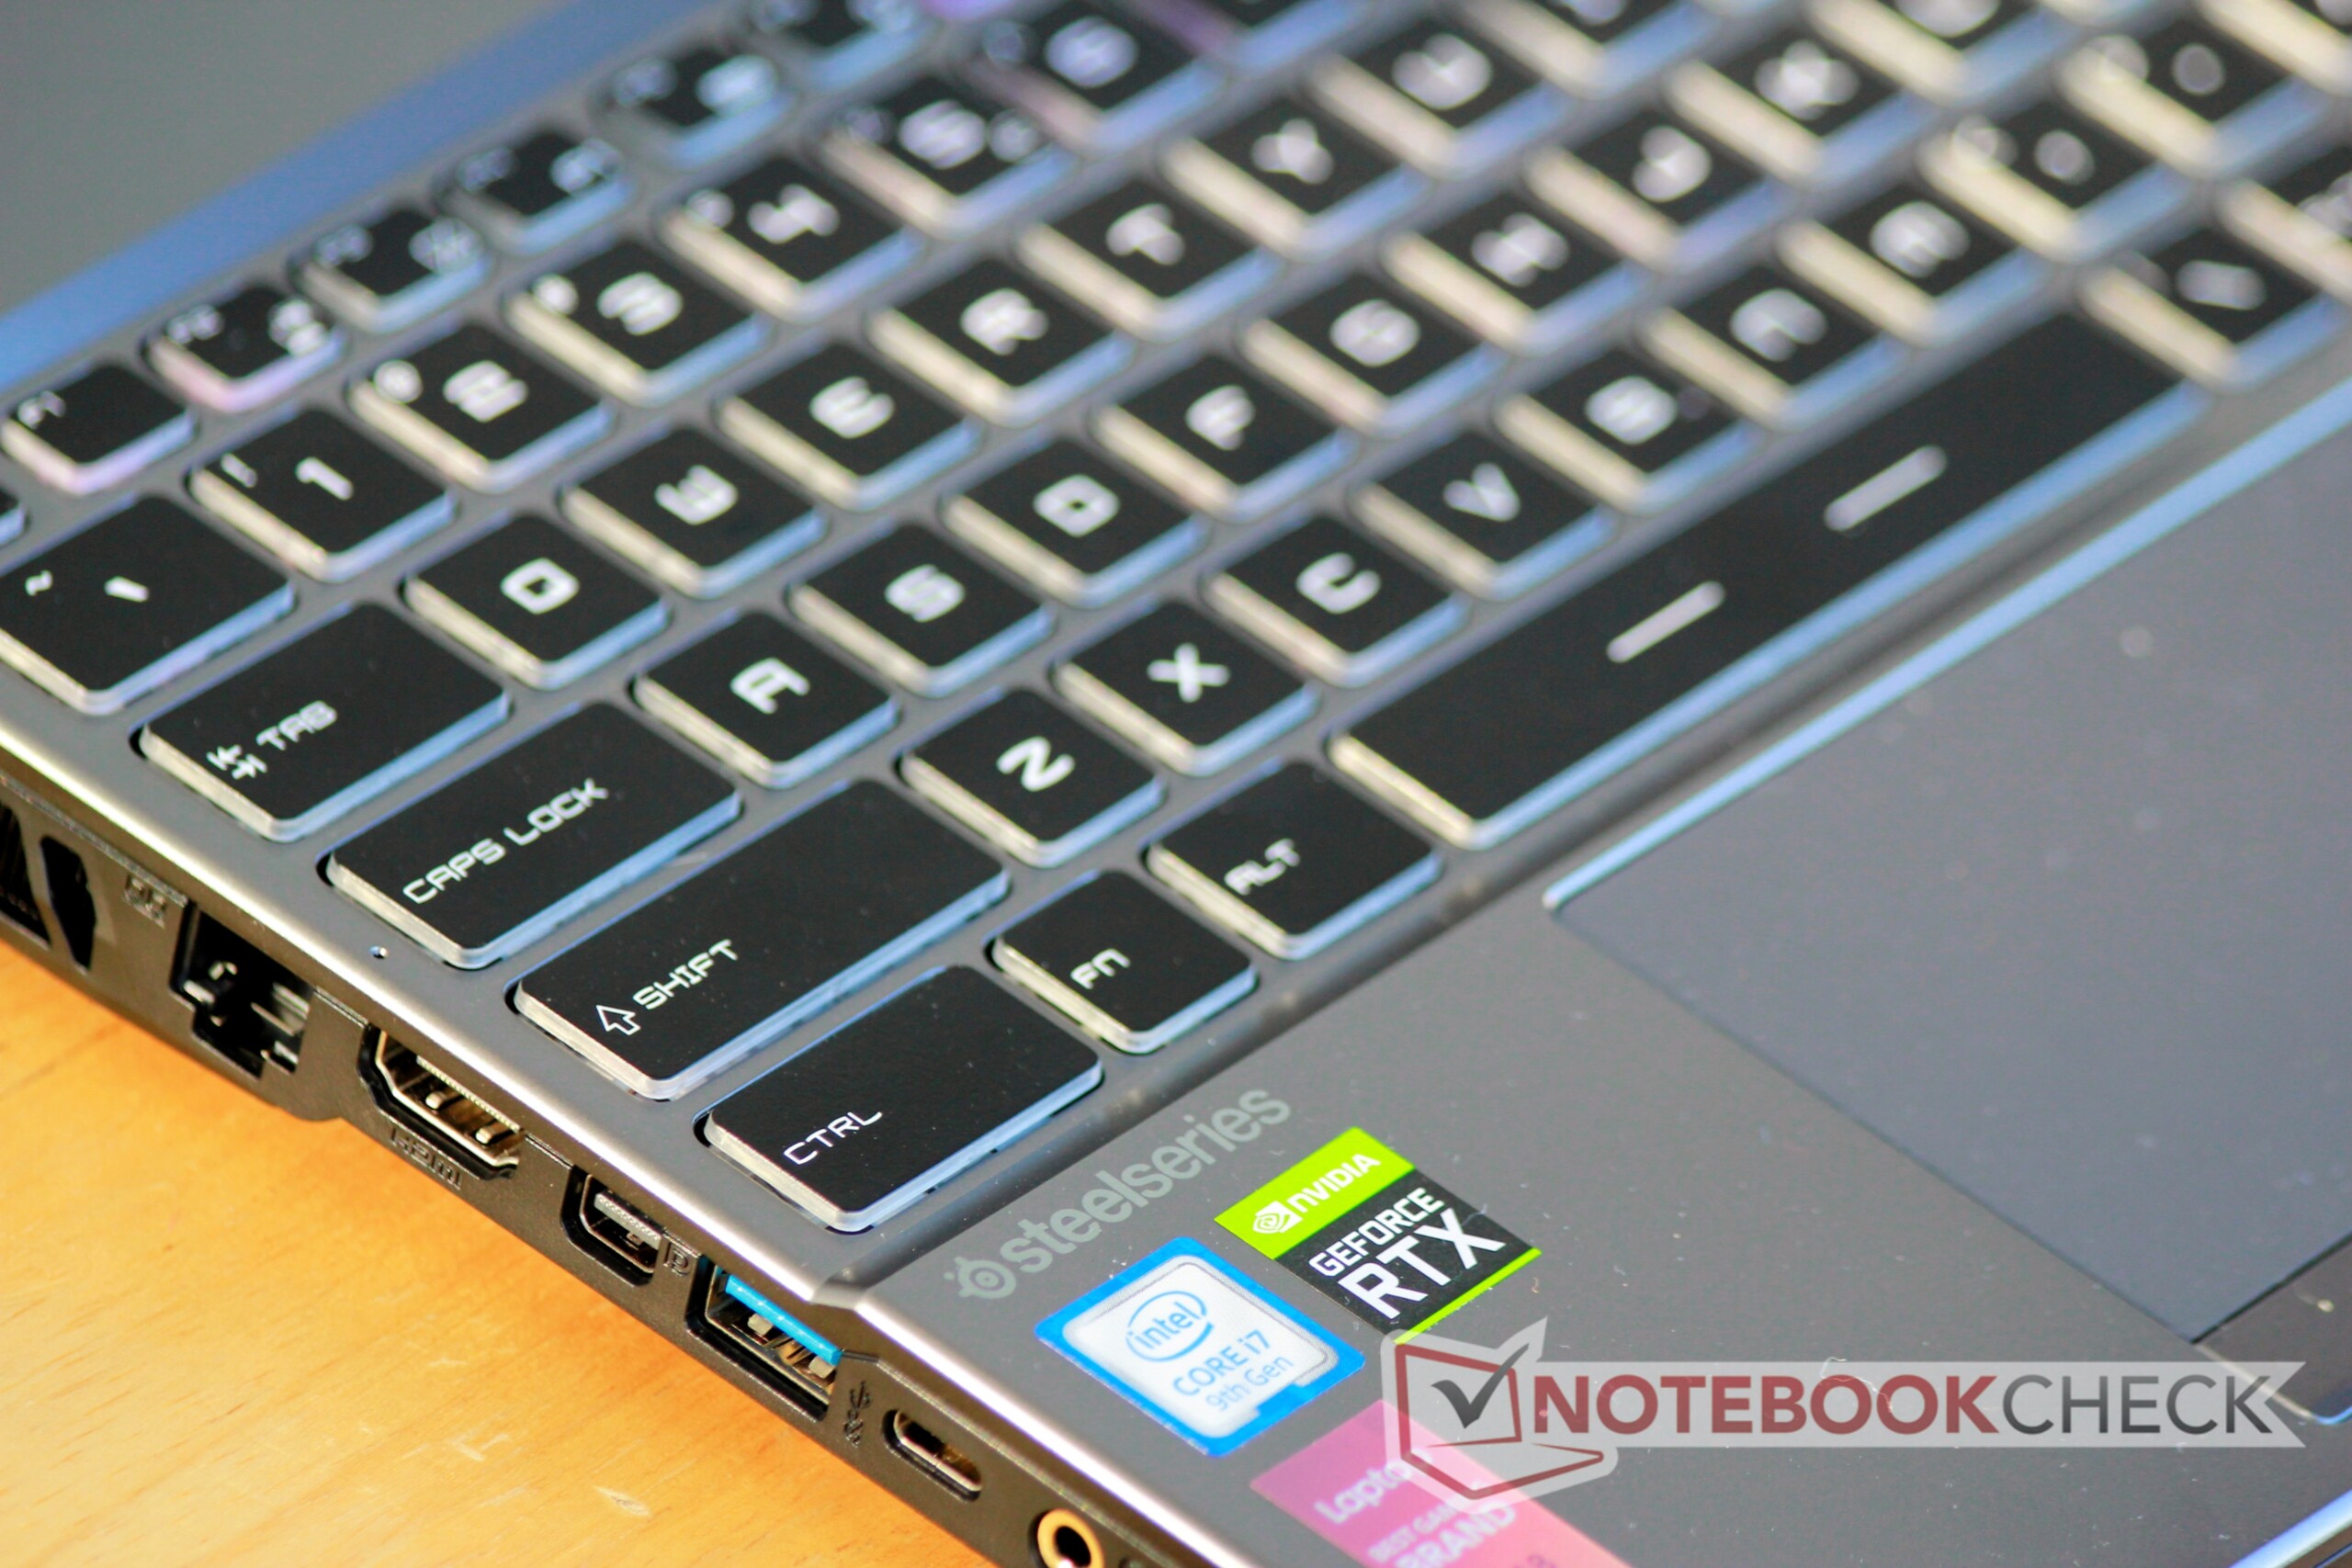
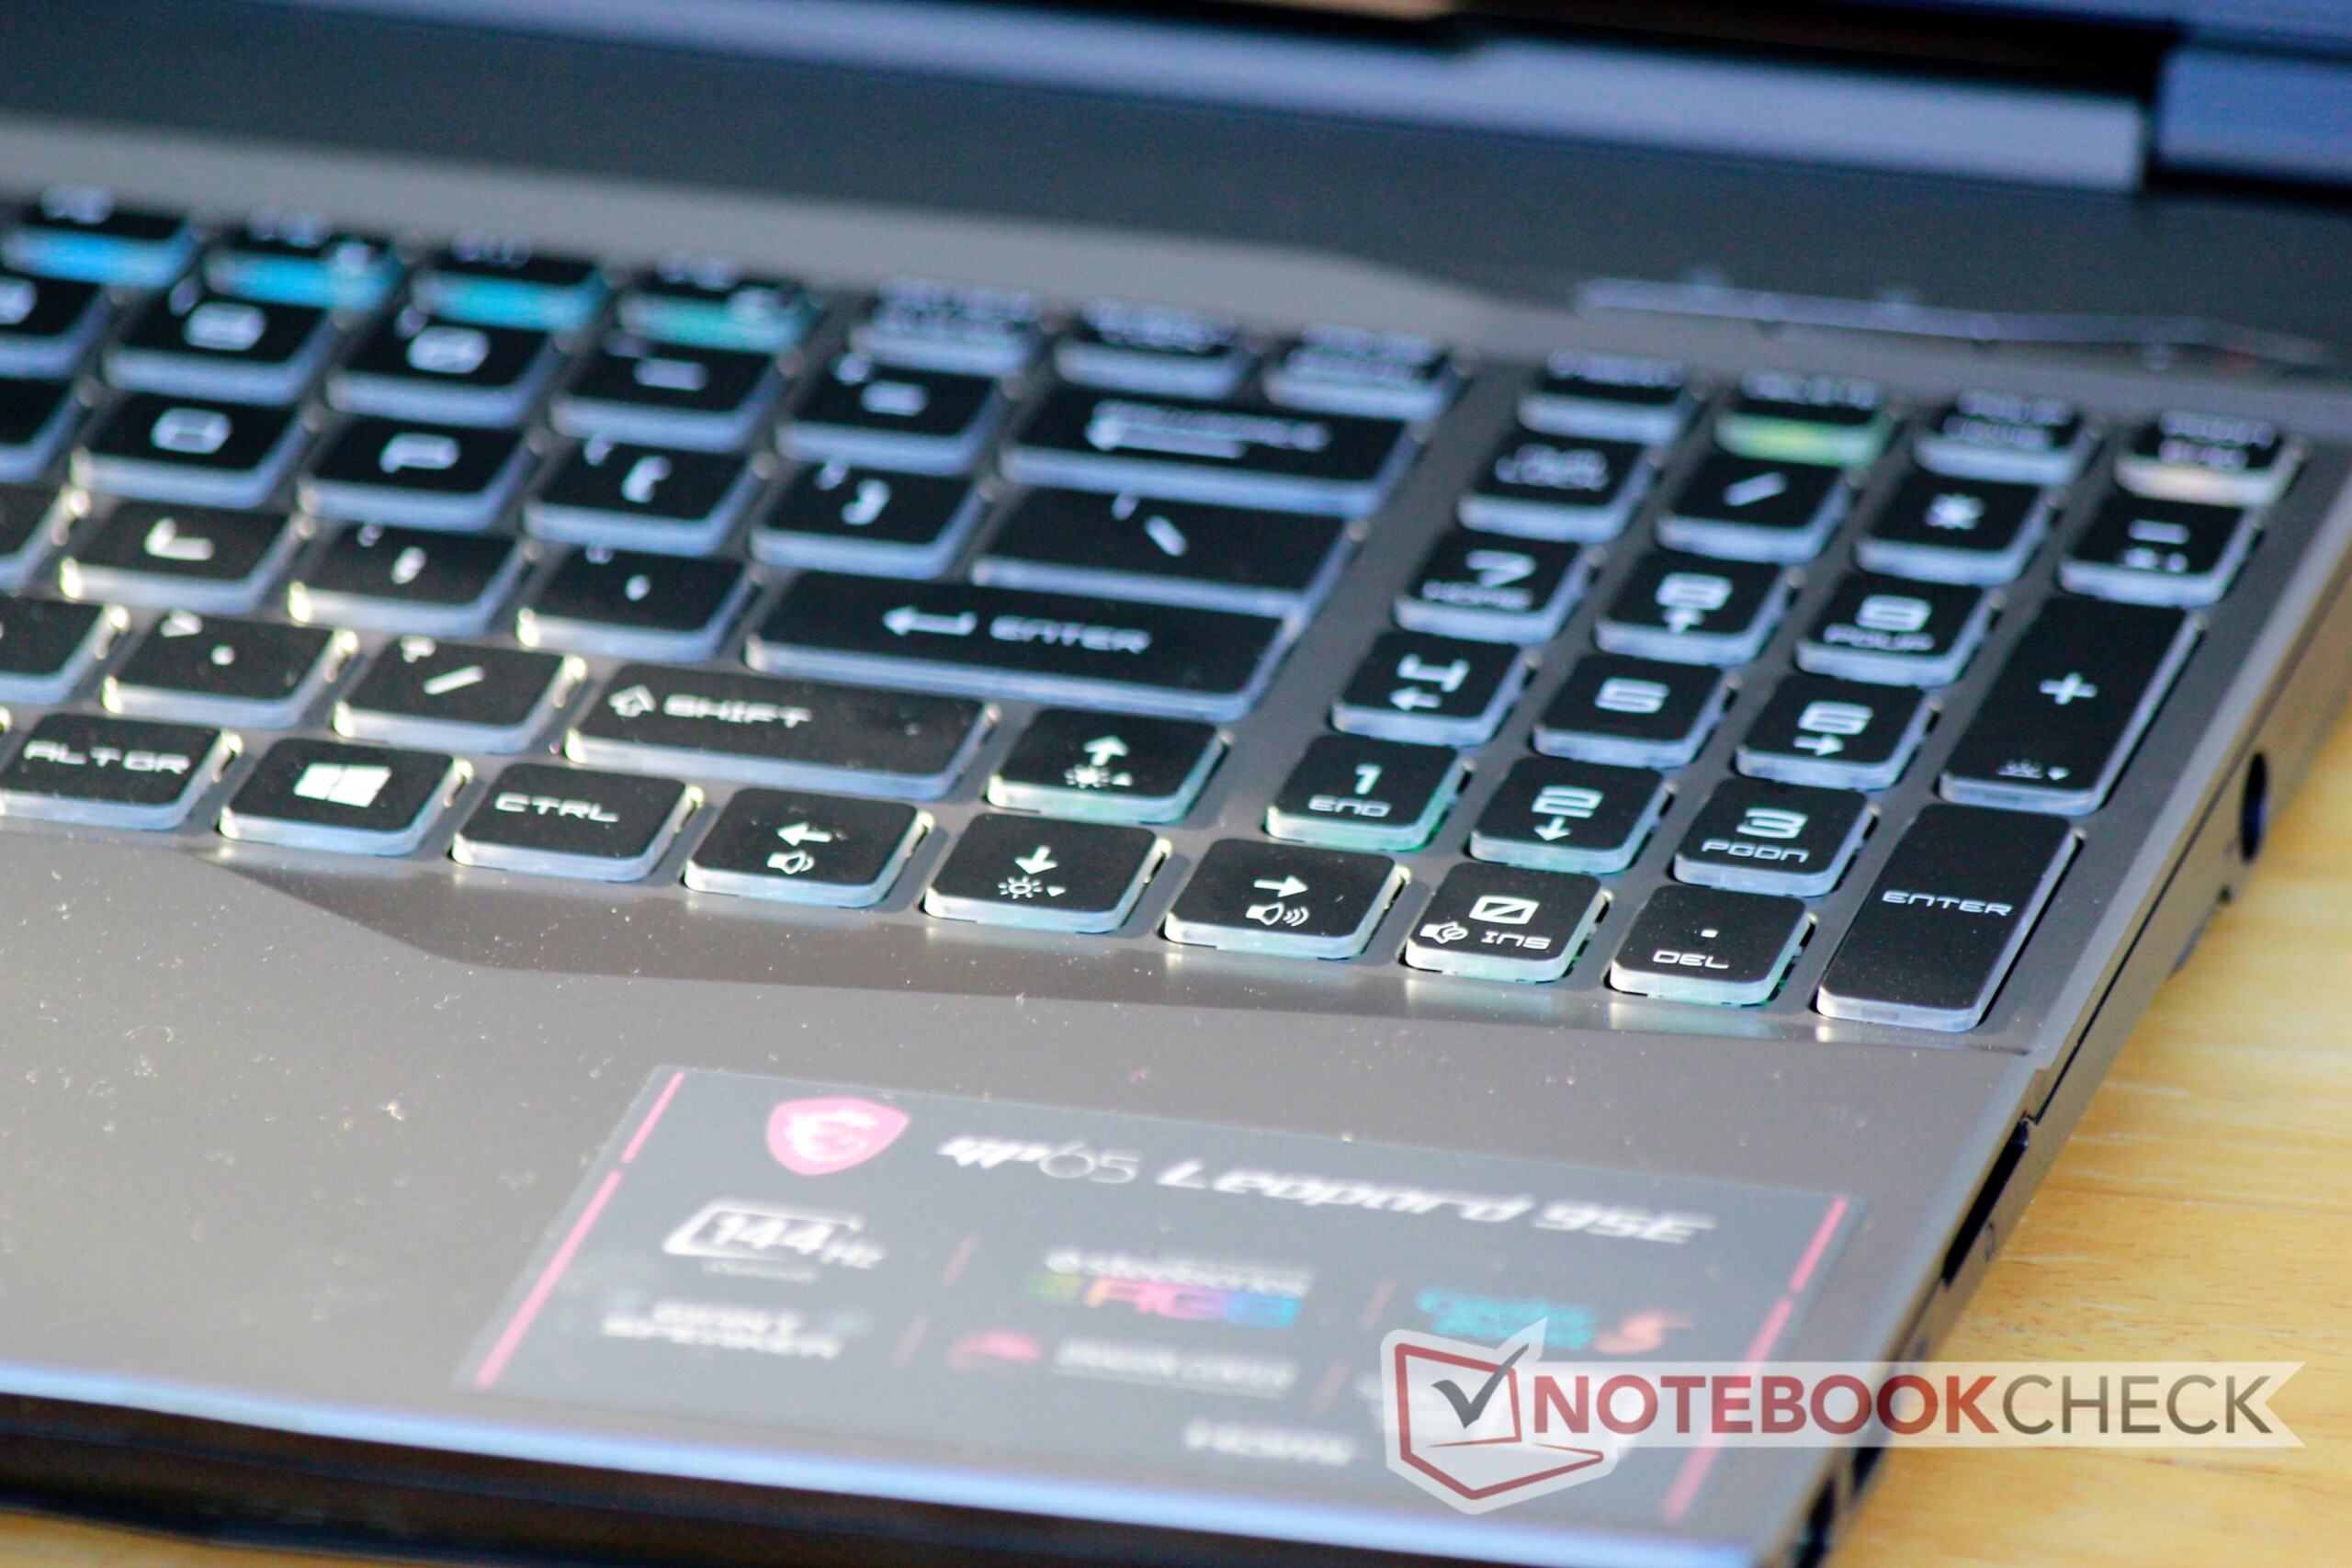
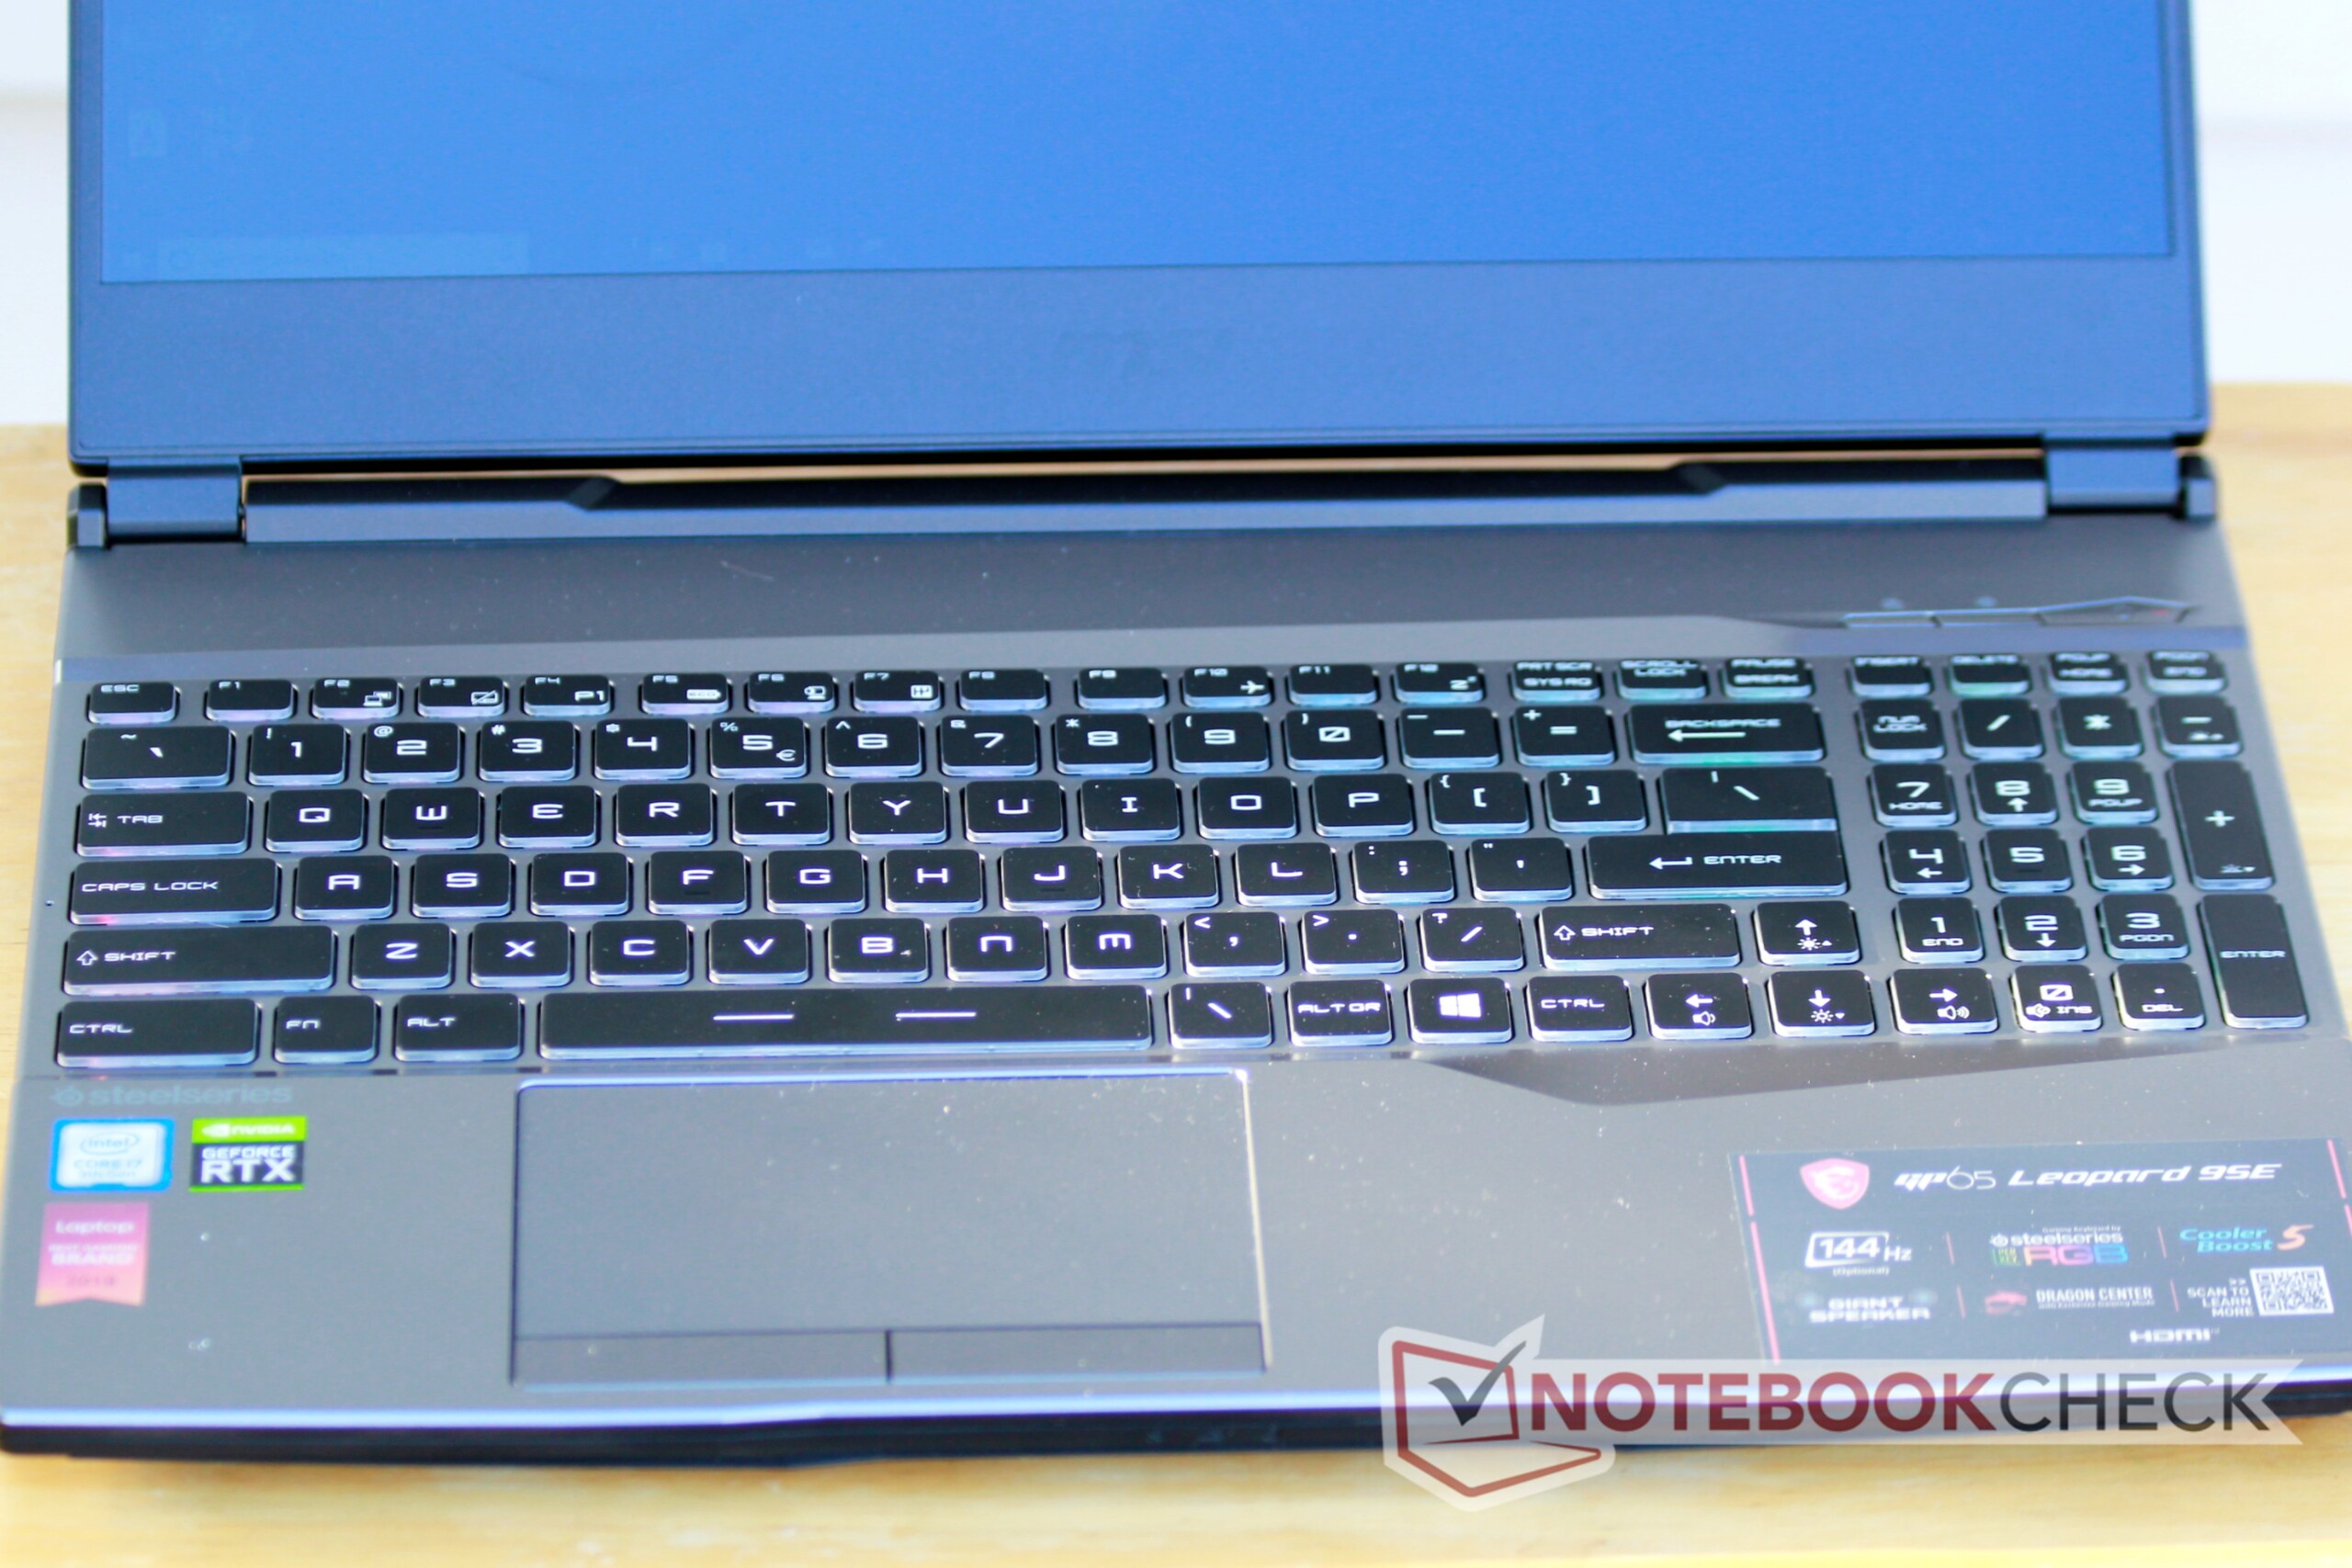
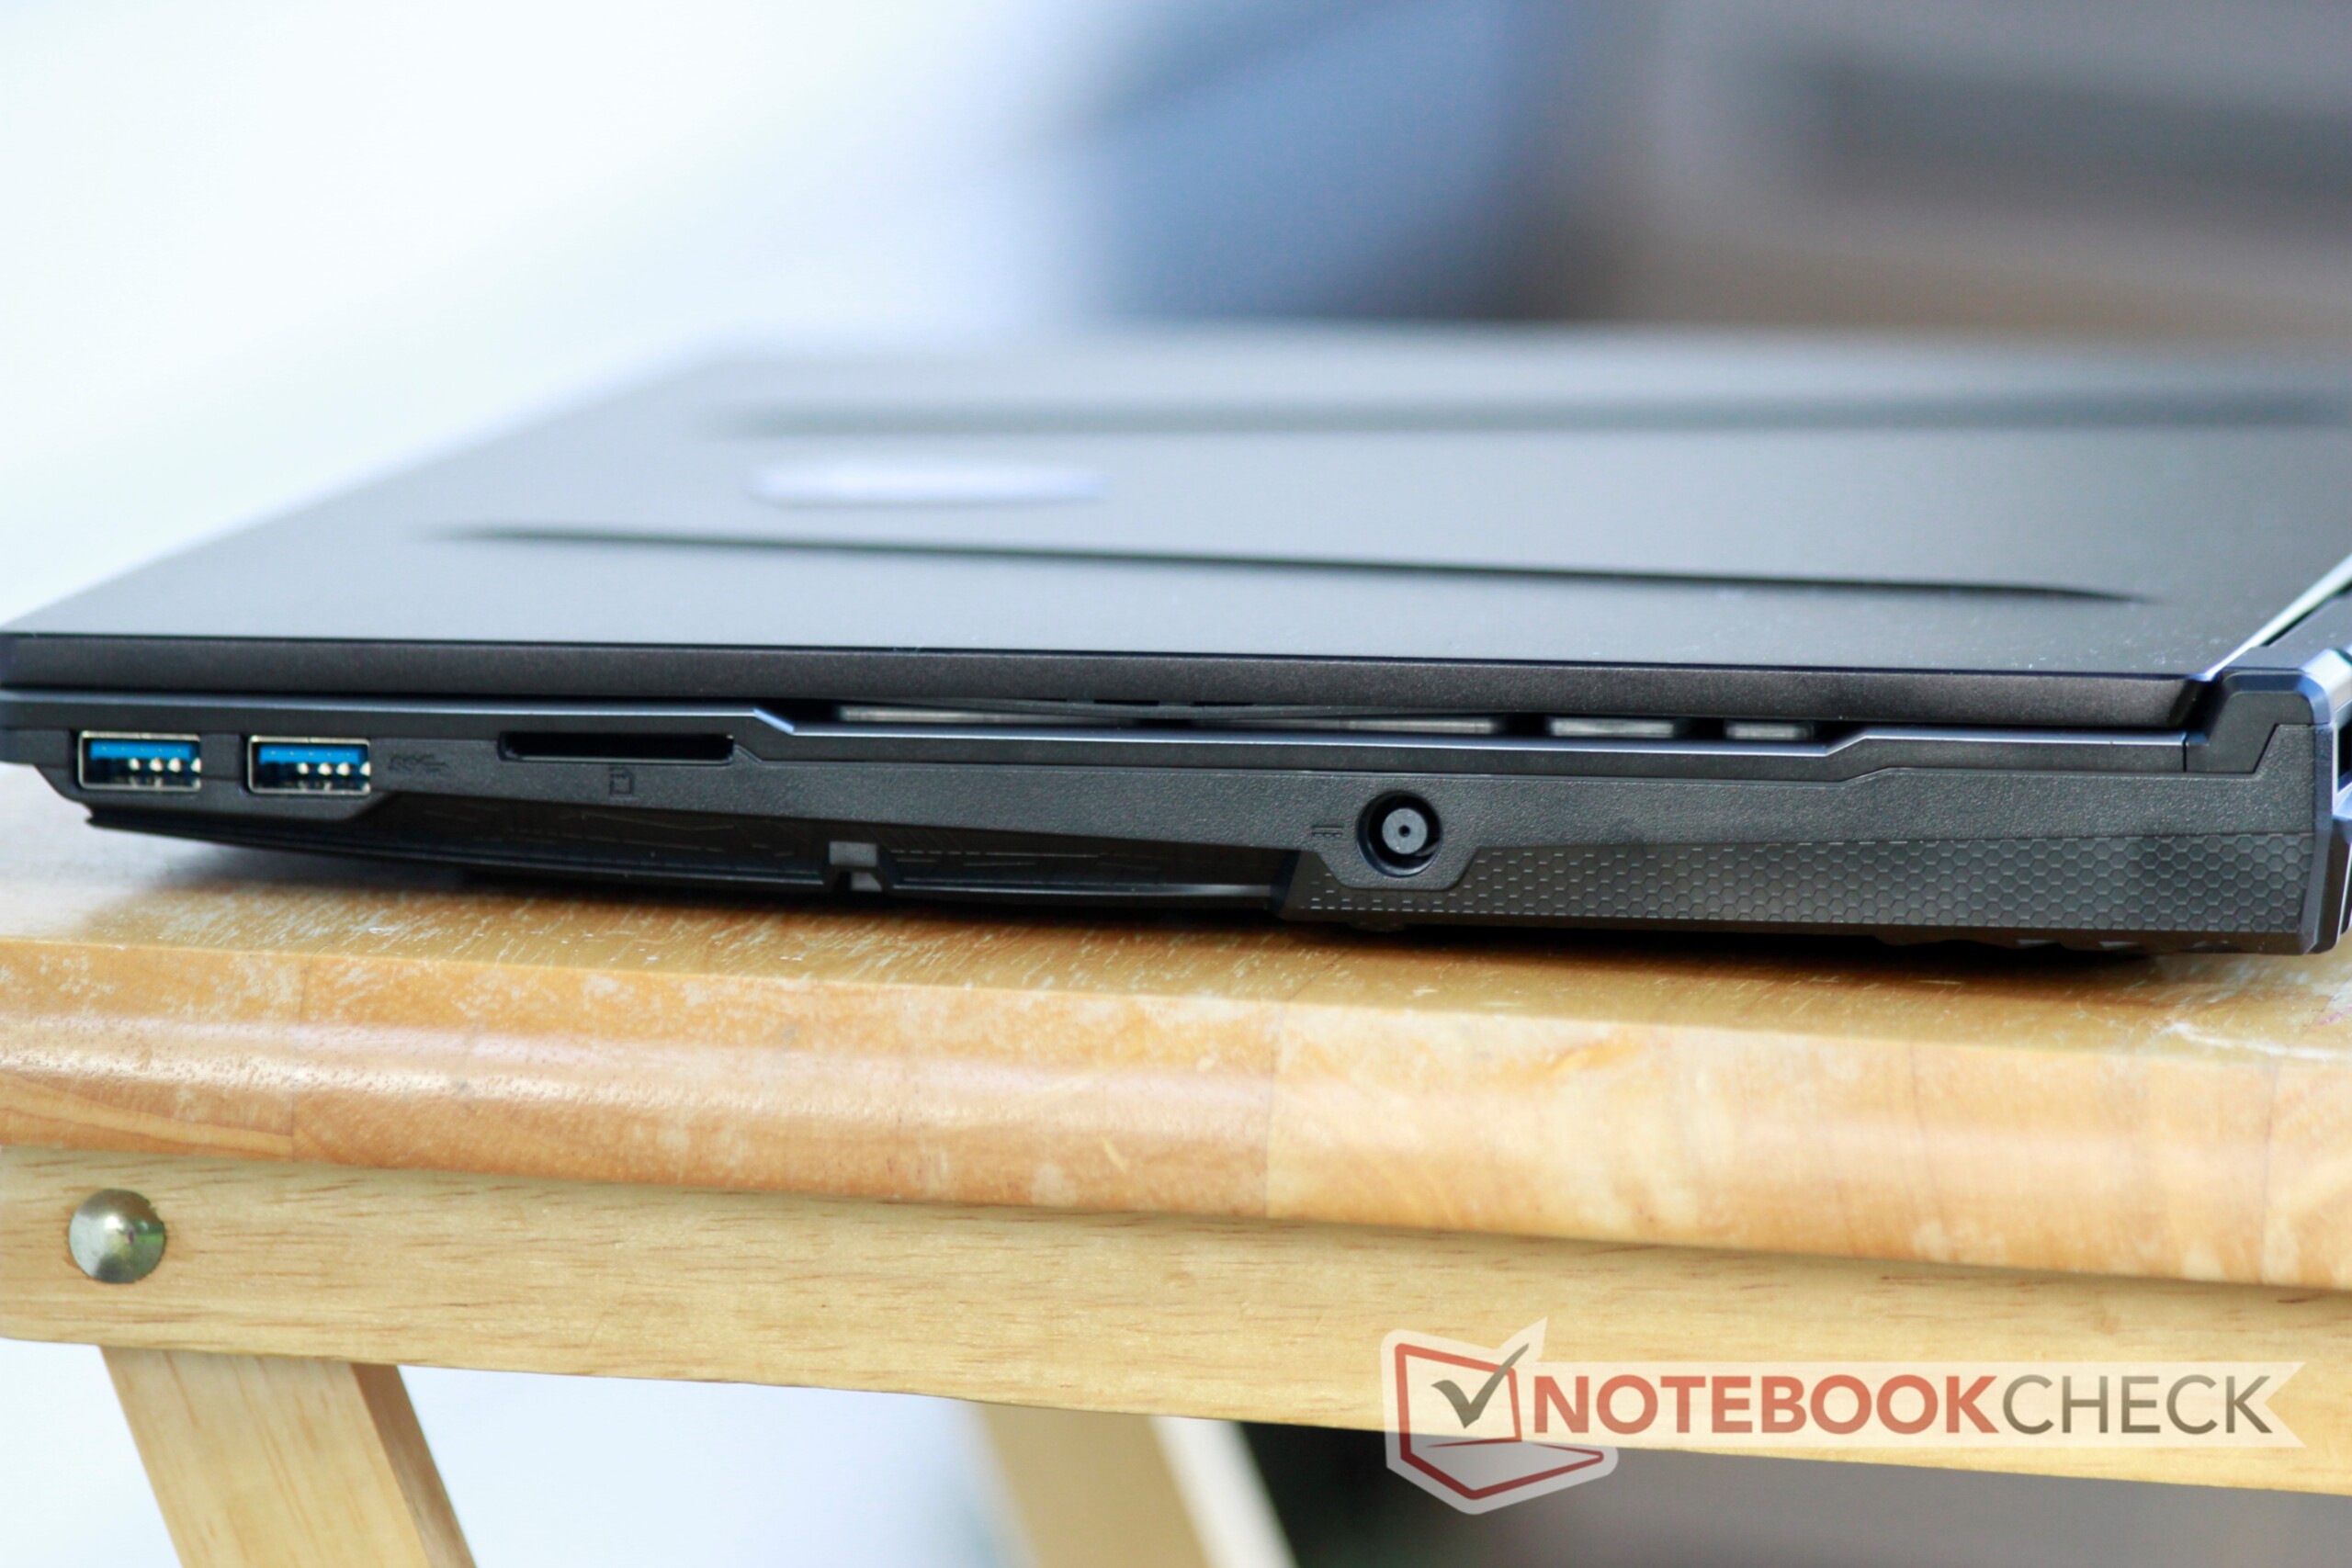
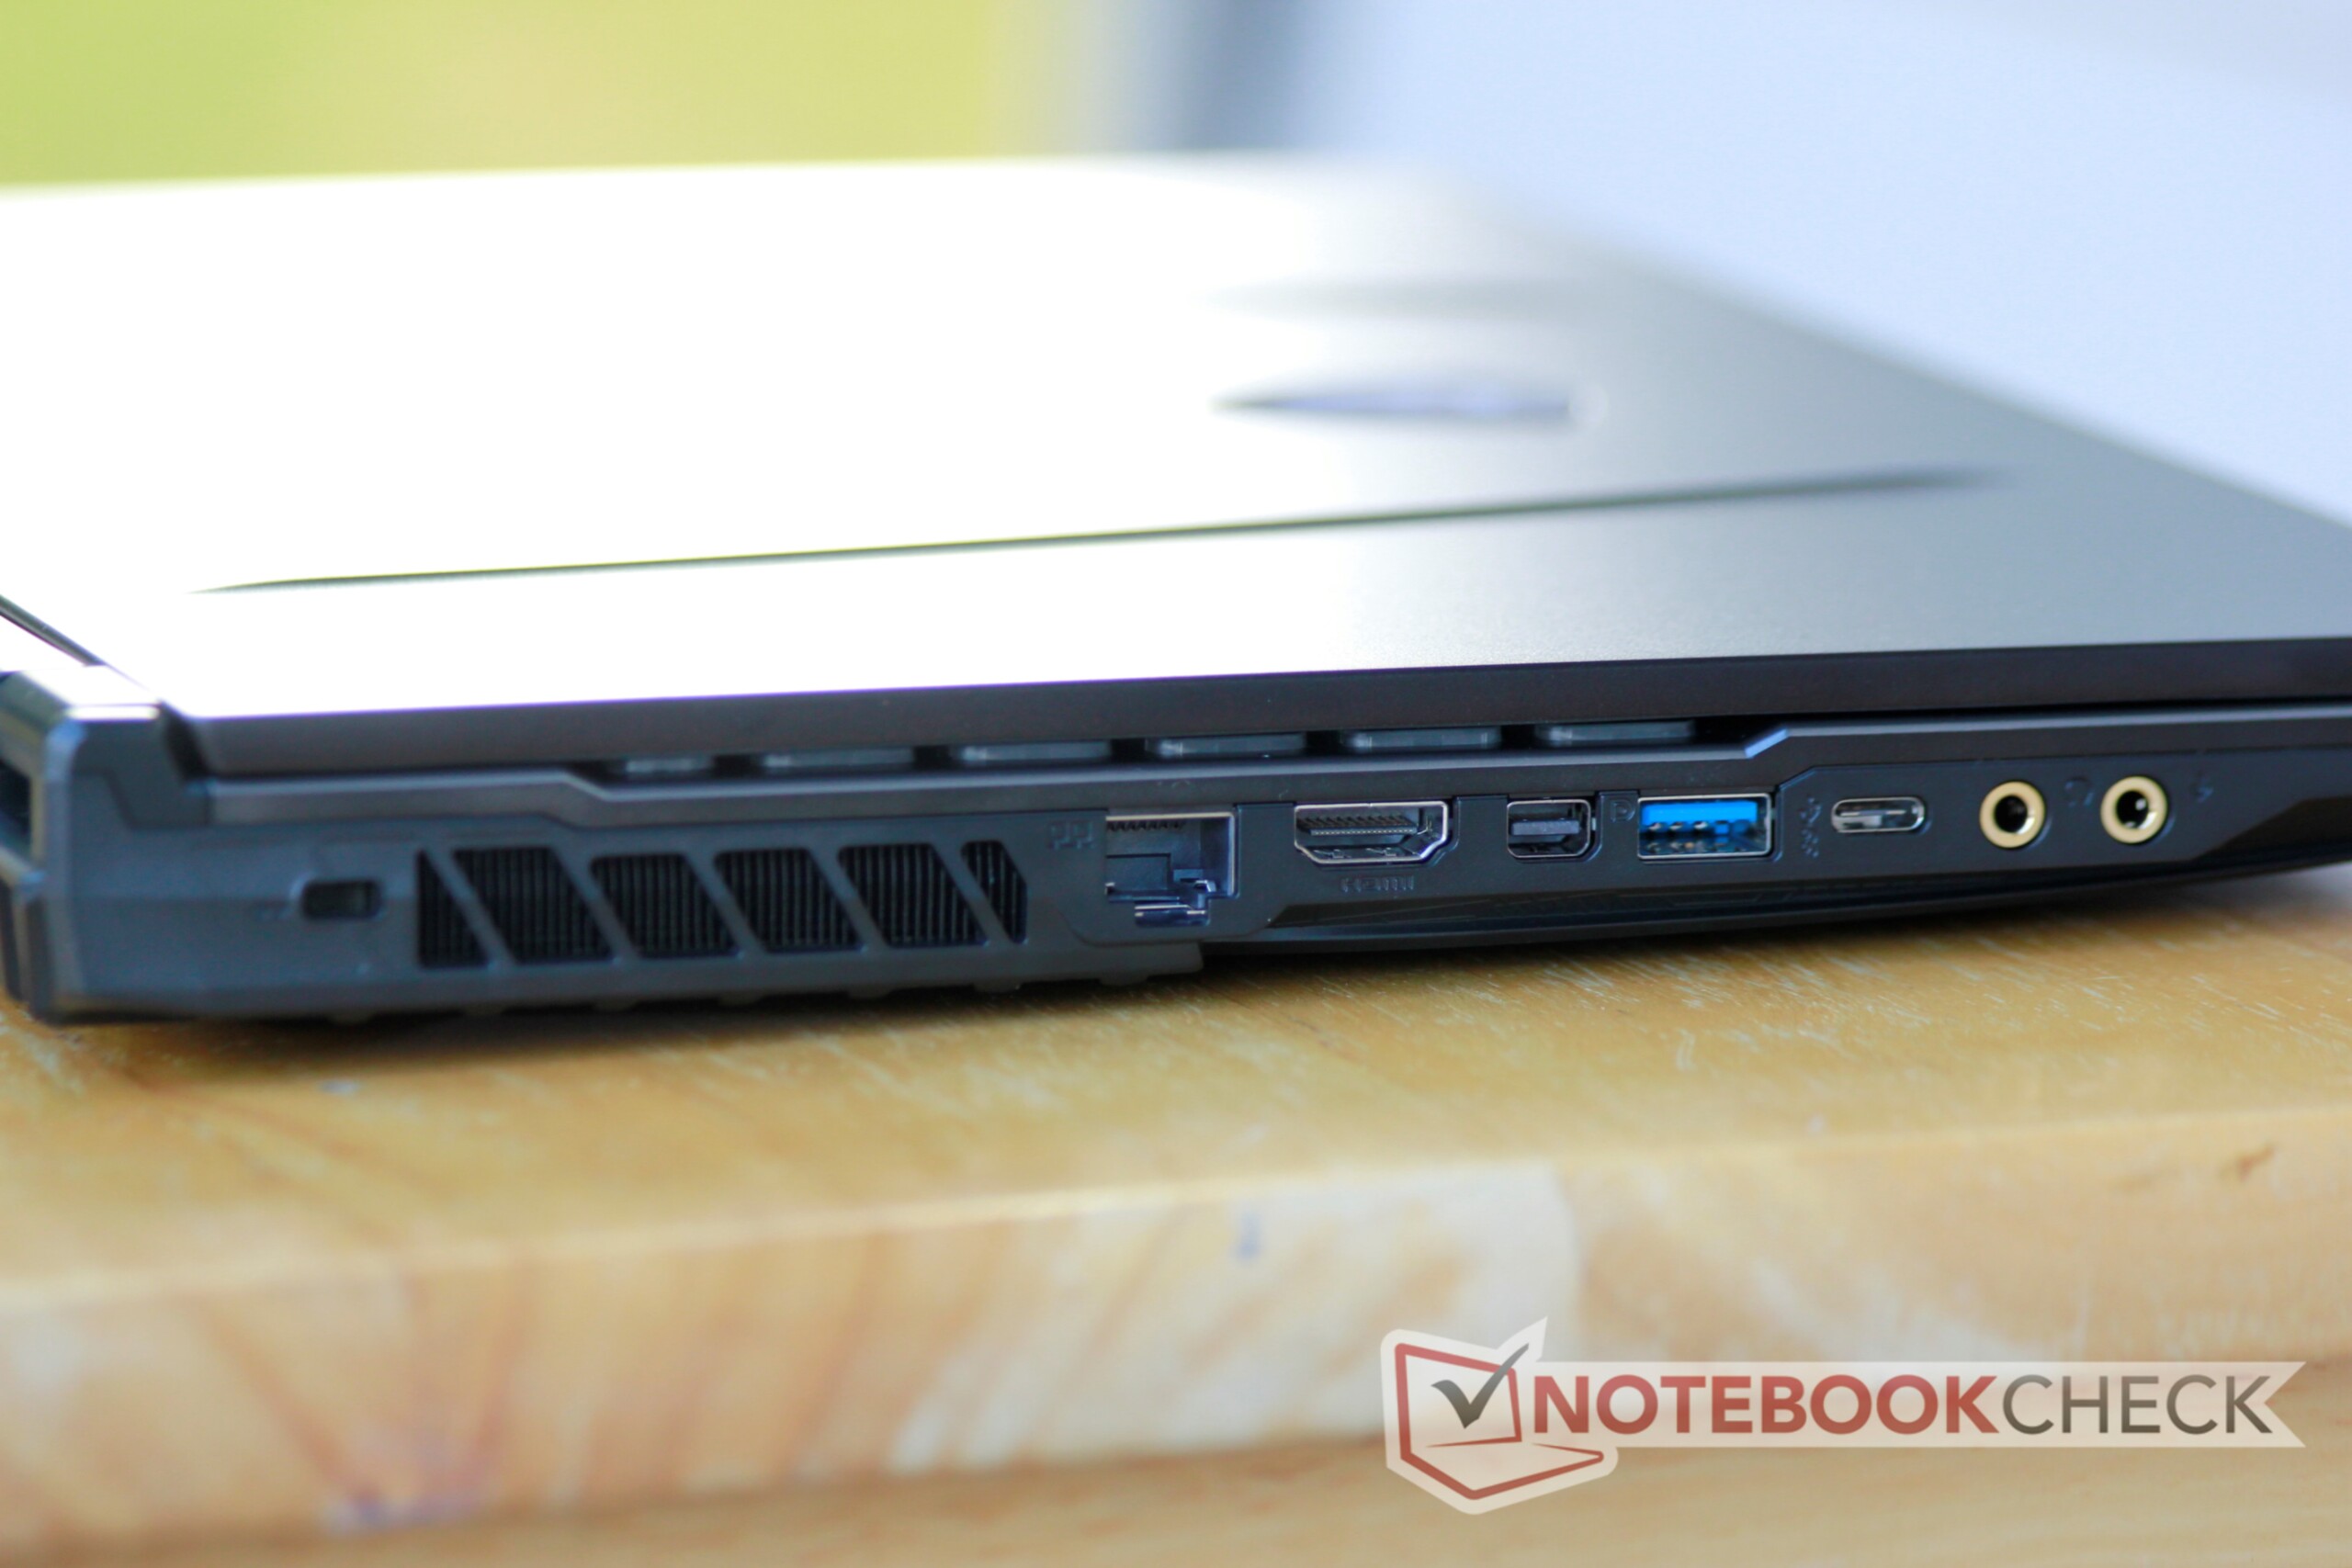
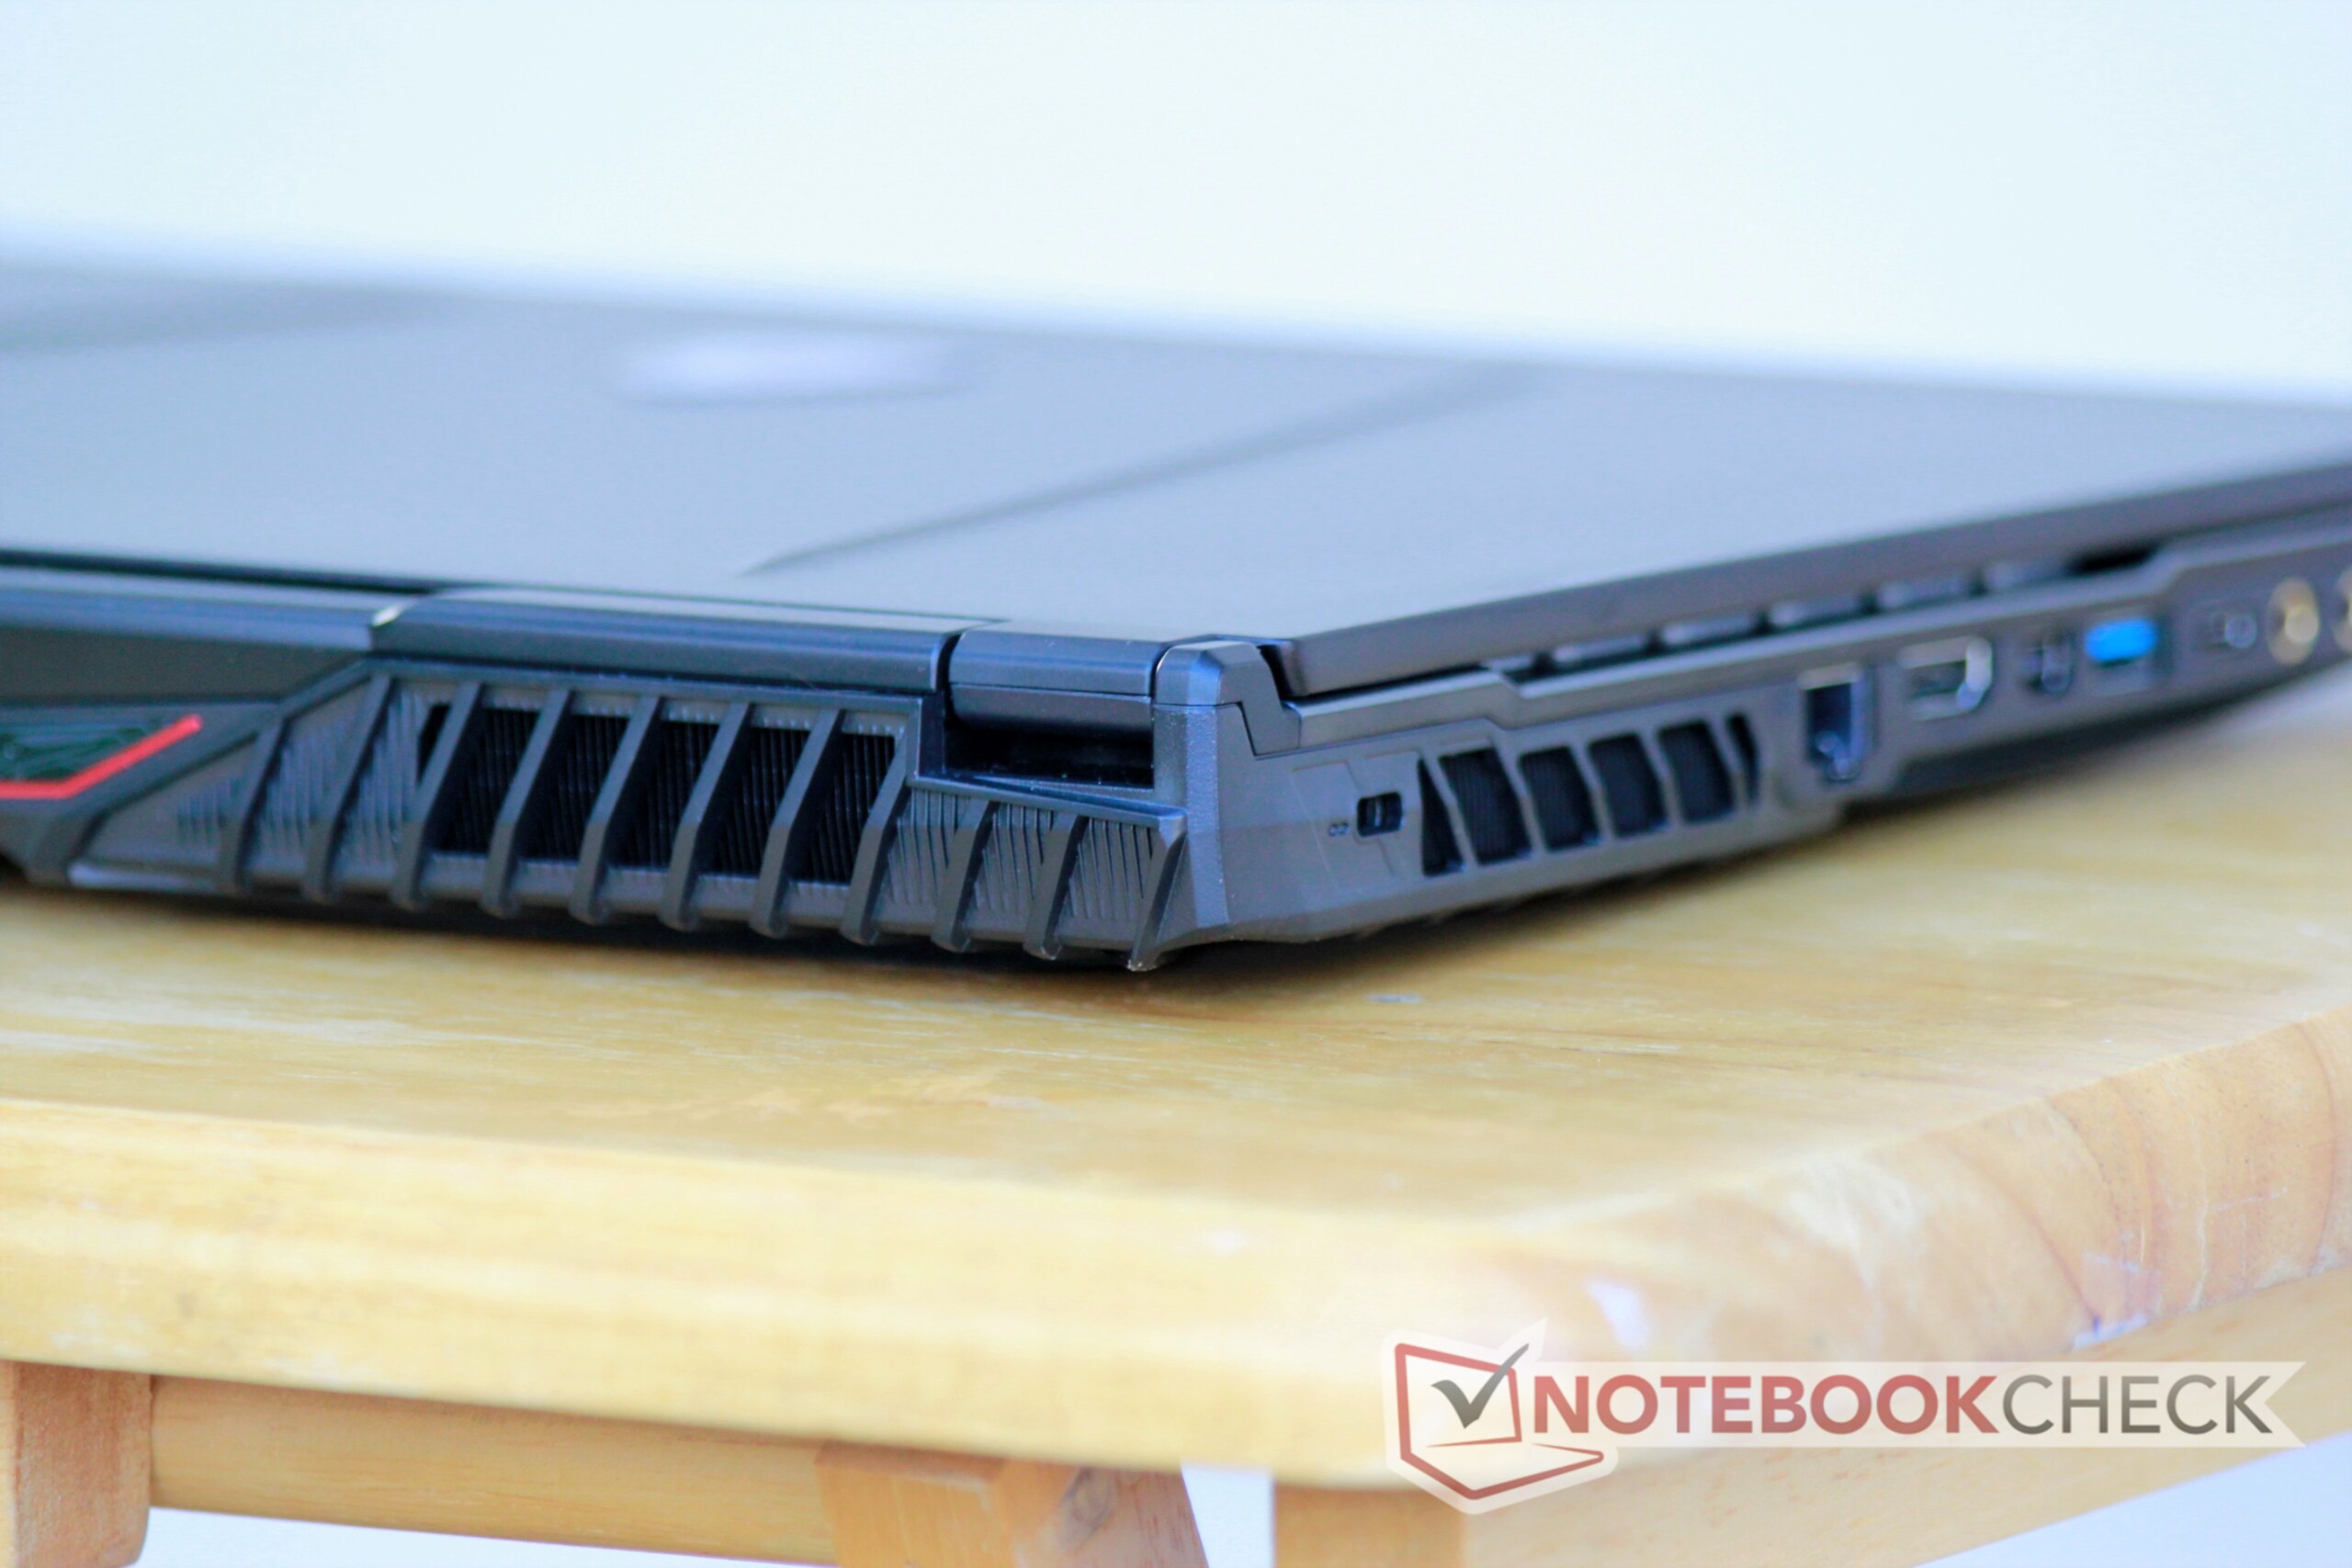
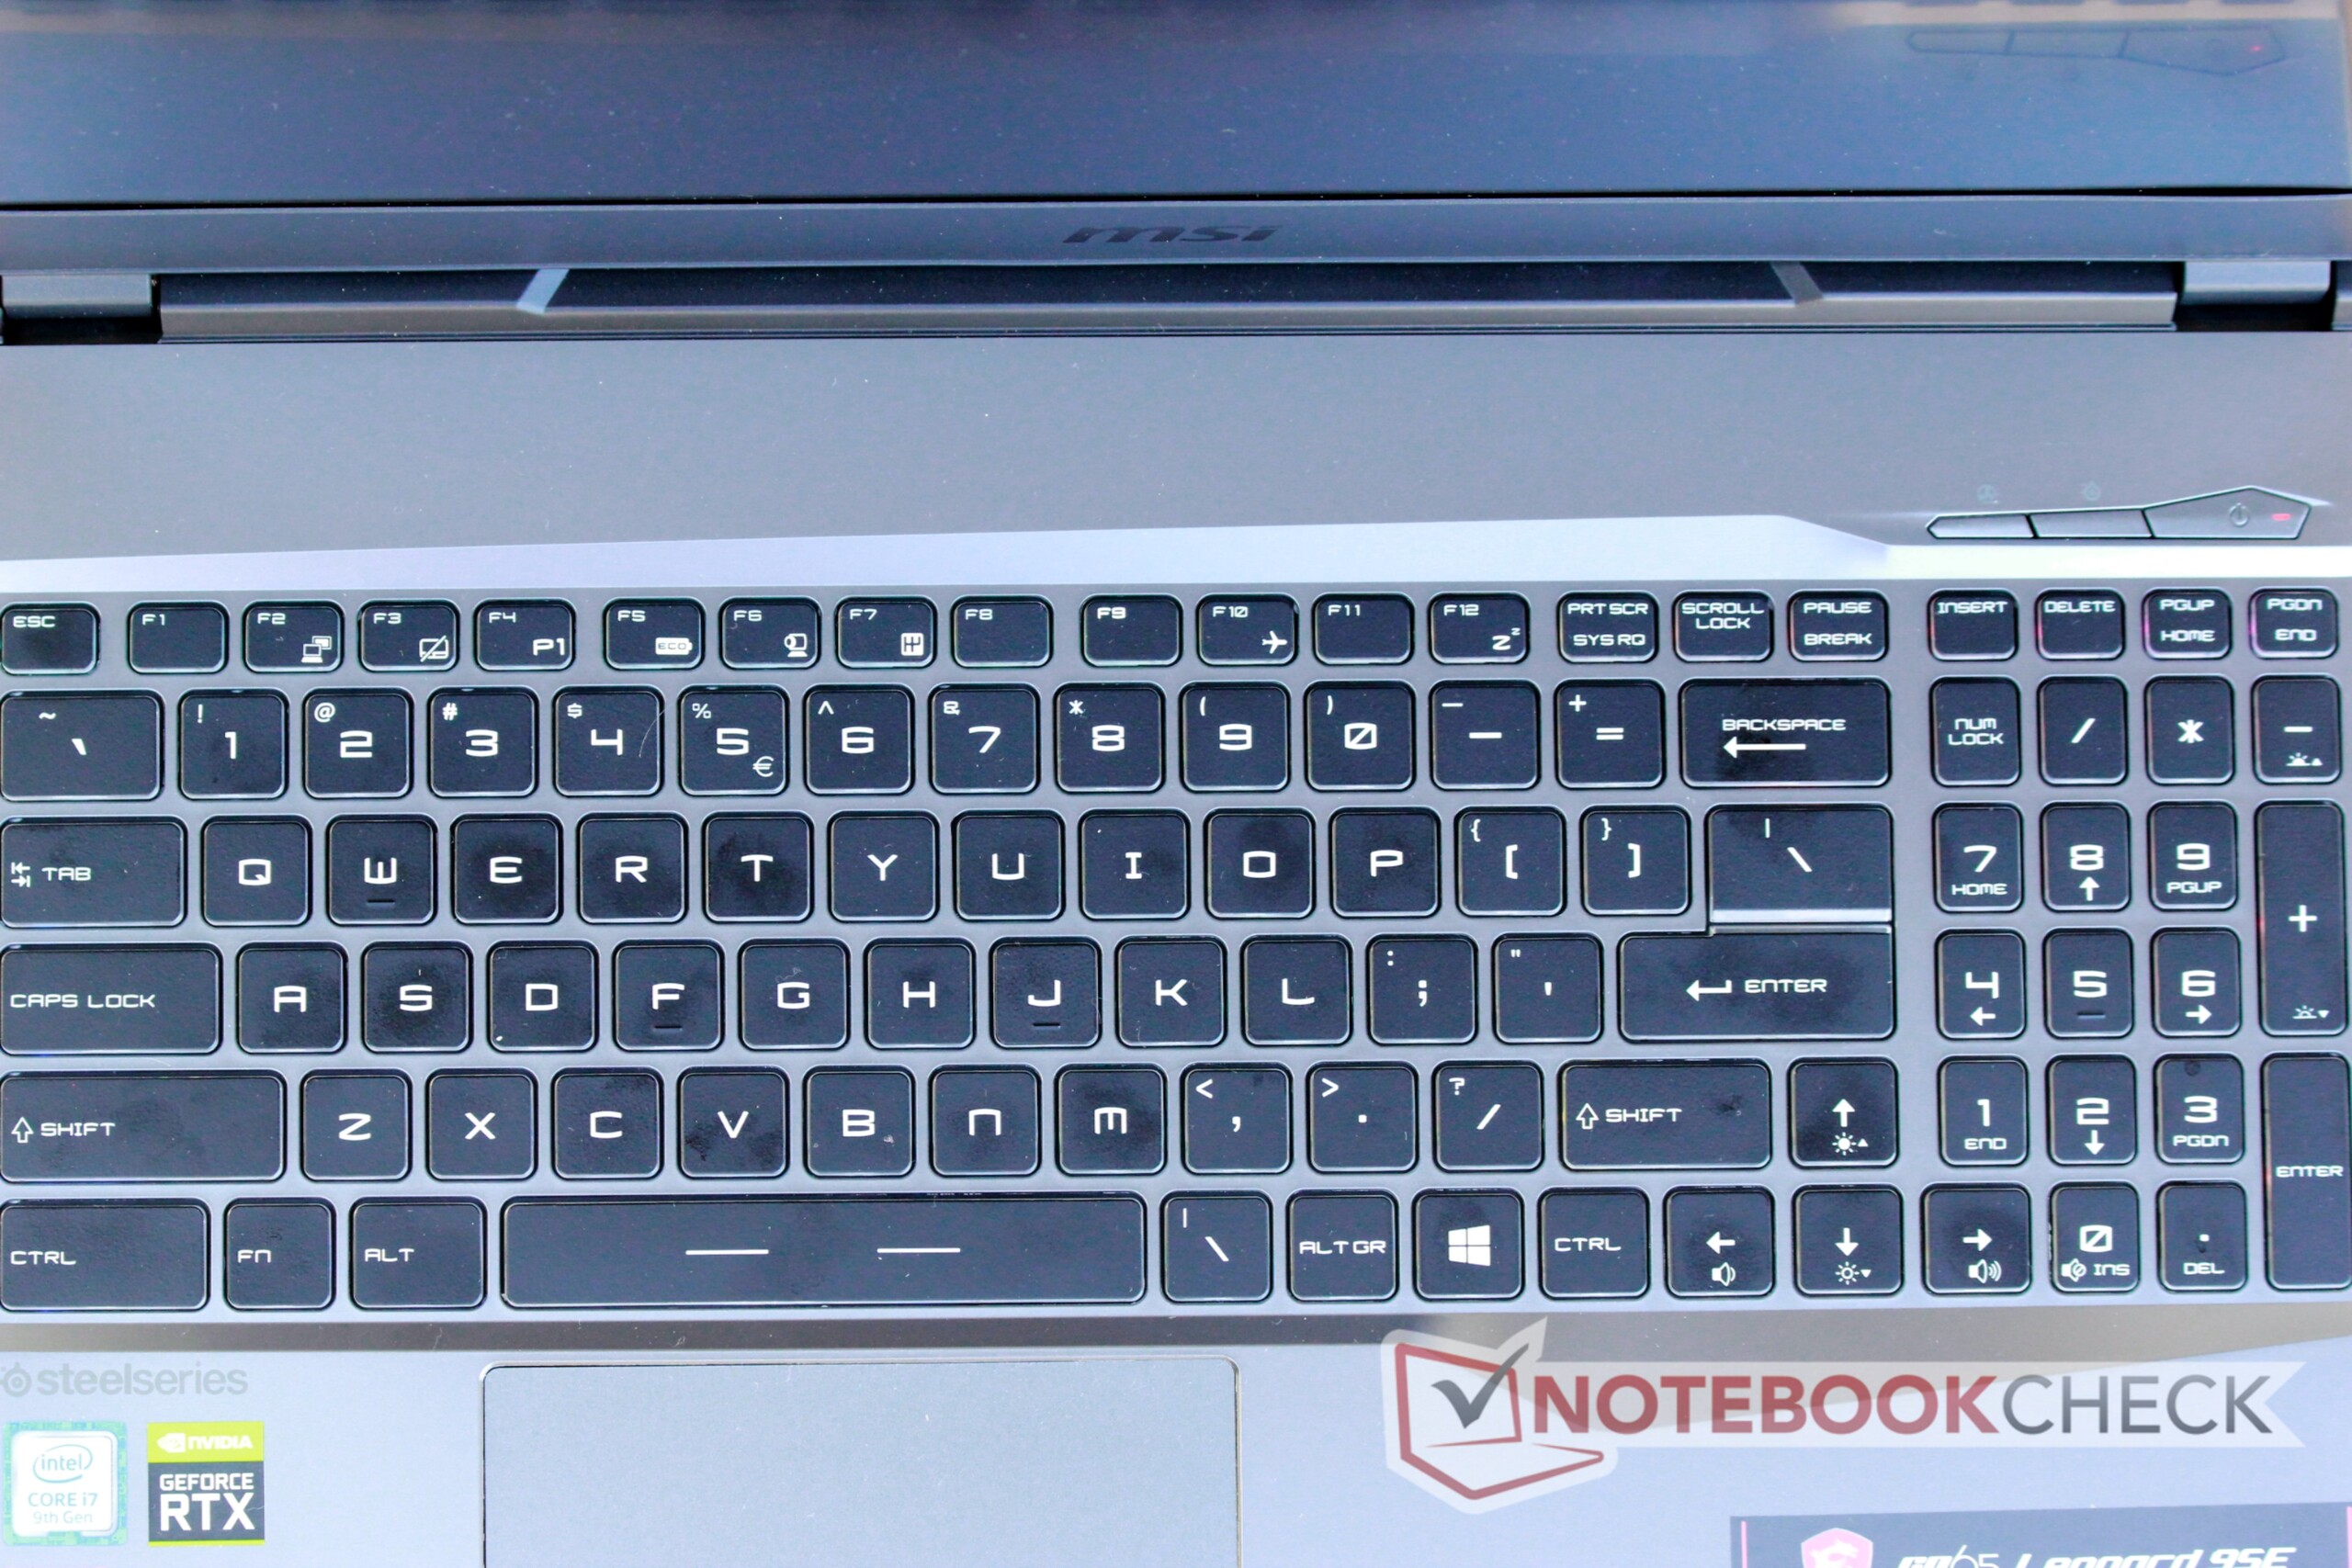
Andere premium foefjes beginnen nu ook het middensegment van de game notebook markt te bereiken, zoals te zien is in de GP65. Het toetsenbord zet SteelSeries' uitstekende reputatie voort, de per-toets RGB verlichting is een welkome en leuke toevoeging. Poortselectie is gevarieerd, alhoewel de plaatsing van de poorten wat vreemd is en frustrerend kan zijn. Tot slot, gamen en algemene prestaties waren super, zeker voor €1350. De GP65 kan ook naast een game notebook ook een fatsoenlijke content creation notebook zijn.
Echter is de GP65 niet gecreëerd in een vacuüm. Er zijn namelijk concurrenten die een beter totaalpakket bieden rond deze prijs. Bijvoorbeeld de Lenovo's Legion Y540 heeft betere thermische regeling (en stillere ventilatoren) en vergelijkbare game prestaties voor €90 minder. Het CUK Model Z biedt een betere behuizing, een mechanisch toetsenbord, en een krachtigere videokaart (RTX 2070 Max-Q) voor hetzelfde prijskaartje van €1350. Echter wordt het Model Z veel warmer dan de GP65 en heeft deze luidere ventilatoren.
De keuze komt neer op wat je met je laptop wilt doen. Als je vooral wilt gamen (en de warmteontwikkeling er niet toe doet), is de CUK Model Z lastig om te verslaan op dit prijspunt. Als je een kleiner budget hebt is de Lenovo Legion Y540 een goed geprijsde laptop met een klein compromis in game prestaties (Lenovo heeft ook regelmatig aanbiedingen).
Hoewel de laptop een paar compromissen sluit in bouwkwaliteit en thermisch beheer, biedt de MSI GP65 Leopard een uitstekende waarde voor je geld en is een fantastische notebook die van alle markten thuis is. Het uitstekende beeldscherm is goed genoeg voor content creation, en gameprestaties houd de meeste gamers tevreden tot en met de nabije toekomst. Voor €1350 bevindt de GP65 Leopard zich op het randje van de middenklasse markt, maar is het ook een van de beste middenklasse gaming laptops verkrijgbaar tegenwoordig.
MSI GP65 Leopard 9SE-225US
- 25-08-2019 v6 (old)
Sam Medley
Price comparison
