Kort testrapport Lenovo Legion Y530 (i7-8750H, GTX1060) Laptop


| Networking | |
| iperf3 transmit AX12 | |
| HP Pavilion Gaming 15-cx0003ng | |
| Razer Blade 15 Base Model | |
| Lenovo Legion Y7000P-1060 | |
| Medion Erazer P6705-MD61131 | |
| Lenovo Legion Y530-15ICH | |
| Lenovo Legion Y530-15ICH | |
| iperf3 receive AX12 | |
| Medion Erazer P6705-MD61131 | |
| Razer Blade 15 Base Model | |
| Lenovo Legion Y530-15ICH | |
| Lenovo Legion Y7000P-1060 | |
| HP Pavilion Gaming 15-cx0003ng | |
| MSI P65 8RF-451 - Creator | |
| Lenovo Legion Y530-15ICH | |
| |||||||||||||||||||||||||
Helderheidsverdeling: 83 %
Helderheid in Batterij-modus: 308 cd/m²
Contrast: 587:1 (Zwart: 0.52 cd/m²)
ΔE ColorChecker Calman: 3.63 | ∀{0.5-29.43 Ø4.73}
calibrated: 1.31
ΔE Greyscale Calman: 4.77 | ∀{0.09-98 Ø4.97}
93% sRGB (Argyll 1.6.3 3D)
59% AdobeRGB 1998 (Argyll 1.6.3 3D)
63.8% AdobeRGB 1998 (Argyll 3D)
93% sRGB (Argyll 3D)
62.5% Display P3 (Argyll 3D)
Gamma: 2.54
CCT: 7500 K
| Lenovo Legion Y530-15ICH LG Display LP156WFG-SPB2, , 1920x1080, 15.6" | HP Pavilion Gaming 15-cx0003ng BOE07A1, , 1920x1080, 15.6" | Lenovo Legion Y7000P-1060 BOE NV156FHM-N61, , 1920x1080, 15.6" | Medion Erazer P6705-MD61131 AU Optronics B156HTN03.8 (AUO38ED), , 1920x1080, 15.6" | MSI P65 8RF-451 - Creator AU Optronics B156HAN08.0 (AUO80ED), , 1920x1080, 15.6" | Razer Blade 15 Base Model BOE NV156FHM-N61, , 1920x1080, 15.6" | Lenovo Legion Y530-15ICH B156HAN02.1, , 1920x1080, 15.6" | |
|---|---|---|---|---|---|---|---|
| Display | -36% | -1% | -41% | 2% | -1% | -38% | |
| Display P3 Coverage (%) | 62.5 | 39.72 -36% | 66.1 6% | 36.4 -42% | 65.1 4% | 66.3 6% | 38.31 -39% |
| sRGB Coverage (%) | 93 | 59.3 -36% | 86.4 -7% | 54.8 -41% | 91.1 -2% | 86.6 -7% | 57.3 -38% |
| AdobeRGB 1998 Coverage (%) | 63.8 | 41.04 -36% | 63.1 -1% | 37.61 -41% | 65.9 3% | 63.3 -1% | 39.58 -38% |
| Response Times | -198% | -206% | -122% | -4% | -191% | -193% | |
| Response Time Grey 50% / Grey 80% * (ms) | 15 ? | 47 ? -213% | 42.8 ? -185% | 44.8 ? -199% | 16 ? -7% | 39.2 ? -161% | 43.6 ? -191% |
| Response Time Black / White * (ms) | 11 ? | 31 ? -182% | 36 ? -227% | 16 ? -45% | 11 ? -0% | 35.2 ? -220% | 32.4 ? -195% |
| PWM Frequency (Hz) | 208 ? | 21740 ? | 21190 ? | ||||
| Screen | 7% | -17% | -71% | -5% | -5% | -36% | |
| Brightness middle (cd/m²) | 305 | 241 -21% | 312.9 3% | 200 -34% | 235 -23% | 273.6 -10% | 282.8 -7% |
| Brightness (cd/m²) | 284 | 236 -17% | 296 4% | 186 -35% | 235 -17% | 262 -8% | 264 -7% |
| Brightness Distribution (%) | 83 | 75 -10% | 88 6% | 85 2% | 85 2% | 86 4% | 88 6% |
| Black Level * (cd/m²) | 0.52 | 0.15 71% | 0.37 29% | 0.43 17% | 0.22 58% | 0.3 42% | 0.42 19% |
| Contrast (:1) | 587 | 1607 174% | 846 44% | 465 -21% | 1068 82% | 912 55% | 673 15% |
| Colorchecker dE 2000 * | 3.63 | 4.85 -34% | 5.49 -51% | 11.39 -214% | 2.82 22% | 3.22 11% | 4.93 -36% |
| Colorchecker dE 2000 max. * | 8.18 | 8.82 -8% | 8.78 -7% | 19.36 -137% | 4.82 41% | 7.61 7% | 17.65 -116% |
| Colorchecker dE 2000 calibrated * | 1.31 | 3.99 -205% | 3.05 -133% | 4.88 -273% | 4.1 -213% | 4.07 -211% | |
| Greyscale dE 2000 * | 4.77 | 5.15 -8% | 4.7 1% | 11.73 -146% | 2.32 51% | 1.4 71% | 3.8 20% |
| Gamma | 2.54 87% | 2.49 88% | 2.29 96% | 1.97 112% | 2.49 88% | 2.24 98% | 2.449 90% |
| CCT | 7500 87% | 7042 92% | 6779 96% | 12614 52% | 6310 103% | 6636 98% | 6112 106% |
| Color Space (Percent of AdobeRGB 1998) (%) | 59 | 38 -36% | 56.3 -5% | 35 -41% | 59 0% | 56.4 -4% | 36 -39% |
| Color Space (Percent of sRGB) (%) | 93 | 59 -37% | 86.1 -7% | 55 -41% | 92 -1% | 86.2 -7% | 57 -39% |
| Totaal Gemiddelde (Programma / Instellingen) | -76% /
-29% | -75% /
-38% | -78% /
-72% | -2% /
-4% | -66% /
-27% | -89% /
-56% |
* ... kleiner is beter
Responstijd Scherm
| ↔ Responstijd Zwart naar Wit | ||
|---|---|---|
| 11 ms ... stijging ↗ en daling ↘ gecombineerd | ↗ 7 ms stijging | 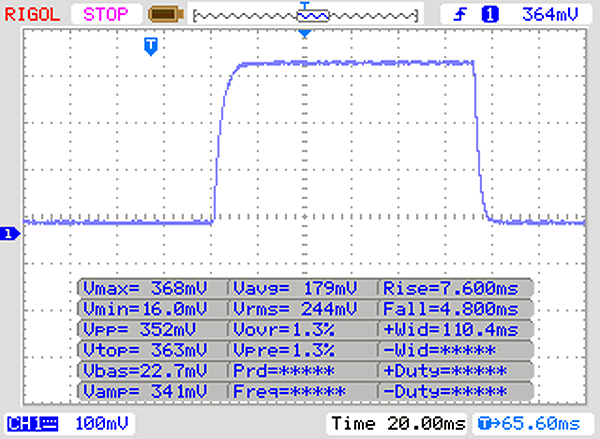 |
| ↘ 4 ms daling | ||
| Het scherm vertoonde prima responstijden in onze tests maar is misschien wat te traag voor competitieve games. Ter vergelijking: alle testtoestellen variëren van 0.1 (minimum) tot 240 (maximum) ms. » 29 % van alle toestellen zijn beter. Dit betekent dat de gemeten responstijd beter is dan het gemiddelde (19.9 ms) van alle geteste toestellen. | ||
| ↔ Responstijd 50% Grijs naar 80% Grijs | ||
| 15 ms ... stijging ↗ en daling ↘ gecombineerd | ↗ 8 ms stijging | 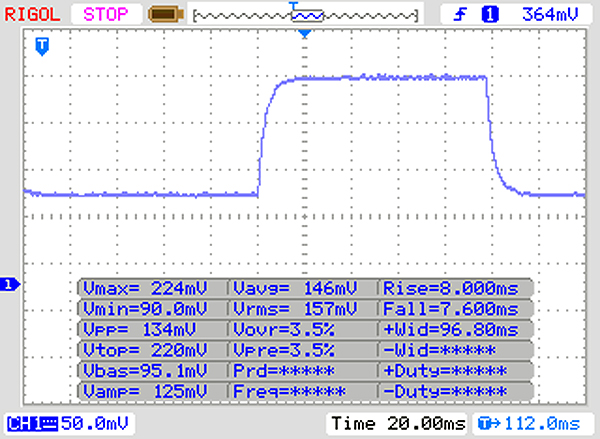 |
| ↘ 7 ms daling | ||
| Het scherm vertoonde prima responstijden in onze tests maar is misschien wat te traag voor competitieve games. Ter vergelijking: alle testtoestellen variëren van 0.165 (minimum) tot 636 (maximum) ms. » 29 % van alle toestellen zijn beter. Dit betekent dat de gemeten responstijd beter is dan het gemiddelde (31.1 ms) van alle geteste toestellen. | ||
Screen Flickering / PWM (Pulse-Width Modulation)
| Screen flickering / PWM niet waargenomen | 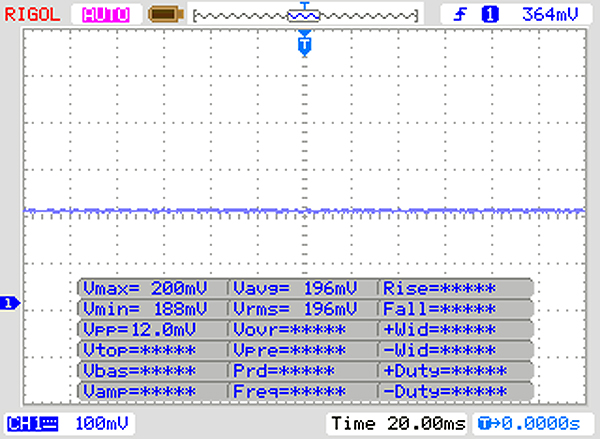 | ||
Ter vergelijking: 52 % van alle geteste toestellen maakten geen gebruik van PWM om de schermhelderheid te verlagen. Als het wel werd gebruikt, werd een gemiddelde van 7794 (minimum: 5 - maximum: 343500) Hz waargenomen. | |||
| PCMark 8 Home Score Accelerated v2 | 4440 punten | |
| PCMark 8 Work Score Accelerated v2 | 5543 punten | |
| PCMark 10 Score | 5125 punten | |
Help | ||
| Lenovo Legion Y530-15ICH Samsung SSD PM981 MZVLB256HAHQ | HP Pavilion Gaming 15-cx0003ng Intel Optane 16 GB MEMPEK1J016GAH + HGST HTS721010A9E630 1 TB HDD | Lenovo Legion Y7000P-1060 Samsung SSD PM981 MZVLB256HAHQ | Medion Erazer P6705-MD61131 Samsung SSD PM981 MZVLB256HAHQ | MSI P65 8RF-451 - Creator Kingston RBUSNS8154P3512GJ | Razer Blade 15 Base Model Samsung SSD PM981 MZVLB256HAHQ | Lenovo Legion Y530-15ICH Toshiba KBG30ZMT128G | Gemiddeld Samsung SSD PM981 MZVLB256HAHQ | |
|---|---|---|---|---|---|---|---|---|
| CrystalDiskMark 5.2 / 6 | -31% | -8% | 11% | -16% | 9% | -46% | 58% | |
| Write 4K (MB/s) | 108.9 | 59.2 -46% | 92.3 -15% | 107 -2% | 89.2 -18% | 112.5 3% | 71.8 -34% | 116.1 ? 7% |
| Read 4K (MB/s) | 40.23 | 91.3 127% | 39.04 -3% | 39.91 -1% | 34.36 -15% | 43.09 7% | 41.03 2% | 189.5 ? 371% |
| Write Seq (MB/s) | 1390 | 158.3 -89% | 1218 -12% | 1439 4% | 949 -32% | 1450 4% | 349 -75% | 1409 ? 1% |
| Read Seq (MB/s) | 964 | 880 -9% | 755 -22% | 2011 109% | 899 -7% | 1392 44% | 736 -24% | 1624 ? 68% |
| Write 4K Q32T1 (MB/s) | 314.2 | 161.8 -49% | 280.7 -11% | 282.1 -10% | 371.4 18% | 356.1 13% | 105.3 -66% | 360 ? 15% |
| Read 4K Q32T1 (MB/s) | 369.2 | 286.5 -22% | 328 -11% | 326.6 -12% | 399 8% | 406.9 10% | 308 -17% | 396 ? 7% |
| Write Seq Q32T1 (MB/s) | 1506 | 159.8 -89% | 1698 13% | 1441 -4% | 1035 -31% | 1451 -4% | 151.4 -90% | 1492 ? -1% |
| Read Seq Q32T1 (MB/s) | 3446 | 929 -73% | 3430 0% | 3516 2% | 1603 -53% | 3272 -5% | 1262 -63% | 3313 ? -4% |
| Write 4K Q8T8 (MB/s) | 760 | 1152 ? | ||||||
| Read 4K Q8T8 (MB/s) | 811 | 736 ? | ||||||
| AS SSD | -1631% | 60% | 19% | 11% | 58% | -160% | 50% | |
| Seq Read (MB/s) | 1808 | 854 -53% | 864 -52% | 2724 51% | 850 -53% | 1803 0% | 1231 -32% | 2032 ? 12% |
| Seq Write (MB/s) | 1429 | 147 -90% | 1646 15% | 1365 -4% | 869 -39% | 1367 -4% | 131.6 -91% | 1339 ? -6% |
| 4K Read (MB/s) | 46.1 | 105.1 128% | 32.4 -30% | 46.14 0% | 36.43 -21% | 40.75 -12% | 38.71 -16% | 46.1 ? 0% |
| 4K Write (MB/s) | 97 | 59.5 -39% | 88 -9% | 102.6 6% | 84.4 -13% | 93 -4% | 35.74 -63% | 107.4 ? 11% |
| 4K-64 Read (MB/s) | 536 | 42.09 -92% | 770 44% | 567 6% | 839 57% | 749 40% | 335.3 -37% | 712 ? 33% |
| 4K-64 Write (MB/s) | 273.6 | 137.3 -50% | 1392 409% | 459.8 68% | 602 120% | 1270 364% | 78.9 -71% | 999 ? 265% |
| Access Time Read * (ms) | 0.085 | 14.99 -17535% | 0.103 -21% | 0.08 6% | 0.104 -22% | 0.113 -33% | 0.626 -636% | 0.07076 ? 17% |
| Access Time Write * (ms) | 0.038 | 0.043 -13% | 0.044 -16% | 0.037 3% | 0.044 -16% | 0.04 -5% | 0.287 -655% | 0.04352 ? -15% |
| Score Read (Points) | 763 | 233 -69% | 888 16% | 886 16% | 960 26% | 970 27% | 497 -35% | 961 ? 26% |
| Score Write (Points) | 514 | 211 -59% | 1644 220% | 699 36% | 773 50% | 1499 192% | 128 -75% | 1240 ? 141% |
| Score Total (Points) | 1663 | 577 -65% | 3032 82% | 1983 19% | 2233 34% | 2952 78% | 838 -50% | 2671 ? 61% |
| Copy ISO MB/s (MB/s) | 110.1 | 1677 | 840 | 1892 | 1297 ? | |||
| Copy Program MB/s (MB/s) | 94.1 | 764 | 306.9 | 495.5 | 409 ? | |||
| Copy Game MB/s (MB/s) | 81.7 | 1298 | 622 | 1070 | 786 ? | |||
| Totaal Gemiddelde (Programma / Instellingen) | -831% /
-957% | 26% /
31% | 15% /
15% | -3% /
-0% | 34% /
38% | -103% /
-112% | 54% /
53% |
* ... kleiner is beter

| 3DMark 11 - 1280x720 Performance GPU | |
| Gemiddelde van klas Gaming (21841 - 80022, n=108, laatste 2 jaar) | |
| MSI P65 8RF-451 - Creator | |
| Gemiddeld NVIDIA GeForce GTX 1060 Mobile (12620 - 15607, n=77) | |
| Lenovo Legion Y530-15ICH | |
| Lenovo Legion Y7000P-1060 | |
| Razer Blade 15 Base Model | |
| Lenovo Legion Y530-15ICH | |
| Medion Erazer P6705-MD61131 | |
| HP Pavilion Gaming 15-cx0003ng | |
| 3DMark 11 Performance | 13743 punten | |
| 3DMark Cloud Gate Standard Score | 34124 punten | |
| 3DMark Fire Strike Score | 10389 punten | |
Help | ||
| The Witcher 3 | |
| 1920x1080 High Graphics & Postprocessing (Nvidia HairWorks Off) | |
| Gemiddelde van klas Gaming (181 - 341, n=3, laatste 2 jaar) | |
| MSI P65 8RF-451 - Creator | |
| Lenovo Legion Y530-15ICH | |
| Lenovo Legion Y7000P-1060 | |
| Razer Blade 15 Base Model | |
| Gemiddeld NVIDIA GeForce GTX 1060 Mobile (52.6 - 80.6, n=49) | |
| Medion Erazer P6705-MD61131 | |
| HP Pavilion Gaming 15-cx0003ng | |
| 1920x1080 Ultra Graphics & Postprocessing (HBAO+) | |
| Gemiddelde van klas Gaming (95 - 240, n=8, laatste 2 jaar) | |
| MSI P65 8RF-451 - Creator | |
| Lenovo Legion Y530-15ICH | |
| Gemiddeld NVIDIA GeForce GTX 1060 Mobile (24 - 42.3, n=60) | |
| Razer Blade 15 Base Model | |
| Lenovo Legion Y530-15ICH | |
| Lenovo Legion Y7000P-1060 | |
| Medion Erazer P6705-MD61131 | |
| HP Pavilion Gaming 15-cx0003ng | |
| lage | gem. | hoge | ultra | |
|---|---|---|---|---|
| BioShock Infinite (2013) | 280.5 | 232.6 | 224.8 | 114.2 |
| Thief (2014) | 98.4 | 77.9 | ||
| The Witcher 3 (2015) | 78 | 41.4 | ||
| Rise of the Tomb Raider (2016) | 64.8 |
Geluidsniveau
| Onbelast |
| 30.9 / 30.9 / 31.6 dB (A) |
| HDD |
| 31.3 dB (A) |
| Belasting |
| 42.3 / 40 dB (A) |
 | ||
30 dB stil 40 dB(A) hoorbaar 50 dB(A) luid |
||
min: | ||
(-) De maximumtemperatuur aan de bovenzijde bedraagt 48.4 °C / 119 F, vergeleken met het gemiddelde van 40.4 °C / 105 F, variërend van 21.2 tot 68.8 °C voor de klasse Gaming.
(-) De bodem warmt op tot een maximum van 48 °C / 118 F, vergeleken met een gemiddelde van 43.2 °C / 110 F
(+) Bij onbelast gebruik bedraagt de gemiddelde temperatuur voor de bovenzijde 25.8 °C / 78 F, vergeleken met het apparaatgemiddelde van 33.9 °C / 93 F.
(+) De palmsteunen en het touchpad zijn met een maximum van ###max## °C / 85.3 F koeler dan de huidtemperatuur en voelen daarom koel aan.
(±) De gemiddelde temperatuur van de handpalmsteun van soortgelijke toestellen bedroeg 28.8 °C / 83.8 F (-0.8 °C / -1.5 F).
Lenovo Legion Y530-15ICH audioanalyse
(-) | niet erg luide luidsprekers (68.3 dB)
Bas 100 - 315 Hz
(±) | verminderde zeebaars - gemiddeld 11.5% lager dan de mediaan
(+) | de lage tonen zijn lineair (6.4% delta naar de vorige frequentie)
Midden 400 - 2000 Hz
(±) | hogere middens - gemiddeld 5% hoger dan de mediaan
(+) | de middentonen zijn lineair (6.9% delta ten opzichte van de vorige frequentie)
Hoog 2 - 16 kHz
(+) | evenwichtige hoogtepunten - slechts 3% verwijderd van de mediaan
(+) | de hoge tonen zijn lineair (4.6% delta naar de vorige frequentie)
Algemeen 100 - 16.000 Hz
(±) | lineariteit van het totale geluid is gemiddeld (16% verschil met de mediaan)
Vergeleken met dezelfde klasse
» 38% van alle geteste apparaten in deze klasse waren beter, 6% vergelijkbaar, 55% slechter
» De beste had een delta van 6%, het gemiddelde was 18%, de slechtste was 132%
Vergeleken met alle geteste toestellen
» 25% van alle geteste apparaten waren beter, 5% gelijk, 70% slechter
» De beste had een delta van 4%, het gemiddelde was 24%, de slechtste was 134%
| Uit / Standby | |
| Inactief | |
| Belasting |
|
Key:
min: | |
| Lenovo Legion Y530-15ICH i7-8750H, GeForce GTX 1060 Mobile, Samsung SSD PM981 MZVLB256HAHQ, IPS, 1920x1080, 15.6" | HP Pavilion Gaming 15-cx0003ng i7-8750H, GeForce GTX 1050 Ti Mobile, Intel Optane 16 GB MEMPEK1J016GAH + HGST HTS721010A9E630 1 TB HDD, IPS, 1920x1080, 15.6" | Lenovo Legion Y7000P-1060 i7-8750H, GeForce GTX 1060 Mobile, Samsung SSD PM981 MZVLB256HAHQ, IPS, 1920x1080, 15.6" | Medion Erazer P6705-MD61131 i7-8750H, GeForce GTX 1050 Ti Mobile, Samsung SSD PM981 MZVLB256HAHQ, TN, 1920x1080, 15.6" | MSI P65 8RF-451 - Creator i7-8750H, GeForce GTX 1070 Max-Q, Kingston RBUSNS8154P3512GJ, IPS, 1920x1080, 15.6" | Razer Blade 15 Base Model i7-8750H, GeForce GTX 1060 Max-Q, Samsung SSD PM981 MZVLB256HAHQ, IPS, 1920x1080, 15.6" | Lenovo Legion Y530-15ICH i5-8300H, GeForce GTX 1050 Ti Mobile, Toshiba KBG30ZMT128G, IPS, 1920x1080, 15.6" | Gemiddeld NVIDIA GeForce GTX 1060 Mobile | Gemiddelde van klas Gaming | |
|---|---|---|---|---|---|---|---|---|---|
| Power Consumption | 16% | 5% | 27% | -6% | -14% | 16% | -36% | -59% | |
| Idle Minimum * (Watt) | 7.3 | 5.5 25% | 4.9 33% | 4 45% | 7.4 -1% | 10.2 -40% | 4.5 38% | 12.7 ? -74% | 13.2 ? -81% |
| Idle Average * (Watt) | 11.1 | 8.5 23% | 8.1 27% | 7 37% | 11.7 -5% | 13.2 -19% | 10 10% | 17.5 ? -58% | 18.9 ? -70% |
| Idle Maximum * (Watt) | 12.6 | 11.9 6% | 16.5 -31% | 11 13% | 16.8 -33% | 17.6 -40% | 13.8 -10% | 21.8 ? -73% | 24.3 ? -93% |
| Load Average * (Watt) | 109 | 94 14% | 109.2 -0% | 72 34% | 94 14% | 99.5 9% | 92.5 15% | 91.7 ? 16% | 108 ? 1% |
| Load Maximum * (Watt) | 168 | 144 14% | 175.2 -4% | 158 6% | 177 -5% | 133.3 21% | 123.2 27% | 156.4 ? 7% | 254 ? -51% |
| Witcher 3 ultra * (Watt) | 86 | 124.6 | 79 | 113.6 | 108.1 |
* ... kleiner is beter
| Lenovo Legion Y530-15ICH i7-8750H, GeForce GTX 1060 Mobile, 52 Wh | HP Pavilion Gaming 15-cx0003ng i7-8750H, GeForce GTX 1050 Ti Mobile, 52.5 Wh | Lenovo Legion Y7000P-1060 i7-8750H, GeForce GTX 1060 Mobile, 57 Wh | Medion Erazer P6705-MD61131 i7-8750H, GeForce GTX 1050 Ti Mobile, 62 Wh | MSI P65 8RF-451 - Creator i7-8750H, GeForce GTX 1070 Max-Q, 82 Wh | Razer Blade 15 Base Model i7-8750H, GeForce GTX 1060 Max-Q, 65 Wh | Lenovo Legion Y530-15ICH i5-8300H, GeForce GTX 1050 Ti Mobile, 52.5 Wh | Gemiddelde van klas Gaming | |
|---|---|---|---|---|---|---|---|---|
| Batterijduur | 106% | 72% | 203% | 109% | 120% | 8% | 119% | |
| Reader / Idle (h) | 8.3 | 10.8 30% | 13.6 64% | 8.9 7% | 7.5 -10% | 11.5 39% | 8.71 ? 5% | |
| WiFi v1.3 (h) | 3.8 | 5.3 39% | 5.8 53% | 6.7 76% | 7.1 87% | 5.5 45% | 4.1 8% | 7.02 ? 85% |
| Load (h) | 0.4 | 1.4 250% | 0.8 100% | 2.5 525% | 1.4 250% | 1.5 275% | 1.47 ? 268% |
Pro
Contra
Voor het volledige, Engelse testrapport, klik hier.
Elke configuratie van de Lenovo Legion Y530 is een krachtige gaming-laptop, die de kracht van zijn componenten zeer goed kan benutten. De resultaten in de synthetische benchmarks en gaming testen zijn daardoor erg goed. Het beeldscherm produceert mooie beelden met levendige kleuren.
Gezien de lage prijs, kunnen we de Lenovo Legion Y530 met de Nvidia GeForce GTX 1060 aanbevelen.
Het koelsysteem moet hard doorwerken om de prestaties te behouden, maar dit resulteert in luide ventilatoren. Het wordt aangeraden om een koptelefoon te gebruiken voor langere gamesessies. De batterijduur is ook relatief kort, hoewel dit niet ongebruikelijk is voor een apparaat uit dit segment.
Lenovo Legion Y530-15ICH
- 14-12-2018 v6 (old)
Mike Wobker
Price comparison
