Kort testrapport MSI P65 Creator 8RF (i7-8750H, GTX 1070 Max-Q, 512 GB SSD, 144 Hz) Laptop


| |||||||||||||||||||||||||
Helderheidsverdeling: 85 %
Helderheid in Batterij-modus: 238 cd/m²
Contrast: 1068:1 (Zwart: 0.22 cd/m²)
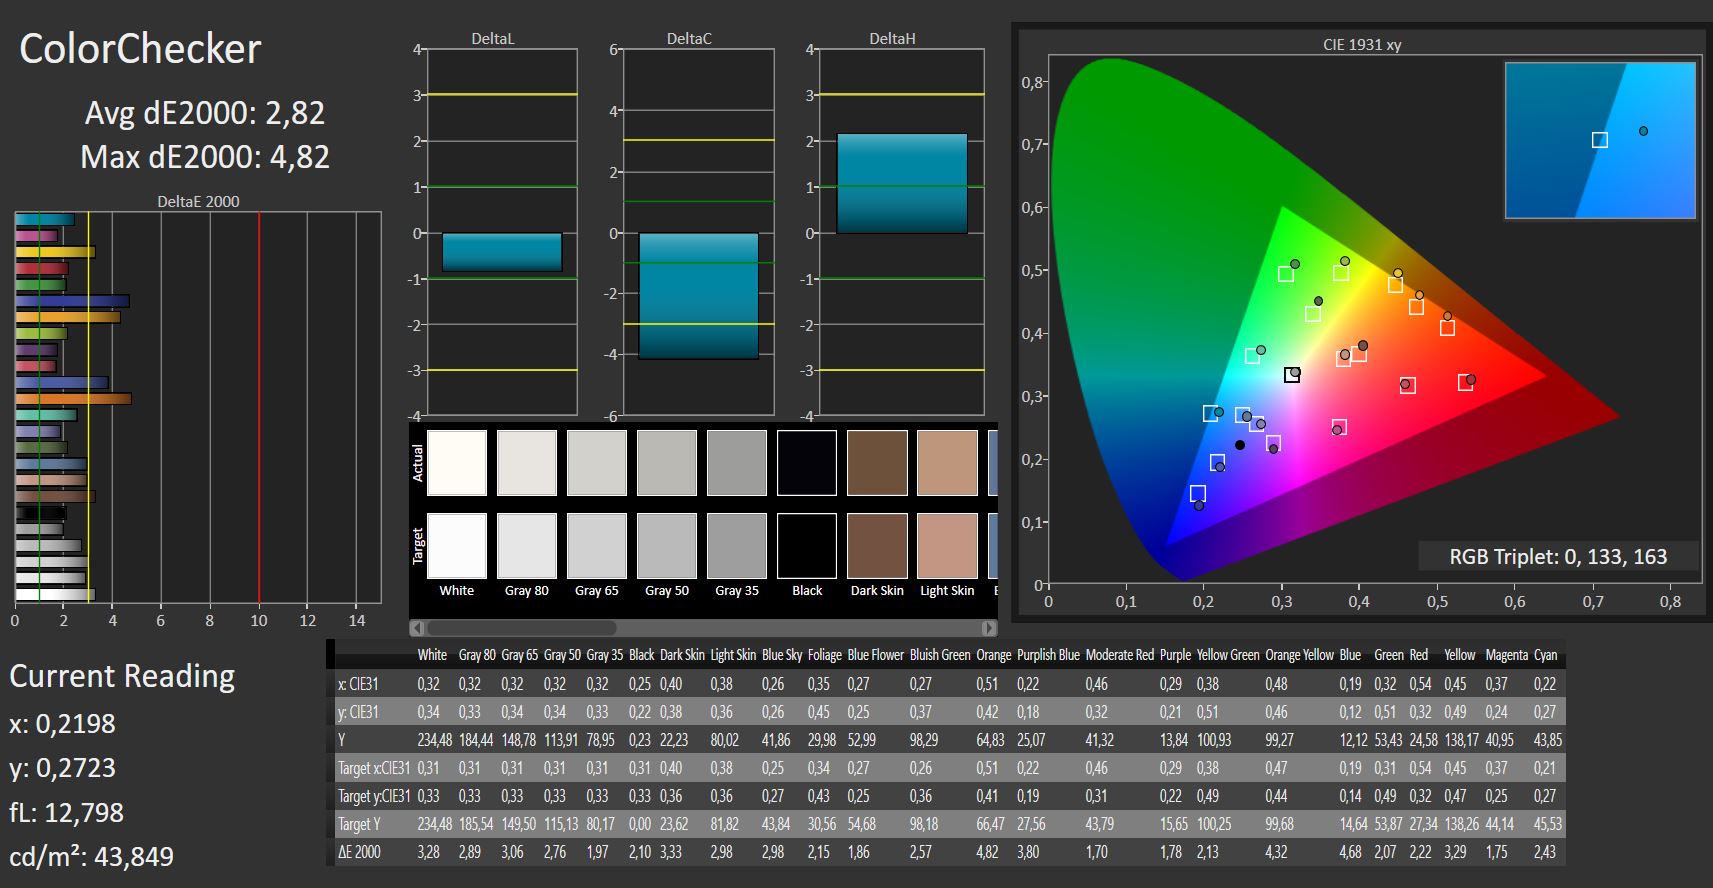
ΔE ColorChecker Calman: 2.82 | ∀{0.5-29.43 Ø4.71}
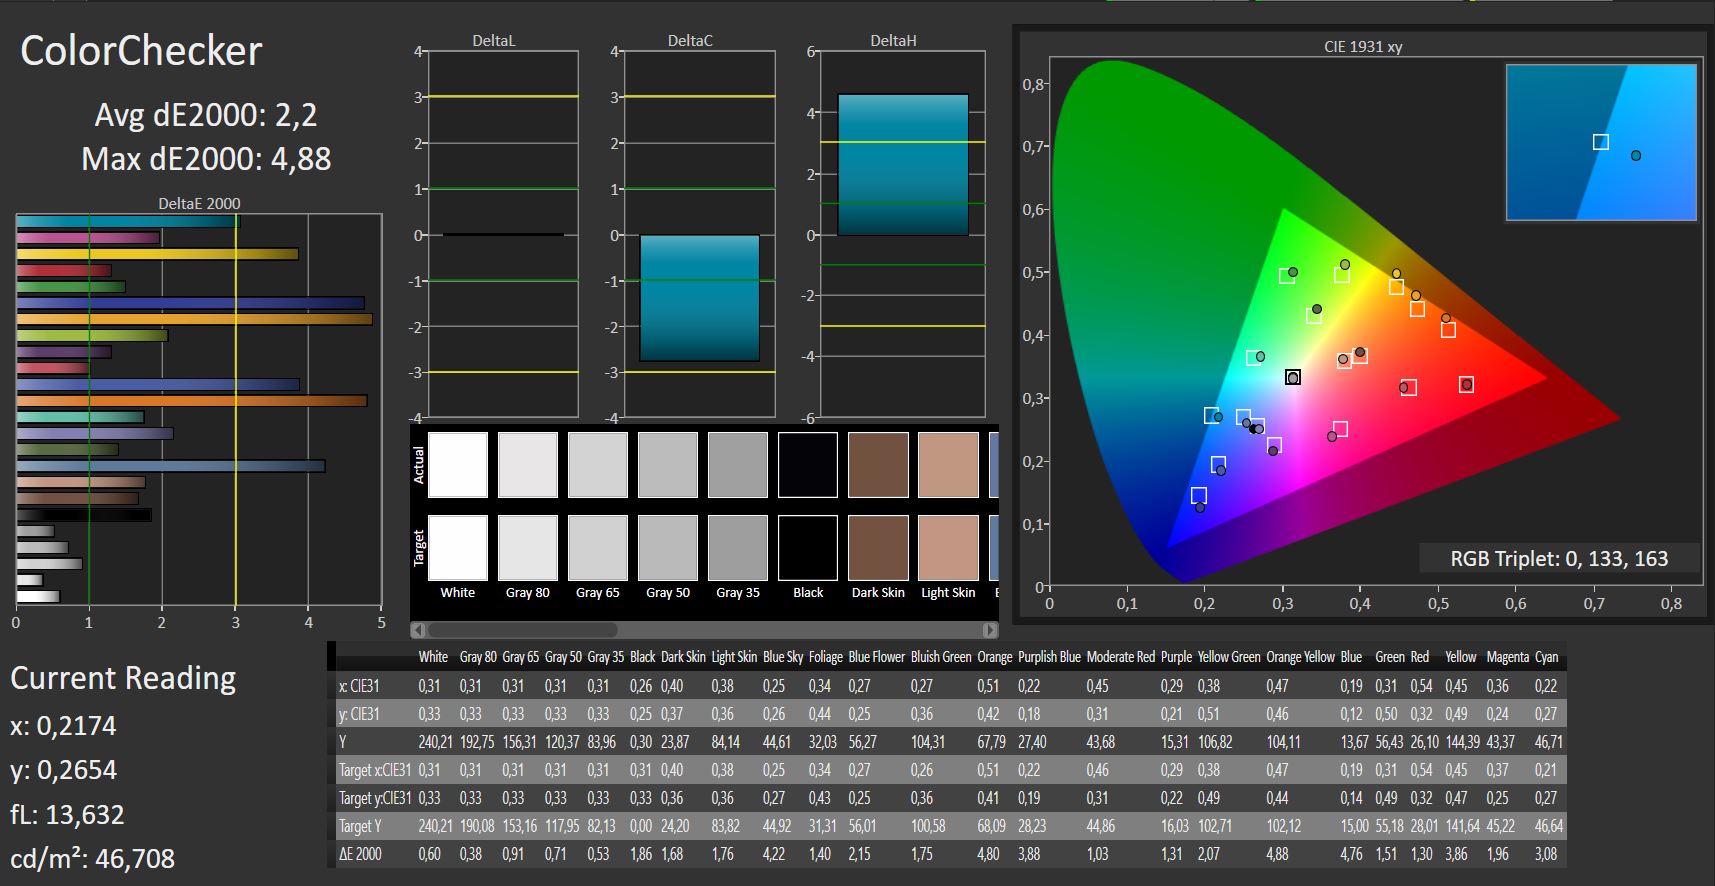
calibrated: 4.88
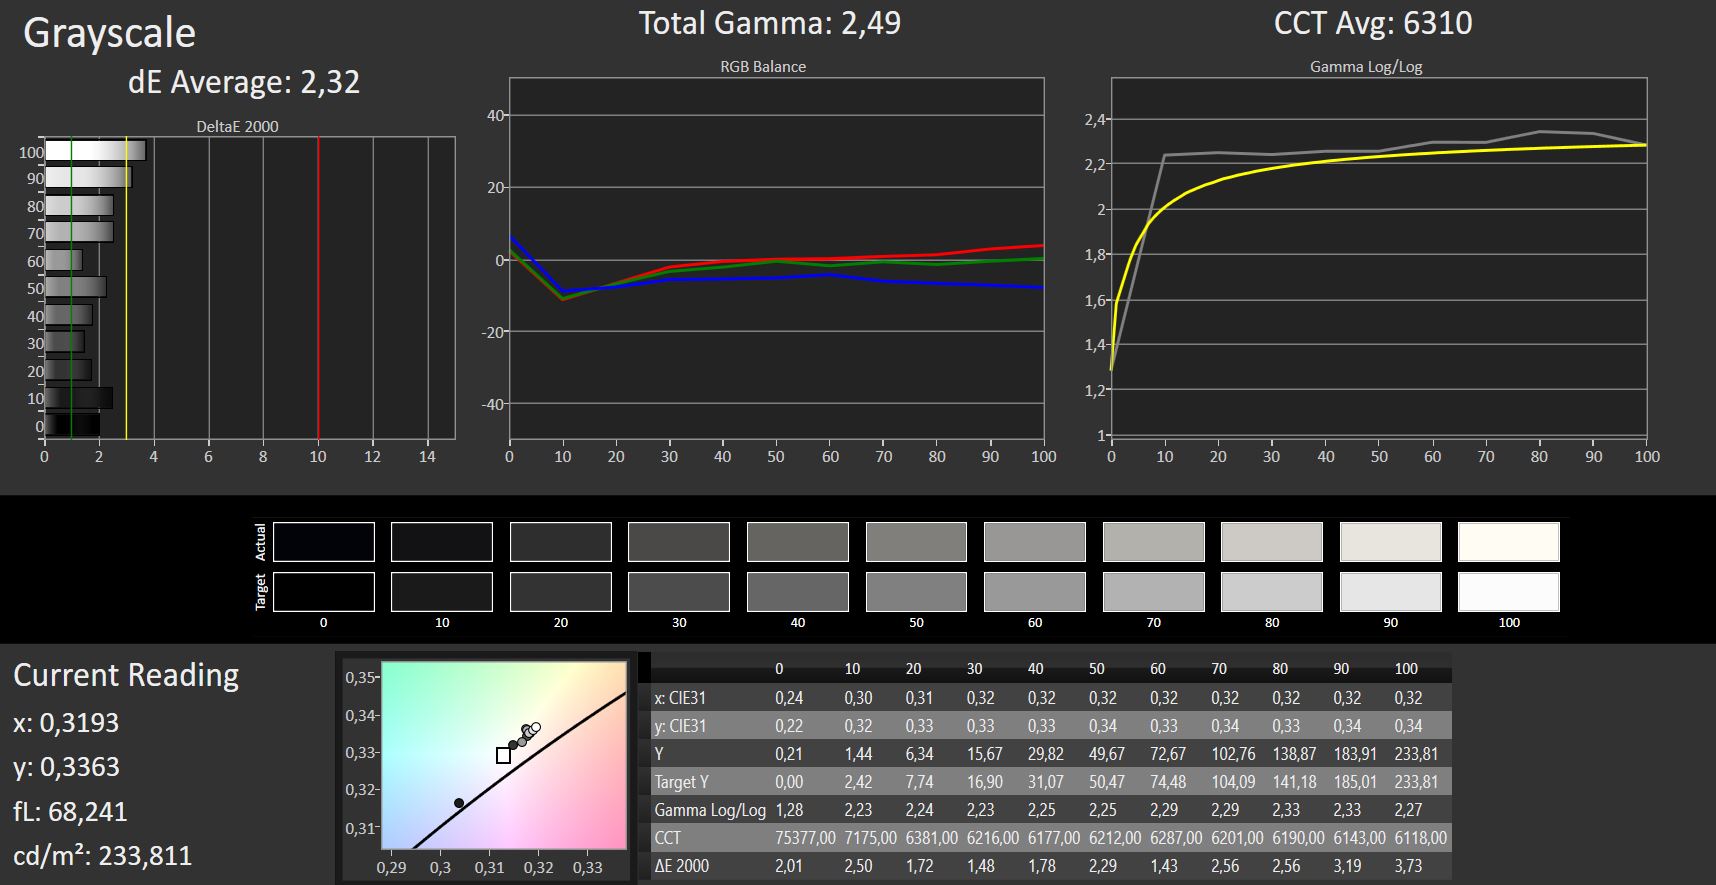
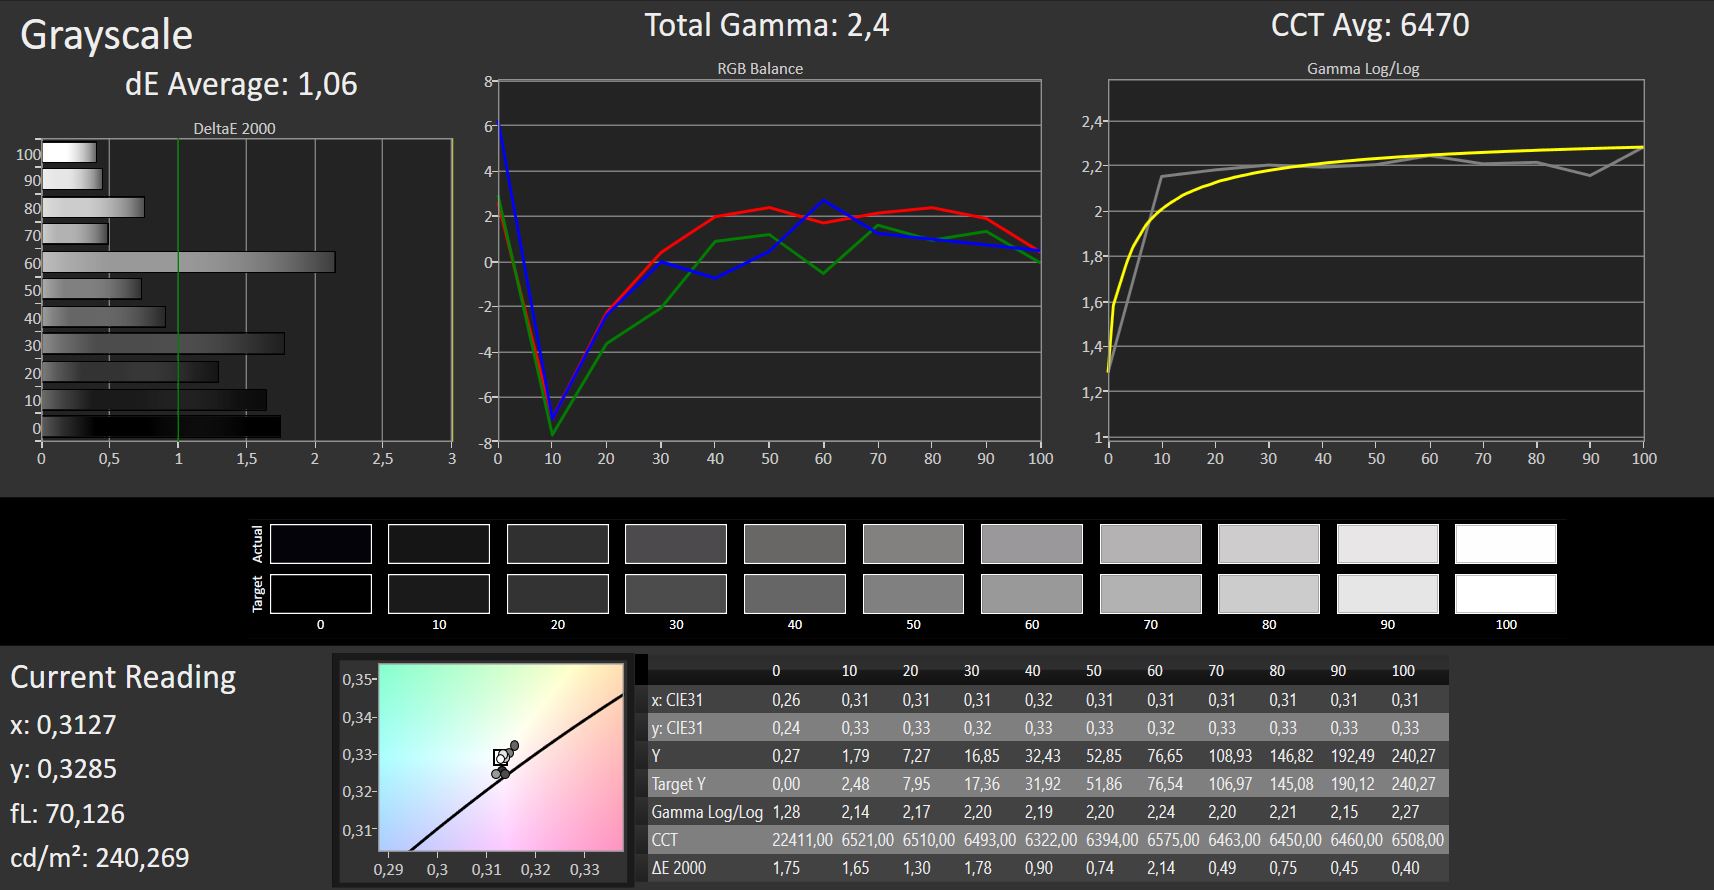
ΔE Greyscale Calman: 2.32 | ∀{0.09-98 Ø4.96}
92% sRGB (Argyll 1.6.3 3D)
59% AdobeRGB 1998 (Argyll 1.6.3 3D)
65.9% AdobeRGB 1998 (Argyll 3D)
91.1% sRGB (Argyll 3D)
65.1% Display P3 (Argyll 3D)
Gamma: 2.49
CCT: 6310 K
| MSI P65 8RF-451 - Creator AU Optronics B156HAN08.0 (AUO80ED), IPS, 1920x1080, 15.6" | Asus ZenBook Pro 15 UX580GE AU Optronics B156ZAN03.1, IPS, 3840x2160, 15.6" | Gigabyte Aero 15X v8 LGD05C0, IPS, 1920x1080, 15.6" | Asus GL504GS AU Optronics B156HAN08.2 (AUO82ED), IPS, 1920x1080, 15.6" | MSI GS65 8RF-019DE Stealth Thin AU Optronics B156HAN08.0 (AUO80ED), IPS, 1920x1080, 15.6" | Lenovo ThinkPad X1 Extreme-20MF000XGE B156ZAN03.2, IPS, 3840x2160, 15.6" | |
|---|---|---|---|---|---|---|
| Display | 31% | -0% | 0% | 2% | 31% | |
| Display P3 Coverage (%) | 65.1 | 85.9 32% | 63.6 -2% | 66.4 2% | 66.2 2% | 86.3 33% |
| sRGB Coverage (%) | 91.1 | 100 10% | 93.8 3% | 90.2 -1% | 92.1 1% | 100 10% |
| AdobeRGB 1998 Coverage (%) | 65.9 | 99.1 50% | 64.9 -2% | 66 0% | 67.2 2% | 99.4 51% |
| Response Times | -141% | -4% | 38% | -13% | -238% | |
| Response Time Grey 50% / Grey 80% * (ms) | 16 ? | 44 ? -175% | 16.8 ? -5% | 7.2 ? 55% | 17.6 ? -10% | 61.6 ? -285% |
| Response Time Black / White * (ms) | 11 ? | 22.8 ? -107% | 11.2 ? -2% | 8.8 ? 20% | 12.8 ? -16% | 32 ? -191% |
| PWM Frequency (Hz) | ||||||
| Screen | -2% | 18% | 3% | 13% | 2% | |
| Brightness middle (cd/m²) | 235 | 357.6 52% | 313 33% | 271 15% | 254 8% | 396 69% |
| Brightness (cd/m²) | 235 | 350 49% | 300 28% | 261 11% | 262 11% | 380 62% |
| Brightness Distribution (%) | 85 | 85 0% | 78 -8% | 86 1% | 89 5% | 90 6% |
| Black Level * (cd/m²) | 0.22 | 0.35 -59% | 0.33 -50% | 0.32 -45% | 0.22 -0% | 0.28 -27% |
| Contrast (:1) | 1068 | 1022 -4% | 948 -11% | 847 -21% | 1155 8% | 1414 32% |
| Colorchecker dE 2000 * | 2.82 | 4.12 -46% | 1.29 54% | 2.61 7% | 2.37 16% | 4 -42% |
| Colorchecker dE 2000 max. * | 4.82 | 9.91 -106% | 2.04 58% | 4.93 -2% | 4.71 2% | 7.6 -58% |
| Colorchecker dE 2000 calibrated * | 4.88 | 4.23 13% | 2.33 52% | 1.84 62% | 0.9 82% | |
| Greyscale dE 2000 * | 2.32 | 1.8 22% | 0.69 70% | 1.97 15% | 1.58 32% | 6.1 -163% |
| Gamma | 2.49 88% | 2.17 101% | 2.43 91% | 2.4 92% | 2.48 89% | 2.25 98% |
| CCT | 6310 103% | 6613 98% | 6550 99% | 6398 102% | 6785 96% | 7786 83% |
| Color Space (Percent of AdobeRGB 1998) (%) | 59 | 87.5 48% | 60 2% | 59 0% | 60 2% | 88.5 50% |
| Color Space (Percent of sRGB) (%) | 92 | 100 9% | 94 2% | 90 -2% | 92 0% | 100 9% |
| Totaal Gemiddelde (Programma / Instellingen) | -37% /
-13% | 5% /
11% | 14% /
7% | 1% /
8% | -68% /
-23% |
* ... kleiner is beter

Responstijd Scherm
| ↔ Responstijd Zwart naar Wit | ||
|---|---|---|
| 11 ms ... stijging ↗ en daling ↘ gecombineerd | ↗ 7 ms stijging | 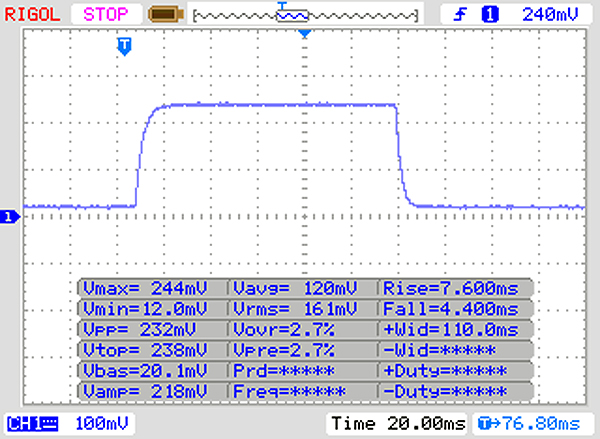 |
| ↘ 4 ms daling | ||
| Het scherm vertoonde prima responstijden in onze tests maar is misschien wat te traag voor competitieve games. Ter vergelijking: alle testtoestellen variëren van 0.1 (minimum) tot 240 (maximum) ms. » 30 % van alle toestellen zijn beter. Dit betekent dat de gemeten responstijd beter is dan het gemiddelde (19.8 ms) van alle geteste toestellen. | ||
| ↔ Responstijd 50% Grijs naar 80% Grijs | ||
| 16 ms ... stijging ↗ en daling ↘ gecombineerd | ↗ 9 ms stijging | 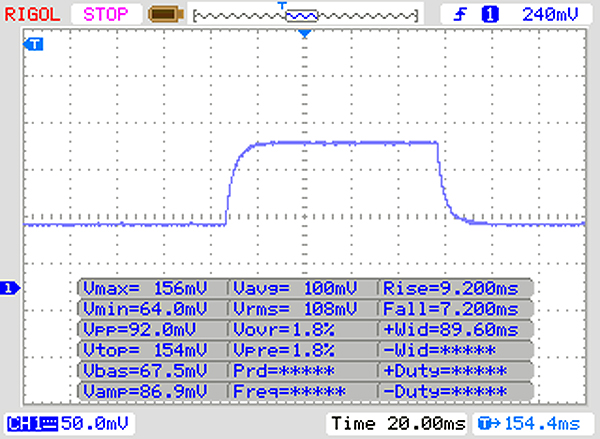 |
| ↘ 7 ms daling | ||
| Het scherm vertoonde prima responstijden in onze tests maar is misschien wat te traag voor competitieve games. Ter vergelijking: alle testtoestellen variëren van 0.165 (minimum) tot 636 (maximum) ms. » 30 % van alle toestellen zijn beter. Dit betekent dat de gemeten responstijd beter is dan het gemiddelde (31 ms) van alle geteste toestellen. | ||
Screen Flickering / PWM (Pulse-Width Modulation)
| Screen flickering / PWM niet waargenomen | 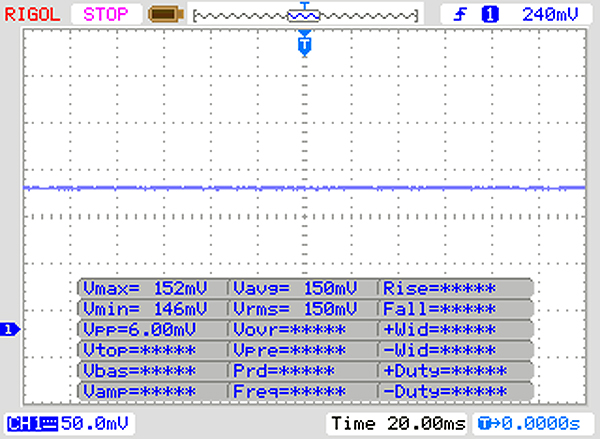 | ||
Ter vergelijking: 52 % van alle geteste toestellen maakten geen gebruik van PWM om de schermhelderheid te verlagen. Als het wel werd gebruikt, werd een gemiddelde van 7754 (minimum: 5 - maximum: 343500) Hz waargenomen. | |||
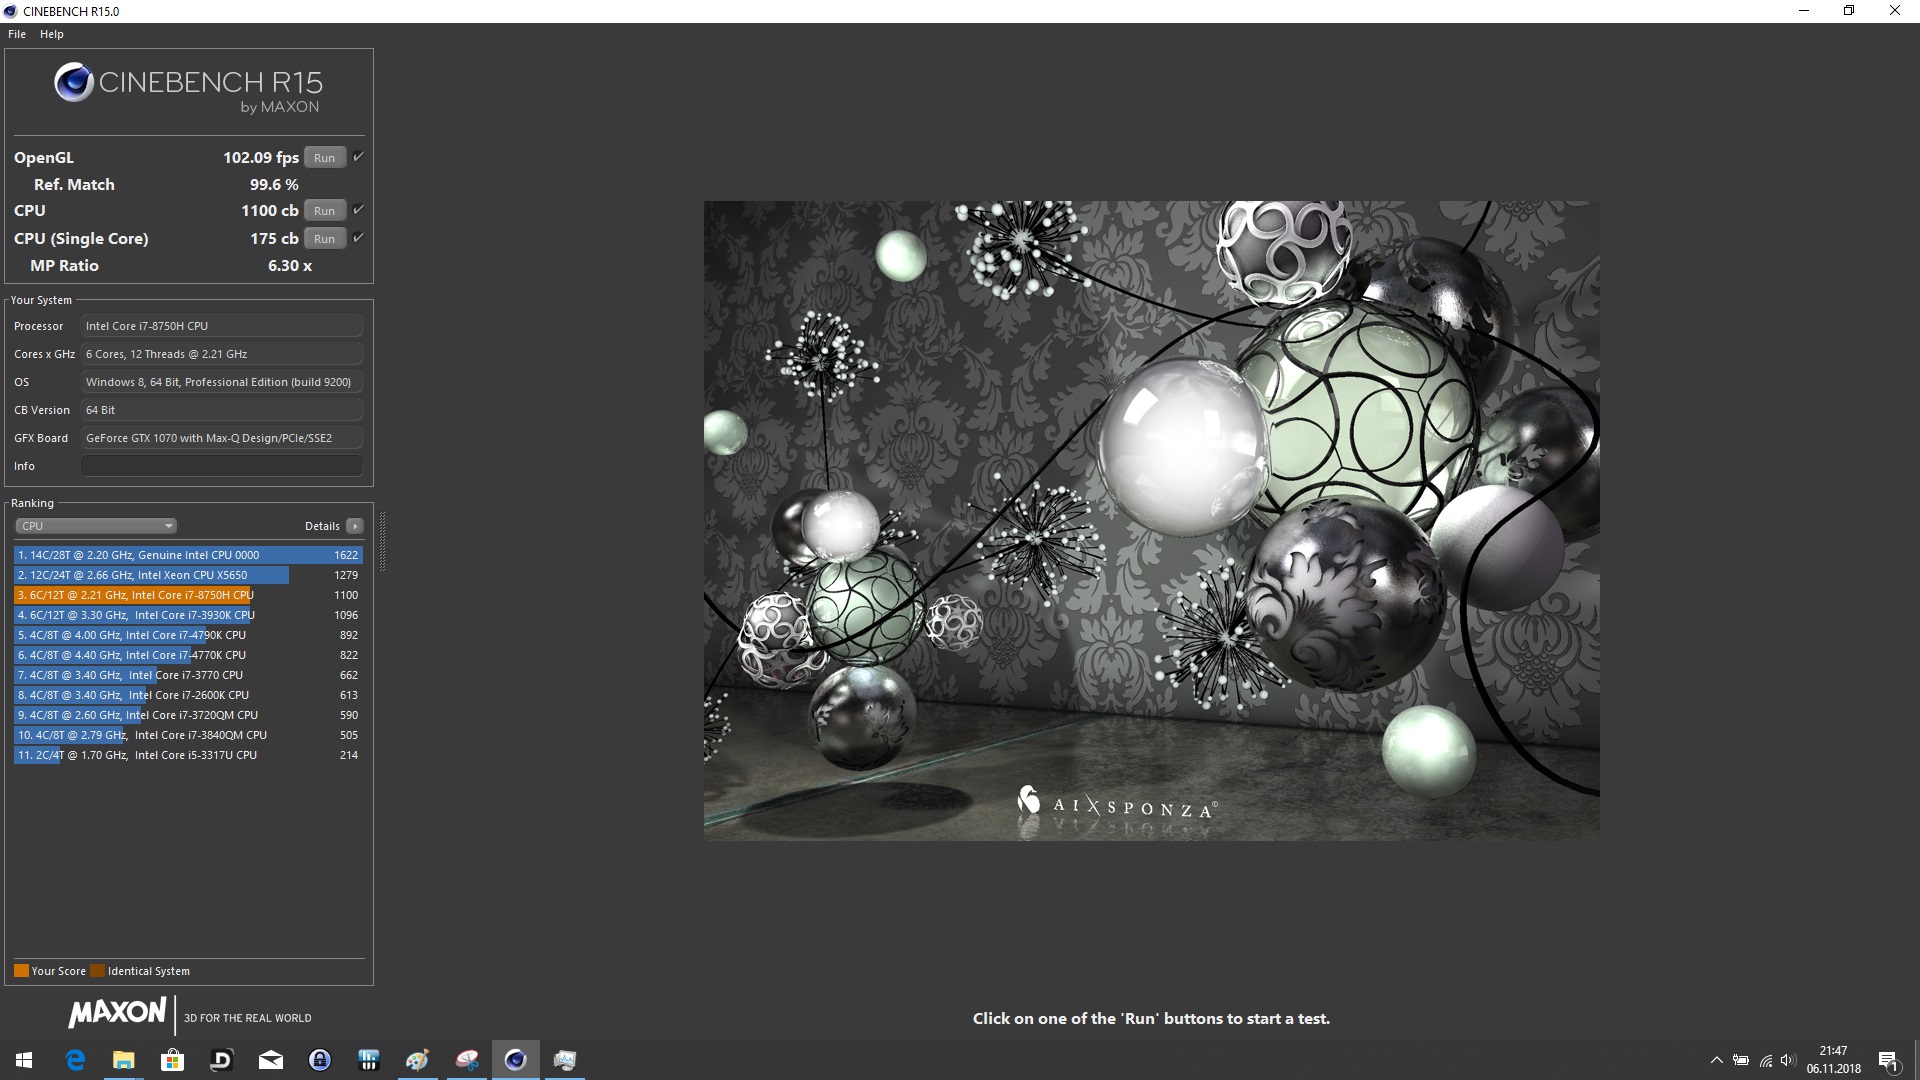
| HWBOT x265 Benchmark v2.2 - 4k Preset | |
| Gemiddelde van klas Multimedia (5.26 - 36.1, n=56, laatste 2 jaar) | |
| Gemiddeld Intel Core i7-8750H (7.56 - 9.55, n=5) | |
| MSI P65 8RF-451 - Creator | |
| Blender - v2.79 BMW27 CPU | |
| MSI P65 8RF-451 - Creator | |
| Gemiddeld Intel Core i7-8750H (396 - 486, n=6) | |
| Gemiddelde van klas Multimedia (100 - 557, n=58, laatste 2 jaar) | |
* ... kleiner is beter
| PCMark 8 Home Score Accelerated v2 | 4446 punten | |
| PCMark 8 Creative Score Accelerated v2 | 5264 punten | |
| PCMark 8 Work Score Accelerated v2 | 5651 punten | |
| PCMark 10 Score | 4910 punten | |
Help | ||
| MSI P65 8RF-451 - Creator Kingston RBUSNS8154P3512GJ | Asus ZenBook Pro 15 UX580GE Samsung SSD PM961 1TB M.2 PCIe 3.0 x4 NVMe (MZVLW1T0) | Gigabyte Aero 15X v8 Toshiba NVMe THNSN5512GPU7 | Asus GL504GS Samsung SSD PM981 MZVLB512HAJQ | MSI GS65 8RF-019DE Stealth Thin Samsung SSD PM981 MZVLB512HAJQ | Lenovo ThinkPad X1 Extreme-20MF000XGE Samsung SSD PM981 MZVLB1T0HALR | |
|---|---|---|---|---|---|---|
| CrystalDiskMark 5.2 / 6 | 33% | 21% | 42% | 35% | 71% | |
| Write 4K (MB/s) | 89.2 | 125 40% | 94.4 6% | 97.9 10% | 95.3 7% | 123.7 39% |
| Read 4K (MB/s) | 34.36 | 44.68 30% | 37.65 10% | 41.23 20% | 40.13 17% | 44.07 28% |
| Write Seq (MB/s) | 949 | 1059 12% | 1335 41% | 1852 95% | 1883 98% | 2215 133% |
| Read Seq (MB/s) | 899 | 772 -14% | 1404 56% | 1761 96% | 1322 47% | 2242 149% |
| Write 4K Q32T1 (MB/s) | 371.4 | 507 37% | 268.6 -28% | 297.7 -20% | 309.9 -17% | 313.9 -15% |
| Read 4K Q32T1 (MB/s) | 399 | 614 54% | 332.8 -17% | 344.2 -14% | 353.7 -11% | 359.8 -10% |
| Write Seq Q32T1 (MB/s) | 1035 | 1763 70% | 1375 33% | 1864 80% | 1919 85% | 2404 132% |
| Read Seq Q32T1 (MB/s) | 1603 | 2171 35% | 2627 64% | 2738 71% | 2466 54% | 3333 108% |
| AS SSD | 72% | 19% | 83% | 72% | 123% | |
| Seq Read (MB/s) | 850 | 2099 147% | 2213 160% | 1837 116% | 1266 49% | 2703 218% |
| Seq Write (MB/s) | 869 | 1729 99% | 1163 34% | 1730 99% | 1834 111% | 2336 169% |
| 4K Read (MB/s) | 36.43 | 37.78 4% | 23.36 -36% | 53.3 46% | 48.94 34% | 56.8 56% |
| 4K Write (MB/s) | 84.4 | 100.9 20% | 80.4 -5% | 105.7 25% | 107.2 27% | 130.9 55% |
| 4K-64 Read (MB/s) | 839 | 1431 71% | 847 1% | 1305 56% | 1170 39% | 1805 115% |
| 4K-64 Write (MB/s) | 602 | 1273 111% | 742 23% | 1704 183% | 1760 192% | 1782 196% |
| Access Time Read * (ms) | 0.104 | 0.04 62% | 0.119 -14% | 0.049 53% | 0.073 30% | 0.034 67% |
| Access Time Write * (ms) | 0.044 | 0.036 18% | 0.046 -5% | 0.035 20% | 0.035 20% | 0.028 36% |
| Score Read (Points) | 960 | 1679 75% | 1092 14% | 1542 61% | 1346 40% | 2132 122% |
| Score Write (Points) | 773 | 1547 100% | 939 21% | 1983 157% | 2051 165% | 2147 178% |
| Score Total (Points) | 2233 | 4065 82% | 2536 14% | 4318 93% | 4122 85% | 5355 140% |
| Totaal Gemiddelde (Programma / Instellingen) | 53% /
55% | 20% /
20% | 63% /
66% | 54% /
56% | 97% /
101% |
* ... kleiner is beter

| 3DMark 06 Standard Score | 33475 punten | |
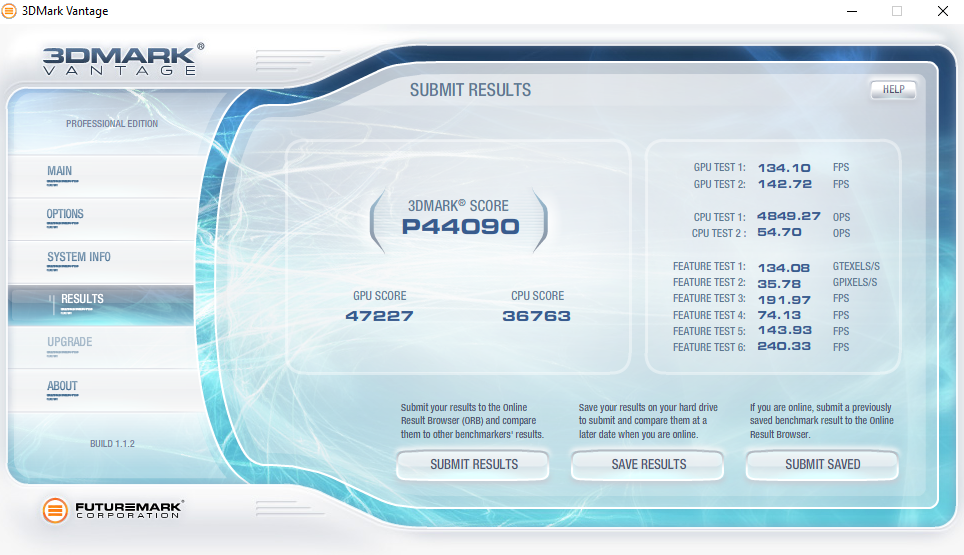
| 3DMark Vantage P Result | 44090 punten | |
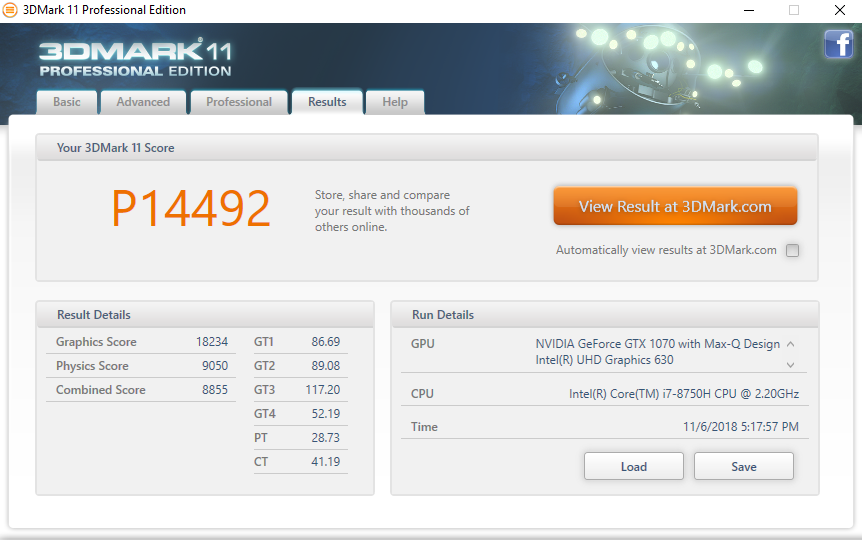
| 3DMark 11 Performance | 14492 punten | |
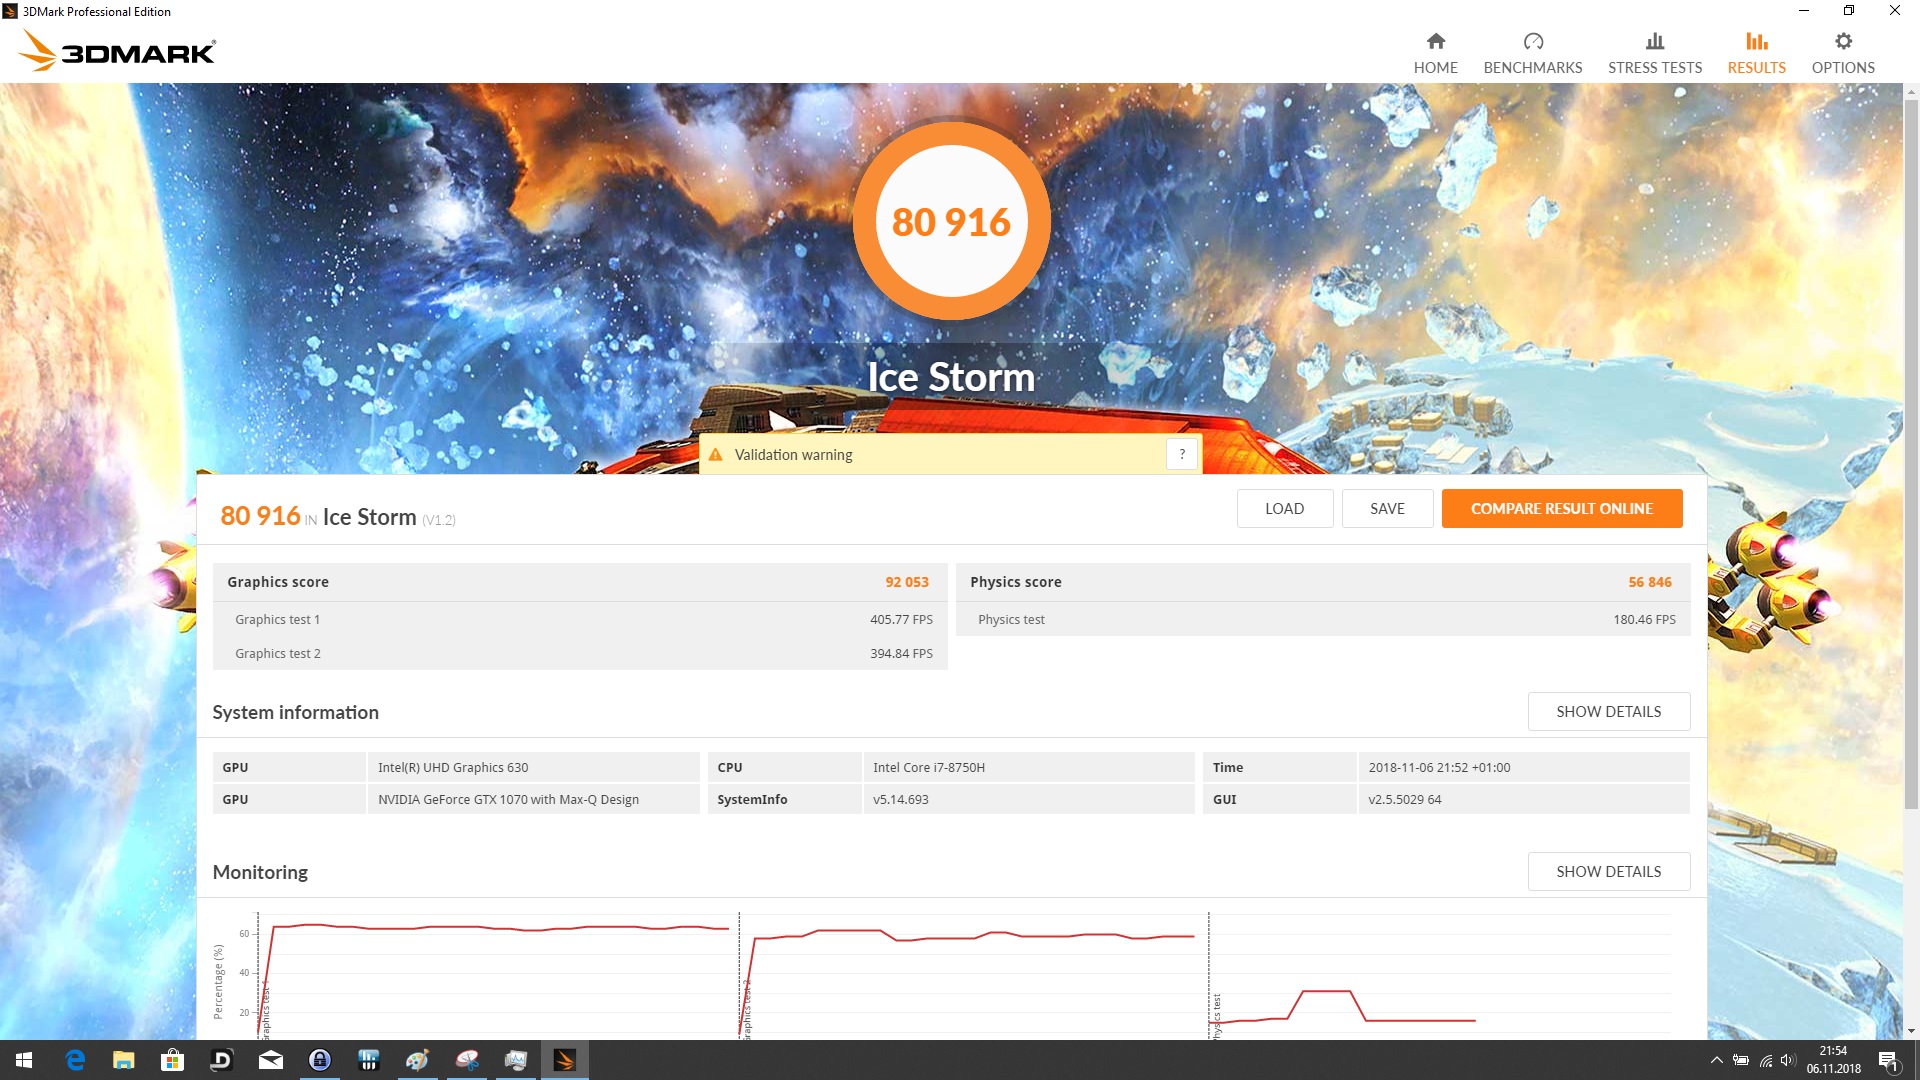
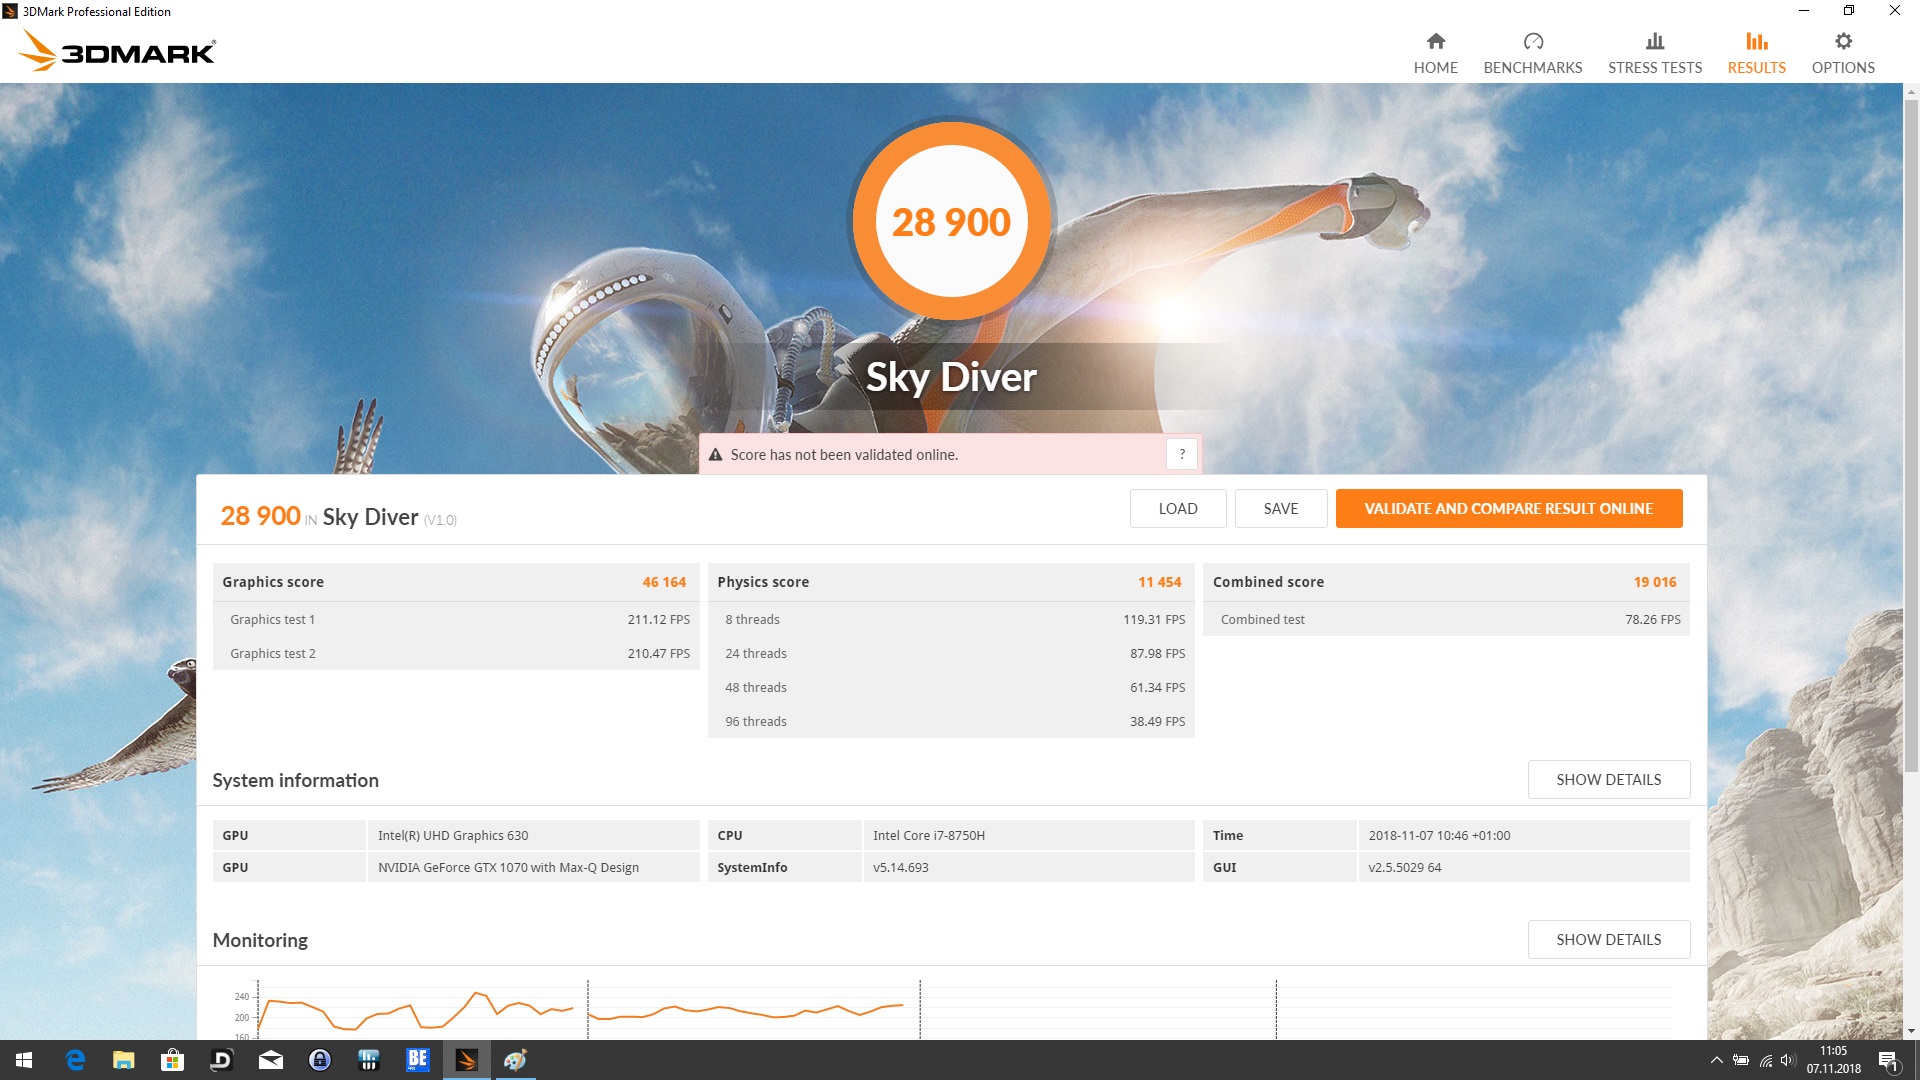
| 3DMark Ice Storm Standard Score | 80916 punten | |
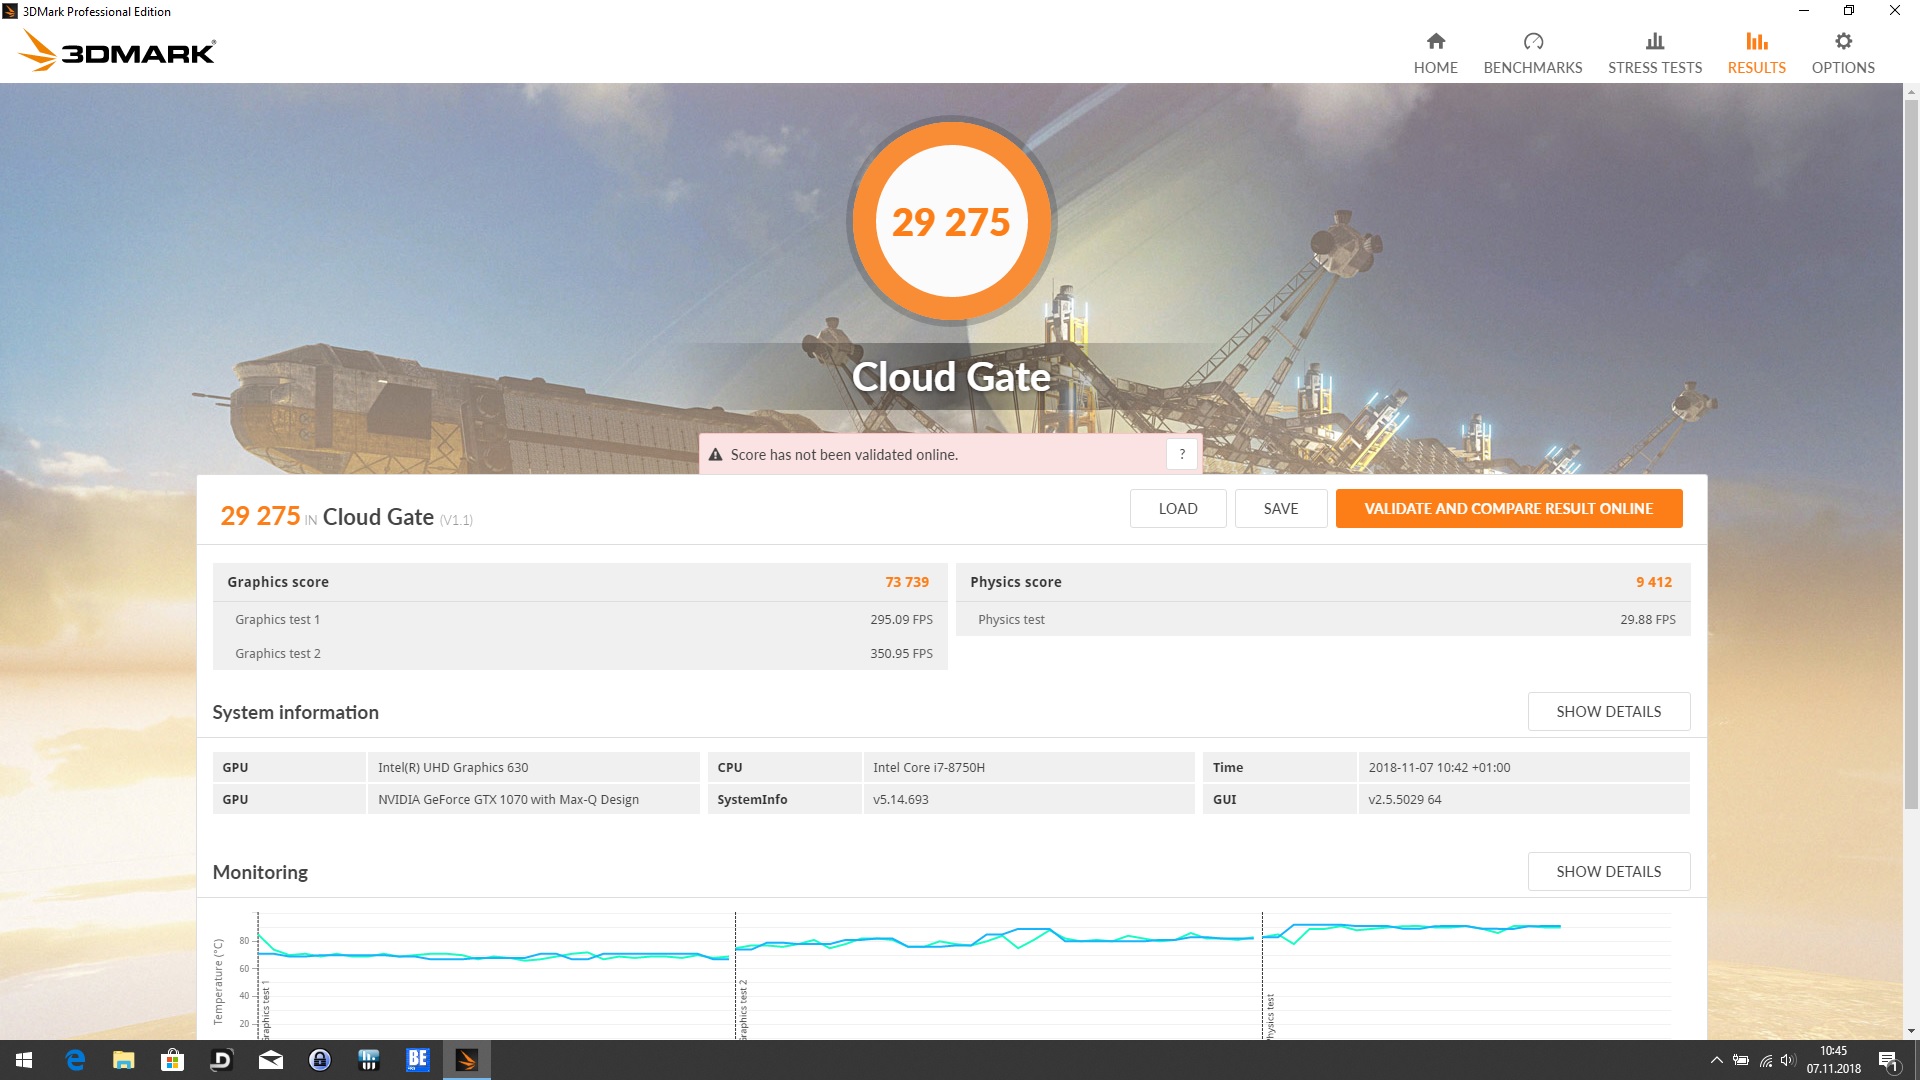
| 3DMark Cloud Gate Standard Score | 29275 punten | |
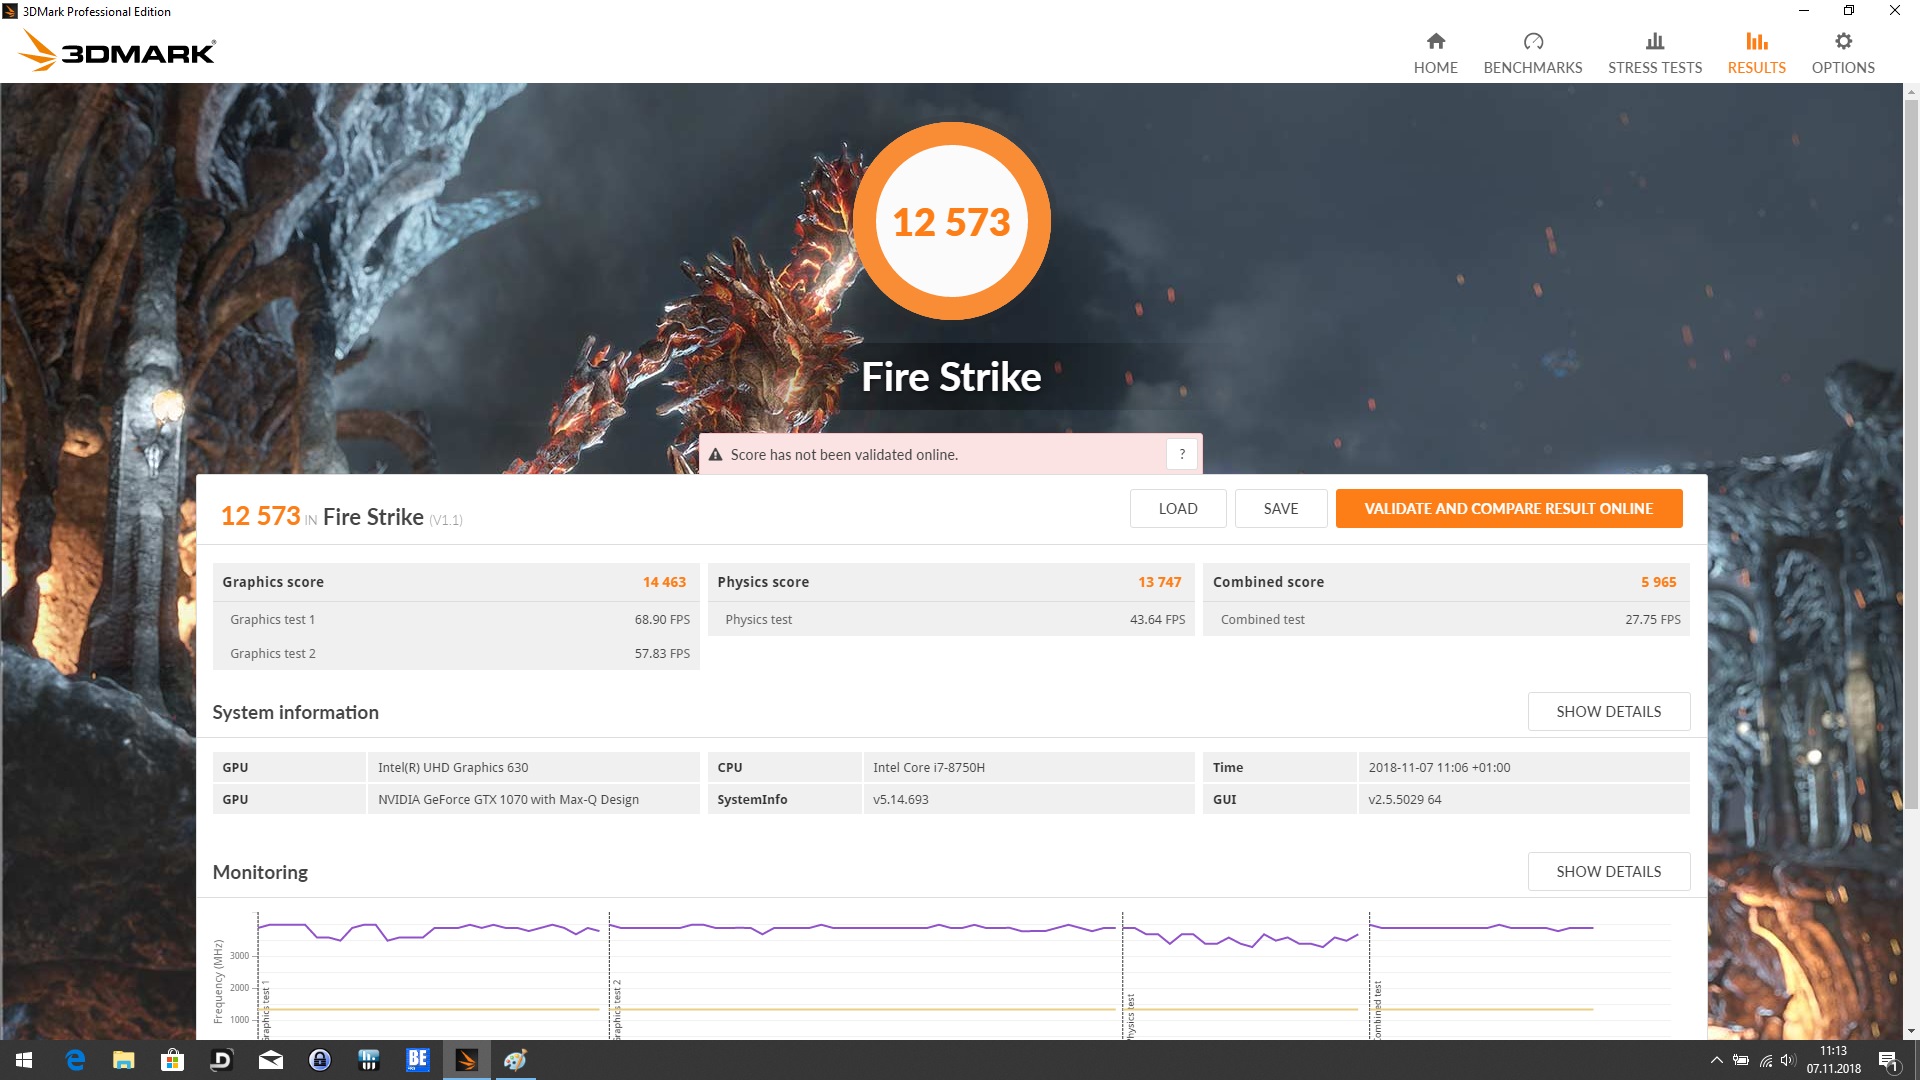
| 3DMark Fire Strike Score | 12573 punten | |
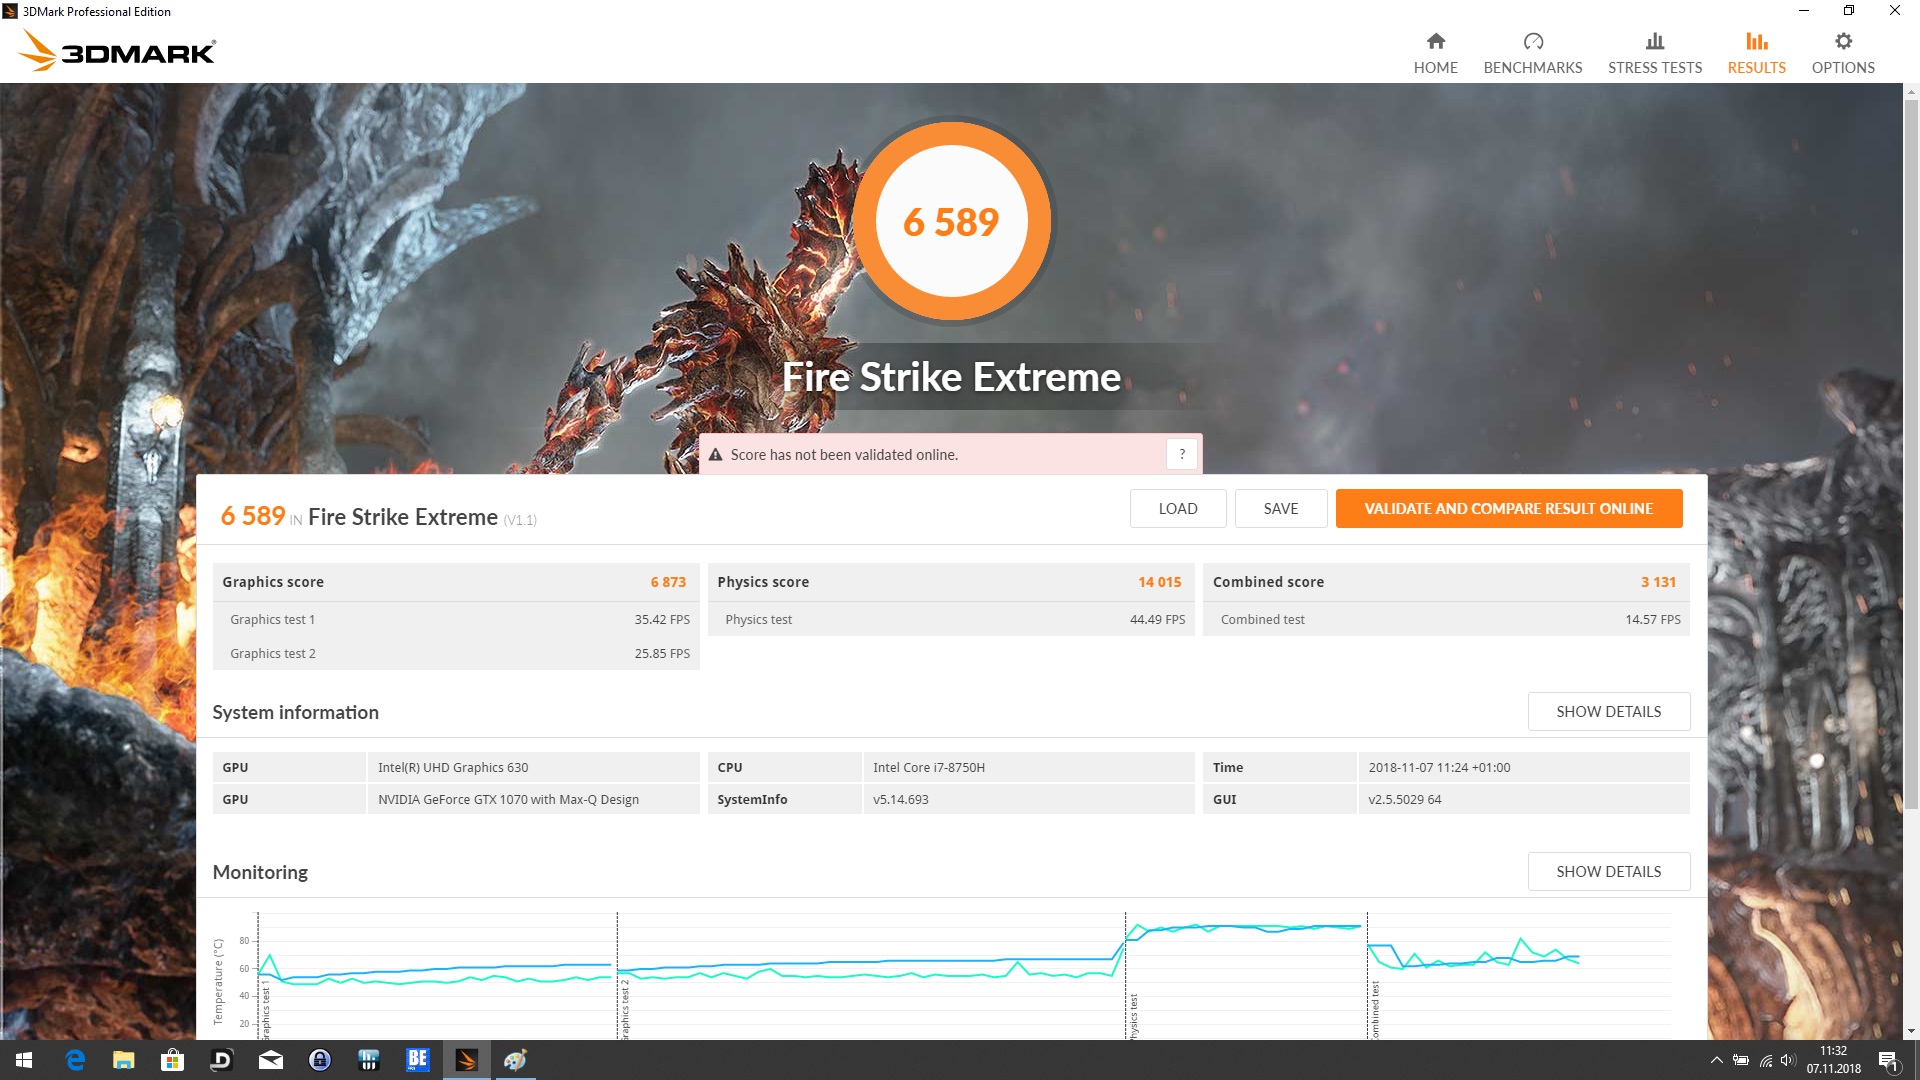
| 3DMark Fire Strike Extreme Score | 6589 punten | |
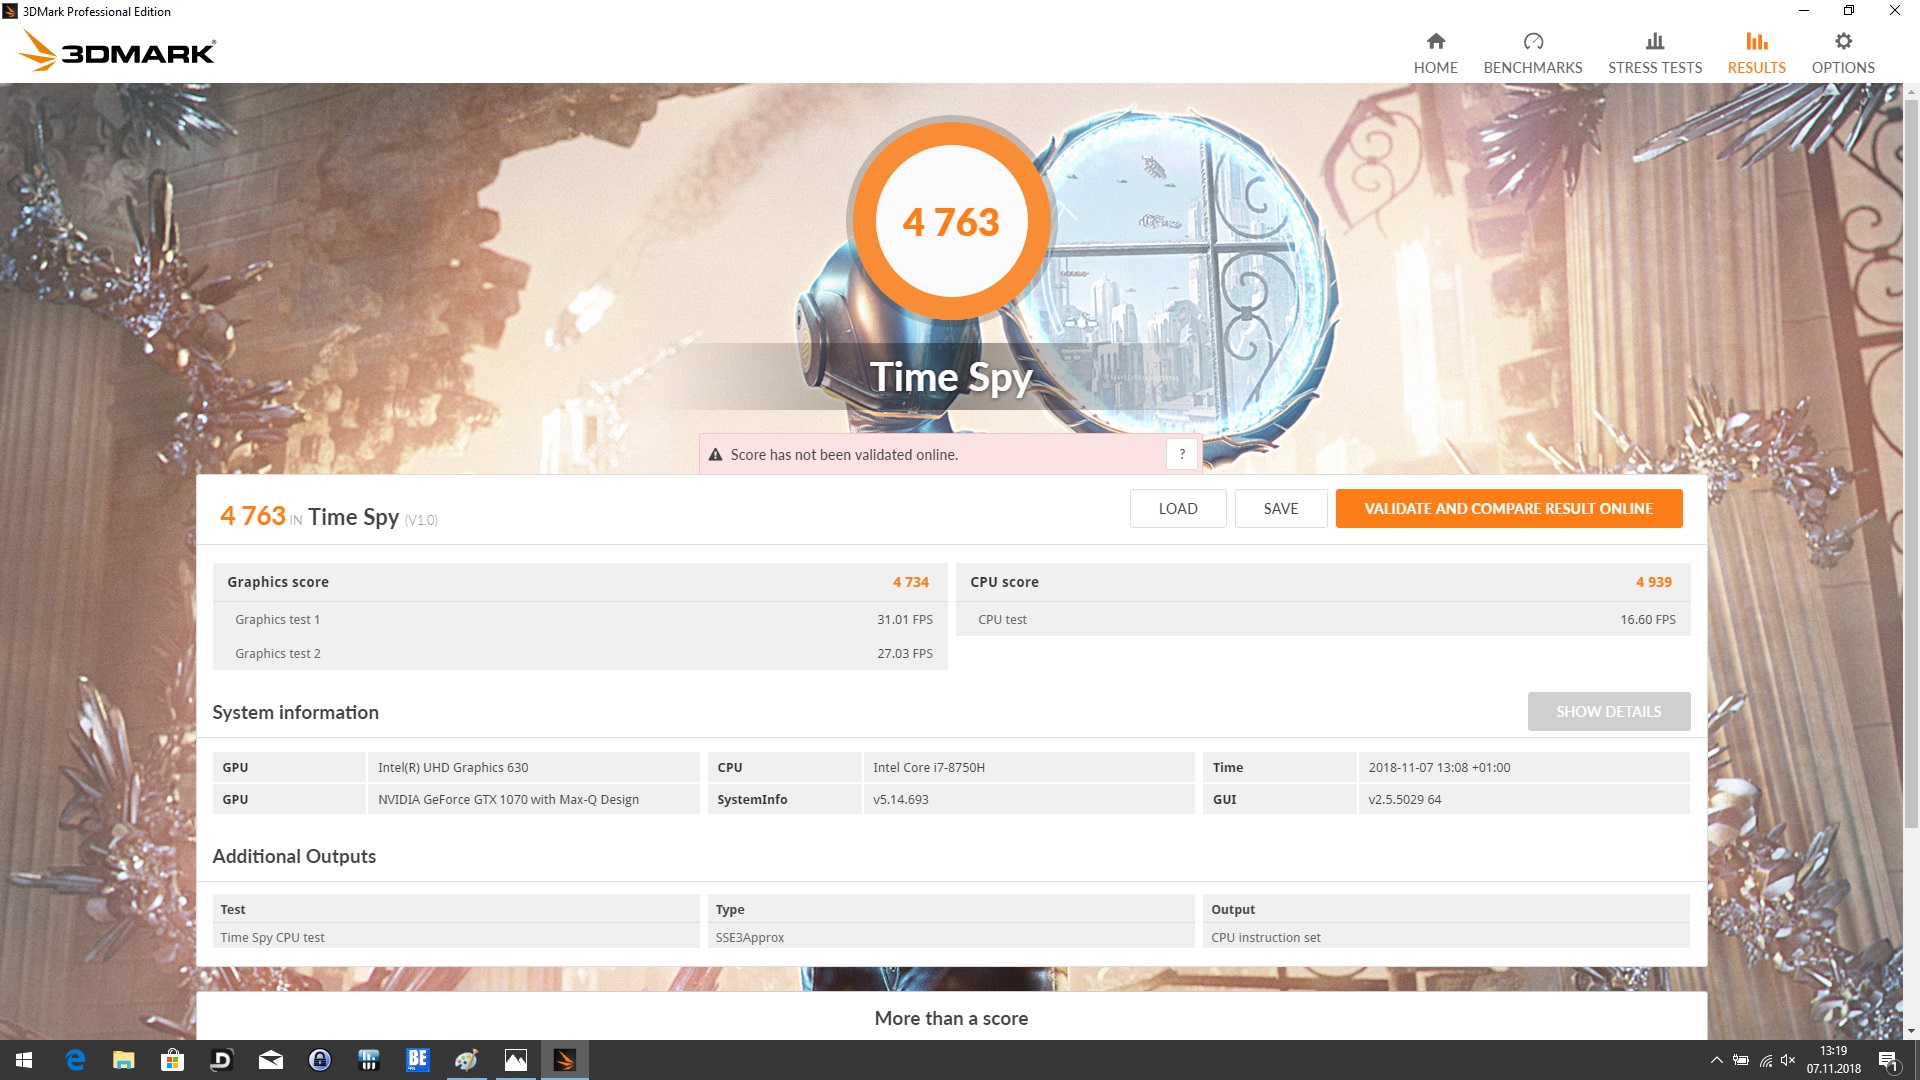
| 3DMark Time Spy Score | 4763 punten | |
Help | ||
| The Witcher 3 - 1920x1080 Ultra Graphics & Postprocessing (HBAO+) | |
| Asus GL504GS | |
| Gemiddelde van klas Multimedia (11 - 121, n=7, laatste 2 jaar) | |
| MSI GS65 8RF-019DE Stealth Thin | |
| Gigabyte Aero 15X v8 | |
| MSI P65 8RF-451 - Creator | |
| Gemiddeld NVIDIA GeForce GTX 1070 Max-Q (46 - 55.3, n=19) | |
| MSI WS63 7RF-290US | |
| Lenovo ThinkPad X1 Extreme-20MF000XGE | |
| Asus ZenBook Pro 15 UX580GE | |
| Shadow of the Tomb Raider - 1920x1080 Highest Preset AA:T | |
| Gemiddelde van klas Multimedia (23 - 129, n=8, laatste 2 jaar) | |
| Gemiddeld NVIDIA GeForce GTX 1070 Max-Q (58 - 61, n=3) | |
| MSI P65 8RF-451 - Creator | |
| Lenovo ThinkPad X1 Extreme-20MF000XGE | |
| F1 2018 - 1920x1080 Ultra High Preset AA:T AF:16x | |
| MSI P65 8RF-451 - Creator | |
| Gemiddeld NVIDIA GeForce GTX 1070 Max-Q (70 - 76, n=3) | |
| Lenovo ThinkPad X1 Extreme-20MF000XGE | |
| Forza Horizon 4 - 1920x1080 Ultra Preset AA:2xMS | |
| Gemiddeld NVIDIA GeForce GTX 1070 Max-Q (78 - 80, n=2) | |
| MSI P65 8RF-451 - Creator | |
| lage | gem. | hoge | ultra | 4K | |
|---|---|---|---|---|---|
| BioShock Infinite (2013) | 249.1 | 222.1 | 204.7 | 118 | |
| The Witcher 3 (2015) | 218.5 | 156.7 | 93.2 | 51.5 | 27.7 |
| Rise of the Tomb Raider (2016) | 131.1 | 126.7 | 85.7 | 77.1 | 32.1 |
| Battlefield 1 (2016) | 123.2 | 105.5 | 91.5 | 90.7 | 39.1 |
| Assassin´s Creed Origins (2017) | 70 | 64 | 62 | 53 | 26 |
| Far Cry 5 (2018) | 103 | 81 | 77 | 74 | 27 |
| F1 2018 (2018) | 163 | 130 | 100 | 76 | 59 |
| Shadow of the Tomb Raider (2018) | 91 | 65 | 62 | 58 | 20 |
| Forza Horizon 4 (2018) | 127 | 101 | 95 | 78 | 43 |
| Assassin´s Creed Odyssey (2018) | 64 | 62 | 52 | 39 | 21 |
Geluidsniveau
| Onbelast |
| 32.1 / 32.1 / 32.4 dB (A) |
| Belasting |
| 39 / 40.2 dB (A) |
 | ||
30 dB stil 40 dB(A) hoorbaar 50 dB(A) luid |
||
min: | ||
| MSI P65 8RF-451 - Creator Intel Core i7-8750H, NVIDIA GeForce GTX 1070 Max-Q | Asus ZenBook Pro 15 UX580GE Intel Core i9-8950HK, NVIDIA GeForce GTX 1050 Ti Mobile | Lenovo ThinkPad X1 Extreme-20MF000XGE Intel Core i7-8750H, NVIDIA GeForce GTX 1050 Ti Max-Q | Gigabyte Aero 15X v8 Intel Core i7-8750H, NVIDIA GeForce GTX 1070 Max-Q | Asus GL504GS Intel Core i7-8750H, NVIDIA GeForce GTX 1070 Mobile | MSI GS65 8RF-019DE Stealth Thin Intel Core i7-8750H, NVIDIA GeForce GTX 1070 Max-Q | MSI WS63 7RF-290US Intel Core i7-7700HQ, NVIDIA Quadro P3000 | |
|---|---|---|---|---|---|---|---|
| Noise | 2% | 6% | -9% | -13% | -2% | 3% | |
| uit / omgeving * (dB) | 30.7 | 28 9% | 28.8 6% | 29 6% | 29 6% | 30 2% | 28.1 8% |
| Idle Minimum * (dB) | 32.1 | 28.6 11% | 28.8 10% | 30 7% | 32 -0% | 30 7% | 28.1 12% |
| Idle Average * (dB) | 32.1 | 29.9 7% | 28.8 10% | 31 3% | 33 -3% | 31 3% | 28.1 12% |
| Idle Maximum * (dB) | 32.4 | 30.5 6% | 31.3 3% | 35 -8% | 40 -23% | 34 -5% | 32 1% |
| Load Average * (dB) | 39 | 42.5 -9% | 36.4 7% | 49 -26% | 49 -26% | 43 -10% | 38 3% |
| Load Maximum * (dB) | 40.2 | 44.8 -11% | 39.2 2% | 54 -34% | 53 -32% | 44 -9% | 47.2 -17% |
| Witcher 3 ultra * (dB) | 44.8 | 36.4 | 51 | 51 | 42 | 35.8 |
* ... kleiner is beter
(-) De maximumtemperatuur aan de bovenzijde bedraagt 46.6 °C / 116 F, vergeleken met het gemiddelde van 36.8 °C / 98 F, variërend van 21 tot 71 °C voor de klasse Multimedia.
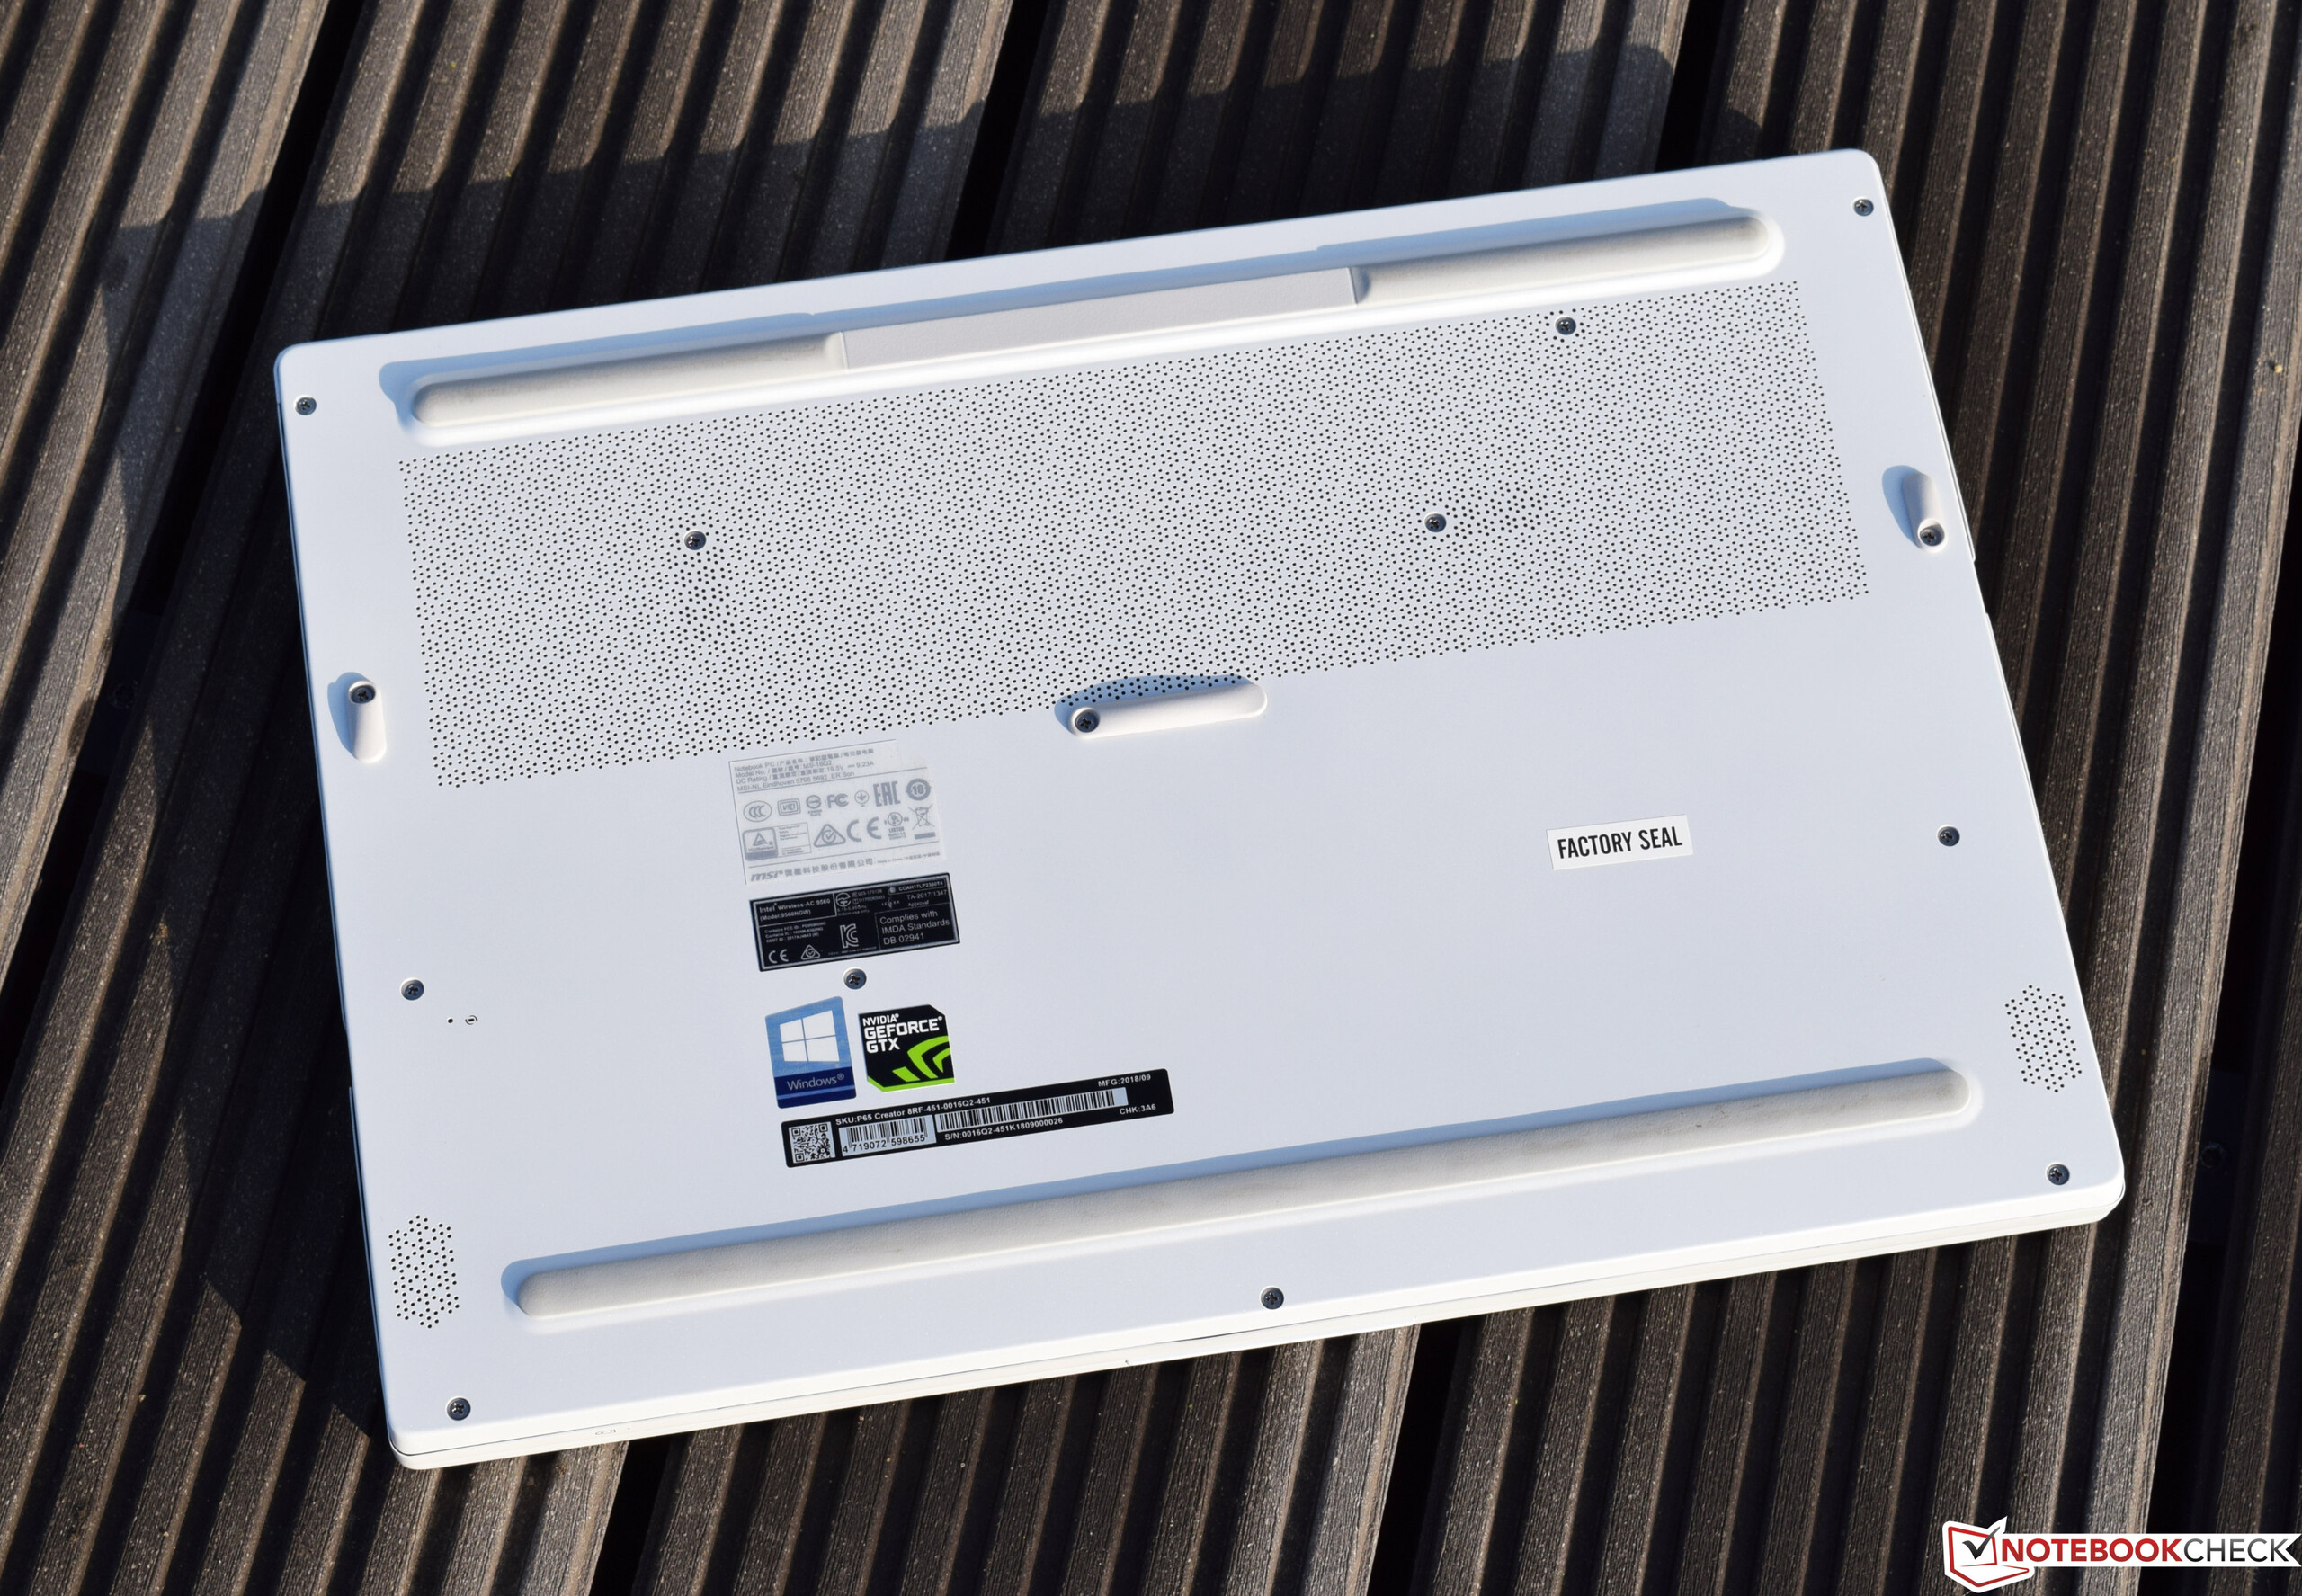
(-) De bodem warmt op tot een maximum van 56.6 °C / 134 F, vergeleken met een gemiddelde van 39.1 °C / 102 F
(+) Bij onbelast gebruik bedraagt de gemiddelde temperatuur voor de bovenzijde 27 °C / 81 F, vergeleken met het apparaatgemiddelde van 31.3 °C / 88 F.
(-) De palmsteunen en het touchpad kunnen zeer heet aanvoelen met een maximum van ###max## °C / 107.1 F.
(-) De gemiddelde temperatuur van de handpalmsteun van soortgelijke toestellen bedroeg 28.7 °C / 83.7 F (-13 °C / -23.4 F).
| MSI P65 8RF-451 - Creator GeForce GTX 1070 Max-Q, i7-8750H, Kingston RBUSNS8154P3512GJ | Asus ZenBook Pro 15 UX580GE GeForce GTX 1050 Ti Mobile, i9-8950HK, Samsung SSD PM961 1TB M.2 PCIe 3.0 x4 NVMe (MZVLW1T0) | Lenovo ThinkPad X1 Extreme-20MF000XGE GeForce GTX 1050 Ti Max-Q, i7-8750H, Samsung SSD PM981 MZVLB1T0HALR | Gigabyte Aero 15X v8 GeForce GTX 1070 Max-Q, i7-8750H, Toshiba NVMe THNSN5512GPU7 | Asus GL504GS GeForce GTX 1070 Mobile, i7-8750H, Samsung SSD PM981 MZVLB512HAJQ | MSI GS65 8RF-019DE Stealth Thin GeForce GTX 1070 Max-Q, i7-8750H, Samsung SSD PM981 MZVLB512HAJQ | MSI WS63 7RF-290US Quadro P3000, i7-7700HQ, Samsung SM961 MZVKW512HMJP m.2 PCI-e | |
|---|---|---|---|---|---|---|---|
| Heat | -5% | 7% | -6% | -17% | 3% | -2% | |
| Maximum Upper Side * (°C) | 46.6 | 42.4 9% | 45.4 3% | 53 -14% | 55 -18% | 49 -5% | 46.4 -0% |
| Maximum Bottom * (°C) | 56.6 | 50.8 10% | 53.4 6% | 65 -15% | 55 3% | 63 -11% | 62 -10% |
| Idle Upper Side * (°C) | 28.8 | 33 -15% | 26.3 9% | 26 10% | 36 -25% | 24 17% | 28.2 2% |
| Idle Bottom * (°C) | 28.5 | 35.2 -24% | 26.2 8% | 30 -5% | 36 -26% | 25 12% | 28.8 -1% |
* ... kleiner is beter
MSI P65 8RF-451 - Creator audioanalyse
(±) | luidspreker luidheid is gemiddeld maar goed (76.8 dB)
Bas 100 - 315 Hz
(-) | bijna geen lage tonen - gemiddeld 15.5% lager dan de mediaan
(+) | de lage tonen zijn lineair (3.6% delta naar de vorige frequentie)
Midden 400 - 2000 Hz
(±) | hogere middens - gemiddeld 7.3% hoger dan de mediaan
(±) | lineariteit van de middentonen is gemiddeld (7.3% delta ten opzichte van de vorige frequentie)
Hoog 2 - 16 kHz
(±) | higher highs - on average 7.1% higher than median
(+) | de hoge tonen zijn lineair (6.8% delta naar de vorige frequentie)
Algemeen 100 - 16.000 Hz
(±) | lineariteit van het totale geluid is gemiddeld (20.4% verschil met de mediaan)
Vergeleken met dezelfde klasse
» 69% van alle geteste apparaten in deze klasse waren beter, 8% vergelijkbaar, 23% slechter
» De beste had een delta van 5%, het gemiddelde was 17%, de slechtste was 45%
Vergeleken met alle geteste toestellen
» 54% van alle geteste apparaten waren beter, 8% gelijk, 38% slechter
» De beste had een delta van 4%, het gemiddelde was 23%, de slechtste was 134%
Asus ZenBook Pro 15 UX580GE audioanalyse
(±) | luidspreker luidheid is gemiddeld maar goed (79.9 dB)
Bas 100 - 315 Hz
(-) | bijna geen lage tonen - gemiddeld 22.3% lager dan de mediaan
(±) | lineariteit van de lage tonen is gemiddeld (11.5% delta ten opzichte van de vorige frequentie)
Midden 400 - 2000 Hz
(+) | evenwichtige middens - slechts 2.4% verwijderd van de mediaan
(±) | lineariteit van de middentonen is gemiddeld (7.5% delta ten opzichte van de vorige frequentie)
Hoog 2 - 16 kHz
(+) | evenwichtige hoogtepunten - slechts 4% verwijderd van de mediaan
(+) | de hoge tonen zijn lineair (6.2% delta naar de vorige frequentie)
Algemeen 100 - 16.000 Hz
(±) | lineariteit van het totale geluid is gemiddeld (17.7% verschil met de mediaan)
Vergeleken met dezelfde klasse
» 51% van alle geteste apparaten in deze klasse waren beter, 7% vergelijkbaar, 42% slechter
» De beste had een delta van 5%, het gemiddelde was 17%, de slechtste was 45%
Vergeleken met alle geteste toestellen
» 35% van alle geteste apparaten waren beter, 8% gelijk, 57% slechter
» De beste had een delta van 4%, het gemiddelde was 23%, de slechtste was 134%
| Uit / Standby | |
| Inactief | |
| Belasting |
|
Key:
min: | |
| MSI P65 8RF-451 - Creator i7-8750H, GeForce GTX 1070 Max-Q, Kingston RBUSNS8154P3512GJ, IPS, 1920x1080, 15.6" | Asus ZenBook Pro 15 UX580GE i9-8950HK, GeForce GTX 1050 Ti Mobile, Samsung SSD PM961 1TB M.2 PCIe 3.0 x4 NVMe (MZVLW1T0), IPS, 3840x2160, 15.6" | Lenovo ThinkPad X1 Extreme-20MF000XGE i7-8750H, GeForce GTX 1050 Ti Max-Q, Samsung SSD PM981 MZVLB1T0HALR, IPS, 3840x2160, 15.6" | Gigabyte Aero 15X v8 i7-8750H, GeForce GTX 1070 Max-Q, Toshiba NVMe THNSN5512GPU7, IPS, 1920x1080, 15.6" | Asus GL504GS i7-8750H, GeForce GTX 1070 Mobile, Samsung SSD PM981 MZVLB512HAJQ, IPS, 1920x1080, 15.6" | MSI GS65 8RF-019DE Stealth Thin i7-8750H, GeForce GTX 1070 Max-Q, Samsung SSD PM981 MZVLB512HAJQ, IPS, 1920x1080, 15.6" | MSI WS63 7RF-290US i7-7700HQ, Quadro P3000, Samsung SM961 MZVKW512HMJP m.2 PCI-e, IPS, 1920x1080, 15.6" | Gemiddeld NVIDIA GeForce GTX 1070 Max-Q | Gemiddelde van klas Multimedia | |
|---|---|---|---|---|---|---|---|---|---|
| Power Consumption | -24% | 2% | -34% | -124% | -3% | -6% | -23% | 26% | |
| Idle Minimum * (Watt) | 7.4 | 11.7 -58% | 7.6 -3% | 14 -89% | 29 -292% | 7 5% | 11 -49% | 11.4 ? -54% | 5.66 ? 24% |
| Idle Average * (Watt) | 11.7 | 18.5 -58% | 14.8 -26% | 18 -54% | 32 -174% | 11 6% | 14.2 -21% | 15.7 ? -34% | 10.2 ? 13% |
| Idle Maximum * (Watt) | 16.8 | 22.8 -36% | 17.6 -5% | 22 -31% | 38 -126% | 20 -19% | 14.6 13% | 20.7 ? -23% | 12.5 ? 26% |
| Load Average * (Watt) | 94 | 97.5 -4% | 86 9% | 91 3% | 100 -6% | 98 -4% | 77.7 17% | 98.1 ? -4% | 65.2 ? 31% |
| Load Maximum * (Watt) | 177 | 111.1 37% | 118.9 33% | 173 2% | 217 -23% | 182 -3% | 161.7 9% | 173.8 ? 2% | 113.5 ? 36% |
| Witcher 3 ultra * (Watt) | 102.9 | 85 | 142 | 170 | 132 | 89.1 |
* ... kleiner is beter

| MSI P65 8RF-451 - Creator i7-8750H, GeForce GTX 1070 Max-Q, 82 Wh | Asus ZenBook Pro 15 UX580GE i9-8950HK, GeForce GTX 1050 Ti Mobile, 71 Wh | Lenovo ThinkPad X1 Extreme-20MF000XGE i7-8750H, GeForce GTX 1050 Ti Max-Q, 80 Wh | Gigabyte Aero 15X v8 i7-8750H, GeForce GTX 1070 Max-Q, 94.24 Wh | Asus GL504GS i7-8750H, GeForce GTX 1070 Mobile, 66 Wh | MSI GS65 8RF-019DE Stealth Thin i7-8750H, GeForce GTX 1070 Max-Q, 82 Wh | Gemiddelde van klas Multimedia | |
|---|---|---|---|---|---|---|---|
| Batterijduur | 23% | 23% | 55% | -50% | -1% | 128% | |
| Reader / Idle (h) | 7.5 | 14 87% | 11.5 53% | 12.7 69% | 2.9 -61% | 8.5 13% | 24.9 ? 232% |
| H.264 (h) | 5.9 | 6.2 5% | 8.4 42% | 2.5 -58% | 5.9 0% | 17.1 ? 190% | |
| WiFi v1.3 (h) | 7.1 | 6.3 -11% | 6.4 -10% | 8.6 21% | 2.4 -66% | 6 -15% | 12.2 ? 72% |
| Load (h) | 1.4 | 1.3 -7% | 2 43% | 2.6 86% | 1.2 -14% | 1.4 0% | 1.664 ? 19% |
| Witcher 3 ultra (h) | 1.1 |
Pro
Contra
Voor het volledige, Engelse testrapport, klik hier.
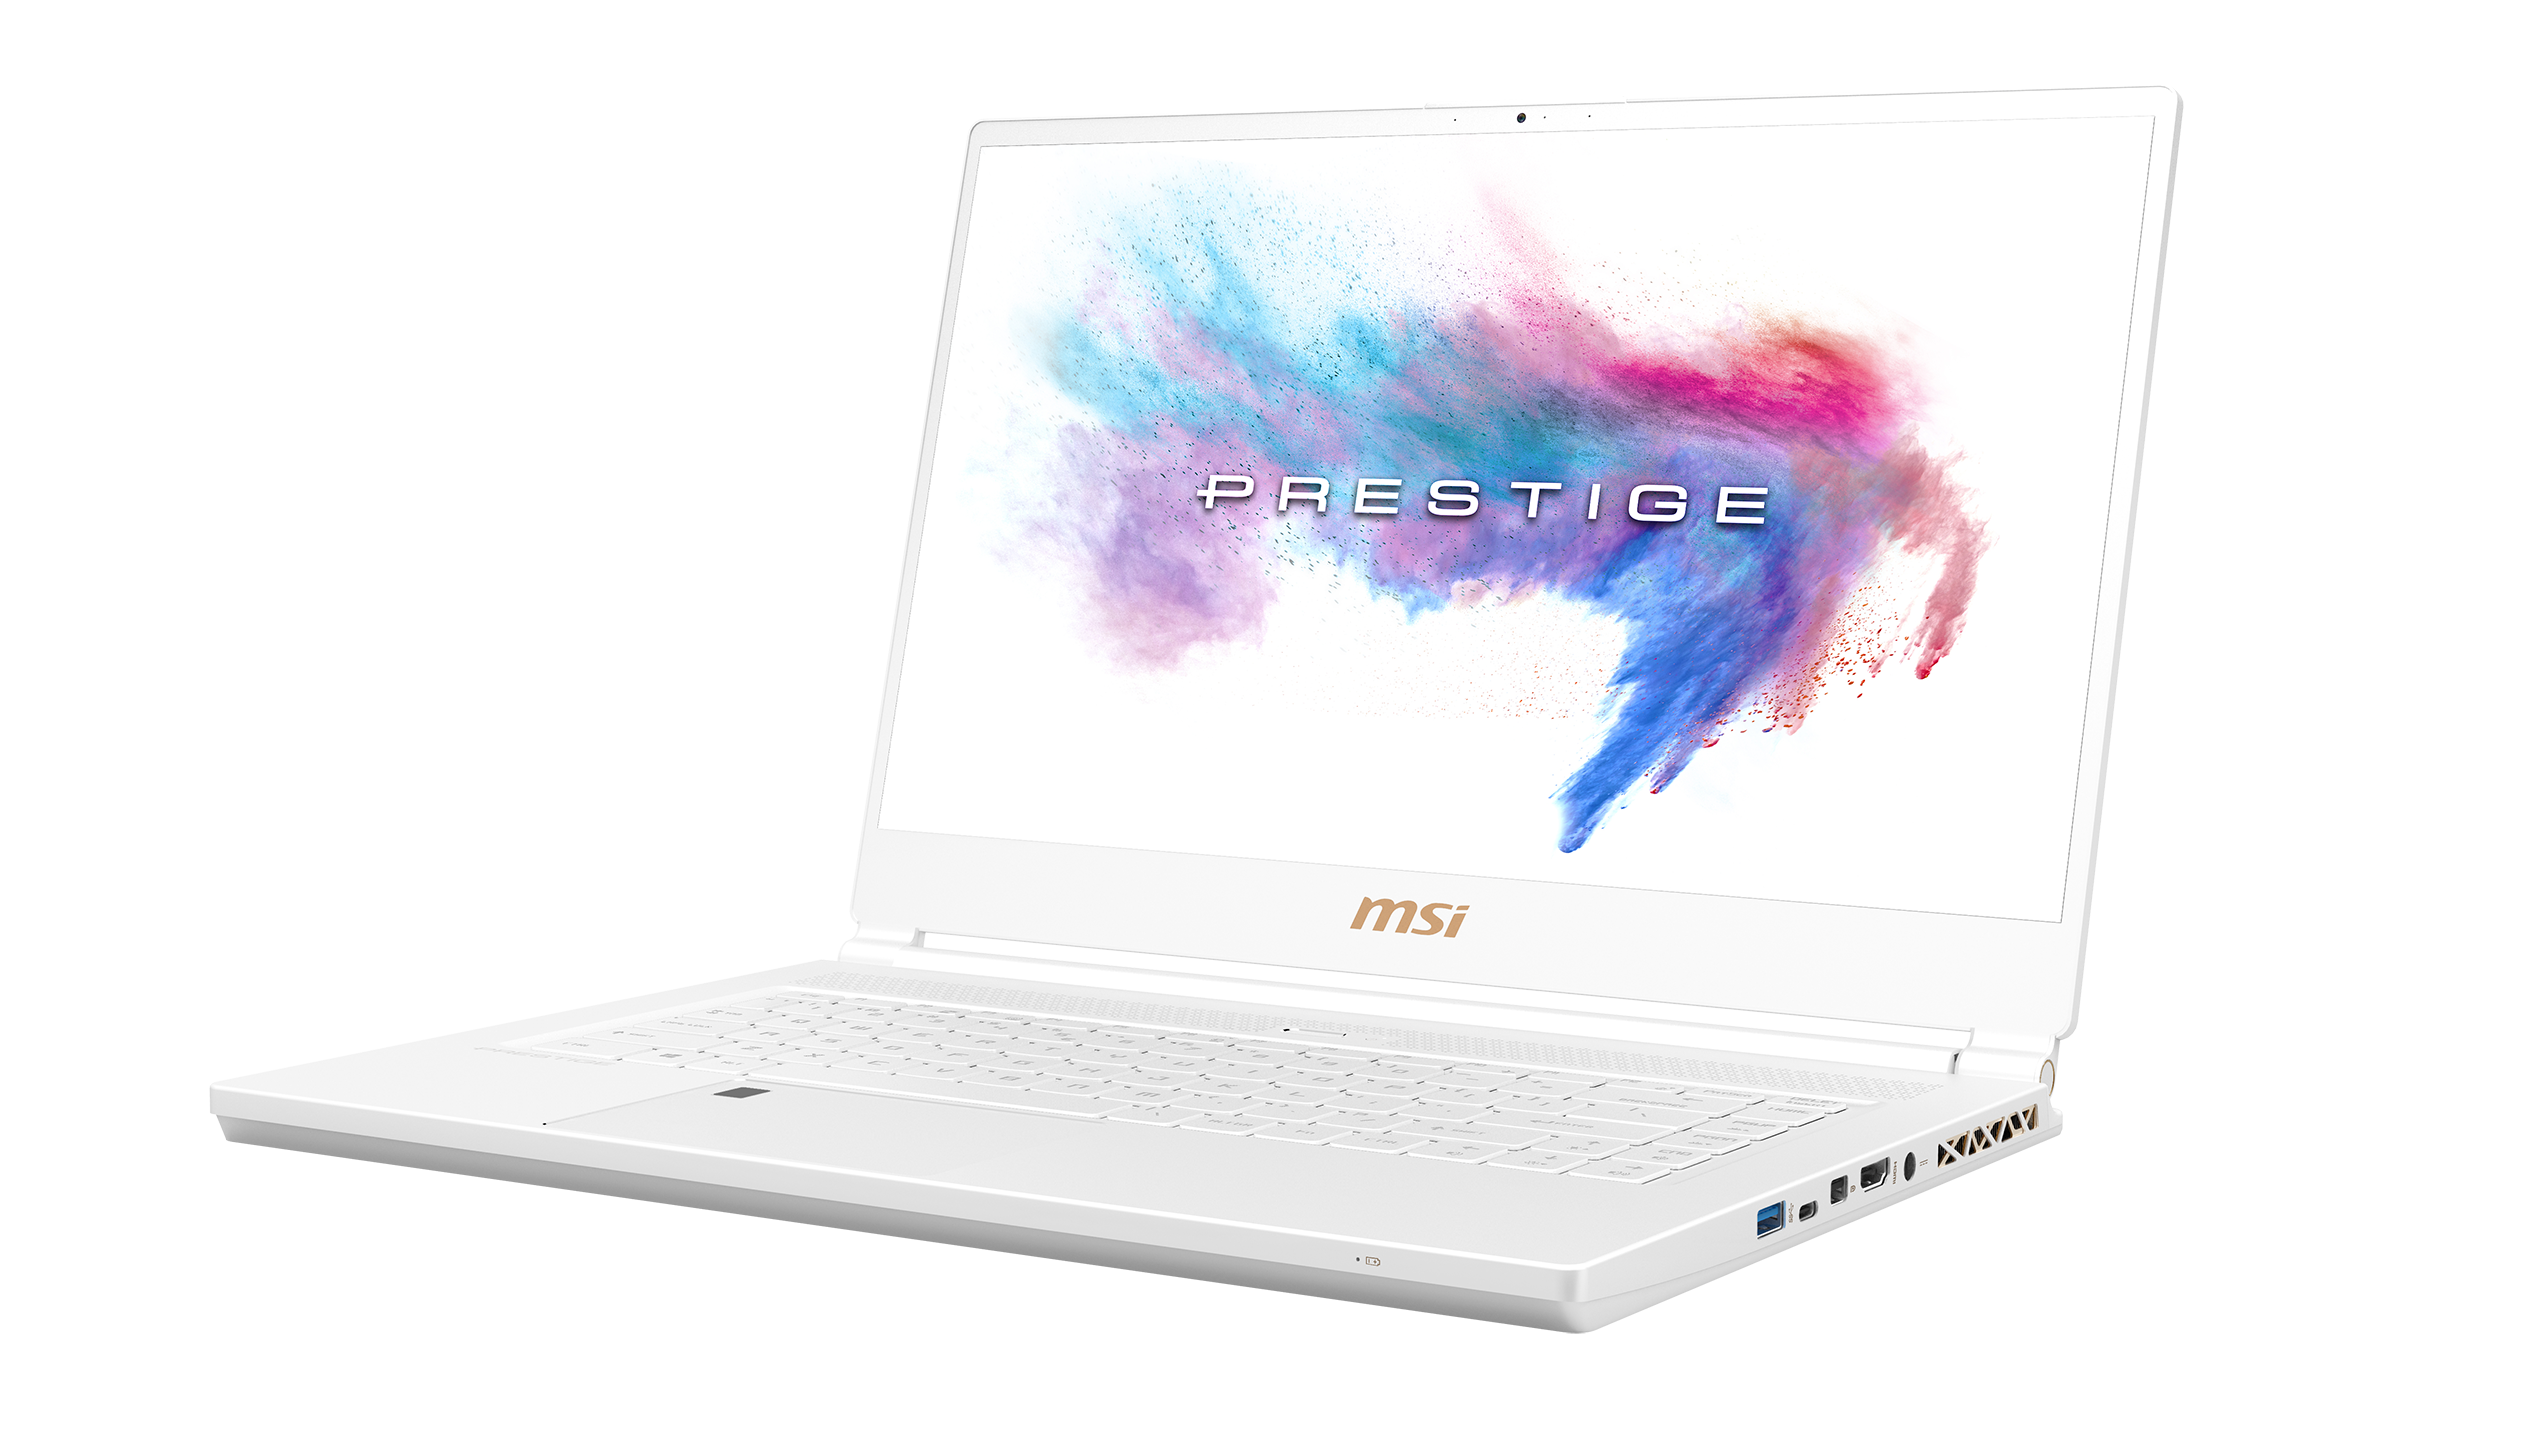
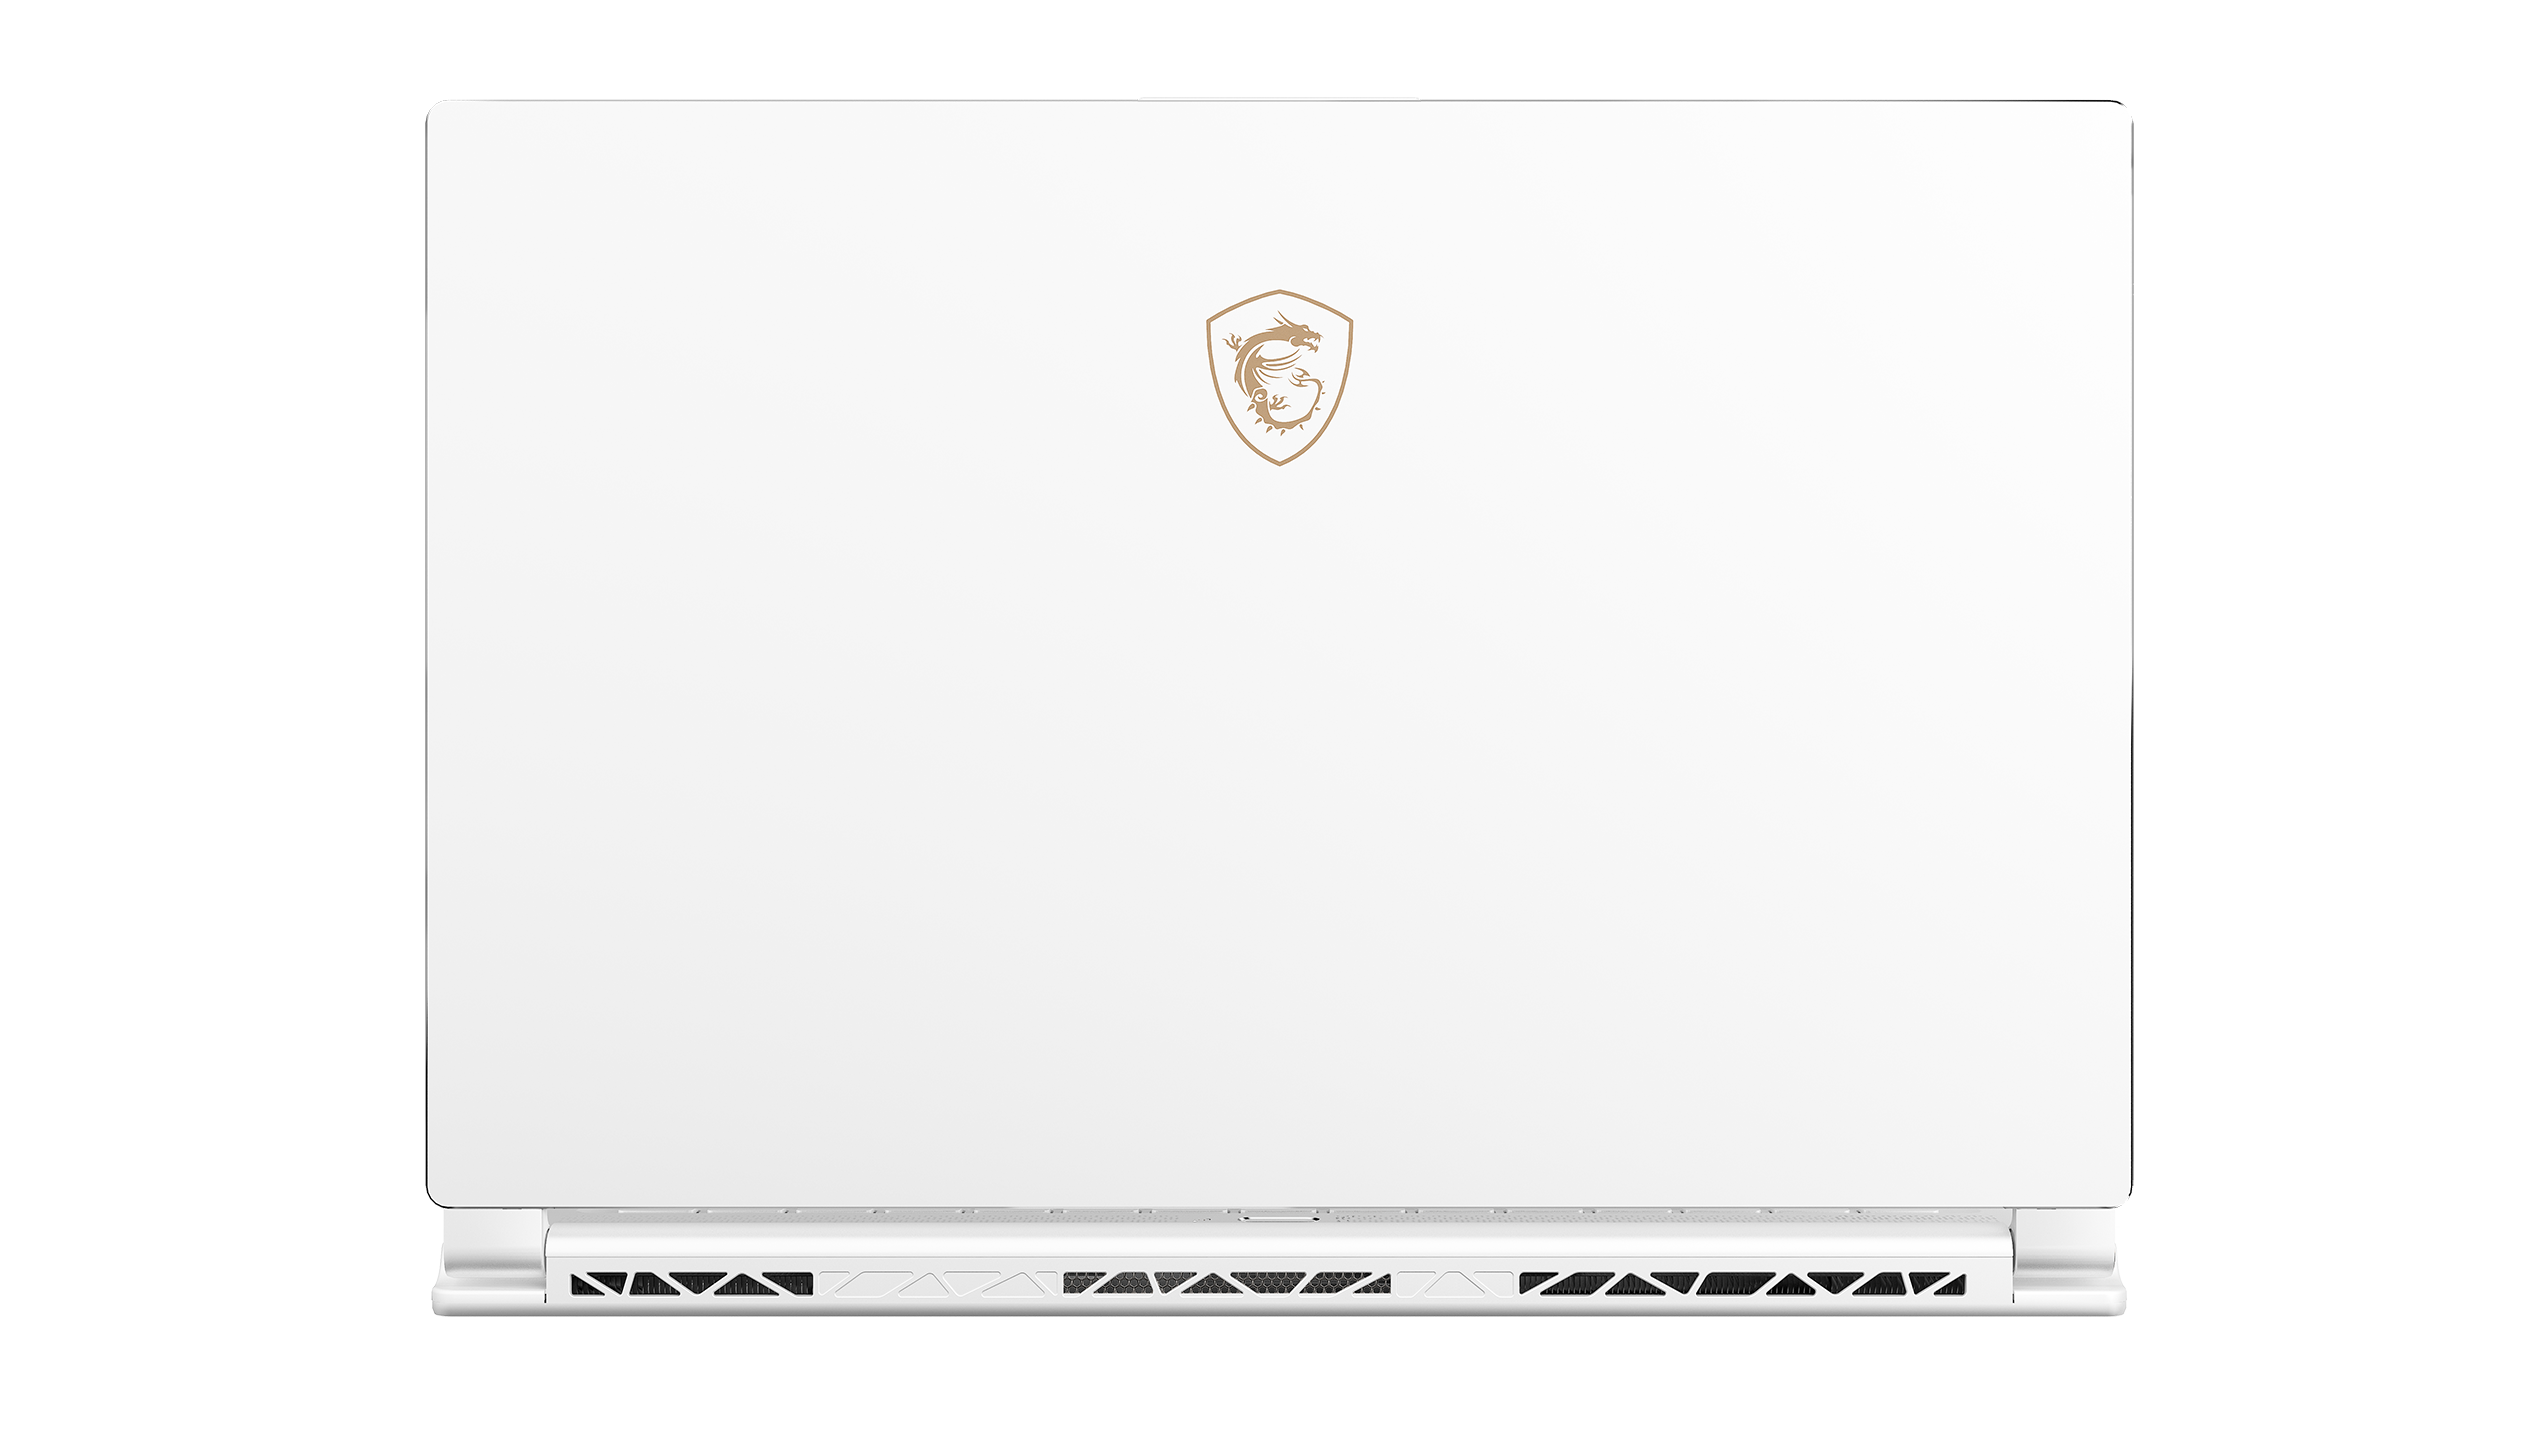
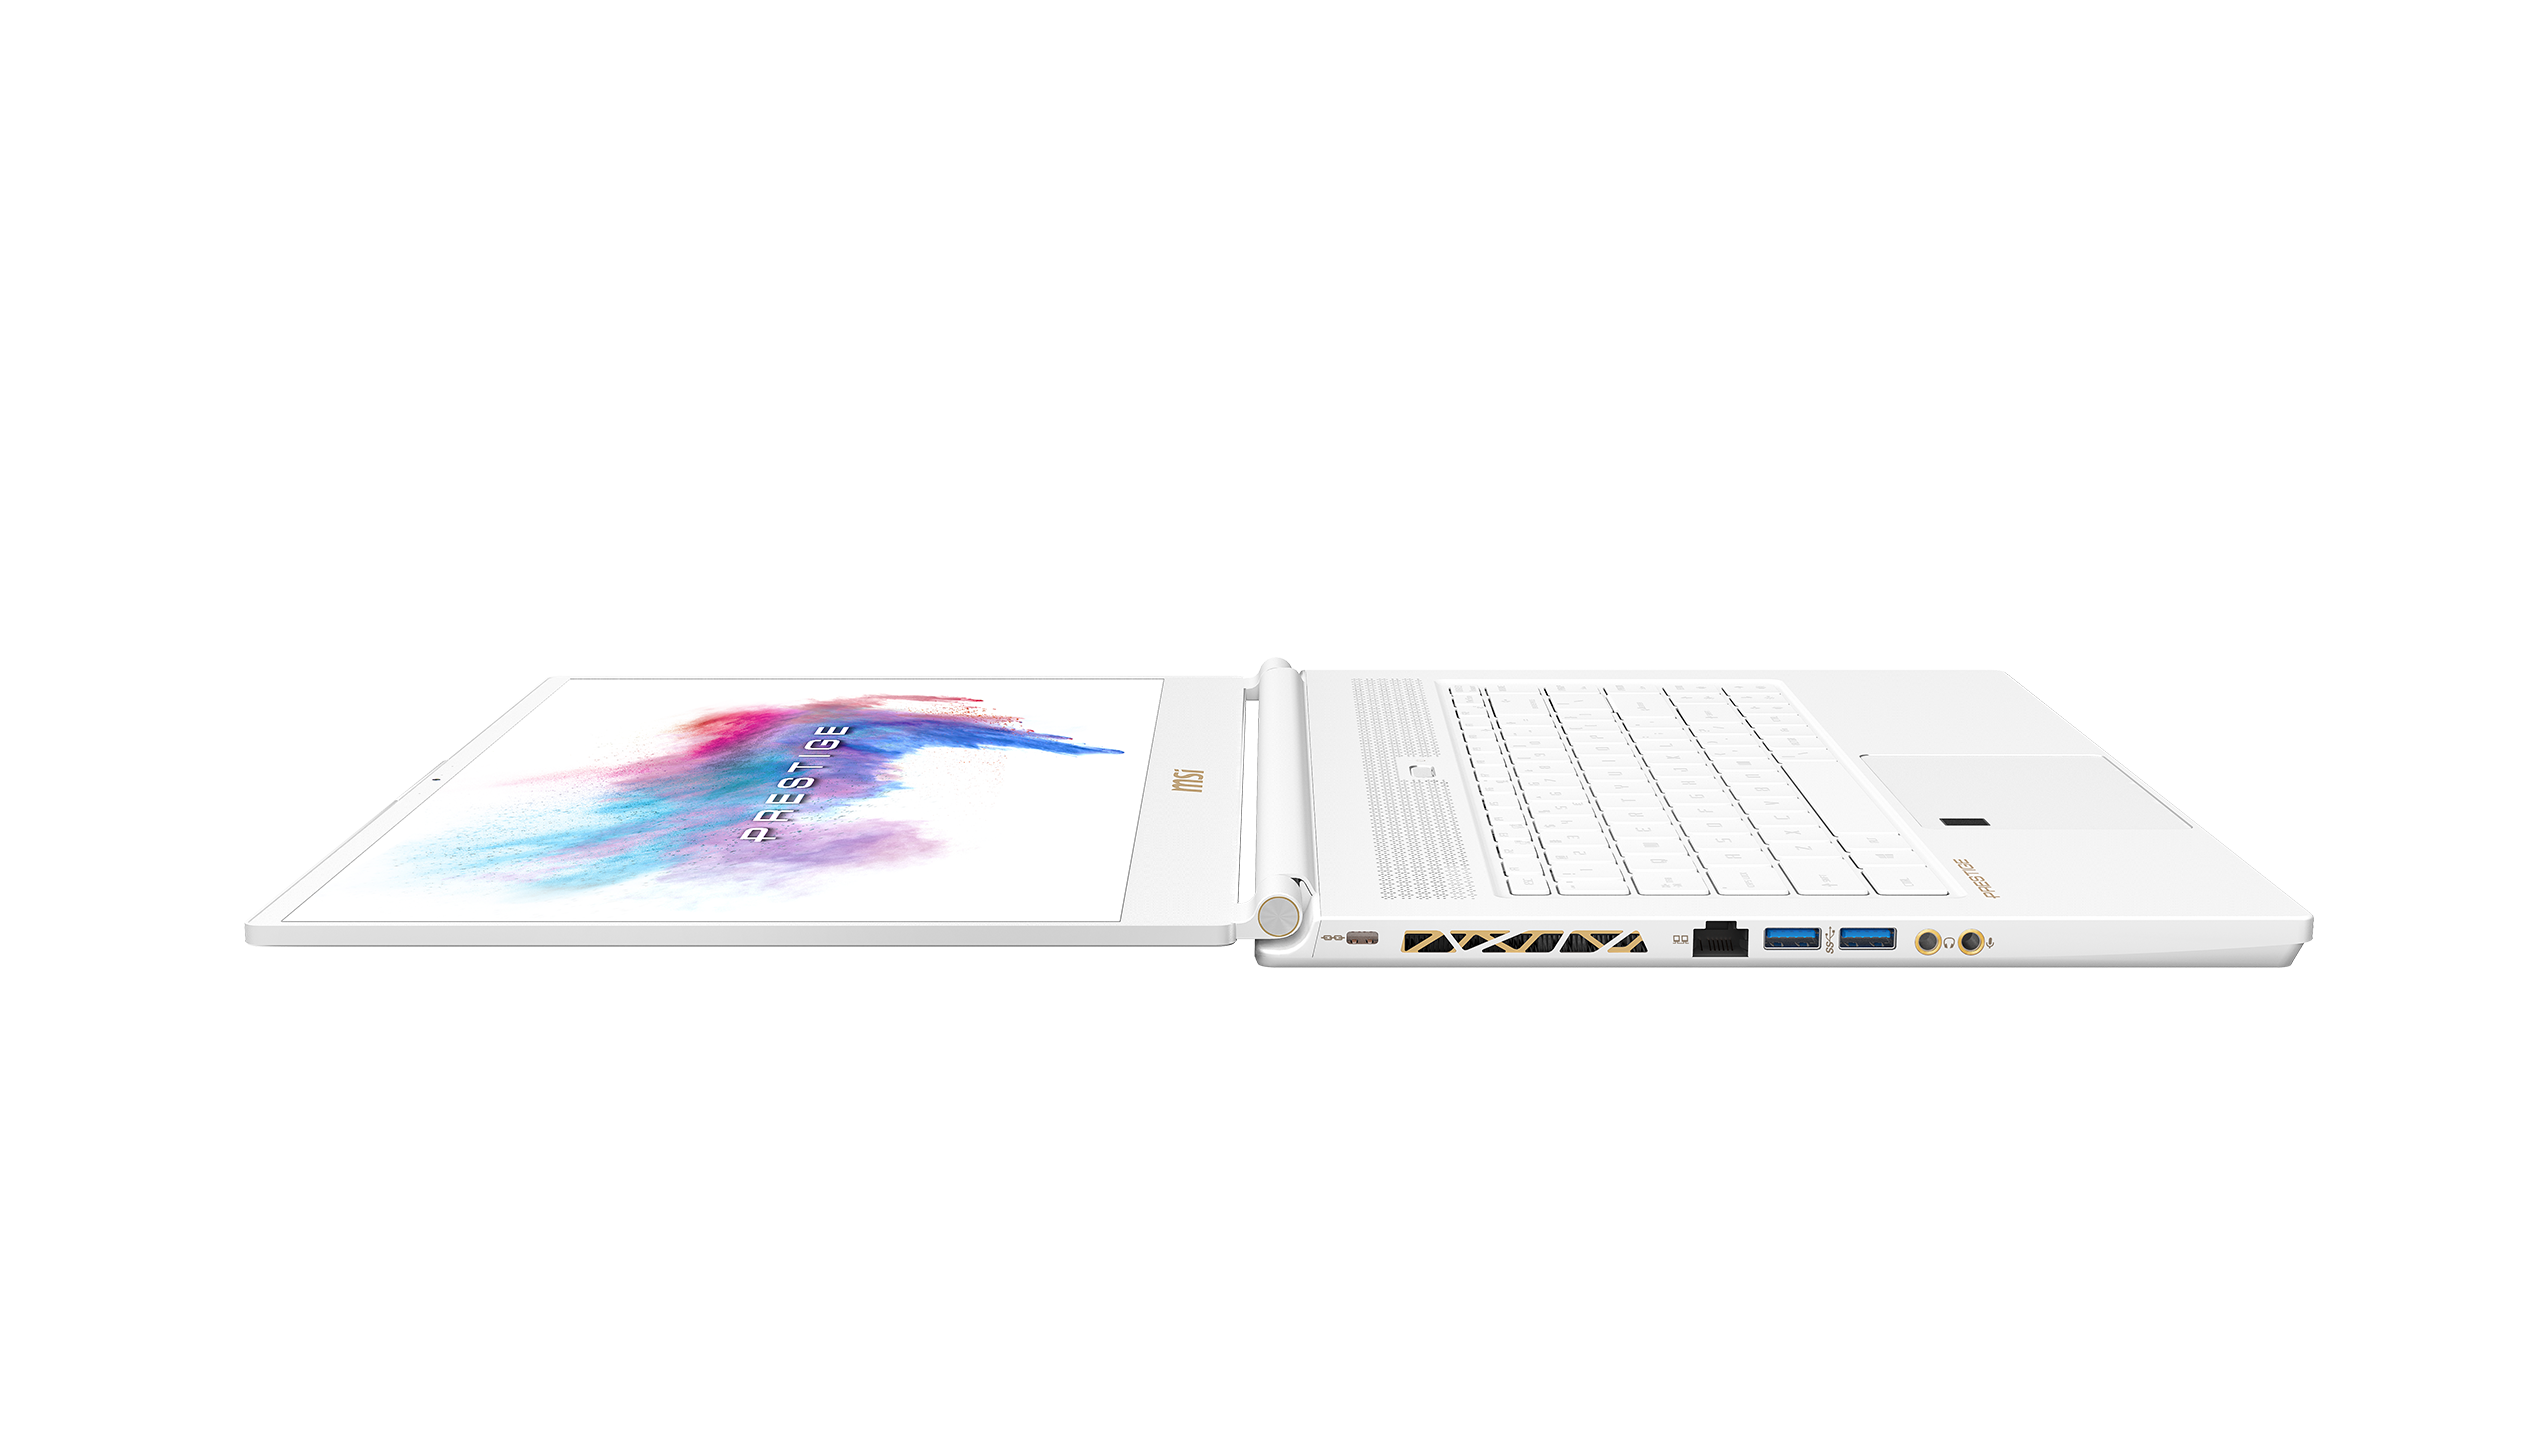
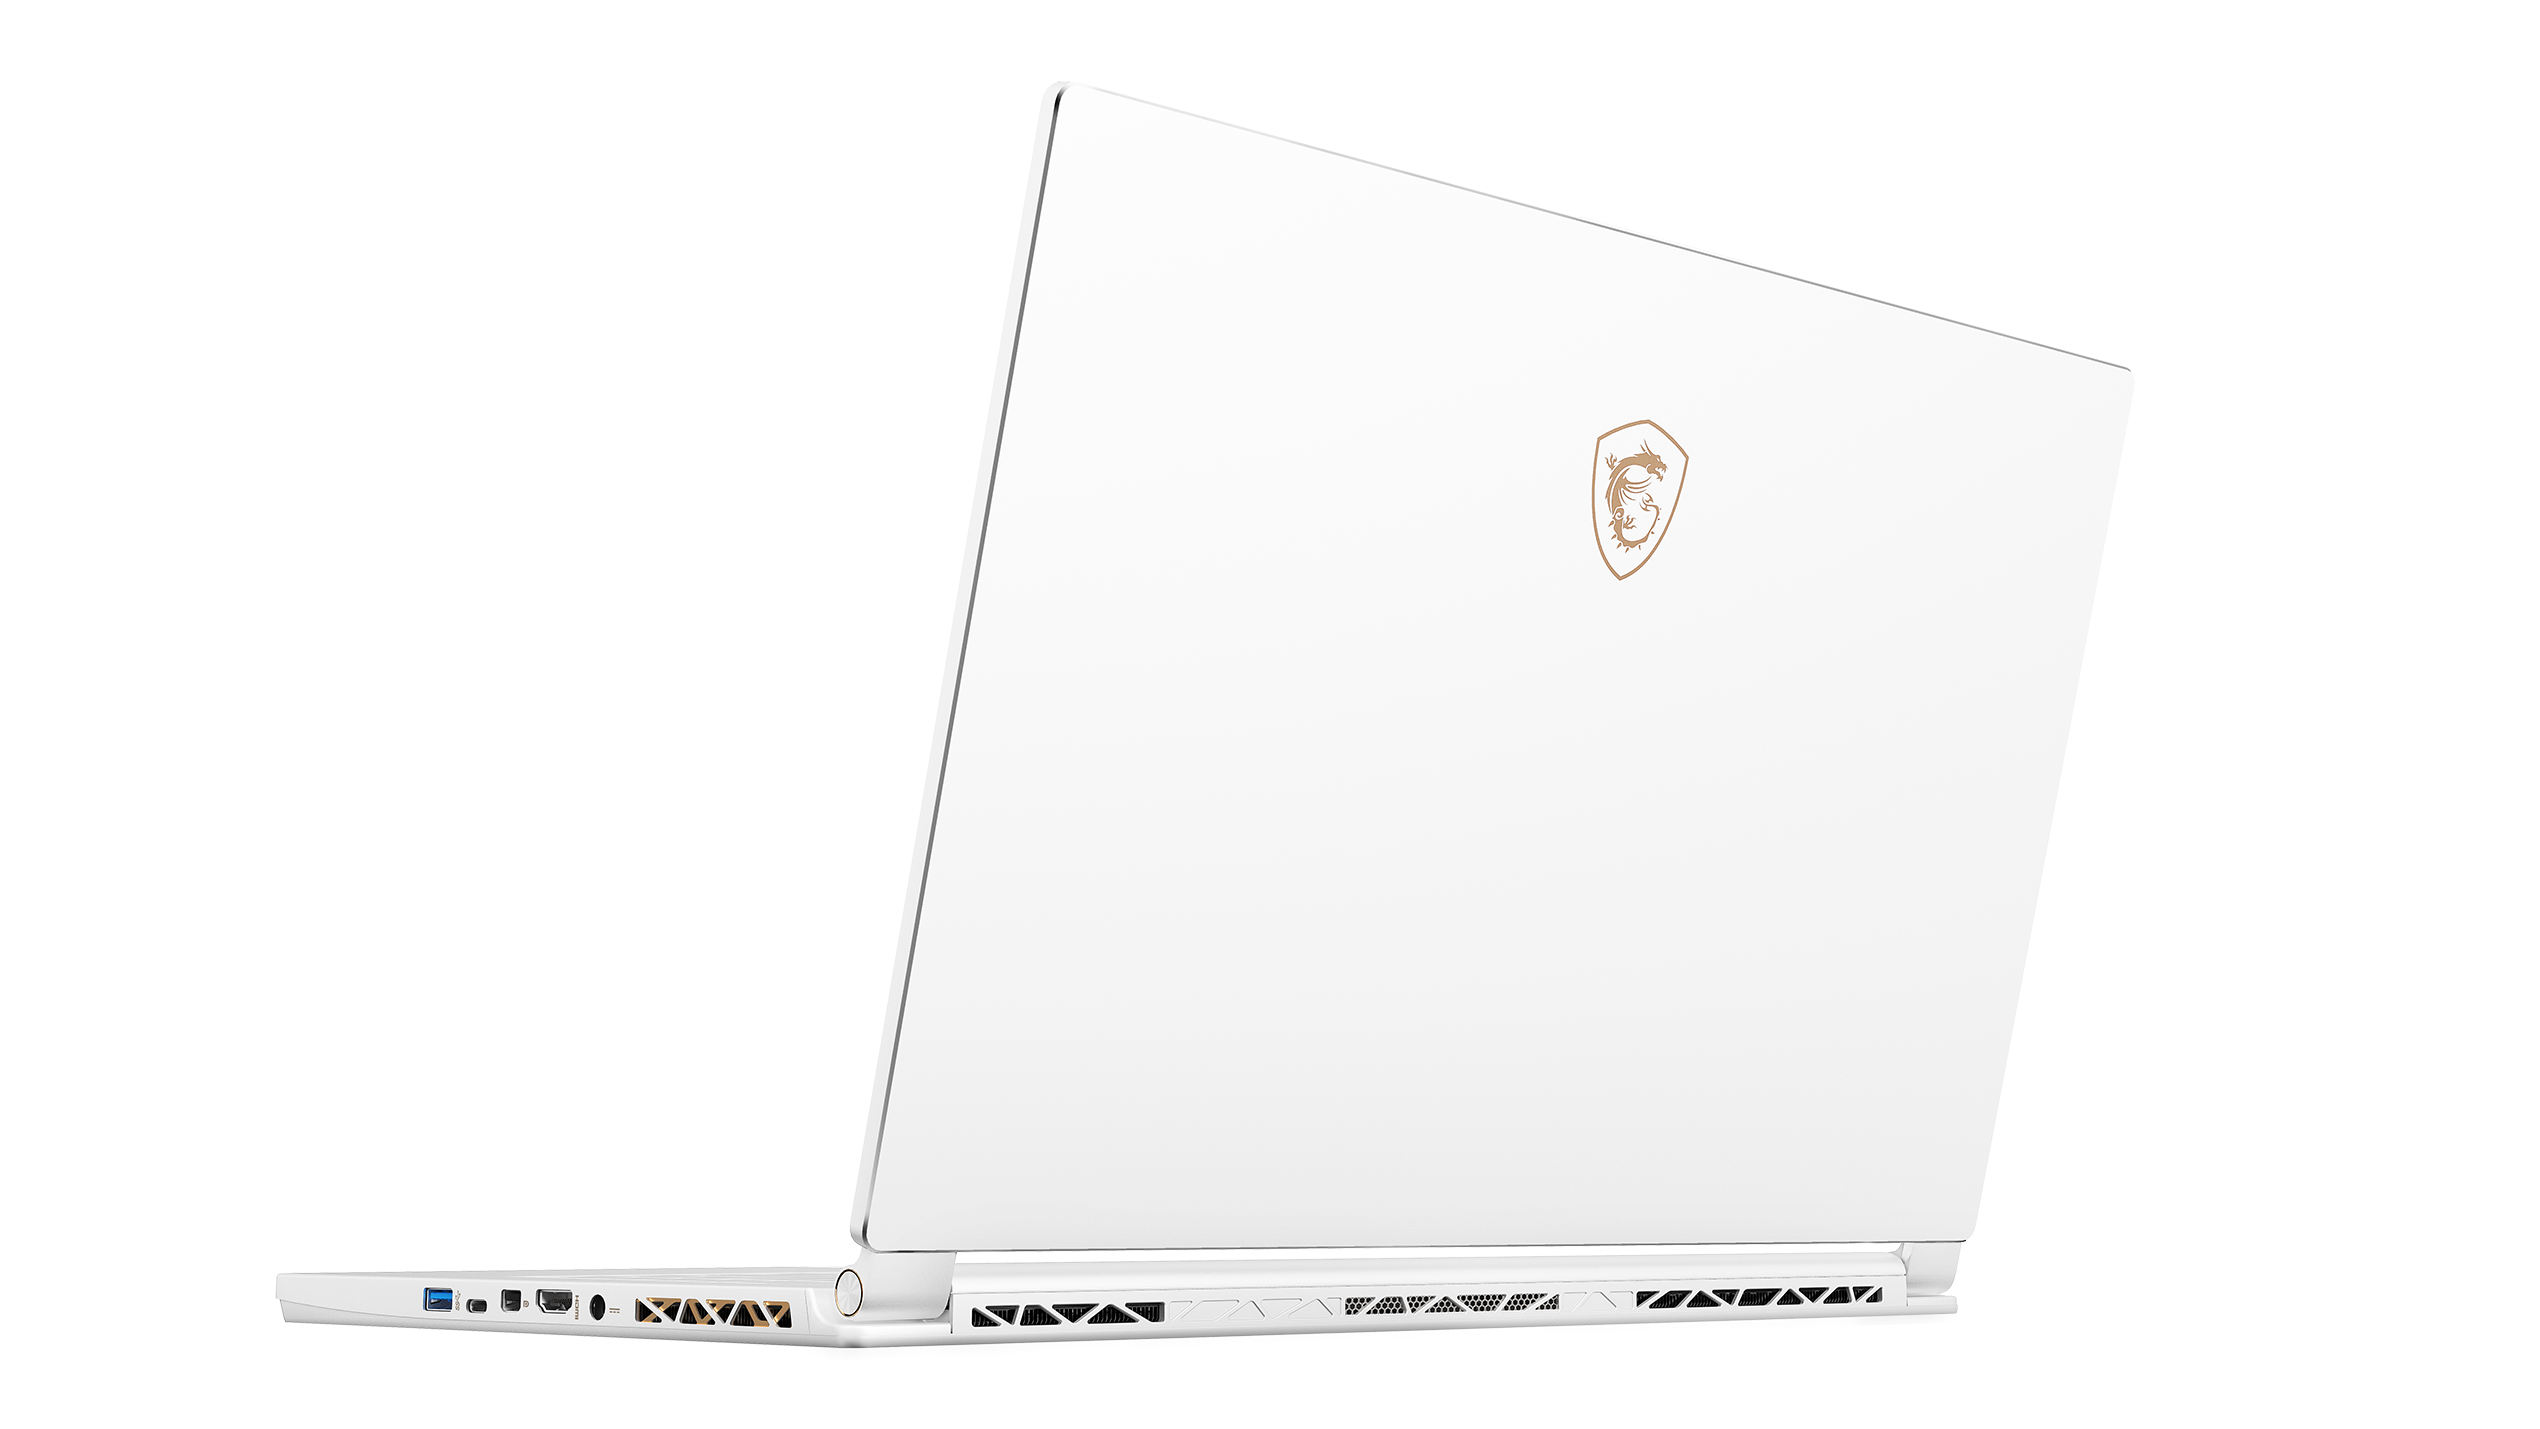
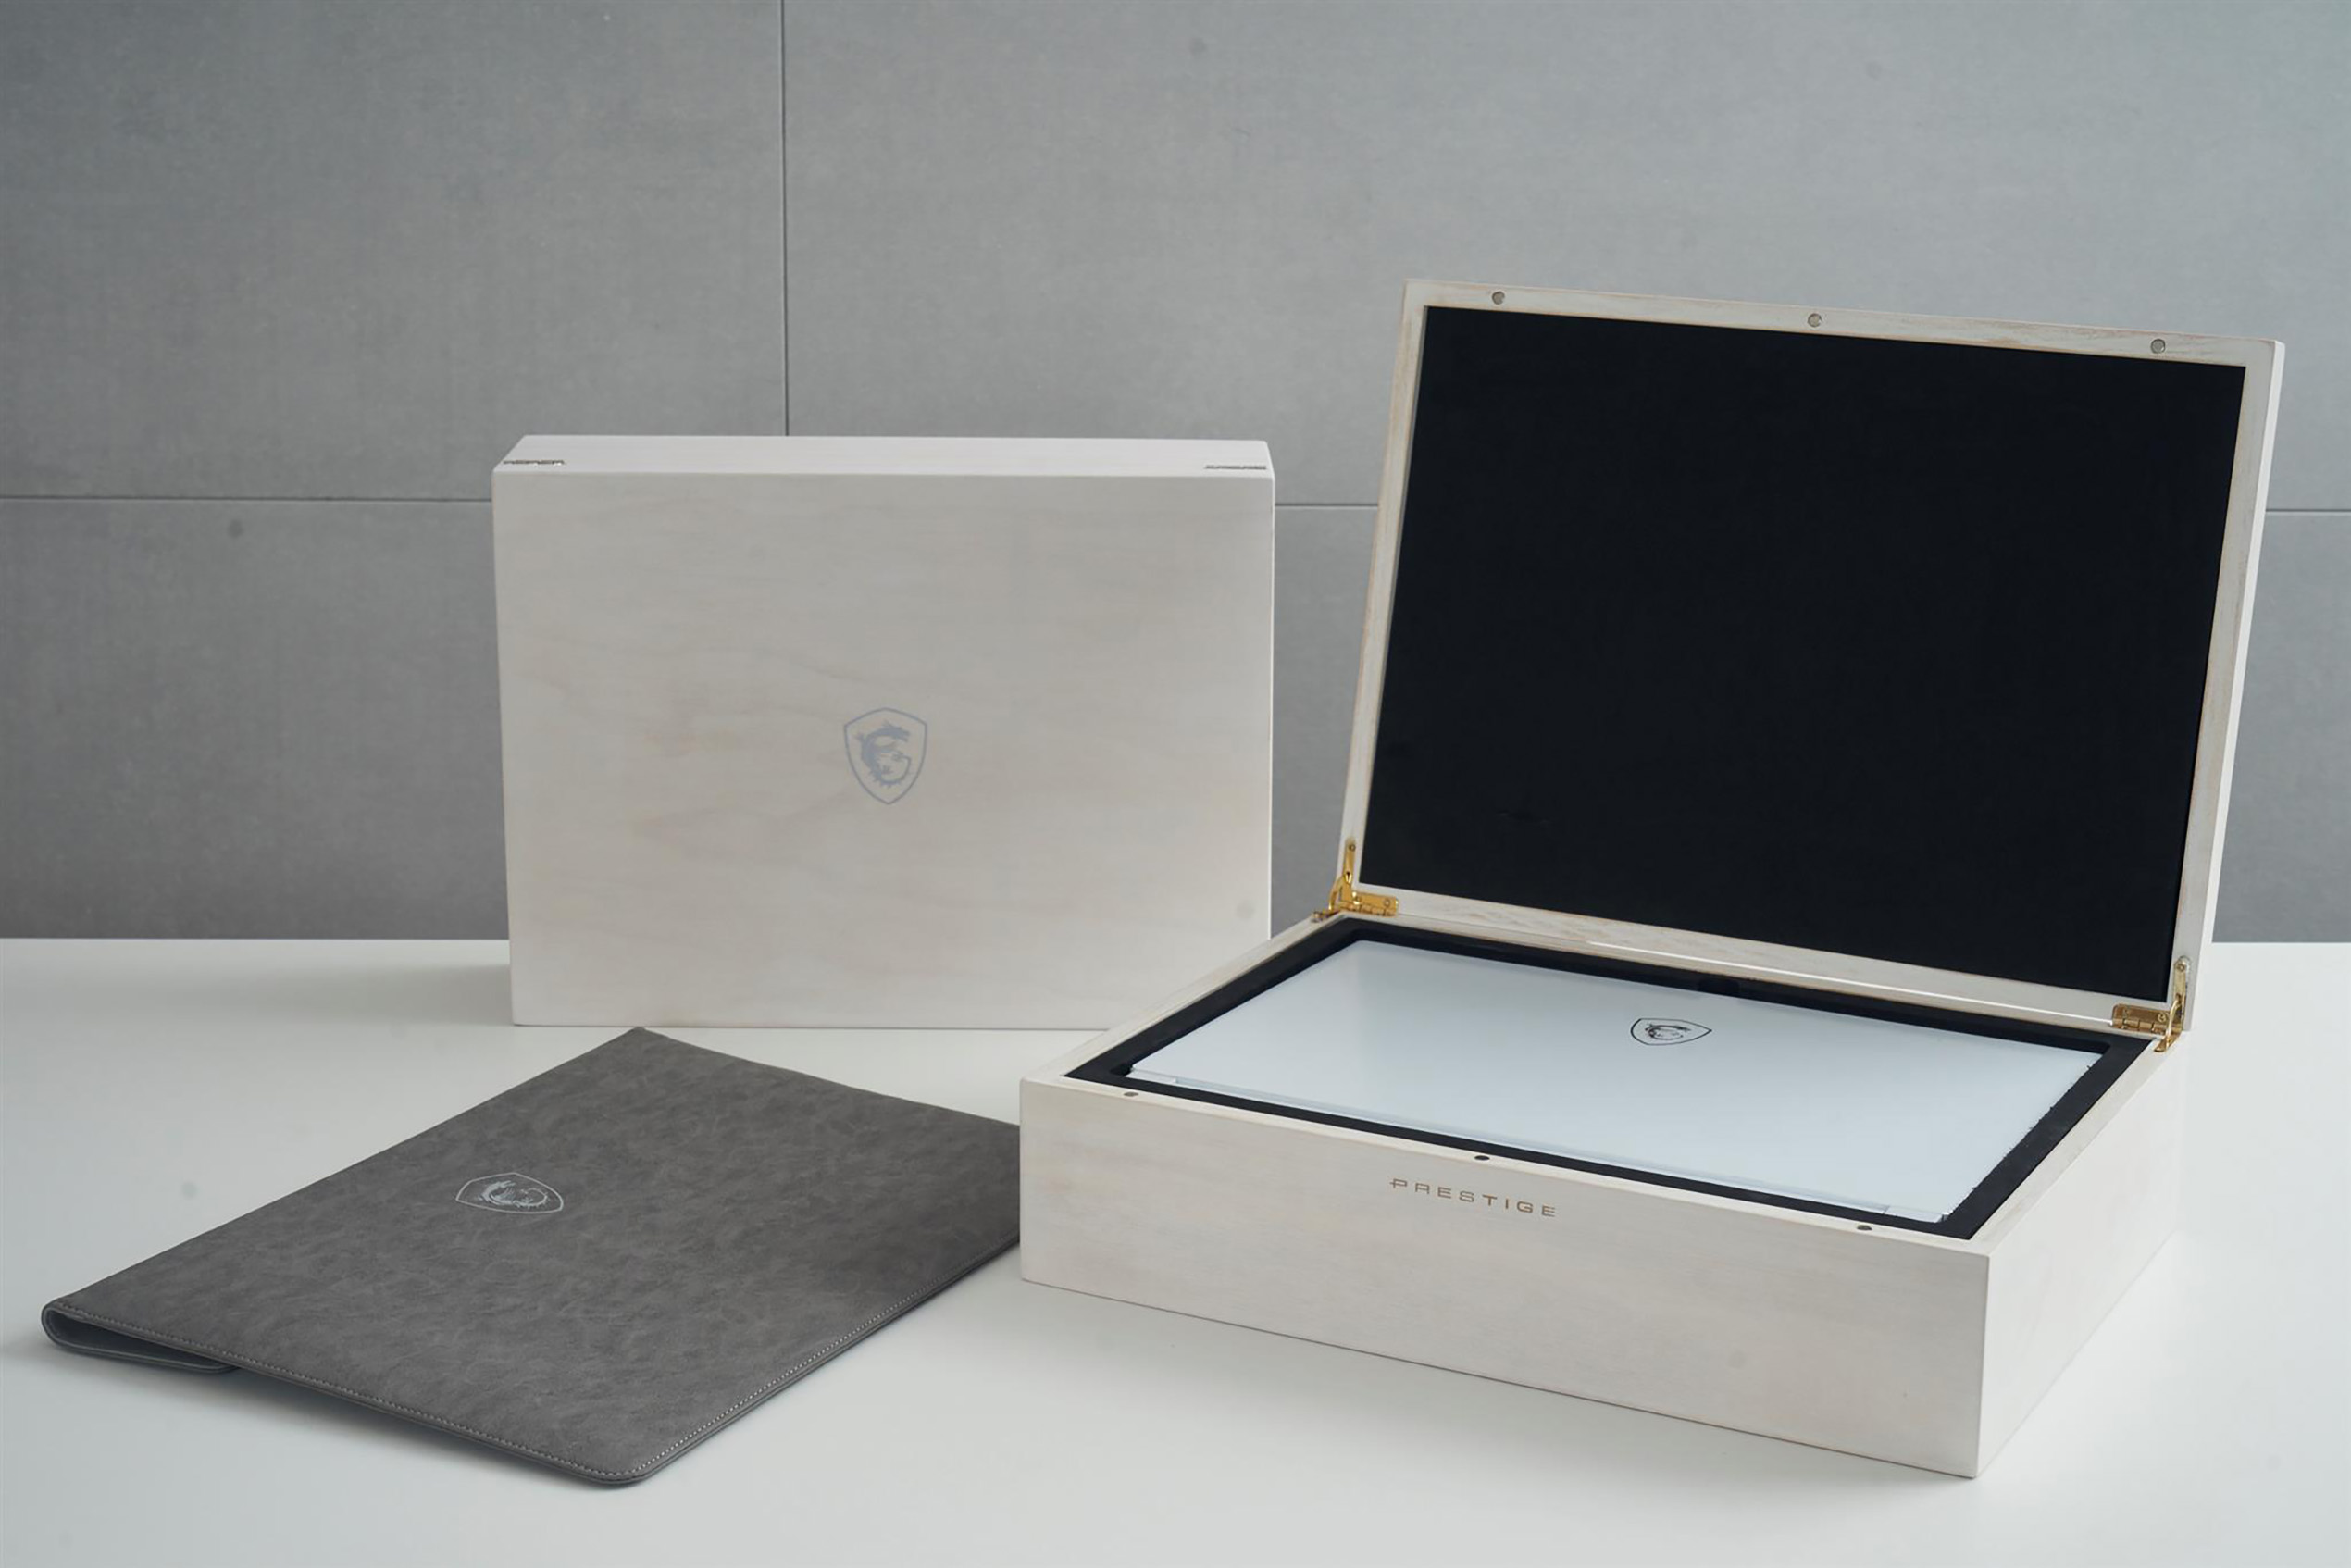
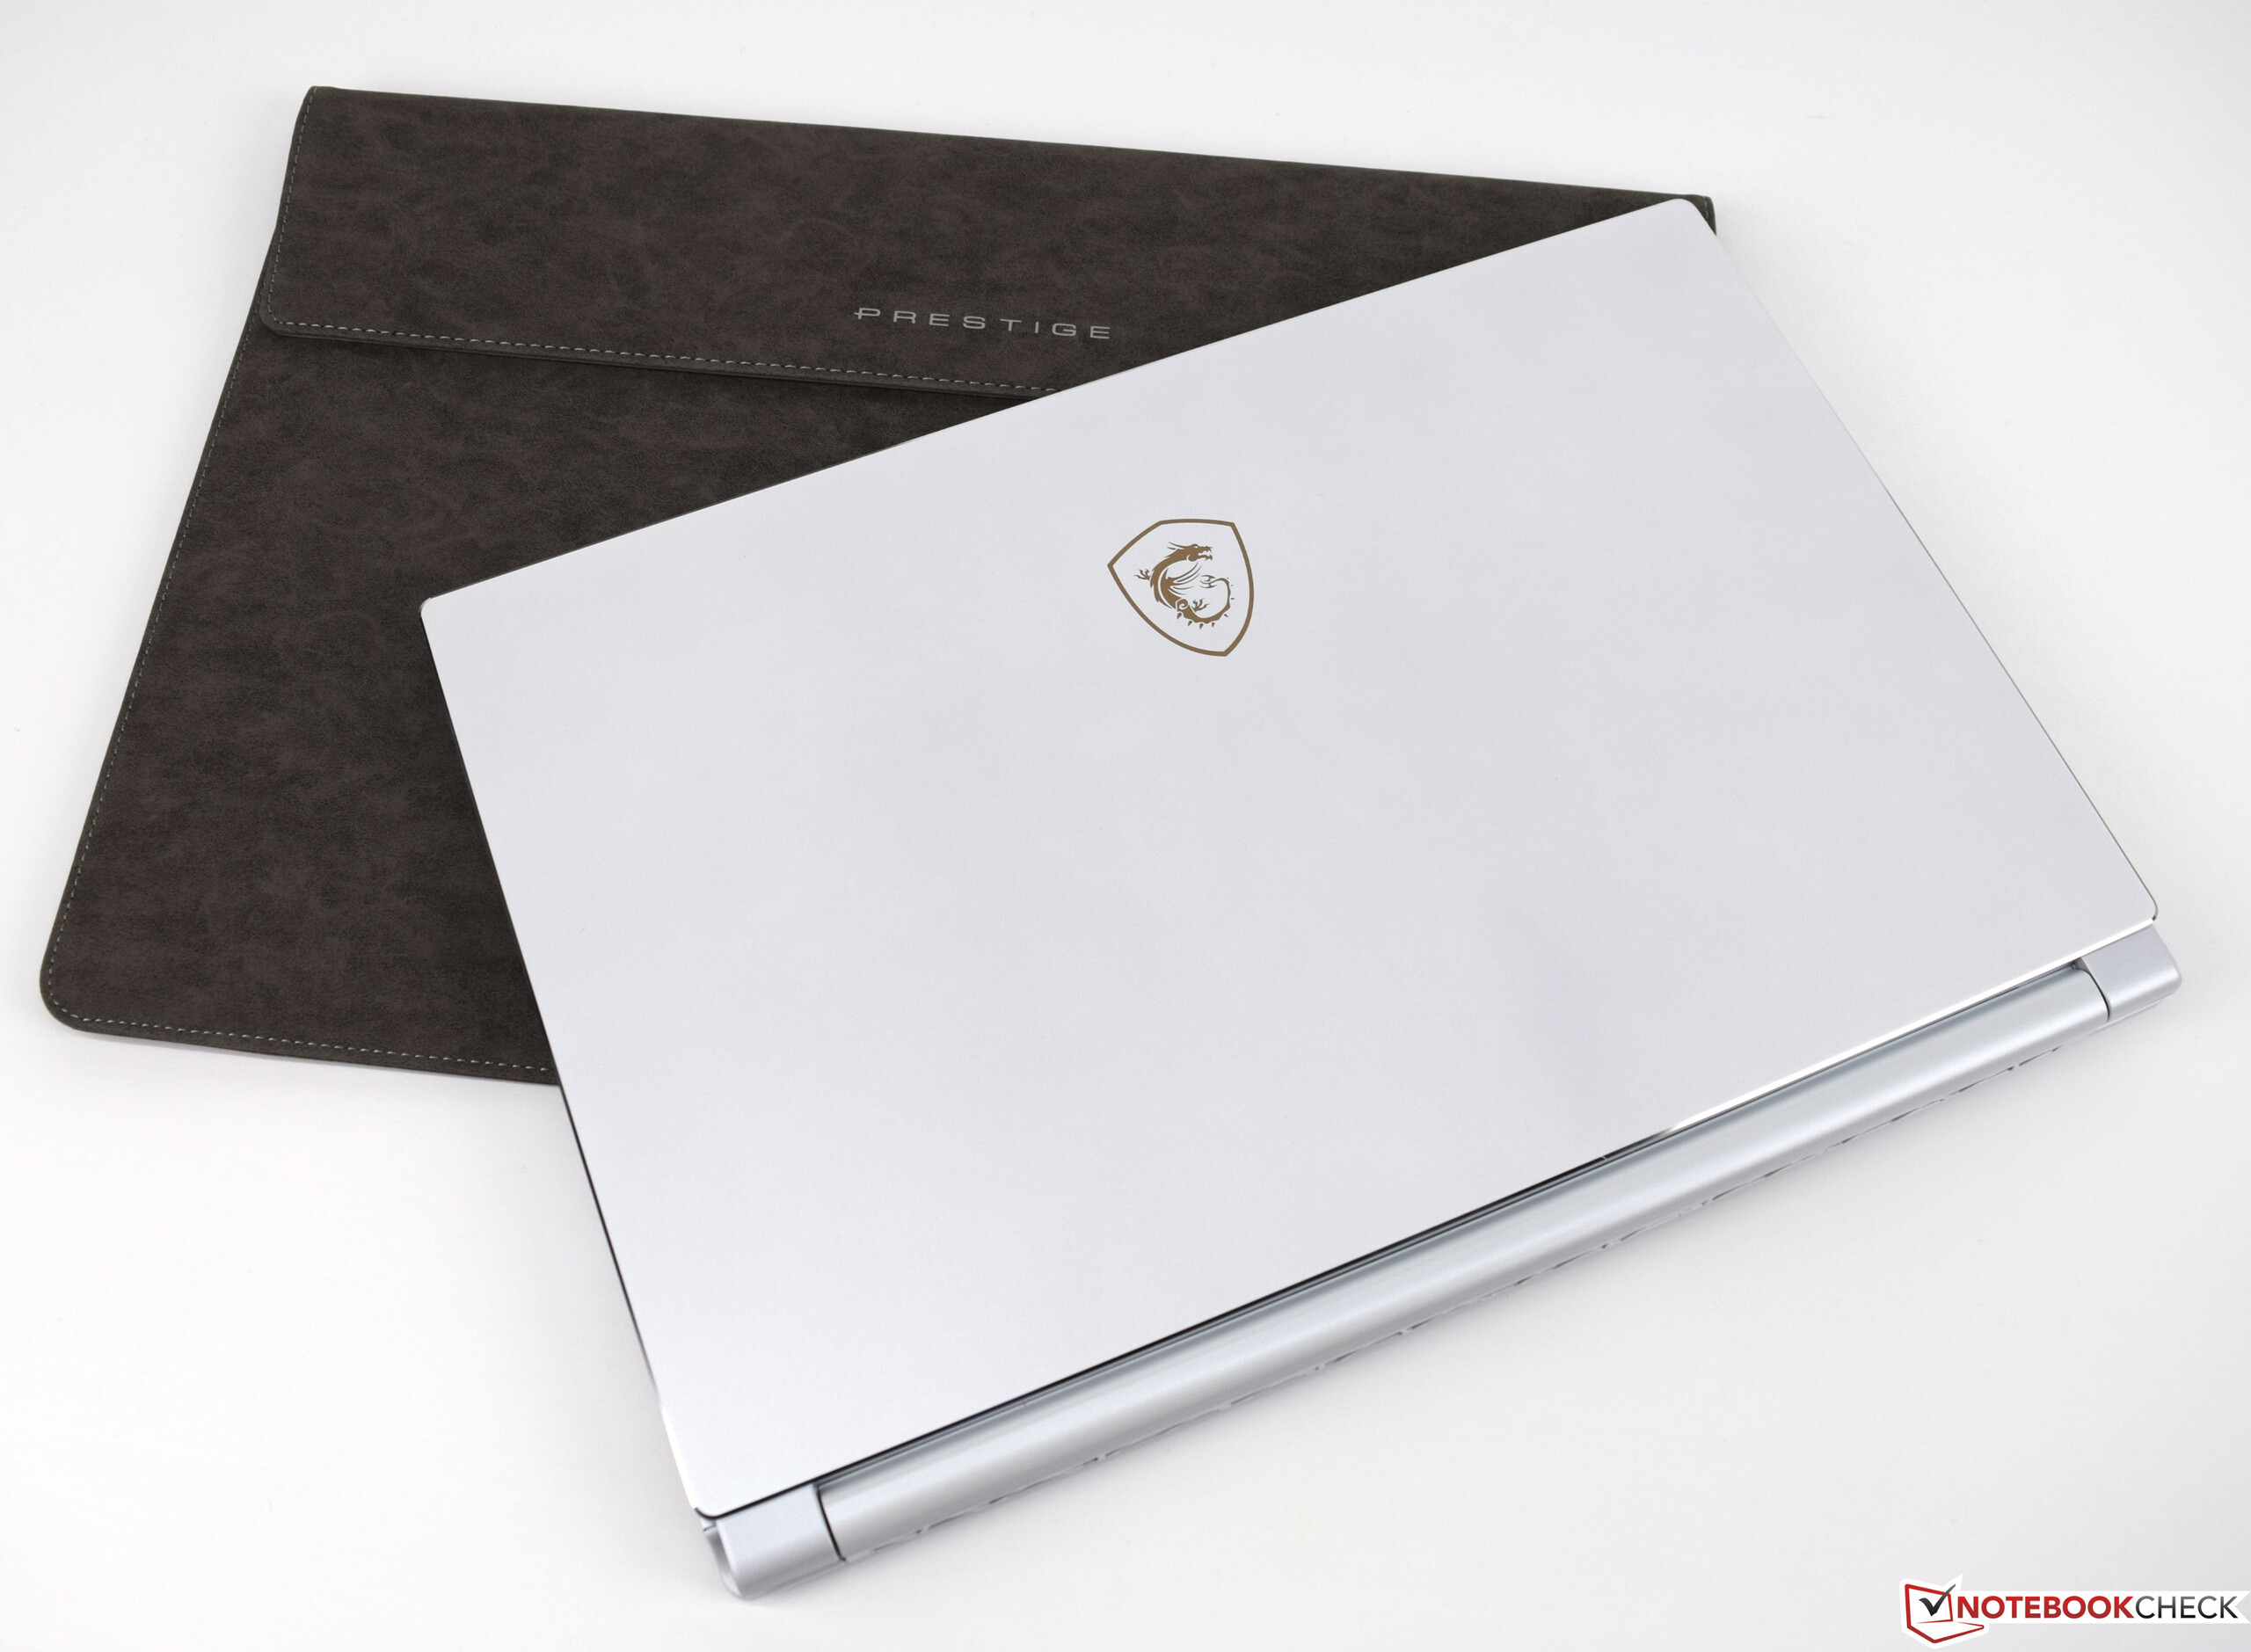
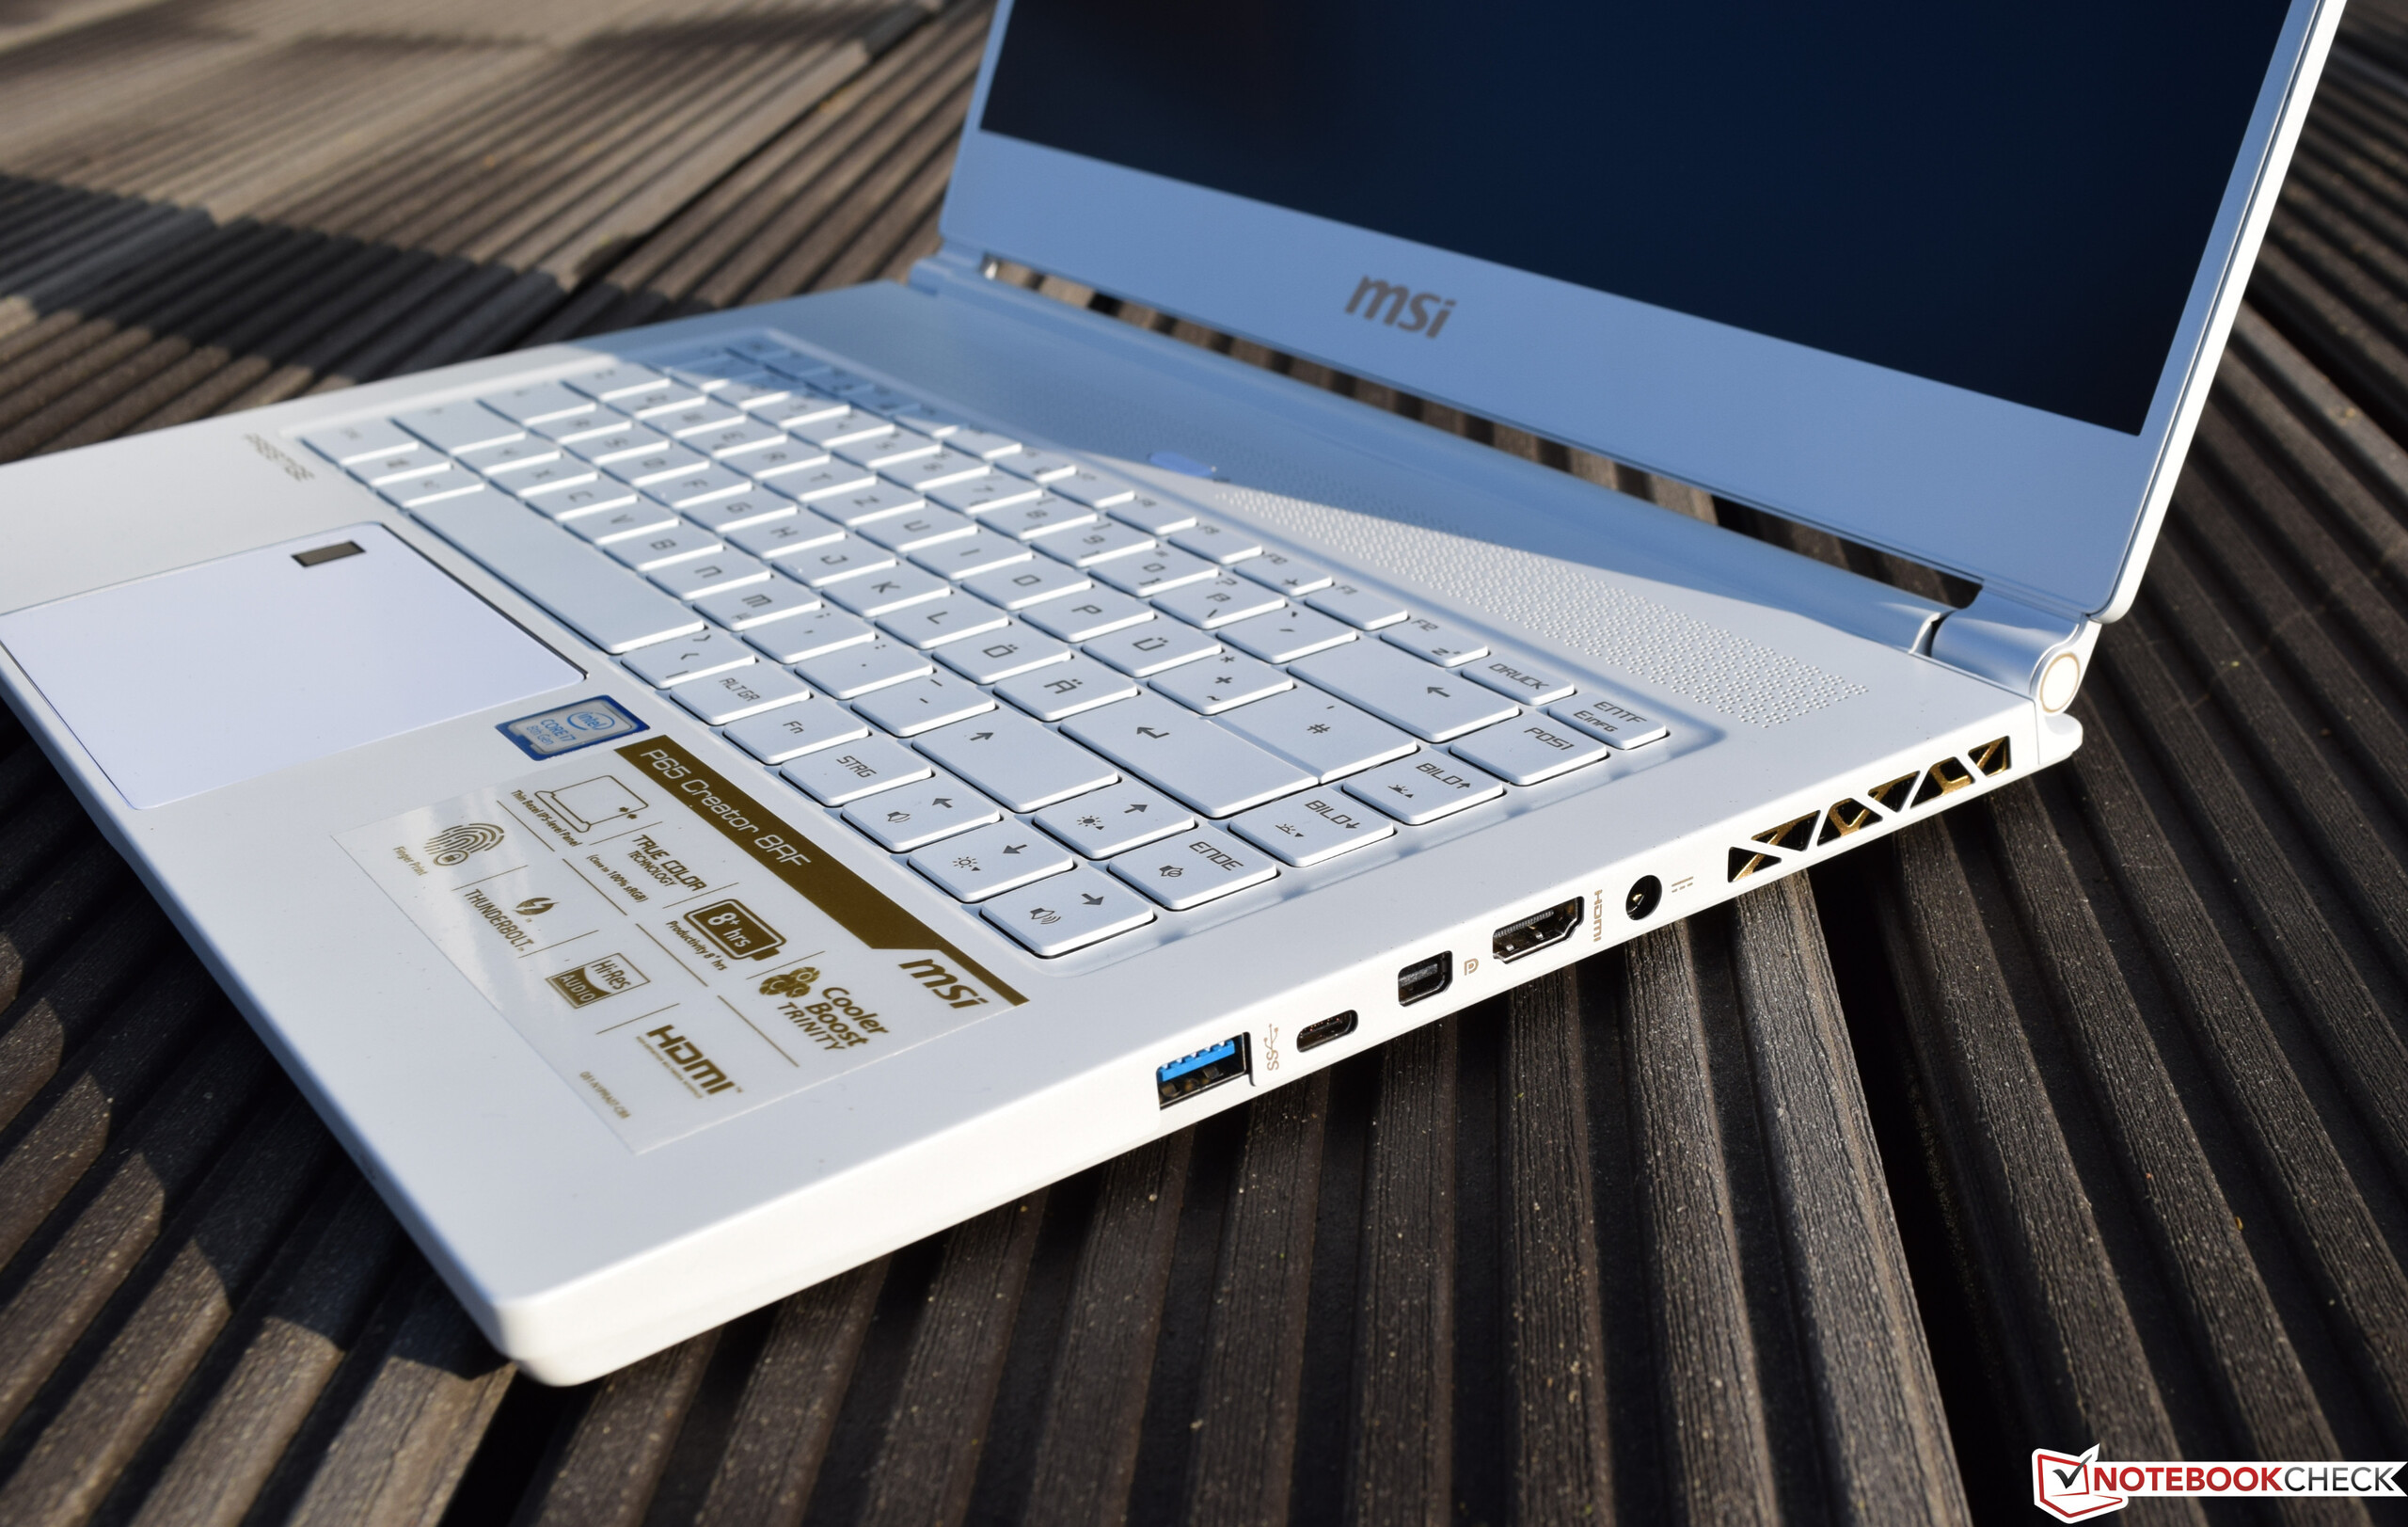
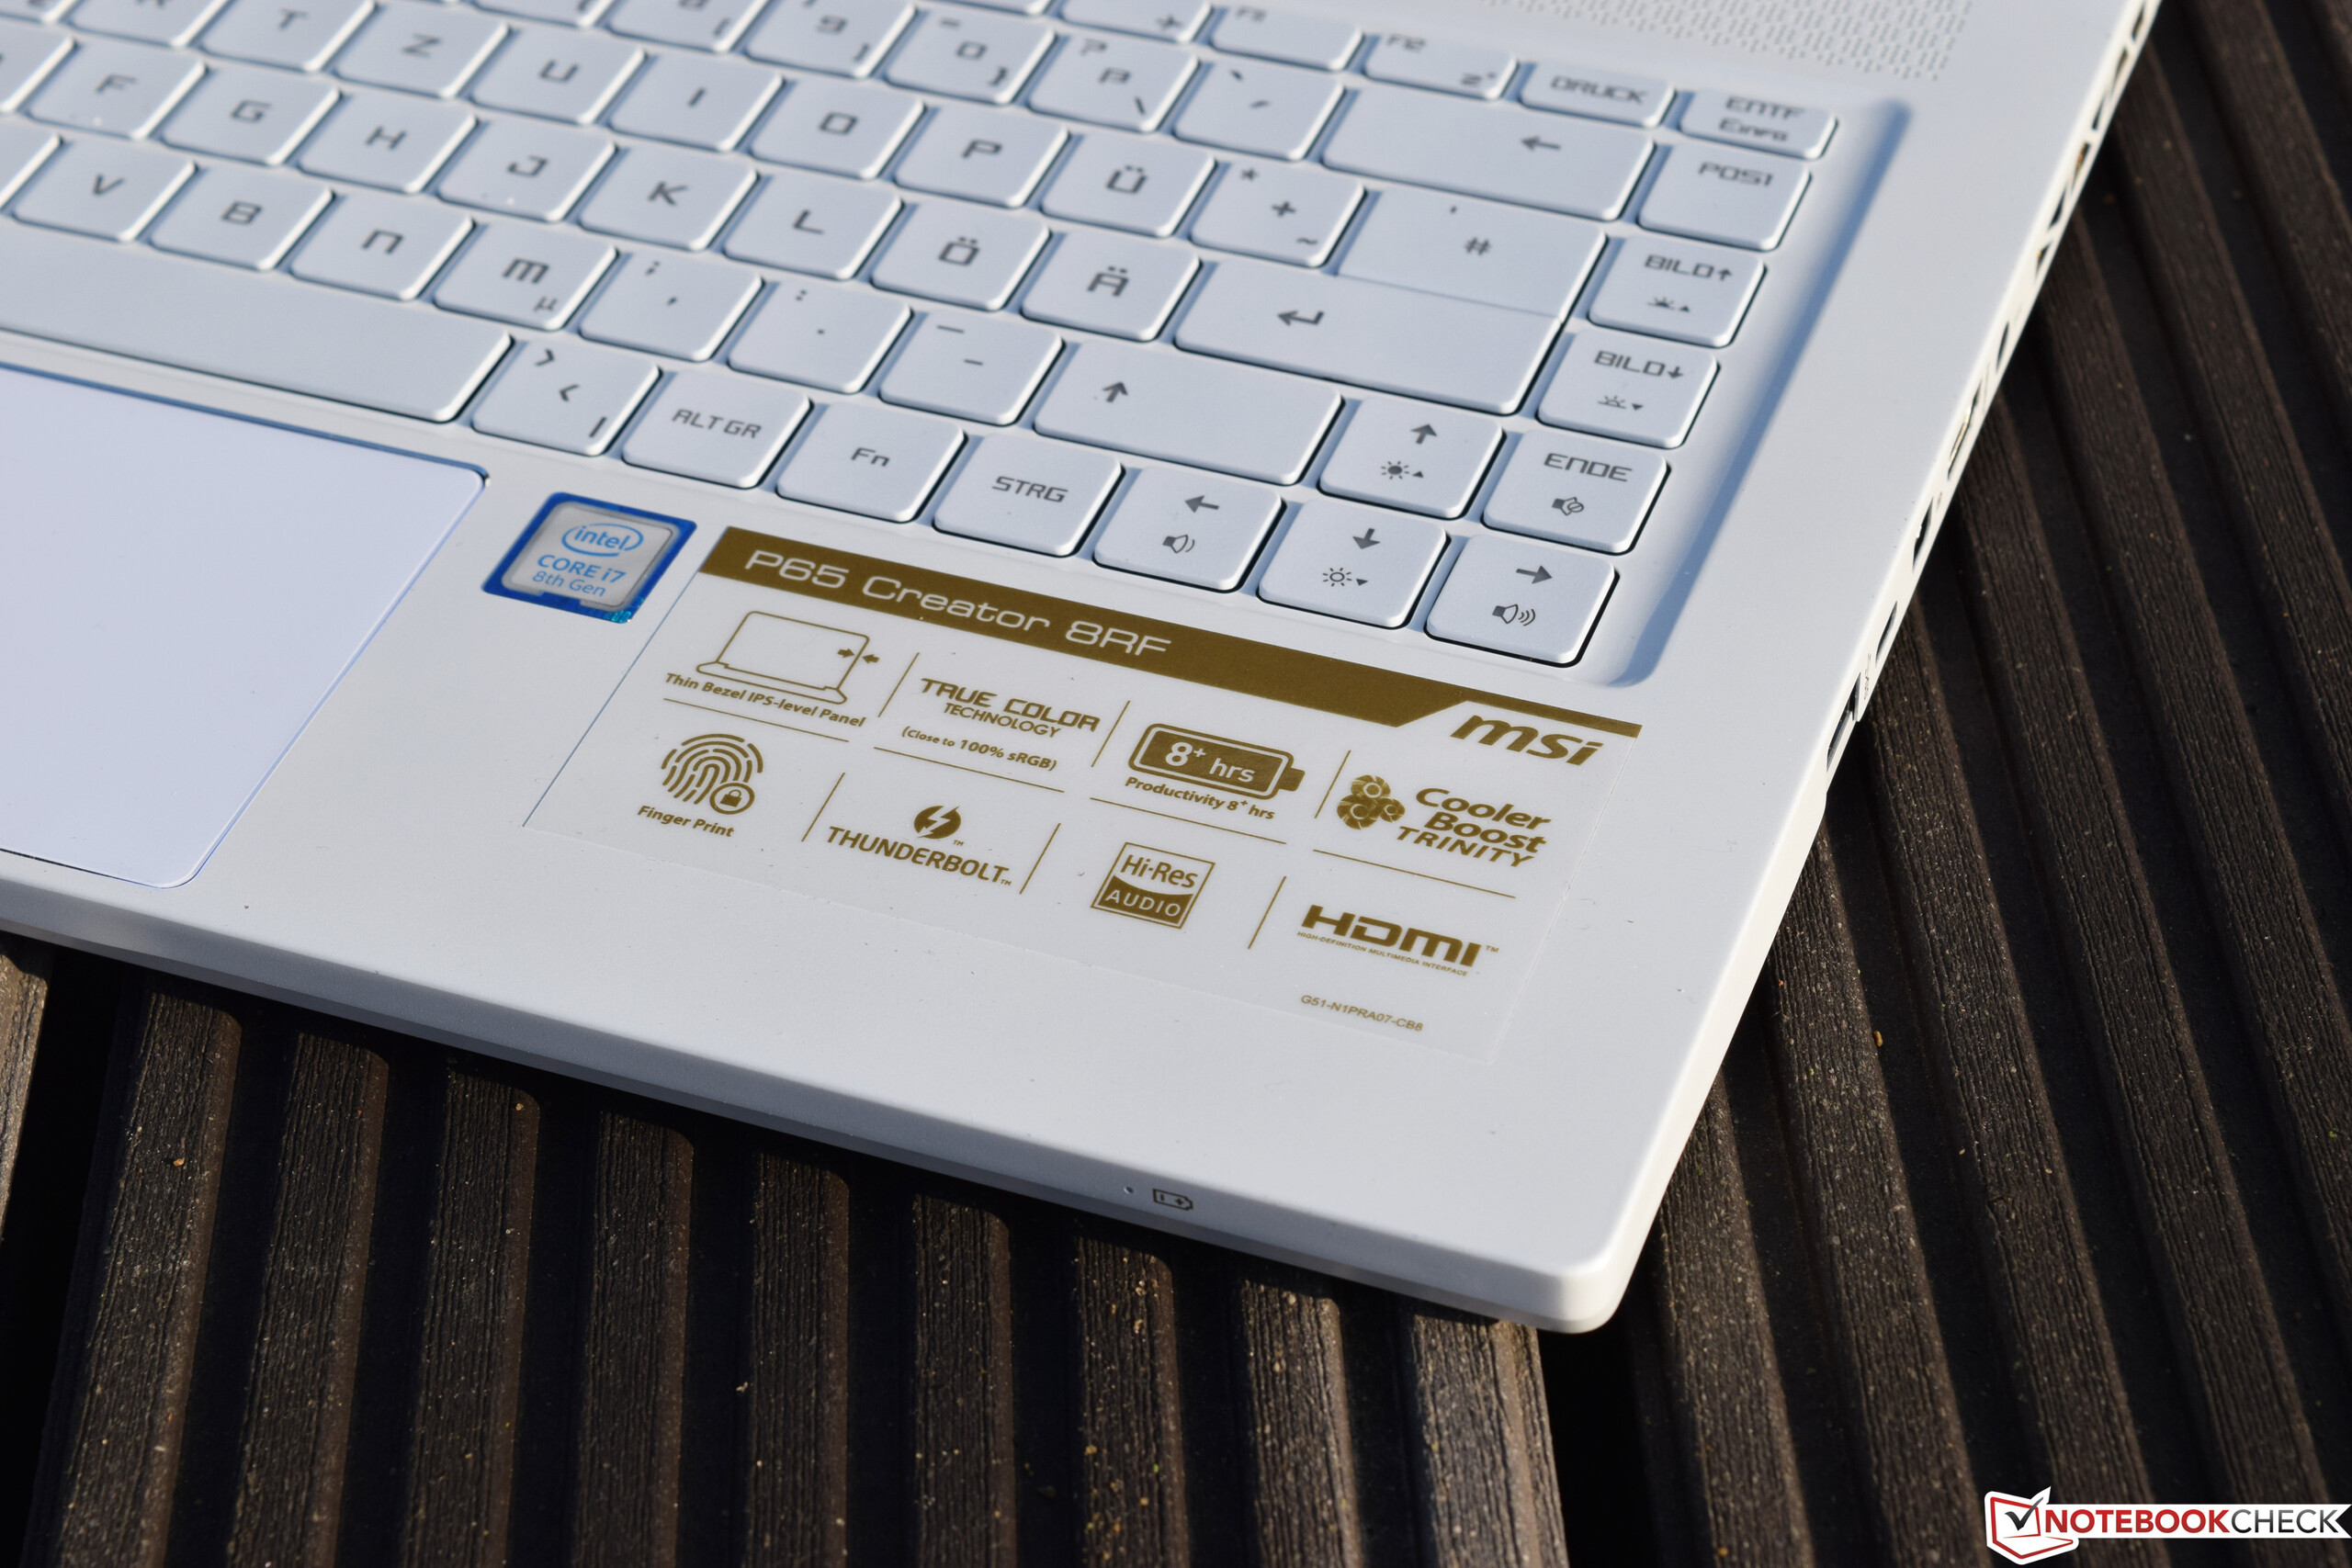
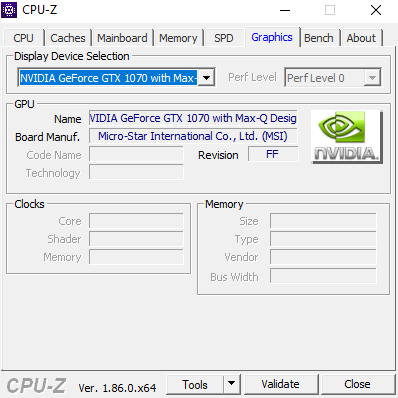
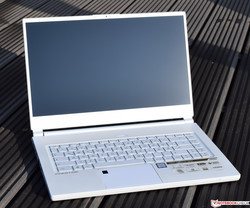
Zoals de naam al aangeeft, is de P65 8RF Creator van MSI gebaseerd op de GS65 8RF. Het is echter in de eerste plaats gericht op de creatieve menigte die software zoals Adobe Photoshop of Adobe Premiere onderweg gebruikt. De Limited Edition biedt meer dan alleen de witte behuizing, zoals een krachtige GPU en hoogwaardige verpakking, inclusief een beschermende hoes. Bovendien is er een gratis garantieverlenging tot 36 maanden in totaal beschikbaar wanneer het product wordt geregistreerd bij MSI.
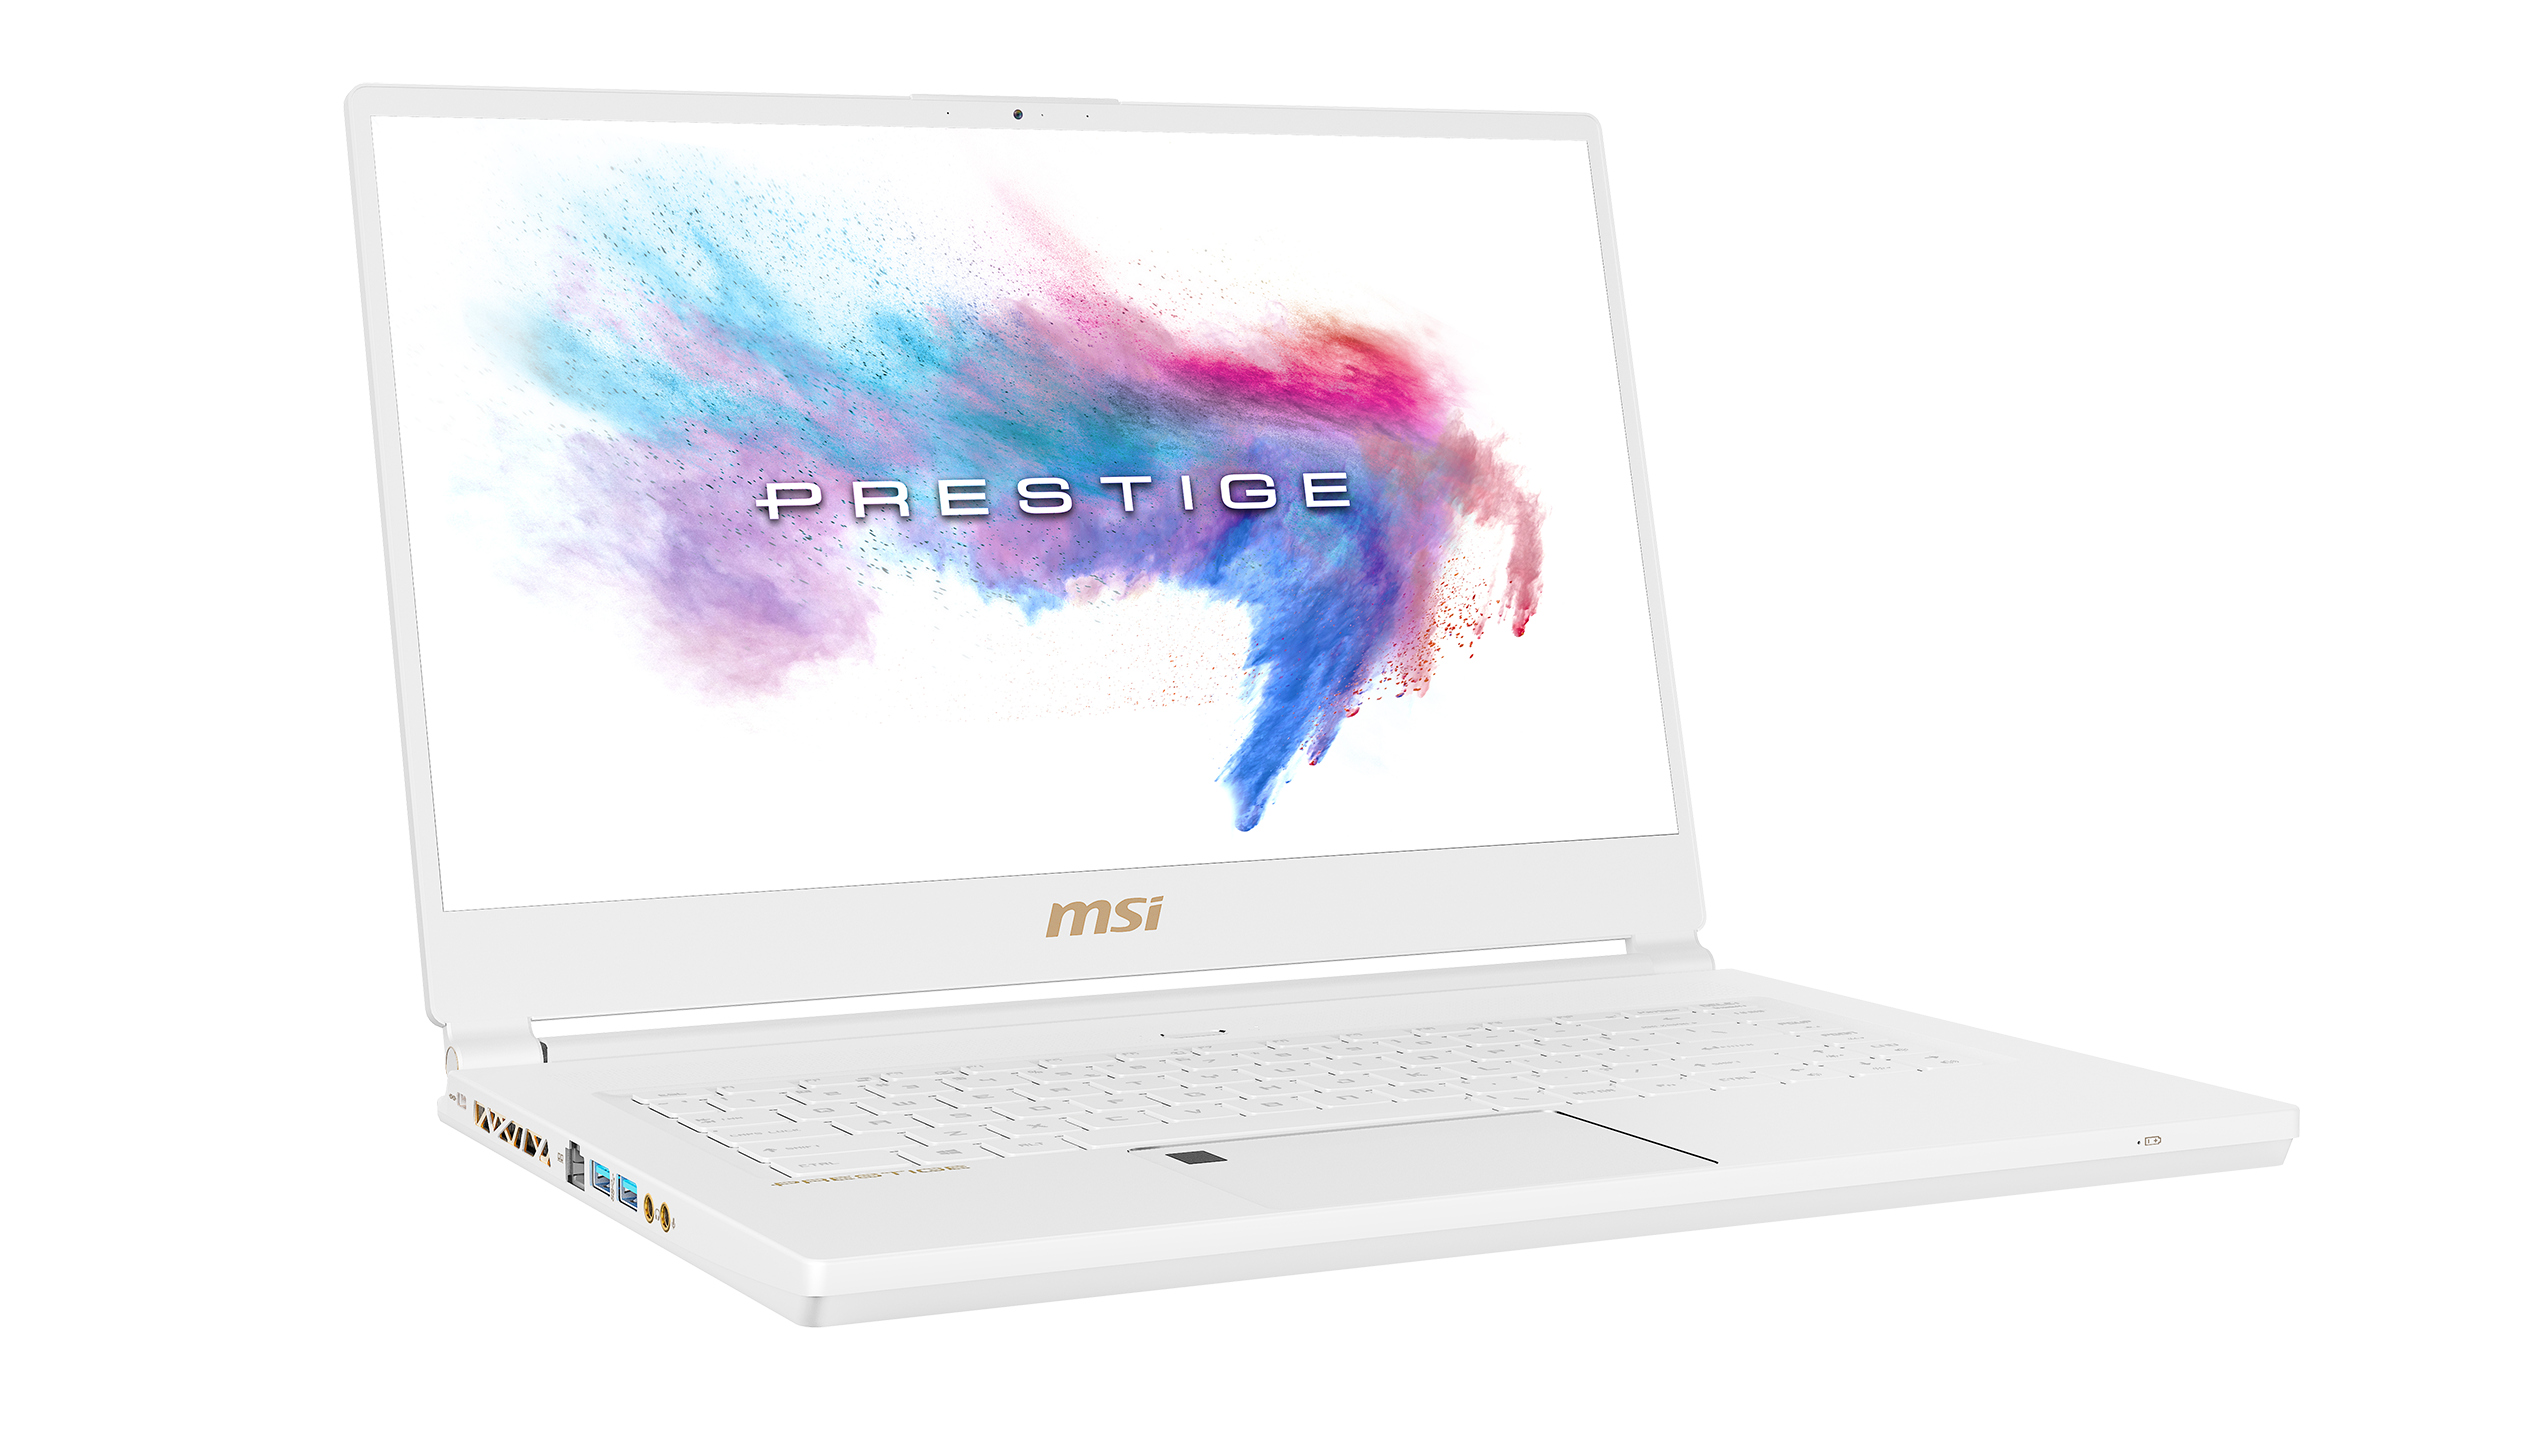
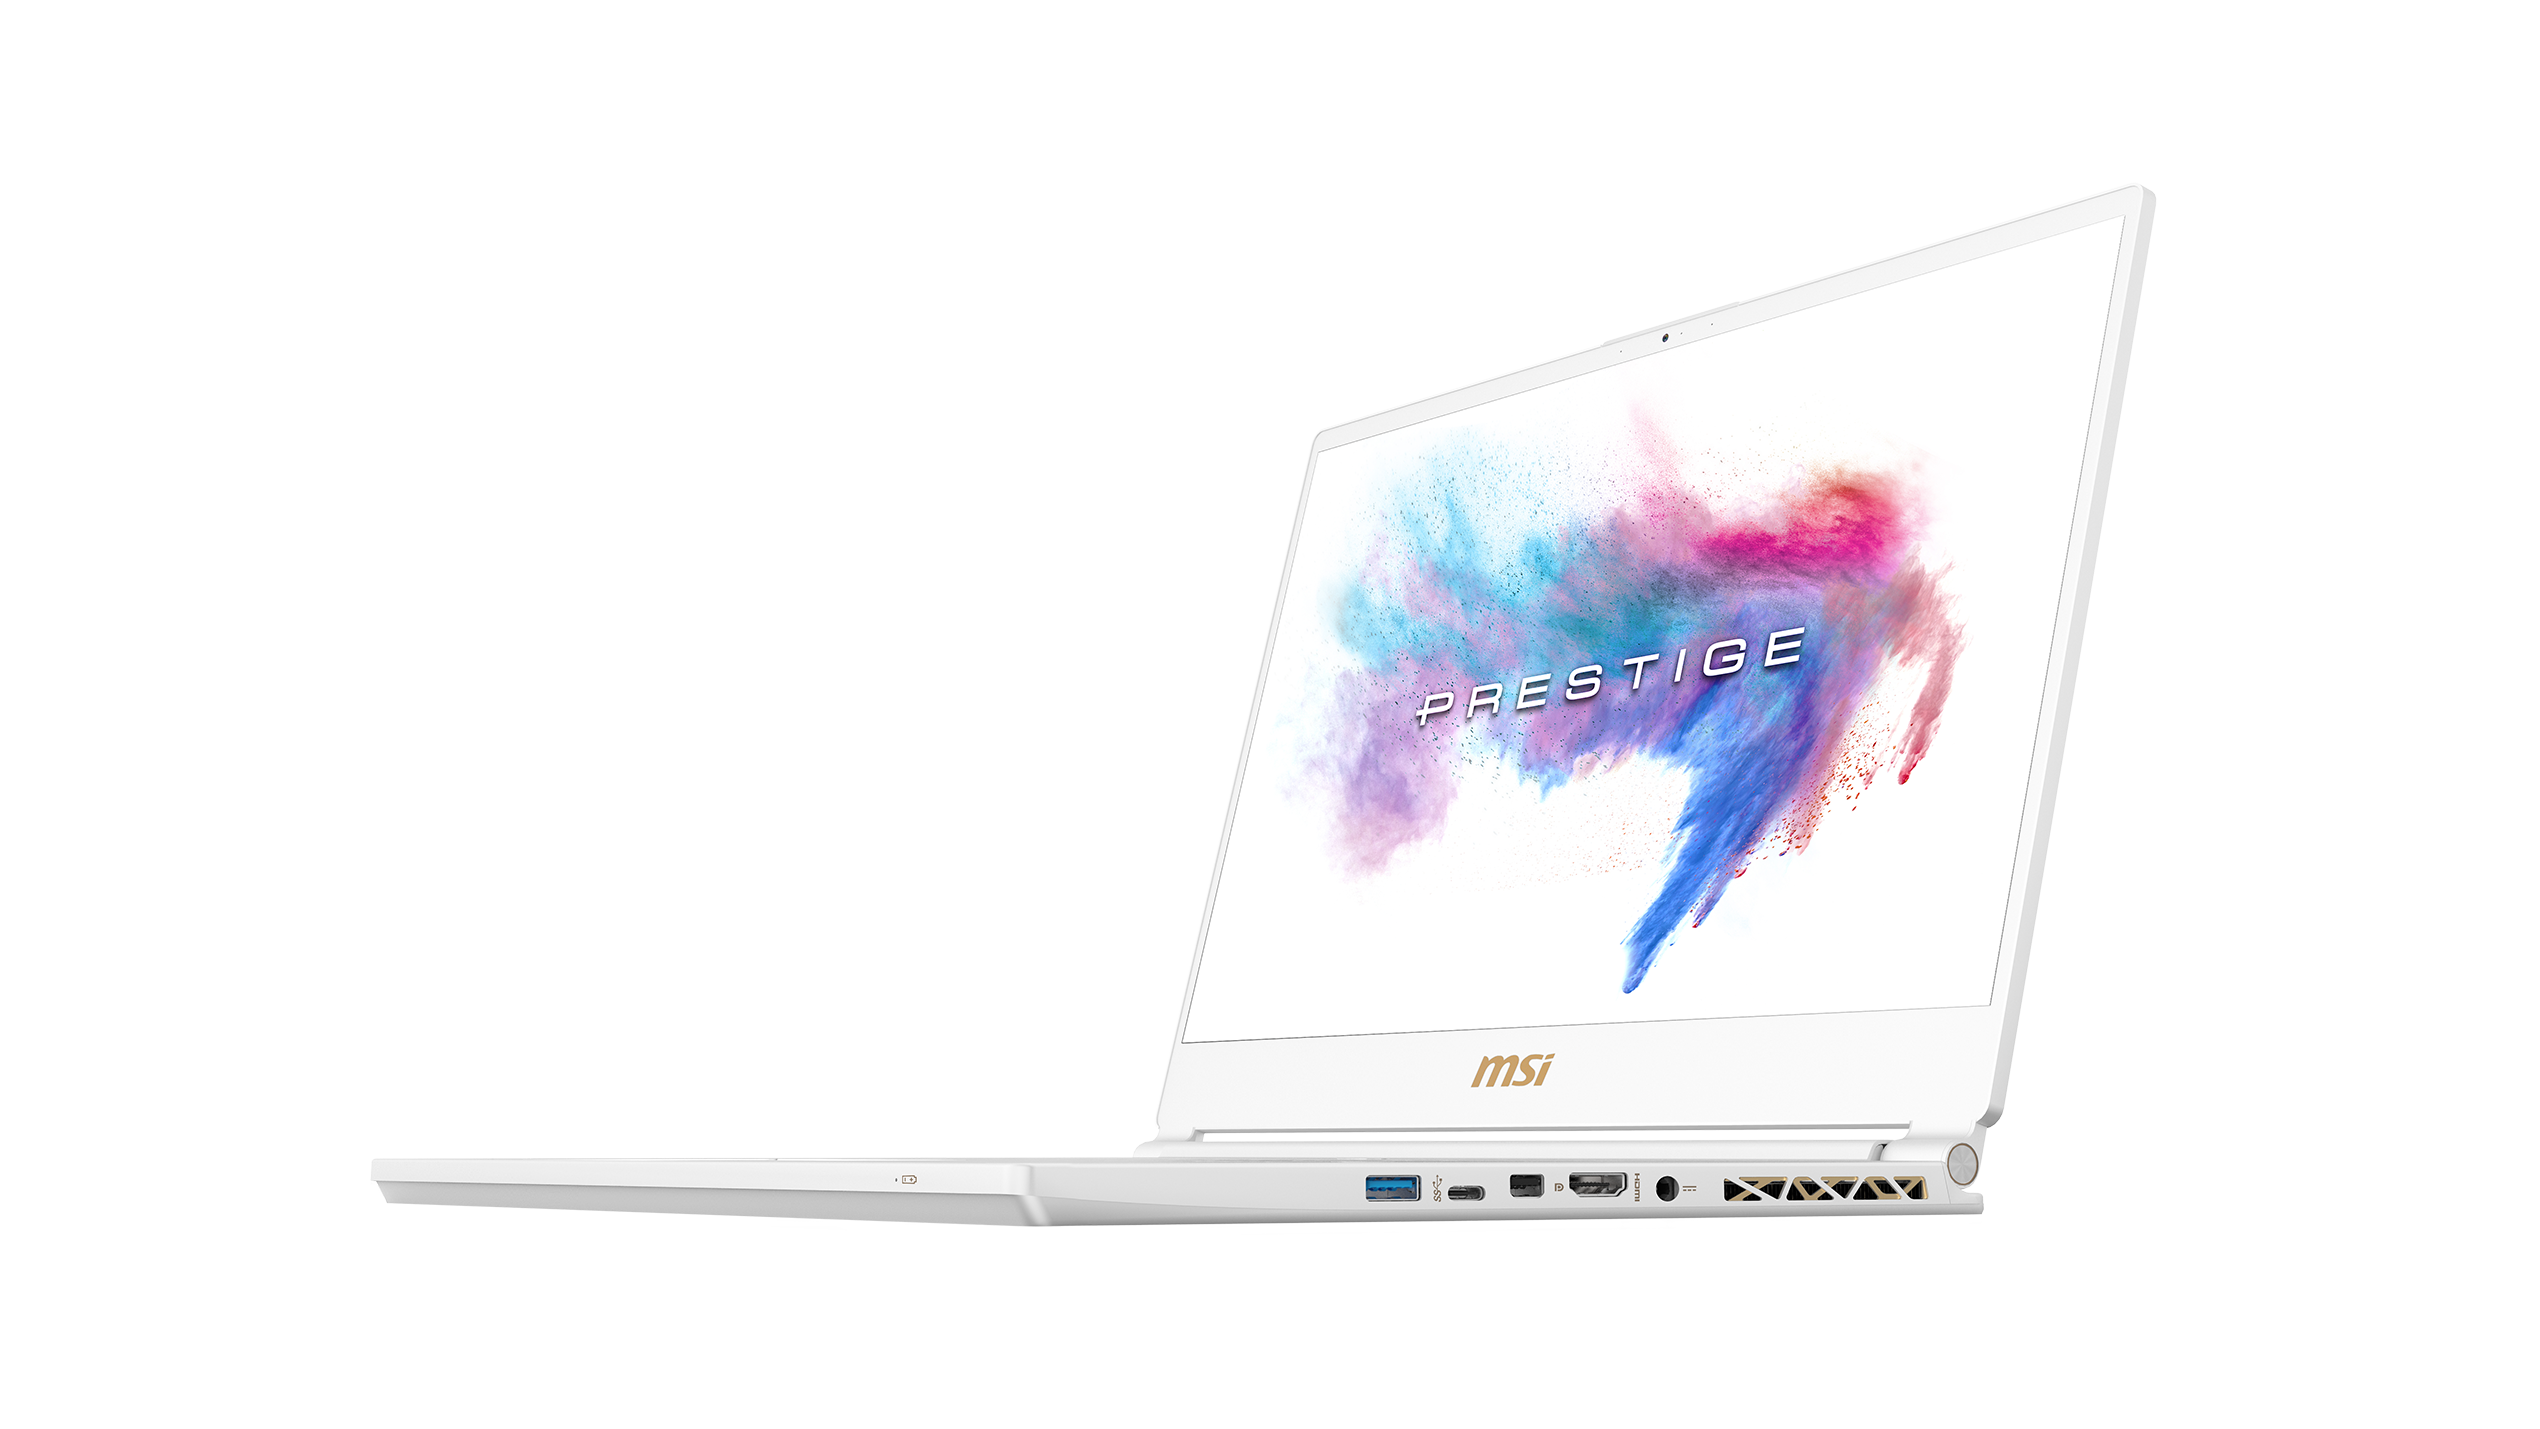
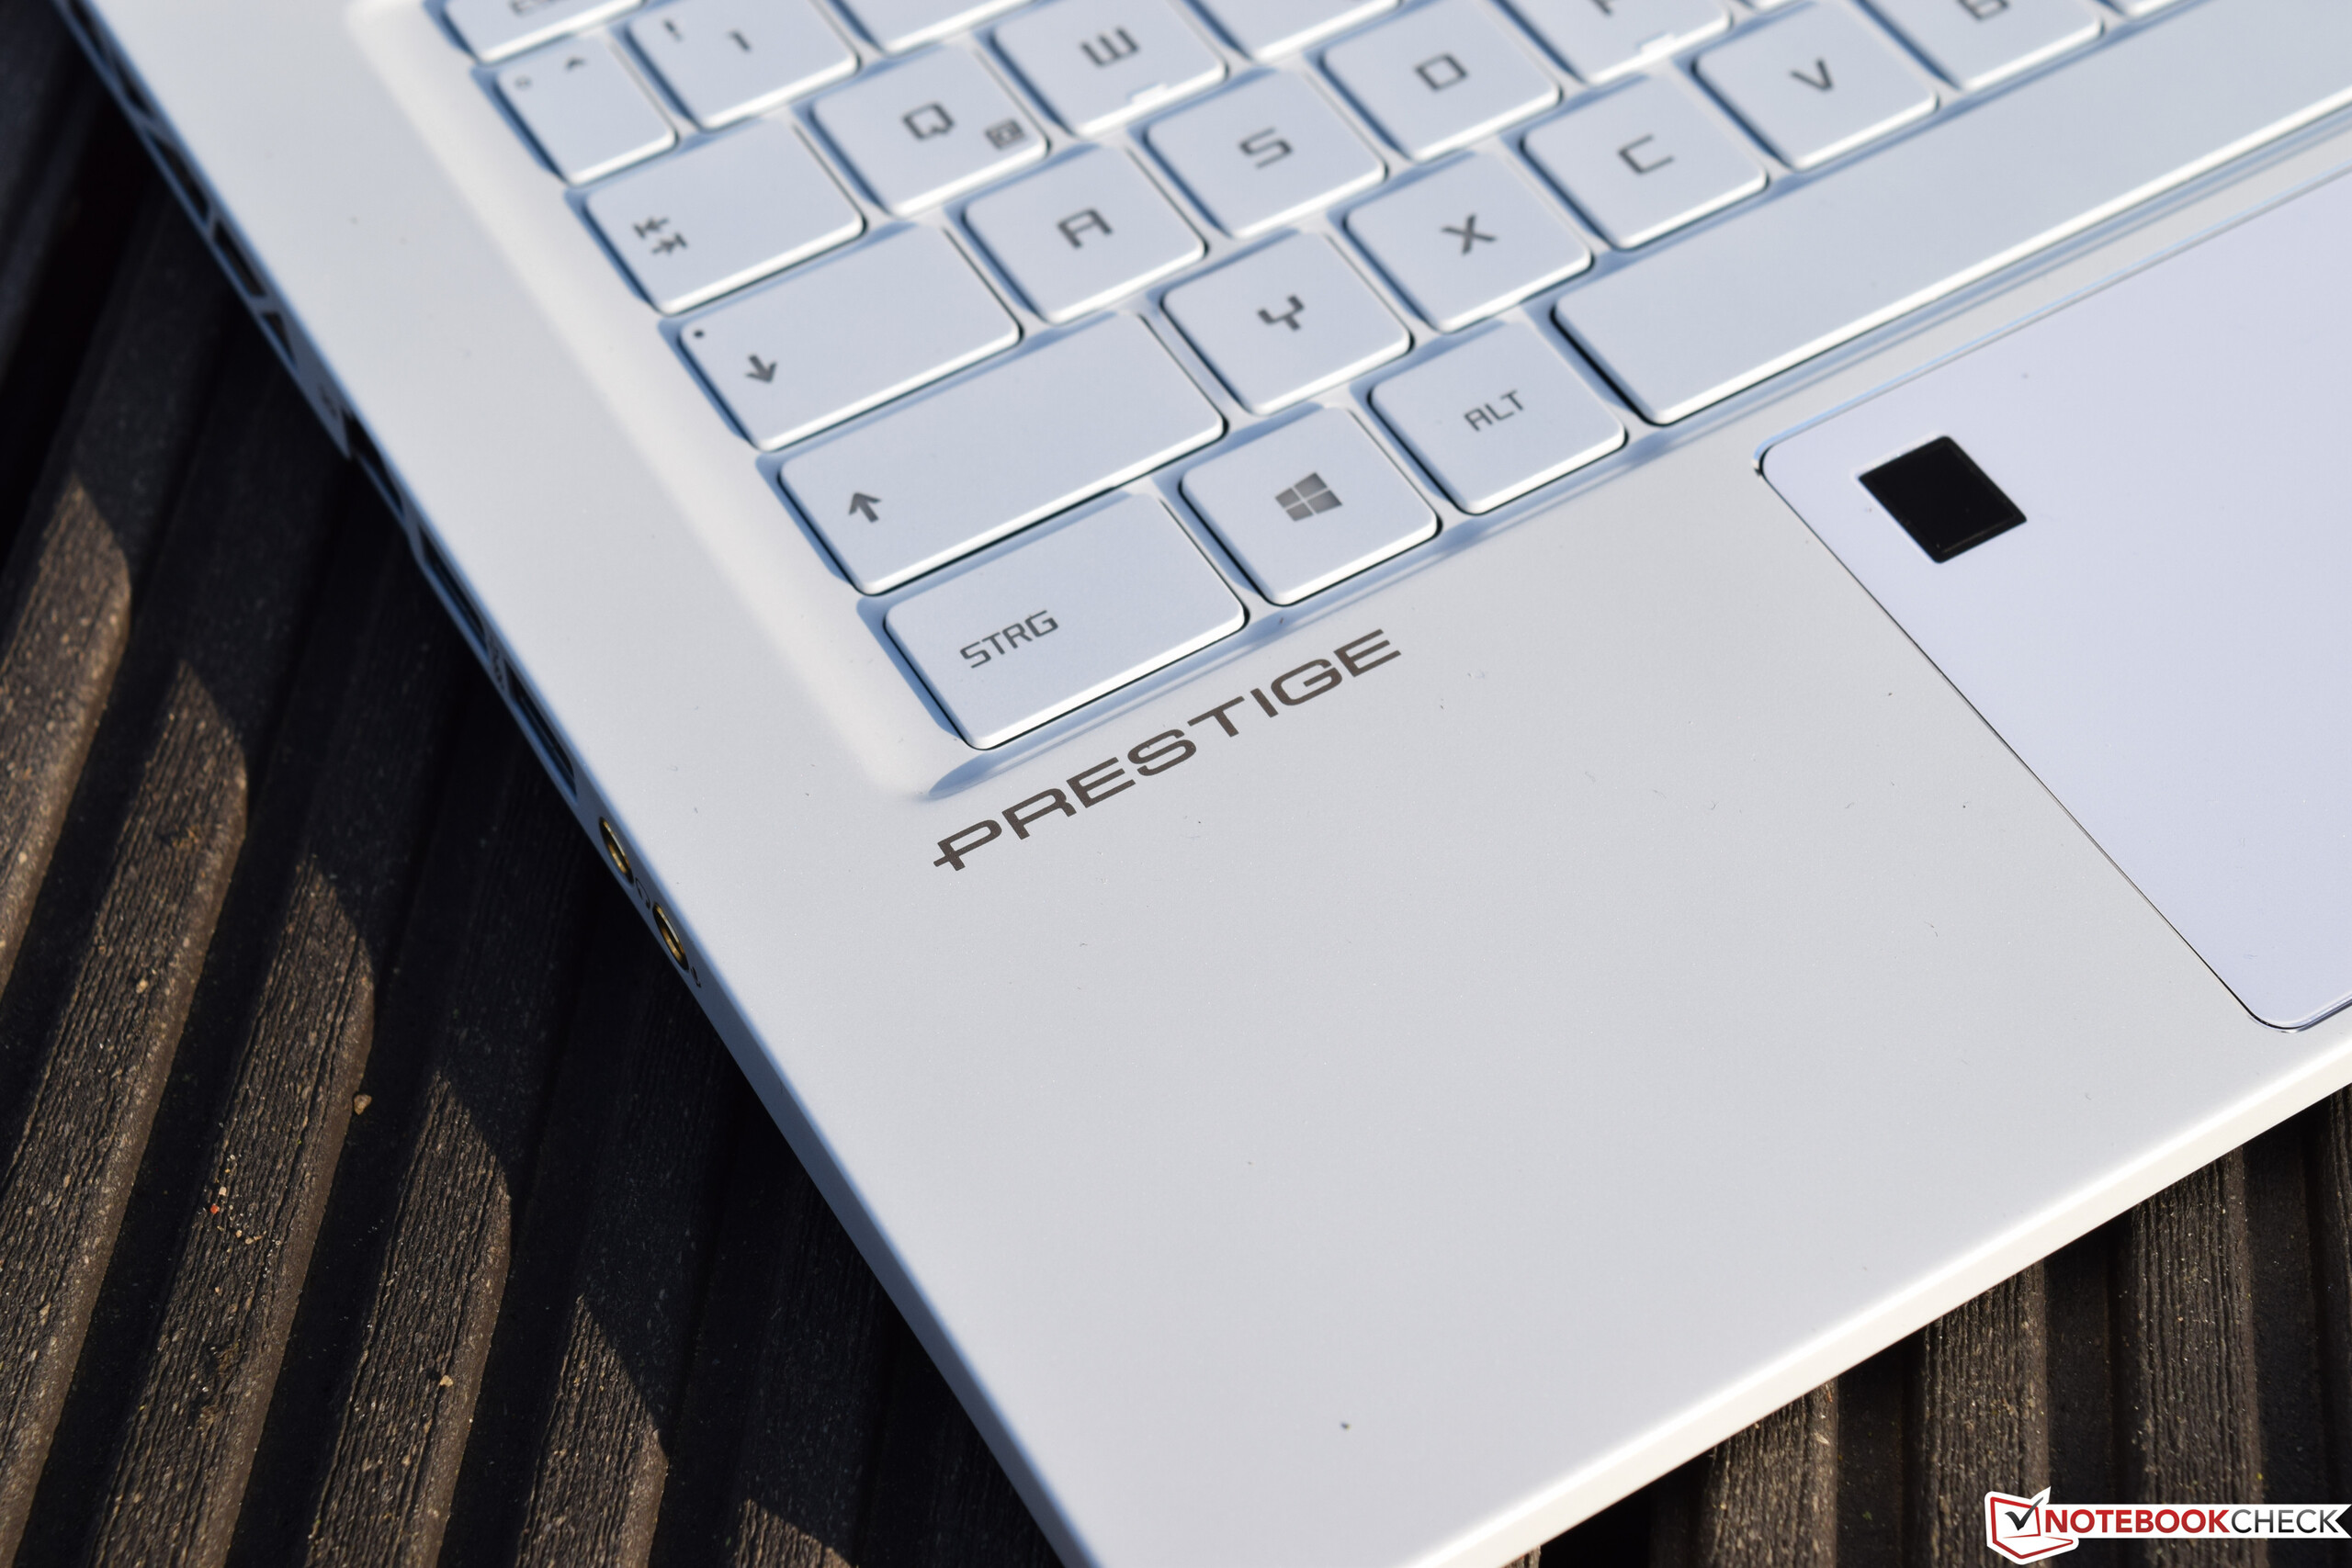
De vraag is: voor wie is dit apparaat gemaakt? Als je op zoek bent naar een stijlvol en ongebruikelijk apparaat, is de P65 8RF wellicht een geschikte notebook. Het apparaat ziet er geweldig uit tijdens presentaties zonder in te boeten aan gaming prestaties. Daarnaast zorgt het ontbreken van gaming-bling voor een zeer serieuze verschijning. Dit is waar de P65 8RF echt tot zijn recht komt.
De MSI P65 8RF leeft een dubbelleven. Overdag speelt het zijn rol als stijlvolle zakelijke underdog. 's Nachts kan het worden gebruikt om zelfs de nieuwste games soepel in 1080p met maximale details te draaien.
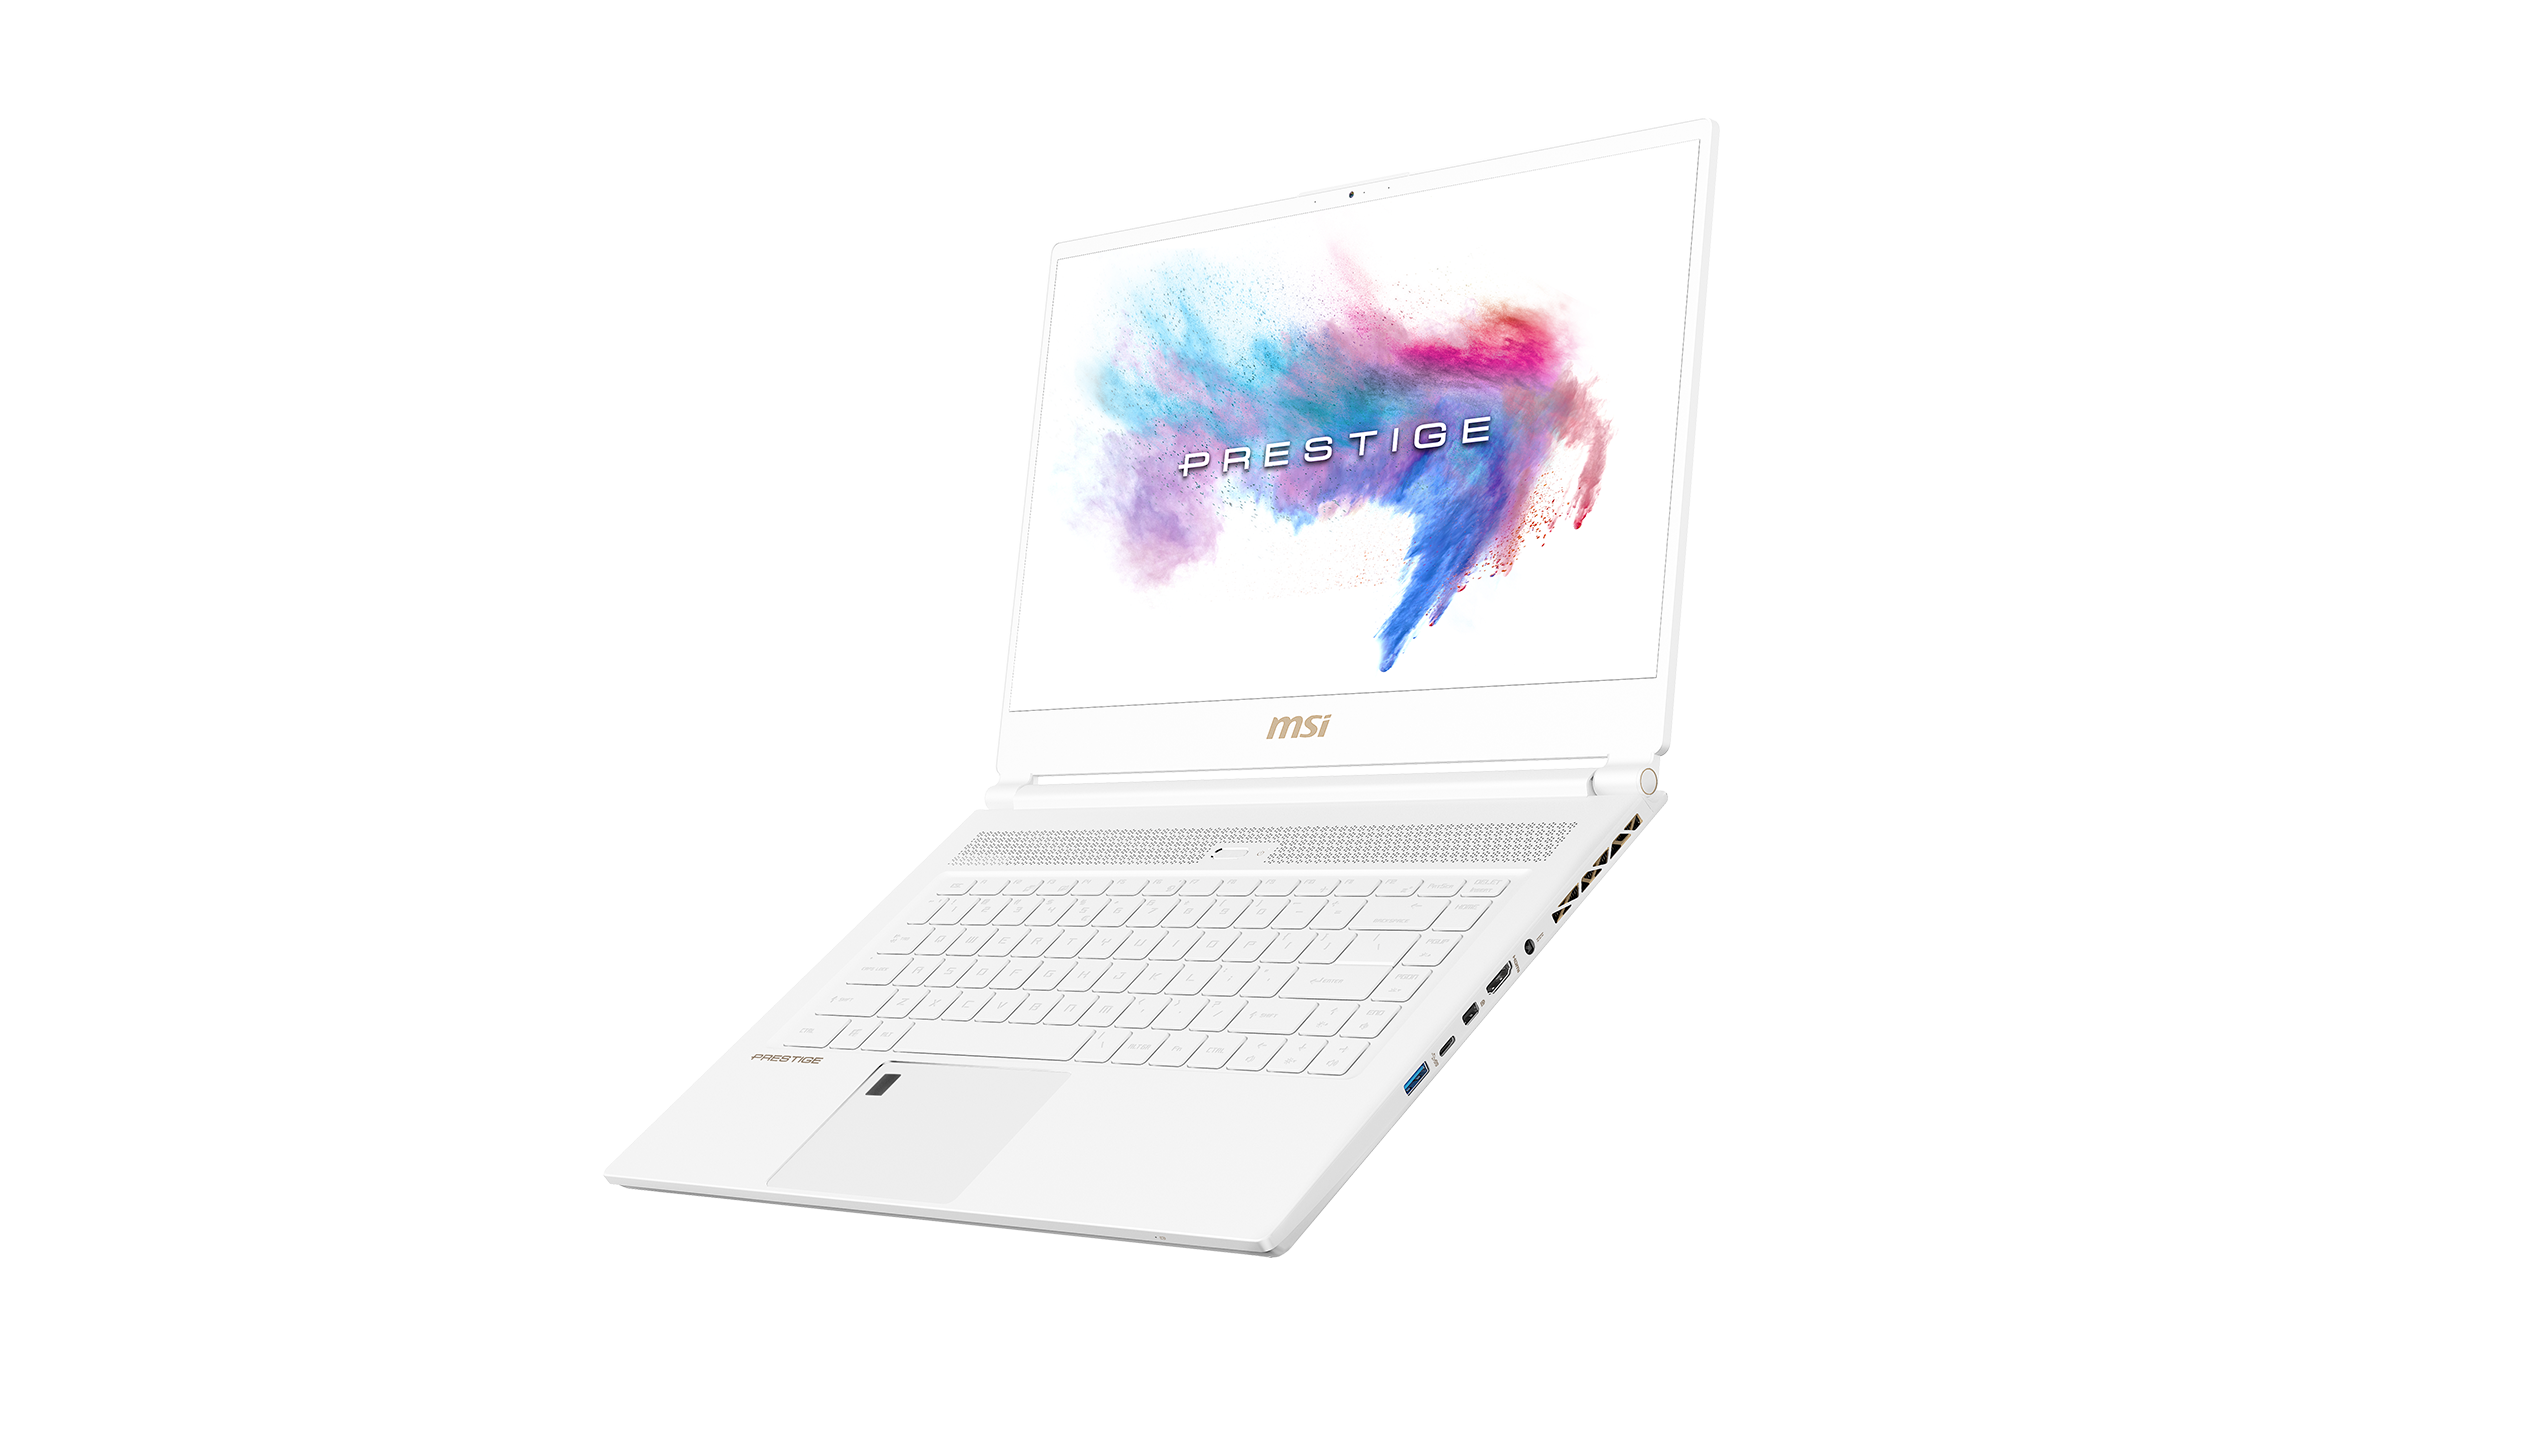
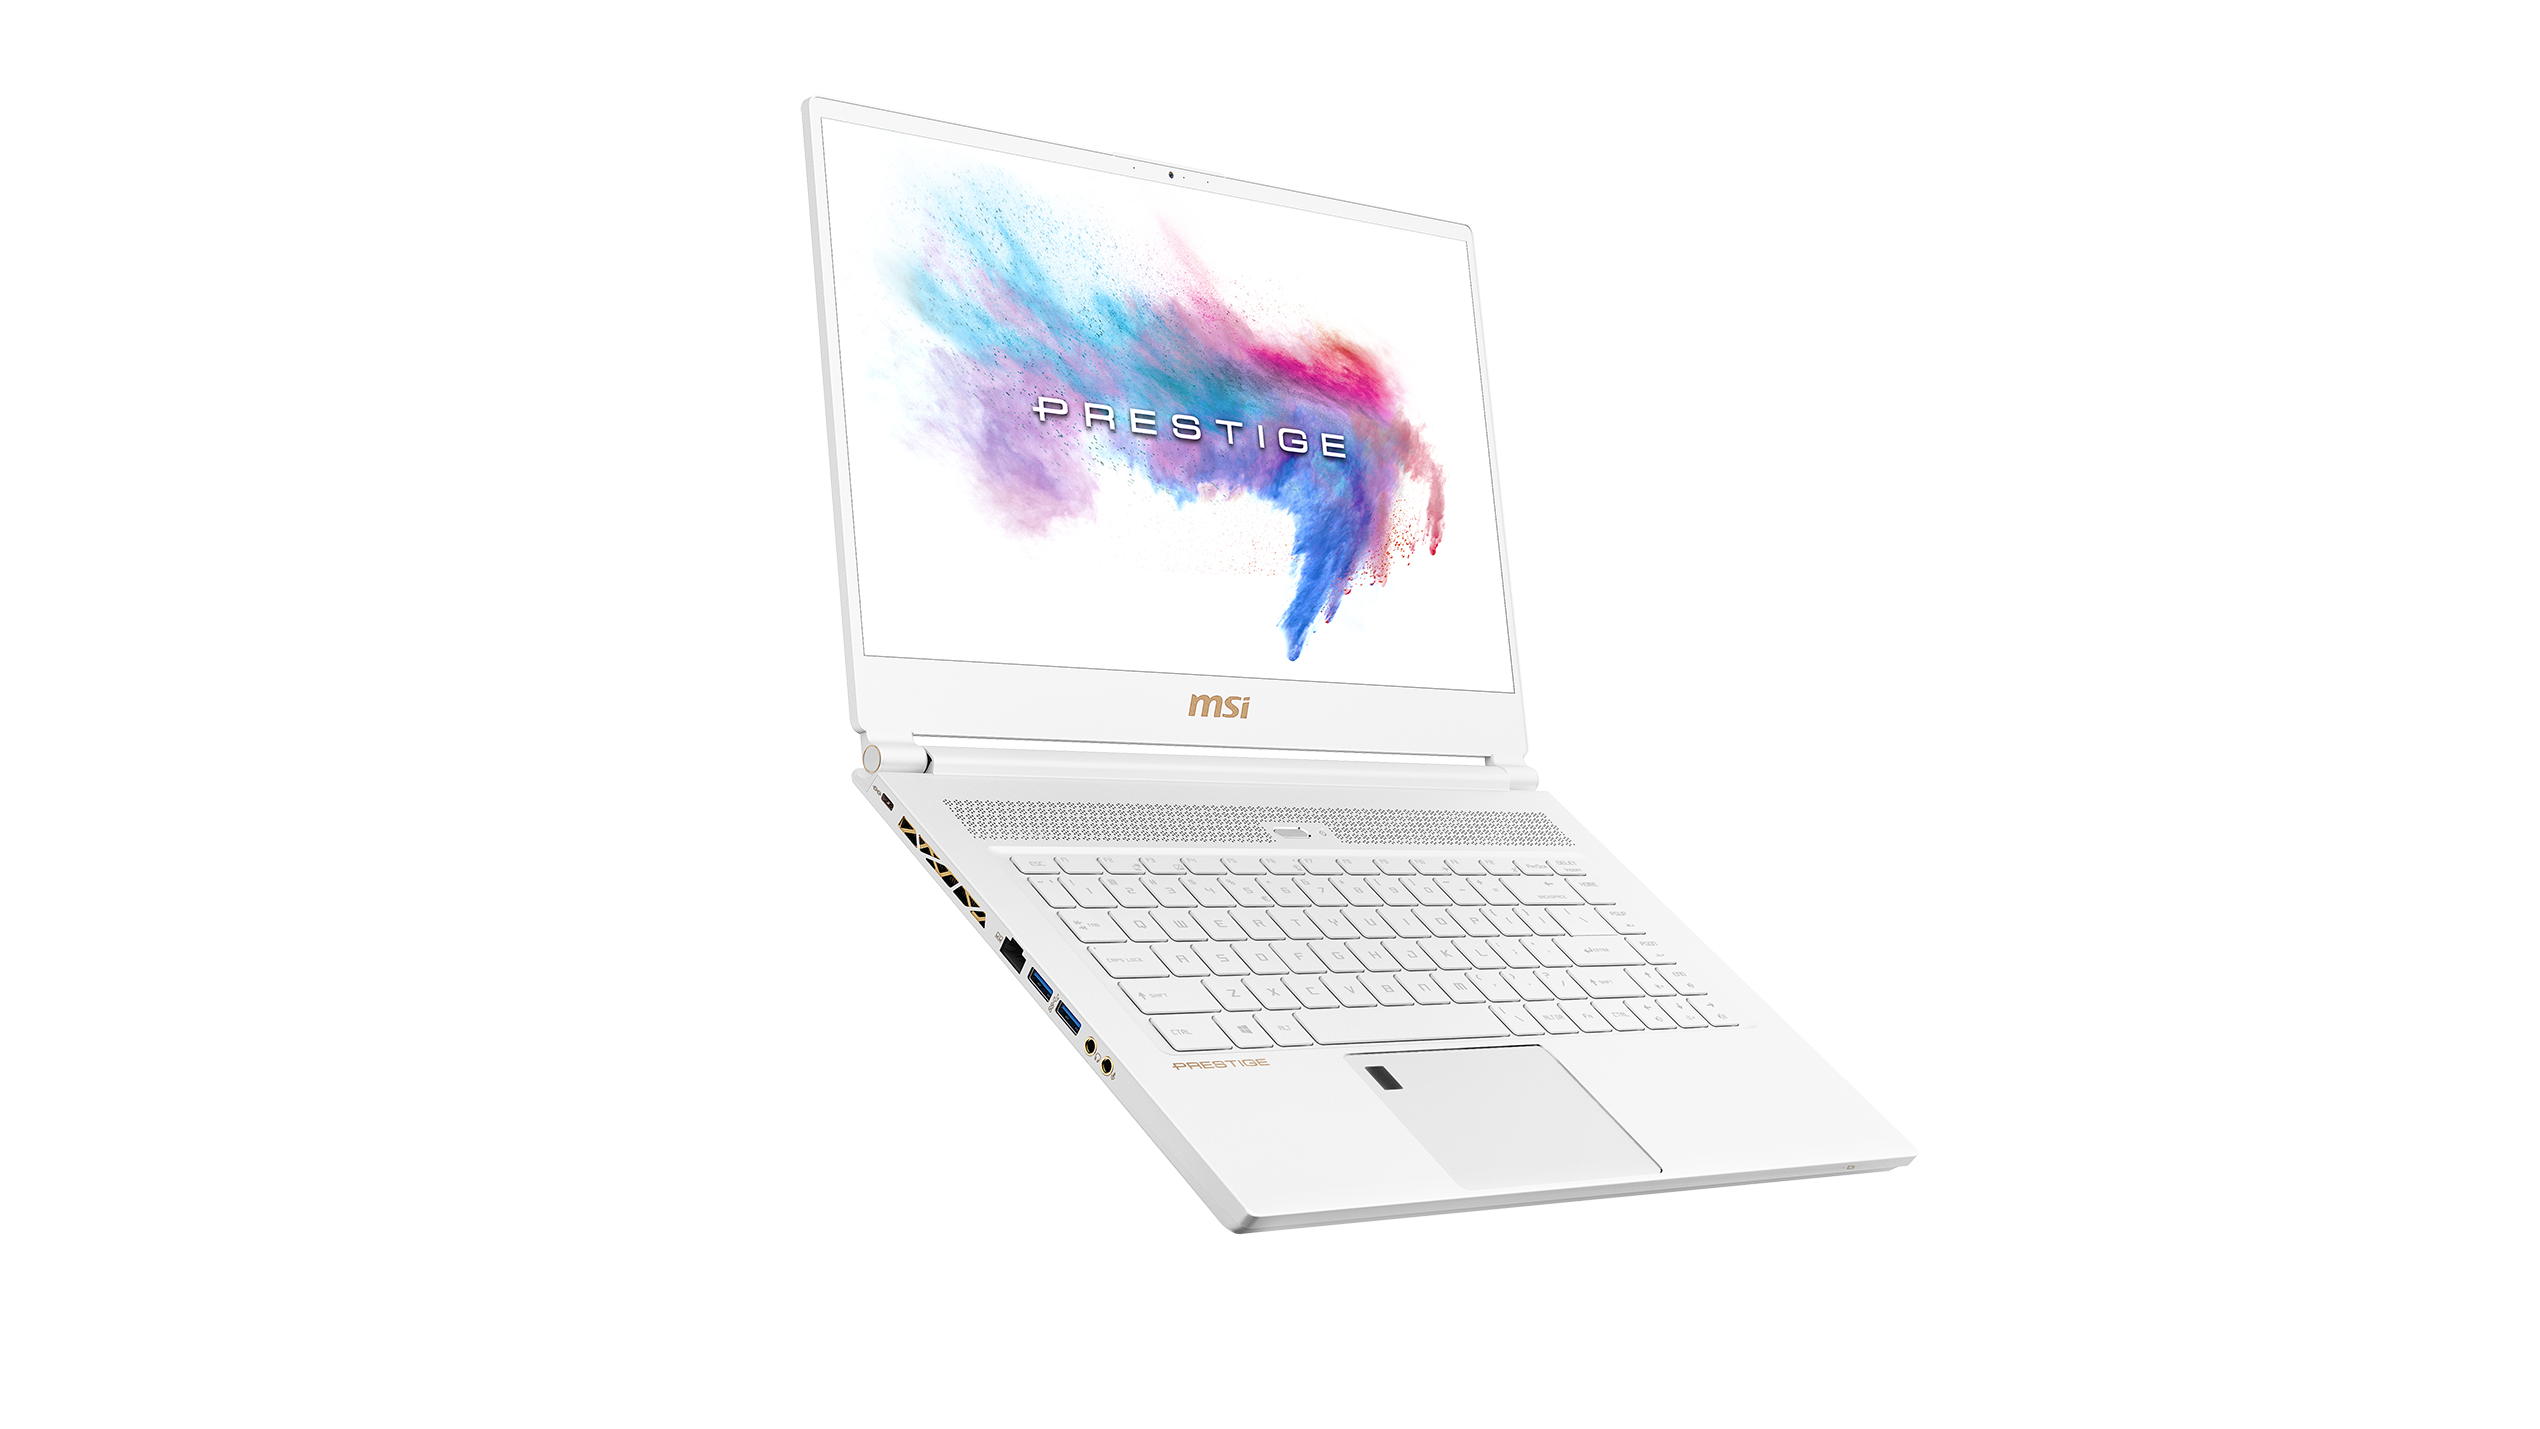
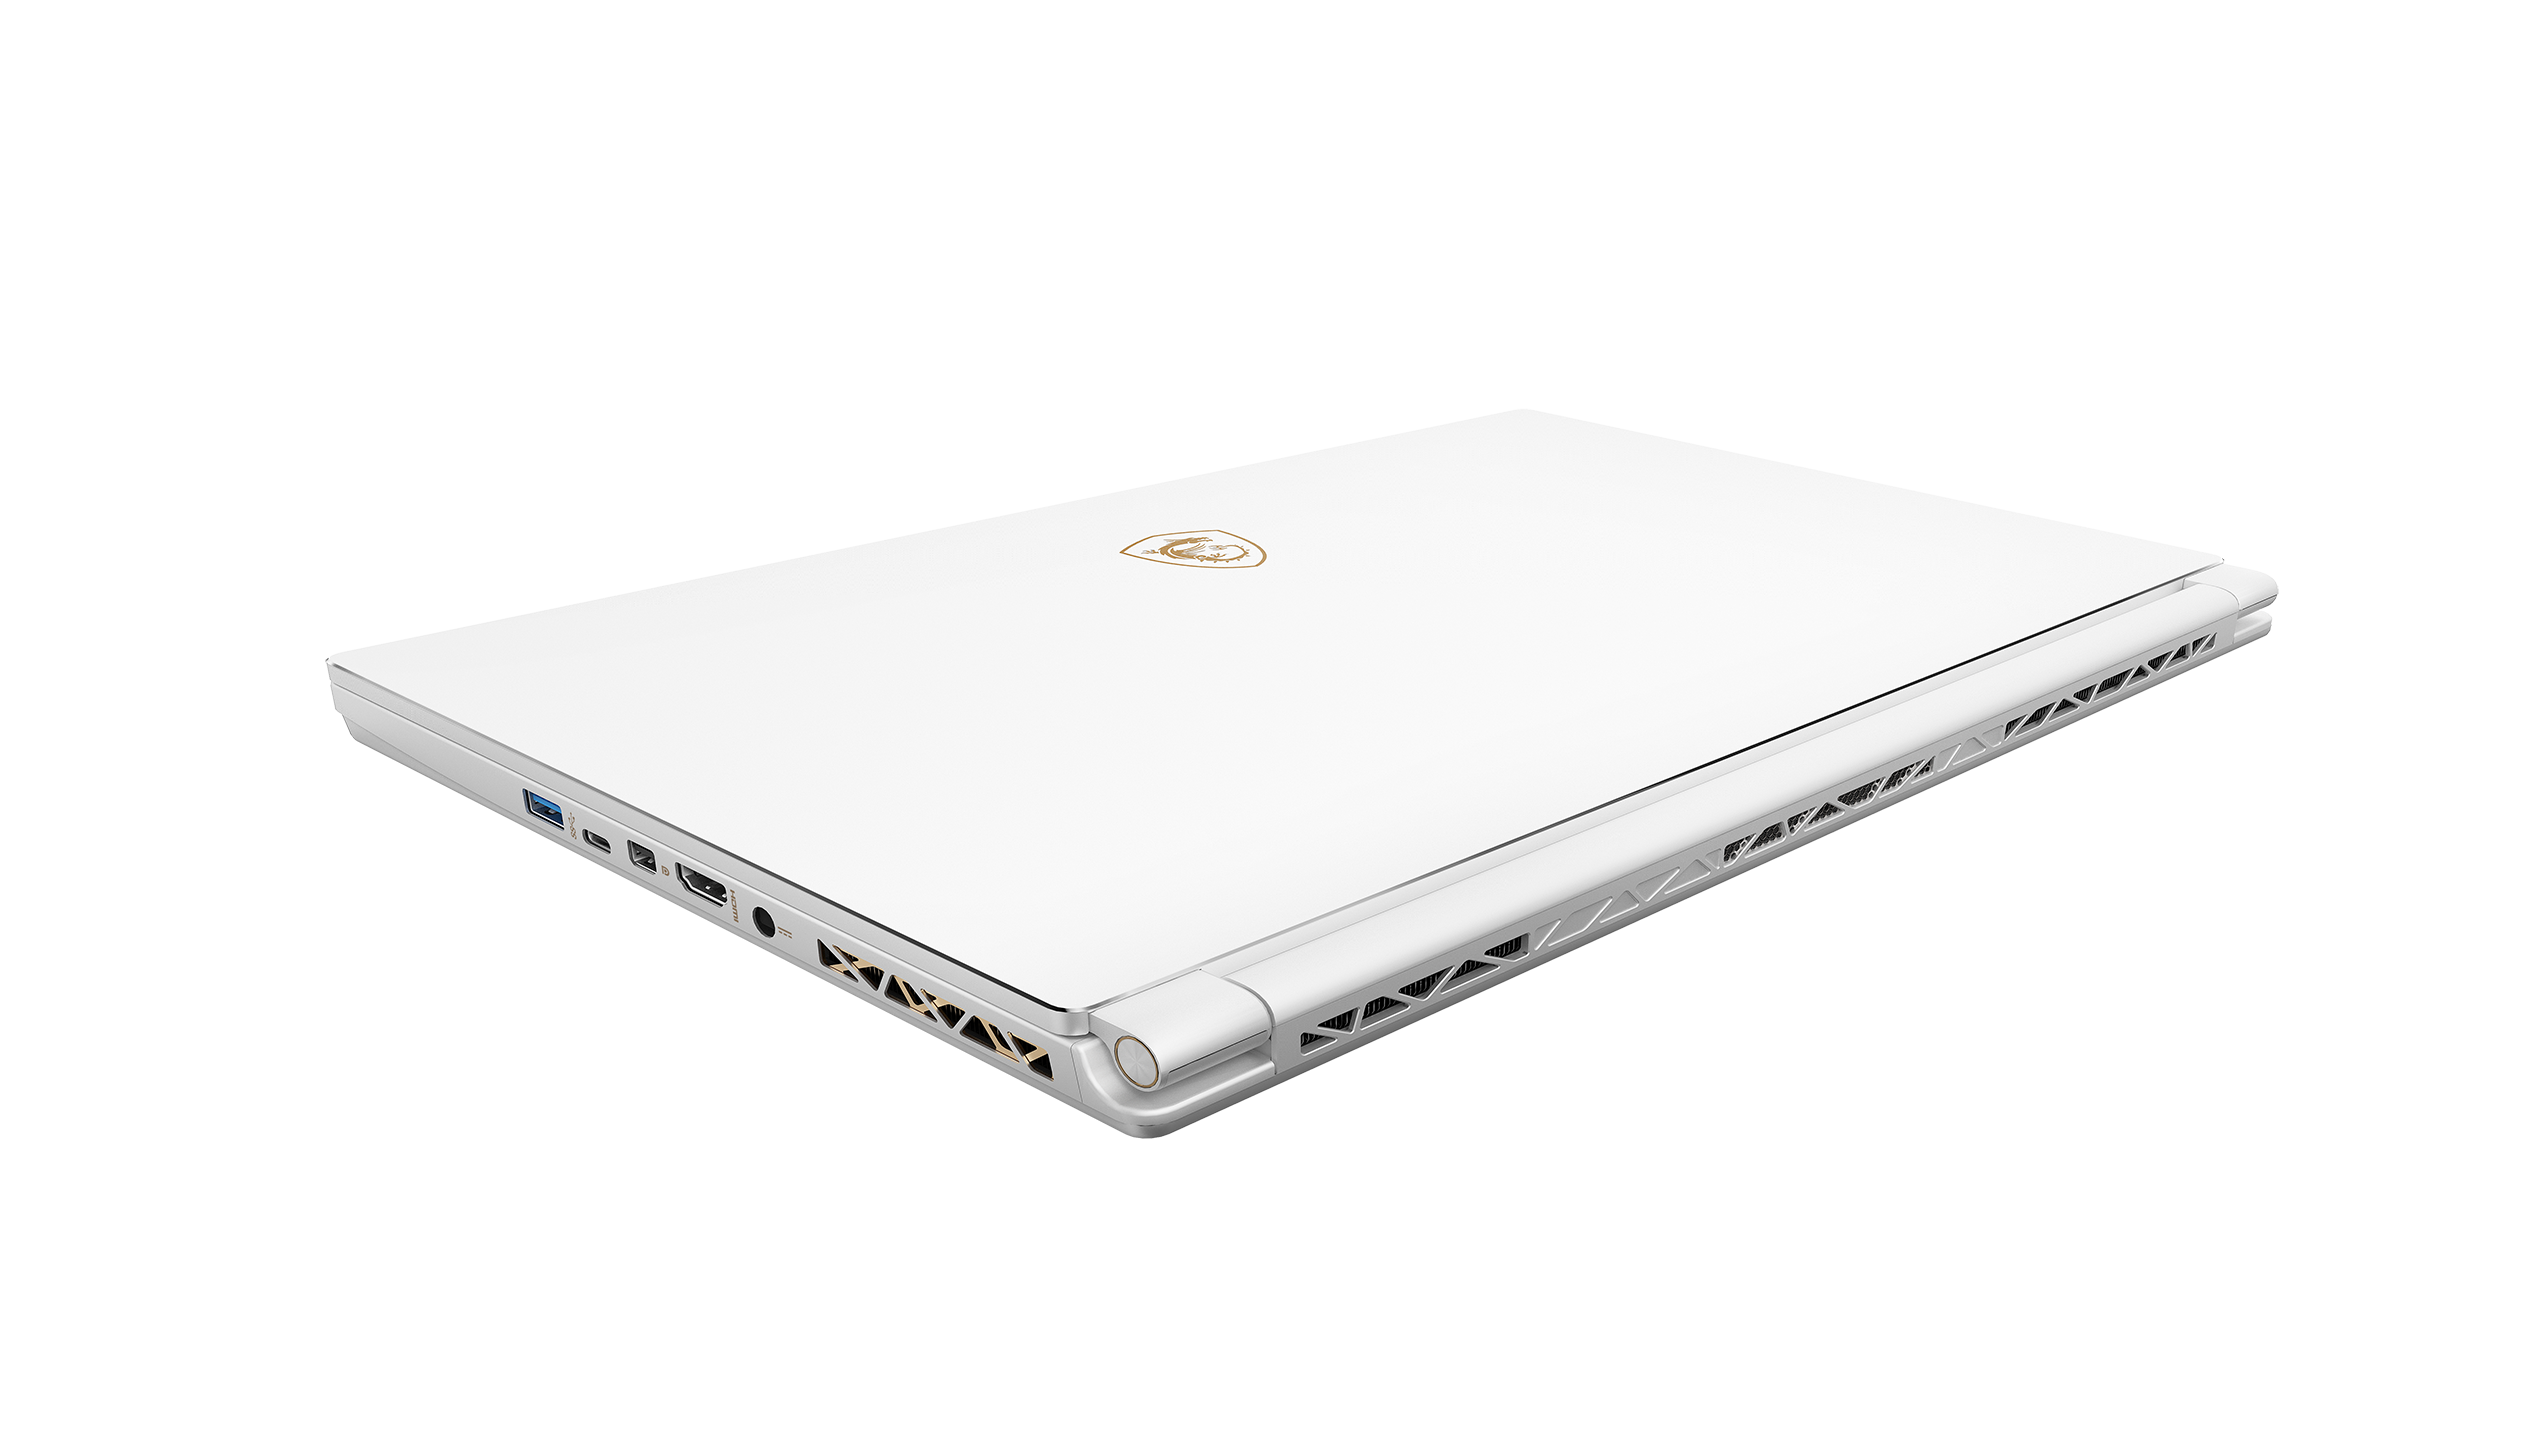
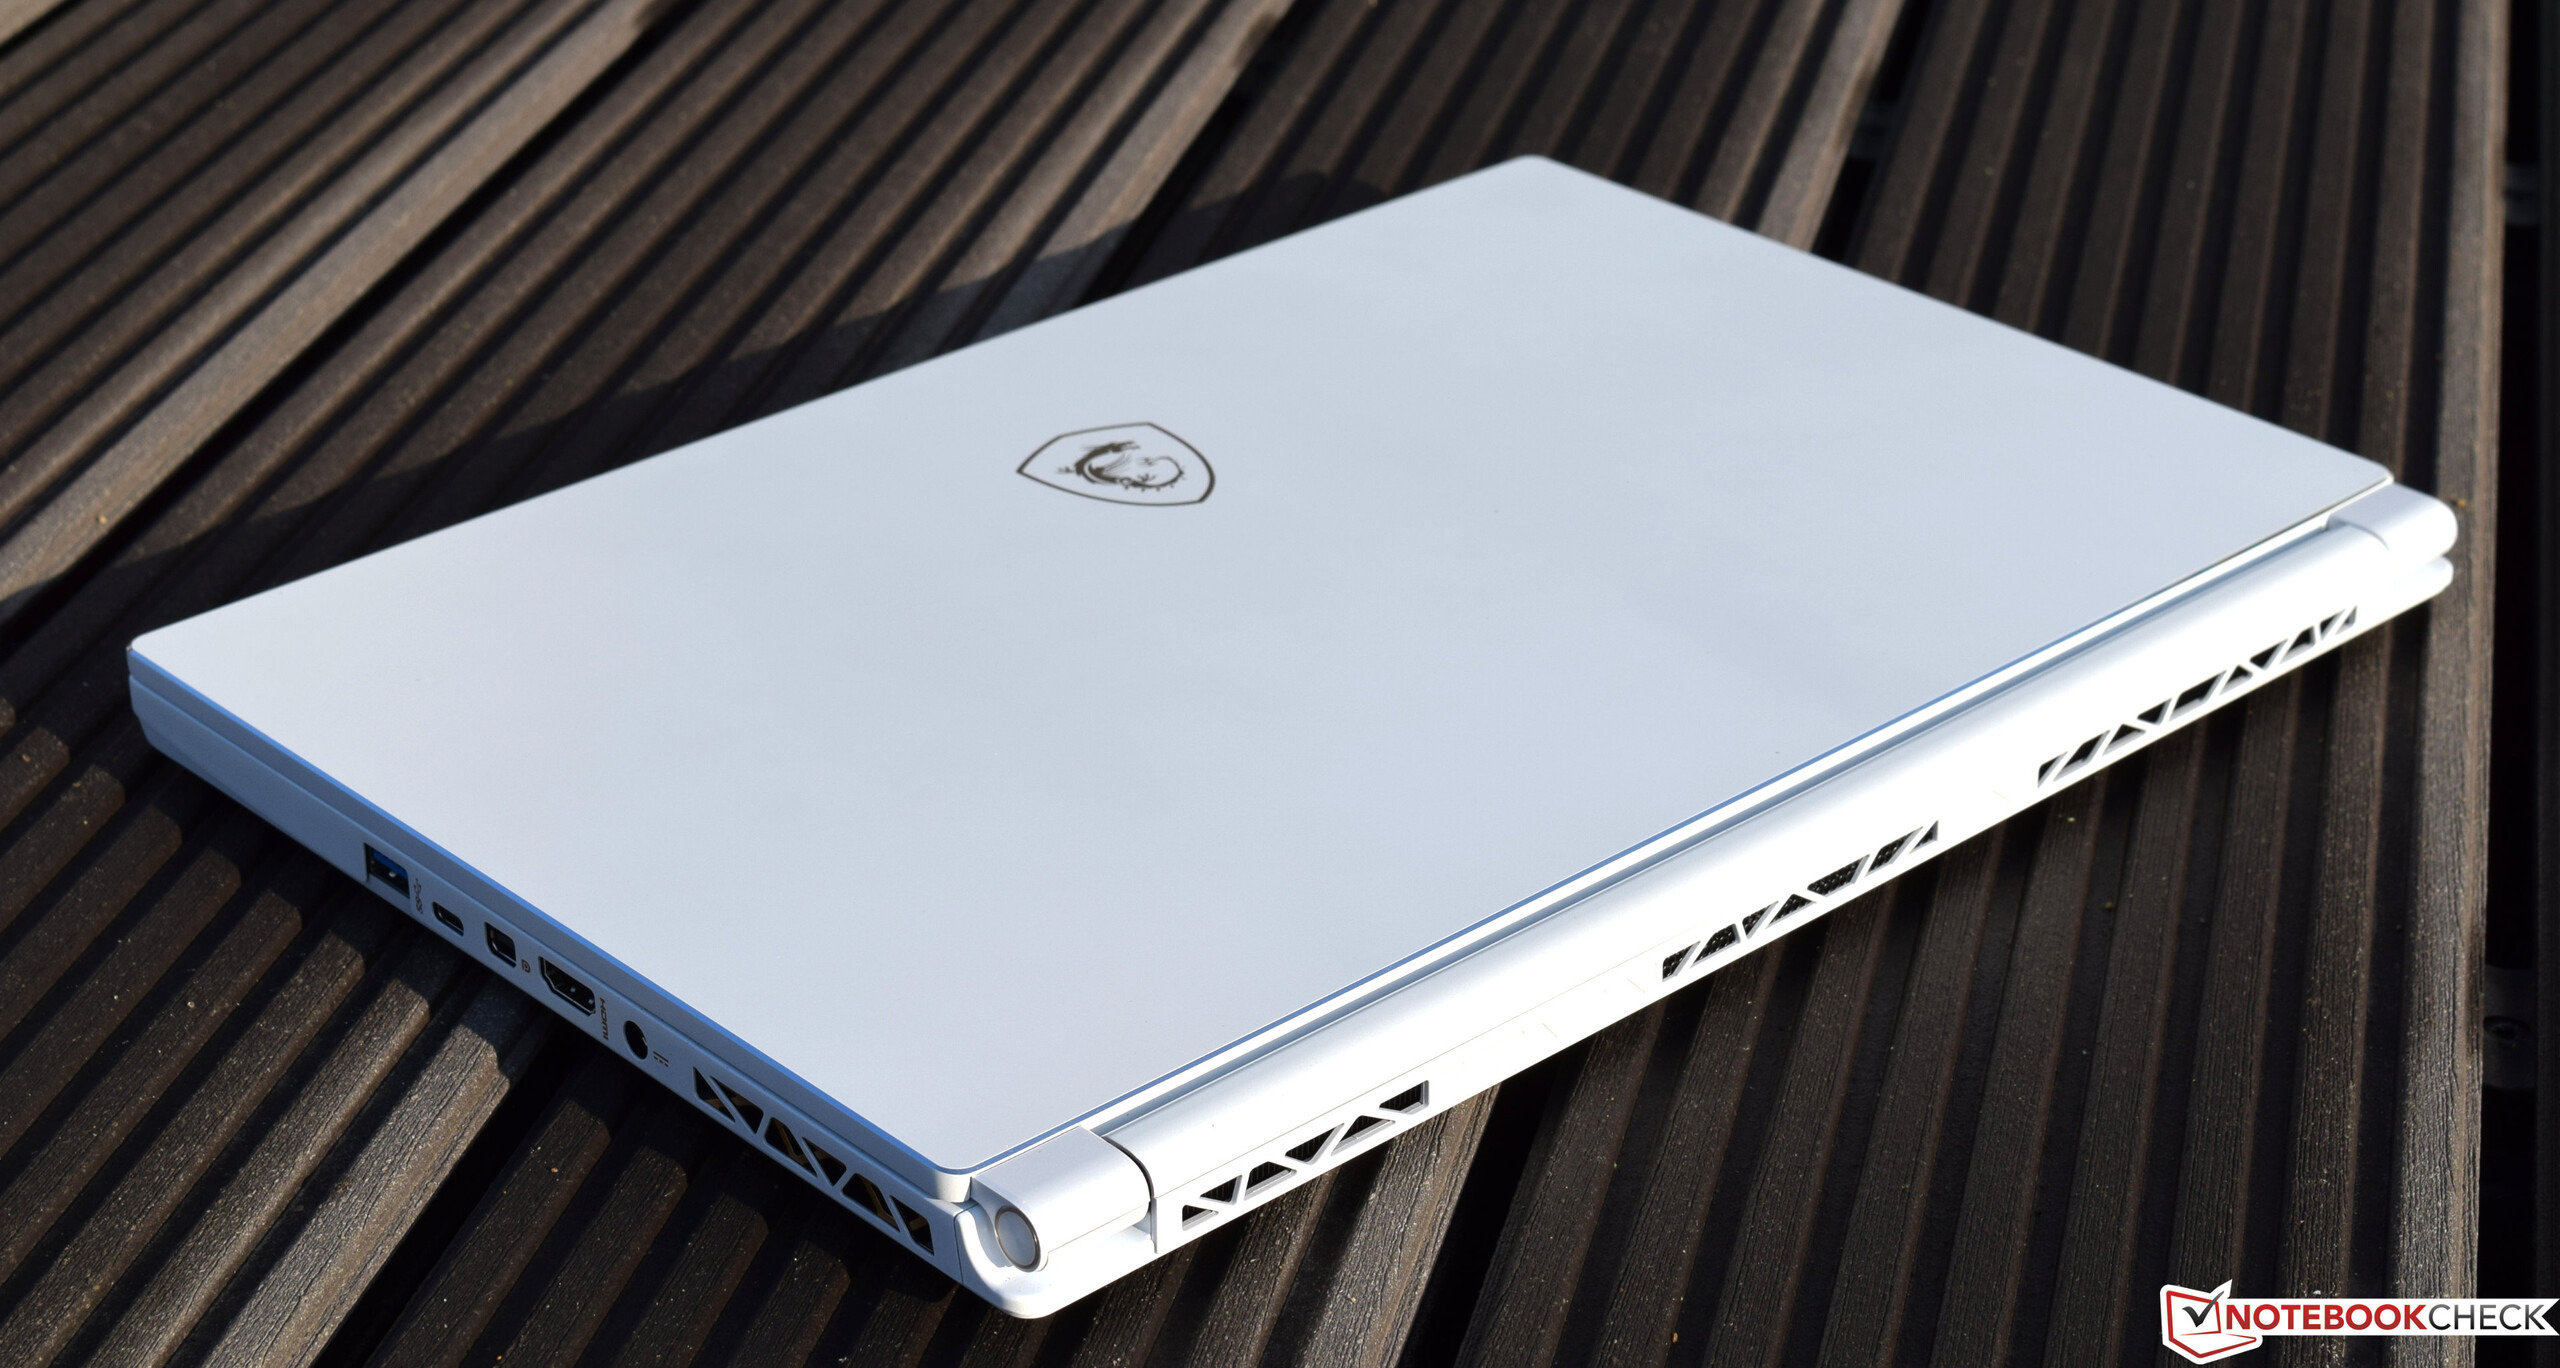
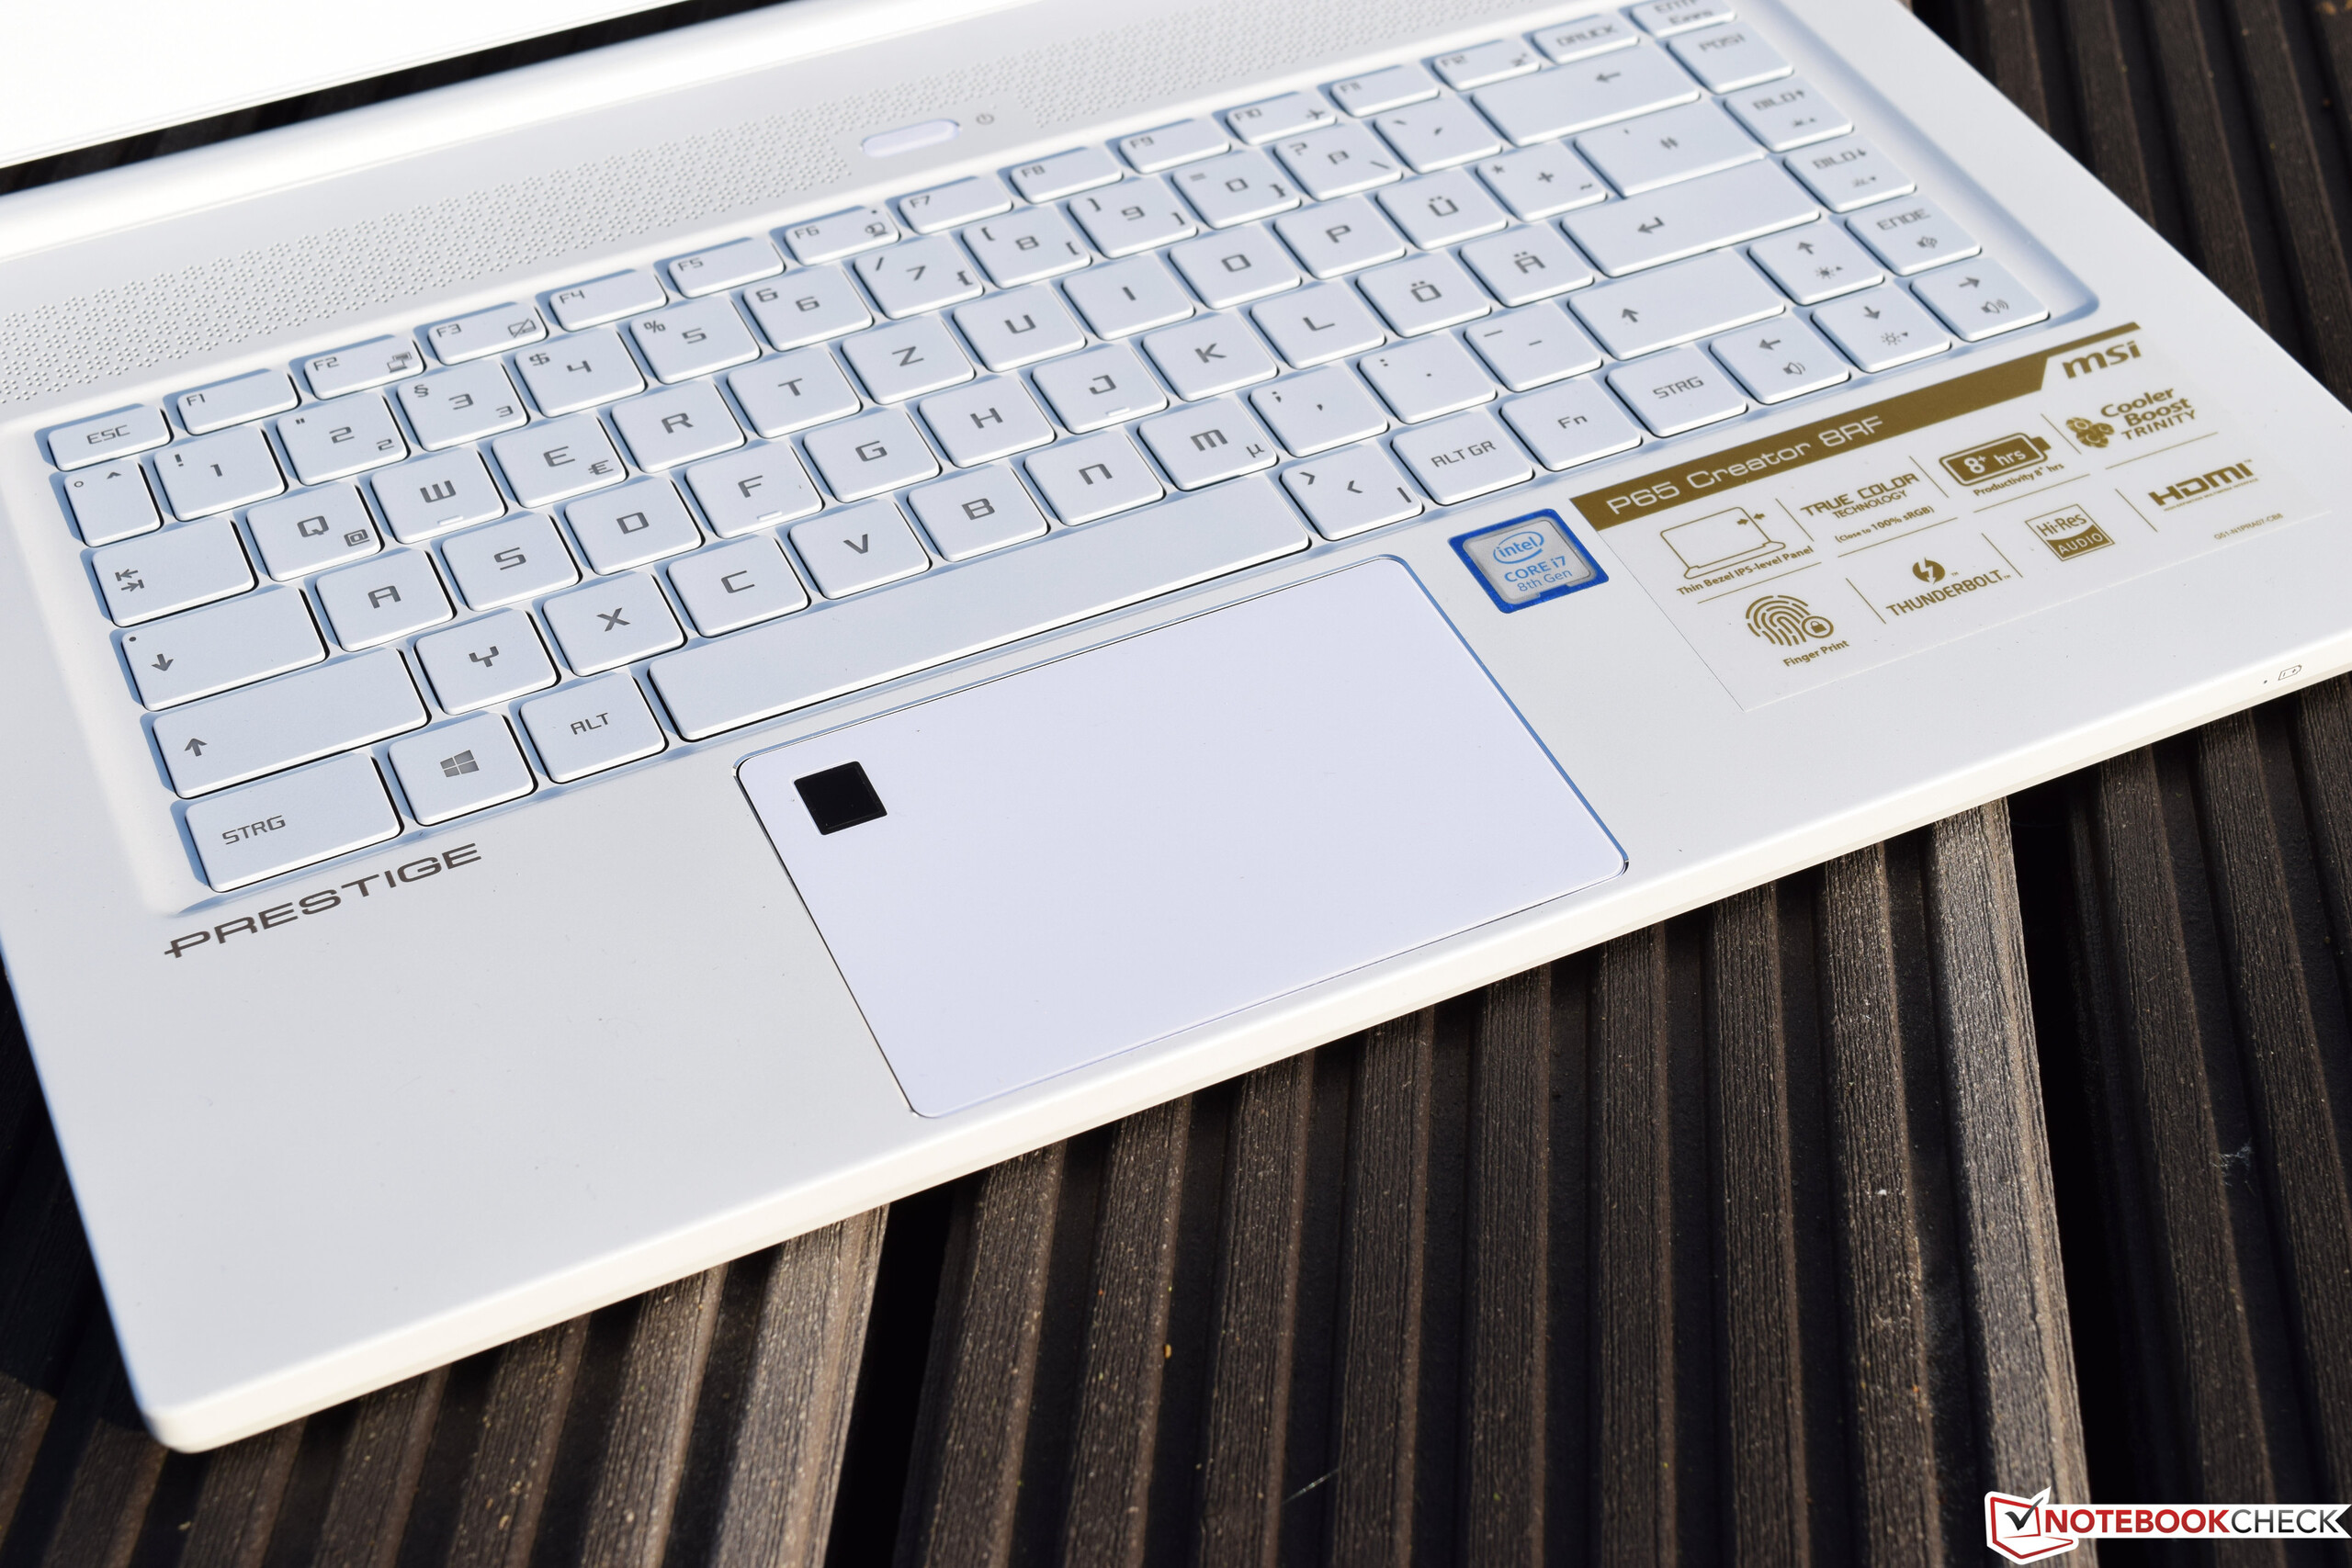
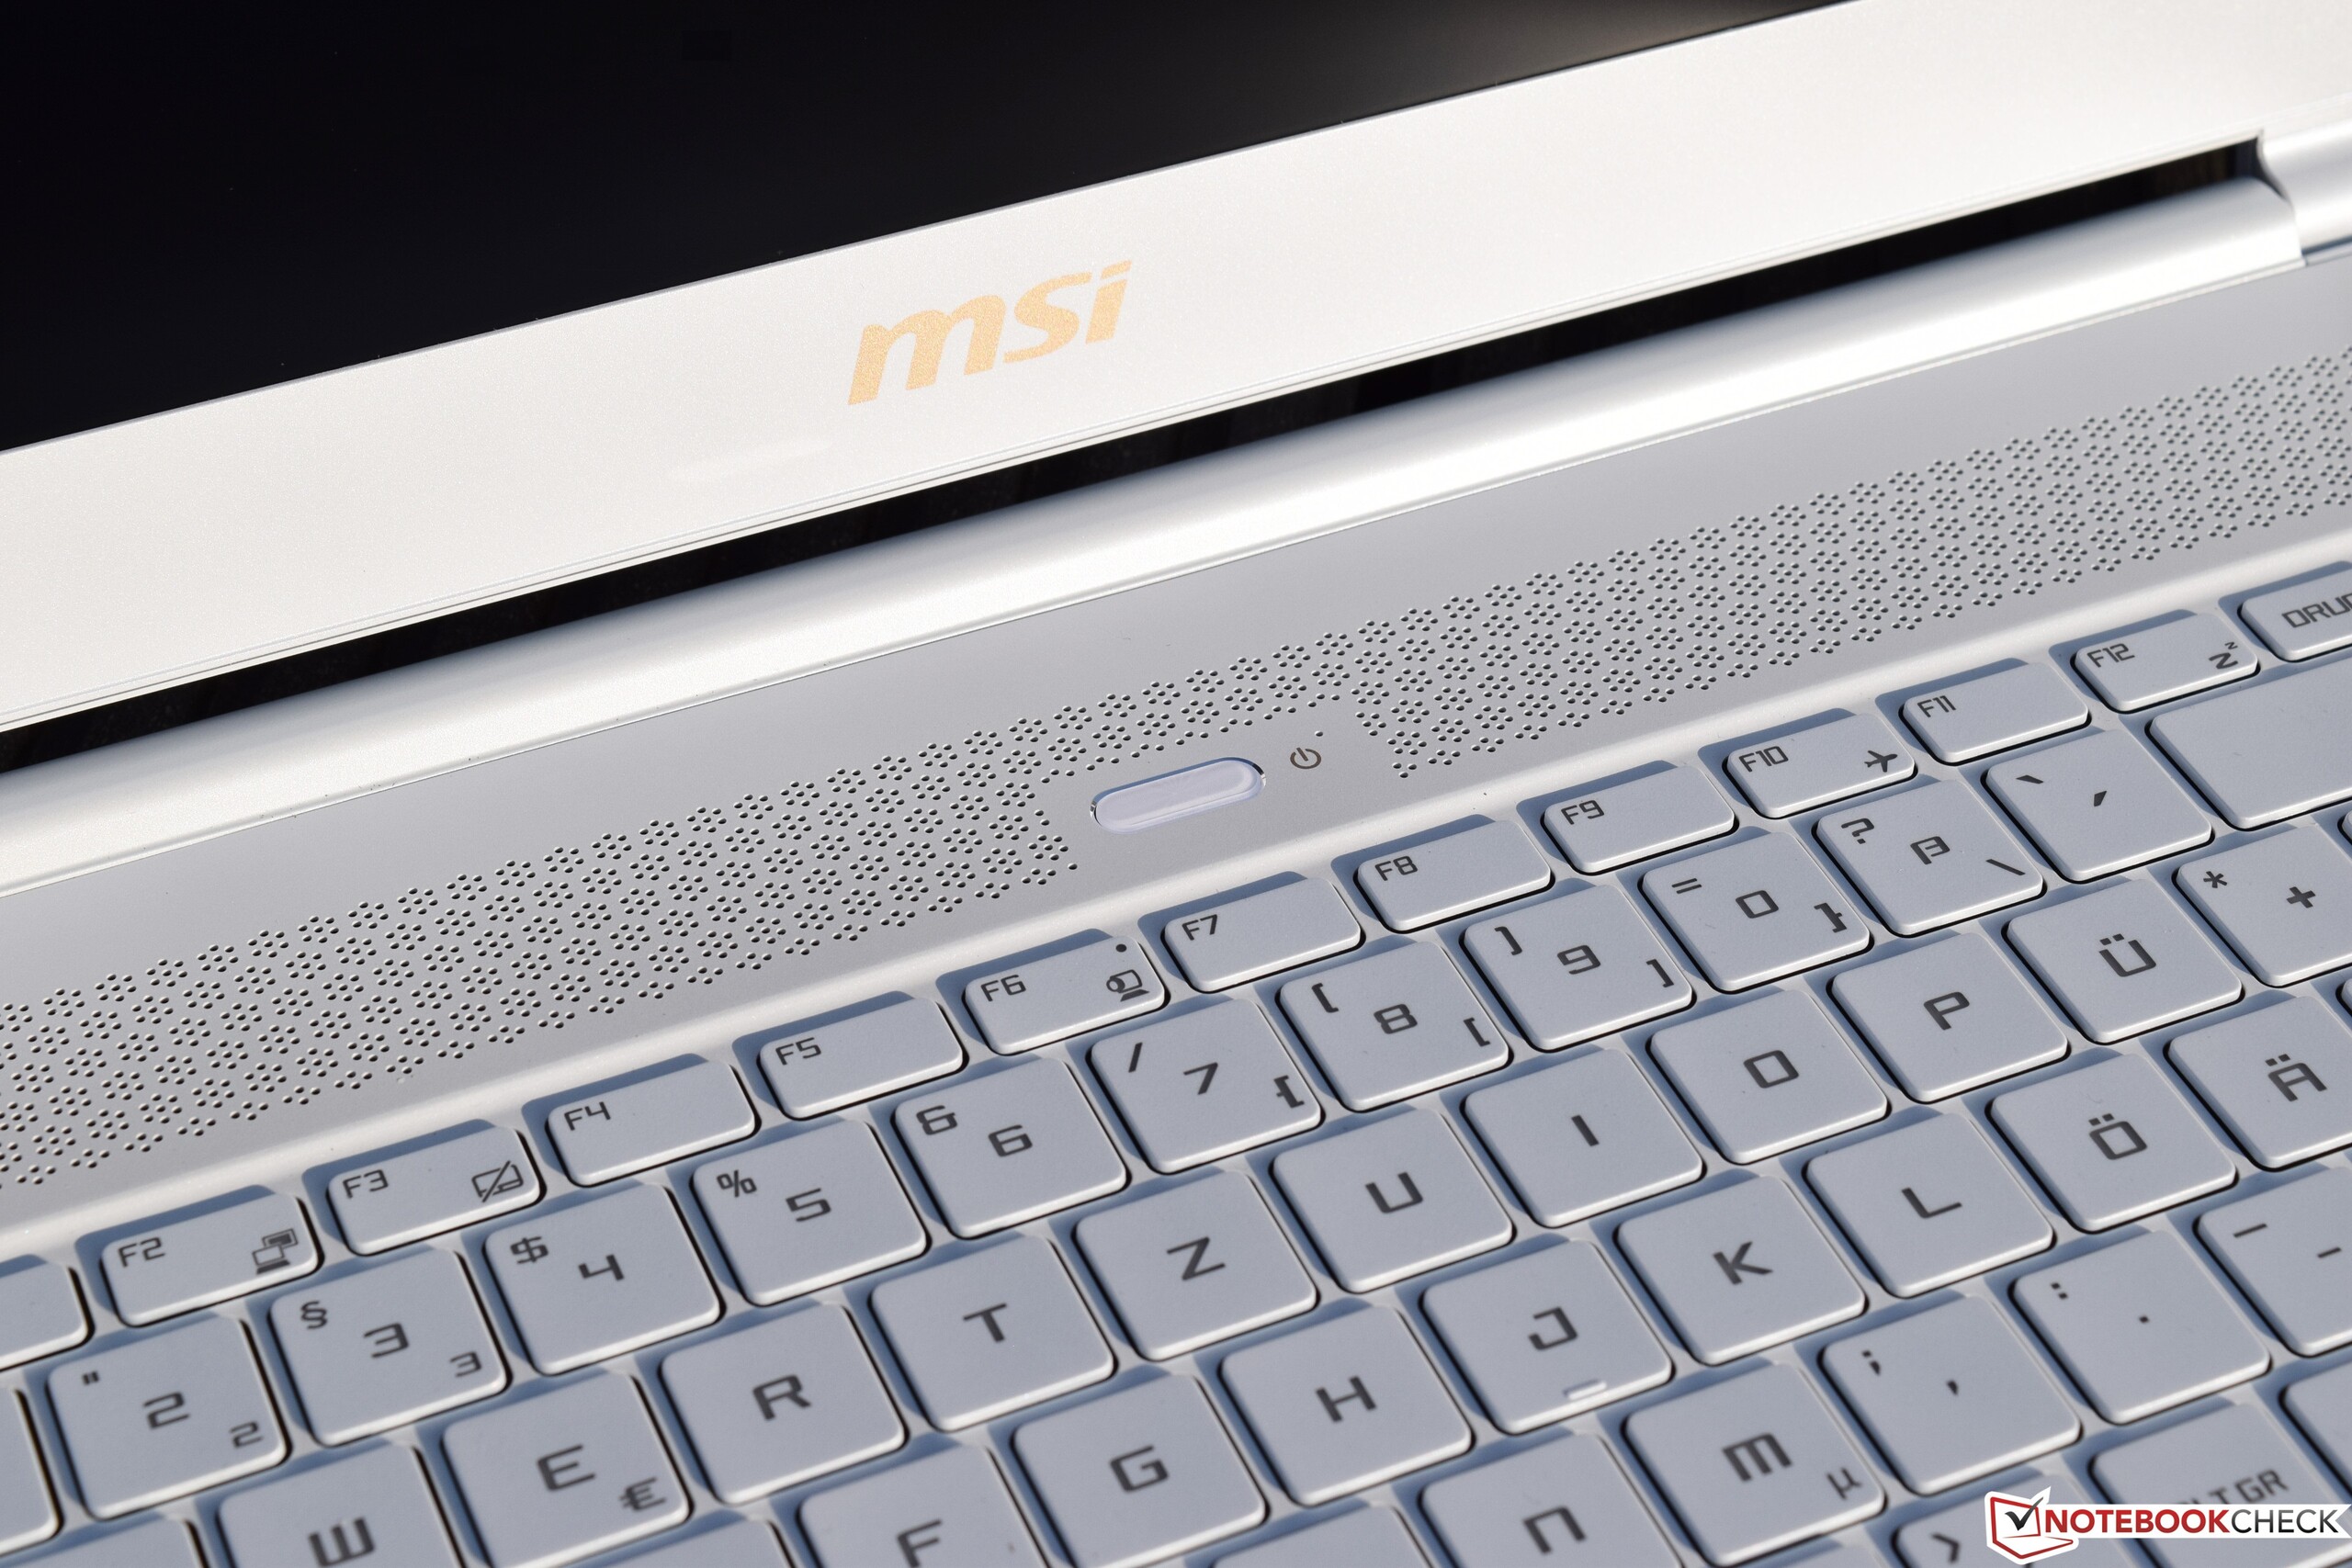
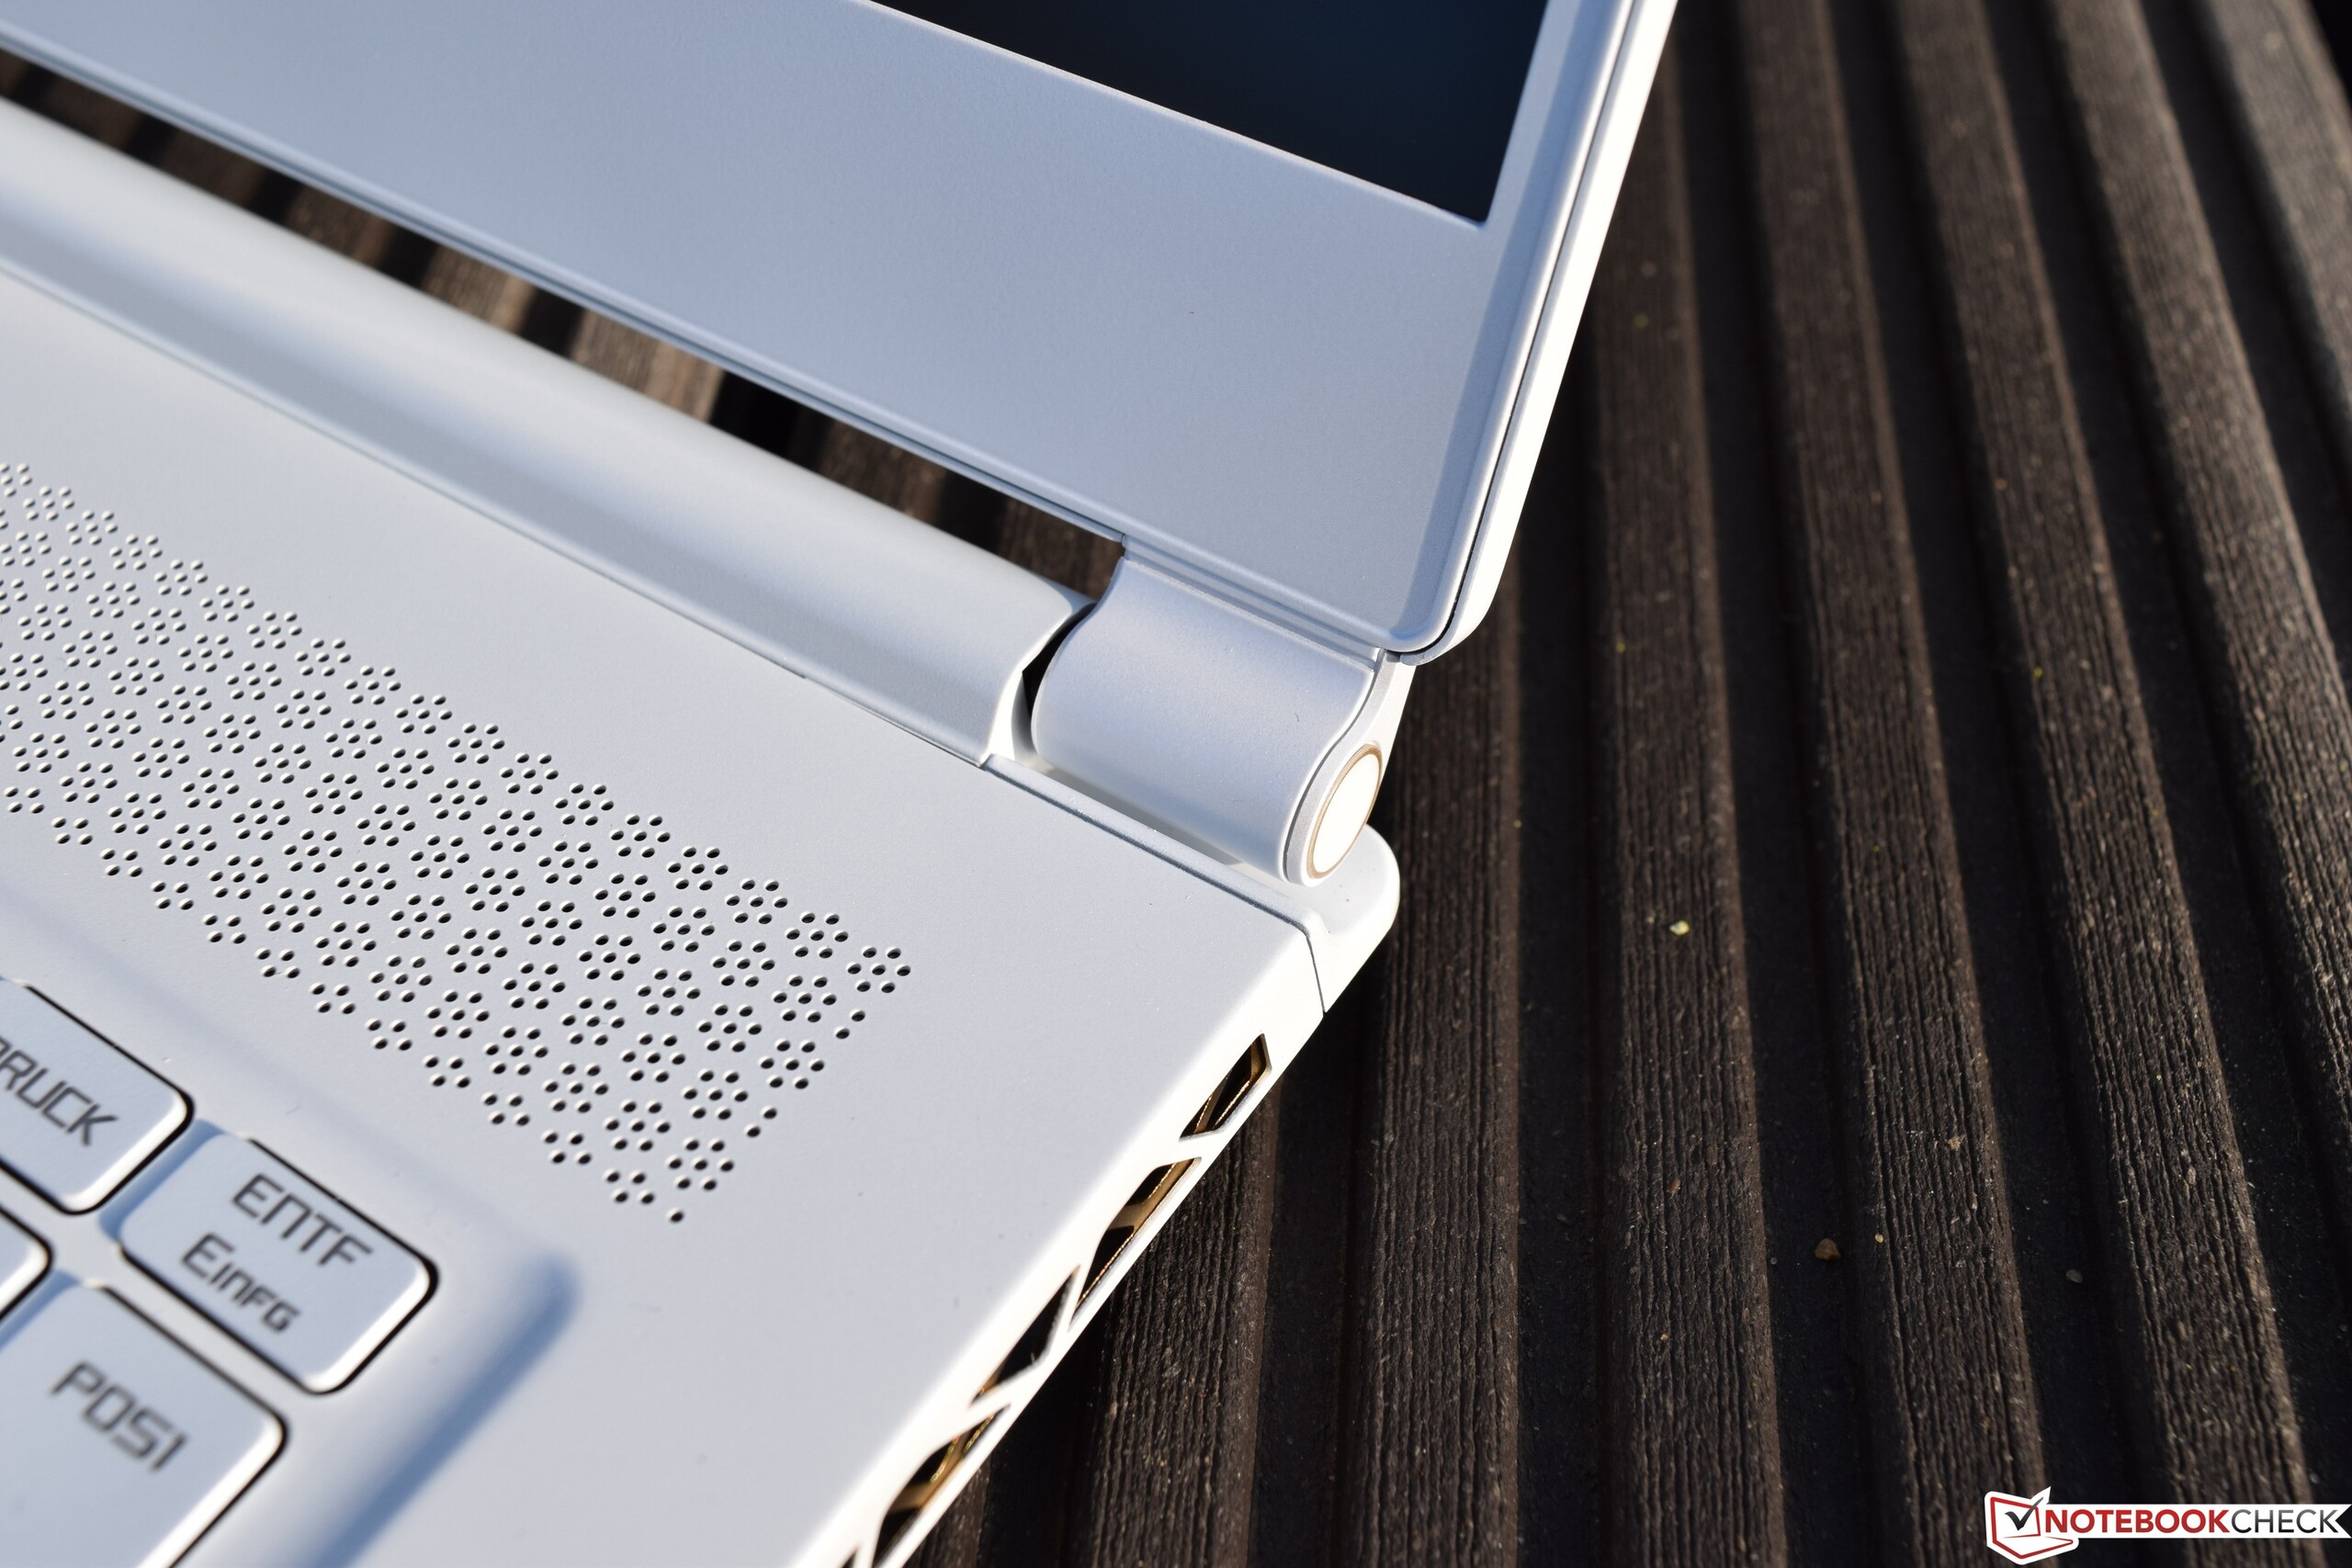
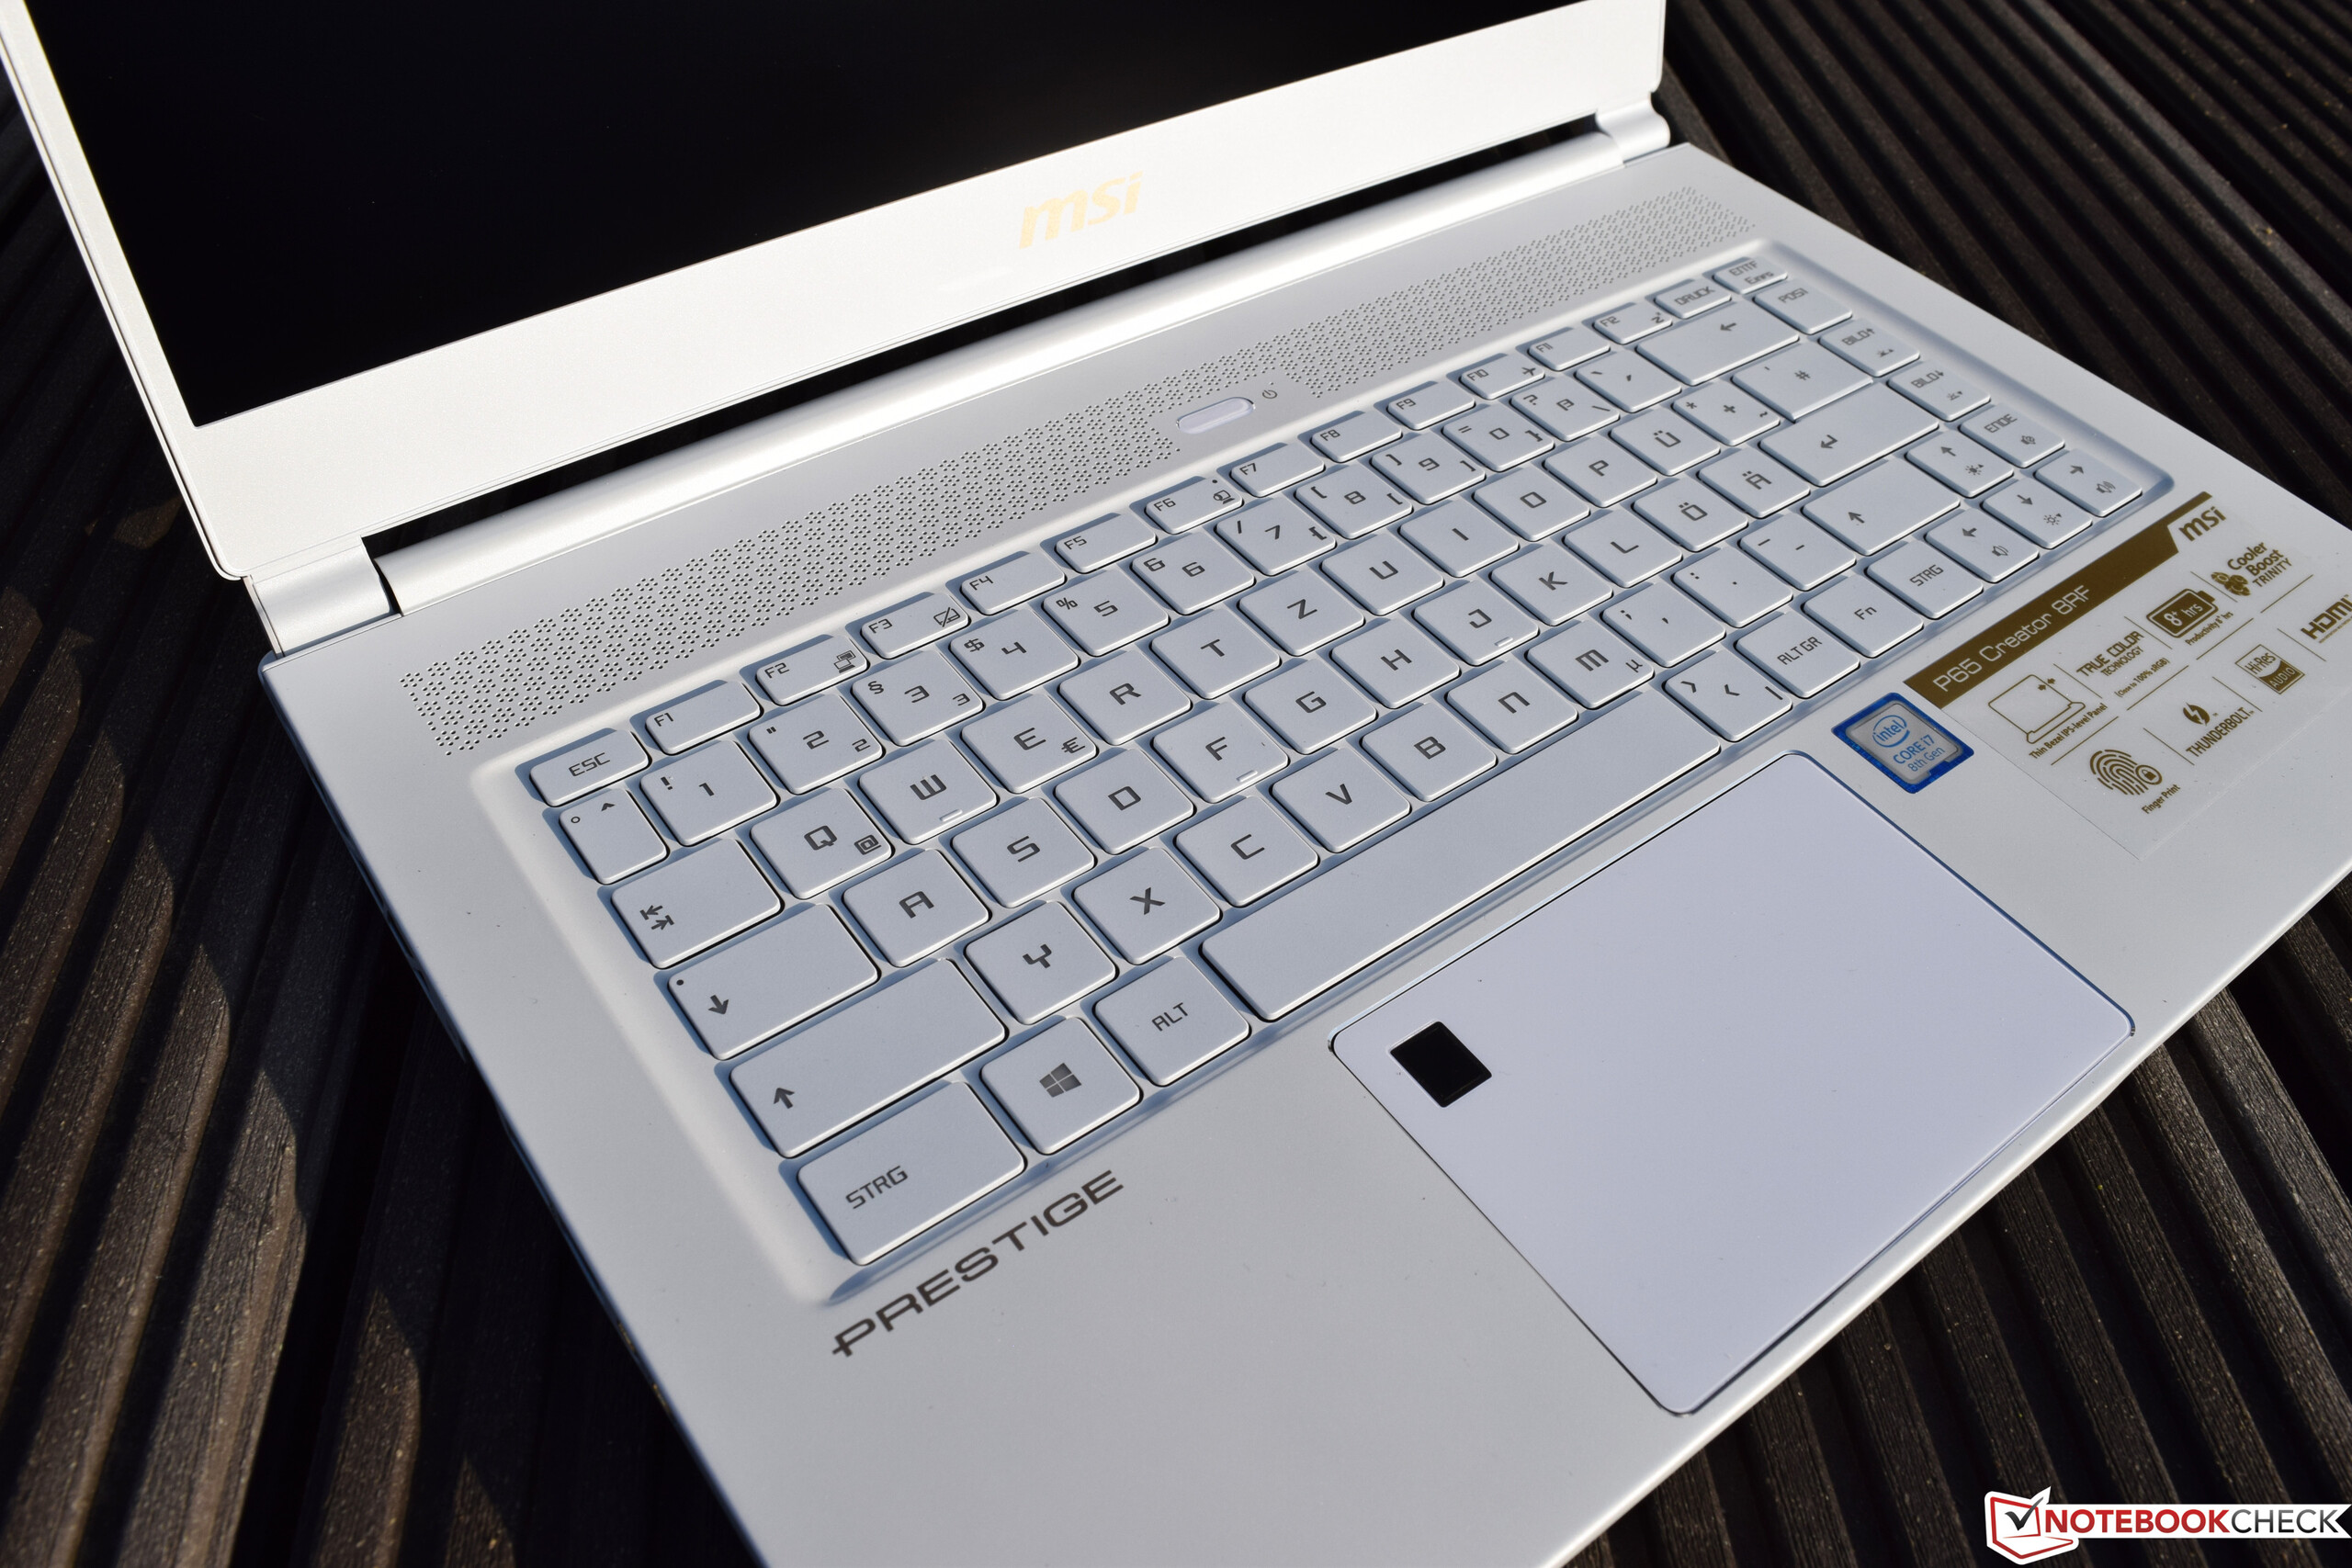
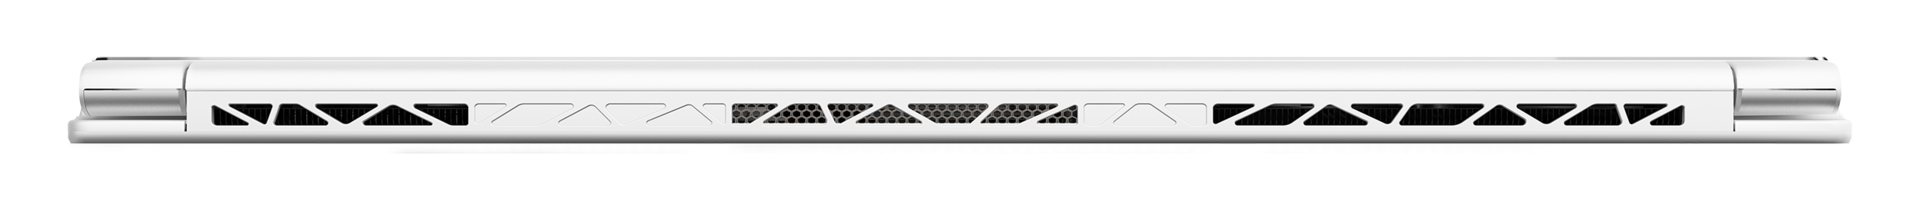
De behuizing is een goed compromis tussen mobiliteit en stijfheid. Het gebruikte materiaal is zeer hoogwaardig, maar we hadden een meer robuust ontwerp gewenst. Het beeldscherm laat gemengde gevoelens achter. Aan de ene kant biedt het een 144 Hz paneel en snelle reactietijden. Aan de andere kant is het te donker en praktisch onbruikbaar buitenshuis. Het toetsenbord is ook niet het beste model dat we ooit getest hebben. De aanduiding is ongelooflijk moeilijk te lezen en de ongebruikelijke lay-out vergt meer wennen dan we zouden willen.
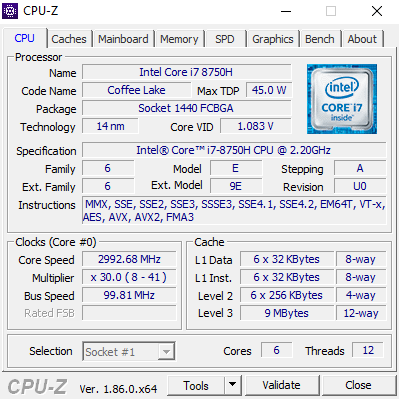
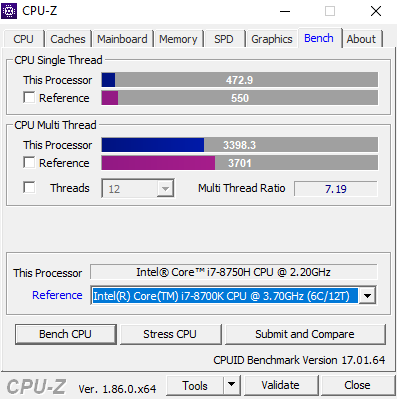
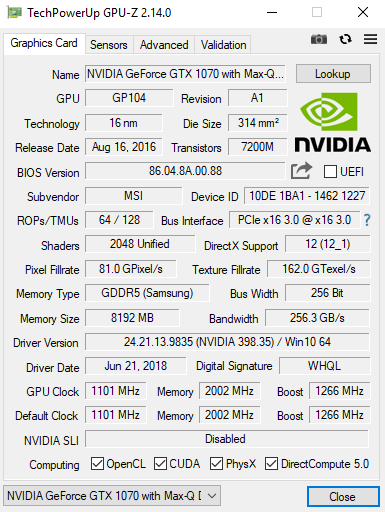
De prestaties liggen daarentegen zonder twijfel ongelooflijk hoog voor zo'n dun en licht apparaat. Intel's Core i7-8750H werkte goed ondanks het feit dat de prestaties ervan een beetje te lijden hadden onder langdurige belasting, en Nvidia's GeForce GTX 1070 Max-Q bood gezien de dunne behuizing ongelooflijke prestaties.
Met een adviesprijs van meer dan $2300 kost het model ongeveer net zoveel als de GS65 8RF, maar het biedt een paar extra's zoals de vingerafdruklezer en verlengde garantietermijn. Als u het typische zwarte ontwerp en de RGB-bling wilt vermijden, is de P65 een goed alternatief.
Als u besluit om de P65 Creator aan te schaffen, levert MSI ook een softwarebundle ter waarde van meer dan $300 om je op weg te helpen met creatieve processen (geldig tot 31 december 2018).
MSI P65 8RF-451 - Creator
- 10-11-2018 v6 (old)
Sebastian Bade
Price comparison
