Kort testrapport Dell XPS 15 7590 Core i9 en GeForce GTX 1650 OLED Laptop: overweldigende kracht
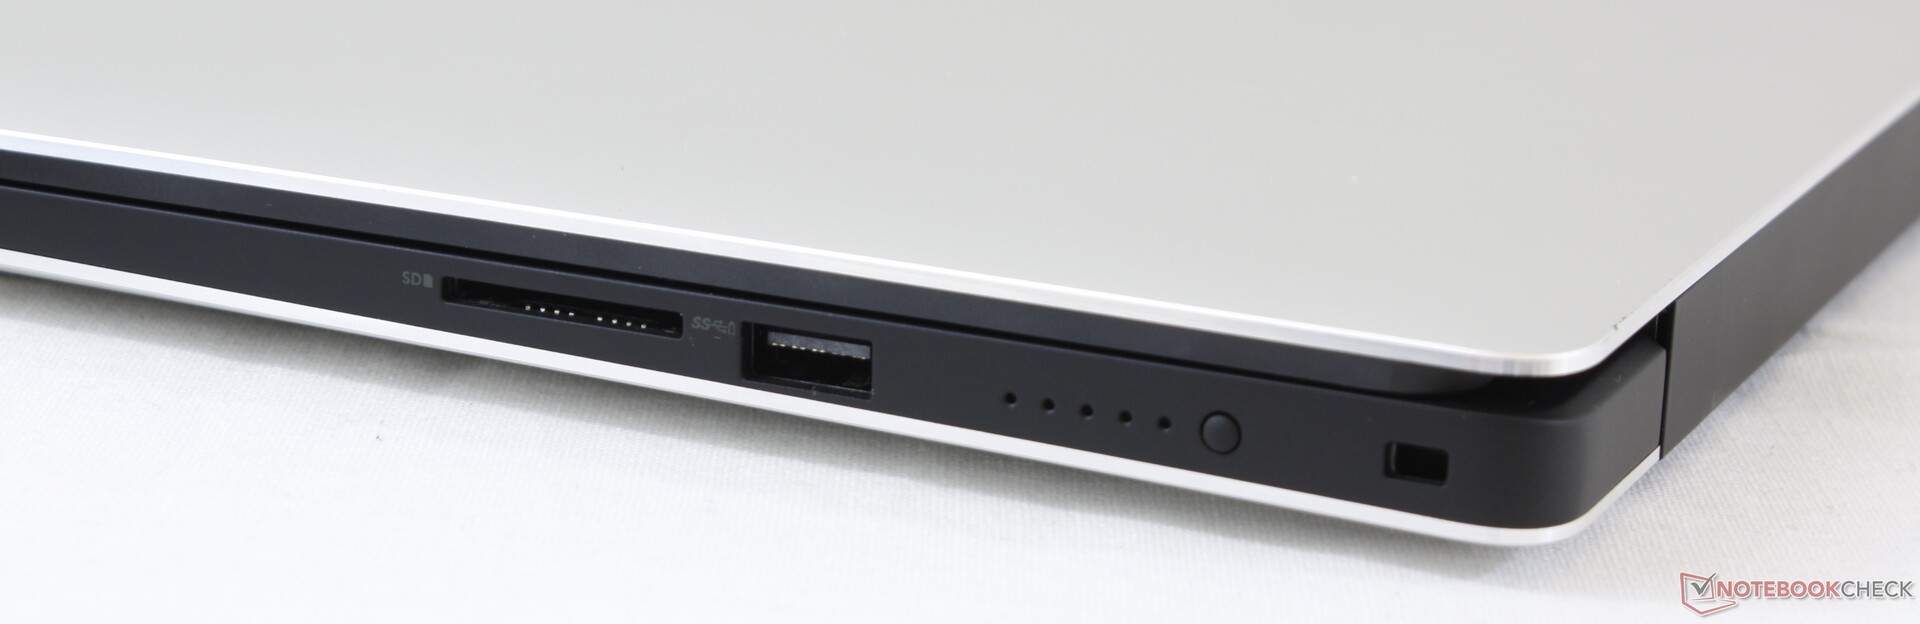
| SD Card Reader | |
| average JPG Copy Test (av. of 3 runs) | |
| Gigabyte Aero 15 OLED XA (Toshiba Exceria Pro SDXC 64 GB UHS-II) | |
| Dell XPS 15 9570 Core i9 UHD (Toshiba Exceria Pro SDXC 64 GB UHS-II) | |
| Dell XPS 15 7590 9980HK GTX 1650 (Toshiba Exceria Pro SDXC 64 GB UHS-II) | |
| HP Spectre x360 15-df0126ng (Toshiba Exceria Pro M501 microSDXC 64GB) | |
| Asus ZenBook 15 UX533FD (Toshiba Exceria Pro SDXC 64 GB UHS-II) | |
| maximum AS SSD Seq Read Test (1GB) | |
| Gigabyte Aero 15 OLED XA (Toshiba Exceria Pro SDXC 64 GB UHS-II) | |
| Dell XPS 15 9570 Core i9 UHD (Toshiba Exceria Pro SDXC 64 GB UHS-II) | |
| HP Spectre x360 15-df0126ng (Toshiba Exceria Pro M501 microSDXC 64GB) | |
| Dell XPS 15 7590 9980HK GTX 1650 (Toshiba Exceria Pro SDXC 64 GB UHS-II) | |
| Asus ZenBook 15 UX533FD (Toshiba Exceria Pro SDXC 64 GB UHS-II) | |
| |||||||||||||||||||||||||
Helderheidsverdeling: 94 %
Helderheid in Batterij-modus: 418.4 cd/m²
Contrast: ∞:1 (Zwart: 0 cd/m²)
ΔE ColorChecker Calman: 6.06 | ∀{0.5-29.43 Ø4.71}
ΔE Greyscale Calman: 2.8 | ∀{0.09-98 Ø4.96}
99.6% sRGB (Argyll 1.6.3 3D)
81% AdobeRGB 1998 (Argyll 1.6.3 3D)
91.8% AdobeRGB 1998 (Argyll 3D)
99.6% sRGB (Argyll 3D)
88.1% Display P3 (Argyll 3D)
Gamma: 2.15
CCT: 6235 K
| Dell XPS 15 7590 9980HK GTX 1650 Samsung 156WR04, SDCA029, OLED, 15.6", 3840x2160 | Dell XPS 15 9570 Core i9 UHD LQ156D1, IPS, 15.6", 3840x2160 | Asus ZenBook 15 UX533FD BOE07D8, IPS, 15.6", 1920x1080 | HP Spectre x360 15-df0126ng AU Optronics AUO30EB, IPS, 15.6", 3840x2160 | Gigabyte Aero 15 OLED XA Samsung SDCA029, OLED, 15.6", 3840x2160 | Razer Blade 15 RTX 2080 Max-Q Sharp LQ156M1JW03 (SHP14C5), IPS, 15.6", 1920x1080 | |
|---|---|---|---|---|---|---|
| Display | -8% | -22% | -18% | -17% | ||
| Display P3 Coverage (%) | 88.1 | 79.6 -10% | 67.2 -24% | 68.1 -23% | 66.9 -24% | |
| sRGB Coverage (%) | 99.6 | 98.4 -1% | 88.4 -11% | 94.2 -5% | 98.1 -2% | |
| AdobeRGB 1998 Coverage (%) | 91.8 | 79.7 -13% | 64.6 -30% | 68.4 -25% | 68.5 -25% | |
| Response Times | -1698% | -1650% | -1785% | 2% | -395% | |
| Response Time Grey 50% / Grey 80% * (ms) | 2.3 ? | 52.4 ? -2178% | 45 ? -1857% | 57 ? -2378% | 2.4 ? -4% | 12.8 ? -457% |
| Response Time Black / White * (ms) | 2.4 ? | 31.6 ? -1217% | 37 ? -1442% | 31 ? -1192% | 2.2 ? 8% | 10.4 ? -333% |
| PWM Frequency (Hz) | 59.5 ? | 1000 ? | 60 ? | 23810 ? | ||
| Screen | -28% | -18% | -9% | 7% | 8% | |
| Brightness middle (cd/m²) | 421.2 | 451.9 7% | 311 -26% | 330 -22% | 373 -11% | 293 -30% |
| Brightness (cd/m²) | 417 | 414 -1% | 303 -27% | 310 -26% | 375 -10% | 270 -35% |
| Brightness Distribution (%) | 94 | 81 -14% | 81 -14% | 87 -7% | 93 -1% | 87 -7% |
| Black Level * (cd/m²) | 0.36 | 0.24 | 0.37 | 0.29 | ||
| Colorchecker dE 2000 * | 6.06 | 5.62 7% | 5.1 16% | 4.03 33% | 3.98 34% | 1.69 72% |
| Colorchecker dE 2000 max. * | 11.89 | 19.1 -61% | 8.91 25% | 6.74 43% | 6.28 47% | 3.37 72% |
| Greyscale dE 2000 * | 2.8 | 6.9 -146% | 4.93 -76% | 4.49 -60% | 2.81 -0% | 2.3 18% |
| Gamma | 2.15 102% | 2.2 100% | 2.44 90% | 2.57 86% | 2.62 84% | 2.3 96% |
| CCT | 6235 104% | 6254 104% | 7641 85% | 6744 96% | 6434 101% | 6758 96% |
| Color Space (Percent of AdobeRGB 1998) (%) | 81 | 71.8 -11% | 58 -28% | 61 -25% | 78 -4% | 63 -22% |
| Color Space (Percent of sRGB) (%) | 99.6 | 98.5 -1% | 88 -12% | 94 -6% | 97 -3% | 98.5 -1% |
| Contrast (:1) | 1255 | 1296 | 892 | 1010 | ||
| Colorchecker dE 2000 calibrated * | 2.69 | 2.48 | 1.96 | 1.24 | ||
| Totaal Gemiddelde (Programma / Instellingen) | -578% /
-280% | -563% /
-270% | -604% /
-284% | 5% /
6% | -135% /
-60% |
* ... kleiner is beter
Responstijd Scherm
| ↔ Responstijd Zwart naar Wit | ||
|---|---|---|
| 2.4 ms ... stijging ↗ en daling ↘ gecombineerd | ↗ 1.1 ms stijging | 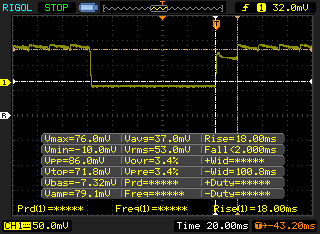 |
| ↘ 1.3 ms daling | ||
| Het scherm vertoonde erg snelle responstijden in onze tests en zou zeer geschikt moeten zijn voor snelle games. Ter vergelijking: alle testtoestellen variëren van 0.1 (minimum) tot 240 (maximum) ms. » 13 % van alle toestellen zijn beter. Dit betekent dat de gemeten responstijd beter is dan het gemiddelde (19.8 ms) van alle geteste toestellen. | ||
| ↔ Responstijd 50% Grijs naar 80% Grijs | ||
| 2.3 ms ... stijging ↗ en daling ↘ gecombineerd | ↗ 1.1 ms stijging | 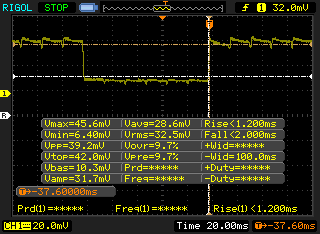 |
| ↘ 1.2 ms daling | ||
| Het scherm vertoonde erg snelle responstijden in onze tests en zou zeer geschikt moeten zijn voor snelle games. Ter vergelijking: alle testtoestellen variëren van 0.165 (minimum) tot 636 (maximum) ms. » 11 % van alle toestellen zijn beter. Dit betekent dat de gemeten responstijd beter is dan het gemiddelde (30.9 ms) van alle geteste toestellen. | ||
Screen Flickering / PWM (Pulse-Width Modulation)
| Screen flickering / PWM waargenomen | 59.5 Hz | ≤ 100 % helderheid instelling | 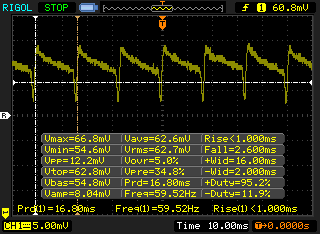 |
De achtergrondverlichting van het scherm flikkert op 59.5 Hz (in het slechtste geval, bijvoorbeeld bij gebruik van PWM) aan een helderheid van 100 % en lager. Boven deze helderheid zou er geen flickering / PWM mogen optreden. De frequentie van 59.5 Hz is erg laag en kan dus aanleiding geven tot geïrriteerde ogen en hoofdpijn bij langer gebruik. Ter vergelijking: 52 % van alle geteste toestellen maakten geen gebruik van PWM om de schermhelderheid te verlagen. Als het wel werd gebruikt, werd een gemiddelde van 7744 (minimum: 5 - maximum: 343500) Hz waargenomen. | |||
| wPrime 2.10 - 1024m | |
| Asus ROG Zephyrus G15 GA502DU | |
| Eurocom Sky X4C | |
| Gemiddeld Intel Core i9-9980HK (110.4 - 120.2, n=2) | |
* ... kleiner is beter
| PCMark 8 Home Score Accelerated v2 | 3799 punten | |
| PCMark 8 Work Score Accelerated v2 | 4762 punten | |
| PCMark 10 Score | 5469 punten | |
Help | ||
| Dell XPS 15 7590 9980HK GTX 1650 Toshiba XG6 KXG60ZNV1T02 | Dell XPS 15 9570 Core i9 UHD Samsung SSD PM981 MZVLB1T0HALR | Asus ZenBook 15 UX533FD WDC PC SN520 SDAPNUW-512G | HP Spectre x360 15-df0126ng Toshiba XG5-P KXG50PNV2T04 | Gigabyte Aero 15 OLED XA Intel SSD 600p SSDPEKKW512G8L | |
|---|---|---|---|---|---|
| AS SSD | -4% | -22% | -45% | -4% | |
| Seq Read (MB/s) | 1723 | 1320 -23% | 579 -66% | 2018 17% | 2095 22% |
| Seq Write (MB/s) | 1386 | 1500 8% | 411.8 -70% | 773 -44% | 1464 6% |
| 4K Read (MB/s) | 43.25 | 30.73 -29% | 41.81 -3% | 24.62 -43% | 56.8 31% |
| 4K Write (MB/s) | 98.3 | 94.4 -4% | 131.6 34% | 92.8 -6% | 109.8 12% |
| 4K-64 Read (MB/s) | 1078 | 1453 35% | 975 -10% | 845 -22% | 871 -19% |
| 4K-64 Write (MB/s) | 1456 | 1815 25% | 1047 -28% | 957 -34% | 773 -47% |
| Access Time Read * (ms) | 0.05 | 0.061 -22% | 0.08 -60% | 0.147 -194% | 0.045 10% |
| Access Time Write * (ms) | 0.039 | 0.044 -13% | 0.027 31% | 0.057 -46% | 0.033 15% |
| Score Read (Points) | 1294 | 1616 25% | 1075 -17% | 1071 -17% | 1137 -12% |
| Score Write (Points) | 1693 | 2059 22% | 1220 -28% | 1127 -33% | 1029 -39% |
| Score Total (Points) | 3638 | 4507 24% | 2845 -22% | 2684 -26% | 2732 -25% |
| Copy ISO MB/s (MB/s) | 3182 | 2577 -19% | 1652 -48% | ||
| Copy Program MB/s (MB/s) | 984 | 515 -48% | 328.5 -67% | ||
| Copy Game MB/s (MB/s) | 1824 | 1120 -39% | 700 -62% |
* ... kleiner is beter

| 3DMark 11 Performance | 12340 punten | |
| 3DMark Cloud Gate Standard Score | 30573 punten | |
| 3DMark Fire Strike Score | 7356 punten | |
| 3DMark Time Spy Score | 3676 punten | |
Help | ||
| Shadow of the Tomb Raider - 1920x1080 Highest Preset AA:T | |
| Alienware Area-51m i9-9900K RTX 2080 | |
| MSI GE75 9SG | |
| Razer Blade Pro 17 RTX 2060 | |
| Gigabyte Aero 15 OLED XA | |
| HP Pavilion Gaming 17-cd0085cl | |
| MSI GF75 Thin 9SC | |
| Gemiddeld NVIDIA GeForce GTX 1650 Mobile (34 - 47, n=15) | |
| Asus Zephyrus S GX531GM | |
| Asus G752VY | |
| Dell XPS 15 7590 9980HK GTX 1650 | |
| Asus TUF FX705GE-EW096T | |
| Rocket League - 1920x1080 High Quality AA:High FX | |
| Gemiddeld NVIDIA GeForce GTX 1650 Mobile (96.4 - 162.2, n=6) | |
| HP Spectre x360 15-df0126ng | |
| Asus GL703GE-ES73 | |
| Dell XPS 15 7590 9980HK GTX 1650 | |
| lage | gem. | hoge | ultra | 4K | |
|---|---|---|---|---|---|
| BioShock Infinite (2013) | 342.5 | 223.4 | 171.8 | 68.5 | |
| The Witcher 3 (2015) | 183.5 | 111.5 | 64.8 | 36 | |
| Rocket League (2017) | 248 | 152.5 | 96.4 | 41.1 | |
| Shadow of the Tomb Raider (2018) | 111 | 42 | 38 | 34 | 14 |
| Dell XPS 15 7590 9980HK GTX 1650 GeForce GTX 1650 Mobile, i9-9980HK, Toshiba XG6 KXG60ZNV1T02 | Dell XPS 15 9570 Core i9 UHD GeForce GTX 1050 Ti Max-Q, i9-8950HK, Samsung SSD PM981 MZVLB1T0HALR | Asus ZenBook 15 UX533FD GeForce GTX 1050 Max-Q, i7-8565U, WDC PC SN520 SDAPNUW-512G | HP Spectre x360 15-df0126ng GeForce GTX 1050 Ti Max-Q, i7-8750H, Toshiba XG5-P KXG50PNV2T04 | Gigabyte Aero 15 OLED XA GeForce RTX 2070 Max-Q, i7-9750H, Intel SSD 600p SSDPEKKW512G8L | Razer Blade 15 RTX 2080 Max-Q GeForce RTX 2080 Max-Q, i7-9750H, Samsung SSD PM981 MZVLB512HAJQ | |
|---|---|---|---|---|---|---|
| Noise | 3% | -1% | -1% | -17% | 5% | |
| uit / omgeving * (dB) | 28.2 | 28.2 -0% | 30.5 -8% | 30.4 -8% | 30 -6% | 28.3 -0% |
| Idle Minimum * (dB) | 28.2 | 28.5 -1% | 30.5 -8% | 30.4 -8% | 34 -21% | 28.8 -2% |
| Idle Average * (dB) | 28.2 | 28.6 -1% | 30.5 -8% | 30.4 -8% | 35 -24% | 28.8 -2% |
| Idle Maximum * (dB) | 30.4 | 28.8 5% | 30.5 -0% | 31.6 -4% | 45 -48% | 29 5% |
| Load Average * (dB) | 43.8 | 36.2 17% | 40.8 7% | 43.2 1% | 43 2% | 33.5 24% |
| Witcher 3 ultra * (dB) | 47.2 | 47.6 -1% | 52 -10% | 45 5% | ||
| Load Maximum * (dB) | 47.2 | 47.6 -1% | 41.8 11% | 38.3 19% | 54 -14% | 45.2 4% |
* ... kleiner is beter
Geluidsniveau
| Onbelast |
| 28.2 / 28.2 / 30.4 dB (A) |
| Belasting |
| 43.8 / 47.2 dB (A) |
 | ||
30 dB stil 40 dB(A) hoorbaar 50 dB(A) luid |
||
min: | ||
(-) De maximumtemperatuur aan de bovenzijde bedraagt 50.4 °C / 123 F, vergeleken met het gemiddelde van 36.8 °C / 98 F, variërend van 21 tot 71 °C voor de klasse Multimedia.
(-) De bodem warmt op tot een maximum van 49.2 °C / 121 F, vergeleken met een gemiddelde van 39.1 °C / 102 F
(+) Bij onbelast gebruik bedraagt de gemiddelde temperatuur voor de bovenzijde 30.9 °C / 88 F, vergeleken met het apparaatgemiddelde van 31.3 °C / 88 F.
(-) Bij het spelen van The Witcher 3 is de gemiddelde temperatuur voor de bovenzijde 39.4 °C / 103 F, vergeleken met het apparaatgemiddelde van 31.3 °C / 88 F.
(+) De palmsteunen en het touchpad zijn met een maximum van ###max## °C / 89.2 F koeler dan de huidtemperatuur en voelen daarom koel aan.
(-) De gemiddelde temperatuur van de handpalmsteun van soortgelijke toestellen bedroeg 28.7 °C / 83.7 F (-3.1 °C / -5.5 F).
Dell XPS 15 7590 9980HK GTX 1650 audioanalyse
(+) | luidsprekers kunnen relatief luid spelen (88.4 dB)
Bas 100 - 315 Hz
(-) | bijna geen lage tonen - gemiddeld 24.9% lager dan de mediaan
(±) | lineariteit van de lage tonen is gemiddeld (14.4% delta ten opzichte van de vorige frequentie)
Midden 400 - 2000 Hz
(+) | evenwichtige middens - slechts 2.8% verwijderd van de mediaan
(±) | lineariteit van de middentonen is gemiddeld (7.8% delta ten opzichte van de vorige frequentie)
Hoog 2 - 16 kHz
(+) | evenwichtige hoogtepunten - slechts 1.9% verwijderd van de mediaan
(+) | de hoge tonen zijn lineair (5.3% delta naar de vorige frequentie)
Algemeen 100 - 16.000 Hz
(±) | lineariteit van het totale geluid is gemiddeld (17.8% verschil met de mediaan)
Vergeleken met dezelfde klasse
» 52% van alle geteste apparaten in deze klasse waren beter, 7% vergelijkbaar, 41% slechter
» De beste had een delta van 5%, het gemiddelde was 17%, de slechtste was 45%
Vergeleken met alle geteste toestellen
» 36% van alle geteste apparaten waren beter, 8% gelijk, 56% slechter
» De beste had een delta van 4%, het gemiddelde was 23%, de slechtste was 134%
Apple MacBook 12 (Early 2016) 1.1 GHz audioanalyse
(+) | luidsprekers kunnen relatief luid spelen (83.6 dB)
Bas 100 - 315 Hz
(±) | verminderde zeebaars - gemiddeld 11.3% lager dan de mediaan
(±) | lineariteit van de lage tonen is gemiddeld (14.2% delta ten opzichte van de vorige frequentie)
Midden 400 - 2000 Hz
(+) | evenwichtige middens - slechts 2.4% verwijderd van de mediaan
(+) | de middentonen zijn lineair (5.5% delta ten opzichte van de vorige frequentie)
Hoog 2 - 16 kHz
(+) | evenwichtige hoogtepunten - slechts 2% verwijderd van de mediaan
(+) | de hoge tonen zijn lineair (4.5% delta naar de vorige frequentie)
Algemeen 100 - 16.000 Hz
(+) | het totale geluid is lineair (10.2% verschil met de mediaan)
Vergeleken met dezelfde klasse
» 7% van alle geteste apparaten in deze klasse waren beter, 2% vergelijkbaar, 90% slechter
» De beste had een delta van 5%, het gemiddelde was 18%, de slechtste was 53%
Vergeleken met alle geteste toestellen
» 5% van alle geteste apparaten waren beter, 1% gelijk, 94% slechter
» De beste had een delta van 4%, het gemiddelde was 23%, de slechtste was 134%
| Uit / Standby | |
| Inactief | |
| Belasting |
|
Key:
min: | |
| Dell XPS 15 7590 9980HK GTX 1650 i9-9980HK, GeForce GTX 1650 Mobile, Toshiba XG6 KXG60ZNV1T02, OLED, 3840x2160, 15.6" | Dell XPS 15 9570 Core i9 UHD i9-8950HK, GeForce GTX 1050 Ti Max-Q, Samsung SSD PM981 MZVLB1T0HALR, IPS, 3840x2160, 15.6" | Asus ZenBook 15 UX533FD i7-8565U, GeForce GTX 1050 Max-Q, WDC PC SN520 SDAPNUW-512G, IPS, 1920x1080, 15.6" | HP Spectre x360 15-df0126ng i7-8750H, GeForce GTX 1050 Ti Max-Q, Toshiba XG5-P KXG50PNV2T04, IPS, 3840x2160, 15.6" | Gigabyte Aero 15 OLED XA i7-9750H, GeForce RTX 2070 Max-Q, Intel SSD 600p SSDPEKKW512G8L, OLED, 3840x2160, 15.6" | Razer Blade 15 RTX 2080 Max-Q i7-9750H, GeForce RTX 2080 Max-Q, Samsung SSD PM981 MZVLB512HAJQ, IPS, 1920x1080, 15.6" | MSI GF75 Thin 9SC i7-9750H, GeForce GTX 1650 Mobile, Crucial P1 SSD CT1000P1SSD8, IPS, 1920x1080, 17.3" | |
|---|---|---|---|---|---|---|---|
| Power Consumption | -6% | 37% | 34% | -101% | -46% | -13% | |
| Idle Minimum * (Watt) | 6.2 | 7.1 -15% | 2.7 56% | 2.1 66% | 23 -271% | 12.5 -102% | 6.1 2% |
| Idle Average * (Watt) | 9.6 | 13.6 -42% | 8 17% | 6.7 30% | 25 -160% | 15.3 -59% | 11.2 -17% |
| Idle Maximum * (Watt) | 21.2 | 14.1 33% | 10.6 50% | 11.4 46% | 33 -56% | 20.7 2% | 24.5 -16% |
| Load Average * (Watt) | 104.3 | 103.9 -0% | 74 29% | 77.7 26% | 96 8% | 90.2 14% | 94.7 9% |
| Witcher 3 ultra * (Watt) | 91.7 | 103 -12% | 168 -83% | 162 -77% | 105.8 -15% | ||
| Load Maximum * (Watt) | 135.3 | 130.9 3% | 89 34% | 131.5 3% | 197 -46% | 209.3 -55% | 192.2 -42% |
* ... kleiner is beter
| Dell XPS 15 7590 9980HK GTX 1650 i9-9980HK, GeForce GTX 1650 Mobile, 97 Wh | Dell XPS 15 9570 Core i9 UHD i9-8950HK, GeForce GTX 1050 Ti Max-Q, 97 Wh | Asus ZenBook 15 UX533FD i7-8565U, GeForce GTX 1050 Max-Q, 73 Wh | HP Spectre x360 15-df0126ng i7-8750H, GeForce GTX 1050 Ti Max-Q, 84 Wh | Gigabyte Aero 15 OLED XA i7-9750H, GeForce RTX 2070 Max-Q, 94.24 Wh | Razer Blade 15 RTX 2080 Max-Q i7-9750H, GeForce RTX 2080 Max-Q, 80 Wh | MSI GF75 Thin 9SC i7-9750H, GeForce GTX 1650 Mobile, 51 Wh | |
|---|---|---|---|---|---|---|---|
| Batterijduur | -20% | 25% | 2% | -29% | -19% | -40% | |
| Reader / Idle (h) | 15.2 | 15 -1% | 26.5 74% | 18.8 24% | 9.9 -35% | 15.9 5% | |
| WiFi v1.3 (h) | 7.8 | 8.6 10% | 8.7 12% | 8.8 13% | 5.7 -27% | 6.6 -15% | 4.7 -40% |
| Load (h) | 3.3 | 1 -70% | 2.9 -12% | 2.3 -30% | 2.5 -24% | 1.7 -48% |
Pro
Contra
Dit is de verkorte versie van het originele artikel. Het volledige, Engelse testrapport vind je hier.
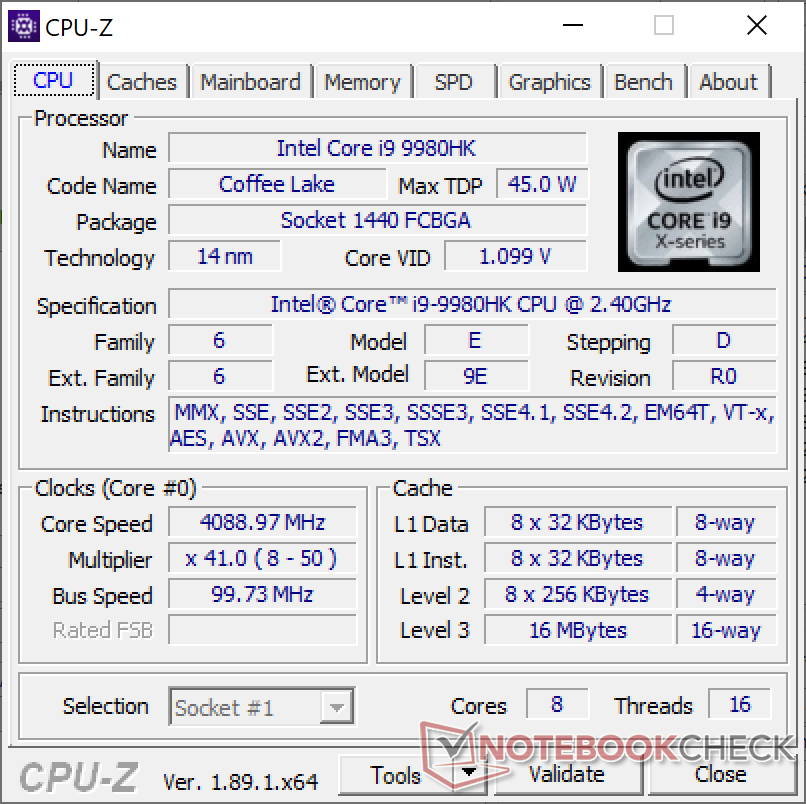
De XPS 15 7590 met Core i9-9980HK en GTX 1650 is de snelste versie van de XPS 15 tot nu toe - zoals het zou moeten. Aan de andere kant is het ook de traagste uitvoering van de i9-9980HK en GTX 1650 die we tot nu toe hebben getest in een laptop. Er is een reden waarom je weinig Ultrabooks zal zien met de Core i9-CPU, laat staan de 'unlocked' Core i9 en GeForce GTX-GPU. Zoveel prestaties in een behuizing van dit formaat proppen, zal het potentieel van de processor beperken aangezien deze volledig afhangt van de toegepaste koeling. We weten op basis van onze metingen bij omvangrijkere laptops dat zowel de Core i9 als GTX 1650 in de XPS 15 in staat zijn om veel beter te presteren.
Onze meetresultaten worden maar echt duidelijk als je kijkt naar de geschiedenis van het huidige XPS-design. Zijn behuizing werd bijna vijf jaar geleden ontwikkeld ten tijde van Intel Skylake, voordat er zelfs maar sprake was van de Core i9. Core i9-CPU's zijn berucht voor hun erg hoge Turbo Boost-kloksnelheden die alleen benut kunnen worden in combinatie met een geschikte koeling. Als je deze hoge Turbo Boost-kloksnelheden niet kan aanhouden, zullen de algemene prestaties niet veel hoger liggen dan die van een gewone Core i7. Deze leuke nieuwe processors lopen dus tegen de beperkingen aan van wat de behuizing van de XPS 15 kan koelen.
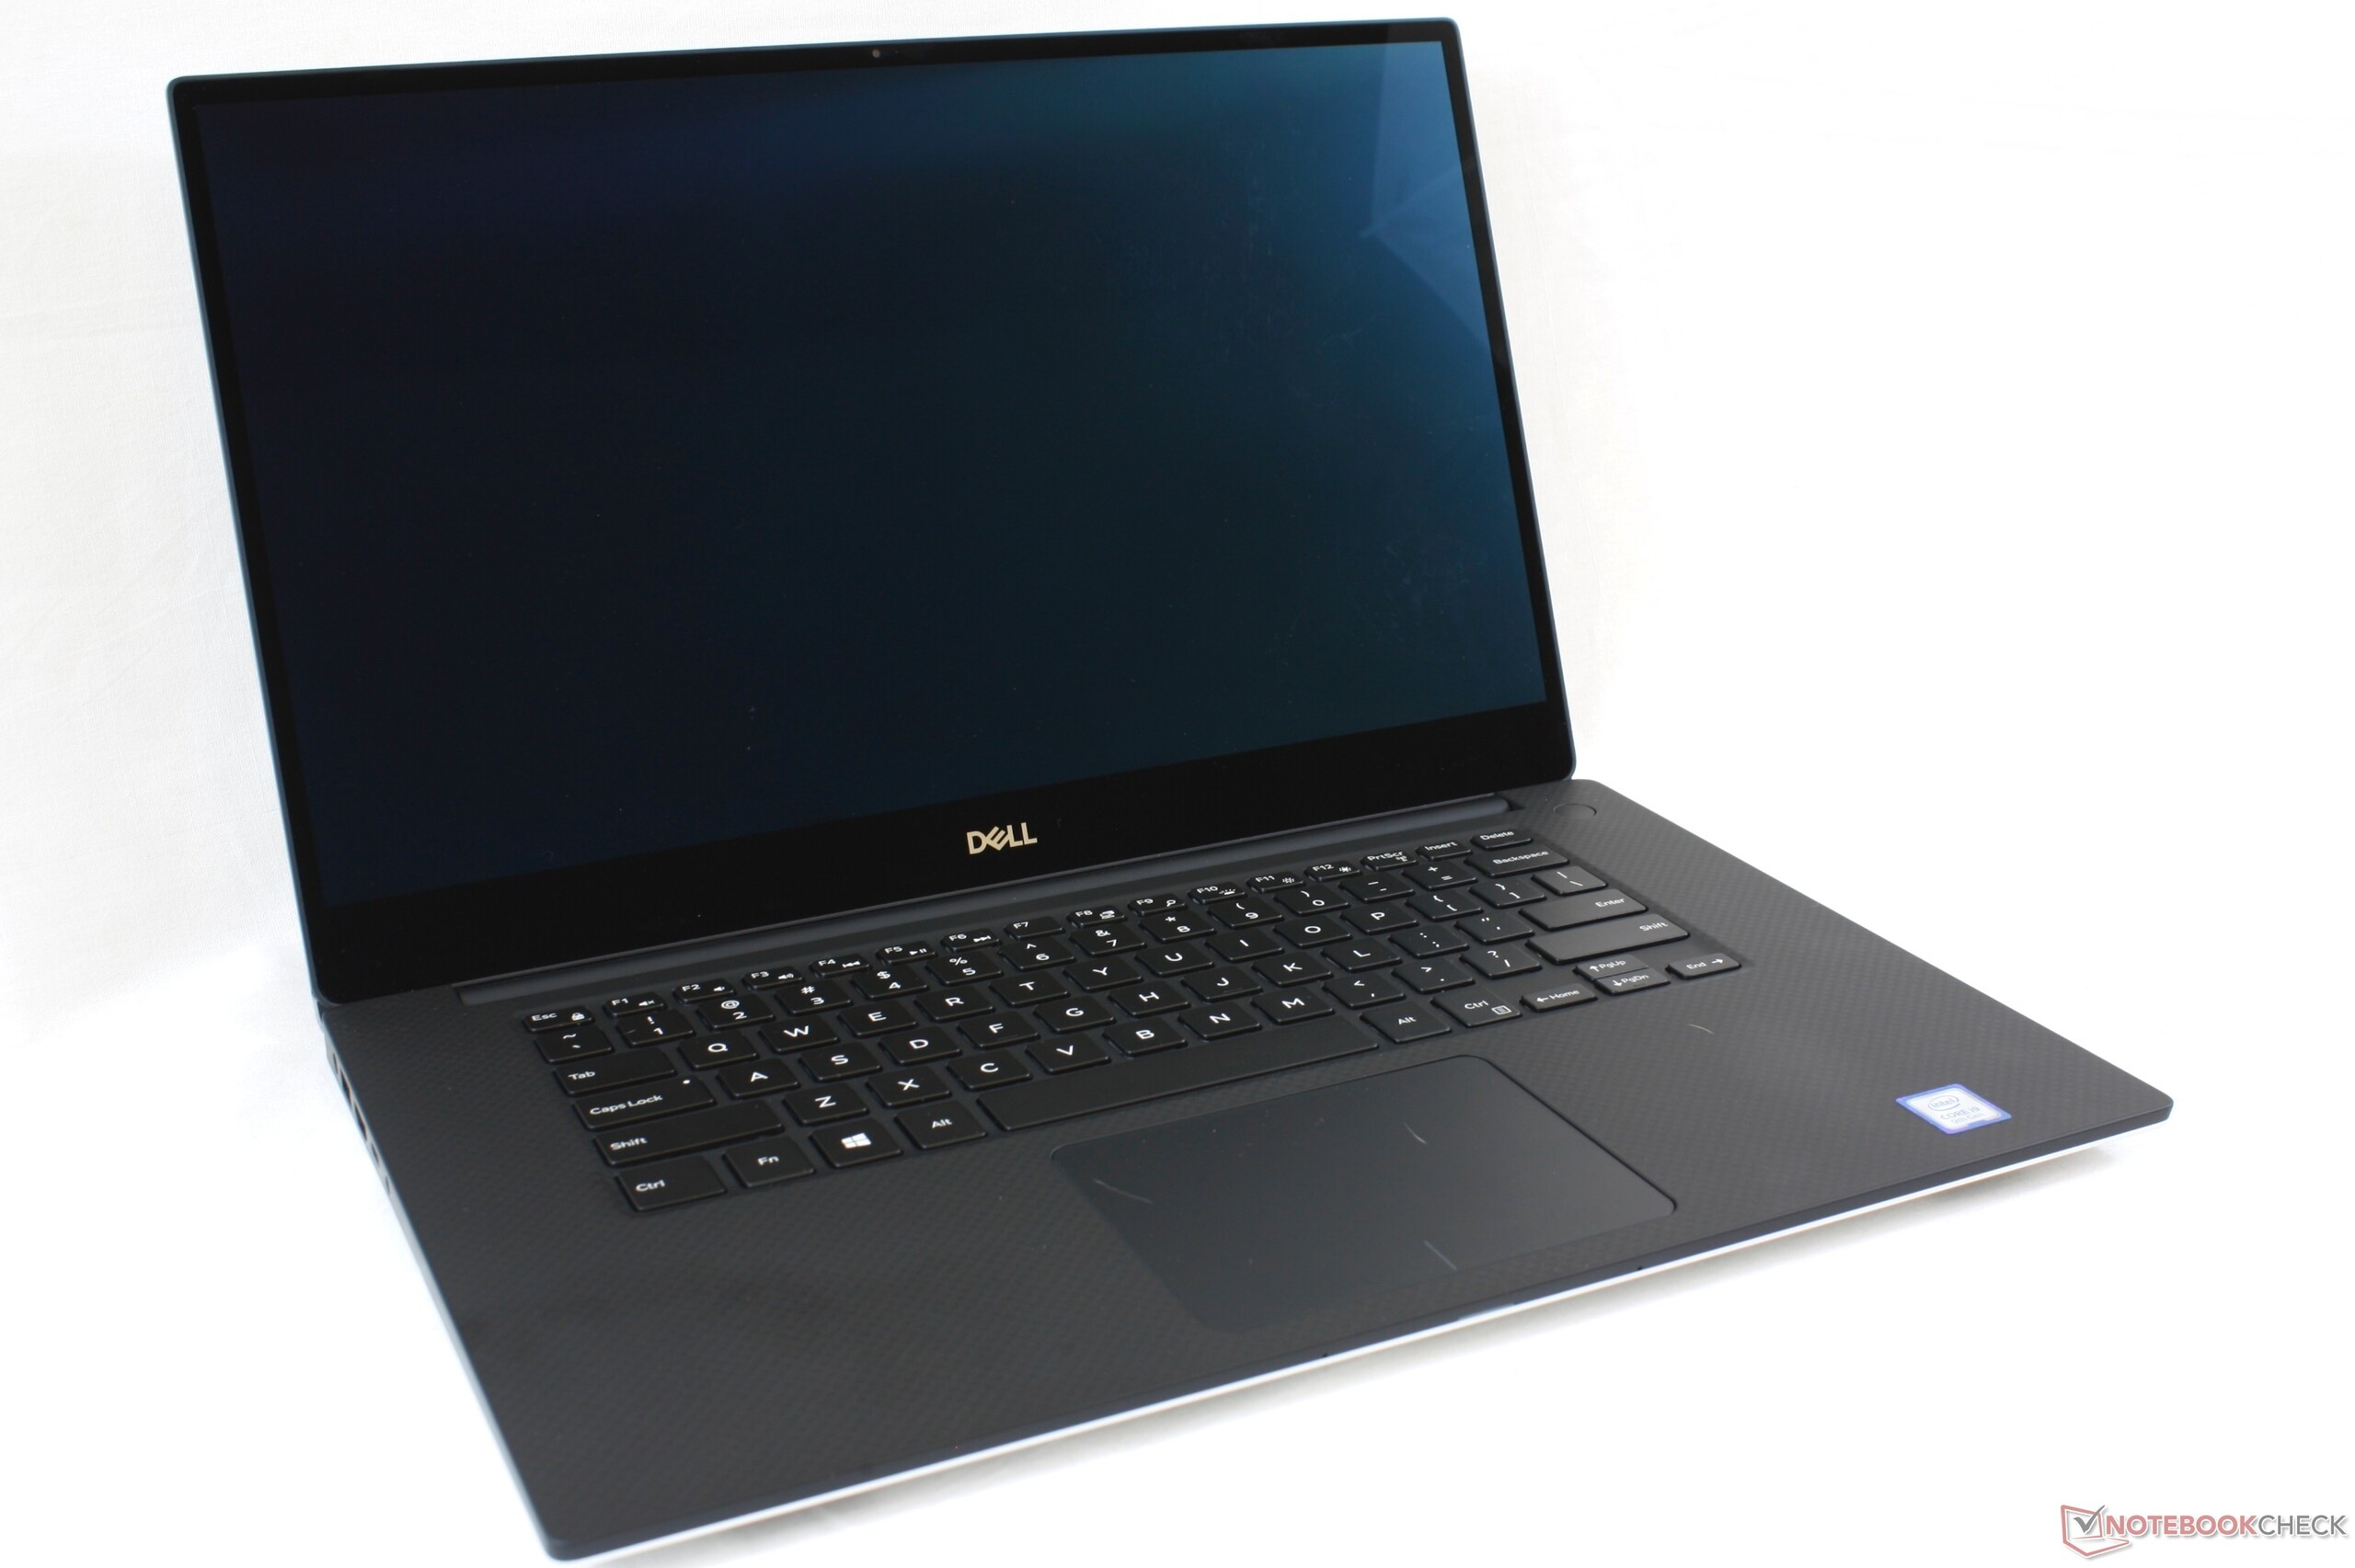
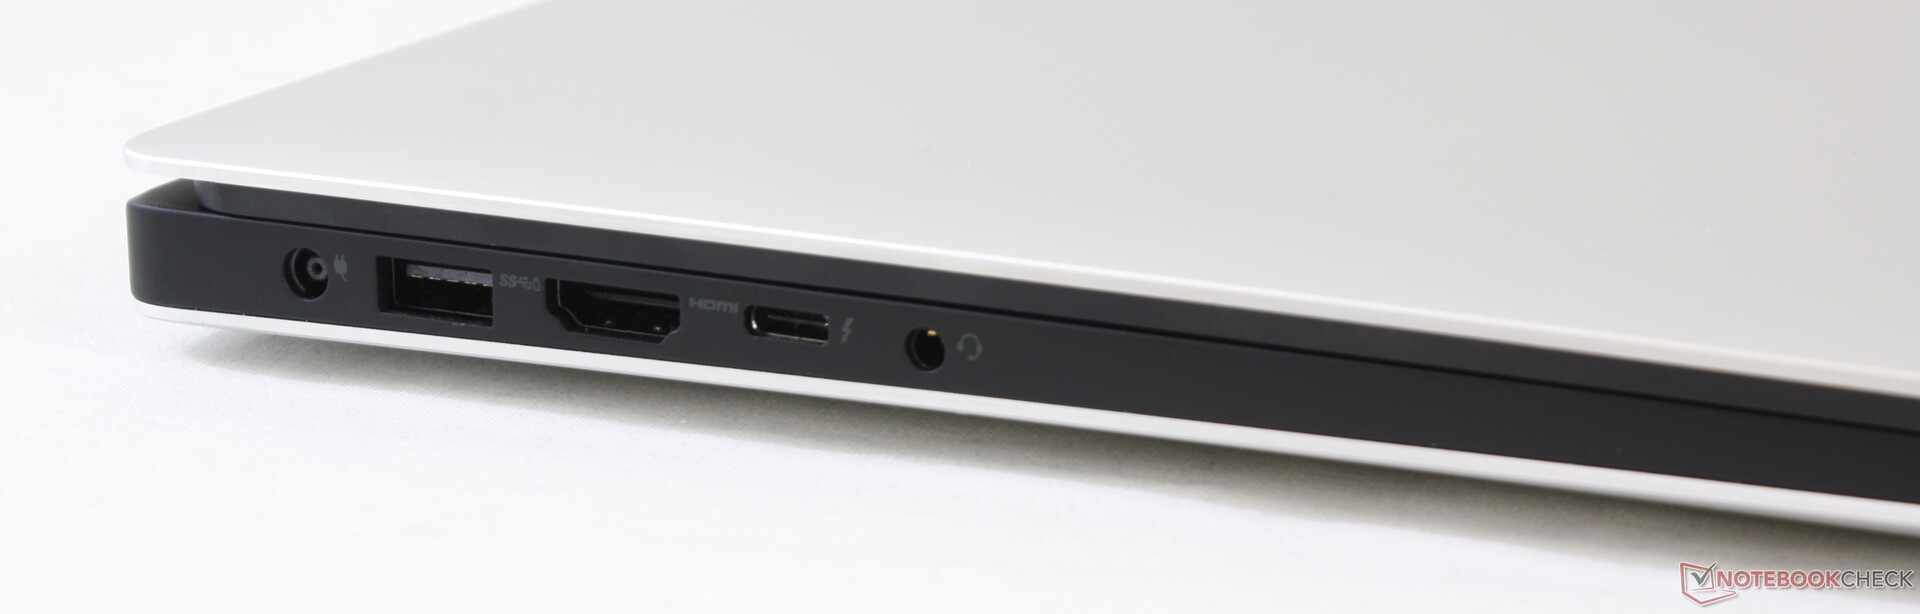
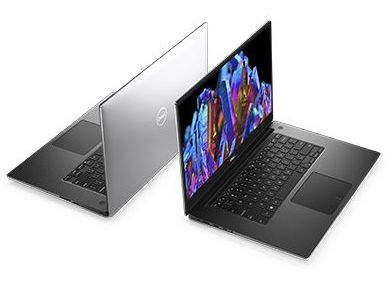
Ondanks deze matige CPU- en GPU-prestaties, blijft de XPS 15 een van de meest herkenbare Ultrabooks op de markt. Het is verrassend hoe goed het visuele design mee blijft met zijn tijd op het vlak van bouwkwaliteit en uitstraling, zelfs in vergelijking met nieuwere 15.6-inch Ultrabooks op de markt. Voor meer prestaties per dollar en een evenwichtiger toestel raden we echter aan om voor de opties met de Core i7 of Core i5 te kiezen.
De configuraties met Core i9-9980HK en GTX 1650 presteren beter dan de Core i9-8950H en GTX 1050 Ti Max-Q van vorig jaar, maar de verschillen zijn eerder beperkt en kleiner dan ze hadden kunnen zijn. De optie voor een 'unlocked' Core i9 werkt gewoonweg niet goed voor de huidige iteratie van de XPS 15. De meest interessante feature van de 7590-serie is niet de CPU of GPU, maar de introductie van een OLED-optie.
Dell XPS 15 7590 9980HK GTX 1650
- 31-08-2022 v7 (old)
Allen Ngo
Price comparison
