Kort testrapport Asus ROG Strix GL702ZC (Ryzen 7 1700, Radeon RX 580) Laptop
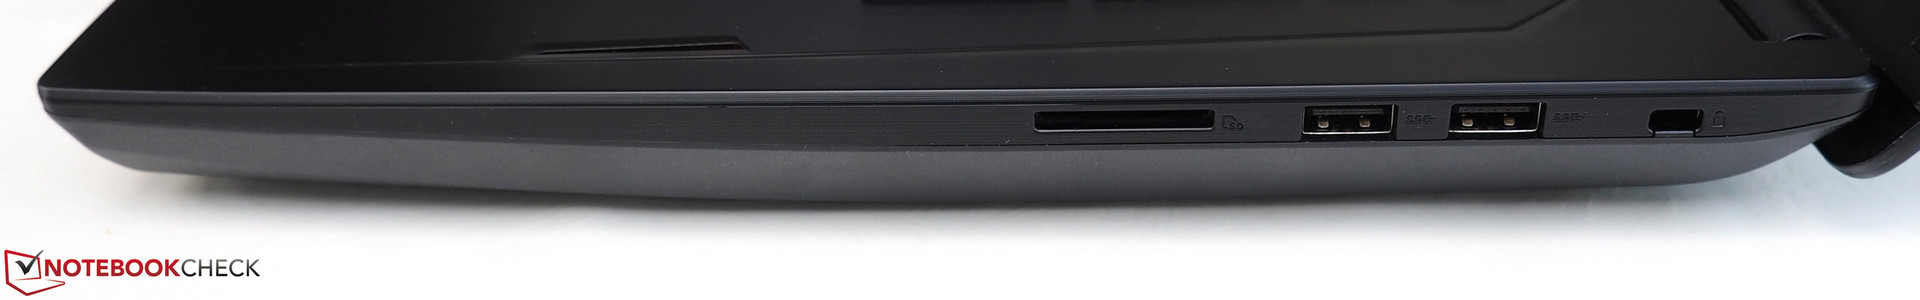
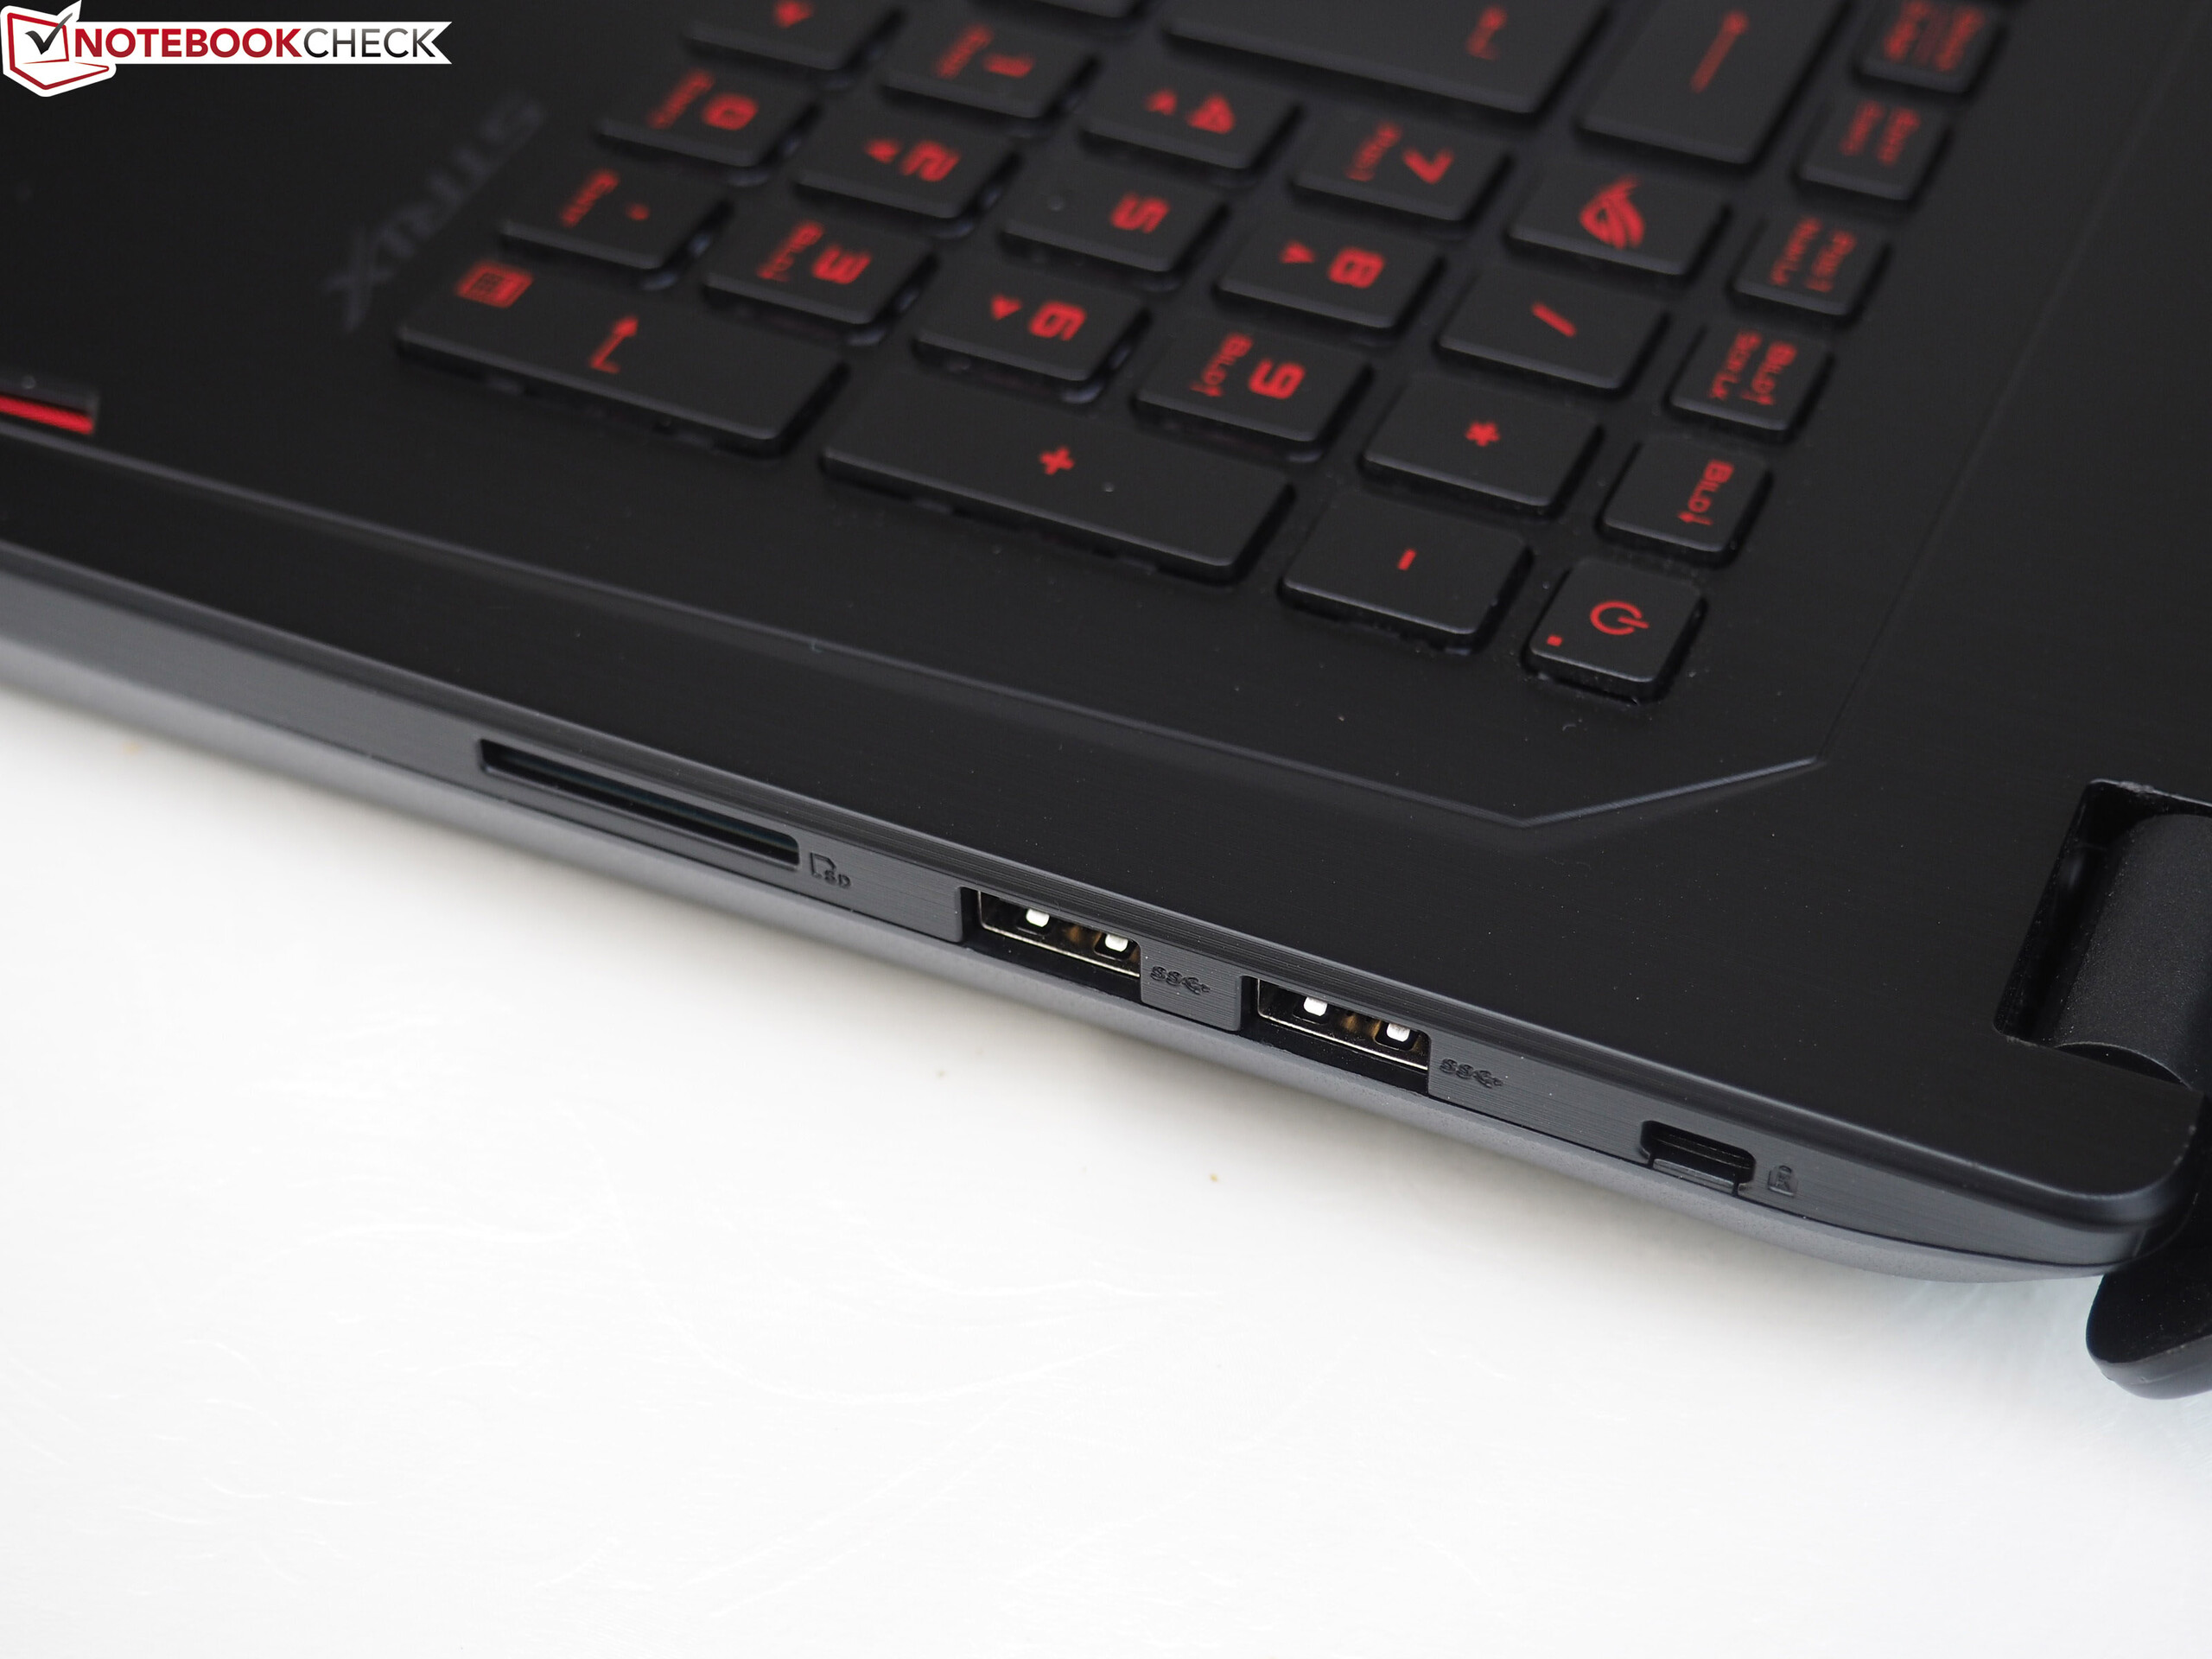
| SD Card Reader | |
| average JPG Copy Test (av. of 3 runs) | |
| Aorus X7 v7 (Toshiba Exceria Pro SDXC 64 GB UHS-II) | |
| Schenker XMG U727 2017 (Toshiba Exceria Pro SDXC 64 GB UHS-II) | |
| Asus GL702ZC-GC104T (Toshiba Exceria Pro SDXC 64 GB UHS-II) | |
| MSI GE72 7RE-046 (Toshiba Exceria Pro SDXC 64 GB UHS-II) | |
| Acer Aspire V17 Nitro BE VN7-793-738J (Toshiba Exceria Pro SDXC 64 GB UHS-II) | |
| maximum AS SSD Seq Read Test (1GB) | |
| Aorus X7 v7 (Toshiba Exceria Pro SDXC 64 GB UHS-II) | |
| Schenker XMG U727 2017 (Toshiba Exceria Pro SDXC 64 GB UHS-II) | |
| Asus GL702ZC-GC104T (Toshiba Exceria Pro SDXC 64 GB UHS-II) | |
| MSI GE72 7RE-046 (Toshiba Exceria Pro SDXC 64 GB UHS-II) | |
| Acer Aspire V17 Nitro BE VN7-793-738J (Toshiba Exceria Pro SDXC 64 GB UHS-II) | |
| |||||||||||||||||||||||||
Helderheidsverdeling: 89 %
Helderheid in Batterij-modus: 379 cd/m²
Contrast: 1223:1 (Zwart: 0.31 cd/m²)
ΔE ColorChecker Calman: 4.32 | ∀{0.5-29.43 Ø4.71}
ΔE Greyscale Calman: 4 | ∀{0.09-98 Ø4.96}
85% sRGB (Argyll 1.6.3 3D)
56% AdobeRGB 1998 (Argyll 1.6.3 3D)
62.5% AdobeRGB 1998 (Argyll 3D)
85.4% sRGB (Argyll 3D)
67.1% Display P3 (Argyll 3D)
Gamma: 2.47
CCT: 6984 K
| Asus GL702ZC-GC104T LG Philips LP173WF4-SPF5 (LGD04E8), 1920x1080, 17.3" | Schenker XMG U727 2017 AU Optronics B173ZAN01.0 (AUO109B), 3840x2160, 17.3" | Aorus X7 v7 AU Optronics B173QTN01.4 (AUO1496), 2560x1440, 17.3" | Acer Aspire V17 Nitro BE VN7-793-738J AU Optronics B173ZAN01.0, 3840x2160, 17.3" | MSI GE72 7RE-046 N173HHE-G32 (CMN1747), 1920x1080, 17.3" | |
|---|---|---|---|---|---|
| Display | 35% | -1% | 33% | 29% | |
| Display P3 Coverage (%) | 67.1 | 86.6 29% | 63 -6% | 85.4 27% | 90.7 35% |
| sRGB Coverage (%) | 85.4 | 99.9 17% | 87.1 2% | 100 17% | 99.9 17% |
| AdobeRGB 1998 Coverage (%) | 62.5 | 99.5 59% | 63.7 2% | 97.8 56% | 85.2 36% |
| Response Times | -18% | 57% | 4% | 46% | |
| Response Time Grey 50% / Grey 80% * (ms) | 39.2 ? | 44 ? -12% | 24 ? 39% | 29 ? 26% | 27 ? 31% |
| Response Time Black / White * (ms) | 22.8 ? | 28 ? -23% | 6 ? 74% | 27 ? -18% | 9 ? 61% |
| PWM Frequency (Hz) | 122000 ? | ||||
| Screen | 16% | -24% | 2% | -13% | |
| Brightness middle (cd/m²) | 379 | 362 -4% | 375 -1% | 380 0% | 253 -33% |
| Brightness (cd/m²) | 354 | 344 -3% | 353 0% | 336 -5% | 230 -35% |
| Brightness Distribution (%) | 89 | 85 -4% | 85 -4% | 81 -9% | 86 -3% |
| Black Level * (cd/m²) | 0.31 | 0.35 -13% | 0.58 -87% | 0.32 -3% | 0.24 23% |
| Contrast (:1) | 1223 | 1034 -15% | 647 -47% | 1188 -3% | 1054 -14% |
| Colorchecker dE 2000 * | 4.32 | 2.46 43% | 6.06 -40% | 5.32 -23% | 5.01 -16% |
| Colorchecker dE 2000 max. * | 8.56 | 4.26 50% | 10.54 -23% | 7.63 11% | 10.4 -21% |
| Greyscale dE 2000 * | 4 | 2.9 27% | 5.68 -42% | 4.9 -23% | 7.26 -82% |
| Gamma | 2.47 89% | 2.31 95% | 2.3 96% | 2.61 84% | 2.09 105% |
| CCT | 6984 93% | 6120 106% | 7998 81% | 6558 99% | 6329 103% |
| Color Space (Percent of AdobeRGB 1998) (%) | 56 | 88 57% | 57 2% | 87.2 56% | 76 36% |
| Color Space (Percent of sRGB) (%) | 85 | 100 18% | 87 2% | 100 18% | 100 18% |
| Totaal Gemiddelde (Programma / Instellingen) | 11% /
15% | 11% /
-9% | 13% /
8% | 21% /
4% |
* ... kleiner is beter
Responstijd Scherm
| ↔ Responstijd Zwart naar Wit | ||
|---|---|---|
| 22.8 ms ... stijging ↗ en daling ↘ gecombineerd | ↗ 11.2 ms stijging | 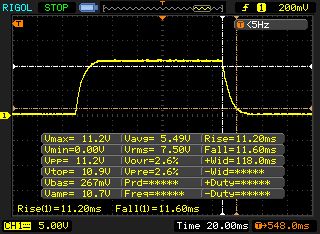 |
| ↘ 11.6 ms daling | ||
| Het scherm vertoonde prima responstijden in onze tests maar is misschien wat te traag voor competitieve games. Ter vergelijking: alle testtoestellen variëren van 0.1 (minimum) tot 240 (maximum) ms. » 52 % van alle toestellen zijn beter. Dit betekent dat de gemeten responstijd slechter is dan het gemiddelde (19.8 ms) van alle geteste toestellen. | ||
| ↔ Responstijd 50% Grijs naar 80% Grijs | ||
| 39.2 ms ... stijging ↗ en daling ↘ gecombineerd | ↗ 20.4 ms stijging | 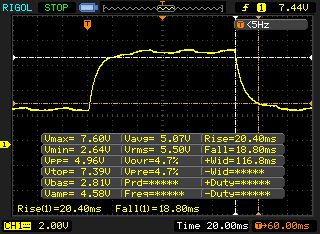 |
| ↘ 18.8 ms daling | ||
| Het scherm vertoonde trage responstijden in onze tests en is misschien te traag voor games. Ter vergelijking: alle testtoestellen variëren van 0.165 (minimum) tot 636 (maximum) ms. » 60 % van alle toestellen zijn beter. Dit betekent dat de gemeten responstijd slechter is dan het gemiddelde (30.9 ms) van alle geteste toestellen. | ||
Screen Flickering / PWM (Pulse-Width Modulation)
| Screen flickering / PWM waargenomen | 122000 Hz | ≤ 90 % helderheid instelling | 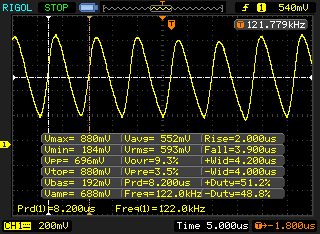 |
De achtergrondverlichting van het scherm flikkert op 122000 Hz (in het slechtste geval, bijvoorbeeld bij gebruik van PWM) aan een helderheid van 90 % en lager. Boven deze helderheid zou er geen flickering / PWM mogen optreden. De frequentie van 122000 Hz is redelijk hoog en de meeste mensen die gevoelig zijn aan flickering zouden dit dus niet mogen waarnemen of geïrriteerde ogen krijgen. Ter vergelijking: 52 % van alle geteste toestellen maakten geen gebruik van PWM om de schermhelderheid te verlagen. Als het wel werd gebruikt, werd een gemiddelde van 7741 (minimum: 5 - maximum: 343500) Hz waargenomen. | |||
| Cinebench R11.5 | |
| CPU Single 64Bit | |
| Schenker XMG U727 2017 | |
| Aorus X7 v7 | |
| MSI GE72 7RE-046 | |
| Asus GL702ZC-GC104T | |
| CPU Multi 64Bit | |
| Asus GL702ZC-GC104T | |
| Schenker XMG U727 2017 | |
| Aorus X7 v7 | |
| MSI GE72 7RE-046 | |
| PCMark 8 | |
| Home Score Accelerated v2 | |
| Aorus X7 v7 | |
| Schenker XMG U727 2017 | |
| Asus GL702ZC-GC104T | |
| Acer Aspire V17 Nitro BE VN7-793-738J | |
| Work Score Accelerated v2 | |
| Aorus X7 v7 | |
| Asus GL702ZC-GC104T | |
| Schenker XMG U727 2017 | |
| Acer Aspire V17 Nitro BE VN7-793-738J | |
| PCMark 10 - Score | |
| Aorus X7 v7 | |
| Asus GL702ZC-GC104T | |
| PCMark 8 Home Score Accelerated v2 | 4173 punten | |
| PCMark 8 Work Score Accelerated v2 | 5110 punten | |
| PCMark 10 Score | 5084 punten | |
Help | ||
| Asus GL702ZC-GC104T SanDisk SD8SN8U256G1002 | MSI GT75VR 7RF-012 Titan Pro 2x Samsung SM961 MZVPW256HEGL NVMe (RAID 0) | Asus Zephyrus GX501 Samsung SSD SM961 1TB M.2 MZVKW1T0HMLH | Gigabyte P56XT LiteOn CX2-8B256 | Schenker XMG A517 Samsung SSD 960 Evo 500GB m.2 NVMe | HP Omen 15-ce002ng Samsung PM961 MZVLW256HEHP | |
|---|---|---|---|---|---|---|
| CrystalDiskMark 5.2 / 6 | 343% | 196% | 157% | 250% | 202% | |
| Read Seq Q32T1 (MB/s) | 450.8 | 3407 656% | 3445 664% | 2445 442% | 3389 652% | 3431 661% |
| Write Seq Q32T1 (MB/s) | 461.2 | 2944 538% | 1848 301% | 790 71% | 1706 270% | 1246 170% |
| Read 4K Q32T1 (MB/s) | 205.9 | 625 204% | 547 166% | 588 186% | 627 205% | 586 185% |
| Write 4K Q32T1 (MB/s) | 188.9 | 548 190% | 463 145% | 455.5 141% | 591 213% | 486 157% |
| Read Seq (MB/s) | 494.2 | 3377 583% | 954 93% | 1881 281% | 1856 276% | 1419 187% |
| Write Seq (MB/s) | 467.9 | 2612 458% | 1049 124% | 797 70% | 1652 253% | 1266 171% |
| Read 4K (MB/s) | 38.91 | 55.9 44% | 45 16% | 46.69 20% | 49 26% | 47.14 21% |
| Write 4K (MB/s) | 96.1 | 165 72% | 149 55% | 142.5 48% | 196 104% | 156 62% |

| 3DMark | |
| 2560x1440 Time Spy Graphics | |
| Schenker XMG U727 2017 | |
| Aorus X7 v7 | |
| Acer Aspire V17 Nitro BE VN7-793-738J | |
| Asus GL702ZC-GC104T | |
| 1920x1080 Fire Strike Graphics | |
| Schenker XMG U727 2017 | |
| Aorus X7 v7 | |
| Acer Aspire V17 Nitro BE VN7-793-738J | |
| Asus GL702ZC-GC104T | |
| MSI GE72 7RE-046 | |
| 3DMark 11 - 1280x720 Performance GPU | |
| Schenker XMG U727 2017 | |
| Aorus X7 v7 | |
| Asus GL702ZC-GC104T | |
| Acer Aspire V17 Nitro BE VN7-793-738J | |
| MSI GE72 7RE-046 | |
| Unigine Heaven 4.0 - Extreme Preset DX11 | |
| Schenker XMG U727 2017 | |
| Asus GL702ZC-GC104T | |
| MSI GE72 7RE-046 | |
| 3DMark 11 Performance | 13320 punten | |
| 3DMark Ice Storm Standard Score | 153102 punten | |
| 3DMark Cloud Gate Standard Score | 33582 punten | |
| 3DMark Fire Strike Score | 9642 punten | |
| 3DMark Time Spy Score | 3696 punten | |
Help | ||
| The Witcher 3 | |
| 1920x1080 Ultra Graphics & Postprocessing (HBAO+) | |
| MSI GT62VR-6RE16H21 | |
| MSI GS63VR 7RG | |
| Schenker XMG P507 | |
| Asus GL702ZC-GC104T | |
| HP Omen 15-ce002ng | |
| MSI GE72 7RE-046 | |
| 1920x1080 High Graphics & Postprocessing (Nvidia HairWorks Off) | |
| MSI GT62VR-6RE16H21 | |
| MSI GS63VR 7RG | |
| Asus GL702ZC-GC104T | |
| Schenker XMG P507 | |
| HP Omen 15-ce002ng | |
| MSI GE72 7RE-046 | |
| Batman: Arkham Knight - 1920x1080 High / On (Interactive Smoke & Paper Debris Off) AA:SM AF:8x | |
| MSI GS63VR 7RG | |
| MSI GT62VR-6RE16H21 | |
| Asus GL702ZC-GC104T | |
| Schenker XMG P507 | |
| HP Omen 15-ce002ng | |
| MSI GE72 7RE-046 | |
| Star Wars Battlefront | |
| 1920x1080 Ultra Preset AA:FX | |
| MSI GT62VR-6RE16H21 | |
| MSI GS63VR 7RG | |
| Asus GL702ZC-GC104T | |
| Schenker XMG P507 | |
| HP Omen 15-ce002ng | |
| MSI GE72 7RE-046 | |
| 1920x1080 High Preset AA:FX | |
| MSI GT62VR-6RE16H21 | |
| MSI GS63VR 7RG | |
| Asus GL702ZC-GC104T | |
| Schenker XMG P507 | |
| HP Omen 15-ce002ng | |
| MSI GE72 7RE-046 | |
| Assassin's Creed Syndicate | |
| 1920x1080 Ultra High Preset AA:4x MSAA + FX | |
| MSI GT62VR-6RE16H21 | |
| MSI GS63VR 7RG | |
| Schenker XMG P507 | |
| HP Omen 15-ce002ng | |
| Asus GL702ZC-GC104T | |
| MSI GE72 7RE-046 | |
| 1920x1080 High Preset AA:FX | |
| MSI GS63VR 7RG | |
| Schenker XMG P507 | |
| MSI GT62VR-6RE16H21 | |
| HP Omen 15-ce002ng | |
| MSI GE72 7RE-046 | |
| Asus GL702ZC-GC104T | |
| Rainbow Six Siege | |
| 1920x1080 Ultra Preset AA:T AF:16x | |
| MSI GT62VR-6RE16H21 | |
| MSI GS63VR 7RG | |
| Asus GL702ZC-GC104T | |
| Schenker XMG P507 | |
| HP Omen 15-ce002ng | |
| MSI GE72 7RE-046 | |
| 1920x1080 High Preset AA:T AF:4x | |
| MSI GT62VR-6RE16H21 | |
| MSI GS63VR 7RG | |
| Asus GL702ZC-GC104T | |
| Schenker XMG P507 | |
| HP Omen 15-ce002ng | |
| MSI GE72 7RE-046 | |
| Rise of the Tomb Raider | |
| 1920x1080 Very High Preset AA:FX AF:16x | |
| MSI GT62VR-6RE16H21 | |
| MSI GS63VR 7RG | |
| Schenker XMG P507 | |
| Asus GL702ZC-GC104T | |
| HP Omen 15-ce002ng | |
| MSI GE72 7RE-046 | |
| 1920x1080 High Preset AA:FX AF:4x | |
| MSI GT62VR-6RE16H21 | |
| MSI GS63VR 7RG | |
| Schenker XMG P507 | |
| HP Omen 15-ce002ng | |
| Asus GL702ZC-GC104T | |
| MSI GE72 7RE-046 | |
| Far Cry Primal | |
| 1920x1080 Ultra Preset AA:SM | |
| MSI GT62VR-6RE16H21 | |
| MSI GS63VR 7RG | |
| Schenker XMG P507 | |
| Asus GL702ZC-GC104T | |
| HP Omen 15-ce002ng | |
| MSI GE72 7RE-046 | |
| 1920x1080 High Preset AA:SM | |
| MSI GS63VR 7RG | |
| MSI GT62VR-6RE16H21 | |
| Schenker XMG P507 | |
| HP Omen 15-ce002ng | |
| Asus GL702ZC-GC104T | |
| MSI GE72 7RE-046 | |
| The Division | |
| 1920x1080 Ultra Preset AF:16x | |
| MSI GT62VR-6RE16H21 | |
| MSI GS63VR 7RG | |
| Asus GL702ZC-GC104T | |
| Schenker XMG P507 | |
| HP Omen 15-ce002ng | |
| MSI GE72 7RE-046 | |
| 1920x1080 High Preset AF:8x | |
| MSI GT62VR-6RE16H21 | |
| MSI GS63VR 7RG | |
| Asus GL702ZC-GC104T | |
| Schenker XMG P507 | |
| HP Omen 15-ce002ng | |
| MSI GE72 7RE-046 | |
| Doom | |
| 1920x1080 Ultra Preset AA:SM | |
| MSI GT62VR-6RE16H21 | |
| MSI GS63VR 7RG | |
| Schenker XMG P507 | |
| HP Omen 15-ce002ng | |
| Asus GL702ZC-GC104T | |
| MSI GE72 7RE-046 | |
| 1920x1080 High Preset AA:FX | |
| MSI GT62VR-6RE16H21 | |
| MSI GS63VR 7RG | |
| Schenker XMG P507 | |
| HP Omen 15-ce002ng | |
| MSI GE72 7RE-046 | |
| Asus GL702ZC-GC104T | |
| Mirror's Edge Catalyst | |
| 1920x1080 Ultra Preset AF:16x | |
| MSI GT62VR-6RE16H21 | |
| MSI GS63VR 7RG | |
| Schenker XMG P507 | |
| Asus GL702ZC-GC104T | |
| HP Omen 15-ce002ng | |
| MSI GE72 7RE-046 | |
| 1920x1080 High Preset AF:16x | |
| MSI GT62VR-6RE16H21 | |
| MSI GS63VR 7RG | |
| Schenker XMG P507 | |
| Asus GL702ZC-GC104T | |
| HP Omen 15-ce002ng | |
| MSI GE72 7RE-046 | |
| Deus Ex Mankind Divided | |
| 1920x1080 Ultra Preset AA:2xMS AF:8x | |
| Asus G752VS | |
| MSI GS63VR 7RG | |
| Asus GL702ZC-GC104T | |
| HP Omen 15-ce002ng | |
| MSI GE72 7RE-046 | |
| 1920x1080 High Preset AF:4x | |
| MSI GS63VR 7RG | |
| Asus G752VS | |
| Asus GL702ZC-GC104T | |
| HP Omen 15-ce002ng | |
| MSI GE72 7RE-046 | |
| FIFA 17 | |
| 1920x1080 Ultra Preset AA:4xMS | |
| Asus G752VS | |
| HP Omen 15-ce002ng | |
| Asus GL702ZC-GC104T | |
| MSI GS63VR 7RG | |
| MSI GE72 7RE-046 | |
| 1920x1080 High Preset | |
| Asus G752VS | |
| HP Omen 15-ce002ng | |
| Asus GL702ZC-GC104T | |
| MSI GS63VR 7RG | |
| MSI GE72 7RE-046 | |
| Battlefield 1 | |
| 1920x1080 Ultra Preset AA:T | |
| Asus G752VS | |
| MSI GS63VR 7RG | |
| Asus GL702ZC-GC104T | |
| HP Omen 15-ce002ng | |
| MSI GE72 7RE-046 | |
| 1920x1080 High Preset AA:T | |
| Asus G752VS | |
| MSI GS63VR 7RG | |
| Asus GL702ZC-GC104T | |
| HP Omen 15-ce002ng | |
| MSI GE72 7RE-046 | |
| Titanfall 2 | |
| 1920x1080 Very High (Insane Texture Quality) / Enabled AA:TS AF:16x | |
| Asus G752VS | |
| MSI GS63VR 7RG | |
| Asus GL702ZC-GC104T | |
| HP Omen 15-ce002ng | |
| MSI GE72 7RE-046 | |
| 1920x1080 High / Enabled AA:TS AF:8x | |
| MSI GS63VR 7RG | |
| Asus G752VS | |
| Asus GL702ZC-GC104T | |
| HP Omen 15-ce002ng | |
| MSI GE72 7RE-046 | |
| Call of Duty Infinite Warfare | |
| 1920x1080 Ultra / On AA:T2X SM | |
| Asus G752VS | |
| MSI GS63VR 7RG | |
| MSI GT62VR | |
| Asus GL702ZC-GC104T | |
| HP Omen 15-ce002ng | |
| MSI GE72 7RE-046 | |
| 1920x1080 High / On AA:FX | |
| Asus G752VS | |
| MSI GS63VR 7RG | |
| MSI GT62VR | |
| HP Omen 15-ce002ng | |
| Asus GL702ZC-GC104T | |
| MSI GE72 7RE-046 | |
| Dishonored 2 | |
| 1920x1080 Ultra Preset AA:TX | |
| MSI GS63VR 7RG | |
| Asus G752VS | |
| MSI GT62VR | |
| HP Omen 15-ce002ng | |
| Asus GL702ZC-GC104T | |
| MSI GE72 7RE-046 | |
| 1920x1080 High Preset AA:TX | |
| MSI GS63VR 7RG | |
| Asus G752VS | |
| HP Omen 15-ce002ng | |
| MSI GT62VR | |
| Asus GL702ZC-GC104T | |
| MSI GE72 7RE-046 | |
| Watch Dogs 2 | |
| 1920x1080 Ultra Preset | |
| Asus G752VS | |
| MSI GS63VR 7RG | |
| MSI GT62VR | |
| HP Omen 15-ce002ng | |
| Asus GL702ZC-GC104T | |
| MSI GE72 7RE-046 | |
| 1920x1080 High Preset | |
| Asus G752VS | |
| MSI GS63VR 7RG | |
| MSI GT62VR | |
| HP Omen 15-ce002ng | |
| Asus GL702ZC-GC104T | |
| MSI GE72 7RE-046 | |
| Resident Evil 7 | |
| 1920x1080 Very High / On AA:FXAA+T | |
| Asus G752VS | |
| MSI GS63VR 7RG | |
| Asus GL702ZC-GC104T | |
| MSI GT62VR | |
| HP Omen 15-ce002ng | |
| MSI GE72 7RE-046 | |
| 1920x1080 High / On AA:FXAA+T | |
| Asus G752VS | |
| MSI GS63VR 7RG | |
| Asus GL702ZC-GC104T | |
| MSI GT62VR | |
| HP Omen 15-ce002ng | |
| MSI GE72 7RE-046 | |
| For Honor | |
| 1920x1080 Extreme Preset AA:T AF:16x | |
| Asus G752VS | |
| MSI GS63VR 7RG | |
| MSI GT62VR | |
| Asus GL702ZC-GC104T | |
| HP Omen 15-ce002ng | |
| MSI GE72 7RE-046 | |
| 1920x1080 High Preset AA:T AF:8x | |
| Asus G752VS | |
| MSI GS63VR 7RG | |
| MSI GT62VR | |
| Asus GL702ZC-GC104T | |
| HP Omen 15-ce002ng | |
| MSI GE72 7RE-046 | |
| Ghost Recon Wildlands | |
| 1920x1080 Ultra Preset AA:T AF:16x | |
| Asus G752VS | |
| MSI GS63VR 7RG | |
| MSI GT62VR | |
| HP Omen 15-ce002ng | |
| Asus GL702ZC-GC104T | |
| MSI GE72 7RE-046 | |
| 1920x1080 High Preset AA:T AF:4x | |
| Asus G752VS | |
| MSI GS63VR 7RG | |
| MSI GT62VR | |
| HP Omen 15-ce002ng | |
| Asus GL702ZC-GC104T | |
| MSI GE72 7RE-046 | |
| Prey | |
| 1920x1080 Very High Preset AA:2TX SM AF:16x | |
| Asus G752VS | |
| MSI GS63VR 7RG | |
| MSI GT62VR | |
| Asus GL702ZC-GC104T | |
| HP Omen 15-ce002ng | |
| 1920x1080 High Preset AA:2TX SM AF:8x | |
| MSI GS63VR 7RG | |
| Asus G752VS | |
| MSI GT62VR | |
| Asus GL702ZC-GC104T | |
| HP Omen 15-ce002ng | |
| Rocket League - 1920x1080 High Quality AA:High FX | |
| Asus G752VS | |
| MSI GS63VR 7RG | |
| MSI GT62VR | |
| Asus GL702ZC-GC104T | |
| MSI GE72 7RE-046 | |
| HP Omen 15-ce002ng | |
| Dirt 4 | |
| 1920x1080 Ultra Preset AA:4xMS AF:16x | |
| Asus G752VS | |
| MSI GS63VR 7RG | |
| MSI GT62VR | |
| Asus GL702ZC-GC104T | |
| HP Omen 15-ce002ng | |
| MSI GE72 7RE-046 | |
| 1920x1080 High Preset AA:2xMS AF:8x | |
| Asus G752VS | |
| MSI GS63VR 7RG | |
| MSI GT62VR | |
| Asus GL702ZC-GC104T | |
| HP Omen 15-ce002ng | |
| MSI GE72 7RE-046 | |
| F1 2017 | |
| 1920x1080 Ultra High Preset AA:T AF:16x | |
| Asus G752VS | |
| MSI GT62VR | |
| Asus GL702ZC-GC104T | |
| MSI GE72 7RE-046 | |
| 1920x1080 High Preset AA:T AF:8x | |
| Asus G752VS | |
| MSI GT62VR | |
| Asus GL702ZC-GC104T | |
| MSI GE72 7RE-046 | |
| Ark Survival Evolved | |
| 1920x1080 Epic Preset (100 % Resolution Scale) | |
| Asus G752VS | |
| MSI GT62VR | |
| Asus GL702ZC-GC104T | |
| 1920x1080 High Preset (100 % Resolution Scale) | |
| Asus G752VS | |
| MSI GT62VR | |
| Asus GL702ZC-GC104T | |
| MSI GE72 7RE-046 | |
| lage | gem. | hoge | ultra | 4K | |
|---|---|---|---|---|---|
| The Witcher 3 (2015) | 176 | 129 | 67.4 | 37.4 | 23.8 |
| Batman: Arkham Knight (2015) | 111 | 107 | 84 | 30 | |
| Star Wars Battlefront (2015) | 191 | 183 | 112 | 93.1 | 35.4 |
| Assassin's Creed Syndicate (2015) | 49.7 | 49.3 | 46.5 | 24.4 | 24.1 |
| Rainbow Six Siege (2015) | 199 | 177 | 148 | 121 | 47.4 |
| Rise of the Tomb Raider (2016) | 176 | 121 | 64 | 53 | 22.9 |
| Far Cry Primal (2016) | 85 | 75 | 69 | 55 | 25 |
| The Division (2016) | 135 | 116 | 70.9 | 54.7 | 26.2 |
| Doom (2016) | 73.7 | 72.5 | 68 | 65.9 | 27.1 |
| Mirror's Edge Catalyst (2016) | 102 | 88.9 | 72.6 | 63.3 | 23.3 |
| Deus Ex Mankind Divided (2016) | 70.9 | 67.4 | 56.1 | 30.2 | 18.3 |
| FIFA 17 (2016) | 266 | 261 | 230 | 225 | 112 |
| Battlefield 1 (2016) | 125 | 112 | 87.4 | 75.9 | 32.7 |
| Titanfall 2 (2016) | 144 | 143 | 94.4 | 82.1 | |
| Call of Duty Infinite Warfare (2016) | 102 | 97.4 | 90.5 | 83.3 | 43 |
| Dishonored 2 (2016) | 75.9 | 73.1 | 60.2 | 54.2 | 22.3 |
| Watch Dogs 2 (2016) | 72.4 | 65.6 | 54 | 36.5 | 18.2 |
| Resident Evil 7 (2017) | 348 | 179 | 116 | 99.4 | 30.6 |
| For Honor (2017) | 164 | 100 | 95.7 | 68.2 | 26.7 |
| Ghost Recon Wildlands (2017) | 84 | 61.5 | 57 | 26.7 | 21.3 |
| Prey (2017) | 138 | 127 | 102 | 87.2 | 28.4 |
| Rocket League (2017) | 240 | 228 | 168 | ||
| Dirt 4 (2017) | 220 | 148 | 98.5 | 57.7 | |
| Playerunknown's Battlegrounds (PUBG) (2017) | 110 | 69.1 | 57.1 | 40.5 | 14.3 |
| F1 2017 (2017) | 137 | 104 | 87 | 63 | 27 |
| Ark Survival Evolved (2017) | 87.5 | 41.2 | 29.1 | 20.3 |
Geluidsniveau
| Onbelast |
| 32 / 38 / 40 dB (A) |
| HDD |
| 33 dB (A) |
| Belasting |
| 42 / 57 dB (A) |
 | ||
30 dB stil 40 dB(A) hoorbaar 50 dB(A) luid |
||
min: | ||
| Asus GL702ZC-GC104T R7 1700, Radeon RX 580 (Laptop) | Schenker XMG U727 2017 i7-7700K, GeForce GTX 1080 Mobile | Aorus X7 v7 i7-7820HK, GeForce GTX 1070 Mobile | Acer Aspire V17 Nitro BE VN7-793-738J i7-7700HQ, GeForce GTX 1060 Mobile | MSI GE72 7RE-046 i7-7700HQ, GeForce GTX 1050 Ti Mobile | |
|---|---|---|---|---|---|
| Noise | 5% | 4% | 12% | 5% | |
| uit / omgeving * (dB) | 31 | 30 3% | 30 3% | 30.8 1% | 30 3% |
| Idle Minimum * (dB) | 32 | 31 3% | 33 -3% | 31.4 2% | 34 -6% |
| Idle Average * (dB) | 38 | 34 11% | 36 5% | 31.4 17% | 35 8% |
| Idle Maximum * (dB) | 40 | 37 7% | 41 -2% | 31.4 22% | 36 10% |
| Load Average * (dB) | 42 | 44 -5% | 41 2% | 38.6 8% | 41 2% |
| Witcher 3 ultra * (dB) | 54 | 51 6% | 45 17% | ||
| Load Maximum * (dB) | 57 | 52 9% | 52 9% | 44.3 22% | 49 14% |
* ... kleiner is beter
(-) De maximumtemperatuur aan de bovenzijde bedraagt 51 °C / 124 F, vergeleken met het gemiddelde van 40.4 °C / 105 F, variërend van 21.2 tot 68.8 °C voor de klasse Gaming.
(-) De bodem warmt op tot een maximum van 54 °C / 129 F, vergeleken met een gemiddelde van 43.2 °C / 110 F
(+) Bij onbelast gebruik bedraagt de gemiddelde temperatuur voor de bovenzijde 29.6 °C / 85 F, vergeleken met het apparaatgemiddelde van 33.9 °C / 93 F.
(-) Bij het spelen van The Witcher 3 is de gemiddelde temperatuur voor de bovenzijde 40.2 °C / 104 F, vergeleken met het apparaatgemiddelde van 33.9 °C / 93 F.
(±) De palmsteunen en het touchpad kunnen zeer heet aanvoelen met een maximum van ###max## °C / 102.2 F.
(-) De gemiddelde temperatuur van de handpalmsteun van soortgelijke toestellen bedroeg 28.8 °C / 83.8 F (-10.2 °C / -18.4 F).
Asus GL702ZC-GC104T audioanalyse
(+) | luidsprekers kunnen relatief luid spelen (82 dB)
Bas 100 - 315 Hz
(±) | verminderde zeebaars - gemiddeld 8.4% lager dan de mediaan
(±) | lineariteit van de lage tonen is gemiddeld (11.5% delta ten opzichte van de vorige frequentie)
Midden 400 - 2000 Hz
(+) | evenwichtige middens - slechts 4.7% verwijderd van de mediaan
(+) | de middentonen zijn lineair (4.1% delta ten opzichte van de vorige frequentie)
Hoog 2 - 16 kHz
(+) | evenwichtige hoogtepunten - slechts 2.9% verwijderd van de mediaan
(+) | de hoge tonen zijn lineair (5.2% delta naar de vorige frequentie)
Algemeen 100 - 16.000 Hz
(+) | het totale geluid is lineair (12.5% verschil met de mediaan)
Vergeleken met dezelfde klasse
» 15% van alle geteste apparaten in deze klasse waren beter, 3% vergelijkbaar, 81% slechter
» De beste had een delta van 6%, het gemiddelde was 18%, de slechtste was 132%
Vergeleken met alle geteste toestellen
» 11% van alle geteste apparaten waren beter, 2% gelijk, 86% slechter
» De beste had een delta van 4%, het gemiddelde was 23%, de slechtste was 134%
MSI GE72 7RE-046 audioanalyse
(+) | luidsprekers kunnen relatief luid spelen (91 dB)
Bas 100 - 315 Hz
(-) | bijna geen lage tonen - gemiddeld 17.2% lager dan de mediaan
(±) | lineariteit van de lage tonen is gemiddeld (9.2% delta ten opzichte van de vorige frequentie)
Midden 400 - 2000 Hz
(+) | evenwichtige middens - slechts 3.3% verwijderd van de mediaan
(+) | de middentonen zijn lineair (4.7% delta ten opzichte van de vorige frequentie)
Hoog 2 - 16 kHz
(+) | evenwichtige hoogtepunten - slechts 3.3% verwijderd van de mediaan
(+) | de hoge tonen zijn lineair (4% delta naar de vorige frequentie)
Algemeen 100 - 16.000 Hz
(+) | het totale geluid is lineair (13.7% verschil met de mediaan)
Vergeleken met dezelfde klasse
» 21% van alle geteste apparaten in deze klasse waren beter, 7% vergelijkbaar, 72% slechter
» De beste had een delta van 6%, het gemiddelde was 18%, de slechtste was 132%
Vergeleken met alle geteste toestellen
» 15% van alle geteste apparaten waren beter, 4% gelijk, 81% slechter
» De beste had een delta van 4%, het gemiddelde was 23%, de slechtste was 134%
| Uit / Standby | |
| Inactief | |
| Belasting |
|
Key:
min: | |
| Asus GL702ZC-GC104T R7 1700, Radeon RX 580 (Laptop) | Schenker XMG U727 2017 i7-7700K, GeForce GTX 1080 Mobile | Aorus X7 v7 i7-7820HK, GeForce GTX 1070 Mobile | Acer Aspire V17 Nitro BE VN7-793-738J i7-7700HQ, GeForce GTX 1060 Mobile | MSI GE72 7RE-046 i7-7700HQ, GeForce GTX 1050 Ti Mobile | |
|---|---|---|---|---|---|
| Power Consumption | -10% | 17% | 52% | 52% | |
| Idle Minimum * (Watt) | 43 | 32 26% | 27 37% | 10.5 76% | 14 67% |
| Idle Average * (Watt) | 50 | 43 14% | 33 34% | 20.5 59% | 20 60% |
| Idle Maximum * (Watt) | 57 | 51 11% | 40 30% | 22 61% | 25 56% |
| Load Average * (Watt) | 125 | 138 -10% | 107 14% | 91 27% | 82 34% |
| Witcher 3 ultra * (Watt) | 180 | 279 -55% | 190 -6% | ||
| Load Maximum * (Watt) | 240 | 350 -46% | 259 -8% | 155 35% | 135 44% |
* ... kleiner is beter
| Asus GL702ZC-GC104T R7 1700, Radeon RX 580 (Laptop), 76 Wh | Schenker XMG U727 2017 i7-7700K, GeForce GTX 1080 Mobile, 89 Wh | Aorus X7 v7 i7-7820HK, GeForce GTX 1070 Mobile, 94 Wh | Acer Aspire V17 Nitro BE VN7-793-738J i7-7700HQ, GeForce GTX 1060 Mobile, 69 Wh | MSI GE72 7RE-046 i7-7700HQ, GeForce GTX 1050 Ti Mobile, 51.4 Wh | |
|---|---|---|---|---|---|
| Batterijduur | 94% | 90% | 207% | 114% | |
| Reader / Idle (h) | 1.7 | 3.7 118% | 3.7 118% | ||
| H.264 (h) | 1.5 | 2.8 87% | 3.3 120% | ||
| WiFi v1.3 (h) | 1.5 | 2.8 87% | 3 100% | 4.6 207% | 3.1 107% |
| Load (h) | 0.9 | 1.6 78% | 1.4 56% |
Pro
Contra
Dit is de verkorte versie van het originele artikel. Het volledige, Engelse testrapport vind je hier.
De waardering van de Asus ROG Strix GL702ZC hangt erg af van het bedoelde gebruik. Professionele gebruikers die de hoogst mogelijke CPU prestaties nodig hebben en/of ervan profiteren zullen met deze 17-incher een bijna ongeëvenaard snel systeem krijgen. De 8-core Ryzen 7 1700 presteert beter dan alle Intel-gebaseerde laptops (zelfs die met een desktop CPU) die we tot nu toe getest hebben. De GL702ZC zou dan ook erg aantrekkelijk moeten zijn voor deze doelgroep.
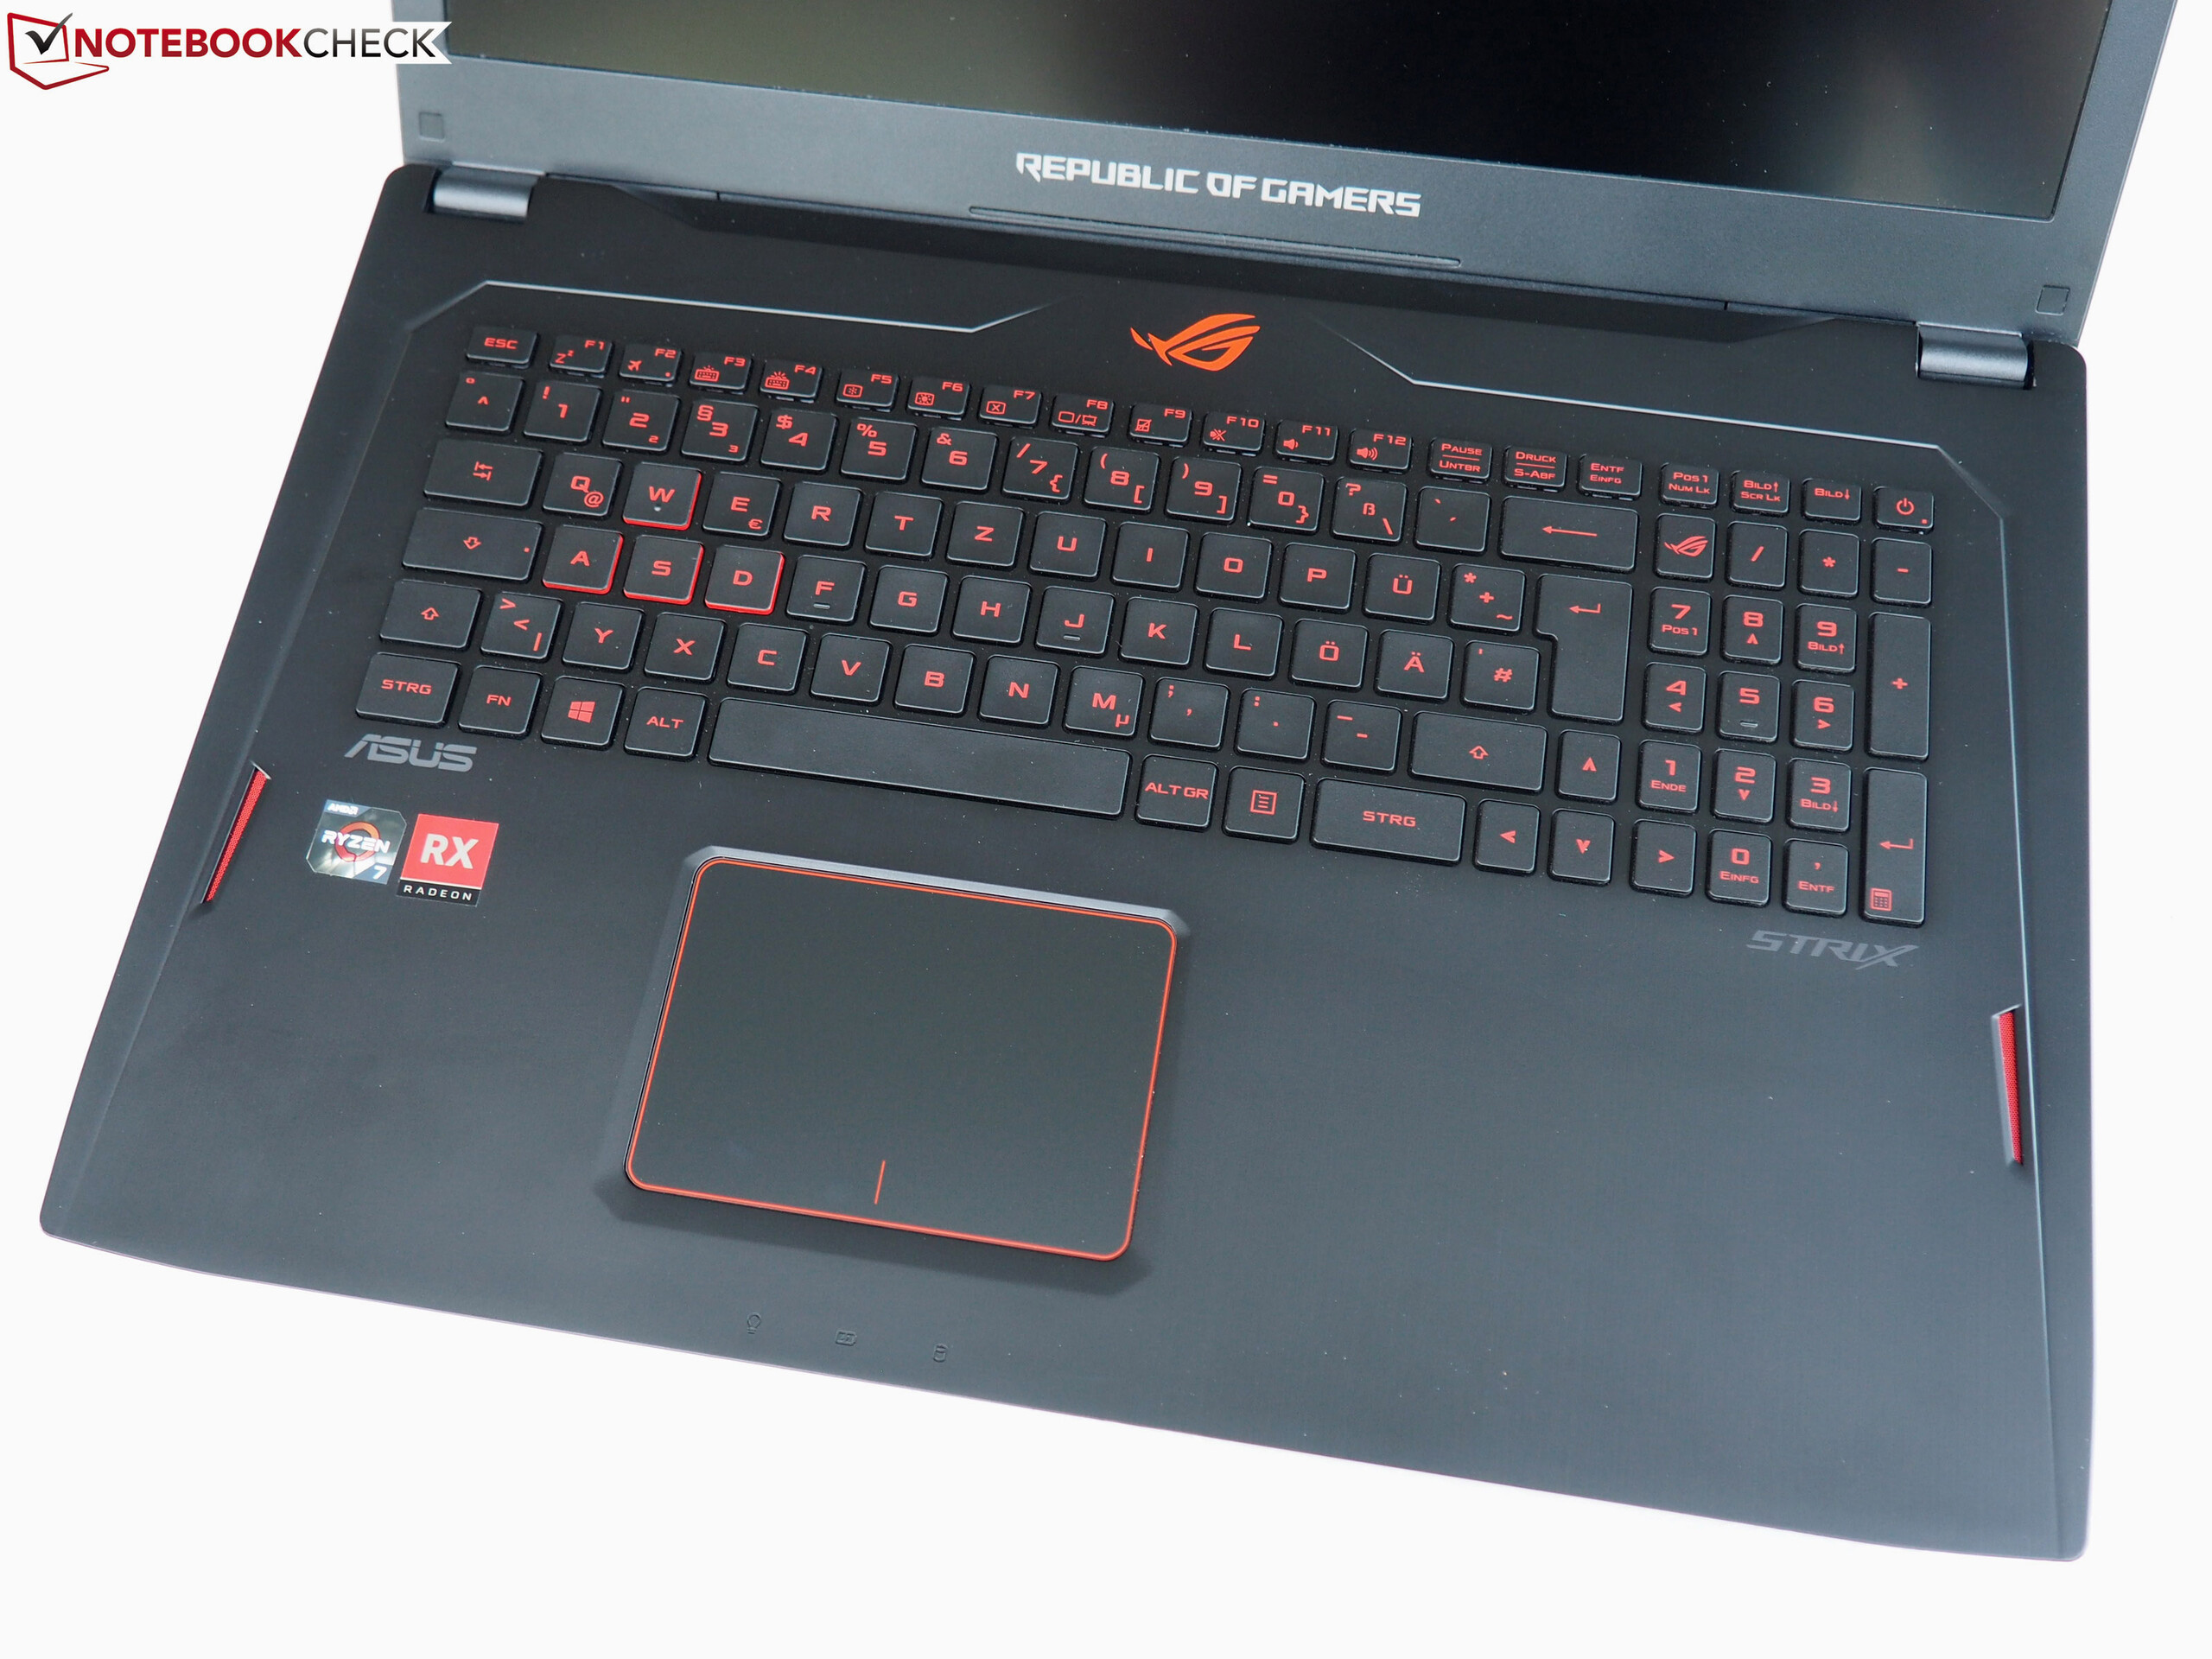
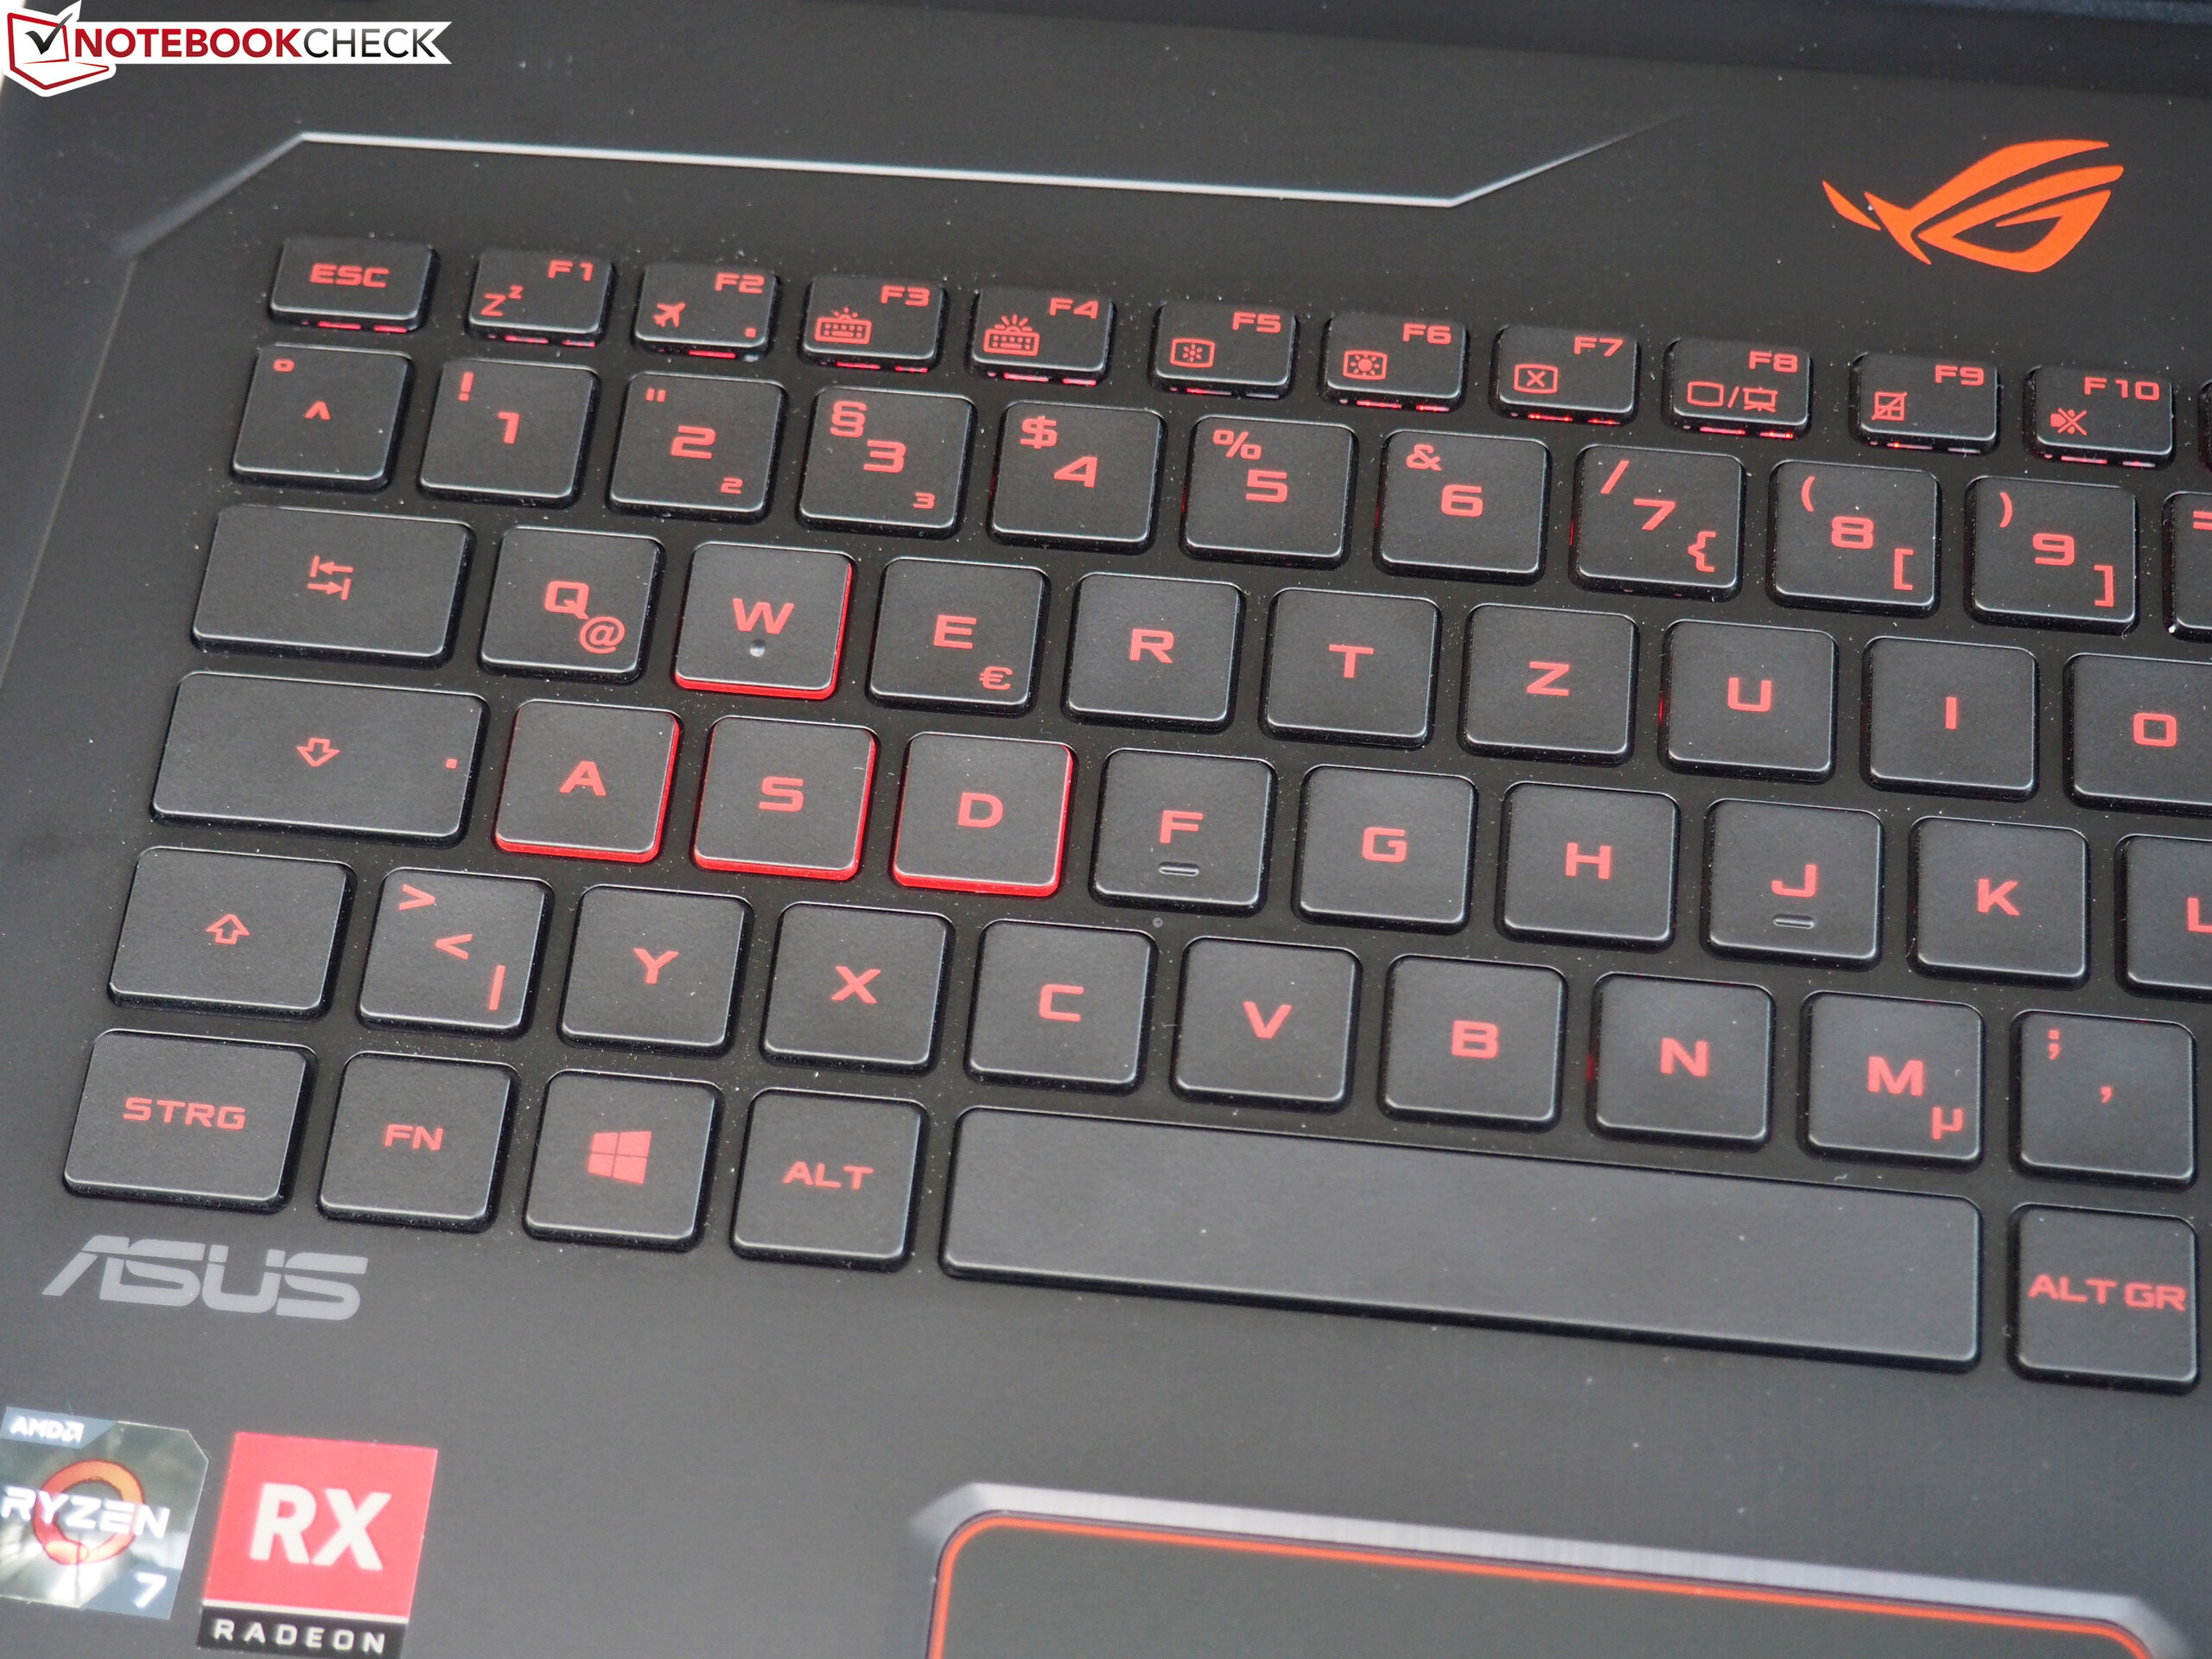
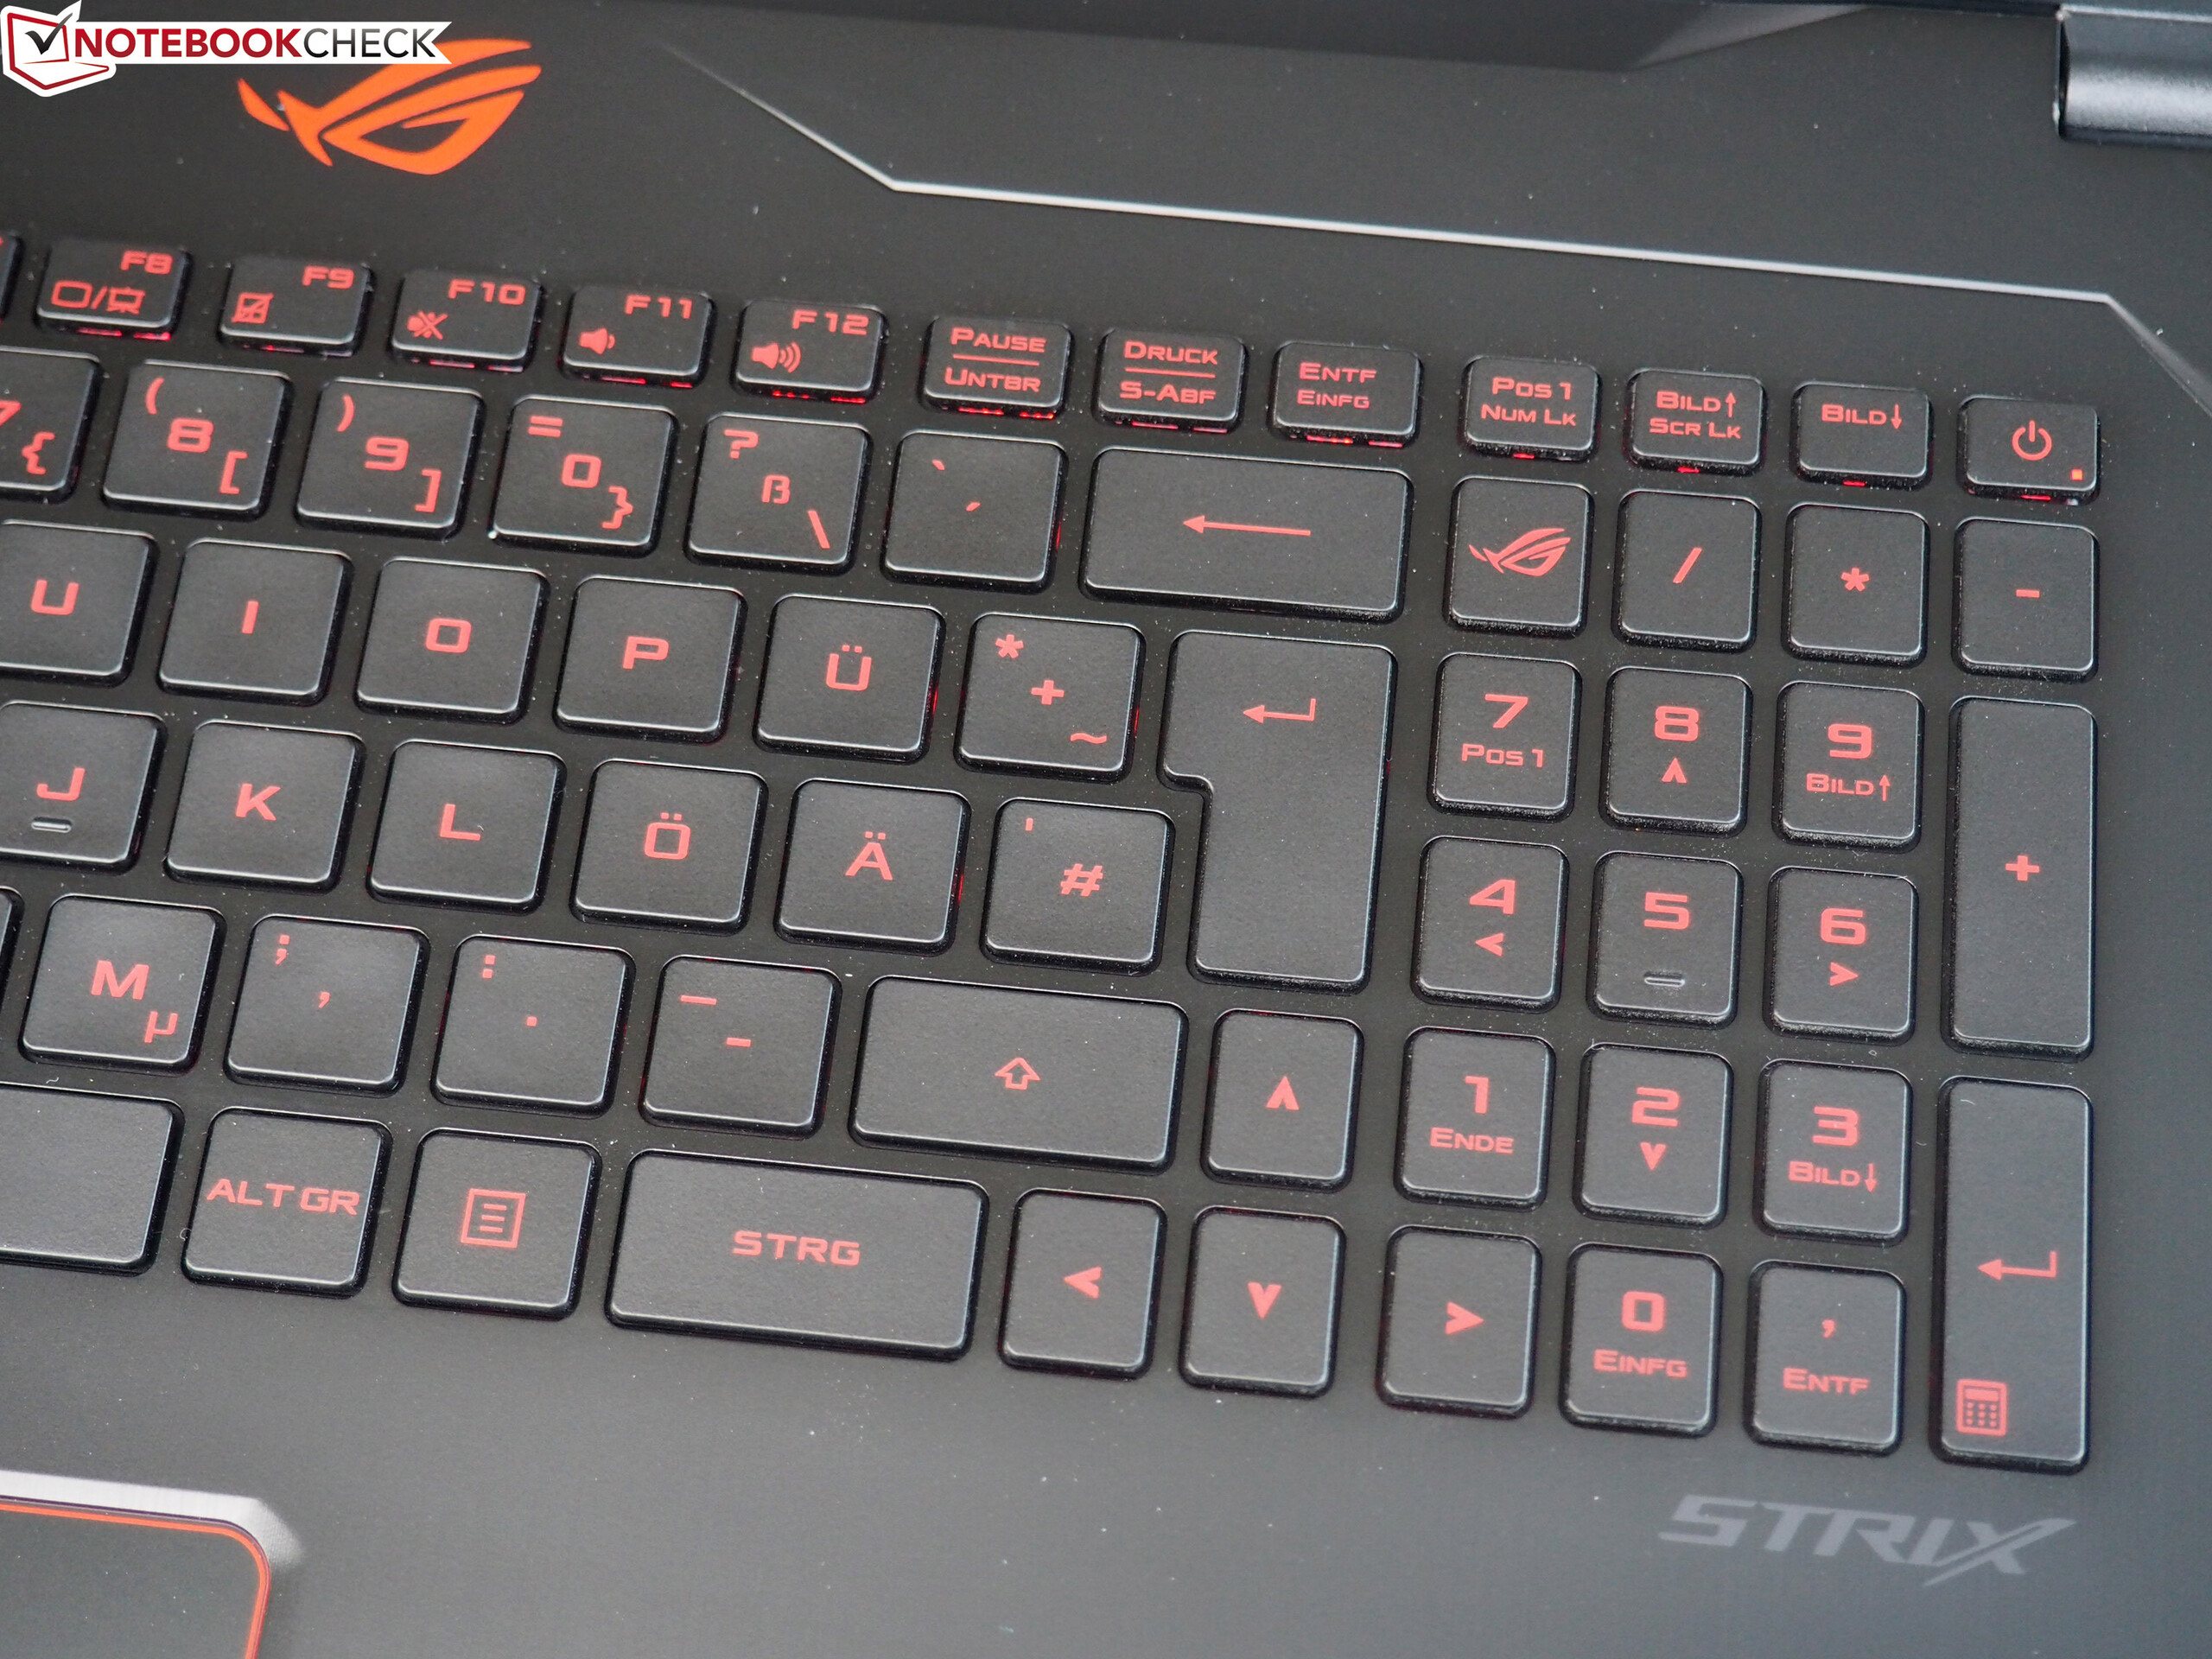
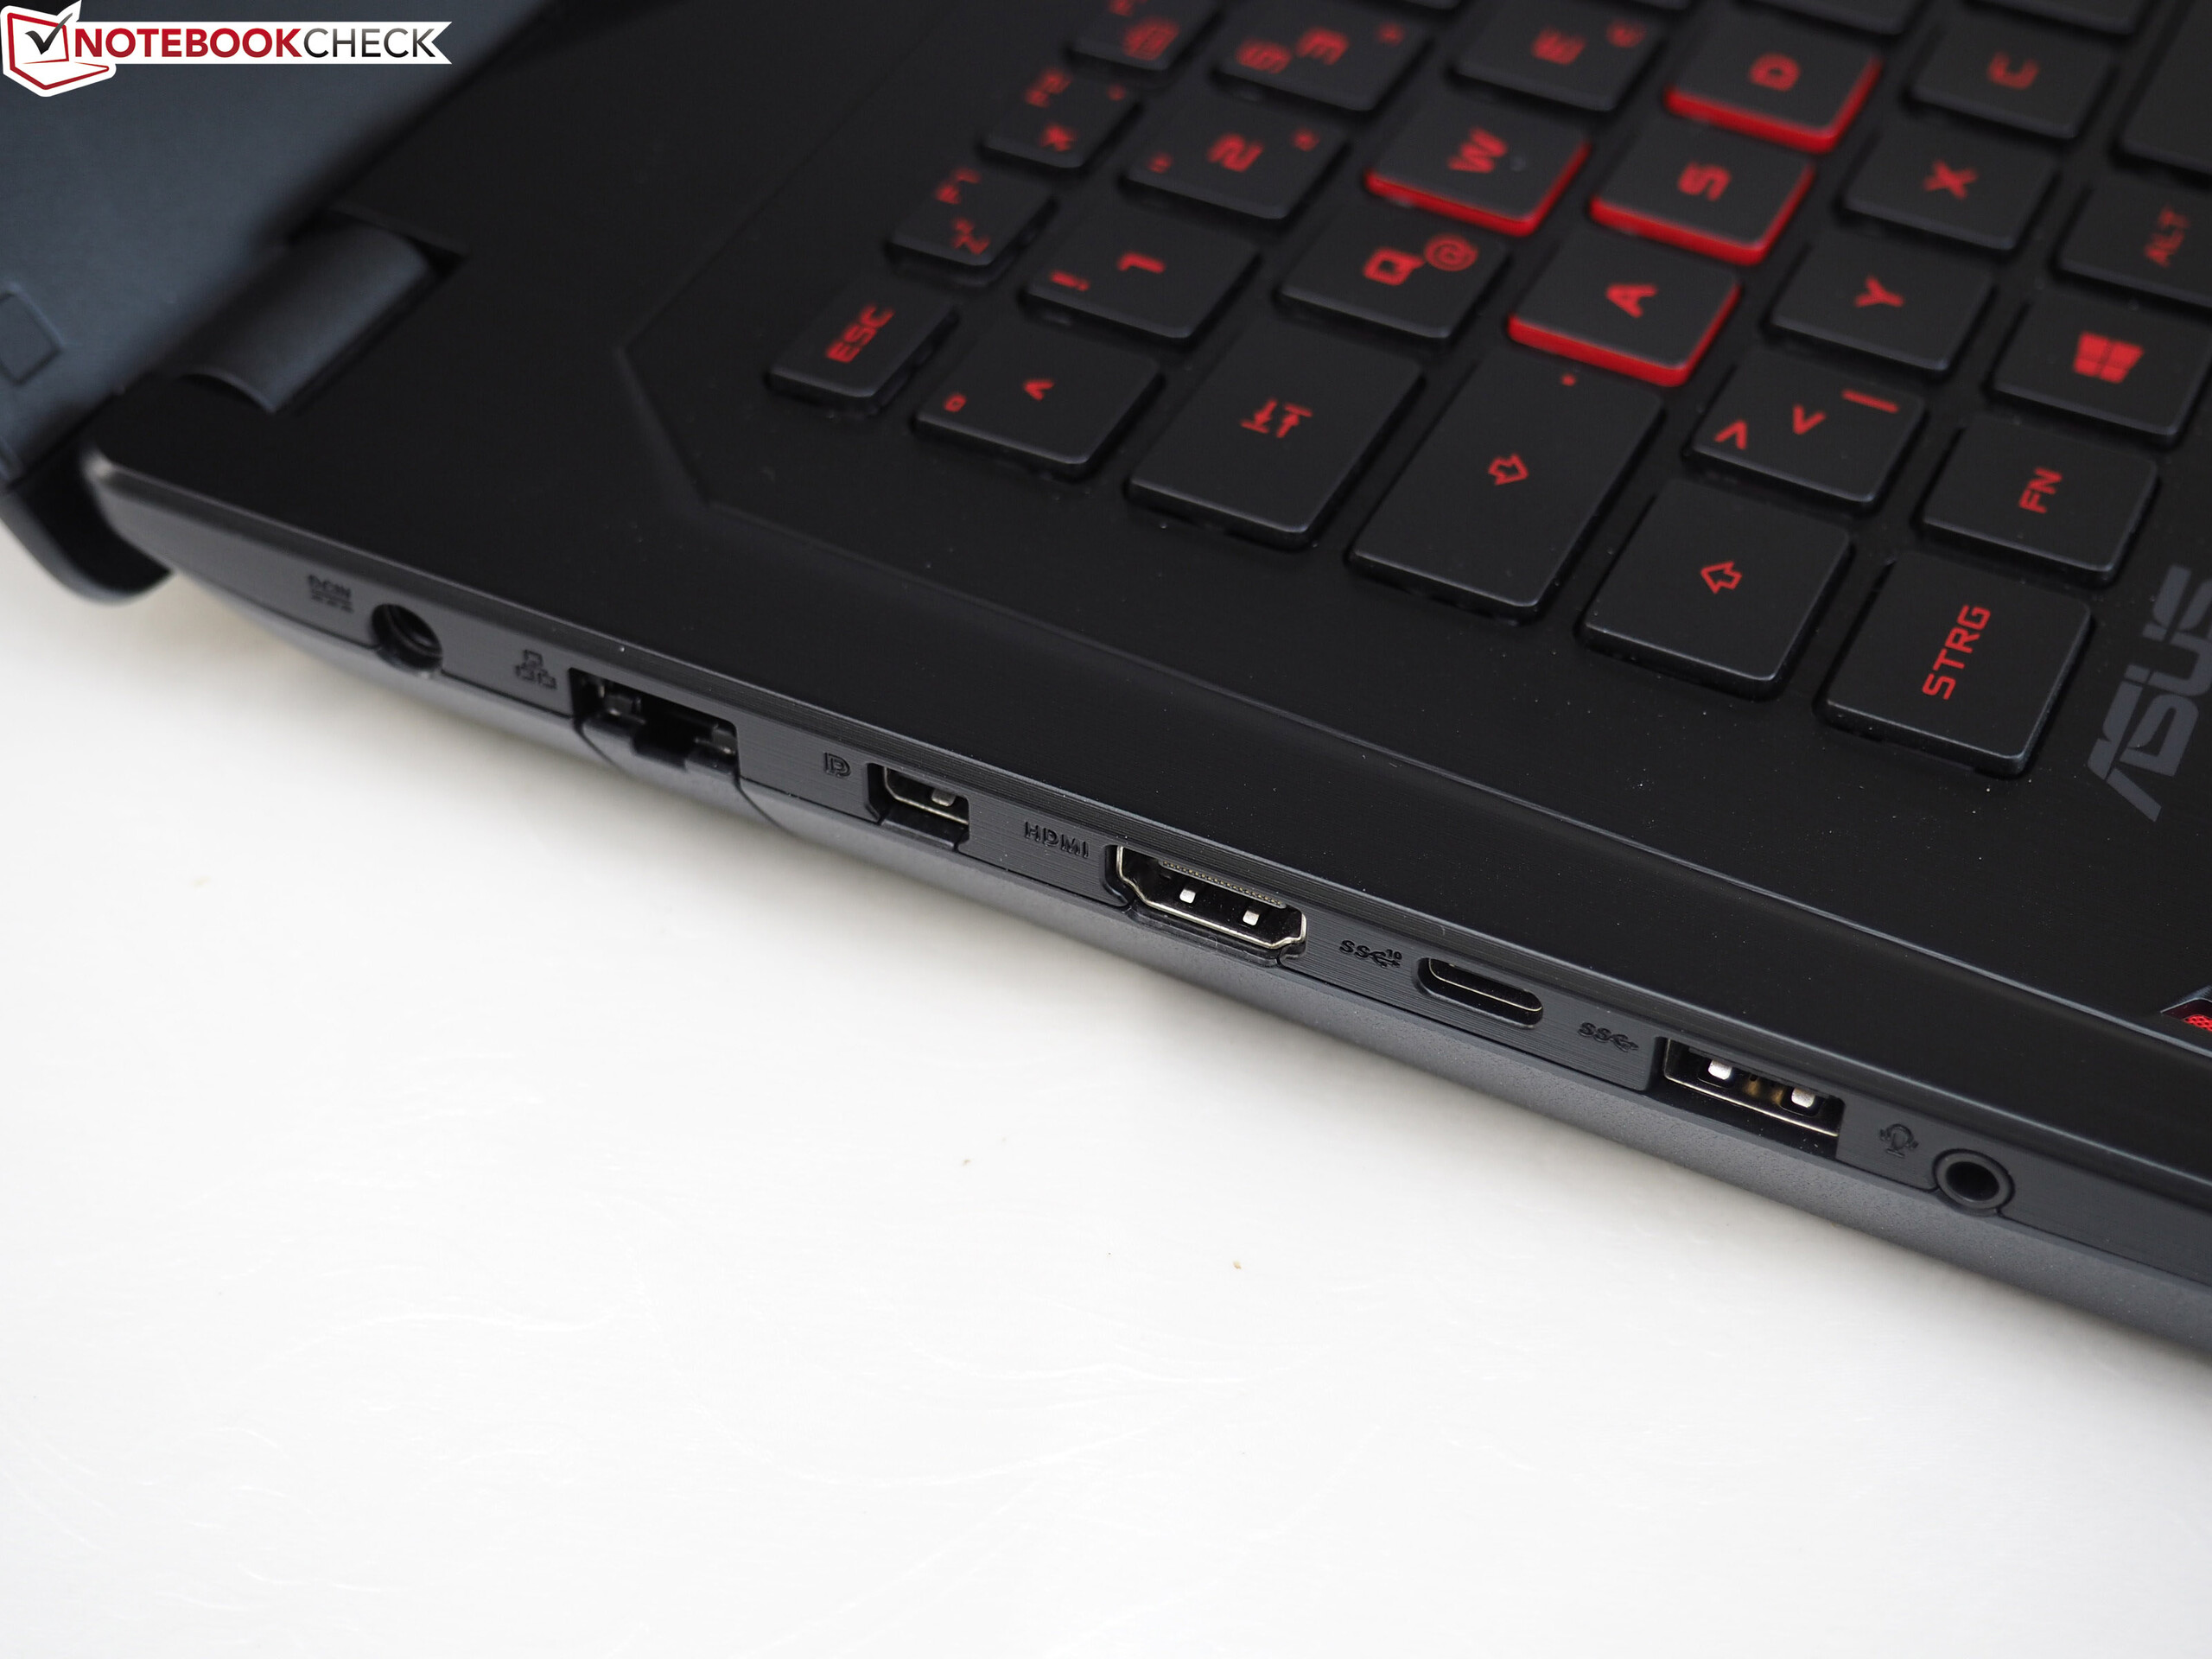
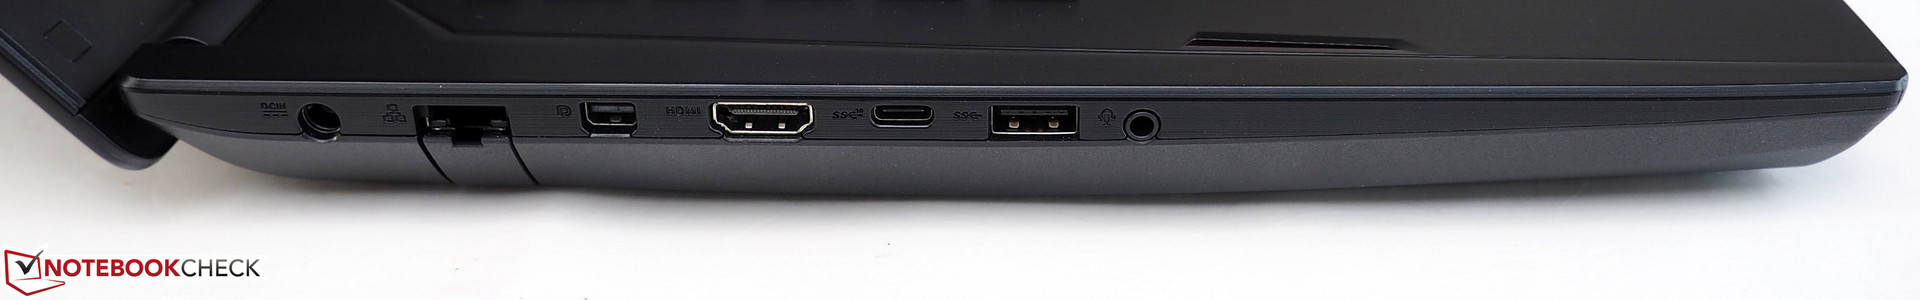
De situatie is anders voor gamers. De notebook is aanzienlijk minder interessant en aantrekkelijk voor hen. Hoewel de Radeon RX 580 goede prestaties levert op de standaard resolutie van 1920 x 1080 pixels, zullen gamers over het algemeen beter af zijn met een combinatie van Intel CPU en nVidia GPU omdat die vrijwel altijd stiller zijn en minder kosten of sneller zijn voor dezelfde prijs. Het oordeel geld ook voor de Ryzen 5 1600 variant, die tot op zekere hoogte wel een beter prijs/prestatieverhouding heeft. Invoerapparaten en aansluitingen (geen Thunderbolt 3) hadden ook beter kunnen zijn.
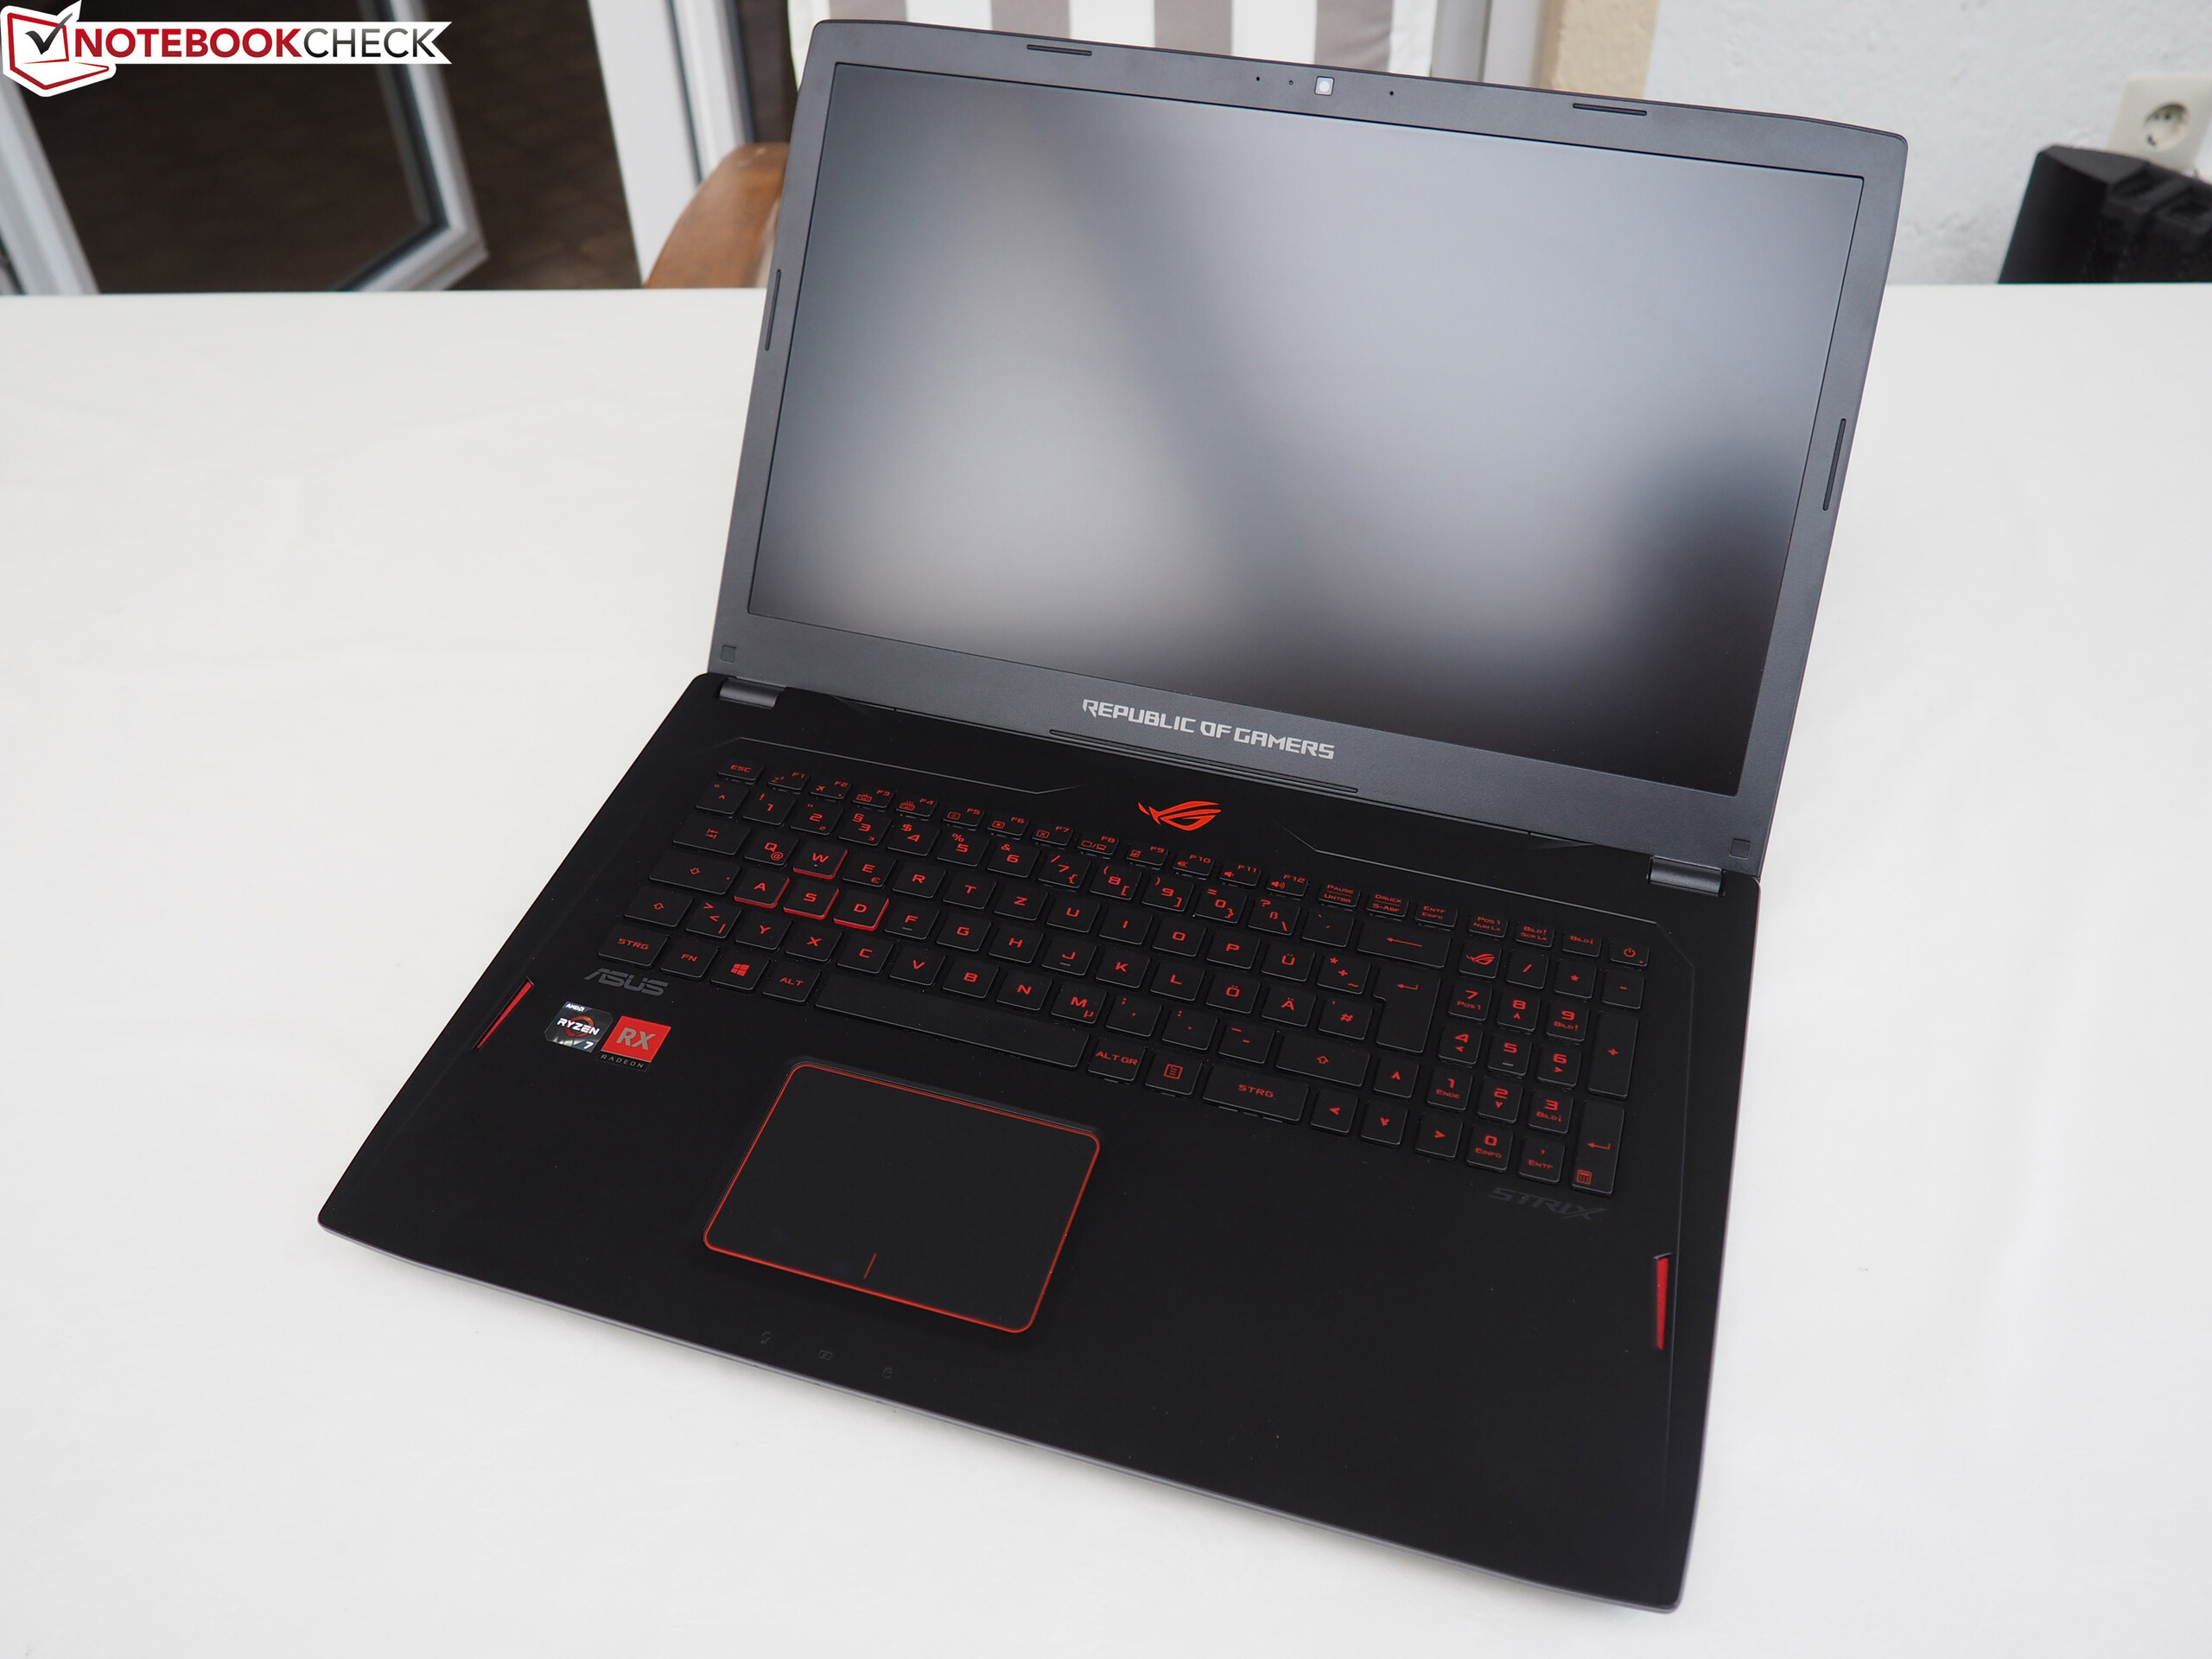
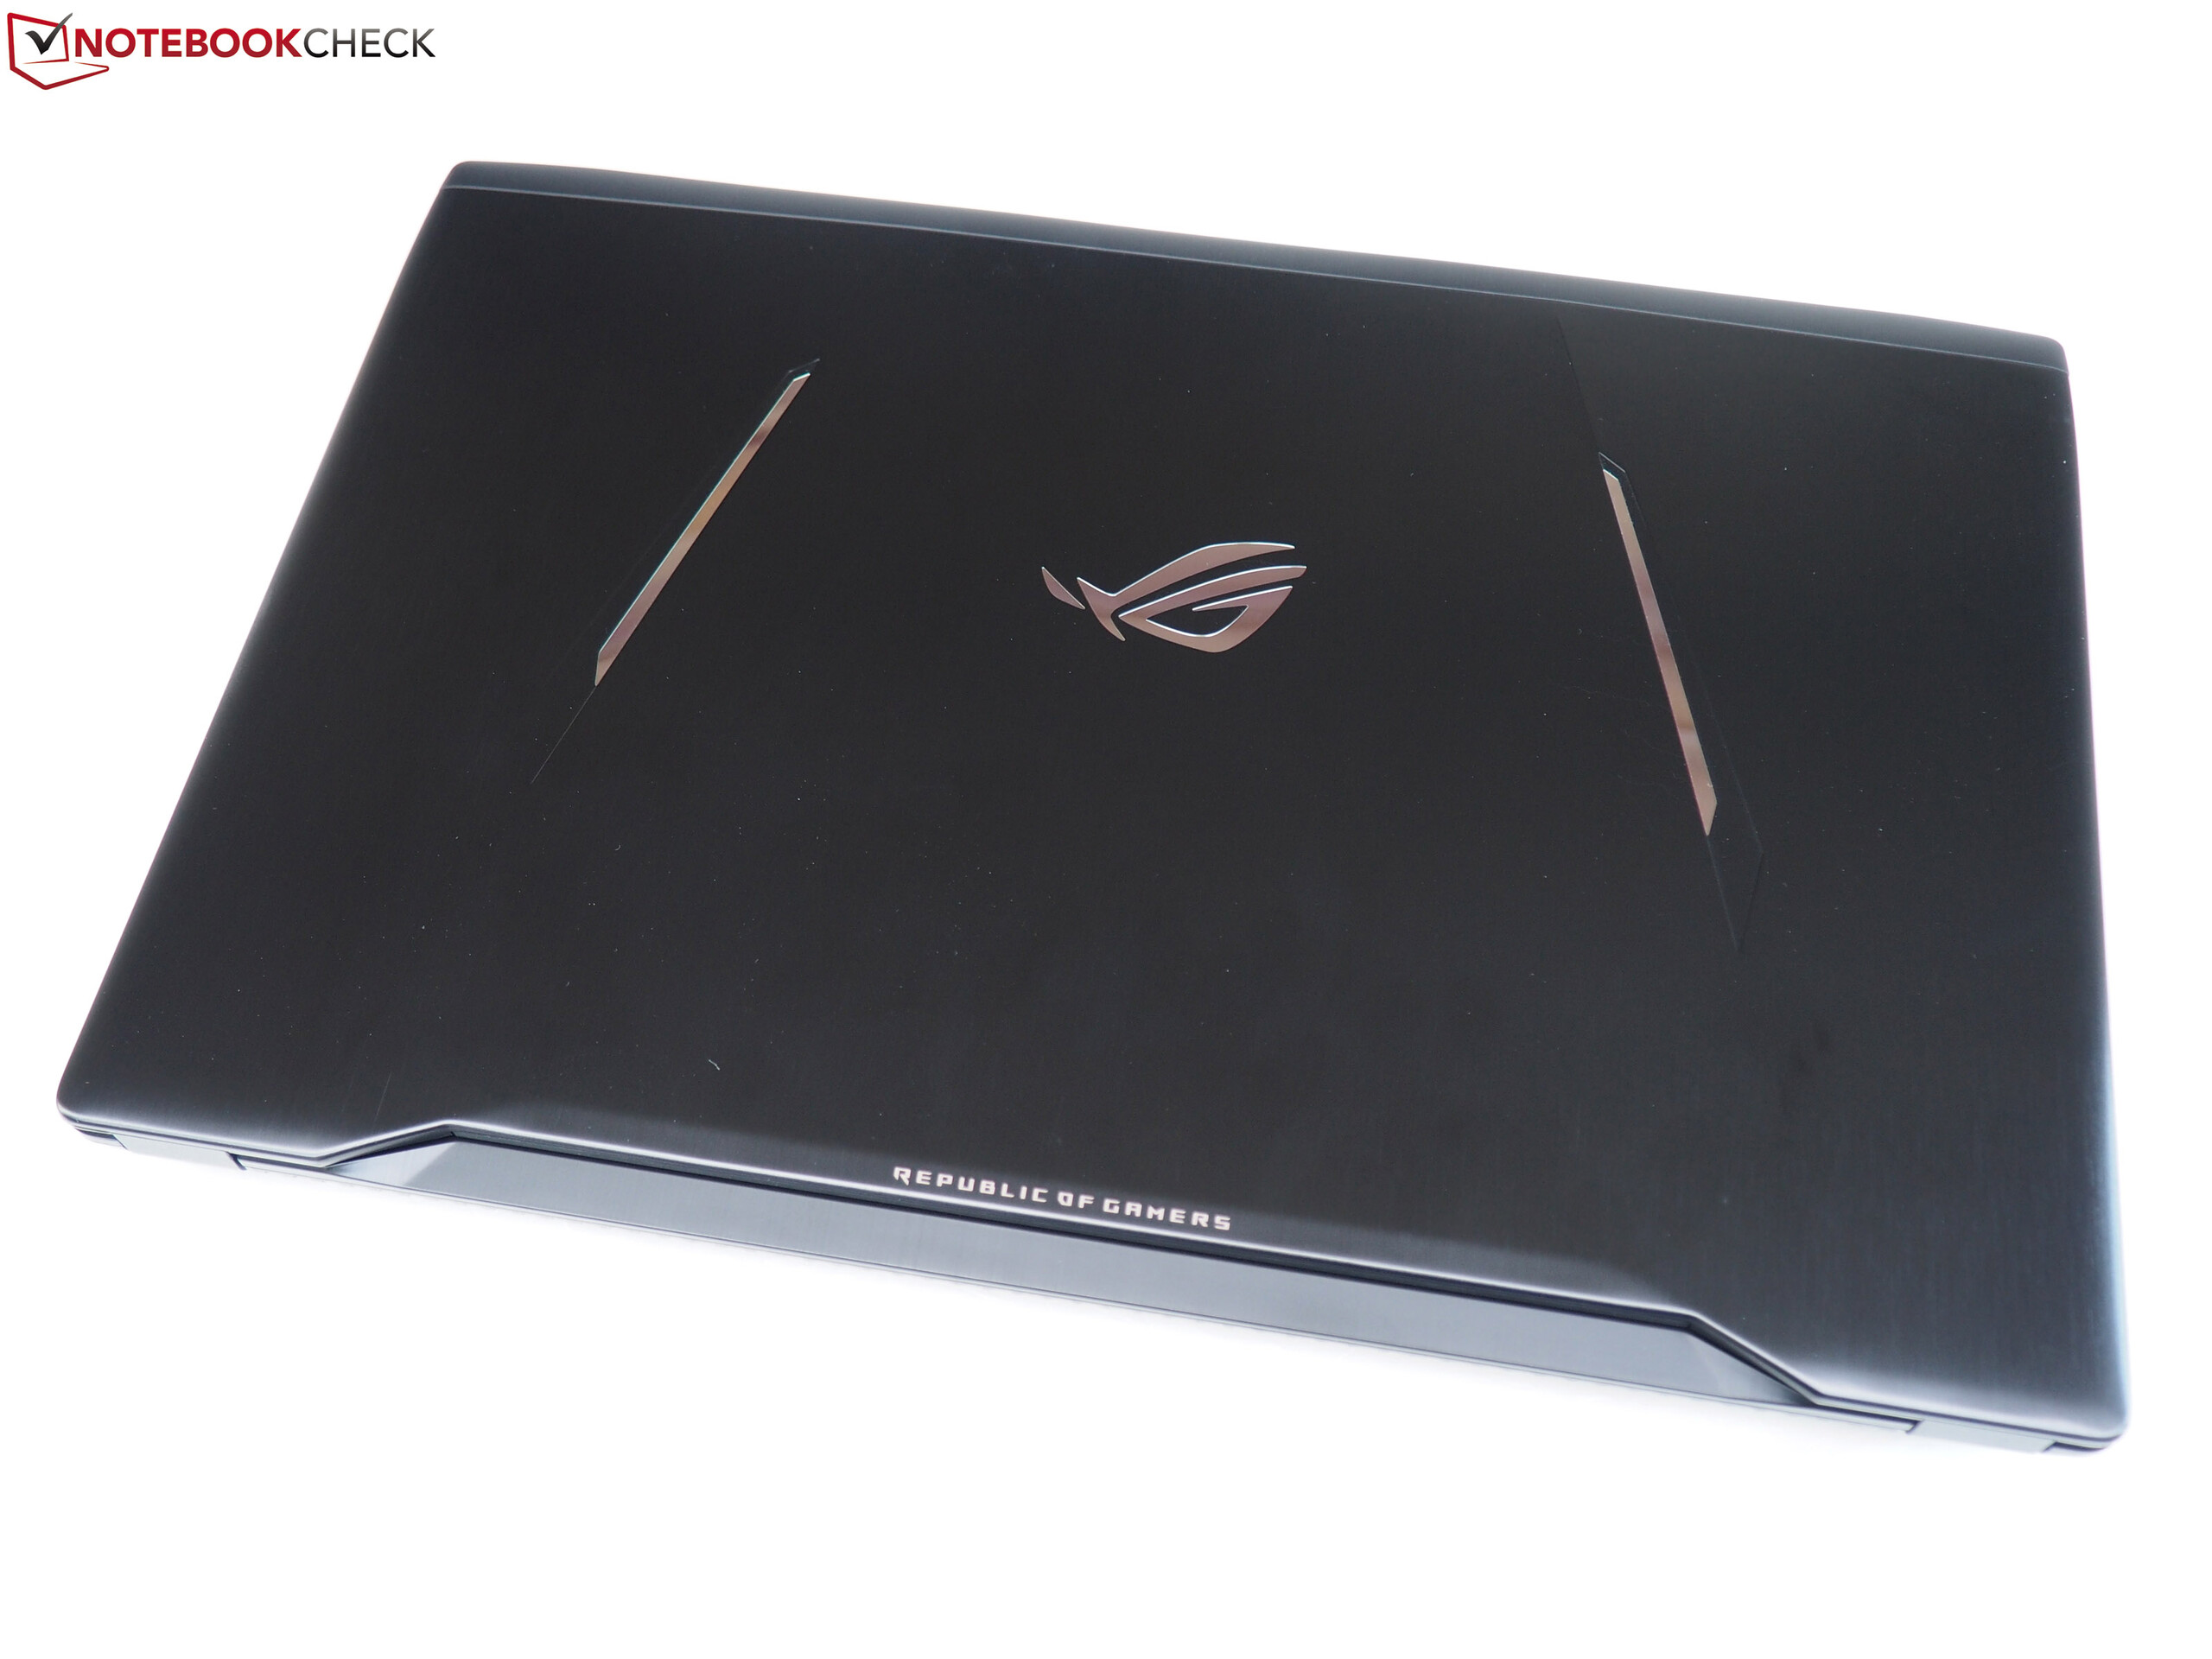
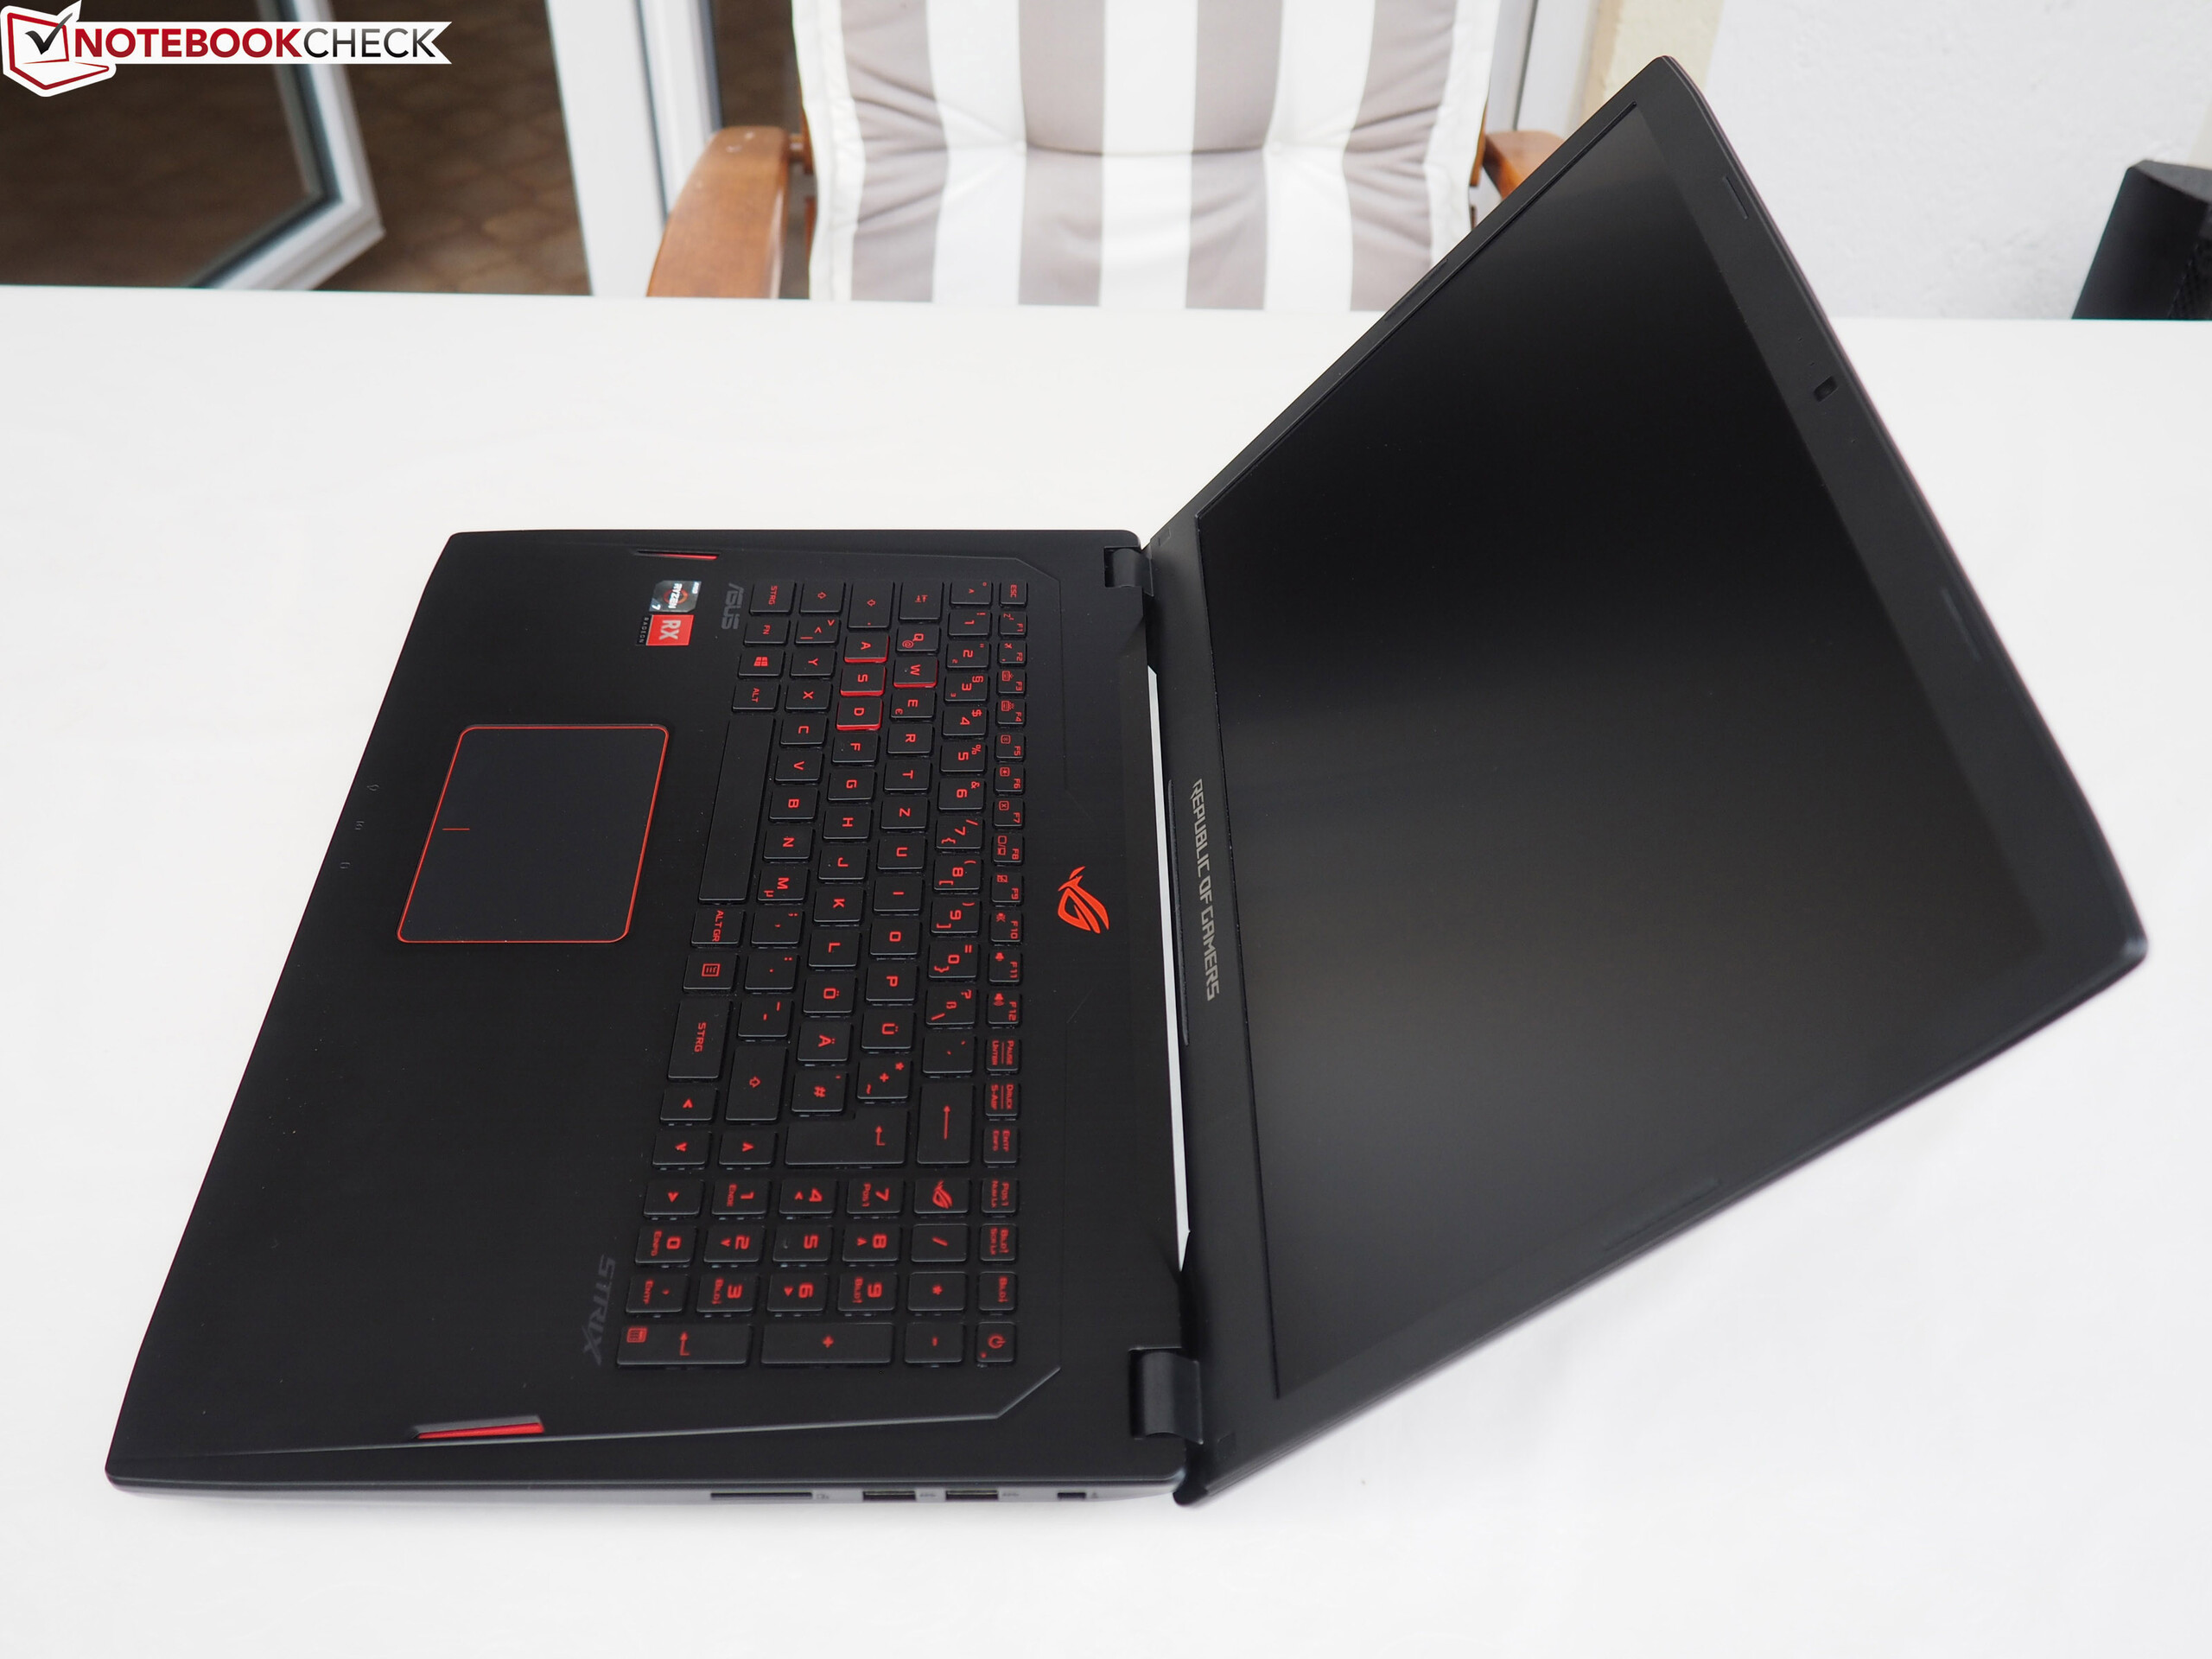
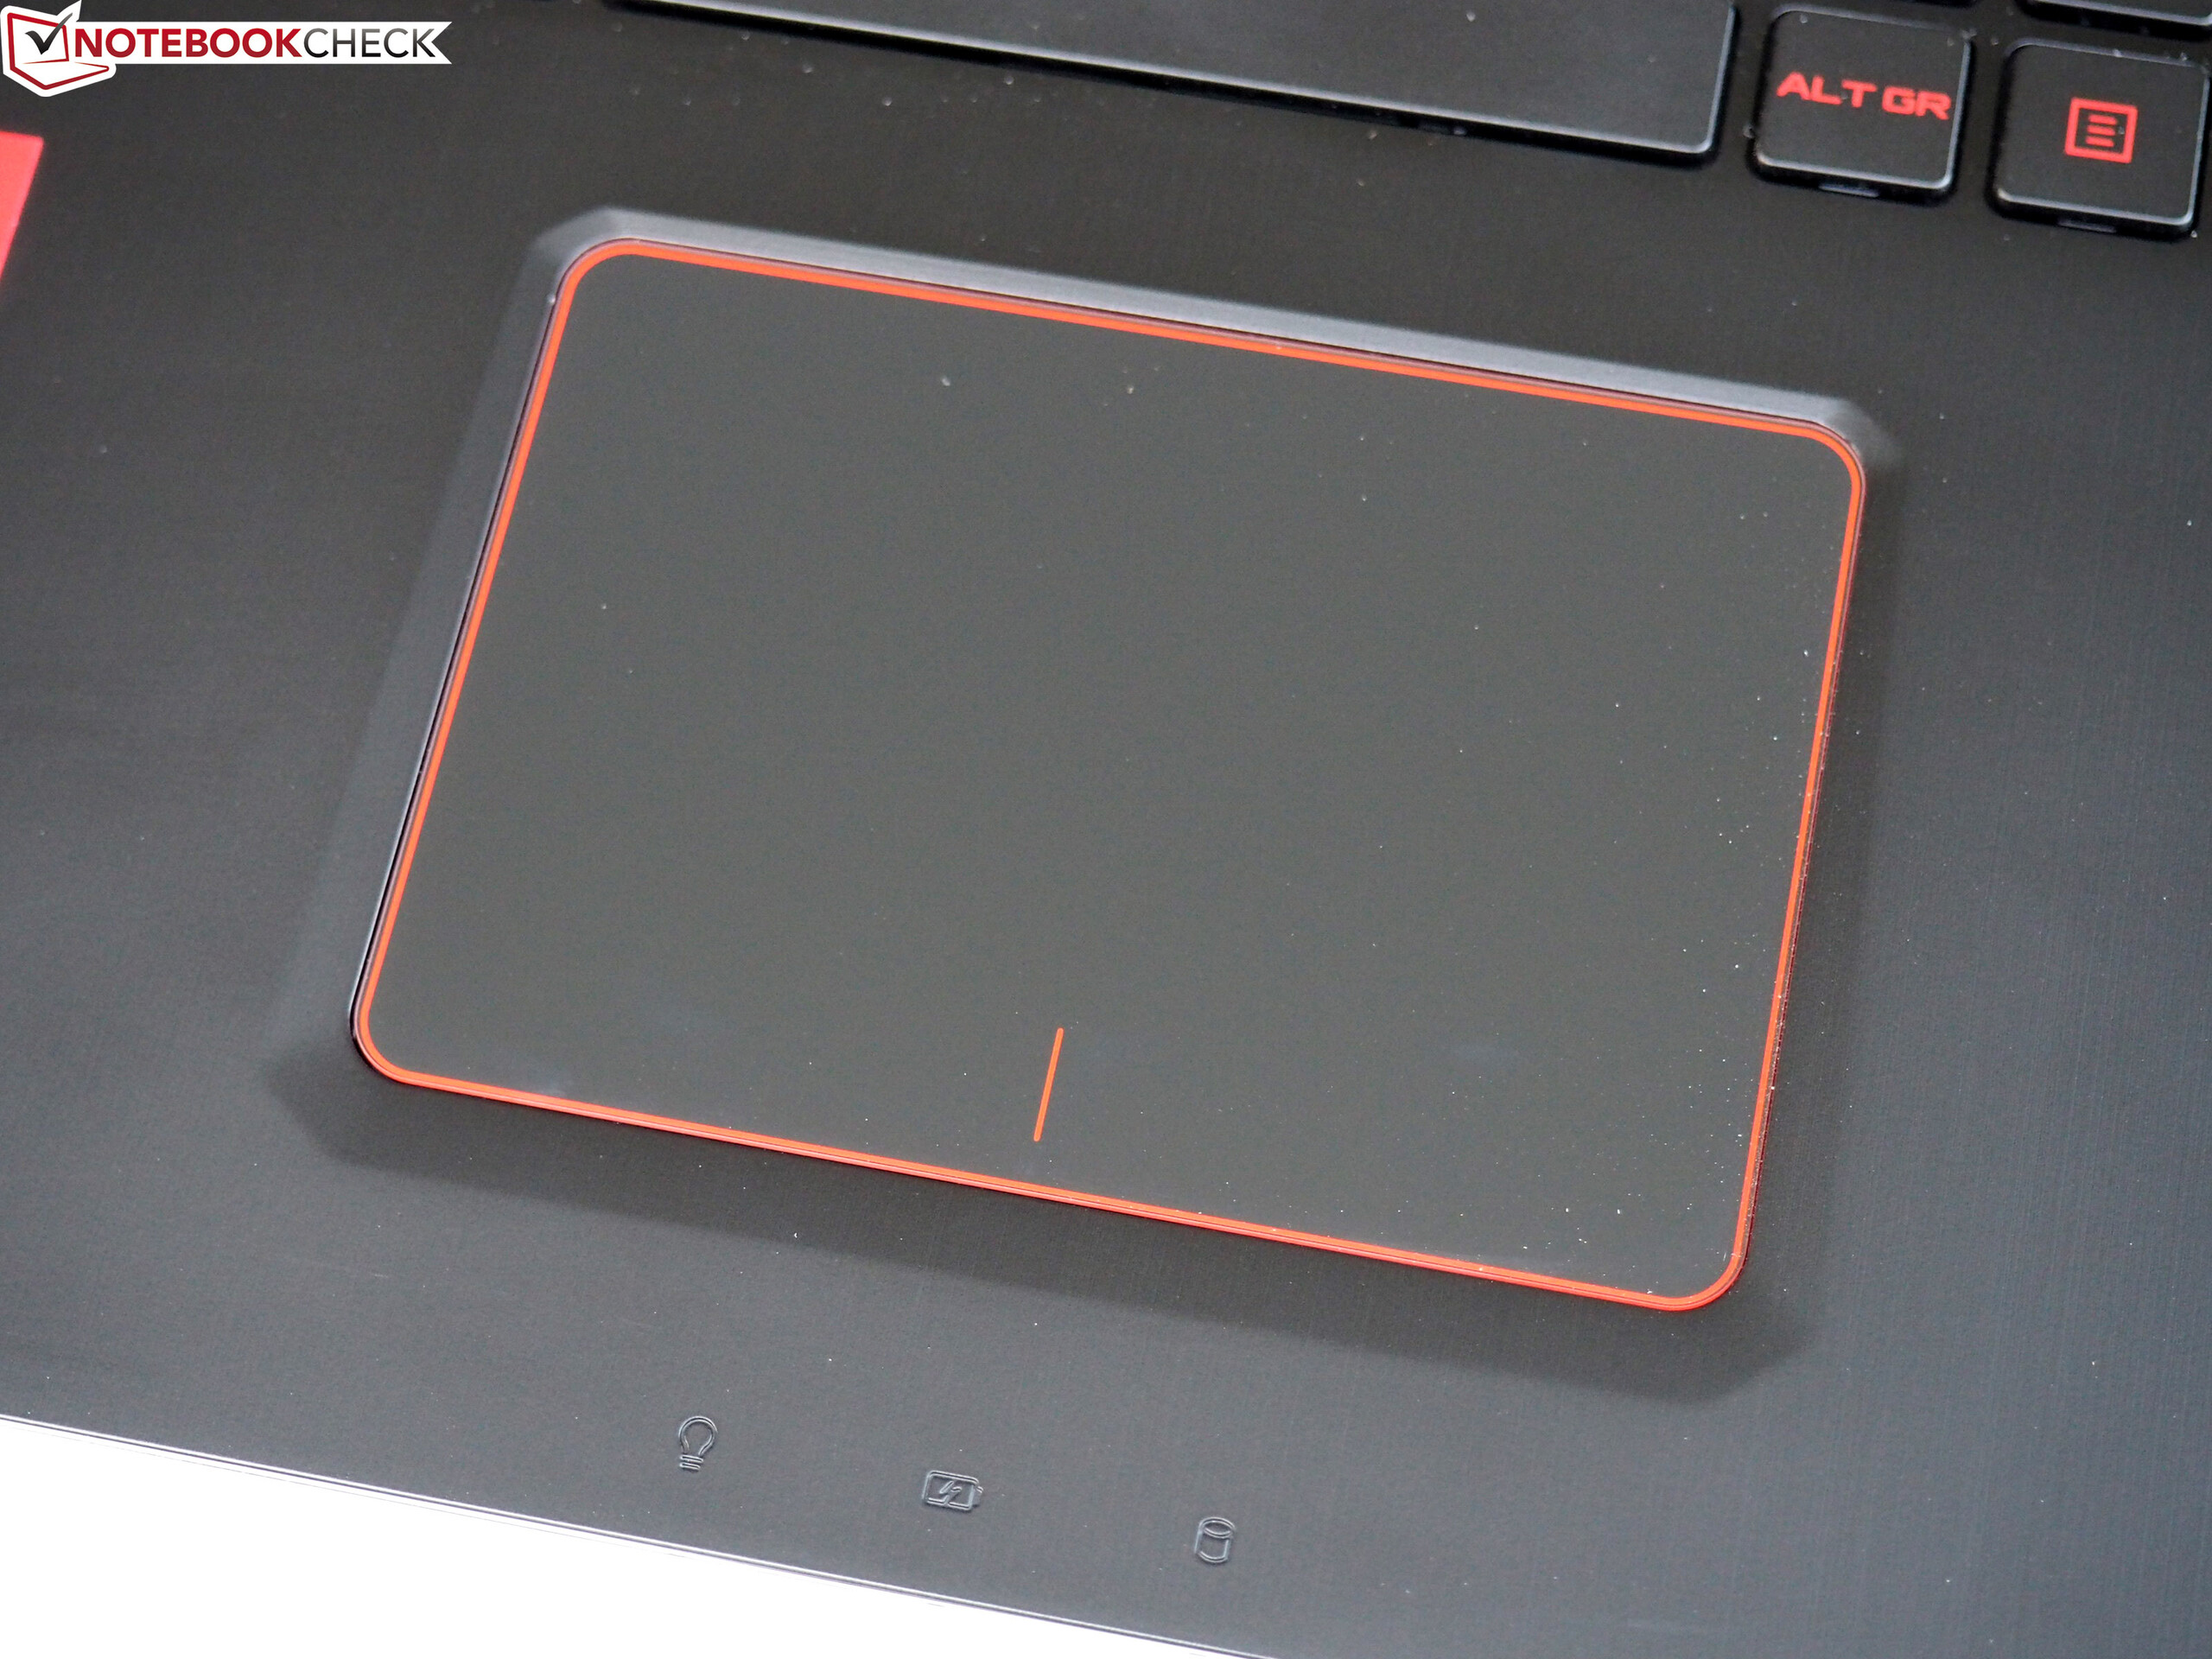
Voor het overige heeft de GL702ZC geen grote nalatigheden. Naast de stijlvolle en nauwkeurig gefabriceerde behuizing waarderen we ook het geluid van de luidsprekers en het heldere contrastrijke IPS beeldscherm. Toch slaagt de GL702ZC er door de eerder genoemde zwakheden niet in om de Gaming Top 10 binnen te dringen.
Asus GL702ZC-GC104T
- 14-09-2017 v6 (old)
Florian Glaser
Price comparison