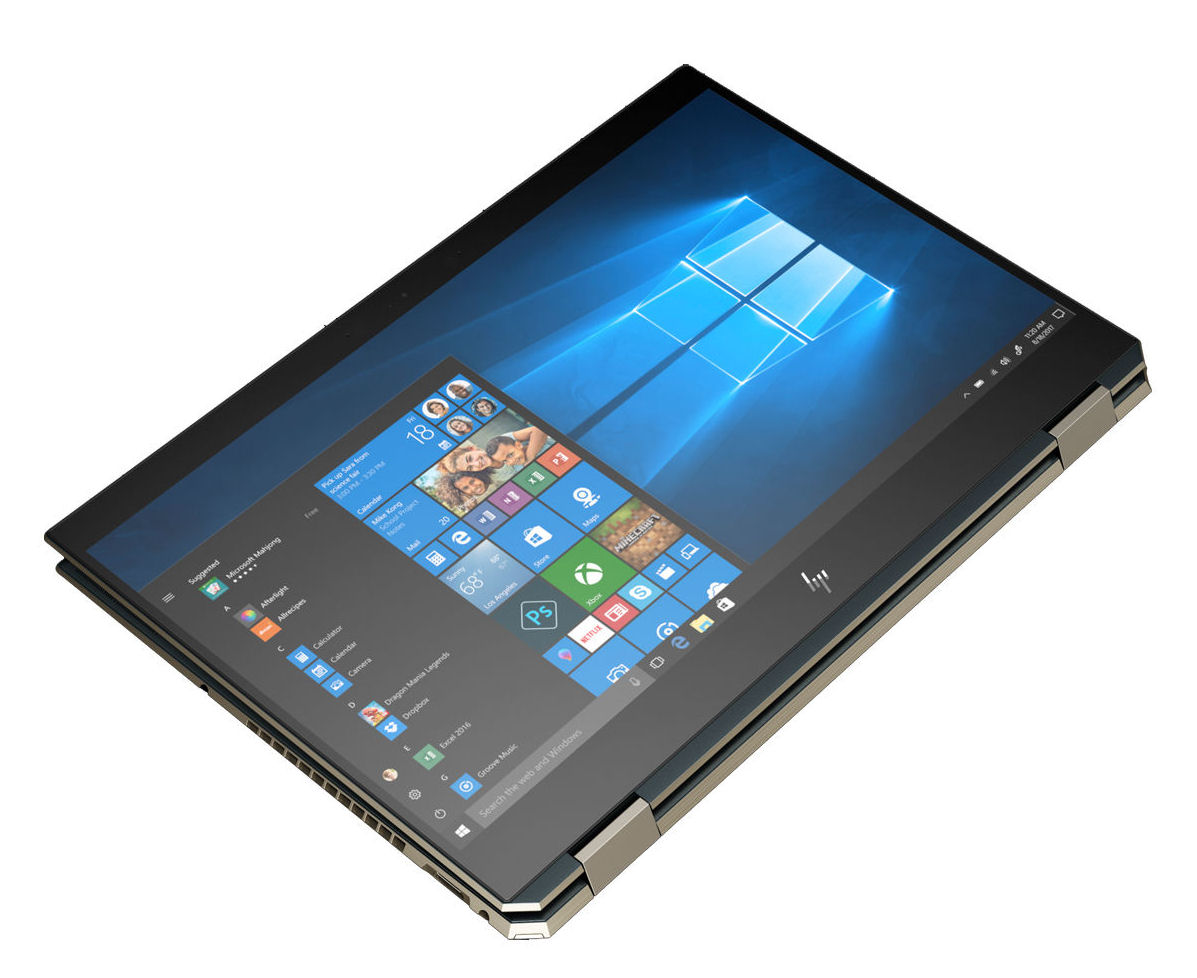
Kort testrapport HP Spectre x360 15 (Core i7-8750H, GTX 1050 Ti Max-Q, 2 TB SSD, 4K) Convertible
| SD Card Reader | |
| average JPG Copy Test (av. of 3 runs) | |
| HP Spectre x360 15-ch000 (Toshiba Exceria Pro SDXC 64 GB UHS-II) | |
| Dell XPS 15 9570 i7 UHD (Toshiba Exceria Pro SDXC 64 GB UHS-II) | |
| HP Spectre x360 15-ch011nr (Toshiba Exceria Pro SDXC 64 GB UHS-II) | |
| HP Spectre x360 15-df0126ng (Toshiba Exceria Pro M501 microSDXC 64GB) | |
| Gemiddelde van klas Multimedia (23 - 531, n=43, laatste 2 jaar) | |
| Asus ZenBook Flip 15 UX561UD (Toshiba Exceria Pro SDXC 64 GB UHS-II) | |
| Acer Spin 5 SP515-51GN-80A3 (Toshiba Exceria Pro SDXC 64 GB UHS-II) | |
| maximum AS SSD Seq Read Test (1GB) | |
| HP Spectre x360 15-ch011nr (Toshiba Exceria Pro SDXC 64 GB UHS-II) | |
| HP Spectre x360 15-ch000 (Toshiba Exceria Pro SDXC 64 GB UHS-II) | |
| HP Spectre x360 15-df0126ng (Toshiba Exceria Pro M501 microSDXC 64GB) | |
| Dell XPS 15 9570 i7 UHD (Toshiba Exceria Pro SDXC 64 GB UHS-II) | |
| Gemiddelde van klas Multimedia (27.9 - 1455, n=42, laatste 2 jaar) | |
| Asus ZenBook Flip 15 UX561UD (Toshiba Exceria Pro SDXC 64 GB UHS-II) | |
| Acer Spin 5 SP515-51GN-80A3 (Toshiba Exceria Pro SDXC 64 GB UHS-II) | |
| |||||||||||||||||||||||||
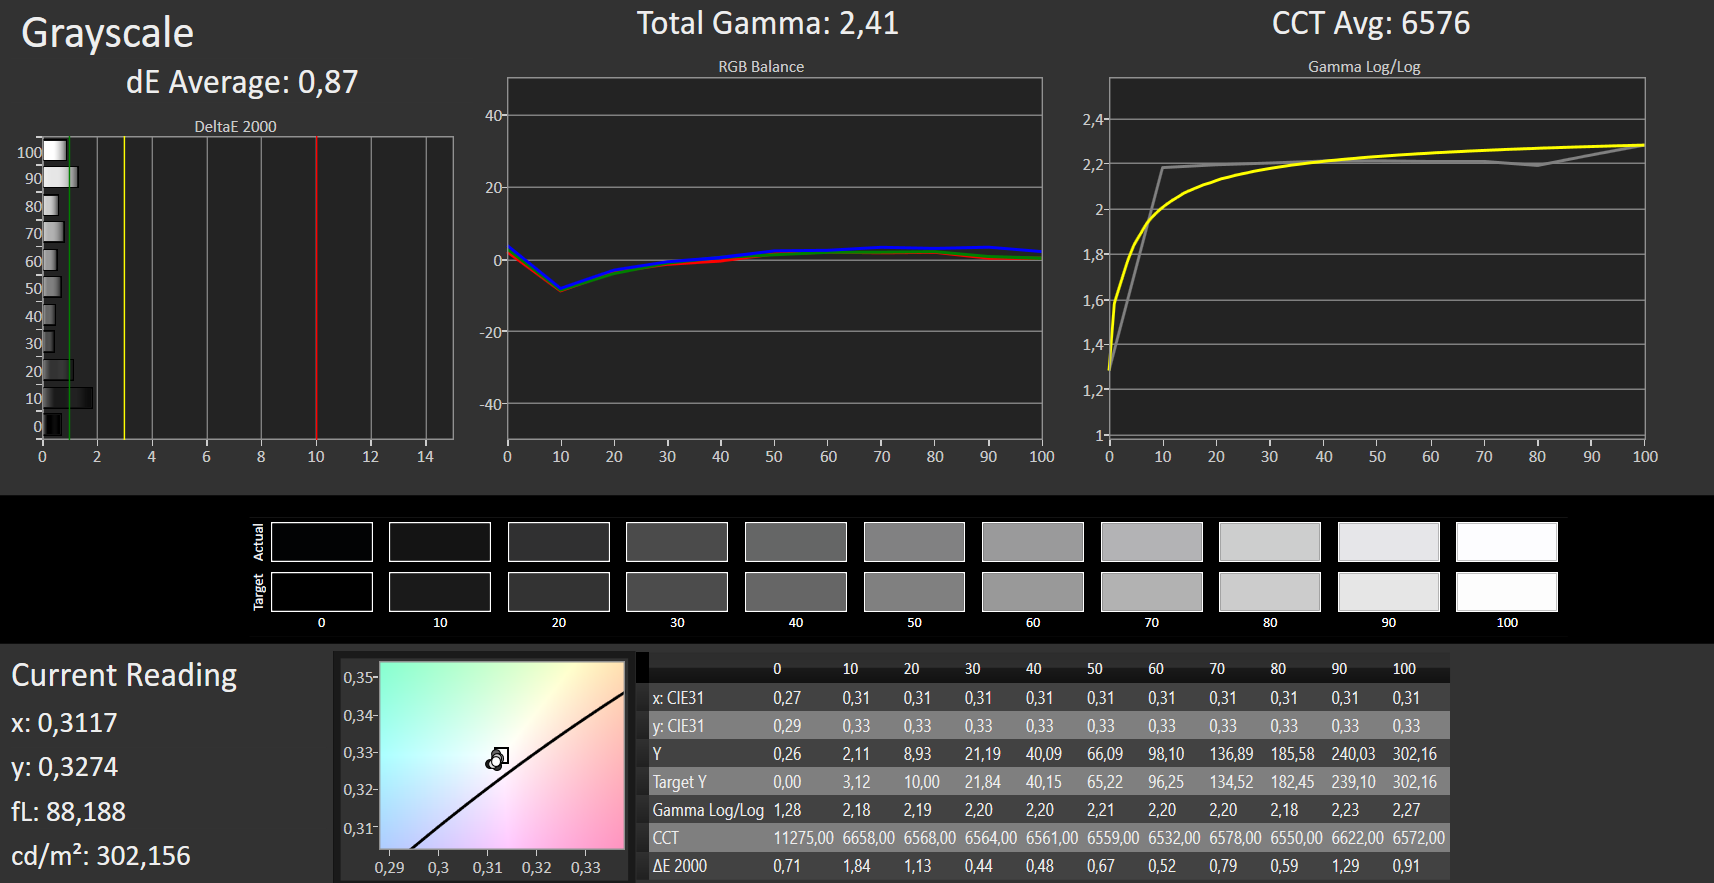
Helderheidsverdeling: 87 %
Helderheid in Batterij-modus: 282 cd/m²
Contrast: 892:1 (Zwart: 0.37 cd/m²)
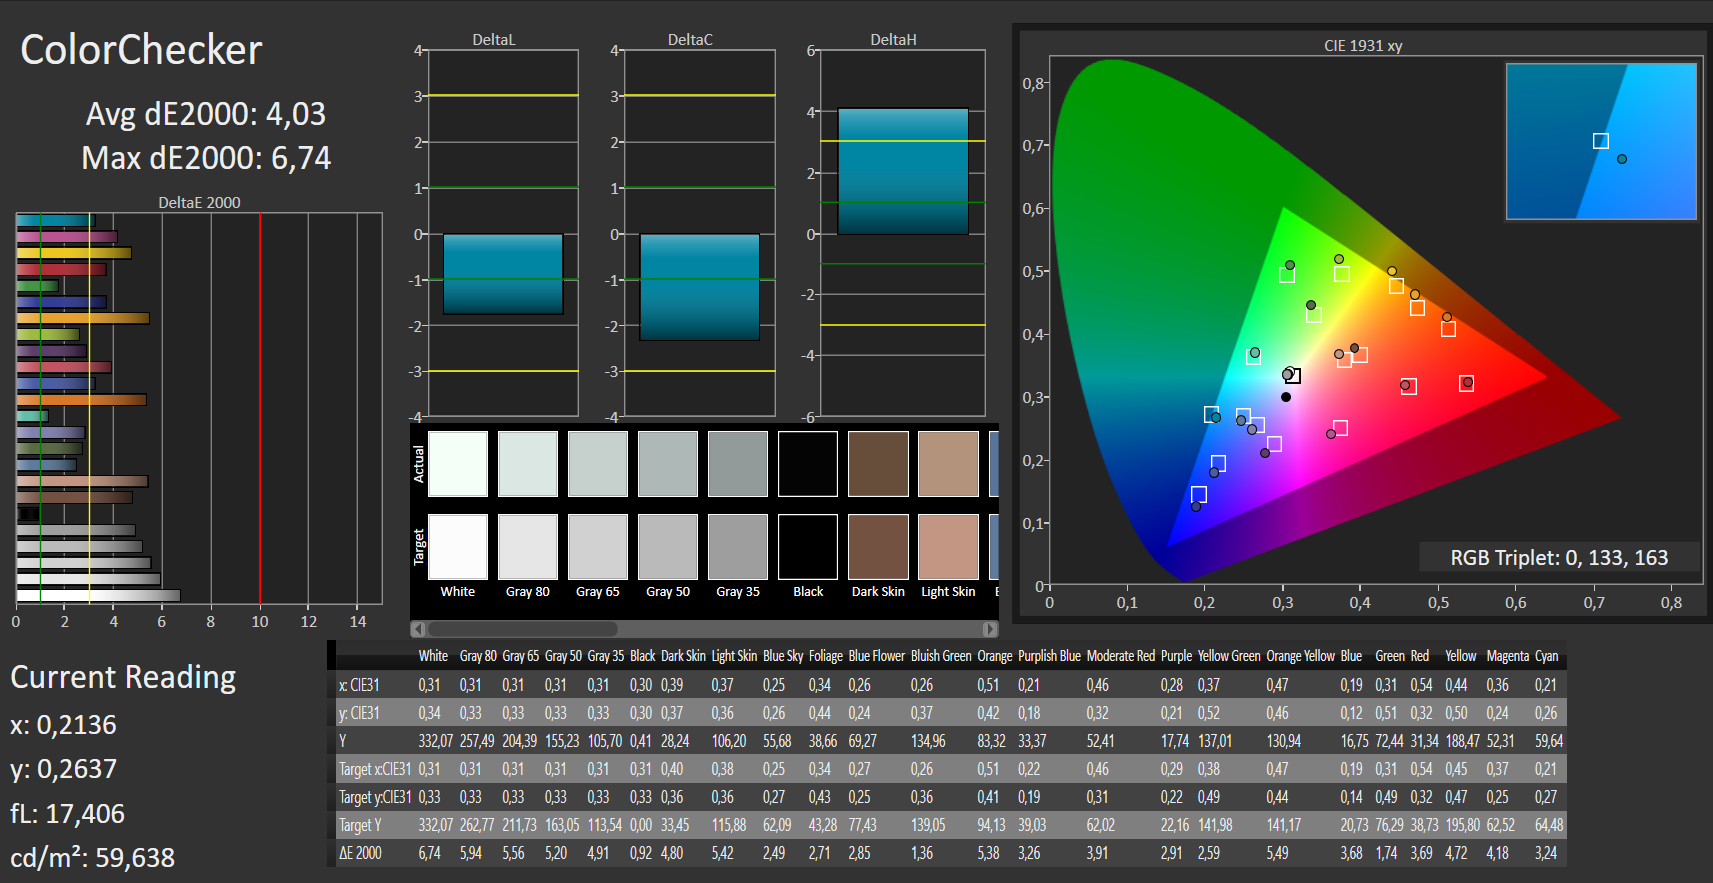
ΔE ColorChecker Calman: 4.03 | ∀{0.5-29.43 Ø4.73}
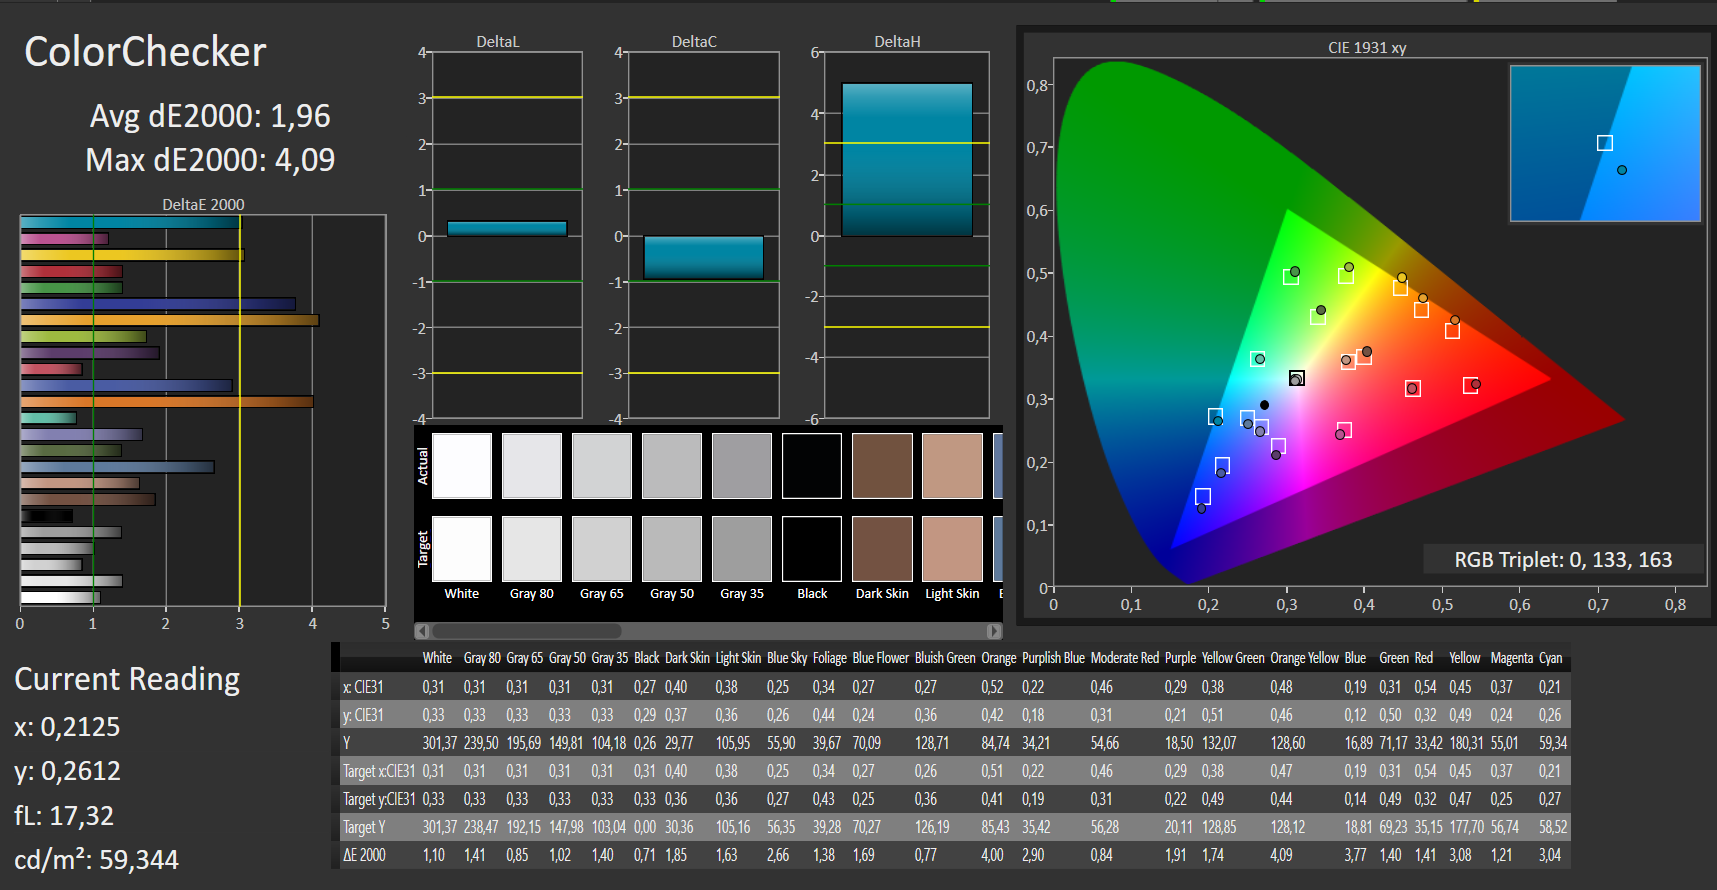
calibrated: 1.96
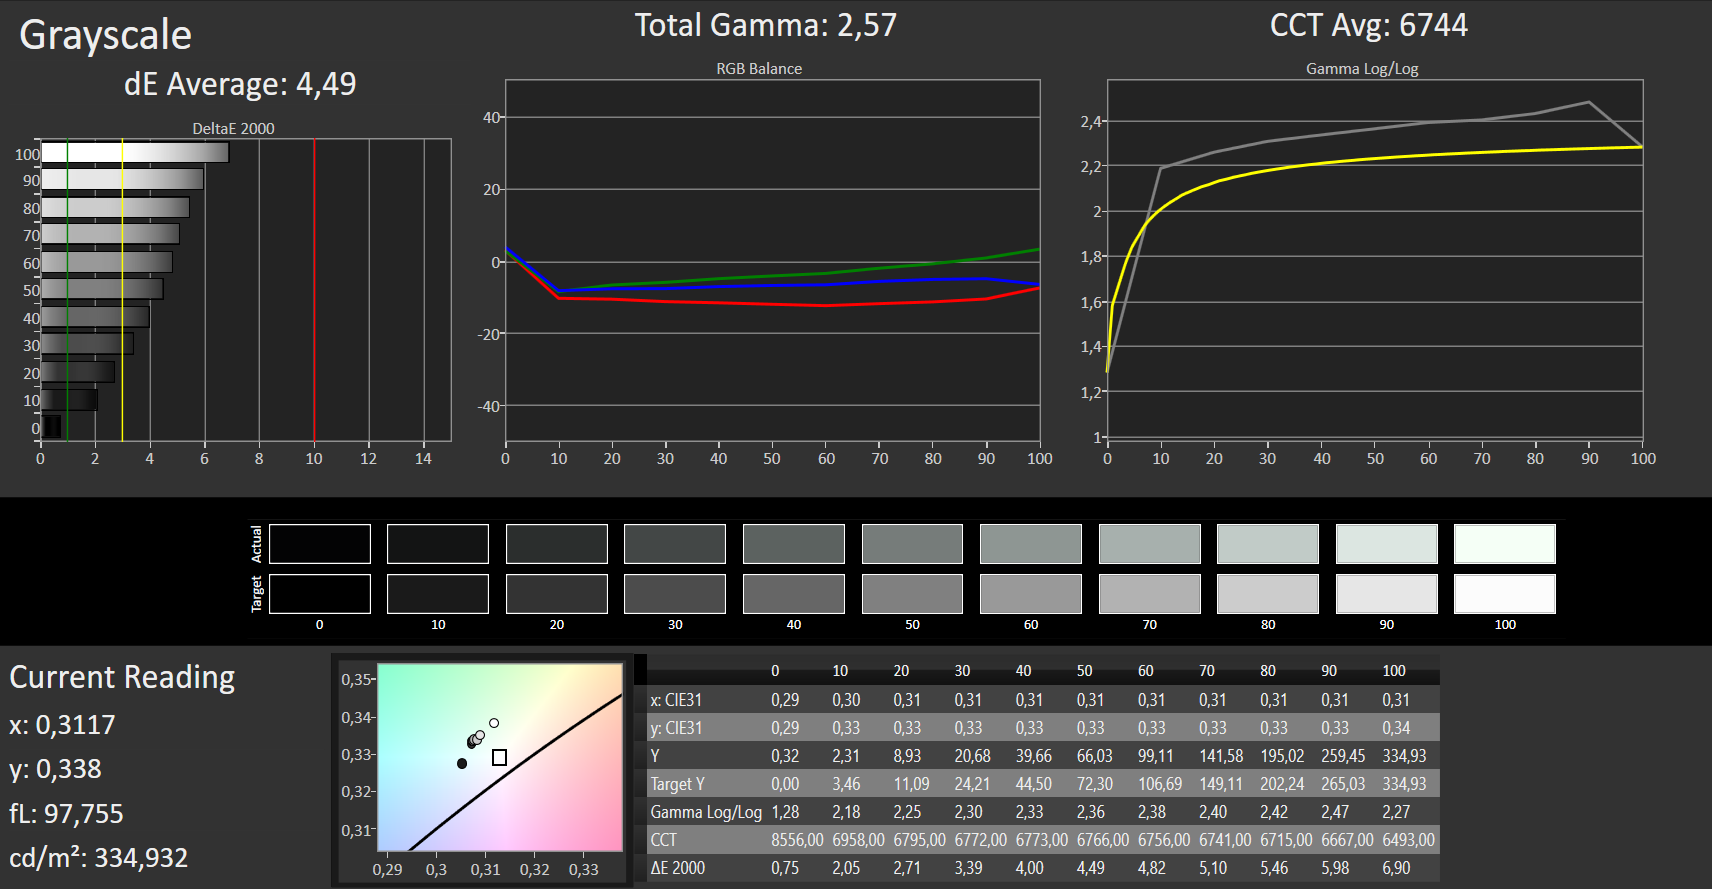
ΔE Greyscale Calman: 4.49 | ∀{0.09-98 Ø4.97}
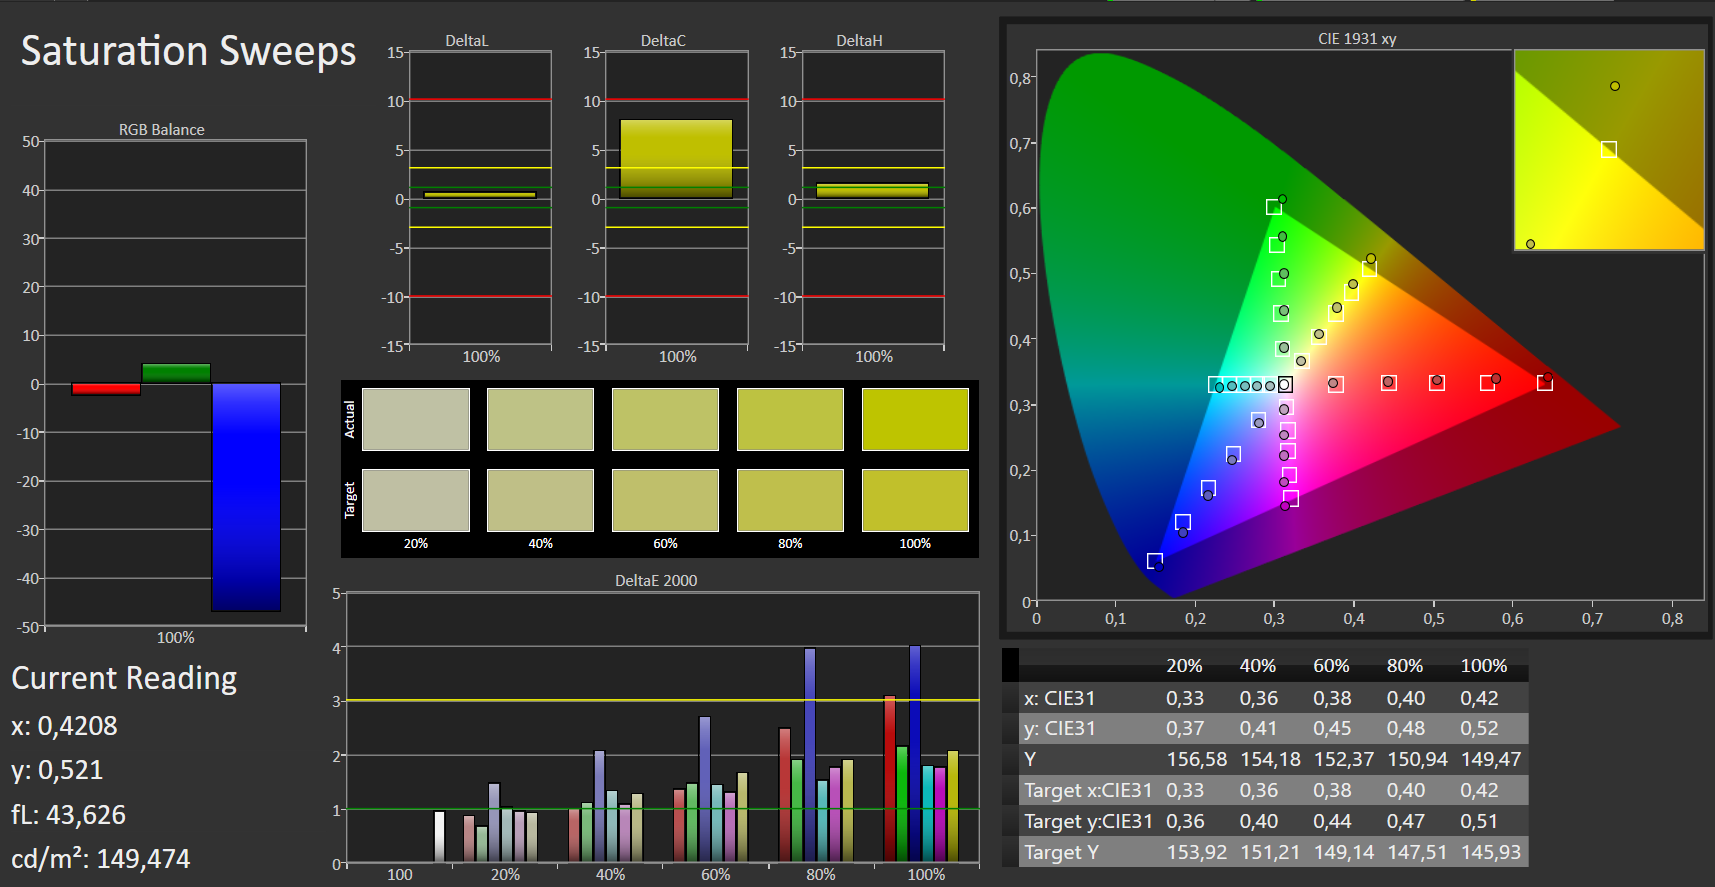
94% sRGB (Argyll 1.6.3 3D)
61% AdobeRGB 1998 (Argyll 1.6.3 3D)
68.4% AdobeRGB 1998 (Argyll 3D)
94.2% sRGB (Argyll 3D)
68.1% Display P3 (Argyll 3D)
Gamma: 2.57
CCT: 6744 K
| HP Spectre x360 15-df0126ng IPS, 3840x2160, 15.6" | HP Spectre x360 15-ch000 IPS, 3840x2160, 15.6" | HP Spectre x360 15-ch011nr IPS, 3840x2160, 15.6" | Lenovo Yoga 730-15IKB IPS, 3840x2160, 15.6" | Asus ZenBook Flip 15 UX561UD IPS, 3840x2160, 15.6" | Acer Spin 5 SP515-51GN-80A3 a-Si TFT-LCD, LCM, IPS, 1920x1080, 15.6" | Dell XPS 15 9570 i7 UHD IPS, 3840x2160, 15.6" | |
|---|---|---|---|---|---|---|---|
| Display | -5% | -2% | -2% | 26% | -41% | 12% | |
| Display P3 Coverage (%) | 68.1 | 66.7 -2% | 68.5 1% | 68.7 1% | 86.6 27% | 38.73 -43% | 79.1 16% |
| sRGB Coverage (%) | 94.2 | 87.4 -7% | 90.7 -4% | 90 -4% | 100 6% | 58.3 -38% | 98.8 5% |
| AdobeRGB 1998 Coverage (%) | 68.4 | 63.8 -7% | 66.3 -3% | 65.8 -4% | 99.5 45% | 40.02 -41% | 79.2 16% |
| Response Times | 31% | 22% | 30% | 8% | 16% | 8% | |
| Response Time Grey 50% / Grey 80% * (ms) | 57 ? | 36 ? 37% | 38 ? 33% | 34 ? 40% | 52 ? 9% | 42 ? 26% | 46.4 ? 19% |
| Response Time Black / White * (ms) | 31 ? | 23.6 ? 24% | 27.6 ? 11% | 25 ? 19% | 29 ? 6% | 29 ? 6% | 32 ? -3% |
| PWM Frequency (Hz) | 943 ? | 943 ? | 961 ? | 980 ? | |||
| Screen | -6% | -20% | -2% | 16% | 7% | 4% | |
| Brightness middle (cd/m²) | 330 | 349.5 6% | 329.3 0% | 309 -6% | 380 15% | 221 -33% | 494 50% |
| Brightness (cd/m²) | 310 | 330 6% | 316 2% | 299 -4% | 371 20% | 224 -28% | 457 47% |
| Brightness Distribution (%) | 87 | 90 3% | 84 -3% | 84 -3% | 87 0% | 89 2% | 88 1% |
| Black Level * (cd/m²) | 0.37 | 0.29 22% | 0.31 16% | 0.29 22% | 0.28 24% | 0.12 68% | 0.34 8% |
| Contrast (:1) | 892 | 1205 35% | 1062 19% | 1066 20% | 1357 52% | 1842 107% | 1453 63% |
| Colorchecker dE 2000 * | 4.03 | 4.06 -1% | 4.78 -19% | 3.9 3% | 4.38 -9% | 4.12 -2% | 5.2 -29% |
| Colorchecker dE 2000 max. * | 6.74 | 7.68 -14% | 11.75 -74% | 7.5 -11% | 7.59 -13% | 6.41 5% | 17.5 -160% |
| Colorchecker dE 2000 calibrated * | 1.96 | 4.22 -115% | 3.51 -79% | ||||
| Greyscale dE 2000 * | 4.49 | 4.4 2% | 7.9 -76% | 4.58 -2% | 3.6 20% | 3.4 24% | 2.7 40% |
| Gamma | 2.57 86% | 2.11 104% | 2.24 98% | 2.43 91% | 2.32 95% | 2.54 87% | 2.1 105% |
| CCT | 6744 96% | 7422 88% | 8323 78% | 7344 89% | 6860 95% | 6893 94% | 7038 92% |
| Color Space (Percent of AdobeRGB 1998) (%) | 61 | 56.5 -7% | 58.8 -4% | 39 -36% | 88 44% | 37 -39% | 71.2 17% |
| Color Space (Percent of sRGB) (%) | 94 | 86.9 -8% | 90.4 -4% | 90 -4% | 100 6% | 58 -38% | 98.8 5% |
| Totaal Gemiddelde (Programma / Instellingen) | 7% /
-2% | 0% /
-12% | 9% /
2% | 17% /
17% | -6% /
-2% | 8% /
6% |
* ... kleiner is beter

Responstijd Scherm
| ↔ Responstijd Zwart naar Wit | ||
|---|---|---|
| 31 ms ... stijging ↗ en daling ↘ gecombineerd | ↗ 16 ms stijging | 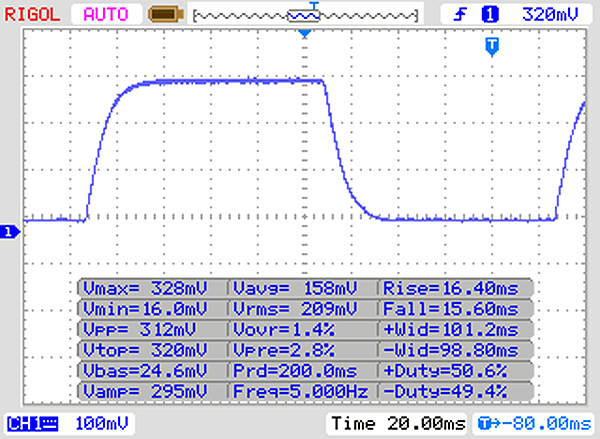 |
| ↘ 15 ms daling | ||
| Het scherm vertoonde trage responstijden in onze tests en is misschien te traag voor games. Ter vergelijking: alle testtoestellen variëren van 0.1 (minimum) tot 240 (maximum) ms. » 84 % van alle toestellen zijn beter. Dit betekent dat de gemeten responstijd slechter is dan het gemiddelde (19.9 ms) van alle geteste toestellen. | ||
| ↔ Responstijd 50% Grijs naar 80% Grijs | ||
| 57 ms ... stijging ↗ en daling ↘ gecombineerd | ↗ 26 ms stijging | 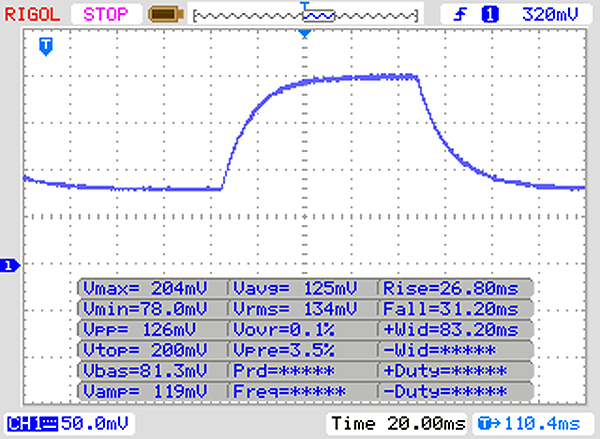 |
| ↘ 31 ms daling | ||
| Het scherm vertoonde trage responstijden in onze tests en is misschien te traag voor games. Ter vergelijking: alle testtoestellen variëren van 0.165 (minimum) tot 636 (maximum) ms. » 94 % van alle toestellen zijn beter. Dit betekent dat de gemeten responstijd slechter is dan het gemiddelde (31.1 ms) van alle geteste toestellen. | ||
Screen Flickering / PWM (Pulse-Width Modulation)
| Screen flickering / PWM niet waargenomen |  | ||
Ter vergelijking: 52 % van alle geteste toestellen maakten geen gebruik van PWM om de schermhelderheid te verlagen. Als het wel werd gebruikt, werd een gemiddelde van 7798 (minimum: 5 - maximum: 343500) Hz waargenomen. | |||
| Geekbench 3 | |
| 32 Bit Multi-Core Score | |
| Gemiddeld Intel Core i7-8750H (20725 - 22665, n=13) | |
| HP Spectre x360 15-df0126ng | |
| Lenovo Yoga 730-15IKB | |
| 32 Bit Single-Core Score | |
| HP Spectre x360 15-df0126ng | |
| Gemiddeld Intel Core i7-8750H (3734 - 4163, n=13) | |
| Lenovo Yoga 730-15IKB | |
| Geekbench 4.4 | |
| 64 Bit Multi-Core Score | |
| Gemiddelde van klas Multimedia (n=1laatste 2 jaar) | |
| Gemiddeld Intel Core i7-8750H (17709 - 23313, n=17) | |
| Lenovo Yoga 730-15IKB | |
| 64 Bit Single-Core Score | |
| Gemiddelde van klas Multimedia (n=1laatste 2 jaar) | |
| Gemiddeld Intel Core i7-8750H (4669 - 5146, n=17) | |
| Lenovo Yoga 730-15IKB | |
| Mozilla Kraken 1.1 - Total | |
| Dell XPS 15 9570 i7 UHD (Edge 42.17134.1.0) | |
| HP Spectre x360 15-ch000 (Edge 42.17134.1.0) | |
| Lenovo Yoga 730-15IKB (Edge 42) | |
| HP Spectre x360 15-df0126ng (Edge 44) | |
| Gemiddeld Intel Core i7-8750H (695 - 1272, n=50) | |
| Asus ZenBook Flip 15 UX561UD | |
| HP Spectre x360 15-ch011nr (Edge 41.16299.15.0) | |
| Acer Spin 5 SP515-51GN-80A3 (Edge 41.16299.15.0) | |
| Gemiddelde van klas Multimedia (228 - 835, n=74, laatste 2 jaar) | |
| Octane V2 - Total Score | |
| Gemiddelde van klas Multimedia (64079 - 153175, n=35, laatste 2 jaar) | |
| Acer Spin 5 SP515-51GN-80A3 (Edge 41.16299.15.0) | |
| Asus ZenBook Flip 15 UX561UD | |
| HP Spectre x360 15-df0126ng (Edge 44) | |
| Dell XPS 15 9570 i7 UHD (Edge 42.17134.1.0) | |
| Gemiddeld Intel Core i7-8750H (27460 - 44549, n=47) | |
| Lenovo Yoga 730-15IKB (Edge 42) | |
| HP Spectre x360 15-ch011nr (Edge 41.16299.15.0) | |
| HP Spectre x360 15-ch000 (Edge 42.17134.1.0) | |
| JetStream 1.1 - 1.1 Total | |
| Gemiddelde van klas Multimedia (482 - 711, n=2, laatste 2 jaar) | |
| Acer Spin 5 SP515-51GN-80A3 (Edge 41.16299.15.0) | |
| Dell XPS 15 9570 i7 UHD (Edge 42.17134.1.0) | |
| Asus ZenBook Flip 15 UX561UD | |
| Gemiddeld Intel Core i7-8750H (205 - 299, n=49) | |
| HP Spectre x360 15-df0126ng (Edge 44) | |
| Lenovo Yoga 730-15IKB (Edge 42) | |
| HP Spectre x360 15-ch011nr (Edge 41.16299.15.0) | |
| HP Spectre x360 15-ch000 (Edge 42.17134.1.0) | |
* ... kleiner is beter
| PCMark 7 Score | 6350 punten | |
| PCMark 8 Home Score Accelerated v2 | 3494 punten | |
| PCMark 8 Creative Score Accelerated v2 | 4685 punten | |
| PCMark 8 Work Score Accelerated v2 | 4316 punten | |
| PCMark 10 Score | 4636 punten | |
Help | ||

| HP Spectre x360 15-df0126ng Toshiba XG5-P KXG50PNV2T04 | HP Spectre x360 15-ch000 Toshiba XG5-P KXG50PNV2T04 | HP Spectre x360 15-ch011nr SK hynix PC401 NVMe 500 GB | Lenovo Yoga 730-15IKB SK Hynix PC401 512GB M.2 (HFS512GD9TNG) | Asus ZenBook Flip 15 UX561UD Micron 1100 MTFDDAV256TBN | Acer Spin 5 SP515-51GN-80A3 Intel SSD 600p SSDPEKKW256G7 | Dell XPS 15 9570 i7 UHD Toshiba XG5 KXG50ZNV512G | Gemiddeld Toshiba XG5-P KXG50PNV2T04 | |
|---|---|---|---|---|---|---|---|---|
| CrystalDiskMark 5.2 / 6 | 30% | 8% | 48% | -35% | -10% | 7% | 10% | |
| Write 4K (MB/s) | 84.7 | 127.3 50% | 108.5 28% | 164.9 95% | 112.6 33% | 132.3 56% | 79.1 -7% | 105.8 ? 25% |
| Read 4K (MB/s) | 24.32 | 16.29 -33% | 37.67 55% | 50.5 108% | 29.67 22% | 35.38 45% | 37.89 56% | 23.7 ? -3% |
| Write Seq (MB/s) | 1033 | 288.2 -72% | 1120 8% | 1262 22% | 432.1 -58% | 592 -43% | 1119 8% | 845 ? -18% |
| Read Seq (MB/s) | 1664 | 344 -79% | 1300 -22% | 2054 23% | 479.9 -71% | 1186 -29% | 1852 11% | 1322 ? -21% |
| Write 4K Q32T1 (MB/s) | 433 | 1037 139% | 243.9 -44% | 477.6 10% | 191 -56% | 323 -25% | 361.1 -17% | 531 ? 23% |
| Read 4K Q32T1 (MB/s) | 269.5 | 894 232% | 311.6 16% | 550 104% | 246.5 -9% | 289.2 7% | 257.9 -4% | 474 ? 76% |
| Write Seq Q32T1 (MB/s) | 1036 | 1046 1% | 1395 35% | 1400 35% | 450.3 -57% | 593 -43% | 1131 9% | 1034 ? 0% |
| Read Seq Q32T1 (MB/s) | 3062 | 3040 -1% | 2667 -13% | 2672 -13% | 522 -83% | 1569 -49% | 3096 1% | 3072 ? 0% |
| 3DMark 06 Standard Score | 30798 punten | |
| 3DMark 11 Performance | 9106 punten | |
| 3DMark Ice Storm Standard Score | 58769 punten | |
| 3DMark Cloud Gate Standard Score | 24021 punten | |
| 3DMark Fire Strike Score | 6700 punten | |
| 3DMark Time Spy Score | 2485 punten | |
Help | ||
| lage | gem. | hoge | ultra | 4K | |
|---|---|---|---|---|---|
| StarCraft 2 (2010) | 433.4 | 200.4 | 186.7 | 126.7 | |
| Diablo III (2012) | 228.2 | 202.6 | 202.1 | 170.1 | |
| BioShock Infinite (2013) | 299 | 209.3 | 183.5 | 72.2 | |
| GTA V (2015) | 150.4 | 143.3 | 78.9 | 34.5 | |
| The Witcher 3 (2015) | 131.3 | 76.6 | 44.2 | 25.4 | 15.9 |
| Dota 2 Reborn (2015) | 111.9 | 104.2 | 98.1 | 93.5 | 46 |
| World of Warships (2015) | 168.6 | 143.9 | 112.7 | 101 | 34.4 |
| Ashes of the Singularity (2016) | 63 | 41.3 | 35.8 | 15.7 | |
| Overwatch (2016) | 285.4 | 233.9 | 117.7 | 70.5 | 37 |
| Prey (2017) | 142.4 | 85.6 | 68.3 | 58.9 | 21.7 |
| Rocket League (2017) | 249.1 | 169.1 | 112.5 | 42.3 | |
| Team Fortress 2 (2017) | 129.8 | 123.6 | 115.7 | 112.6 | 65.2 |
| Middle-earth: Shadow of War (2017) | 105 | 55 | 41 | 31 | 13 |
| Destiny 2 (2017) | 119.5 | 69.4 | 64.3 | 57.9 | 18.9 |
| Final Fantasy XV Benchmark (2018) | 61.5 | 36.6 | 23.3 | 9.2 | |
| X-Plane 11.11 (2018) | 92.7 | 80.3 | 69.4 | 39.5 | |
| Far Cry 5 (2018) | 76 | 45 | 41 | 38 | 14 |
| Monster Hunter World (2018) | 100.3 | 39.2 | 34.9 | 26.8 | 8.3 |
| Forza Horizon 4 (2018) | 122 | 67 | 61 | 47 | 20 |
| Assassin´s Creed Odyssey (2018) | 67 | 43 | 34 | 18 | 7 |
| Call of Duty Black Ops 4 (2018) | 118.7 | 46.3 | 45 | 37.5 | 10.1 |
| Hitman 2 (2018) | 64.8 | 41 | 37.5 | 35.9 | 11.3 |
| Battlefield V (2018) | 100.1 | 57.3 | 47.9 | 44.8 | 17.3 |
| Farming Simulator 19 (2018) | 193.6 | 128.7 | 80.5 | 61 | 22 |
| Darksiders III (2018) | 134.5 | 87.4 | 73.7 | 65 | 13.2 |
| Just Cause 4 (2018) | 73.2 | 47.9 | 36.1 | 35.3 | 12.9 |
| Far Cry New Dawn (2019) | 83 | 47 | 43 | 40 | 14 |
| Metro Exodus (2019) | 55.5 | 49.8 | 36.5 | 28.3 | 4.7 |
| Anthem (2019) | 67.1 | 40.5 | 34 | 30.4 | 9 |
| Dirt Rally 2.0 (2019) | 133.2 | 56.7 | 44.3 | 27.2 | 11.3 |
| The Witcher 3 - 1920x1080 High Graphics & Postprocessing (Nvidia HairWorks Off) | |
| Gemiddelde van klas Multimedia (22 - 224, n=13, laatste 2 jaar) | |
| Dell XPS 15 9570 i7 UHD | |
| Gemiddeld NVIDIA GeForce GTX 1050 Ti Max-Q (42.6 - 60, n=6) | |
| Lenovo ThinkPad X1 Extreme-20MF000XGE | |
| HP Spectre x360 15-df0126ng | |
| HP Spectre x360 15-ch000 | |
| Rocket League - 1920x1080 High Quality AA:High FX | |
| HP Spectre x360 15-df0126ng | |
| Gemiddeld NVIDIA GeForce GTX 1050 Ti Max-Q (n=1) | |
| Lenovo Yoga 730-15IKB | |
| Middle-earth: Shadow of War - 1920x1080 Medium Preset AA:T | |
| HP Spectre x360 15-df0126ng | |
| Gemiddeld NVIDIA GeForce GTX 1050 Ti Max-Q (n=1) | |
| Lenovo Yoga 730-15IKB | |
Geluidsniveau
| Onbelast |
| 30.4 / 30.4 / 31.6 dB (A) |
| Belasting |
| 43.2 / 38.3 dB (A) |
 | ||
30 dB stil 40 dB(A) hoorbaar 50 dB(A) luid |
||
min: | ||
| HP Spectre x360 15-df0126ng i7-8750H, GeForce GTX 1050 Ti Max-Q | HP Spectre x360 15-ch000 i7-8705G, Vega M GL / 870 | HP Spectre x360 15-ch011nr i5-8550U, GeForce MX150 | Lenovo Yoga 730-15IKB i5-8550U, GeForce GTX 1050 Mobile | Asus ZenBook Flip 15 UX561UD i5-8550U, GeForce GTX 1050 Mobile | Acer Spin 5 SP515-51GN-80A3 i5-8550U, GeForce GTX 1050 Mobile | Dell XPS 15 9570 i7 UHD i7-8750H, GeForce GTX 1050 Ti Max-Q | Gemiddeld NVIDIA GeForce GTX 1050 Ti Max-Q | Gemiddelde van klas Multimedia | |
|---|---|---|---|---|---|---|---|---|---|
| Noise | 3% | 6% | 3% | 2% | -2% | 4% | 3% | 11% | |
| uit / omgeving * (dB) | 30.4 | 28.1 8% | 28.6 6% | 30.5 -0% | 30.4 -0% | 30.2 1% | 29.9 2% | 29.6 ? 3% | 24.2 ? 20% |
| Idle Minimum * (dB) | 30.4 | 30.8 -1% | 29.2 4% | 30.5 -0% | 31.3 -3% | 30.2 1% | 29.9 2% | 29.8 ? 2% | 24.4 ? 20% |
| Idle Average * (dB) | 30.4 | 30.9 -2% | 29.2 4% | 30.5 -0% | 31.3 -3% | 30.2 1% | 29.9 2% | 29.8 ? 2% | 24.8 ? 18% |
| Idle Maximum * (dB) | 31.6 | 30.9 2% | 29.2 8% | 30.5 3% | 31.3 1% | 30.9 2% | 30.3 4% | 30.7 ? 3% | 26.5 ? 16% |
| Load Average * (dB) | 43.2 | 31.8 26% | 29.2 32% | 37.5 13% | 36.4 16% | 42.4 2% | 36.5 16% | 37.4 ? 13% | 37.6 ? 13% |
| Load Maximum * (dB) | 38.3 | 44.2 -15% | 45.7 -19% | 37.5 2% | 37.1 3% | 44.8 -17% | 40.4 -5% | 40.7 ? -6% | 45.9 ? -20% |
| Witcher 3 ultra * (dB) | 48.1 | 38.4 | 40.4 |
* ... kleiner is beter
(±) De maximumtemperatuur aan de bovenzijde bedraagt 44.8 °C / 113 F, vergeleken met het gemiddelde van 36.8 °C / 98 F, variërend van 21 tot 71 °C voor de klasse Multimedia.
(-) De bodem warmt op tot een maximum van 49 °C / 120 F, vergeleken met een gemiddelde van 39.1 °C / 102 F
(+) Bij onbelast gebruik bedraagt de gemiddelde temperatuur voor de bovenzijde 26 °C / 79 F, vergeleken met het apparaatgemiddelde van 31.3 °C / 88 F.
(+) De handpalmsteunen en het touchpad bereiken maximaal de huidtemperatuur (33.3 °C / 91.9 F) en zijn dus niet heet.
(-) De gemiddelde temperatuur van de handpalmsteun van soortgelijke toestellen bedroeg 28.7 °C / 83.7 F (-4.6 °C / -8.2 F).
| HP Spectre x360 15-df0126ng i7-8750H, GeForce GTX 1050 Ti Max-Q | HP Spectre x360 15-ch000 i7-8705G, Vega M GL / 870 | HP Spectre x360 15-ch011nr i5-8550U, GeForce MX150 | Lenovo Yoga 730-15IKB i5-8550U, GeForce GTX 1050 Mobile | Asus ZenBook Flip 15 UX561UD i5-8550U, GeForce GTX 1050 Mobile | Acer Spin 5 SP515-51GN-80A3 i5-8550U, GeForce GTX 1050 Mobile | Dell XPS 15 9570 i7 UHD i7-8750H, GeForce GTX 1050 Ti Max-Q | Gemiddeld NVIDIA GeForce GTX 1050 Ti Max-Q | Gemiddelde van klas Multimedia | |
|---|---|---|---|---|---|---|---|---|---|
| Heat | -11% | -13% | 4% | 6% | -1% | -2% | -3% | 3% | |
| Maximum Upper Side * (°C) | 44.8 | 46.4 -4% | 46.4 -4% | 40.9 9% | 41.9 6% | 50.9 -14% | 55.7 -24% | 48.8 ? -9% | 41.5 ? 7% |
| Maximum Bottom * (°C) | 49 | 49.2 -0% | 49 -0% | 43 12% | 40.6 17% | 44.2 10% | 48.5 1% | 49.9 ? -2% | 44.1 ? 10% |
| Idle Upper Side * (°C) | 26.6 | 31 -17% | 32 -20% | 27.3 -3% | 26.6 -0% | 26.3 1% | 24.4 8% | 26.2 ? 2% | 27.1 ? -2% |
| Idle Bottom * (°C) | 26.6 | 33 -24% | 34.2 -29% | 27.4 -3% | 26 2% | 27.1 -2% | 24.8 7% | 26.9 ? -1% | 28 ? -5% |
* ... kleiner is beter
HP Spectre x360 15-df0126ng audioanalyse
(-) | niet erg luide luidsprekers (70.3 dB)
Bas 100 - 315 Hz
(±) | verminderde zeebaars - gemiddeld 14.9% lager dan de mediaan
(±) | lineariteit van de lage tonen is gemiddeld (13.3% delta ten opzichte van de vorige frequentie)
Midden 400 - 2000 Hz
(+) | evenwichtige middens - slechts 3.4% verwijderd van de mediaan
(±) | lineariteit van de middentonen is gemiddeld (9.3% delta ten opzichte van de vorige frequentie)
Hoog 2 - 16 kHz
(+) | evenwichtige hoogtepunten - slechts 1.4% verwijderd van de mediaan
(+) | de hoge tonen zijn lineair (5.5% delta naar de vorige frequentie)
Algemeen 100 - 16.000 Hz
(±) | lineariteit van het totale geluid is gemiddeld (15.8% verschil met de mediaan)
Vergeleken met dezelfde klasse
» 40% van alle geteste apparaten in deze klasse waren beter, 5% vergelijkbaar, 55% slechter
» De beste had een delta van 5%, het gemiddelde was 17%, de slechtste was 45%
Vergeleken met alle geteste toestellen
» 24% van alle geteste apparaten waren beter, 5% gelijk, 71% slechter
» De beste had een delta van 4%, het gemiddelde was 24%, de slechtste was 134%
HP Spectre x360 15t-bl100 audioanalyse
(-) | niet erg luide luidsprekers (66.3 dB)
Bas 100 - 315 Hz
(±) | verminderde zeebaars - gemiddeld 14% lager dan de mediaan
(±) | lineariteit van de lage tonen is gemiddeld (14.7% delta ten opzichte van de vorige frequentie)
Midden 400 - 2000 Hz
(+) | evenwichtige middens - slechts 3.7% verwijderd van de mediaan
(+) | de middentonen zijn lineair (4.5% delta ten opzichte van de vorige frequentie)
Hoog 2 - 16 kHz
(+) | evenwichtige hoogtepunten - slechts 2.8% verwijderd van de mediaan
(±) | lineariteit van de hoogtepunten is gemiddeld (7% delta ten opzichte van de vorige frequentie)
Algemeen 100 - 16.000 Hz
(±) | lineariteit van het totale geluid is gemiddeld (19.5% verschil met de mediaan)
Vergeleken met dezelfde klasse
» 64% van alle geteste apparaten in deze klasse waren beter, 7% vergelijkbaar, 29% slechter
» De beste had een delta van 5%, het gemiddelde was 17%, de slechtste was 45%
Vergeleken met alle geteste toestellen
» 48% van alle geteste apparaten waren beter, 7% gelijk, 44% slechter
» De beste had een delta van 4%, het gemiddelde was 24%, de slechtste was 134%
Lenovo Yoga 730-15IKB audioanalyse
(±) | luidspreker luidheid is gemiddeld maar goed (73.3 dB)
Bas 100 - 315 Hz
(-) | bijna geen lage tonen - gemiddeld 16.9% lager dan de mediaan
(±) | lineariteit van de lage tonen is gemiddeld (12.2% delta ten opzichte van de vorige frequentie)
Midden 400 - 2000 Hz
(+) | evenwichtige middens - slechts 4% verwijderd van de mediaan
(±) | lineariteit van de middentonen is gemiddeld (7.7% delta ten opzichte van de vorige frequentie)
Hoog 2 - 16 kHz
(+) | evenwichtige hoogtepunten - slechts 2.6% verwijderd van de mediaan
(+) | de hoge tonen zijn lineair (6.1% delta naar de vorige frequentie)
Algemeen 100 - 16.000 Hz
(±) | lineariteit van het totale geluid is gemiddeld (16.6% verschil met de mediaan)
Vergeleken met dezelfde klasse
» 31% van alle geteste apparaten in deze klasse waren beter, 4% vergelijkbaar, 66% slechter
» De beste had een delta van 6%, het gemiddelde was 20%, de slechtste was 57%
Vergeleken met alle geteste toestellen
» 29% van alle geteste apparaten waren beter, 6% gelijk, 66% slechter
» De beste had een delta van 4%, het gemiddelde was 24%, de slechtste was 134%
| Uit / Standby | |
| Inactief | |
| Belasting |
|
Key:
min: | |
| HP Spectre x360 15-df0126ng i7-8750H, GeForce GTX 1050 Ti Max-Q | HP Spectre x360 15-ch000 i7-8705G, Vega M GL / 870 | HP Spectre x360 15-ch011nr i5-8550U, GeForce MX150 | Lenovo Yoga 730-15IKB i5-8550U, GeForce GTX 1050 Mobile | Asus ZenBook Flip 15 UX561UD i5-8550U, GeForce GTX 1050 Mobile | Acer Spin 5 SP515-51GN-80A3 i5-8550U, GeForce GTX 1050 Mobile | Dell XPS 15 9570 i7 UHD i7-8750H, GeForce GTX 1050 Ti Max-Q | Gemiddeld NVIDIA GeForce GTX 1050 Ti Max-Q | Gemiddelde van klas Multimedia | |
|---|---|---|---|---|---|---|---|---|---|
| Power Consumption | -130% | -33% | -21% | -50% | -3% | -112% | -53% | -40% | |
| Idle Minimum * (Watt) | 2.1 | 11.7 -457% | 5.3 -152% | 4.8 -129% | 5.4 -157% | 3.9 -86% | 9.48 -351% | 5.8 ? -176% | 5.71 ? -172% |
| Idle Average * (Watt) | 6.7 | 16.8 -151% | 9.8 -46% | 10.1 -51% | 10.8 -61% | 6.7 -0% | 16.1 -140% | 11.2 ? -67% | 10.1 ? -51% |
| Idle Maximum * (Watt) | 11.4 | 18.9 -66% | 12.6 -11% | 10.7 6% | 13.9 -22% | 8.7 24% | 16.9 -48% | 13.5 ? -18% | 12.4 ? -9% |
| Load Average * (Watt) | 77.7 | 82.3 -6% | 73 6% | 44 43% | 94 -21% | 74 5% | 90.8 -17% | 86.9 ? -12% | 65 ? 16% |
| Load Maximum * (Watt) | 131.5 | 94.9 28% | 80 39% | 94.7 28% | 116.6 11% | 79 40% | 134.4 -2% | 122.4 ? 7% | 112.2 ? 15% |
| Witcher 3 ultra * (Watt) | 87.2 | 67.6 |
* ... kleiner is beter
| HP Spectre x360 15-df0126ng i7-8750H, GeForce GTX 1050 Ti Max-Q, 84 Wh | HP Spectre x360 15-ch000 i7-8705G, Vega M GL / 870, 84 Wh | HP Spectre x360 15-ch011nr i5-8550U, GeForce MX150, 84 Wh | Lenovo Yoga 730-15IKB i5-8550U, GeForce GTX 1050 Mobile, 51.5 Wh | Asus ZenBook Flip 15 UX561UD i5-8550U, GeForce GTX 1050 Mobile, 52 Wh | Acer Spin 5 SP515-51GN-80A3 i5-8550U, GeForce GTX 1050 Mobile, 48 Wh | Dell XPS 15 9570 i7 UHD i7-8750H, GeForce GTX 1050 Ti Max-Q, 97 Wh | Gemiddelde van klas Multimedia | |
|---|---|---|---|---|---|---|---|---|
| Batterijduur | -46% | 0% | -41% | -44% | -32% | 9% | 39% | |
| Reader / Idle (h) | 18.8 | 9 -52% | 15.5 -18% | 11.6 -38% | 9.3 -51% | 12.7 -32% | 25.2 ? 34% | |
| H.264 (h) | 7.7 | 5.4 -30% | 4.4 -43% | 5.5 -29% | 12.3 60% | 16.4 ? 113% | ||
| WiFi v1.3 (h) | 8.8 | 5.7 -35% | 10.4 18% | 6.2 -30% | 5.2 -41% | 6.2 -30% | 9.6 9% | 12 ? 36% |
| Load (h) | 2.3 | 1.1 -52% | 2.3 0% | 0.8 -65% | 1.4 -39% | 1.5 -35% | 1.3 -43% | 1.675 ? -27% |
| Witcher 3 ultra (h) | 1 |
Pro
Contra
Dit is de verkorte versie van het originele artikel. Het volledige, Engelse testrapport vind je hier.
De HP Spectre x360 15-df0126ng is een uitstekende 15-inch convertible en een die op vrijwel alle vlakken beter is dan zijn voorganger. De hexa-core CPU is een stuk beter dan de U-serie processor uit het model van vorig jaar, net als de aanzienlijk kracchtiger GPU. Het systeem heeft ook geen last van thermal throttling, ondanks zijn slanke behuizing, wat erg plezant is.
De HP Spectre x360 15-df0126ng is een goed-uitgerust 15.6-inch multimedia convertible die op vrijwel alle vlakken goed presteert.
De convertible is krachtig genoeg voor de meeste taken en kan zelfs moderne games op 1080p draaien. Je kunt ook een externe GPU aansluiten als je nog meer grafische rekenkracht nodig hebt.
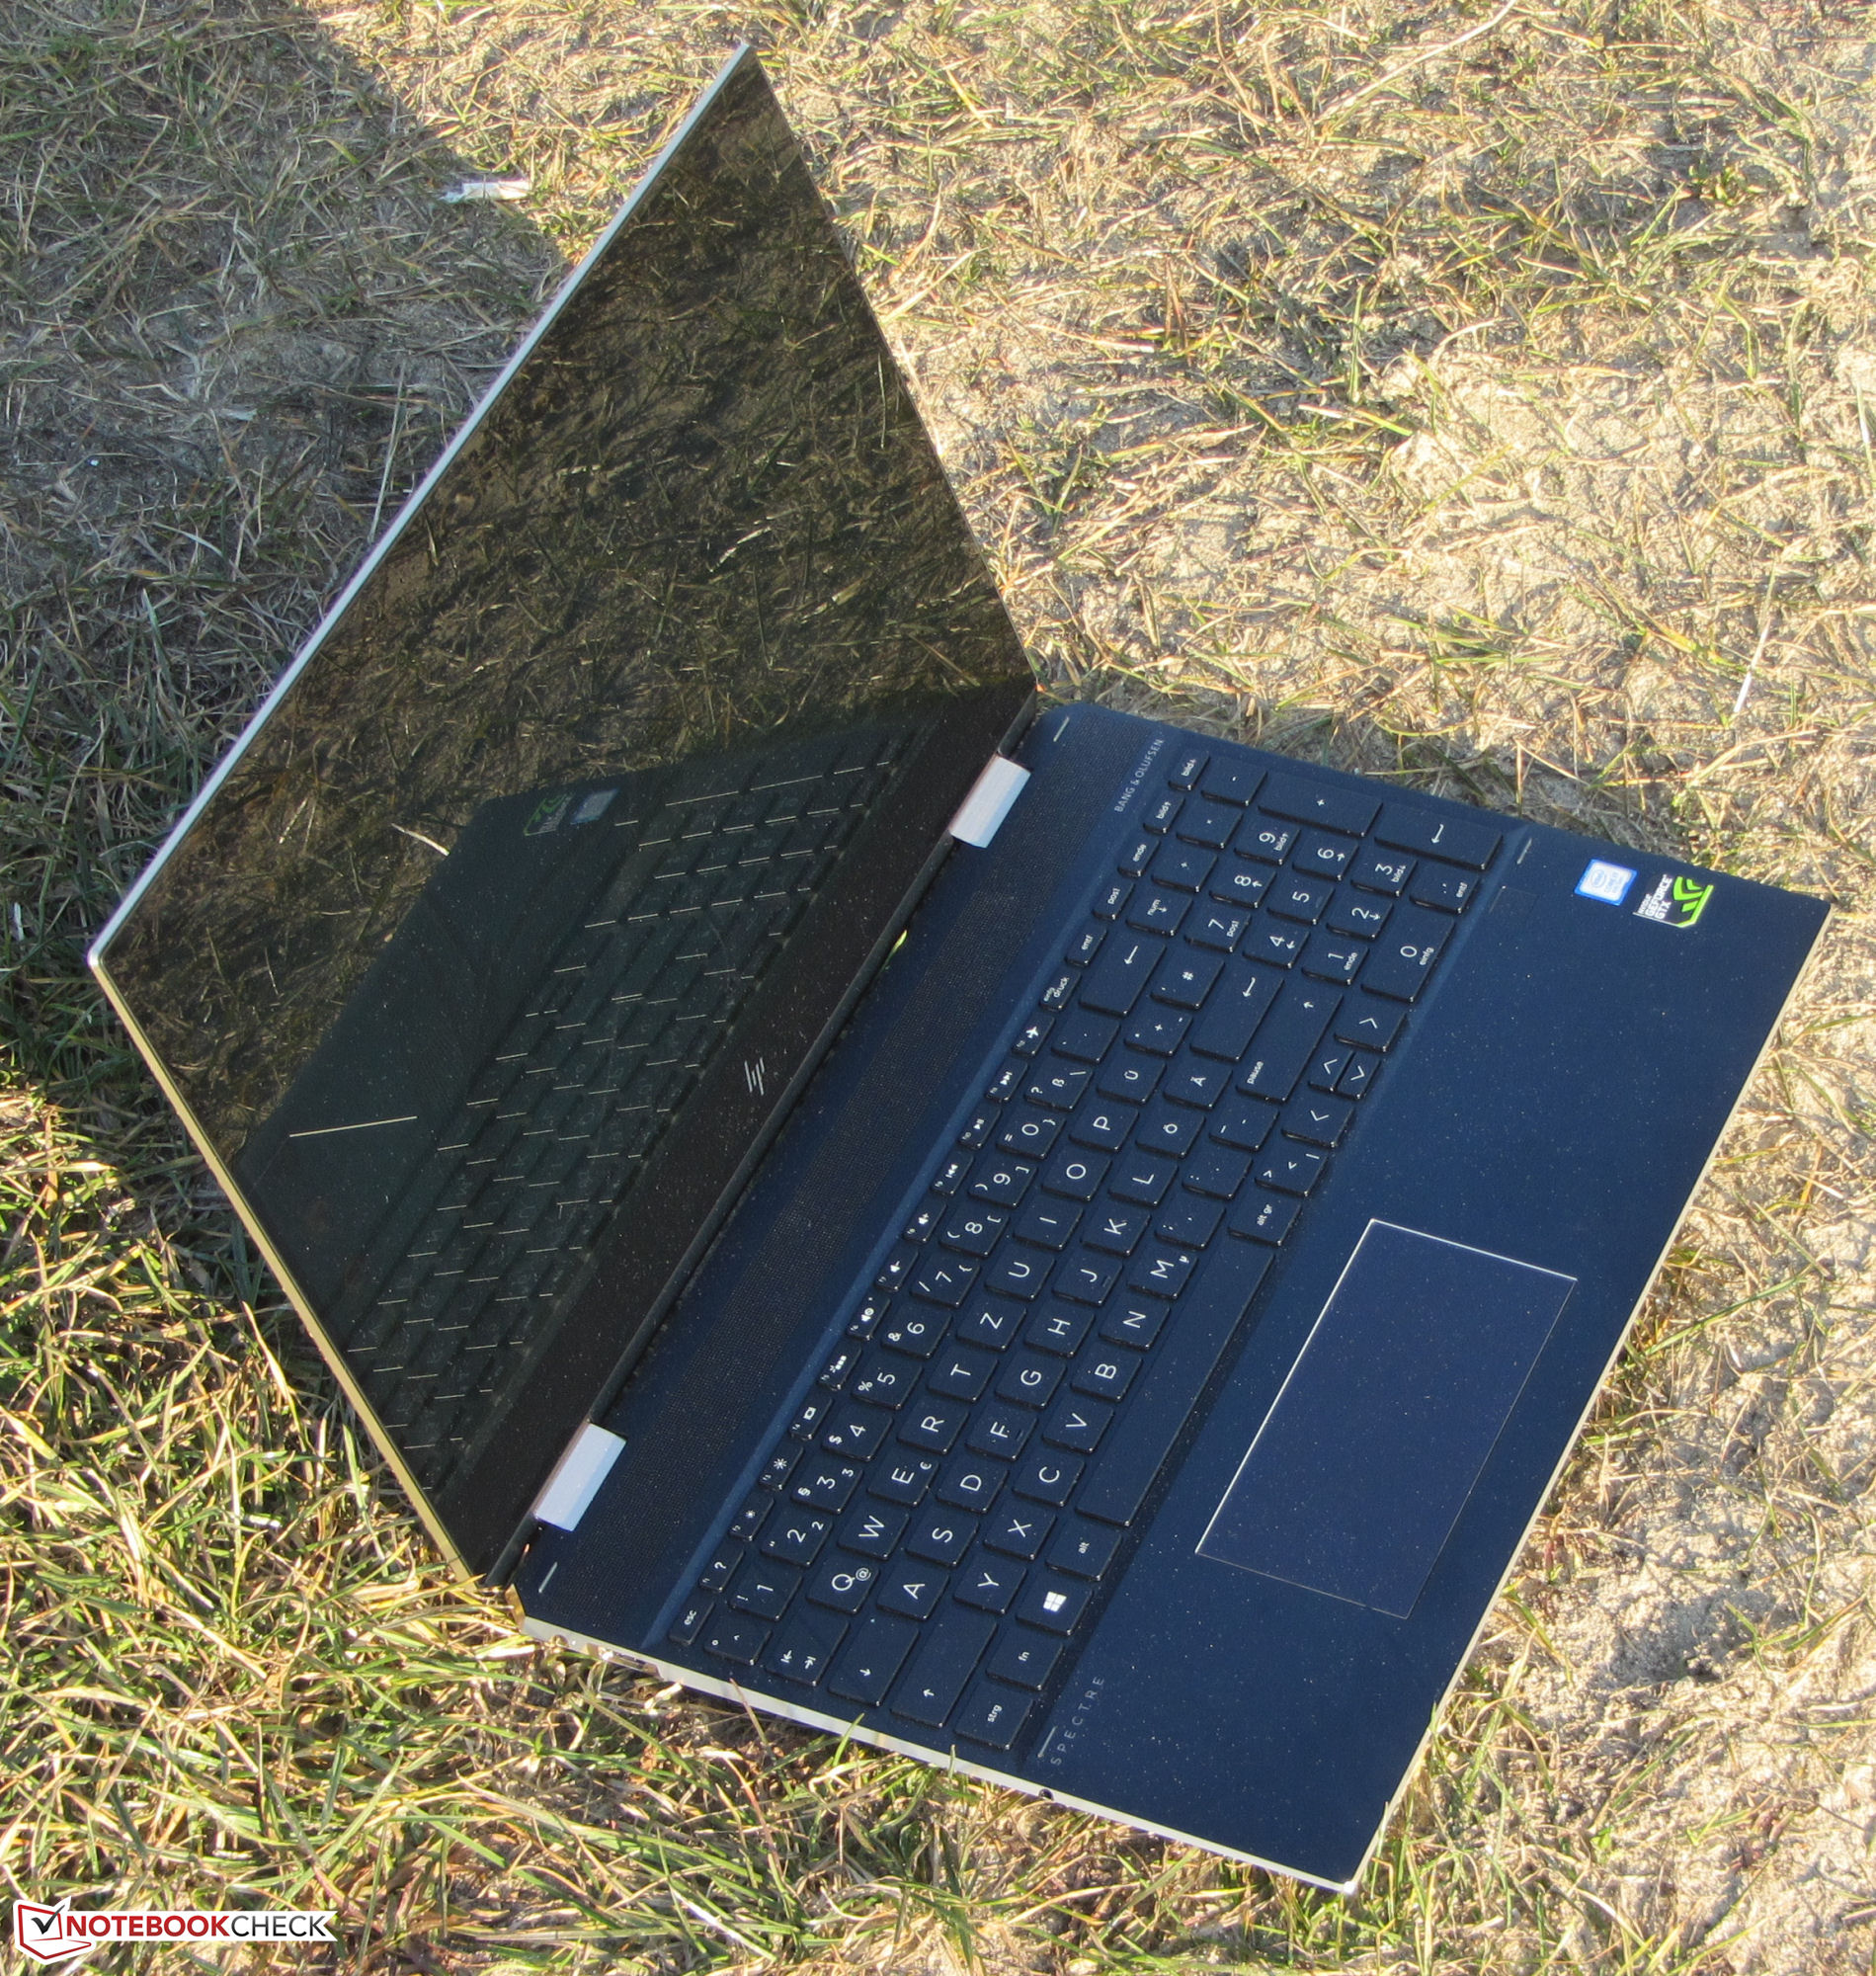
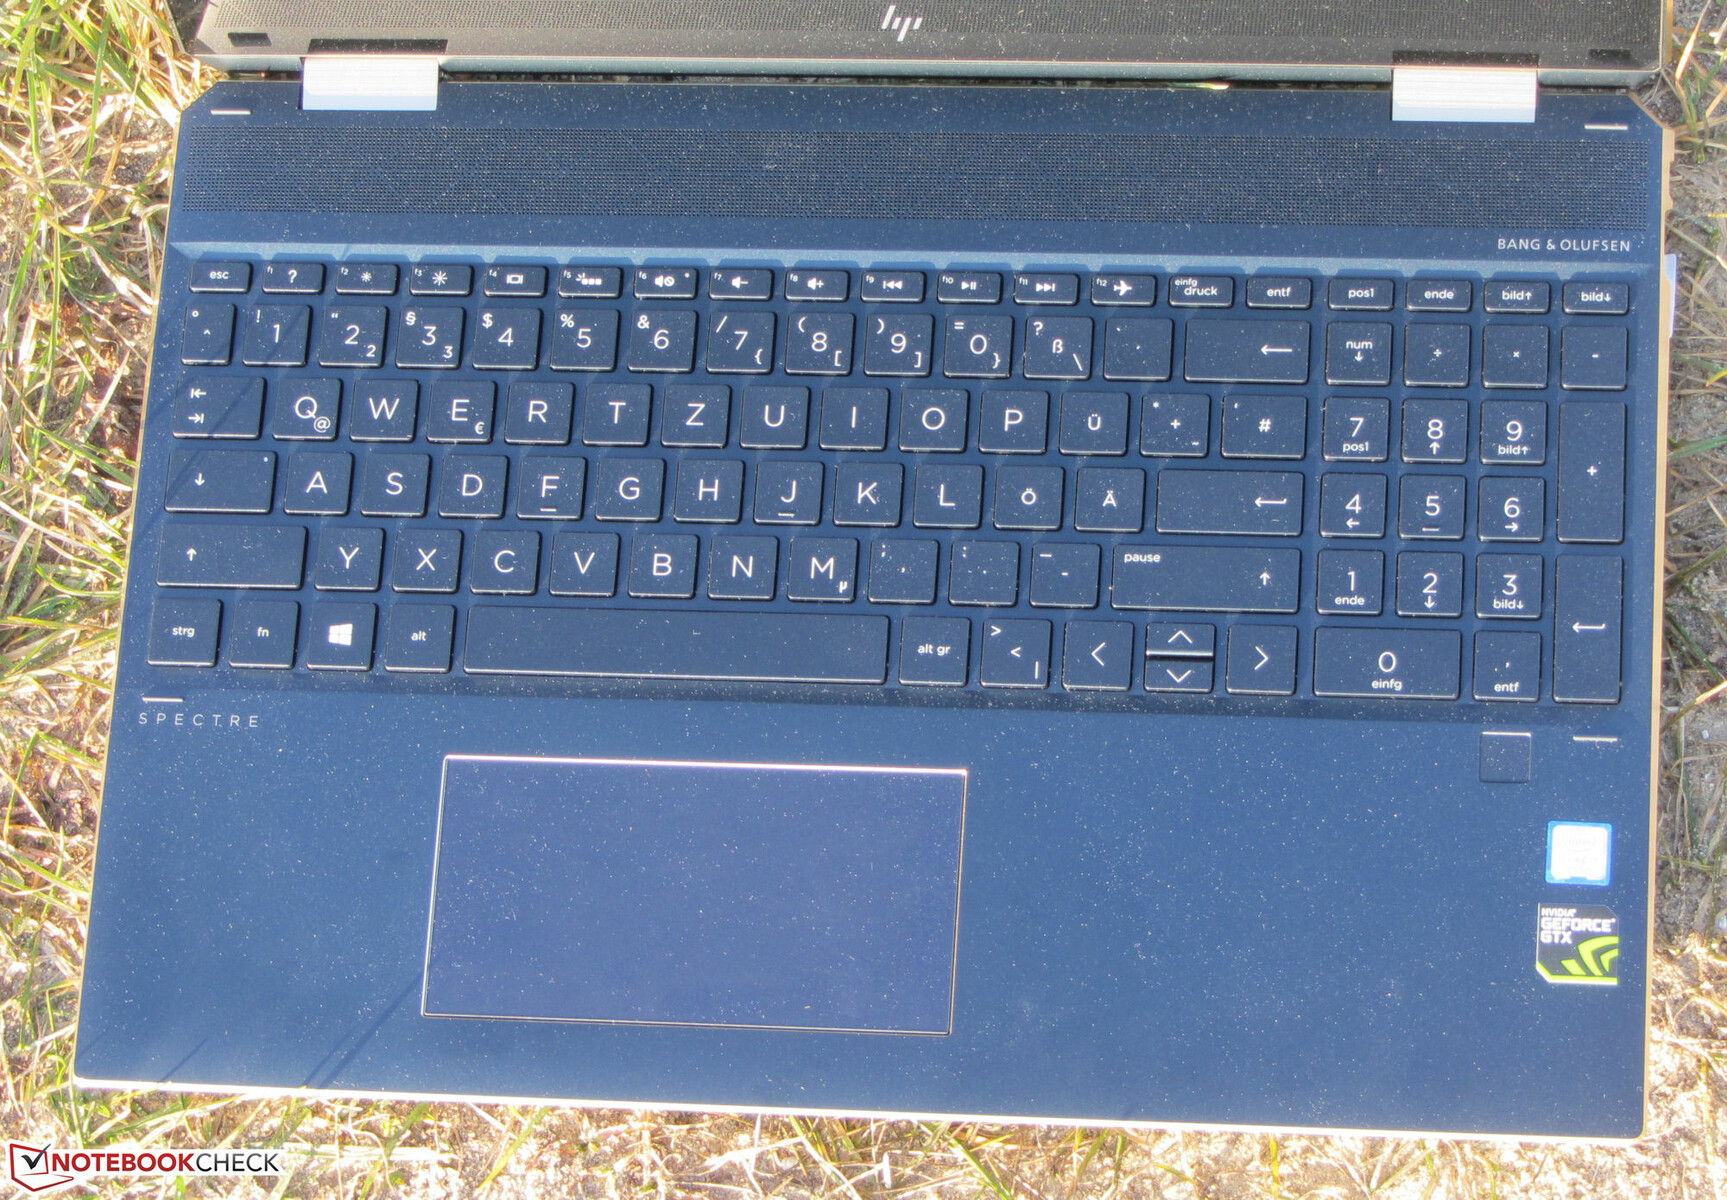
De SSD is voldoende snel, en we denken dat de meeste mensen aan 2 TB opslag meer dan genoeg hebben. HP lijkt mensen te ontmoedigen om de SSD te vervangen, omdat het zeer lastig is dit te doen. Het verlichte toetsenbord en touchscherm zijn fatsoenlijk. Wel is het wat flauw van HP om de Tilt Pen niet direct mee te leveren.
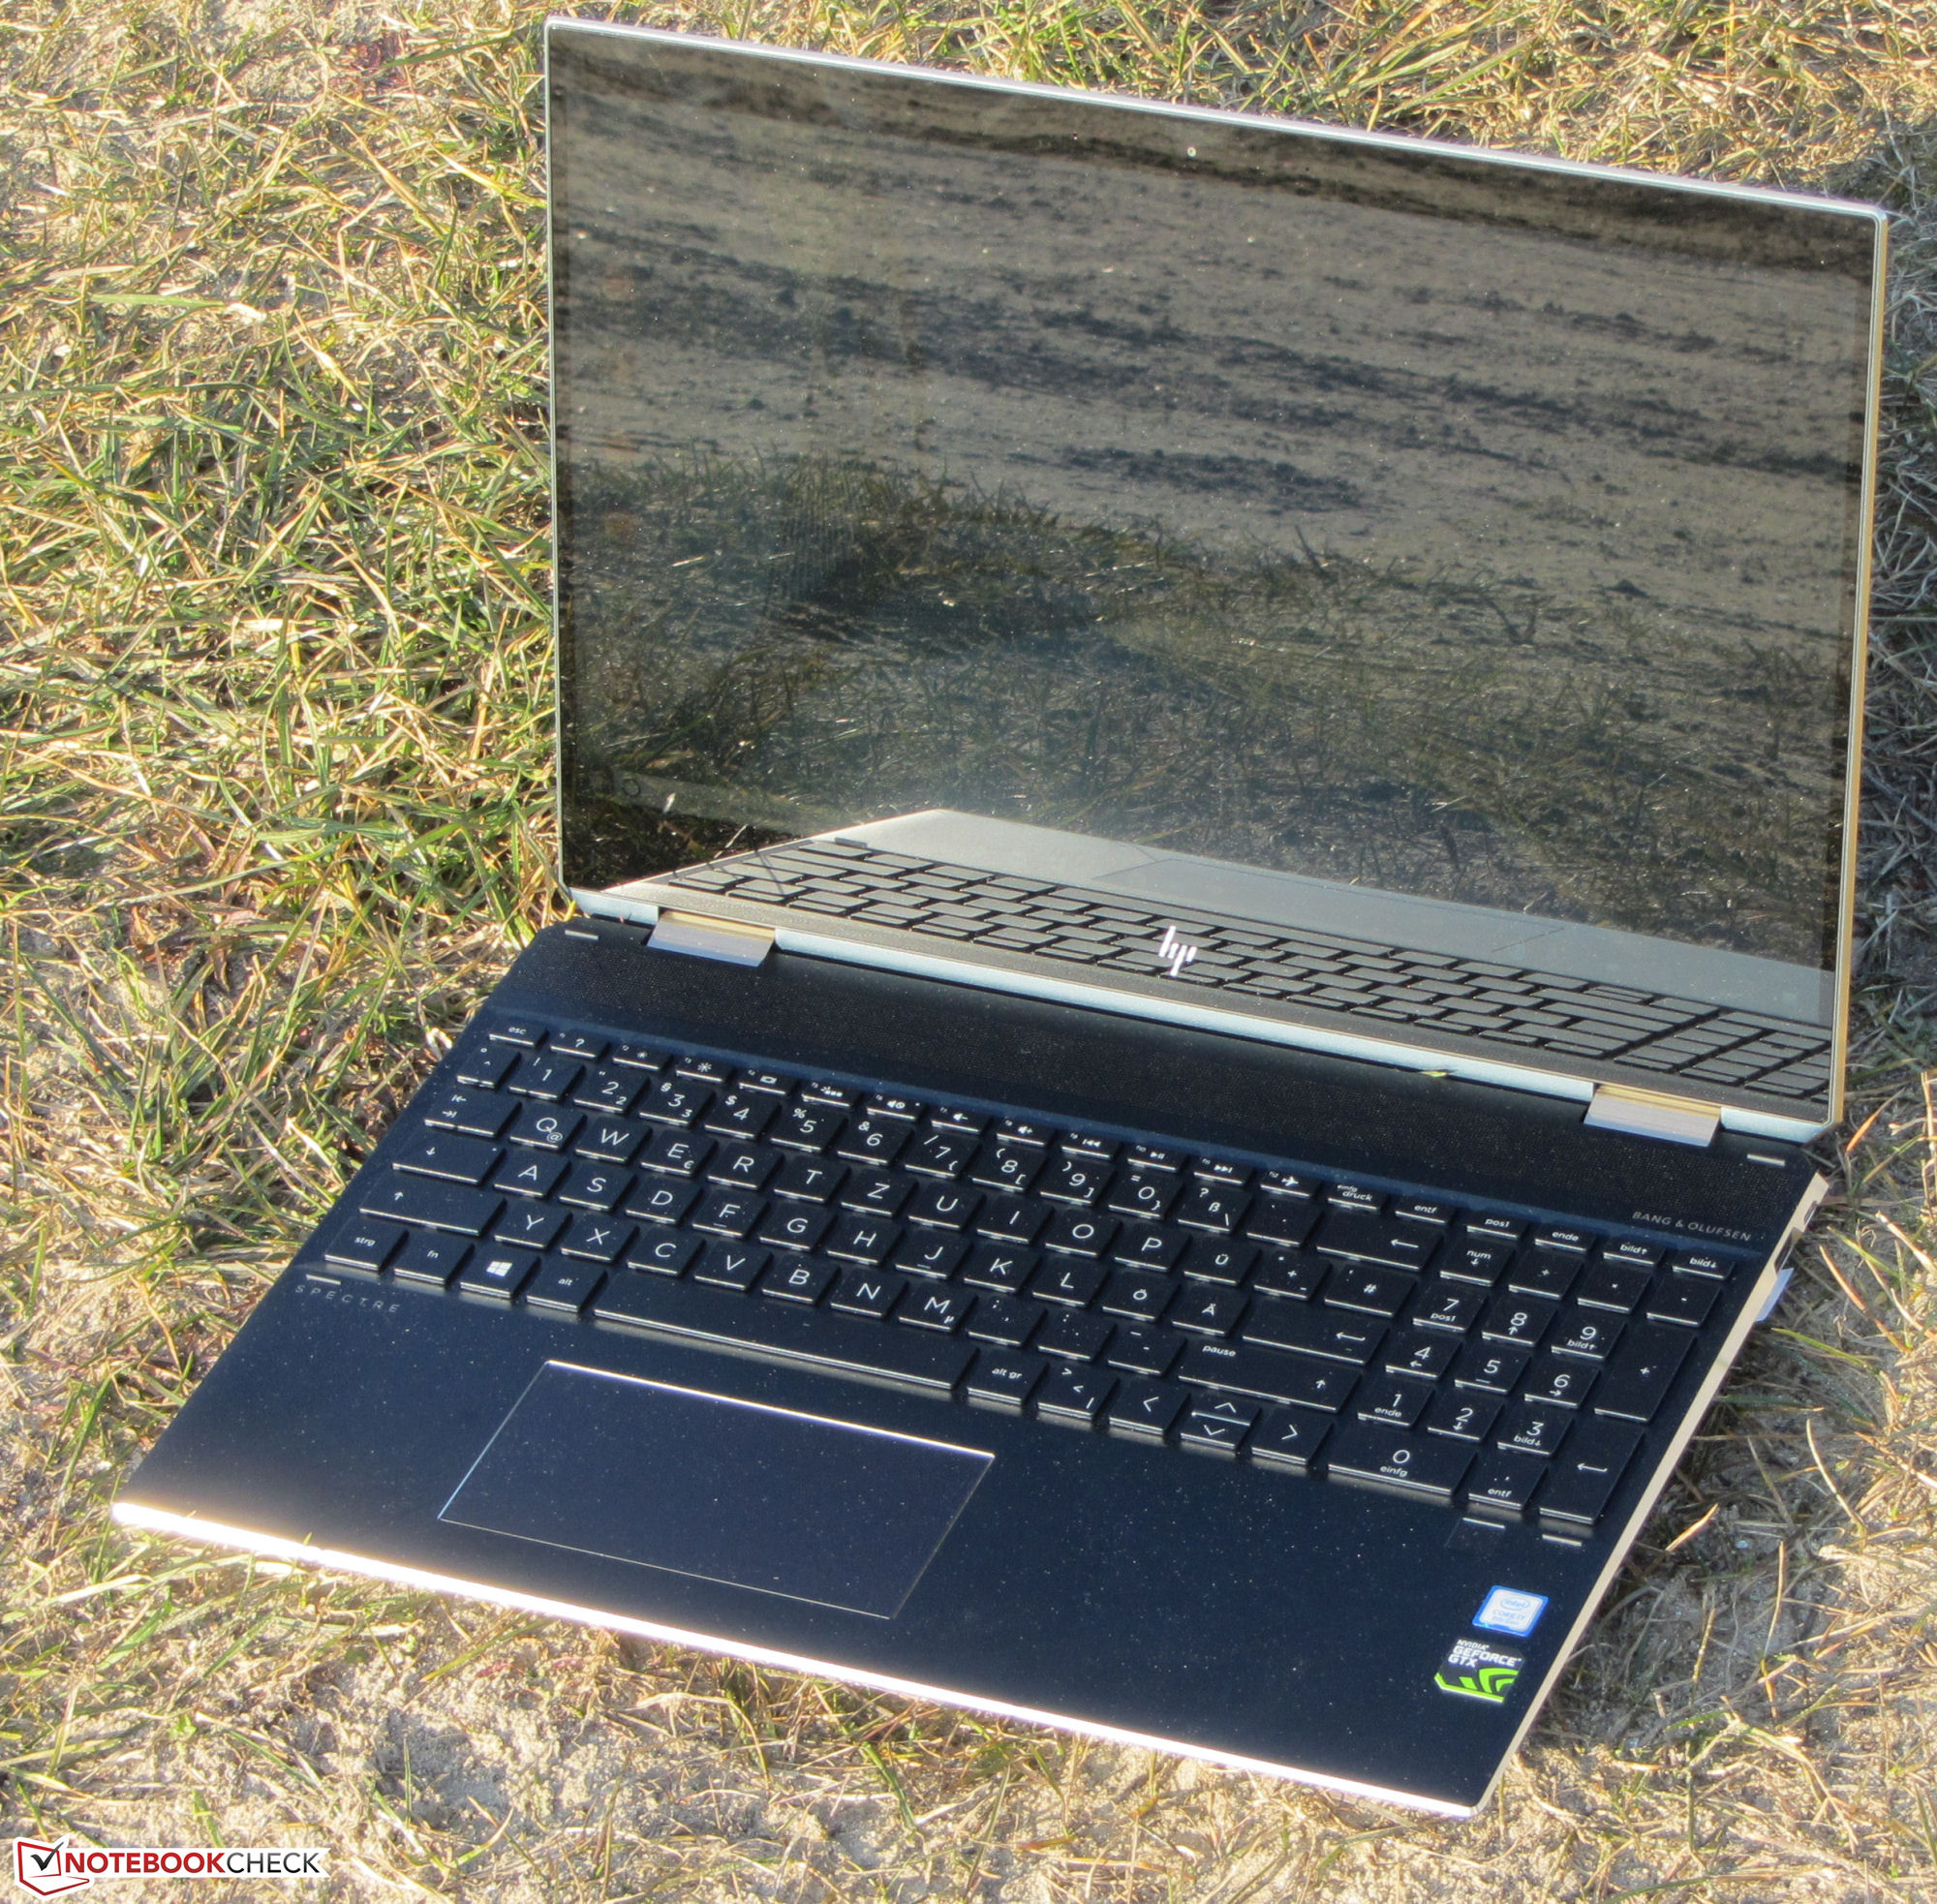
Het beeldscherm is groot genoeg met stabiele kijkhoeken en kleurechtheid, maar de magere maximale helderheid en ondermaatse contrast halen de score omlaag. We hadden bij een dergelijk geprijsd notebook een helderder en levendiger beeldscherm verwacht.
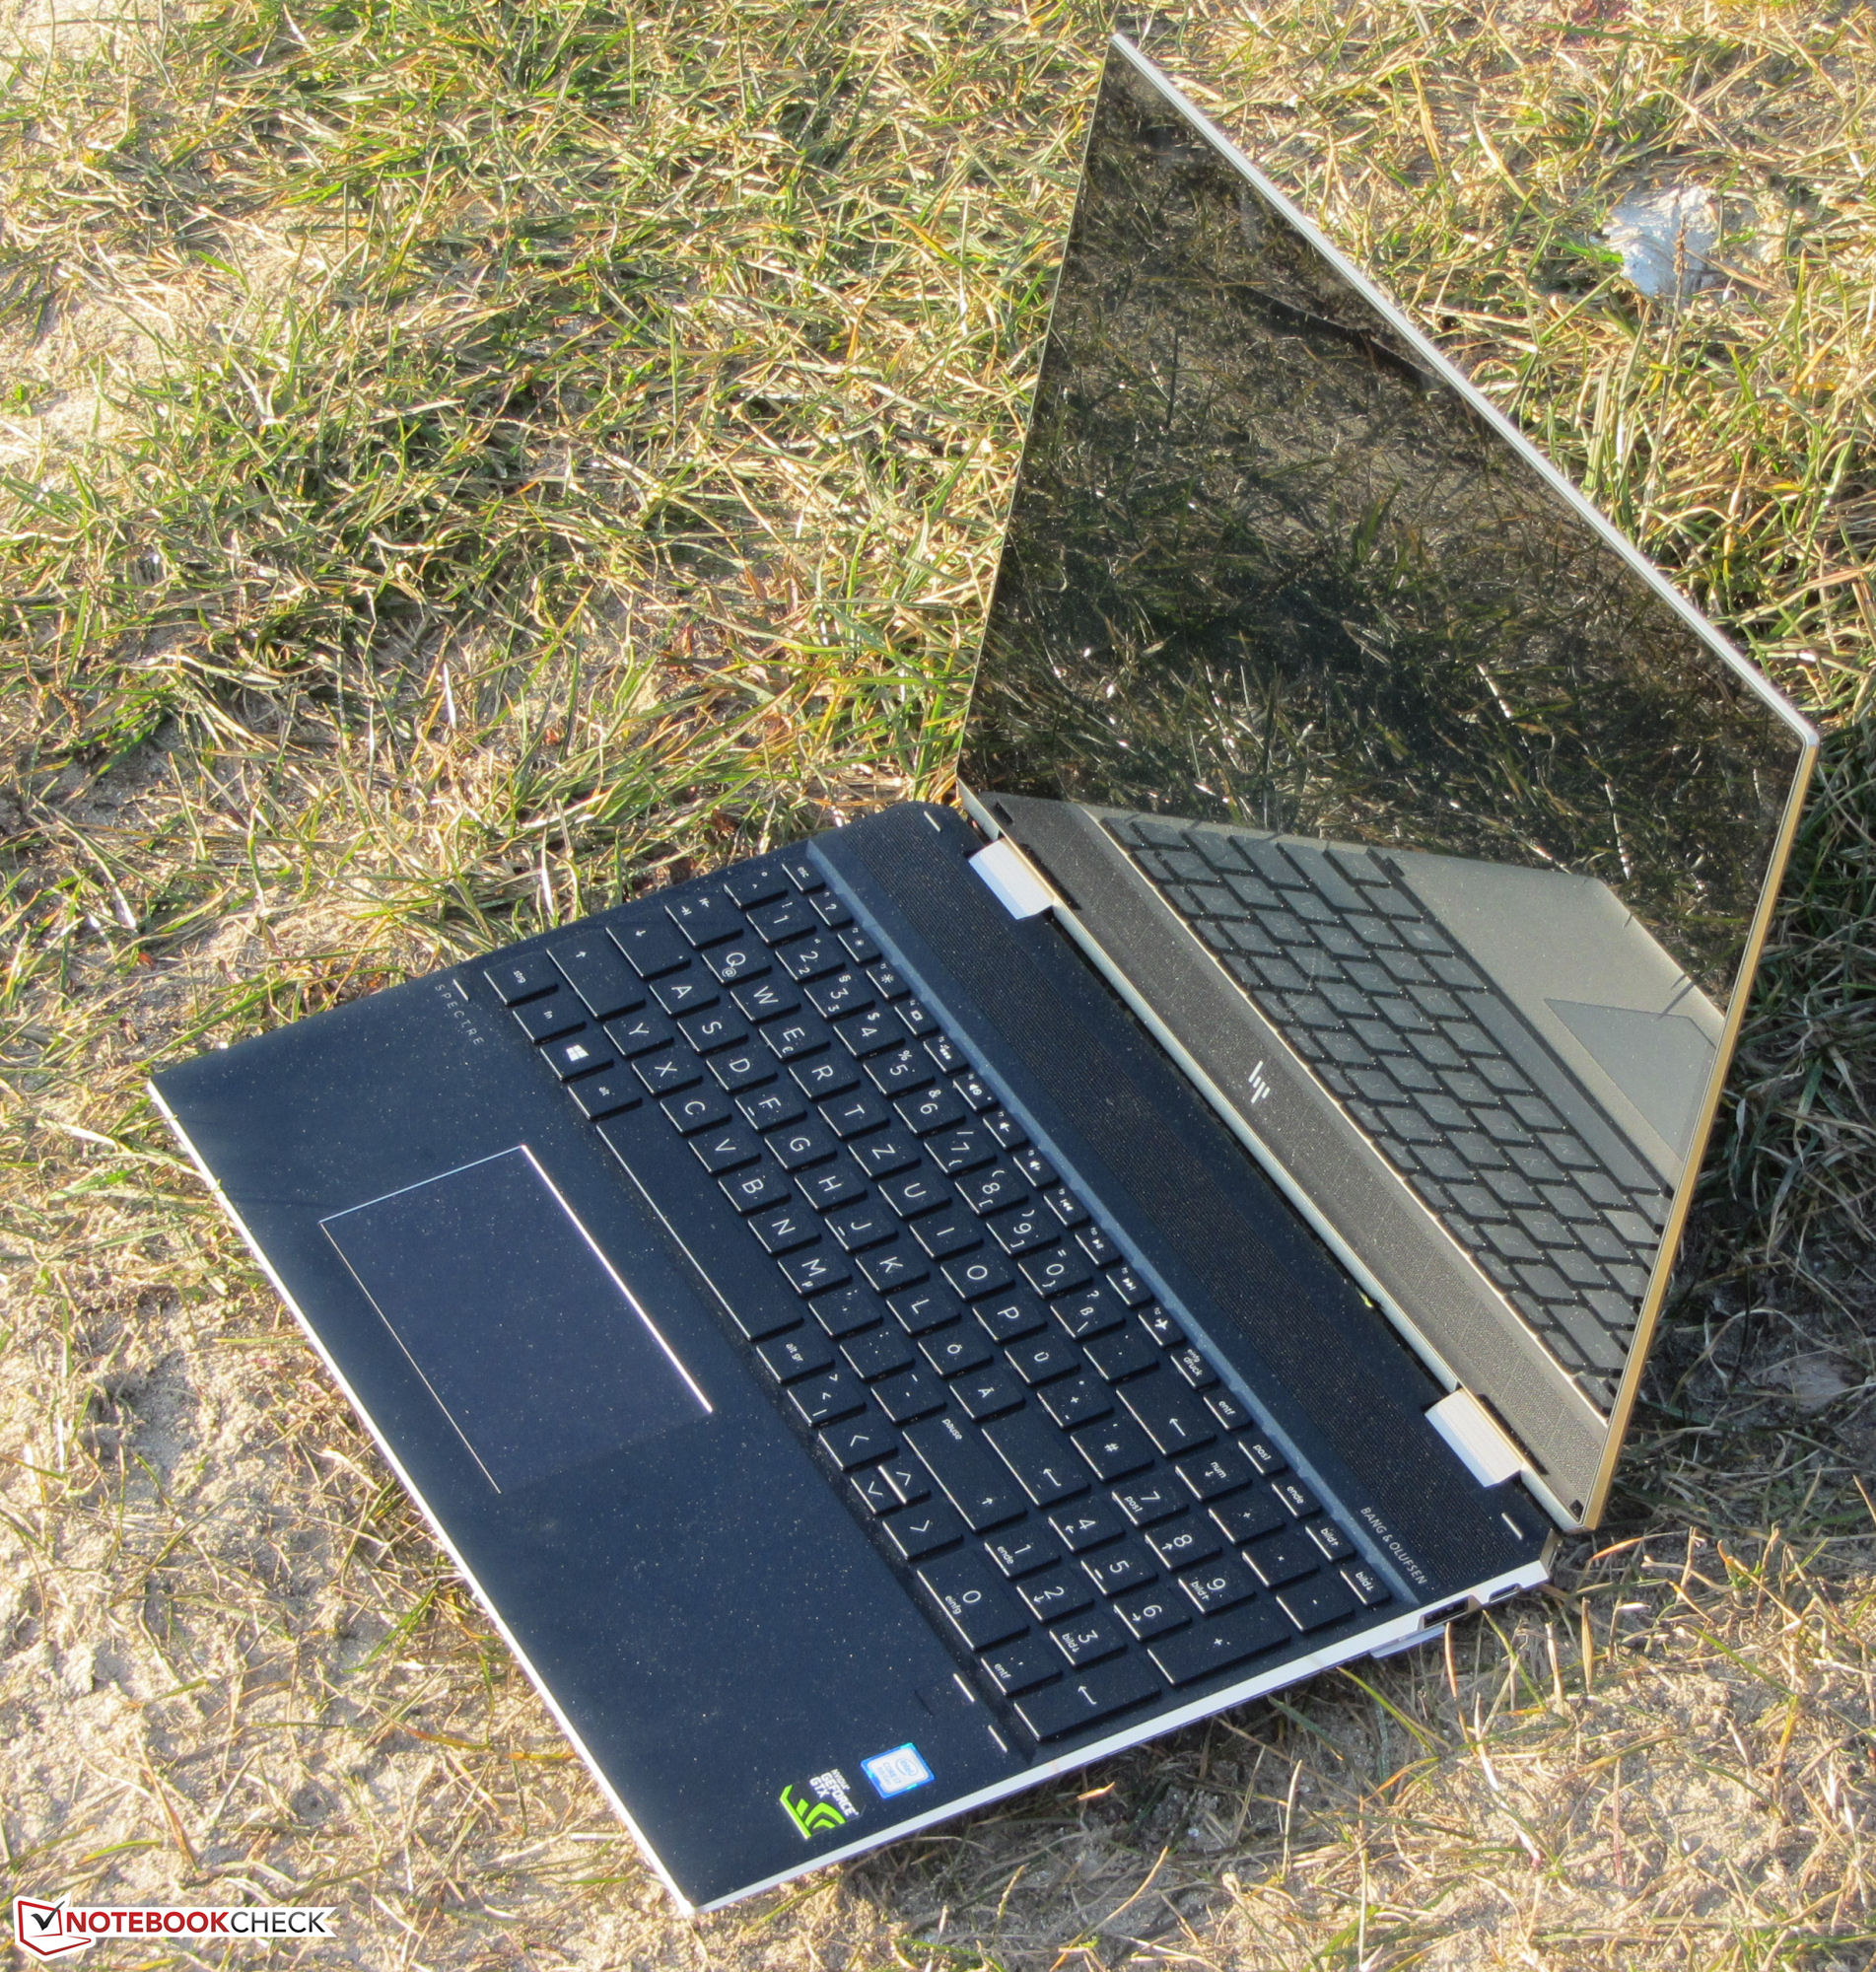
Al met al is de Spectre x360 15-df0126ng een grote en indrukwekkende convertible, maar de instapmodellen zijn uitgerust met aanzienlijk minder krachtige Core i7-8565U processor en GeForce MX150 GPU, en je zult dus goed moeten oppassen bij het kiezen van een model.
HP Spectre x360 15-df0126ng
- 25-10-2019 v7 (old)
Sascha Mölck
Price comparison
