Kort testrapport Razer Blade Pro 17 RTX 2060 Laptop: hoe verhoudt hij zich tot de RTX 2080 Max-Q?

| SD Card Reader | |
| average JPG Copy Test (av. of 3 runs) | |
| Razer Blade Pro 17 RTX 2060 (Toshiba Exceria Pro SDXC 64 GB UHS-II) | |
| Razer Blade Pro 2017 (Toshiba Exceria Pro SDXC 64 GB UHS-II) | |
| maximum AS SSD Seq Read Test (1GB) | |
| Razer Blade Pro 17 RTX 2060 (Toshiba Exceria Pro SDXC 64 GB UHS-II) | |
| Razer Blade Pro 2017 (Toshiba Exceria Pro SDXC 64 GB UHS-II) | |
| |||||||||||||||||||||||||
Helderheidsverdeling: 93 %
Helderheid in Batterij-modus: 300.4 cd/m²
Contrast: 939:1 (Zwart: 0.32 cd/m²)
ΔE ColorChecker Calman: 2.32 | ∀{0.5-29.43 Ø4.73}
calibrated: 2.95
ΔE Greyscale Calman: 1.5 | ∀{0.09-98 Ø4.97}
89% sRGB (Argyll 1.6.3 3D)
57.4% AdobeRGB 1998 (Argyll 1.6.3 3D)
62.5% AdobeRGB 1998 (Argyll 3D)
89.4% sRGB (Argyll 3D)
61.1% Display P3 (Argyll 3D)
Gamma: 2.3
CCT: 6764 K
| Razer Blade Pro 17 RTX 2060 AU Optronics B173HAN04.0, IPS, 17.3", 1920x1080 | Asus Zephyrus S GX701GX B173HAN04.0 (AUO409D), IPS, 17.3", 1920x1080 | MSI GS75 Stealth 9SG Chi Mei N173HCE-G33 (CMN175C), IPS, 17.3", 1920x1080 | Asus ASUS ROG Strix SCAR III G731GW-XB74 AU Optronics AUO409D, IPS, 17.3", 1920x1080 | Razer Blade Pro 2017 Sharp LQ173D1JW33 (SHP145A), IGZO, 17.3", 3840x2160 | Acer Predator Helios 500 PH517-51-93LS B173ZAN01.0, IPS LED, 17.3", 3840x2160 | |
|---|---|---|---|---|---|---|
| Display | 1% | 4% | -0% | 39% | 38% | |
| Display P3 Coverage (%) | 61.1 | 62.9 3% | 62.6 2% | 61.9 1% | 88.9 45% | 86.7 42% |
| sRGB Coverage (%) | 89.4 | 87.8 -2% | 93.5 5% | 86.3 -3% | 100 12% | 100 12% |
| AdobeRGB 1998 Coverage (%) | 62.5 | 63.9 2% | 64.7 4% | 62.9 1% | 99.7 60% | 99.4 59% |
| Response Times | -8% | -10% | -19% | -565% | -303% | |
| Response Time Grey 50% / Grey 80% * (ms) | 6.8 ? | 7.2 ? -6% | 7.2 ? -6% | 7.2 ? -6% | 60.8 ? -794% | 36 ? -429% |
| Response Time Black / White * (ms) | 8.8 ? | 9.6 ? -9% | 10 ? -14% | 11.6 ? -32% | 38.4 ? -336% | 24.4 ? -177% |
| PWM Frequency (Hz) | 25510 ? | 204.9 ? | ||||
| Screen | 7% | 17% | -34% | -45% | -15% | |
| Brightness middle (cd/m²) | 300.4 | 288 -4% | 366 22% | 297.4 -1% | 230 -23% | 366 22% |
| Brightness (cd/m²) | 289 | 287 -1% | 343 19% | 306 6% | 207 -28% | 349 21% |
| Brightness Distribution (%) | 93 | 91 -2% | 91 -2% | 80 -14% | 83 -11% | 86 -8% |
| Black Level * (cd/m²) | 0.32 | 0.2 37% | 0.29 9% | 0.31 3% | 0.2 37% | 0.46 -44% |
| Contrast (:1) | 939 | 1440 53% | 1262 34% | 959 2% | 1150 22% | 796 -15% |
| Colorchecker dE 2000 * | 2.32 | 2.33 -0% | 1.51 35% | 4.08 -76% | 5.62 -142% | 2.9 -25% |
| Colorchecker dE 2000 max. * | 3.81 | 5.34 -40% | 3.22 15% | 6.88 -81% | 10.24 -169% | 5.4 -42% |
| Colorchecker dE 2000 calibrated * | 2.95 | 2.47 16% | 0.71 76% | 4 -36% | 3.1 -5% | |
| Greyscale dE 2000 * | 1.5 | 1.19 21% | 1.93 -29% | 4 -167% | 4.54 -203% | 3.5 -133% |
| Gamma | 2.3 96% | 2.41 91% | 2.38 92% | 2.259 97% | 2.36 93% | 2.37 93% |
| CCT | 6764 96% | 6710 97% | 6881 94% | 7205 90% | 6625 98% | 6616 98% |
| Color Space (Percent of AdobeRGB 1998) (%) | 57.4 | 57 -1% | 60 5% | 56 -2% | 88 53% | 88.1 53% |
| Color Space (Percent of sRGB) (%) | 89 | 88 -1% | 94 6% | 86 -3% | 100 12% | 100 12% |
| Totaal Gemiddelde (Programma / Instellingen) | 0% /
4% | 4% /
11% | -18% /
-26% | -190% /
-98% | -93% /
-41% |
* ... kleiner is beter
Responstijd Scherm
| ↔ Responstijd Zwart naar Wit | ||
|---|---|---|
| 8.8 ms ... stijging ↗ en daling ↘ gecombineerd | ↗ 4.4 ms stijging | 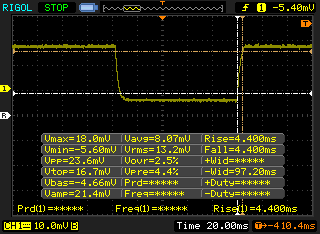 |
| ↘ 4.4 ms daling | ||
| Het scherm vertoonde snelle responstijden in onze tests en zou geschikt moeten zijn voor games. Ter vergelijking: alle testtoestellen variëren van 0.1 (minimum) tot 240 (maximum) ms. » 24 % van alle toestellen zijn beter. Dit betekent dat de gemeten responstijd beter is dan het gemiddelde (19.9 ms) van alle geteste toestellen. | ||
| ↔ Responstijd 50% Grijs naar 80% Grijs | ||
| 6.8 ms ... stijging ↗ en daling ↘ gecombineerd | ↗ 3.6 ms stijging | 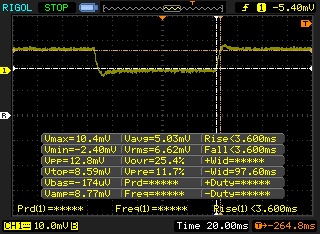 |
| ↘ 3.2 ms daling | ||
| Het scherm vertoonde erg snelle responstijden in onze tests en zou zeer geschikt moeten zijn voor snelle games. Ter vergelijking: alle testtoestellen variëren van 0.165 (minimum) tot 636 (maximum) ms. » 19 % van alle toestellen zijn beter. Dit betekent dat de gemeten responstijd beter is dan het gemiddelde (31.1 ms) van alle geteste toestellen. | ||
Screen Flickering / PWM (Pulse-Width Modulation)
| Screen flickering / PWM niet waargenomen | 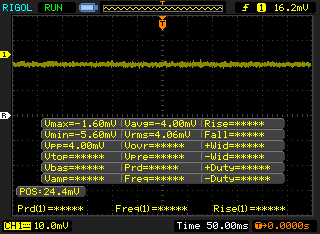 | ||
Ter vergelijking: 52 % van alle geteste toestellen maakten geen gebruik van PWM om de schermhelderheid te verlagen. Als het wel werd gebruikt, werd een gemiddelde van 7791 (minimum: 5 - maximum: 343500) Hz waargenomen. | |||
| Cinebench R10 | |
| Rendering Multiple CPUs 32Bit | |
| Schenker XMG Ultra 15 Turing | |
| MSI GE75 9SG | |
| Gemiddeld Intel Core i7-9750H (28251 - 36304, n=13) | |
| Lenovo Legion Y540-17IRH | |
| Asus Strix GL703VM-DB74 | |
| Rendering Single 32Bit | |
| Schenker XMG Ultra 15 Turing | |
| MSI GE75 9SG | |
| Gemiddeld Intel Core i7-9750H (6659 - 7214, n=13) | |
| Lenovo Legion Y540-17IRH | |
| Asus Strix GL703VM-DB74 | |
| wPrime 2.10 - 1024m | |
| Asus Strix GL703VM-DB74 | |
| Gemiddeld Intel Core i7-9750H (n=1) | |
| MSI GE75 9SG | |
* ... kleiner is beter
| PCMark 8 Home Score Accelerated v2 | 4401 punten | |
| PCMark 8 Work Score Accelerated v2 | 5676 punten | |
| PCMark 10 Score | 5641 punten | |
Help | ||
| Razer Blade Pro 17 RTX 2060 Samsung SSD PM981 MZVLB512HAJQ | Asus Zephyrus S GX701GX Samsung SSD PM981 MZVLB1T0HALR | MSI GS75 Stealth 9SG 2x Samsung SSD PM981 MZVLB1T0HALR (RAID 0) | Asus ASUS ROG Strix SCAR III G731GW-XB74 Intel SSD 660p 1TB SSDPEKNW010T8 | Razer Blade Pro 2017 2x Samsung SSD PM951 MZVLV256HCHP (RAID 0) | |
|---|---|---|---|---|---|
| AS SSD | 5% | 6% | -34% | -19% | |
| Seq Read (MB/s) | 1810 | 911 -50% | 2855 58% | 1427 -21% | 2599 44% |
| Seq Write (MB/s) | 1797 | 2347 31% | 2687 50% | 1610 -10% | 588 -67% |
| 4K Read (MB/s) | 48.43 | 53 9% | 30.31 -37% | 25.63 -47% | 37.57 -22% |
| 4K Write (MB/s) | 106 | 122.5 16% | 96.3 -9% | 84.2 -21% | 104.4 -2% |
| 4K-64 Read (MB/s) | 1156 | 1577 36% | 1460 26% | 588 -49% | 1116 -3% |
| 4K-64 Write (MB/s) | 1748 | 1734 -1% | 1224 -30% | 732 -58% | 513 -71% |
| Access Time Read * (ms) | 0.057 | 0.08 -40% | 0.054 5% | 0.054 5% | 0.051 11% |
| Access Time Write * (ms) | 0.035 | 0.031 11% | 0.038 -9% | 0.071 -103% | 0.036 -3% |
| Score Read (Points) | 1385 | 1721 24% | 1776 28% | 756 -45% | 1414 2% |
| Score Write (Points) | 2033 | 2091 3% | 1589 -22% | 978 -52% | 676 -67% |
| Score Total (Points) | 4135 | 4771 15% | 4259 3% | 2134 -48% | 2715 -34% |
| Copy ISO MB/s (MB/s) | 1984 | 2226 12% | 1489 -25% | ||
| Copy Program MB/s (MB/s) | 588 | 426.4 -27% | 514 -13% | ||
| Copy Game MB/s (MB/s) | 835 | 1152 38% | 893 7% |
* ... kleiner is beter

| 3DMark 11 Performance | 18741 punten | |
| 3DMark Cloud Gate Standard Score | 37458 punten | |
| 3DMark Fire Strike Score | 15132 punten | |
| 3DMark Time Spy Score | 6608 punten | |
Help | ||
| Shadow of the Tomb Raider - 1920x1080 Highest Preset AA:T | |
| MSI GE75 9SG | |
| MSI RTX 2060 Gaming Z 6G | |
| Asus ASUS ROG Strix SCAR III G731GW-XB74 | |
| Alienware m15 P79F | |
| Razer Blade Pro 17 RTX 2060 | |
| Asus Zephyrus S GX701GX | |
| Gemiddeld NVIDIA GeForce RTX 2060 Mobile (54 - 86, n=22) | |
| Asus ROG Strix G GL731GU-RB74 | |
| MSI GF75 Thin 9SC | |
| lage | gem. | hoge | ultra | |
|---|---|---|---|---|
| BioShock Infinite (2013) | 320.8 | 278 | 246.3 | 153.4 |
| The Witcher 3 (2015) | 279.4 | 196.4 | 118.5 | 65 |
| Shadow of the Tomb Raider (2018) | 130 | 97 | 92 | 81 |
| Razer Blade Pro 17 RTX 2060 GeForce RTX 2060 Mobile, i7-9750H, Samsung SSD PM981 MZVLB512HAJQ | Asus Zephyrus S GX701GX GeForce RTX 2080 Max-Q, i7-8750H, Samsung SSD PM981 MZVLB1T0HALR | MSI GS75 Stealth 9SG GeForce RTX 2080 Max-Q, i7-9750H, 2x Samsung SSD PM981 MZVLB1T0HALR (RAID 0) | Asus ASUS ROG Strix SCAR III G731GW-XB74 GeForce RTX 2070 Mobile, i7-9750H, Intel SSD 660p 1TB SSDPEKNW010T8 | Razer Blade Pro 2017 GeForce GTX 1080 Mobile, i7-7820HK, 2x Samsung SSD PM951 MZVLV256HCHP (RAID 0) | Razer Blade Pro 17 RTX 2080 Max-Q GeForce RTX 2080 Max-Q, i7-9750H, Samsung SSD PM981 MZVLB512HAJQ | Acer Predator Helios 500 PH517-51-93LS GeForce GTX 1070 Mobile, i9-8950HK, Liteon CA1-8D512 | |
|---|---|---|---|---|---|---|---|
| Noise | -6% | -9% | -6% | -9% | -2% | 6% | |
| uit / omgeving * (dB) | 28.2 | 29 -3% | 30 -6% | 28.2 -0% | 30 -6% | 28.2 -0% | 29.4 -4% |
| Idle Minimum * (dB) | 28.2 | 29 -3% | 31 -10% | 28.2 -0% | 30 -6% | 28.2 -0% | 29.4 -4% |
| Idle Average * (dB) | 28.2 | 32 -13% | 32 -13% | 28.5 -1% | 31 -10% | 28.2 -0% | 29.4 -4% |
| Idle Maximum * (dB) | 28.2 | 33 -17% | 38 -35% | 30 -6% | 33 -17% | 30.8 -9% | 30.1 -7% |
| Load Average * (dB) | 43 | 47 -9% | 47 -9% | 51.5 -20% | 43 -0% | 42 2% | 36 16% |
| Witcher 3 ultra * (dB) | 48.4 | 49 -1% | 48 1% | 55.3 -14% | 55 -14% | 51 -5% | 37.6 22% |
| Load Maximum * (dB) | 53.4 | 51 4% | 49 8% | 55.3 -4% | 58 -9% | 53 1% | 42.2 21% |
* ... kleiner is beter
Geluidsniveau
| Onbelast |
| 28.2 / 28.2 / 28.2 dB (A) |
| Belasting |
| 43 / 53.4 dB (A) |
 | ||
30 dB stil 40 dB(A) hoorbaar 50 dB(A) luid |
||
min: | ||
(±) De maximumtemperatuur aan de bovenzijde bedraagt 40.6 °C / 105 F, vergeleken met het gemiddelde van 40.4 °C / 105 F, variërend van 21.2 tot 68.8 °C voor de klasse Gaming.
(-) De bodem warmt op tot een maximum van 45.4 °C / 114 F, vergeleken met een gemiddelde van 43.2 °C / 110 F
(+) Bij onbelast gebruik bedraagt de gemiddelde temperatuur voor de bovenzijde 28.6 °C / 83 F, vergeleken met het apparaatgemiddelde van 33.9 °C / 93 F.
(±) Bij het spelen van The Witcher 3 is de gemiddelde temperatuur voor de bovenzijde 32.8 °C / 91 F, vergeleken met het apparaatgemiddelde van 33.9 °C / 93 F.
(+) De palmsteunen en het touchpad zijn met een maximum van ###max## °C / 86 F koeler dan de huidtemperatuur en voelen daarom koel aan.
(±) De gemiddelde temperatuur van de handpalmsteun van soortgelijke toestellen bedroeg 28.8 °C / 83.8 F (-1.2 °C / -2.2 F).
Razer Blade Pro 17 RTX 2060 audioanalyse
(+) | luidsprekers kunnen relatief luid spelen (84.9 dB)
Bas 100 - 315 Hz
(±) | verminderde zeebaars - gemiddeld 9.6% lager dan de mediaan
(±) | lineariteit van de lage tonen is gemiddeld (14.4% delta ten opzichte van de vorige frequentie)
Midden 400 - 2000 Hz
(±) | hogere middens - gemiddeld 6.7% hoger dan de mediaan
(+) | de middentonen zijn lineair (5.1% delta ten opzichte van de vorige frequentie)
Hoog 2 - 16 kHz
(+) | evenwichtige hoogtepunten - slechts 2.4% verwijderd van de mediaan
(+) | de hoge tonen zijn lineair (4.4% delta naar de vorige frequentie)
Algemeen 100 - 16.000 Hz
(±) | lineariteit van het totale geluid is gemiddeld (18.1% verschil met de mediaan)
Vergeleken met dezelfde klasse
» 57% van alle geteste apparaten in deze klasse waren beter, 8% vergelijkbaar, 35% slechter
» De beste had een delta van 6%, het gemiddelde was 18%, de slechtste was 132%
Vergeleken met alle geteste toestellen
» 38% van alle geteste apparaten waren beter, 8% gelijk, 54% slechter
» De beste had een delta van 4%, het gemiddelde was 24%, de slechtste was 134%
Apple MacBook 12 (Early 2016) 1.1 GHz audioanalyse
(+) | luidsprekers kunnen relatief luid spelen (83.6 dB)
Bas 100 - 315 Hz
(±) | verminderde zeebaars - gemiddeld 11.3% lager dan de mediaan
(±) | lineariteit van de lage tonen is gemiddeld (14.2% delta ten opzichte van de vorige frequentie)
Midden 400 - 2000 Hz
(+) | evenwichtige middens - slechts 2.4% verwijderd van de mediaan
(+) | de middentonen zijn lineair (5.5% delta ten opzichte van de vorige frequentie)
Hoog 2 - 16 kHz
(+) | evenwichtige hoogtepunten - slechts 2% verwijderd van de mediaan
(+) | de hoge tonen zijn lineair (4.5% delta naar de vorige frequentie)
Algemeen 100 - 16.000 Hz
(+) | het totale geluid is lineair (10.2% verschil met de mediaan)
Vergeleken met dezelfde klasse
» 7% van alle geteste apparaten in deze klasse waren beter, 2% vergelijkbaar, 91% slechter
» De beste had een delta van 5%, het gemiddelde was 18%, de slechtste was 53%
Vergeleken met alle geteste toestellen
» 5% van alle geteste apparaten waren beter, 1% gelijk, 94% slechter
» De beste had een delta van 4%, het gemiddelde was 24%, de slechtste was 134%
| Uit / Standby | |
| Inactief | |
| Belasting |
|
Key:
min: | |
| Razer Blade Pro 17 RTX 2060 i7-9750H, GeForce RTX 2060 Mobile, Samsung SSD PM981 MZVLB512HAJQ, IPS, 1920x1080, 17.3" | Razer Blade Pro 17 RTX 2080 Max-Q i7-9750H, GeForce RTX 2080 Max-Q, Samsung SSD PM981 MZVLB512HAJQ, IPS, 1920x1080, 17.3" | Asus ASUS ROG Strix SCAR III G731GW-XB74 i7-9750H, GeForce RTX 2070 Mobile, Intel SSD 660p 1TB SSDPEKNW010T8, IPS, 1920x1080, 17.3" | Razer Blade Pro 2017 i7-7820HK, GeForce GTX 1080 Mobile, 2x Samsung SSD PM951 MZVLV256HCHP (RAID 0), IGZO, 3840x2160, 17.3" | Acer Predator Helios 500 PH517-51-93LS i9-8950HK, GeForce GTX 1070 Mobile, Liteon CA1-8D512, IPS LED, 3840x2160, 17.3" | Asus GL704GM-DH74 i7-8750H, GeForce GTX 1060 Mobile, WDC PC SN520 SDAPNUW-256G, IPS, 1920x1080, 17.3" | |
|---|---|---|---|---|---|---|
| Power Consumption | 1% | -16% | -46% | -31% | 8% | |
| Idle Minimum * (Watt) | 16 | 16.2 -1% | 18.2 -14% | 31 -94% | 24.6 -54% | 15.2 5% |
| Idle Average * (Watt) | 21.7 | 20.4 6% | 23 -6% | 36 -66% | 33.1 -53% | 20.4 6% |
| Idle Maximum * (Watt) | 26.1 | 26.1 -0% | 33.1 -27% | 44 -69% | 37.2 -43% | 27.3 -5% |
| Load Average * (Watt) | 105.6 | 96.5 9% | 124.8 -18% | 107 -1% | 124 -17% | 92.9 12% |
| Witcher 3 ultra * (Watt) | 161.8 | 182.9 -13% | 180.8 -12% | 212 -31% | 180 -11% | 143 12% |
| Load Maximum * (Watt) | 225.3 | 214.3 5% | 263 -17% | 258 -15% | 236.5 -5% | 190.6 15% |
* ... kleiner is beter
| Razer Blade Pro 17 RTX 2060 i7-9750H, GeForce RTX 2060 Mobile, 70 Wh | Asus Zephyrus S GX701GX i7-8750H, GeForce RTX 2080 Max-Q, 76 Wh | MSI GS75 Stealth 9SG i7-9750H, GeForce RTX 2080 Max-Q, 80.25 Wh | Asus ASUS ROG Strix SCAR III G731GW-XB74 i7-9750H, GeForce RTX 2070 Mobile, 66 Wh | Razer Blade Pro 2017 i7-7820HK, GeForce GTX 1080 Mobile, 99 Wh | Acer Predator Helios 500 PH517-51-93LS i9-8950HK, GeForce GTX 1070 Mobile, 74 Wh | Razer Blade Pro 17 RTX 2080 Max-Q i7-9750H, GeForce RTX 2080 Max-Q, 70 Wh | |
|---|---|---|---|---|---|---|---|
| Batterijduur | -16% | 33% | -13% | -27% | -36% | 4% | |
| WiFi v1.3 (h) | 4.5 | 3.8 -16% | 6 33% | 3.9 -13% | 3.3 -27% | 2.9 -36% | 4.7 4% |
| Reader / Idle (h) | 5 | 7.7 | 4.2 | 4.2 | 4.9 | ||
| Load (h) | 0.9 | 1.2 | 1.4 | 1.4 | 1.4 |
Pro
Contra
Dit is de verkorte versie van het originele artikel. Het volledige, Engelse testrapport vind je hier.
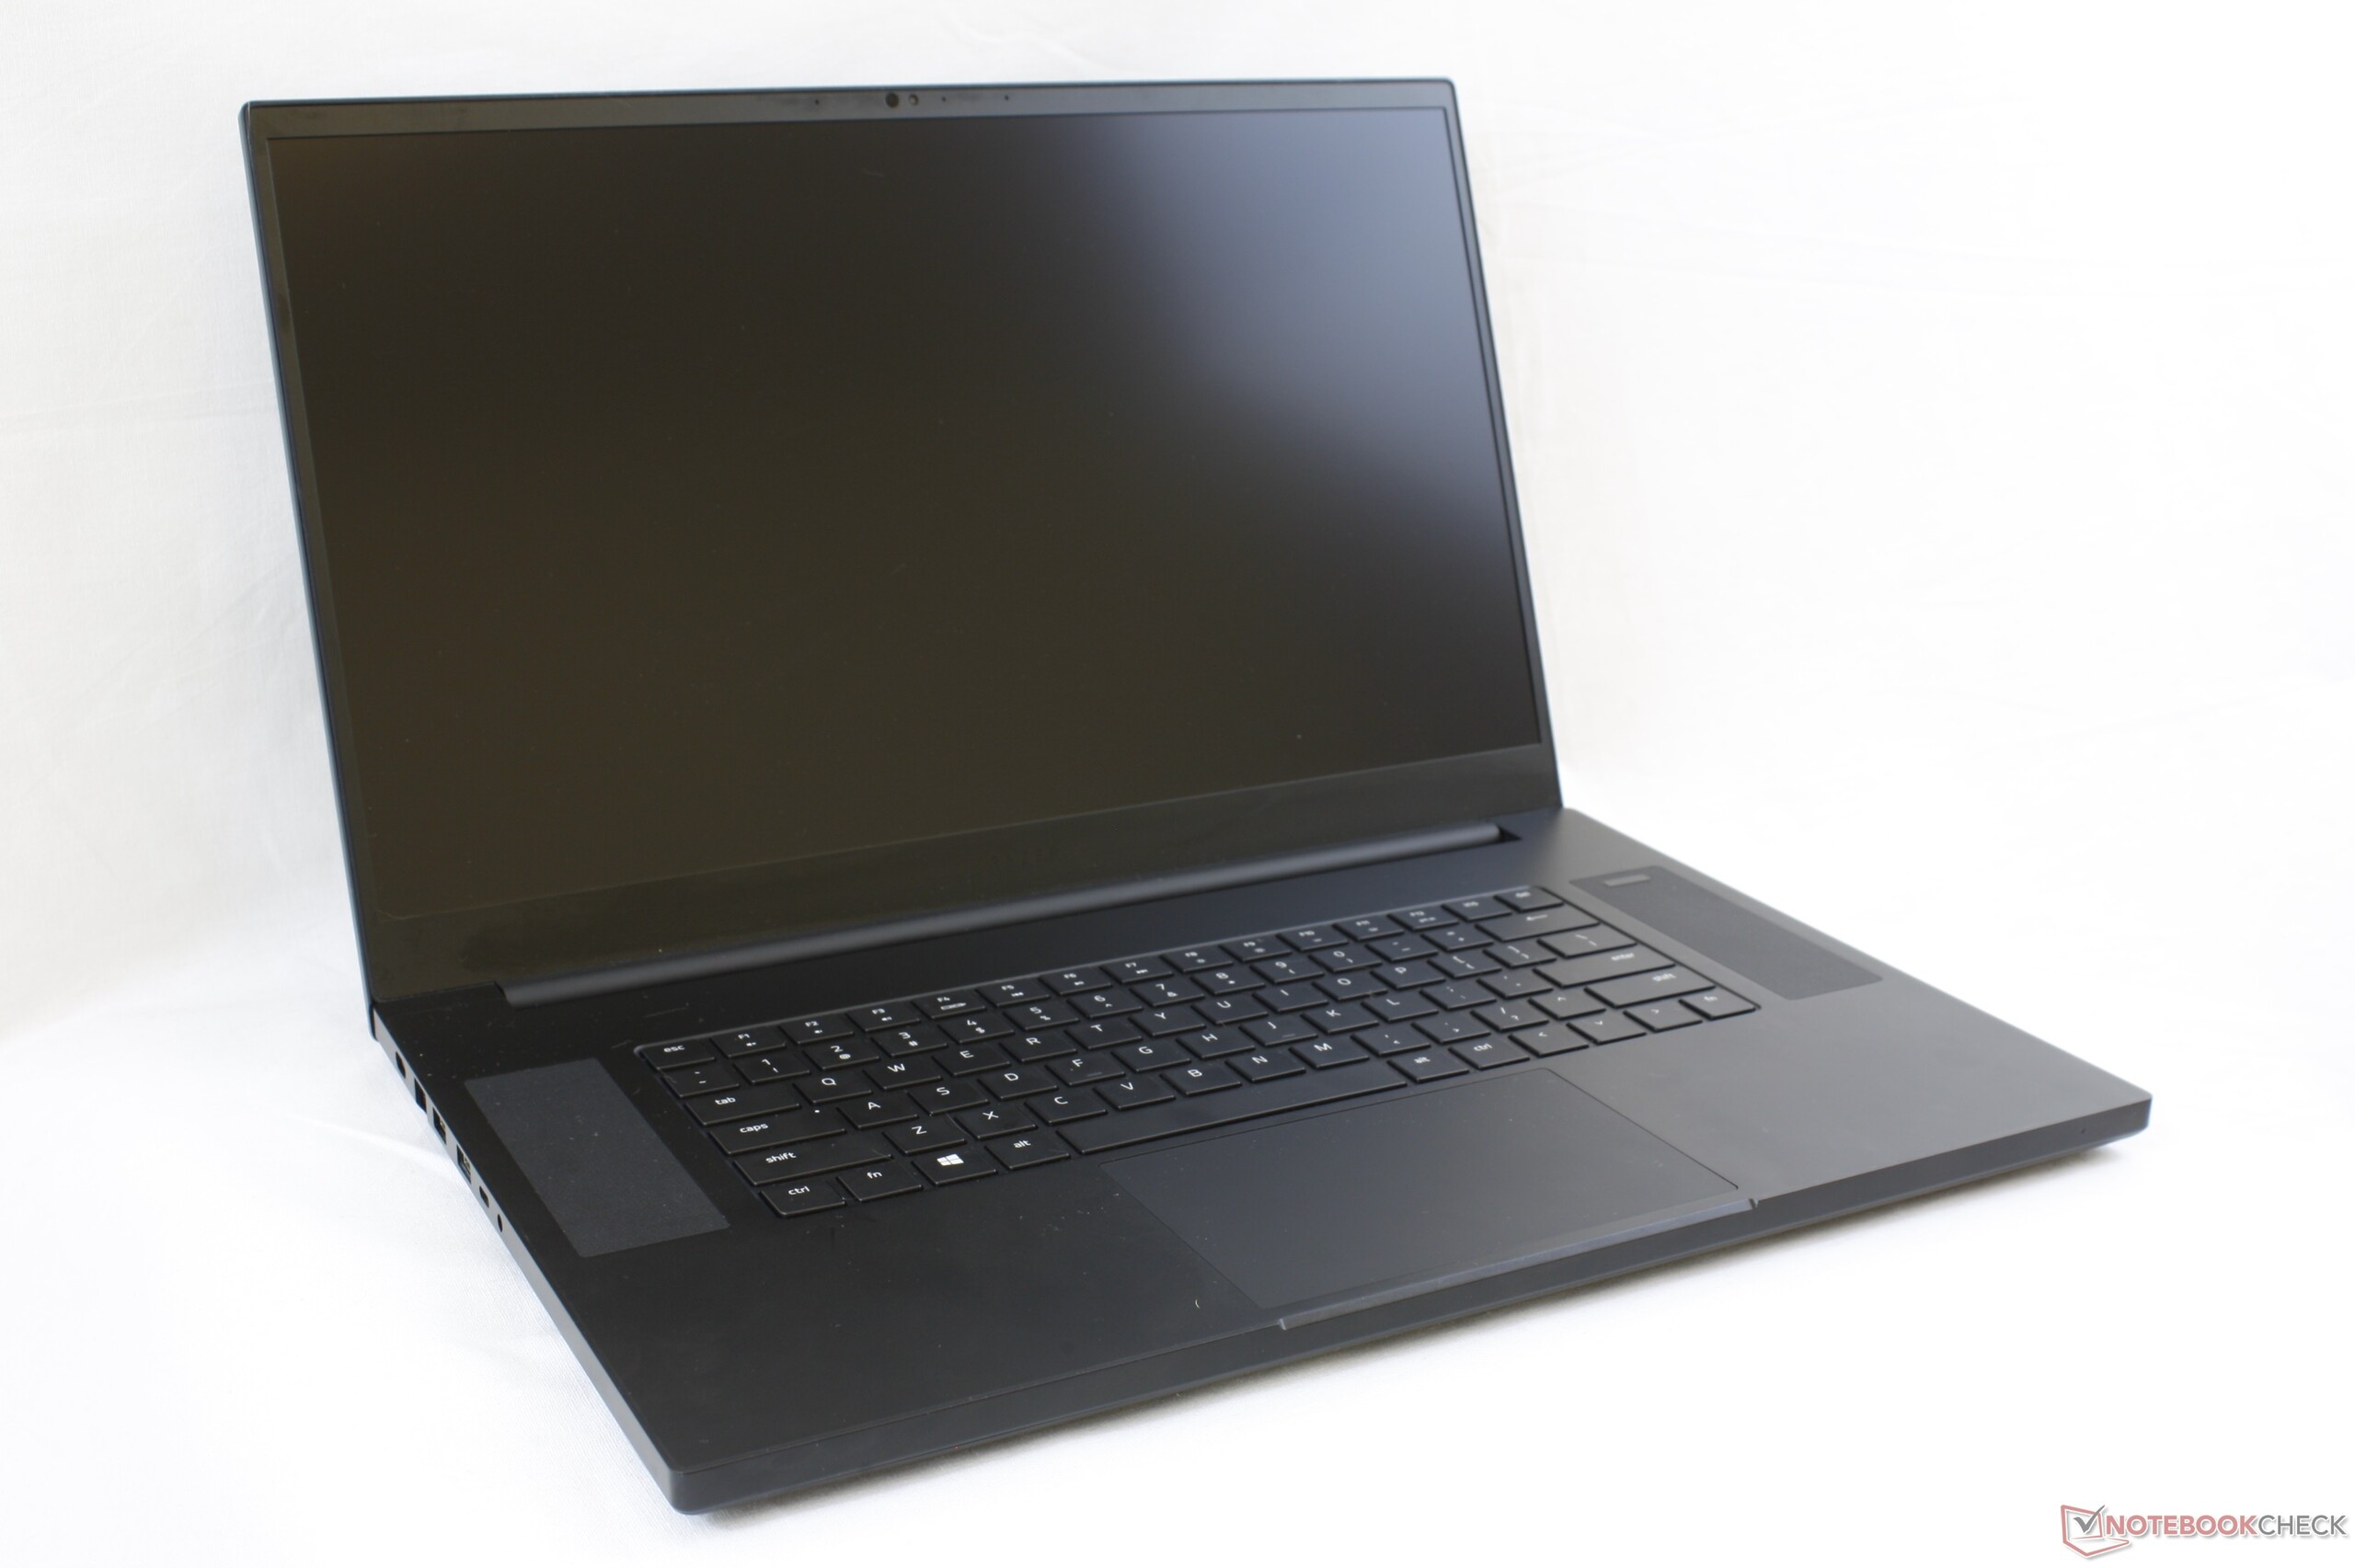
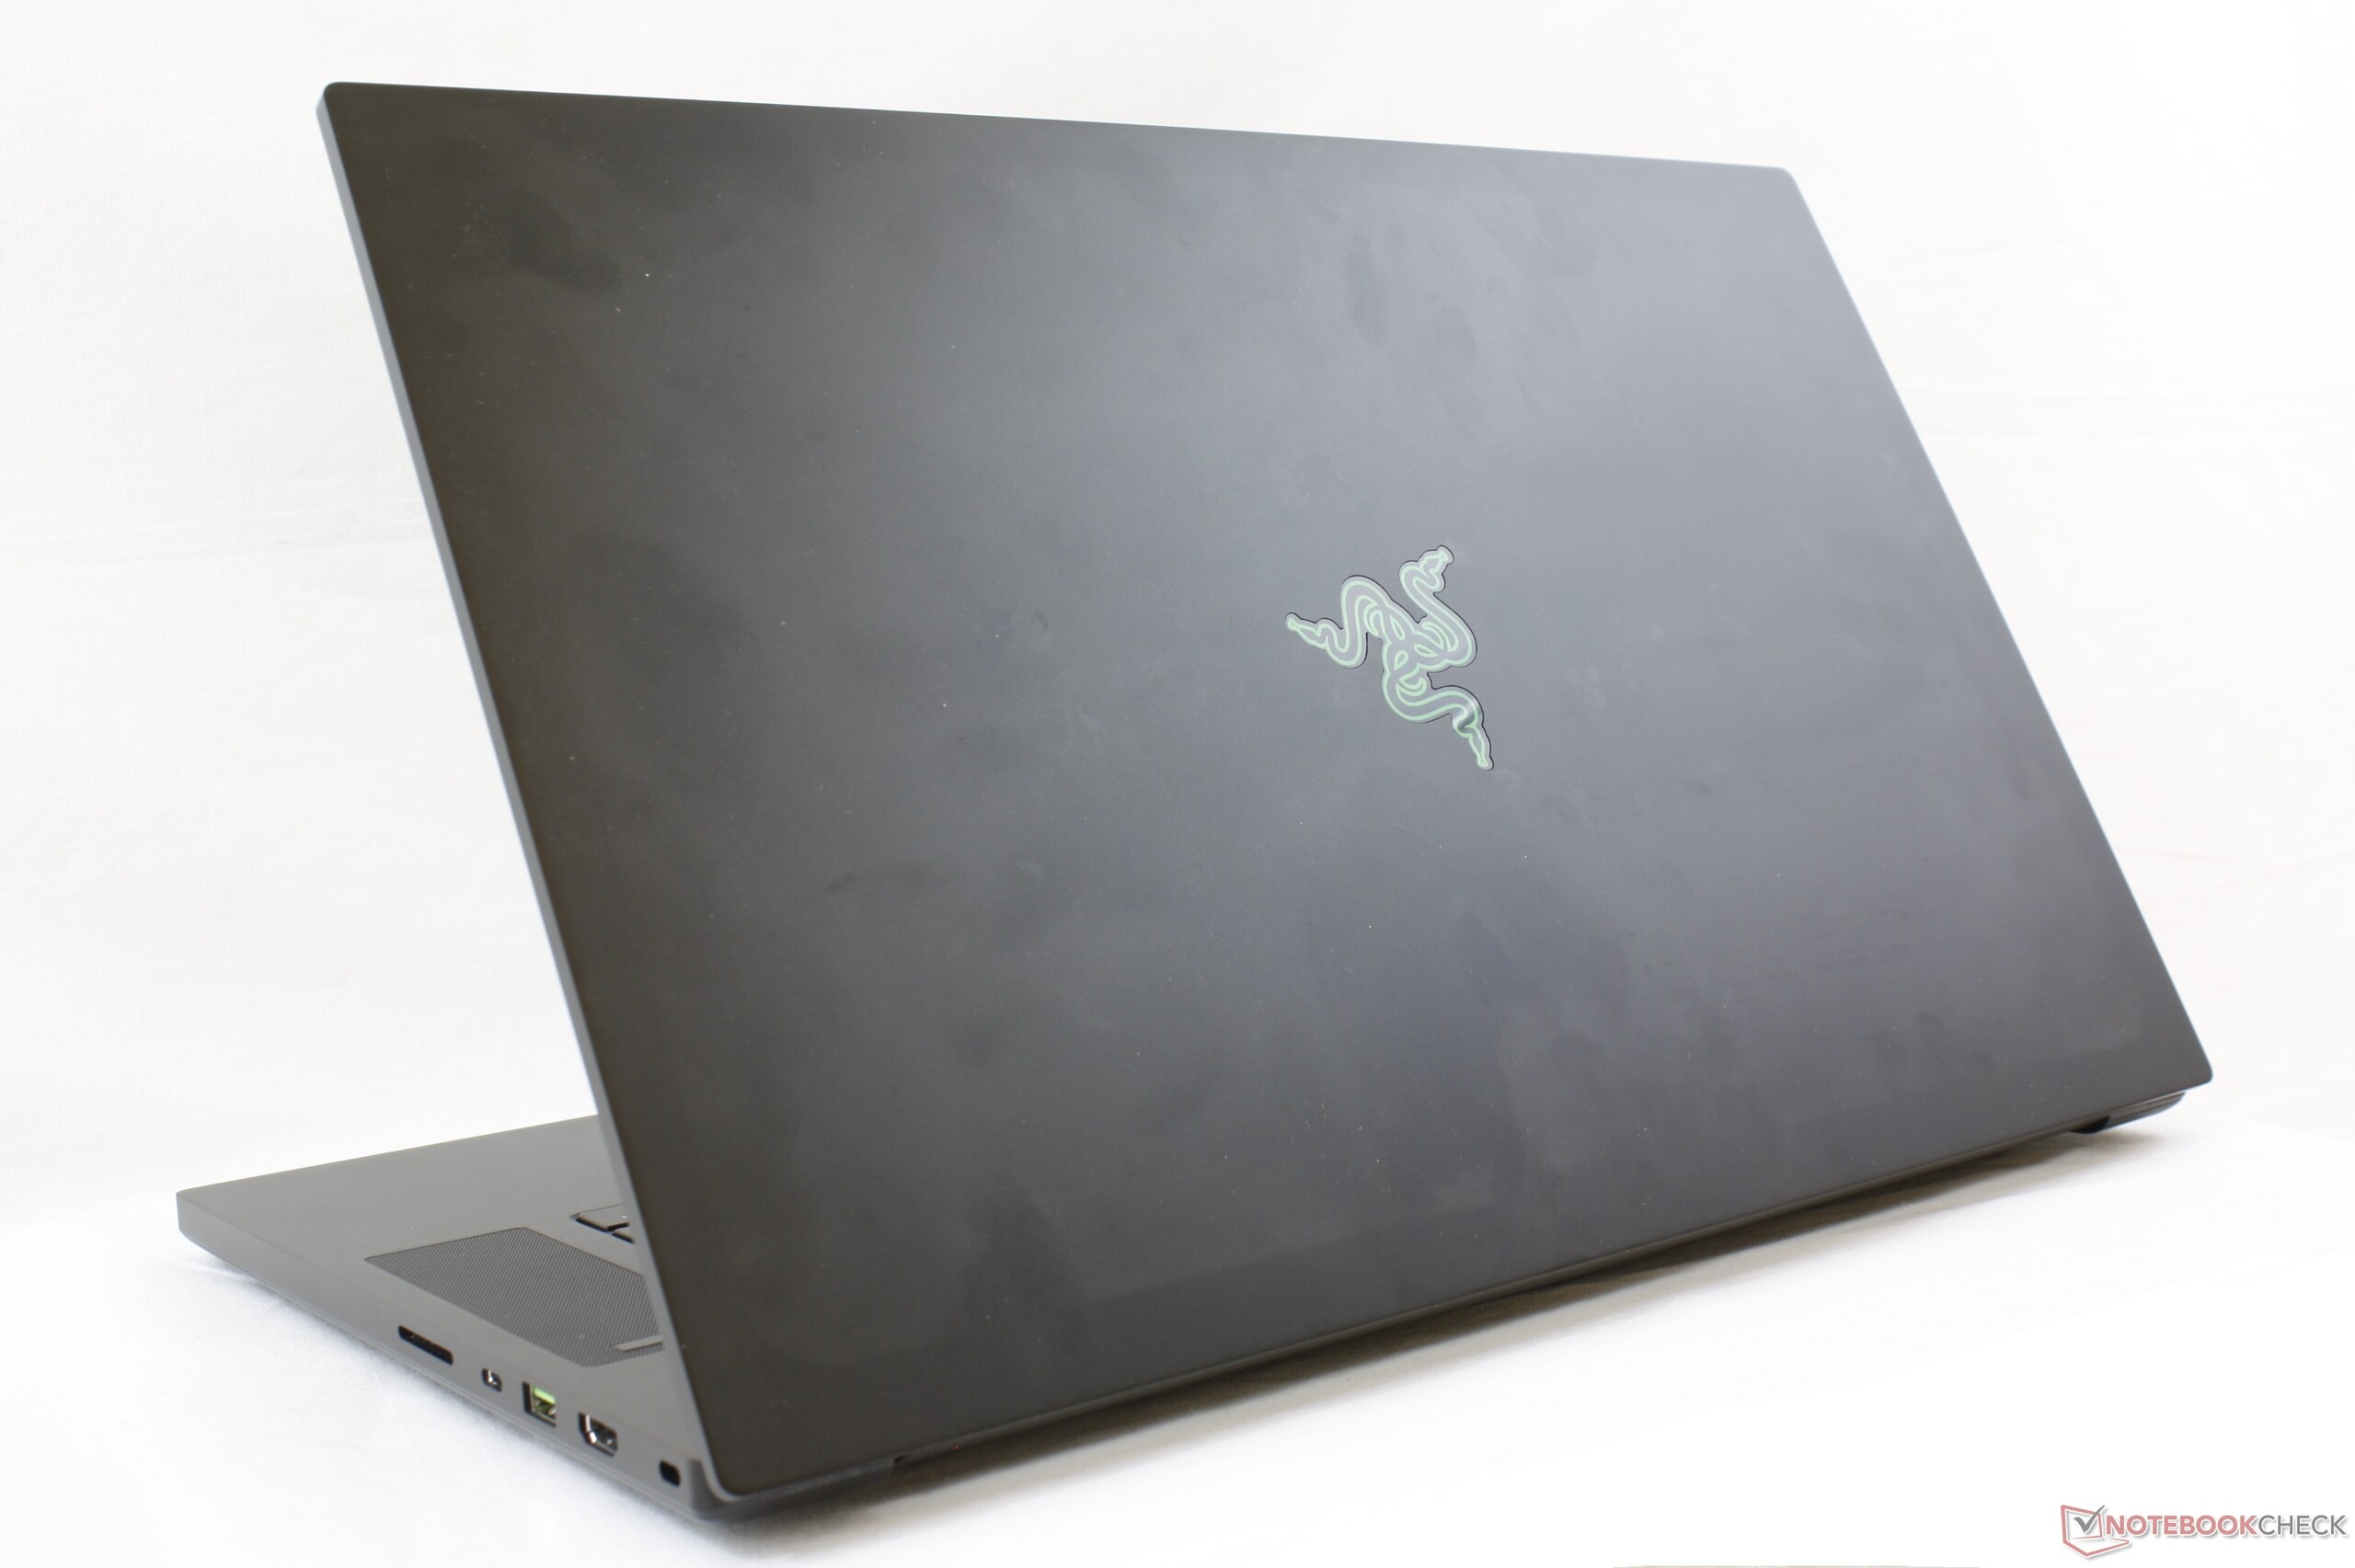
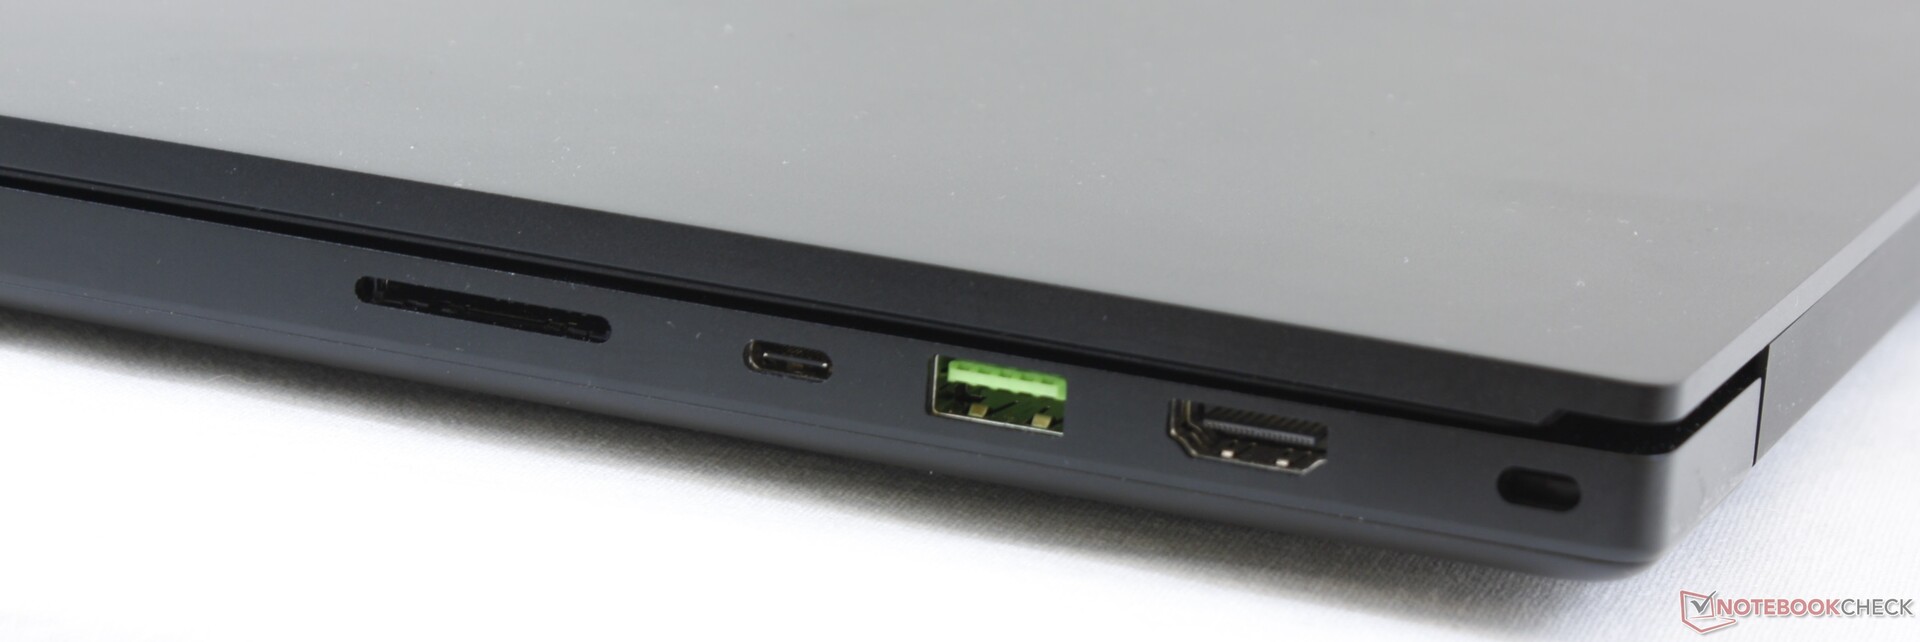
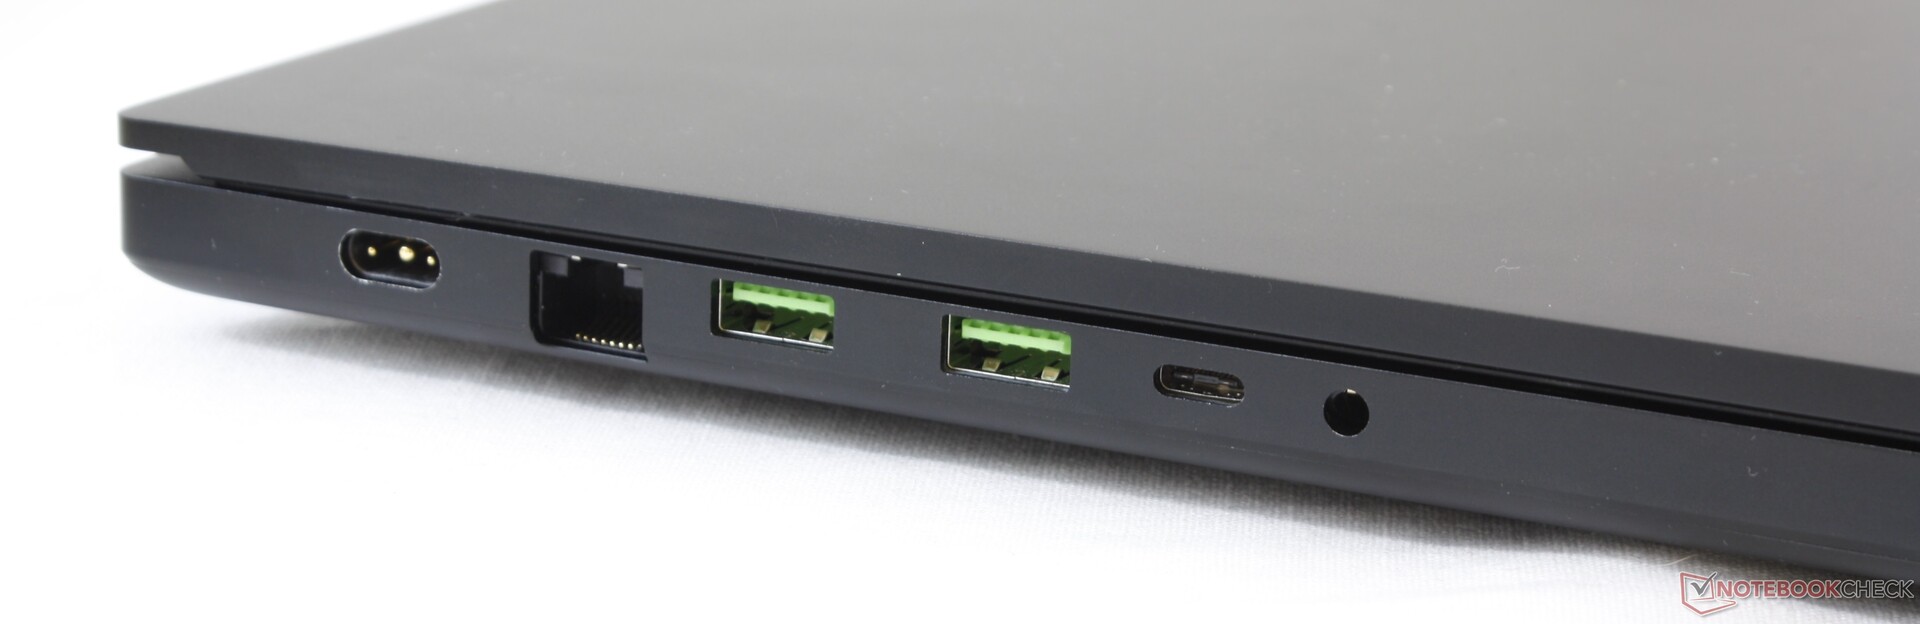
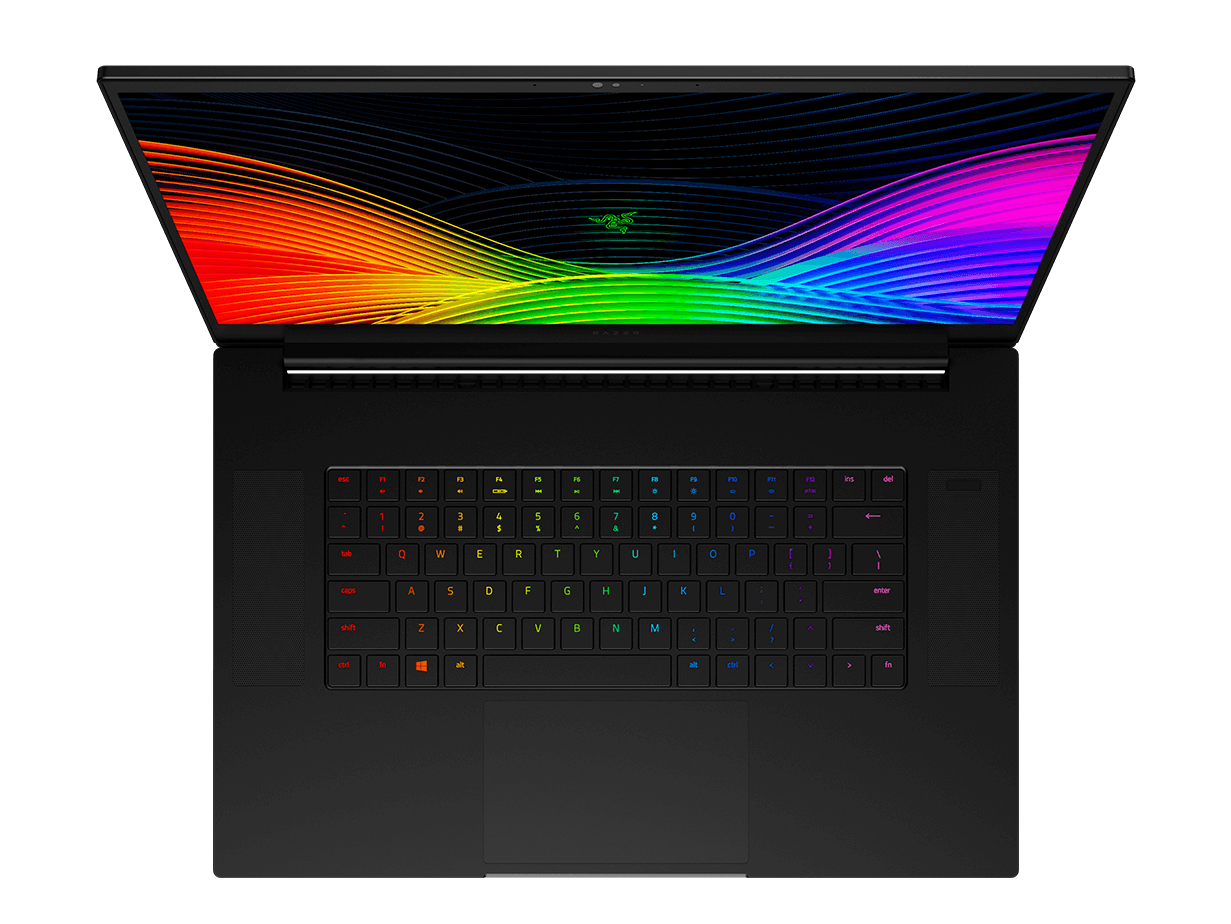
Met een prijskaartje van zo'n 2500 euro is de Razer Blade Pro 17 RTX 2060 duurder dan de meeste alternatieven zoals de Asus ROG Scar II GL704GV, Zephyrus S GX701GV of MSI GS75, allemaal met dezelfde GPU. De meerprijs gaat niet alleen naar het minimalistische en stevigere design van de behuizing, maar ook naar de 'vapor chamber' koeling, UHS-III-kaartlezer, 2.5 Gbit RJ-45 en Wi-Fi 6-connectiviteit, die zeldzaam zijn bij concurrerende laptops met RTX 2060. Kleur de Blade in Space Grey en voorbijgangers zullen het toestel wellicht verwarren met een opgedreven MacBook Pro - om alle goede redenen.
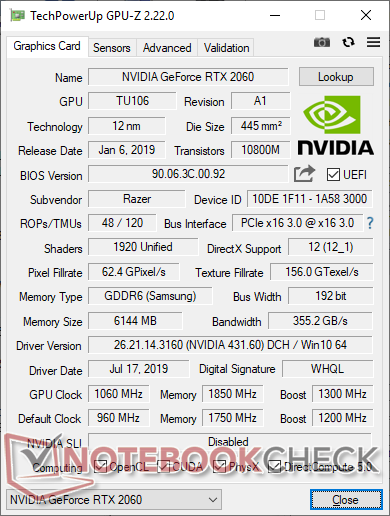
Een klein maar niettemin merkbaar voordeel van de Blade Pro 17 is dat zijn RTX 2060 GPU aan hogere kloksnelheden werkt dan dezelfde GPU in andere laptops, wat voor iets hogere prestaties in games zorgt. Het verschil is groot genoeg dat de gaming-prestaties dicht in de buurt komen van de RTX 2070 Max-Q, waardoor de Blade Pro 17 RTX met 2070 Max-Q wat minder interessant is. Wanneer we de RTX 2060 met de RTX 2080 Max-Q vergelijken, is de laatste zo'n 25 procent sneller voor een 13 procent hoger energieverbruik. Andere aspecten zoals batterijduur, ventilatorgeluid en temperaturen zijn praktisch identiek voor de verschillende versies van de Blade Pro 17 ondanks hun verschillen in grafische prestaties.
De Blade Pro 17 toont de GeForce RTX 2060 op zijn best. Handige features zoals de vier ventilatoren, 'vapor chamber' koeling, UHS-III-kaartlezer, 2.5 Gbit RJ-45 en Wi-Fi 6 kan je in geen enkele andere gaming laptop met dezelfde RTX 2060 GPU vinden.
Razer Blade Pro 17 RTX 2060
- 05-08-2019 v6 (old)
Allen Ngo
Price comparison
