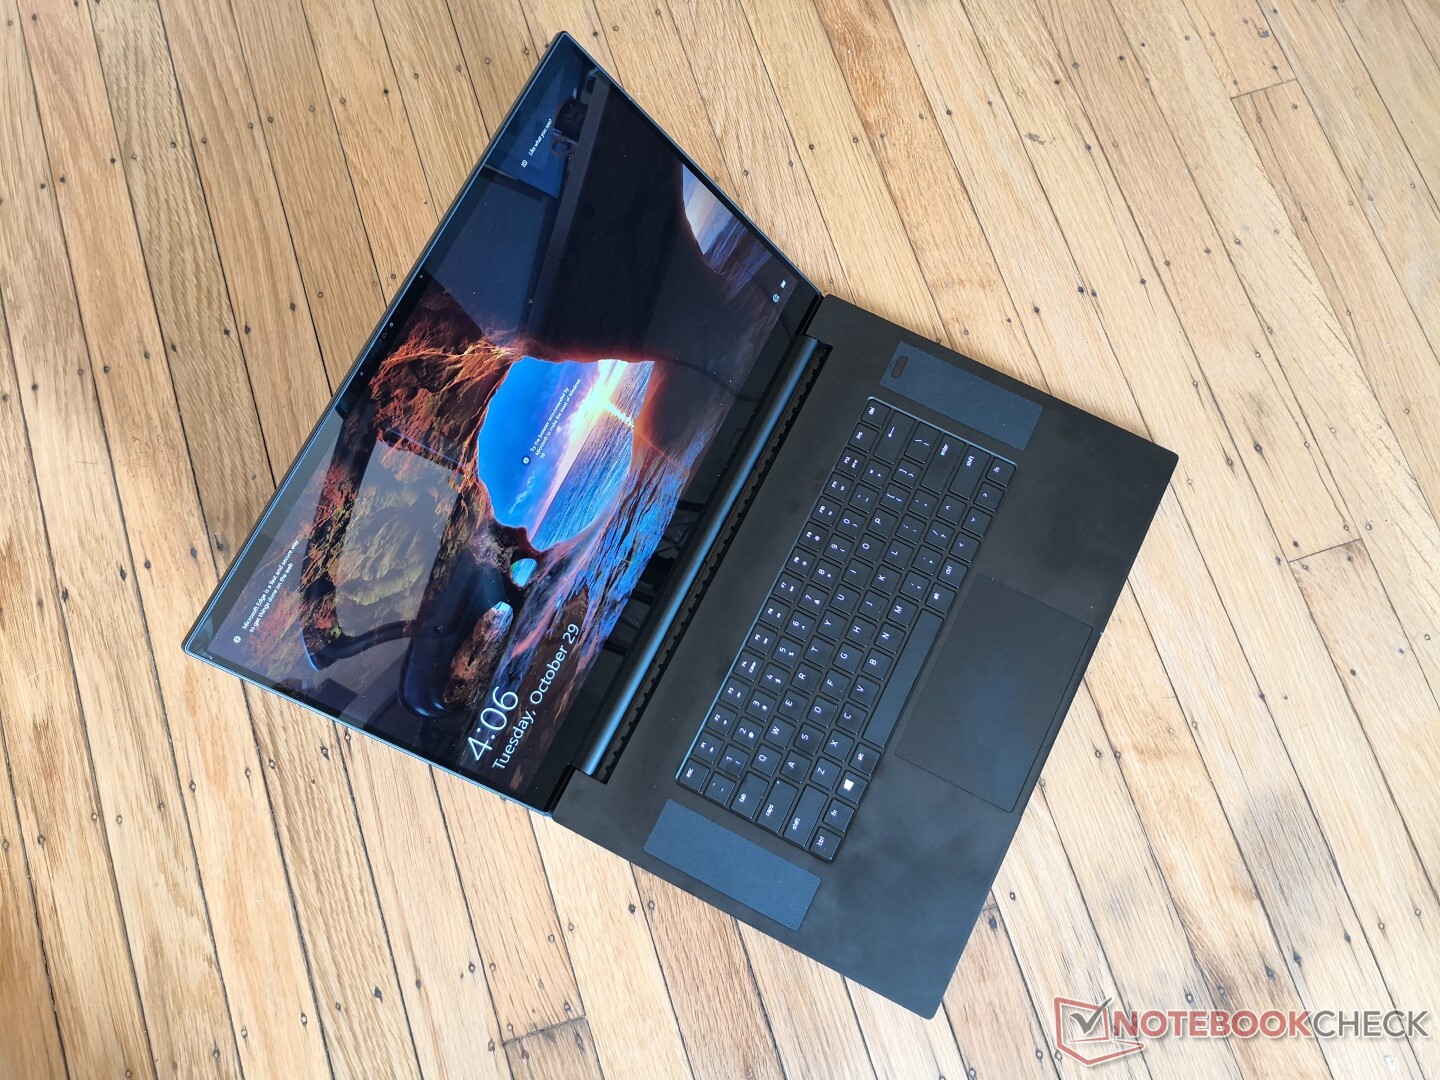
Kort testrapport Razer Blade Pro 17 4K UHD 120 Hz Laptop: Eindelijk een 17-inch 4K-scherm met bijna geen ghosting
Evaluatie | Datum | Model | Gewicht | Hoogte | Formaat | Resolutie | Beste prijs |
|---|---|---|---|---|---|---|---|
| 86.7 % v7 (old) | 11-2019 | Razer Blade Pro 17 4K UHD 120 Hz i7-9750H, GeForce RTX 2080 Max-Q | 2.8 kg | 19.9 mm | 17.30" | 3840x2160 | |
| 82.9 % v7 (old) | 06-2019 | MSI GS75 Stealth 9SG i7-9750H, GeForce RTX 2080 Max-Q | 2.3 kg | 18.9 mm | 17.30" | 1920x1080 | |
| 85.6 % v6 (old) | 03-2019 | Asus Zephyrus S GX701GX i7-8750H, GeForce RTX 2080 Max-Q | 2.6 kg | 19 mm | 17.30" | 1920x1080 | |
| 83.2 % v7 (old) | 10-2019 | Lenovo Legion Y740-17IRH i7-9750H, GeForce RTX 2060 Mobile | 3 kg | 23 mm | 17.30" | 1920x1080 | |
| 86.1 % v7 (old) | 09-2019 | Gigabyte Aero 17 XA RP77 i9-9980HK, GeForce RTX 2070 Max-Q | 2.5 kg | 21.4 mm | 17.30" | 3840x2160 |
| SD Card Reader | |
| average JPG Copy Test (av. of 3 runs) | |
| Gigabyte Aero 17 XA RP77 (Toshiba Exceria Pro SDXC 64 GB UHS-II) | |
| Eurocom Nightsky RX15 (Toshiba Exceria Pro SDXC 64 GB UHS-II) | |
| Razer Blade Pro 17 4K UHD 120 Hz (Toshiba Exceria Pro SDXC 64 GB UHS-II) | |
| Razer Blade Pro 2017 (Toshiba Exceria Pro SDXC 64 GB UHS-II) | |
| HP Pavilion Gaming 15-ec0017ng (Toshiba Exceria Pro SDXC 64 GB UHS-II) | |
| maximum AS SSD Seq Read Test (1GB) | |
| Gigabyte Aero 17 XA RP77 (Toshiba Exceria Pro SDXC 64 GB UHS-II) | |
| Eurocom Nightsky RX15 (Toshiba Exceria Pro SDXC 64 GB UHS-II) | |
| Razer Blade Pro 17 4K UHD 120 Hz (Toshiba Exceria Pro SDXC 64 GB UHS-II) | |
| Razer Blade Pro 2017 (Toshiba Exceria Pro SDXC 64 GB UHS-II) | |
| HP Pavilion Gaming 15-ec0017ng (Toshiba Exceria Pro SDXC 64 GB UHS-II) | |
| |||||||||||||||||||||||||
Helderheidsverdeling: 91 %
Helderheid in Batterij-modus: 346.7 cd/m²
Contrast: 1284:1 (Zwart: 0.27 cd/m²)
ΔE ColorChecker Calman: 5.62 | ∀{0.5-29.43 Ø4.72}
calibrated: 3.81
ΔE Greyscale Calman: 5.5 | ∀{0.09-98 Ø4.97}
100% sRGB (Argyll 1.6.3 3D)
87.2% AdobeRGB 1998 (Argyll 1.6.3 3D)
98.6% AdobeRGB 1998 (Argyll 3D)
99.9% sRGB (Argyll 3D)
84.8% Display P3 (Argyll 3D)
Gamma: 2.25
CCT: 6175 K
| Razer Blade Pro 17 4K UHD 120 Hz AU Optronics B173ZAN03.3, IPS, 17.3", 3840x2160 | Razer Blade Pro 17 RTX 2080 Max-Q AU Optronics B173HAN04.0, IPS, 17.3", 1920x1080 | Razer Blade Pro 2017 Sharp LQ173D1JW33 (SHP145A), IGZO, 17.3", 3840x2160 | Gigabyte Aero 17 XA RP77 AU Optronics B173ZAN03.2, IPS, 17.3", 3840x2160 | Dell XPS 15 7590 9980HK GTX 1650 Samsung 156WR04, SDCA029, OLED, 15.6", 3840x2160 | MSI P65 Creator 9SF-657 AU Optronics AUO41EB, IPS, 15.6", 3840x2160 | |
|---|---|---|---|---|---|---|
| Display | -26% | 2% | 1% | -1% | 0% | |
| Display P3 Coverage (%) | 84.8 | 60.6 -29% | 88.9 5% | 86.8 2% | 88.1 4% | 84.4 0% |
| sRGB Coverage (%) | 99.9 | 89 -11% | 100 0% | 100 0% | 99.6 0% | 100 0% |
| AdobeRGB 1998 Coverage (%) | 98.6 | 62.1 -37% | 99.7 1% | 99.5 1% | 91.8 -7% | 98.5 0% |
| Response Times | 32% | -285% | -196% | 81% | -217% | |
| Response Time Grey 50% / Grey 80% * (ms) | 15.2 ? | 6.8 ? 55% | 60.8 ? -300% | 45.6 ? -200% | 2.3 ? 85% | 51 ? -236% |
| Response Time Black / White * (ms) | 10.4 ? | 9.6 ? 8% | 38.4 ? -269% | 30.4 ? -192% | 2.4 ? 77% | 31 ? -198% |
| PWM Frequency (Hz) | 204.9 ? | 59.5 ? | ||||
| Screen | 6% | -6% | 25% | 7% | -1% | |
| Brightness middle (cd/m²) | 346.7 | 299.3 -14% | 230 -34% | 667.3 92% | 421.2 21% | 445 28% |
| Brightness (cd/m²) | 332 | 294 -11% | 207 -38% | 633 91% | 417 26% | 462 39% |
| Brightness Distribution (%) | 91 | 94 3% | 83 -9% | 90 -1% | 94 3% | 83 -9% |
| Black Level * (cd/m²) | 0.27 | 0.29 -7% | 0.2 26% | 0.46 -70% | 0.5 -85% | |
| Contrast (:1) | 1284 | 1032 -20% | 1150 -10% | 1451 13% | 890 -31% | |
| Colorchecker dE 2000 * | 5.62 | 2.55 55% | 5.62 -0% | 3.53 37% | 6.06 -8% | 4.75 15% |
| Colorchecker dE 2000 max. * | 9.36 | 4.73 49% | 10.24 -9% | 6.88 26% | 11.89 -27% | 7.79 17% |
| Colorchecker dE 2000 calibrated * | 3.81 | 2.9 24% | 3.79 1% | |||
| Greyscale dE 2000 * | 5.5 | 3.5 36% | 4.54 17% | 0.9 84% | 2.8 49% | 4.49 18% |
| Gamma | 2.25 98% | 2.28 96% | 2.36 93% | 2.17 101% | 2.15 102% | 2.49 88% |
| CCT | 6175 105% | 7101 92% | 6625 98% | 6533 99% | 6235 104% | 7374 88% |
| Color Space (Percent of AdobeRGB 1998) (%) | 87.2 | 57 -35% | 88 1% | 87.1 0% | 81 -7% | 87 0% |
| Color Space (Percent of sRGB) (%) | 100 | 88.7 -11% | 100 0% | 100 0% | 99.6 0% | 100 0% |
| Totaal Gemiddelde (Programma / Instellingen) | 4% /
3% | -96% /
-41% | -57% /
-7% | 29% /
17% | -73% /
-29% |
* ... kleiner is beter
Responstijd Scherm
| ↔ Responstijd Zwart naar Wit | ||
|---|---|---|
| 10.4 ms ... stijging ↗ en daling ↘ gecombineerd | ↗ 5.2 ms stijging | 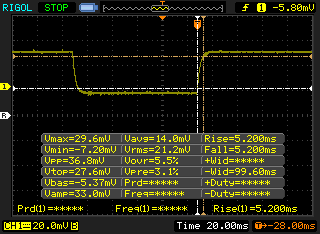 |
| ↘ 5.2 ms daling | ||
| Het scherm vertoonde prima responstijden in onze tests maar is misschien wat te traag voor competitieve games. Ter vergelijking: alle testtoestellen variëren van 0.1 (minimum) tot 240 (maximum) ms. » 28 % van alle toestellen zijn beter. Dit betekent dat de gemeten responstijd beter is dan het gemiddelde (19.8 ms) van alle geteste toestellen. | ||
| ↔ Responstijd 50% Grijs naar 80% Grijs | ||
| 15.2 ms ... stijging ↗ en daling ↘ gecombineerd | ↗ 8.4 ms stijging | 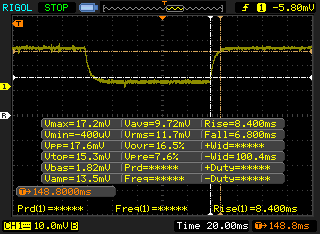 |
| ↘ 6.8 ms daling | ||
| Het scherm vertoonde prima responstijden in onze tests maar is misschien wat te traag voor competitieve games. Ter vergelijking: alle testtoestellen variëren van 0.165 (minimum) tot 636 (maximum) ms. » 29 % van alle toestellen zijn beter. Dit betekent dat de gemeten responstijd beter is dan het gemiddelde (31 ms) van alle geteste toestellen. | ||
Screen Flickering / PWM (Pulse-Width Modulation)
| Screen flickering / PWM niet waargenomen | 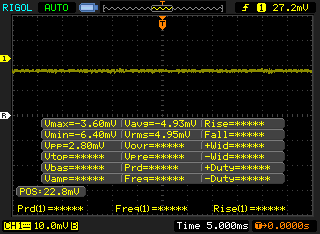 | ||
Ter vergelijking: 52 % van alle geteste toestellen maakten geen gebruik van PWM om de schermhelderheid te verlagen. Als het wel werd gebruikt, werd een gemiddelde van 7769 (minimum: 5 - maximum: 343500) Hz waargenomen. | |||
| Cinebench R11.5 | |
| CPU Single 64Bit | |
| Corsair One i160 | |
| MSI GE75 9SG | |
| Gemiddeld Intel Core i7-9750H (1.96 - 2.19, n=10) | |
| Razer Blade Pro 2017 | |
| CPU Multi 64Bit | |
| Corsair One i160 | |
| MSI GE75 9SG | |
| Gemiddeld Intel Core i7-9750H (11.3 - 14.1, n=10) | |
| Razer Blade Pro 2017 | |
| Cinebench R10 | |
| Rendering Multiple CPUs 32Bit | |
| Corsair One i160 | |
| Eurocom Nightsky RX15 | |
| MSI GE75 9SG | |
| Gemiddeld Intel Core i7-9750H (28251 - 36304, n=13) | |
| HP Pavilion Gaming 15-ec0017ng | |
| Rendering Single 32Bit | |
| Eurocom Nightsky RX15 | |
| Corsair One i160 | |
| MSI GE75 9SG | |
| Gemiddeld Intel Core i7-9750H (6659 - 7214, n=13) | |
| HP Pavilion Gaming 15-ec0017ng | |
| wPrime 2.10 - 1024m | |
| Gemiddeld Intel Core i7-9750H (n=1) | |
| MSI GE75 9SG | |
| Eurocom Nightsky RX15 | |
| Corsair One i160 | |
* ... kleiner is beter
| PCMark 8 Home Score Accelerated v2 | 4255 punten | |
| PCMark 8 Work Score Accelerated v2 | 4755 punten | |
| PCMark 10 Score | 6202 punten | |
Help | ||
| Razer Blade Pro 17 4K UHD 120 Hz Samsung SSD PM981 MZVLB1T0HALR | Razer Blade Pro 17 RTX 2080 Max-Q Samsung SSD PM981 MZVLB512HAJQ | Razer Blade Pro 17 RTX 2060 Samsung SSD PM981 MZVLB512HAJQ | Razer Blade Pro 2017 2x Samsung SSD PM951 MZVLV256HCHP (RAID 0) | MSI GS75 Stealth 9SG 2x Samsung SSD PM981 MZVLB1T0HALR (RAID 0) | Asus Zephyrus S GX701GX Samsung SSD PM981 MZVLB1T0HALR | |
|---|---|---|---|---|---|---|
| AS SSD | -11% | -6% | -22% | -3% | -4% | |
| Seq Read (MB/s) | 1881 | 1831 -3% | 1810 -4% | 2599 38% | 2855 52% | 911 -52% |
| Seq Write (MB/s) | 2354 | 1744 -26% | 1797 -24% | 588 -75% | 2687 14% | 2347 0% |
| 4K Read (MB/s) | 43.42 | 45.16 4% | 48.43 12% | 37.57 -13% | 30.31 -30% | 53 22% |
| 4K Write (MB/s) | 104.1 | 107.1 3% | 106 2% | 104.4 0% | 96.3 -7% | 122.5 18% |
| 4K-64 Read (MB/s) | 1805 | 1240 -31% | 1156 -36% | 1116 -38% | 1460 -19% | 1577 -13% |
| 4K-64 Write (MB/s) | 1775 | 1695 -5% | 1748 -2% | 513 -71% | 1224 -31% | 1734 -2% |
| Access Time Read * (ms) | 0.049 | 0.064 -31% | 0.057 -16% | 0.051 -4% | 0.054 -10% | 0.08 -63% |
| Access Time Write * (ms) | 0.106 | 0.037 65% | 0.035 67% | 0.036 66% | 0.038 64% | 0.031 71% |
| Score Read (Points) | 2037 | 1468 -28% | 1385 -32% | 1414 -31% | 1776 -13% | 1721 -16% |
| Score Write (Points) | 2115 | 1977 -7% | 2033 -4% | 676 -68% | 1589 -25% | 2091 -1% |
| Score Total (Points) | 5215 | 4197 -20% | 4135 -21% | 2715 -48% | 4259 -18% | 4771 -9% |
| Copy ISO MB/s (MB/s) | 1877 | 2086 11% | 1984 6% | 2226 19% | ||
| Copy Program MB/s (MB/s) | 539 | 425.5 -21% | 588 9% | 426.4 -21% | ||
| Copy Game MB/s (MB/s) | 1368 | 555 -59% | 835 -39% | 1152 -16% |
* ... kleiner is beter

| 3DMark 11 | |
| 1280x720 Performance GPU | |
| Nvidia GeForce RTX 2080 Super | |
| Asus ROG G703GXR | |
| Nvidia GeForce GTX 1080 Founders Edition | |
| Razer Blade Pro 17 4K UHD 120 Hz | |
| Gemiddeld NVIDIA GeForce RTX 2080 Max-Q (23386 - 30910, n=20) | |
| Asus Strix Scar III G531GW-AZ062T | |
| Razer Blade Pro 2017 | |
| Alienware 15 R3 Max-Q | |
| Alienware 17 R5 | |
| Razer Blade Pro 17 RTX 2060 | |
| Dell G5 15 5590-P8RVW | |
| Razer Blade 15 GTX 1660 Ti | |
| 1280x720 Performance Combined | |
| Nvidia GeForce RTX 2080 Super | |
| Razer Blade Pro 17 4K UHD 120 Hz | |
| Asus ROG G703GXR | |
| Razer Blade Pro 17 RTX 2060 | |
| Dell G5 15 5590-P8RVW | |
| Gemiddeld NVIDIA GeForce RTX 2080 Max-Q (9212 - 14894, n=20) | |
| Nvidia GeForce GTX 1080 Founders Edition | |
| Razer Blade 15 GTX 1660 Ti | |
| Alienware 17 R5 | |
| Asus Strix Scar III G531GW-AZ062T | |
| Razer Blade Pro 2017 | |
| Alienware 15 R3 Max-Q | |
| 3DMark 11 Performance | 22165 punten | |
| 3DMark Cloud Gate Standard Score | 38524 punten | |
| 3DMark Fire Strike Score | 18629 punten | |
| 3DMark Time Spy Score | 7973 punten | |
Help | ||
| Shadow of the Tomb Raider - 1920x1080 Highest Preset AA:T | |
| Corsair One i160 | |
| Nvidia GeForce RTX 2080 Super | |
| MSI GE75 9SG | |
| Razer Blade Pro 17 4K UHD 120 Hz | |
| Eurocom Nightsky RX15 | |
| Gemiddeld NVIDIA GeForce RTX 2080 Max-Q (71 - 105, n=8) | |
| Razer Blade Pro 17 RTX 2060 | |
| Asus Strix Scar III G531GW-AZ062T | |
| Gigabyte Aero 17 XA RP77 | |
| Asus Zephyrus S GX701GX | |
| Lenovo Legion Y740-17IRH | |
| Razer Blade 15 GTX 1660 Ti | |
| MSI GF65 9SD | |
| HP Pavilion Gaming 15-ec0017ng | |
| Dell XPS 15 7590 9980HK GTX 1650 | |
| lage | gem. | hoge | ultra | 4K | |
|---|---|---|---|---|---|
| BioShock Infinite (2013) | 349.6 | 311.9 | 284.1 | 189.5 | |
| The Witcher 3 (2015) | 325 | 258.7 | 179.9 | 92.7 | 65.5 |
| Shadow of the Tomb Raider (2018) | 132 | 118 | 111 | 105 | 40 |
(±) Bij het spelen van The Witcher 3 is de gemiddelde temperatuur voor de bovenzijde 35.6 °C / 96 F, vergeleken met het apparaatgemiddelde van 33.9 °C / 93 F.
(+) De handpalmsteunen en het touchpad bereiken maximaal de huidtemperatuur (34 °C / 93.2 F) en zijn dus niet heet.
(-) De gemiddelde temperatuur van de handpalmsteun van soortgelijke toestellen bedroeg 28.8 °C / 83.8 F (-5.2 °C / -9.4 F).
| Uit / Standby | |
| Inactief | |
| Belasting |
|
Key:
min: | |
| Razer Blade Pro 17 4K UHD 120 Hz i7-9750H, GeForce RTX 2080 Max-Q, Samsung SSD PM981 MZVLB1T0HALR, IPS, 3840x2160, 17.3" | Razer Blade Pro 17 RTX 2080 Max-Q i7-9750H, GeForce RTX 2080 Max-Q, Samsung SSD PM981 MZVLB512HAJQ, IPS, 1920x1080, 17.3" | Razer Blade Pro 17 RTX 2060 i7-9750H, GeForce RTX 2060 Mobile, Samsung SSD PM981 MZVLB512HAJQ, IPS, 1920x1080, 17.3" | Razer Blade Pro 2017 i7-7820HK, GeForce GTX 1080 Mobile, 2x Samsung SSD PM951 MZVLV256HCHP (RAID 0), IGZO, 3840x2160, 17.3" | MSI GS75 Stealth 9SG i7-9750H, GeForce RTX 2080 Max-Q, 2x Samsung SSD PM981 MZVLB1T0HALR (RAID 0), IPS, 1920x1080, 17.3" | Asus Zephyrus S GX701GX i7-8750H, GeForce RTX 2080 Max-Q, Samsung SSD PM981 MZVLB1T0HALR, IPS, 1920x1080, 17.3" | |
|---|---|---|---|---|---|---|
| Power Consumption | 26% | 25% | -2% | 30% | 24% | |
| Idle Minimum * (Watt) | 34.2 | 16.2 53% | 16 53% | 31 9% | 13 62% | 19 44% |
| Idle Average * (Watt) | 37.2 | 20.4 45% | 21.7 42% | 36 3% | 17 54% | 22 41% |
| Idle Maximum * (Watt) | 50 | 26.1 48% | 26.1 48% | 44 12% | 25 50% | 30 40% |
| Load Average * (Watt) | 106.1 | 96.5 9% | 105.6 -0% | 107 -1% | 96 10% | 104 2% |
| Witcher 3 ultra * (Watt) | 178.7 | 182.9 -2% | 161.8 9% | 212 -19% | 156 13% | 167 7% |
| Load Maximum * (Watt) | 223.6 | 214.3 4% | 225.3 -1% | 258 -15% | 239 -7% | 203 9% |
* ... kleiner is beter
| Razer Blade Pro 17 4K UHD 120 Hz i7-9750H, GeForce RTX 2080 Max-Q, 70 Wh | Razer Blade Pro 17 RTX 2080 Max-Q i7-9750H, GeForce RTX 2080 Max-Q, 70 Wh | Razer Blade Pro 17 RTX 2060 i7-9750H, GeForce RTX 2060 Mobile, 70 Wh | Razer Blade Pro 2017 i7-7820HK, GeForce GTX 1080 Mobile, 99 Wh | MSI GS75 Stealth 9SG i7-9750H, GeForce RTX 2080 Max-Q, 80.25 Wh | Asus Zephyrus S GX701GX i7-8750H, GeForce RTX 2080 Max-Q, 76 Wh | |
|---|---|---|---|---|---|---|
| Batterijduur | 27% | 22% | -11% | 62% | 3% | |
| WiFi v1.3 (h) | 3.7 | 4.7 27% | 4.5 22% | 3.3 -11% | 6 62% | 3.8 3% |
| Reader / Idle (h) | 4.9 | 4.2 | 7.7 | 5 | ||
| Load (h) | 1.4 | 1.4 | 1.2 | 0.9 |
Pro
Contra
Dit is de verkorte versie van het originele artikel. Het volledige, Engelse testrapport vind je hier.
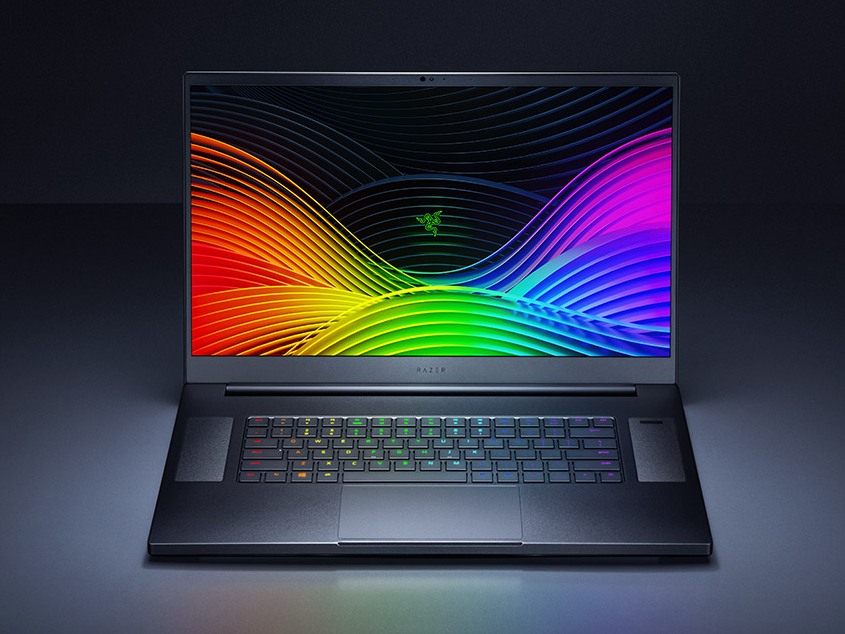
Gaming heeft er dankzij het nieuwe paneel nog nooit zo vlot en helder uitgezien op een 17.3-inch-laptop. Vroeger ging gaming op een 4K 17.3-inch-laptop gepaard met trage responstijden, een limiet van 60 Hz en erg merkbare ghosting. Het nieuwe 120-Hz-scherm van de Razer pakt al deze problemen aan. Houd in het achterhoofd dat het niet nodig is om een stabiele 120 FPS te behalen om de voordelen van een 120-Hz-paneel te kunnen benutten; we gaan er trouwens vanuit dat concurrerende 17.3-inch-laptops op korte termijn gelijkaardige 4K 120-Hz-panelen zullen aanbieden. Voorlopig is de Razer Blade Pro 17 weliswaar het enige toestel dat dit specifieke paneel biedt.
Niettemin hebben we een aantal kleine problemen ontdekt die de ervaring ietwat aantasten. Veelgebruikte apps en functionaliteiten zoals GeForce Experience en graphics-switching zouden van het begin moeten werken, zeker bij een toestel van 3700 euro. Deze haperingen lijken gelukkig te liggen aan software-issues in plaats van hardware en zullen dus hopelijk in de nabije toekomst verholpen worden met updates.
We hadden voor de volgende versie graag G-Sync gezien, aangezien dit erg goed samengaat met een 4K-scherm. Manuele graphics-switching laat toe om zowel Optimus als G-Sync te gebruiken, gelijkaardig aan de oplossing van sommige Asus Zephyrus-modellen.
Voor het eerst een vlotte 4K-gaming-ervaring zonder ghosting op een 120-Hz 17.3-inch-laptop. Een paar bugs moeten echter nog verholpen worden en G-Sync staat ongetwijfeld bovenaan onze lijst van gewenste features in de toekomst.
Razer Blade Pro 17 4K UHD 120 Hz
- 31-10-2019 v7 (old)
Allen Ngo
Price comparison
