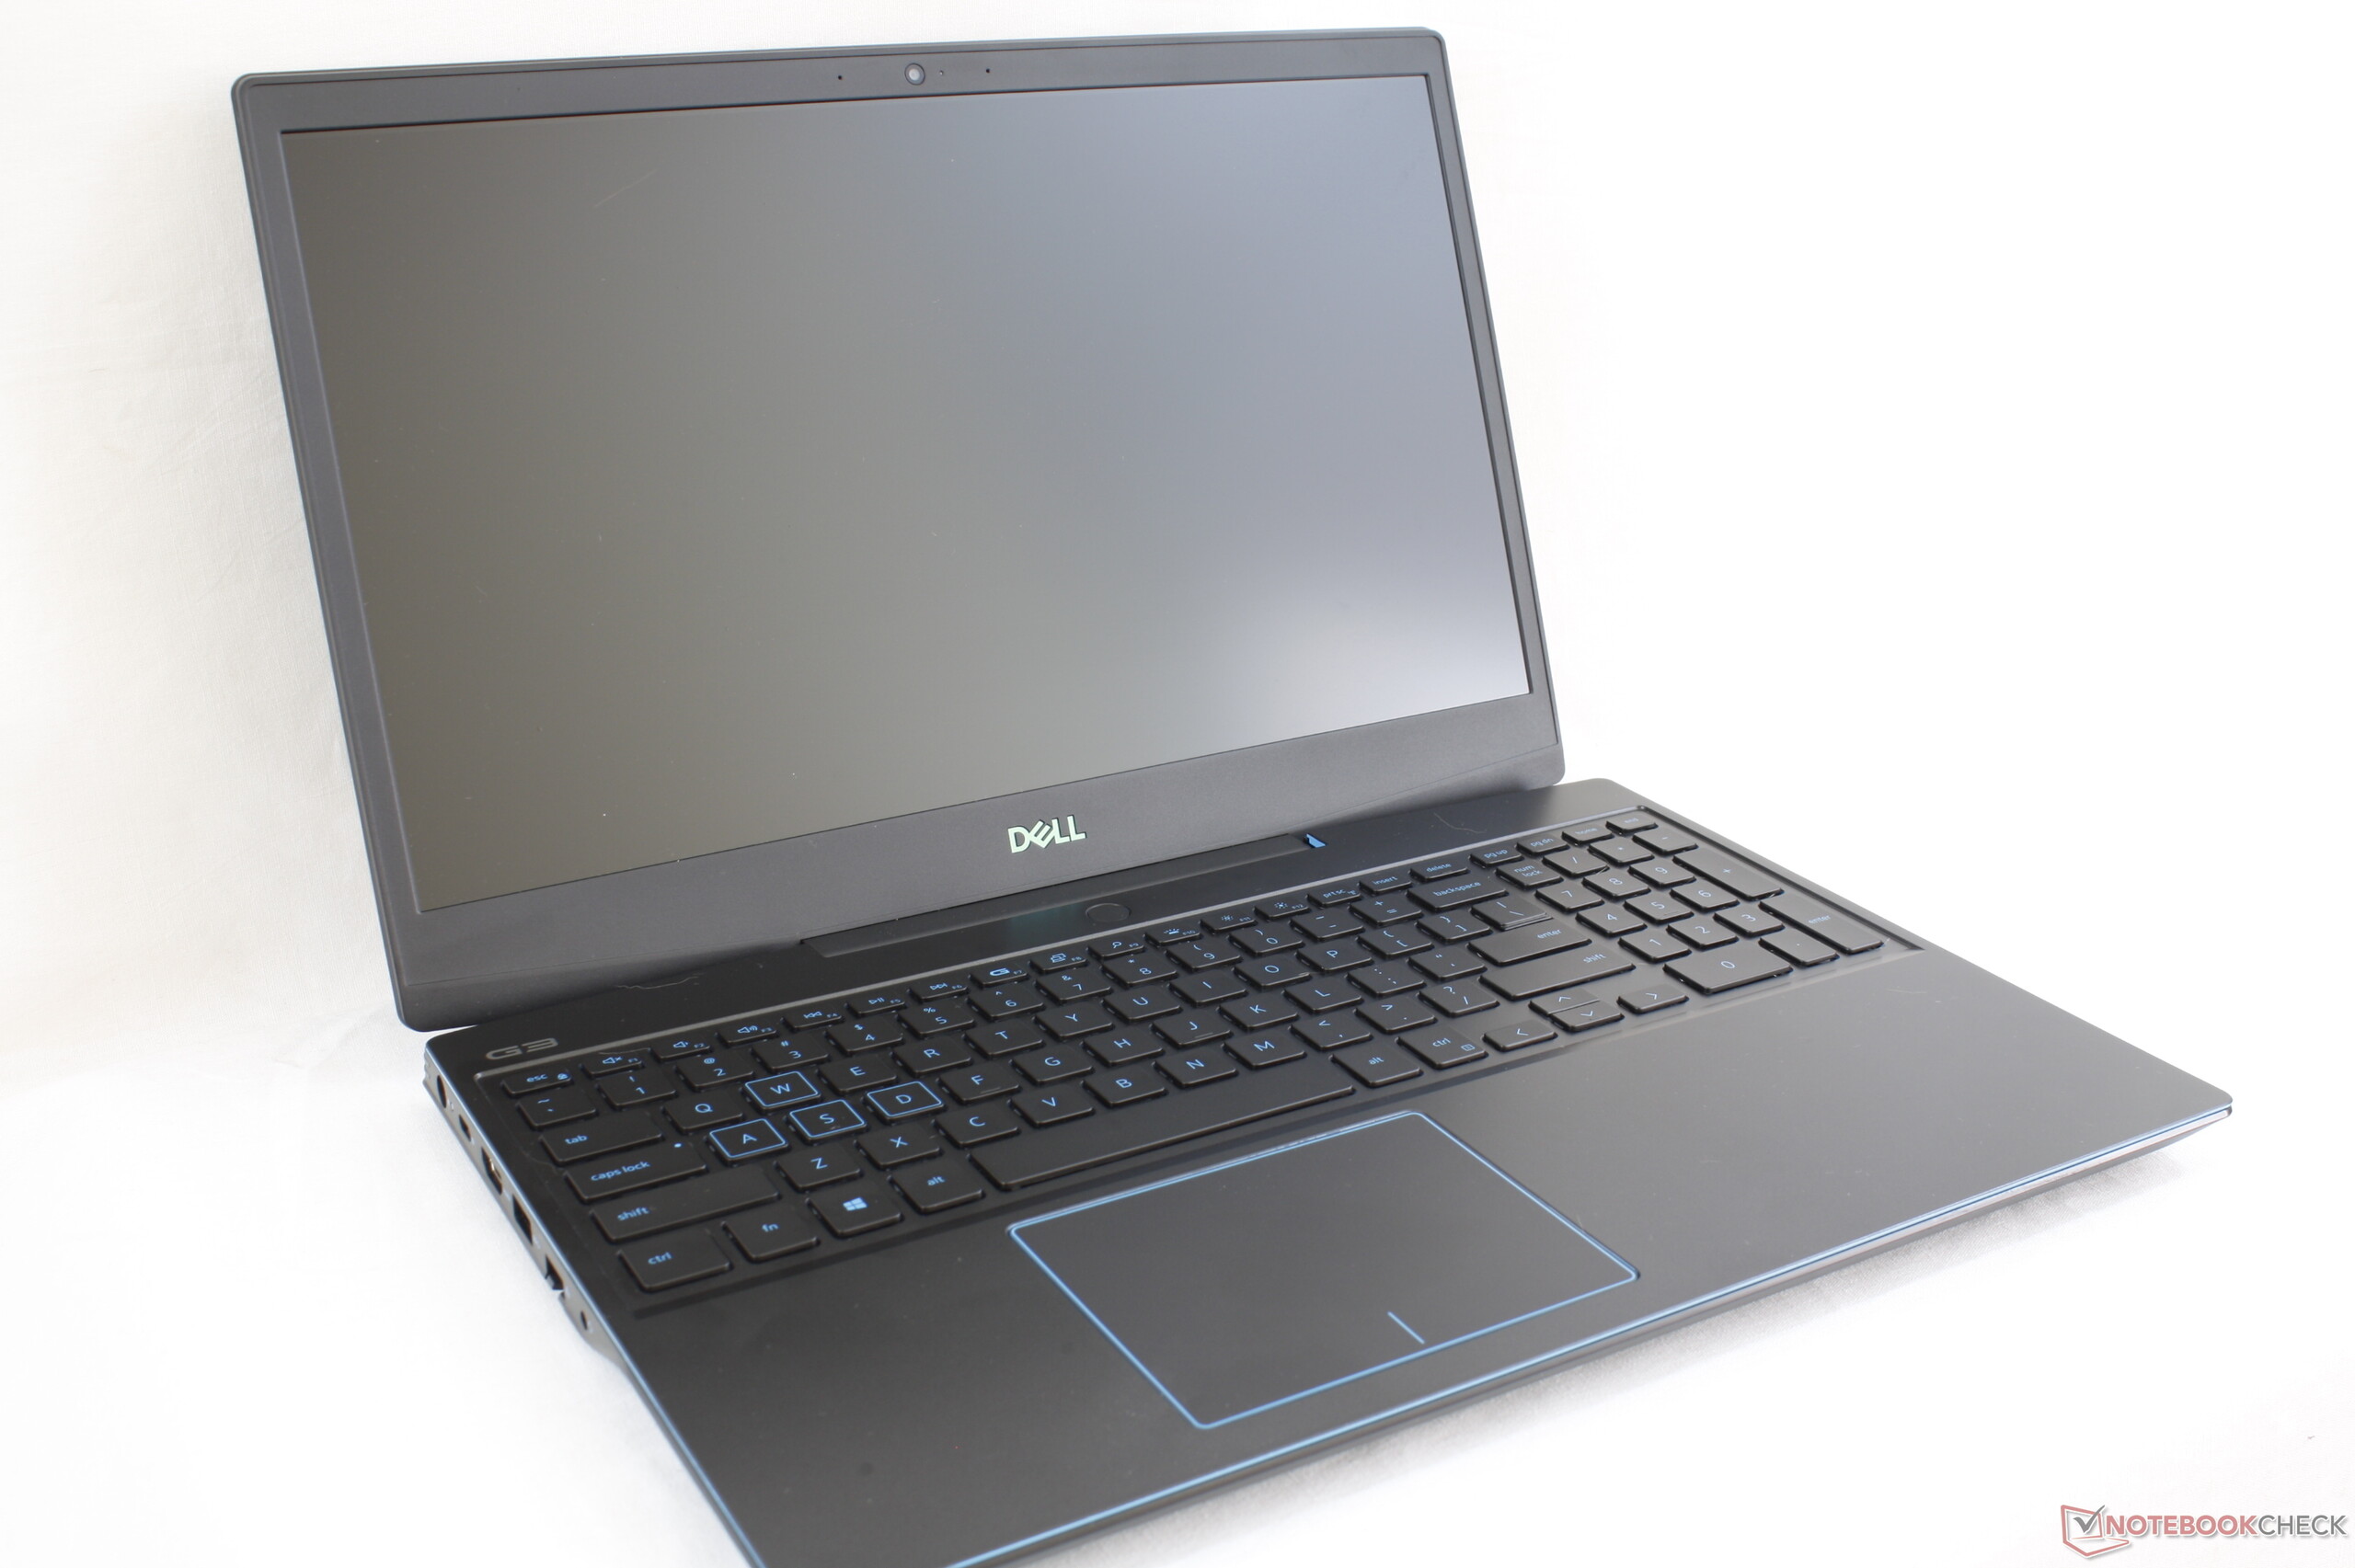
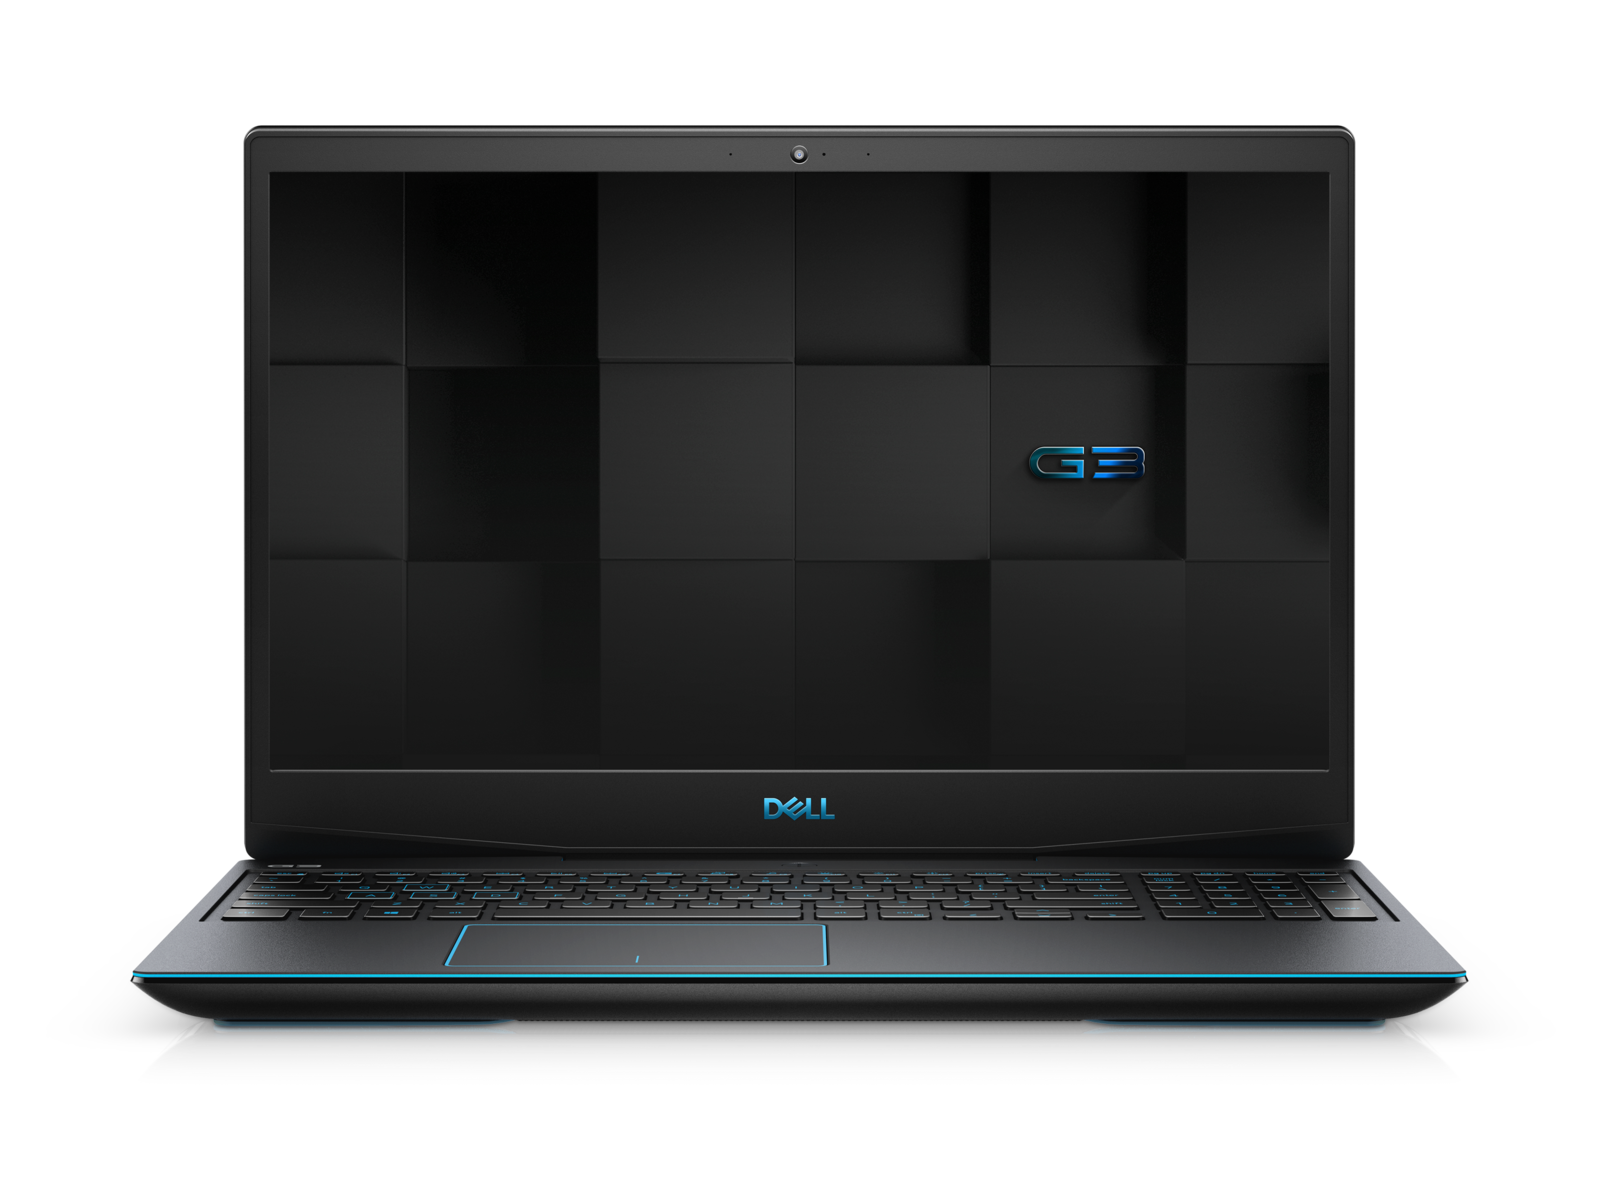
Kort testrapport Dell G3 15 3590 Laptop: goedkoop met makkelijke upgrades
Evaluatie | Datum | Model | Gewicht | Hoogte | Formaat | Resolutie | Beste prijs |
|---|---|---|---|---|---|---|---|
| 79.3 % v7 (old) | 10-2019 | Dell G3 3590 i5-9300H, GeForce GTX 1650 Mobile | 2.5 kg | 21.6 mm | 15.60" | 1920x1080 | |
| 85.5 % v6 (old) | 08-2019 | Aorus 15-SA i7-9750H, GeForce GTX 1660 Ti Mobile | 2.1 kg | 24.4 mm | 15.60" | 1920x1080 | |
| 83.9 % v7 (old) | 08-2019 | HP Gaming Pavilion 15-dk0009ng i7-9750H, GeForce GTX 1660 Ti Max-Q | 2.4 kg | 23.4 mm | 15.60" | 1920x1080 | |
| 83.3 % v6 (old) | 05-2019 | Asus ROG Zephyrus G15 GA502DU R7 3750H, GeForce GTX 1660 Ti Max-Q | 2.1 kg | 20.4 mm | 15.60" | 1920x1080 |
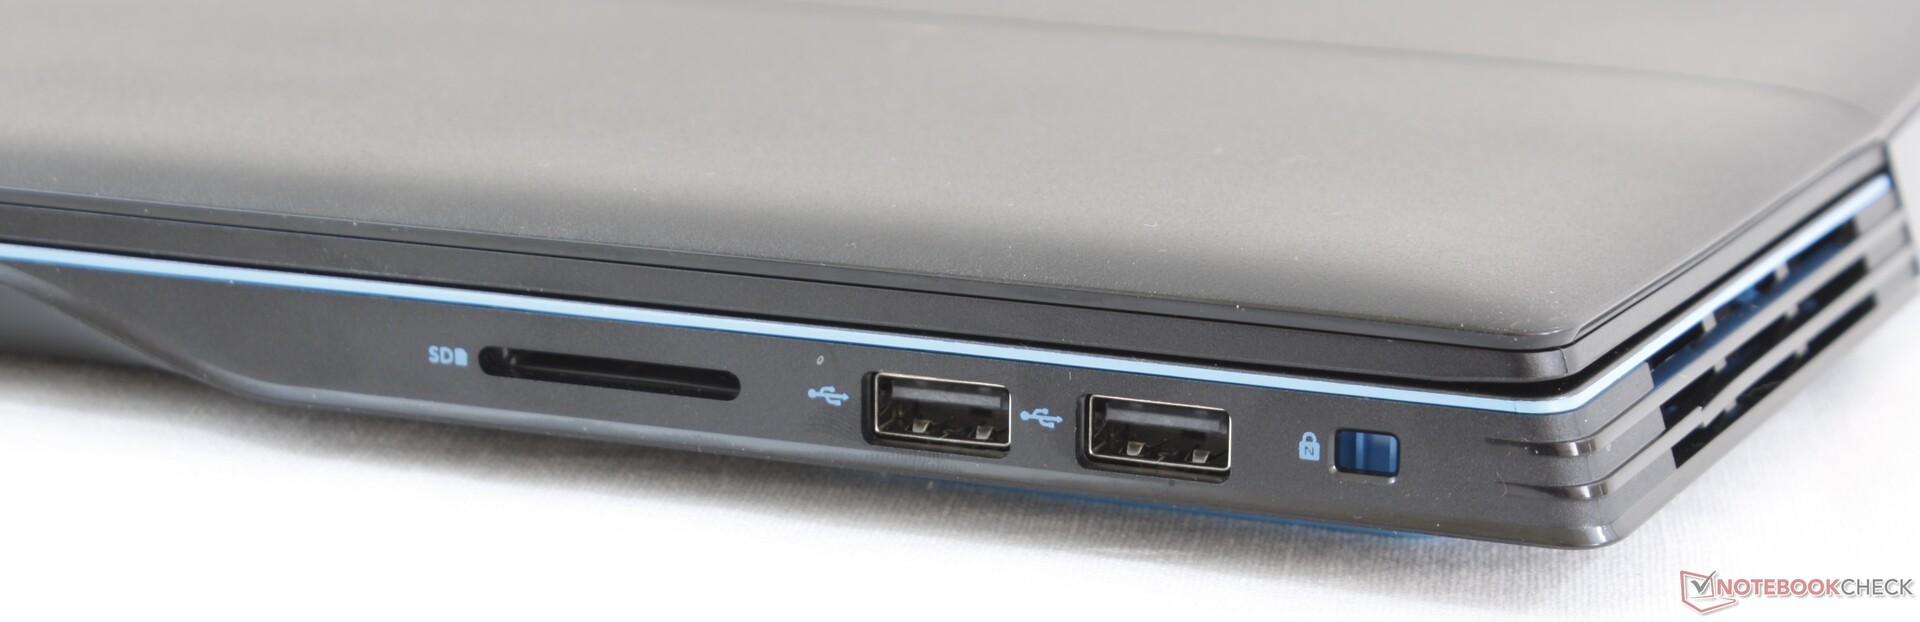
| SD Card Reader | |
| average JPG Copy Test (av. of 3 runs) | |
| HP Gaming Pavilion 15-dk0009ng (Toshiba Exceria Pro SDXC 64 GB UHS-II) | |
| Dell G3 15 3579 (Toshiba Exceria Pro SDXC 64 GB UHS-II) | |
| Dell G3 3590 (Toshiba Exceria Pro SDXC 64 GB UHS-II) | |
| maximum AS SSD Seq Read Test (1GB) | |
| HP Gaming Pavilion 15-dk0009ng (Toshiba Exceria Pro SDXC 64 GB UHS-II) | |
| Dell G3 3590 (Toshiba Exceria Pro SDXC 64 GB UHS-II) | |
| Dell G3 15 3579 (Toshiba Exceria Pro SDXC 64 GB UHS-II) | |
| Networking | |
| iperf3 transmit AX12 | |
| Aorus 15-SA | |
| Lenovo Legion Y540-15IRH-81SX00B2GE | |
| Alienware m15 R2 P87F | |
| Dell G3 15 3579 | |
| Dell G3 3590 | |
| iperf3 receive AX12 | |
| Aorus 15-SA | |
| Alienware m15 R2 P87F | |
| Lenovo Legion Y540-15IRH-81SX00B2GE | |
| Dell G3 3590 | |
| Dell G3 15 3579 | |
| |||||||||||||||||||||||||
Helderheidsverdeling: 86 %
Helderheid in Batterij-modus: 172 cd/m²
Contrast: 1151:1 (Zwart: 0.24 cd/m²)
ΔE ColorChecker Calman: 5.56 | ∀{0.5-29.43 Ø4.71}
calibrated: 5.23
ΔE Greyscale Calman: 2.8 | ∀{0.09-98 Ø4.96}
59% sRGB (Argyll 1.6.3 3D)
37.8% AdobeRGB 1998 (Argyll 1.6.3 3D)
41.47% AdobeRGB 1998 (Argyll 3D)
59.8% sRGB (Argyll 3D)
40.13% Display P3 (Argyll 3D)
Gamma: 2.37
CCT: 6710 K
| Dell G3 3590 BOE NV15N3D, IPS, 15.6", 1920x1080 | Dell G3 15 3579 LG Philips LP156WF6, IPS, 15.6", 1920x1080 | Lenovo Legion Y540-15IRH-81SX00B2GE BOE 084D, IPS, 15.6", 1920x1080 | Aorus 15-SA LG Philips LP156WFG-SPB2 (LGD05E8), IPS, 15.6", 1920x1080 | Alienware m15 R2 P87F Sharp LQ156M1, IPS, 15.6", 1920x1080 | HP Gaming Pavilion 15-dk0009ng LG Philips LGD05FE, IPS, 15.6", 1920x1080 | |
|---|---|---|---|---|---|---|
| Display | -4% | 56% | 58% | 60% | 59% | |
| Display P3 Coverage (%) | 40.13 | 38.48 -4% | 63.6 58% | 64.3 60% | 65.3 63% | 64.2 60% |
| sRGB Coverage (%) | 59.8 | 57.9 -3% | 91.7 53% | 93.6 57% | 95.1 59% | 95.1 59% |
| AdobeRGB 1998 Coverage (%) | 41.47 | 39.75 -4% | 65.2 57% | 65.6 58% | 65.9 59% | 65.8 59% |
| Response Times | 29% | 72% | 63% | 69% | 66% | |
| Response Time Grey 50% / Grey 80% * (ms) | 46 ? | 32.4 ? 30% | 8.8 ? 81% | 15.6 ? 66% | 16.4 ? 64% | 16.4 ? 64% |
| Response Time Black / White * (ms) | 32.4 ? | 23.2 ? 28% | 12 ? 63% | 12.8 ? 60% | 8.8 ? 73% | 10.4 ? 68% |
| PWM Frequency (Hz) | 200 ? | 23810 ? | ||||
| Screen | -11% | 20% | 21% | 2% | 33% | |
| Brightness middle (cd/m²) | 276.2 | 208.2 -25% | 299 8% | 266 -4% | 324.2 17% | 345 25% |
| Brightness (cd/m²) | 261 | 203 -22% | 290 11% | 254 -3% | 304 16% | 324 24% |
| Brightness Distribution (%) | 86 | 81 -6% | 89 3% | 90 5% | 90 5% | 86 0% |
| Black Level * (cd/m²) | 0.24 | 0.34 -42% | 0.29 -21% | 0.28 -17% | 0.38 -58% | 0.42 -75% |
| Contrast (:1) | 1151 | 612 -47% | 1031 -10% | 950 -17% | 853 -26% | 821 -29% |
| Colorchecker dE 2000 * | 5.56 | 4.65 16% | 3.7 33% | 3.11 44% | 5.01 10% | 1.3 77% |
| Colorchecker dE 2000 max. * | 23.45 | 15.99 32% | 7 70% | 5.84 75% | 12.7 46% | 2.8 88% |
| Colorchecker dE 2000 calibrated * | 5.23 | 3.84 27% | 2 62% | 1.37 74% | 1.64 69% | 1.1 79% |
| Greyscale dE 2000 * | 2.8 | 4.1 -46% | 4.1 -46% | 3.94 -41% | 7.9 -182% | 1.2 57% |
| Gamma | 2.37 93% | 2.3 96% | 2.19 100% | 2.53 87% | 2.35 94% | 2.31 95% |
| CCT | 6710 97% | 7352 88% | 7166 91% | 6210 105% | 8455 77% | 6476 100% |
| Color Space (Percent of AdobeRGB 1998) (%) | 37.8 | 36.7 -3% | 59.3 57% | 60 59% | 60.8 61% | 60.5 60% |
| Color Space (Percent of sRGB) (%) | 59 | 57.9 -2% | 91.5 55% | 93 58% | 95.5 62% | 94.9 61% |
| Totaal Gemiddelde (Programma / Instellingen) | 5% /
-4% | 49% /
33% | 47% /
33% | 44% /
21% | 53% /
42% |
* ... kleiner is beter
Responstijd Scherm
| ↔ Responstijd Zwart naar Wit | ||
|---|---|---|
| 32.4 ms ... stijging ↗ en daling ↘ gecombineerd | ↗ 18.4 ms stijging | 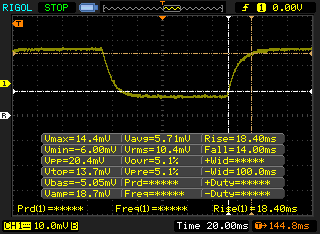 |
| ↘ 14 ms daling | ||
| Het scherm vertoonde trage responstijden in onze tests en is misschien te traag voor games. Ter vergelijking: alle testtoestellen variëren van 0.1 (minimum) tot 240 (maximum) ms. » 88 % van alle toestellen zijn beter. Dit betekent dat de gemeten responstijd slechter is dan het gemiddelde (19.8 ms) van alle geteste toestellen. | ||
| ↔ Responstijd 50% Grijs naar 80% Grijs | ||
| 46 ms ... stijging ↗ en daling ↘ gecombineerd | ↗ 22 ms stijging | 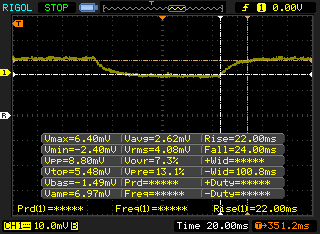 |
| ↘ 24 ms daling | ||
| Het scherm vertoonde trage responstijden in onze tests en is misschien te traag voor games. Ter vergelijking: alle testtoestellen variëren van 0.165 (minimum) tot 636 (maximum) ms. » 79 % van alle toestellen zijn beter. Dit betekent dat de gemeten responstijd slechter is dan het gemiddelde (30.9 ms) van alle geteste toestellen. | ||
Screen Flickering / PWM (Pulse-Width Modulation)
| Screen flickering / PWM waargenomen | 200 Hz | ≤ 98 % helderheid instelling | 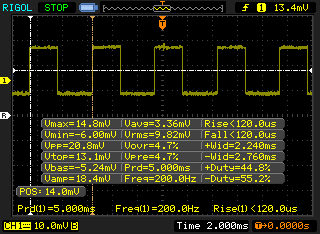 |
De achtergrondverlichting van het scherm flikkert op 200 Hz (in het slechtste geval, bijvoorbeeld bij gebruik van PWM) aan een helderheid van 98 % en lager. Boven deze helderheid zou er geen flickering / PWM mogen optreden. De frequentie van 200 Hz is redelijk laag en de meeste mensen die gevoelig zijn aan flickering kunnen dit dus waarnemen of geïrriteerde ogen krijgen (gebruikmakend van de vermelde helderheid en lager). Ter vergelijking: 52 % van alle geteste toestellen maakten geen gebruik van PWM om de schermhelderheid te verlagen. Als het wel werd gebruikt, werd een gemiddelde van 7741 (minimum: 5 - maximum: 343500) Hz waargenomen. | |||
| Cinebench R11.5 | |
| CPU Single 64Bit | |
| Dell Inspiron 15 7000 7577 4K | |
| Asus ROG Zephyrus G15 GA502DU | |
| CPU Multi 64Bit | |
| Asus ROG Zephyrus G15 GA502DU | |
| Dell Inspiron 15 7000 7577 4K | |
| Cinebench R10 | |
| Rendering Multiple CPUs 32Bit | |
| Gemiddeld Intel Core i5-9300H (21798 - 25656, n=5) | |
| Dell Inspiron 15 7000 7577 4K | |
| Asus ROG Zephyrus G15 GA502DU | |
| Rendering Single 32Bit | |
| Gemiddeld Intel Core i5-9300H (6421 - 6677, n=5) | |
| Dell Inspiron 15 7000 7577 4K | |
| Asus ROG Zephyrus G15 GA502DU | |
| wPrime 2.10 - 1024m | |
| Dell Inspiron 15 7000 7577 4K | |
| Asus ROG Zephyrus G15 GA502DU | |
* ... kleiner is beter
| PCMark 8 Home Score Accelerated v2 | 3792 punten | |
| PCMark 8 Work Score Accelerated v2 | 5088 punten | |
| PCMark 10 Score | 4798 punten | |
Help | ||
| Dell G3 3590 Toshiba BG4 KBG40ZNS128G | Dell G7 17 7790 Toshiba BG3 KBG30ZMS256G | Aorus 15-SA Intel SSD 760p SSDPEKKW512G8 | Razer Blade 15 GTX 1660 Ti Samsung SSD PM981 MZVLB256HAHQ | Dell XPS 15 7590 i5 iGPU FHD Toshiba XG6 KXG60ZNV512G | Asus ROG Zephyrus G15 GA502DU Intel SSD 660p SSDPEKNW512G8 | |
|---|---|---|---|---|---|---|
| AS SSD | 26% | 361% | 387% | 466% | 226% | |
| Seq Read (MB/s) | 1174 | 1033 -12% | 2601 122% | 1829 56% | 2357 101% | 907 -23% |
| Seq Write (MB/s) | 186 | 218.3 17% | 1507 710% | 1315 607% | 1235 564% | 926 398% |
| 4K Read (MB/s) | 34.01 | 24.12 -29% | 56.3 66% | 51.3 51% | 43.29 27% | 47.26 39% |
| 4K Write (MB/s) | 69.4 | 55 -21% | 110.3 59% | 106 53% | 99.7 44% | 98.7 42% |
| 4K-64 Read (MB/s) | 424 | 330.3 -22% | 877 107% | 917 116% | 1020 141% | 321.5 -24% |
| 4K-64 Write (MB/s) | 68.8 | 155.8 126% | 914 1228% | 1212 1662% | 1502 2083% | 736 970% |
| Access Time Read * (ms) | 0.168 | 0.18 -7% | 0.05 70% | 0.063 62% | 0.07 58% | 0.064 62% |
| Access Time Write * (ms) | 0.94 | 0.314 67% | 0.034 96% | 0.104 89% | 0.039 96% | 0.045 95% |
| Score Read (Points) | 575 | 458 -20% | 1193 107% | 1152 100% | 1299 126% | 459 -20% |
| Score Write (Points) | 157 | 233 48% | 1175 648% | 1450 824% | 1726 999% | 927 490% |
| Score Total (Points) | 987 | 891 -10% | 2938 198% | 3177 222% | 3640 269% | 1641 66% |
| Copy ISO MB/s (MB/s) | 215.7 | 382.9 78% | 2104 875% | 1539 613% | 2145 894% | 905 320% |
| Copy Program MB/s (MB/s) | 108.2 | 234.9 117% | 387.7 258% | 513 374% | 565 422% | 496.9 359% |
| Copy Game MB/s (MB/s) | 165.9 | 218.7 32% | 1021 515% | 1150 593% | 1320 696% | 819 394% |
* ... kleiner is beter

| 3DMark 11 Performance | 11845 punten | |
| 3DMark Cloud Gate Standard Score | 24291 punten | |
| 3DMark Fire Strike Score | 8081 punten | |
| 3DMark Time Spy Score | 3608 punten | |
Help | ||
| Shadow of the Tomb Raider - 1920x1080 High Preset AA:SM | |
| Alienware Area-51m i9-9900K RTX 2080 | |
| Alienware m15 R2 P87F | |
| Alienware m15 P79F | |
| Razer Blade 15 GTX 1660 Ti | |
| HP Pavilion Gaming 17-cd0085cl | |
| Asus TUF FX705GM | |
| Asus ROG Zephyrus G15 GA502DU | |
| MSI GF75 Thin 9SC | |
| Dell G3 3590 | |
| Gainward GeForce GTX 1650 4 GB | |
| Gemiddeld NVIDIA GeForce GTX 1650 Mobile (38 - 53, n=15) | |
| Asus TUF FX705GE-EW096T | |
| Asus GL753VD | |
| lage | gem. | hoge | ultra | |
|---|---|---|---|---|
| BioShock Infinite (2013) | 259.9 | 221.8 | 193.6 | 85.6 |
| The Witcher 3 (2015) | 175.1 | 115.8 | 65.9 | 36.2 |
| Rocket League (2017) | 247 | 188.7 | 137.2 | |
| Shadow of the Tomb Raider (2018) | 102 | 61 | 51 |
| Dell G3 3590 GeForce GTX 1650 Mobile, i5-9300H, Toshiba BG4 KBG40ZNS128G | Dell G3 15 3579 GeForce GTX 1050 Mobile, i5-8300H, Seagate Mobile HDD 1TB ST1000LX015-1U7172 | Lenovo Legion Y540-15IRH-81SX00B2GE GeForce GTX 1660 Ti Mobile, i7-9750H, WDC PC SN720 SDAPNTW-512G | Aorus 15-SA GeForce GTX 1660 Ti Mobile, i7-9750H, Intel SSD 760p SSDPEKKW512G8 | Alienware m15 R2 P87F GeForce RTX 2080 Max-Q, i7-9750H, 2x Toshiba XG6 KXG60ZNV512G (RAID 0) | HP Gaming Pavilion 15-dk0009ng GeForce GTX 1660 Ti Max-Q, i7-9750H, Samsung SSD PM981 MZVLB256HAHQ | |
|---|---|---|---|---|---|---|
| Noise | 0% | 3% | -18% | -14% | 9% | |
| uit / omgeving * (dB) | 28.4 | 28 1% | 29.3 -3% | 29 -2% | 28.3 -0% | 28.2 1% |
| Idle Minimum * (dB) | 29.2 | 29.8 -2% | 29.3 -0% | 32 -10% | 28.5 2% | 29.3 -0% |
| Idle Average * (dB) | 29.4 | 29.8 -1% | 29.3 -0% | 35 -19% | 28.5 3% | 29.3 -0% |
| Idle Maximum * (dB) | 29.4 | 30 -2% | 29.3 -0% | 41 -39% | 49 -67% | 29.3 -0% |
| Load Average * (dB) | 39 | 38.6 1% | 35.7 8% | 54 -38% | 49 -26% | 32.3 17% |
| Witcher 3 ultra * (dB) | 49.5 | 46.9 5% | 44.2 11% | 52 -5% | 49 1% | 34 31% |
| Load Maximum * (dB) | 49.7 | 49.4 1% | 45.6 8% | 56 -13% | 55 -11% | 41.2 17% |
* ... kleiner is beter
Geluidsniveau
| Onbelast |
| 29.2 / 29.4 / 29.4 dB (A) |
| Belasting |
| 39 / 49.7 dB (A) |
 | ||
30 dB stil 40 dB(A) hoorbaar 50 dB(A) luid |
||
min: | ||
(-) De maximumtemperatuur aan de bovenzijde bedraagt 49 °C / 120 F, vergeleken met het gemiddelde van 40.4 °C / 105 F, variërend van 21.2 tot 68.8 °C voor de klasse Gaming.
(-) De bodem warmt op tot een maximum van 49.8 °C / 122 F, vergeleken met een gemiddelde van 43.2 °C / 110 F
(+) Bij onbelast gebruik bedraagt de gemiddelde temperatuur voor de bovenzijde 28.8 °C / 84 F, vergeleken met het apparaatgemiddelde van 33.9 °C / 93 F.
(±) Bij het spelen van The Witcher 3 is de gemiddelde temperatuur voor de bovenzijde 37.3 °C / 99 F, vergeleken met het apparaatgemiddelde van 33.9 °C / 93 F.
(+) De palmsteunen en het touchpad zijn met een maximum van ###max## °C / 88.2 F koeler dan de huidtemperatuur en voelen daarom koel aan.
(-) De gemiddelde temperatuur van de handpalmsteun van soortgelijke toestellen bedroeg 28.8 °C / 83.8 F (-2.4 °C / -4.4 F).
Dell G3 3590 audioanalyse
(+) | luidsprekers kunnen relatief luid spelen (84.1 dB)
Bas 100 - 315 Hz
(-) | bijna geen lage tonen - gemiddeld 16.9% lager dan de mediaan
(±) | lineariteit van de lage tonen is gemiddeld (10.9% delta ten opzichte van de vorige frequentie)
Midden 400 - 2000 Hz
(±) | hogere middens - gemiddeld 6.5% hoger dan de mediaan
(+) | de middentonen zijn lineair (5.9% delta ten opzichte van de vorige frequentie)
Hoog 2 - 16 kHz
(+) | evenwichtige hoogtepunten - slechts 3.5% verwijderd van de mediaan
(±) | lineariteit van de hoogtepunten is gemiddeld (9.4% delta ten opzichte van de vorige frequentie)
Algemeen 100 - 16.000 Hz
(±) | lineariteit van het totale geluid is gemiddeld (22.8% verschil met de mediaan)
Vergeleken met dezelfde klasse
» 82% van alle geteste apparaten in deze klasse waren beter, 5% vergelijkbaar, 13% slechter
» De beste had een delta van 6%, het gemiddelde was 18%, de slechtste was 132%
Vergeleken met alle geteste toestellen
» 68% van alle geteste apparaten waren beter, 5% gelijk, 27% slechter
» De beste had een delta van 4%, het gemiddelde was 23%, de slechtste was 134%
Apple MacBook 12 (Early 2016) 1.1 GHz audioanalyse
(+) | luidsprekers kunnen relatief luid spelen (83.6 dB)
Bas 100 - 315 Hz
(±) | verminderde zeebaars - gemiddeld 11.3% lager dan de mediaan
(±) | lineariteit van de lage tonen is gemiddeld (14.2% delta ten opzichte van de vorige frequentie)
Midden 400 - 2000 Hz
(+) | evenwichtige middens - slechts 2.4% verwijderd van de mediaan
(+) | de middentonen zijn lineair (5.5% delta ten opzichte van de vorige frequentie)
Hoog 2 - 16 kHz
(+) | evenwichtige hoogtepunten - slechts 2% verwijderd van de mediaan
(+) | de hoge tonen zijn lineair (4.5% delta naar de vorige frequentie)
Algemeen 100 - 16.000 Hz
(+) | het totale geluid is lineair (10.2% verschil met de mediaan)
Vergeleken met dezelfde klasse
» 7% van alle geteste apparaten in deze klasse waren beter, 2% vergelijkbaar, 90% slechter
» De beste had een delta van 5%, het gemiddelde was 18%, de slechtste was 53%
Vergeleken met alle geteste toestellen
» 5% van alle geteste apparaten waren beter, 1% gelijk, 94% slechter
» De beste had een delta van 4%, het gemiddelde was 23%, de slechtste was 134%
| Uit / Standby | |
| Inactief | |
| Belasting |
|
Key:
min: | |
| Dell G3 3590 i5-9300H, GeForce GTX 1650 Mobile, Toshiba BG4 KBG40ZNS128G, IPS, 1920x1080, 15.6" | Dell G3 15 3579 i5-8300H, GeForce GTX 1050 Mobile, Seagate Mobile HDD 1TB ST1000LX015-1U7172, IPS, 1920x1080, 15.6" | Aorus 15-SA i7-9750H, GeForce GTX 1660 Ti Mobile, Intel SSD 760p SSDPEKKW512G8, IPS, 1920x1080, 15.6" | Alienware m15 R2 P87F i7-9750H, GeForce RTX 2080 Max-Q, 2x Toshiba XG6 KXG60ZNV512G (RAID 0), IPS, 1920x1080, 15.6" | HP Gaming Pavilion 15-dk0009ng i7-9750H, GeForce GTX 1660 Ti Max-Q, Samsung SSD PM981 MZVLB256HAHQ, IPS, 1920x1080, 15.6" | MSI GS65 Stealth Thin 8RE-051US i7-8750H, GeForce GTX 1060 Mobile, Samsung SSD PM981 MZVLB256HAHQ, IPS, 1920x1080, 15.6" | |
|---|---|---|---|---|---|---|
| Power Consumption | 0% | -79% | -147% | -9% | -20% | |
| Idle Minimum * (Watt) | 6.2 | 7.9 -27% | 20 -223% | 19 -206% | 6.8 -10% | 8.7 -40% |
| Idle Average * (Watt) | 8.4 | 9.6 -14% | 23 -174% | 40.5 -382% | 10.7 -27% | 13 -55% |
| Idle Maximum * (Watt) | 27.7 | 13 53% | 29 -5% | 52 -88% | 12.5 55% | 14.3 48% |
| Load Average * (Watt) | 91 | 93 -2% | 87 4% | 132.3 -45% | 87.2 4% | 107.4 -18% |
| Witcher 3 ultra * (Watt) | 94.4 | 100.6 -7% | 136 -44% | 183.3 -94% | 121 -28% | 129 -37% |
| Load Maximum * (Watt) | 131.5 | 132.7 -1% | 173 -32% | 217.2 -65% | 191.4 -46% | 151.5 -15% |
* ... kleiner is beter
| Dell G3 3590 i5-9300H, GeForce GTX 1650 Mobile, 51 Wh | Dell G3 15 3579 i5-8300H, GeForce GTX 1050 Mobile, 56 Wh | Lenovo Legion Y540-15IRH-81SX00B2GE i7-9750H, GeForce GTX 1660 Ti Mobile, 57 Wh | Aorus 15-SA i7-9750H, GeForce GTX 1660 Ti Mobile, 62 Wh | Alienware m15 R2 P87F i7-9750H, GeForce RTX 2080 Max-Q, 76 Wh | HP Gaming Pavilion 15-dk0009ng i7-9750H, GeForce GTX 1660 Ti Max-Q, 52.5 Wh | |
|---|---|---|---|---|---|---|
| Batterijduur | 27% | -47% | -30% | -33% | -24% | |
| Reader / Idle (h) | 13.5 | 4 -70% | 3.5 -74% | 9.2 -32% | 8.7 -36% | |
| WiFi v1.3 (h) | 6.7 | 6.5 -3% | 2.4 -64% | 2.8 -58% | 5.5 -18% | 4.8 -28% |
| Load (h) | 1.4 | 2.2 57% | 1.3 -7% | 2 43% | 0.7 -50% | 1.3 -7% |
| Witcher 3 ultra (h) | 1 |
Pro
Contra
Dit is de verkorte versie van het originele artikel. Het volledige, Engelse testrapport vind je hier.
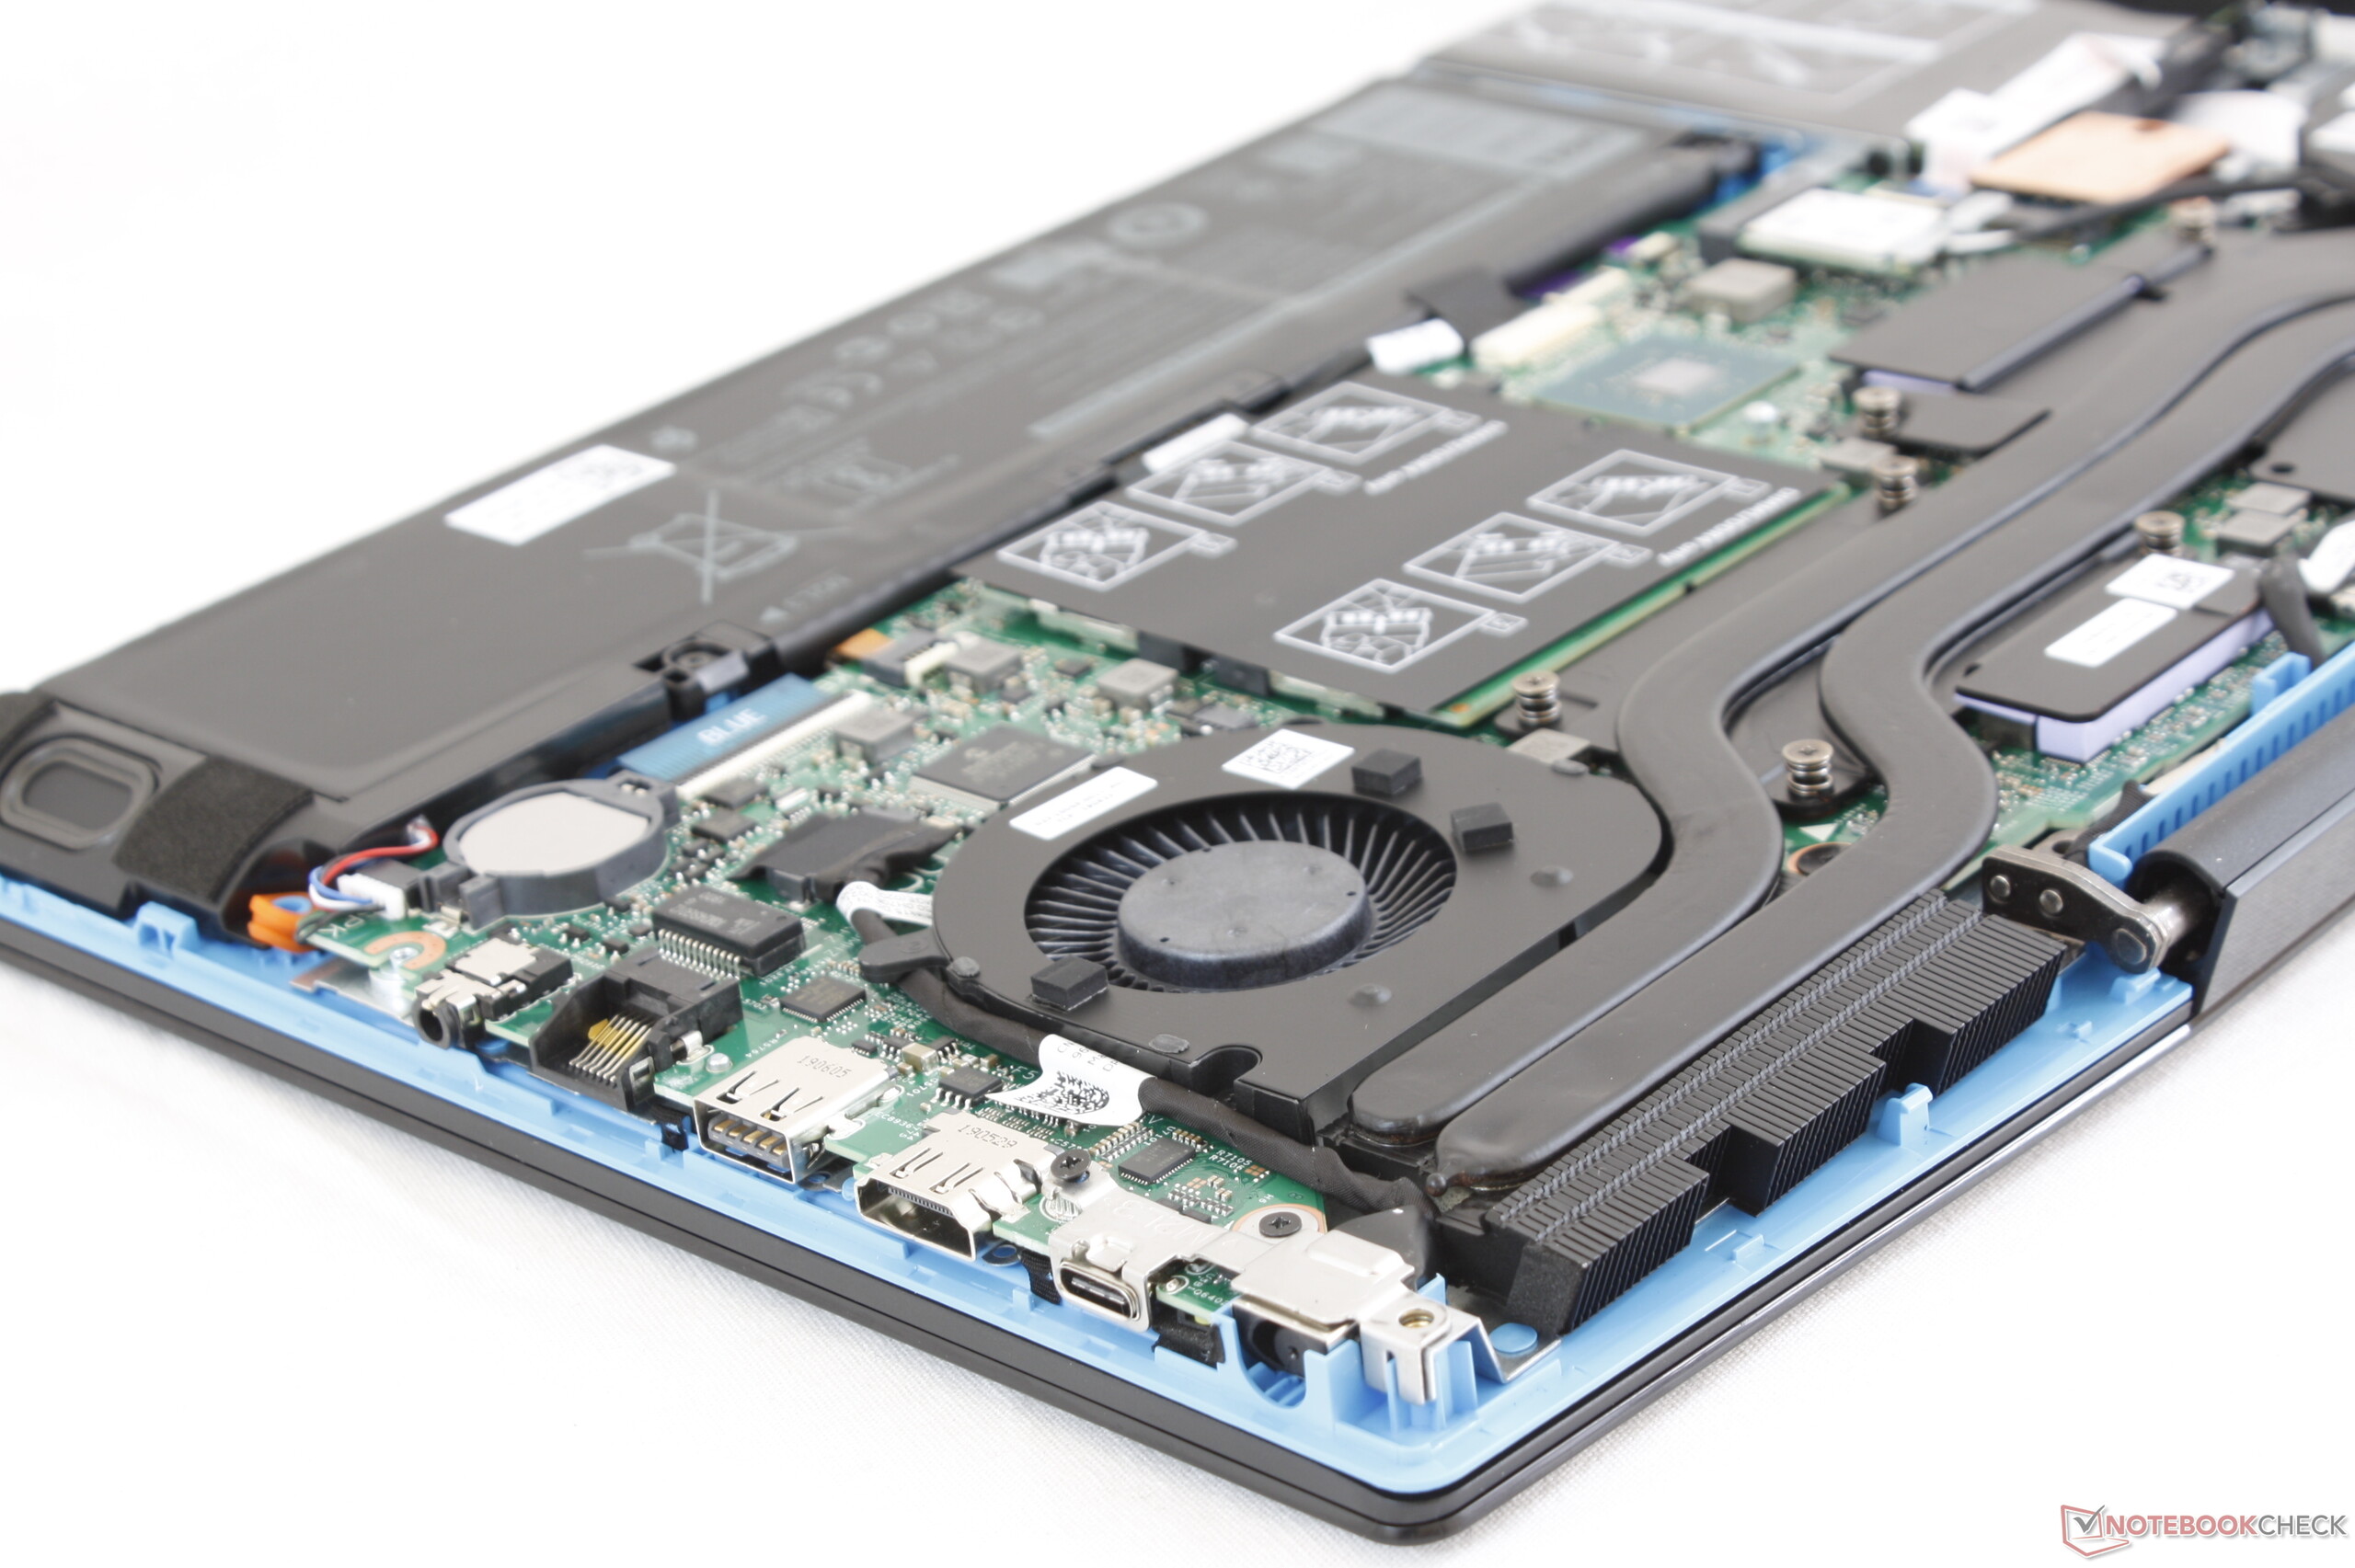
De beste eigenschap van de Dell G3 3590 is het onderhoud. In tegenstelling tot de HP Pavilion Gaming 15 of de MSI GP65 is het upgraden van de Dell notebook makkelijk en vereist niet het verbreken van de garantiezegel. Prestaties zijn wat we verwachten van deze hardware en de lage prijs van het instapmodel maakt deze notebook aantrekkelijk voor gebruikers die een voldoende krachtige notebook zonder fratsen zoeken.
De lijst van minpunten is langer dan we prettig vinden. Met name het beeldscherm heeft last van de kostenbesparingen, wat resulteert in zwakke kleurweergave, matig tot zware backlight bleeding, hoge responstijden, korrelige weergave en een zwak backlight. Hoewel perfect acceptabel in de meeste games, hebben de beide concurrenten HP Gaming Pavilion 15 en Lenovo Legion Y540 veel betere panelen die beter passen bij snelle gameplay. Je zult moeten upgraden naar de Dell G7-serie of hoger om een betere beeldweergave te krijgen, omdat er voor de G3 3590 geen betere beeldschermopties beschikbaar zijn.
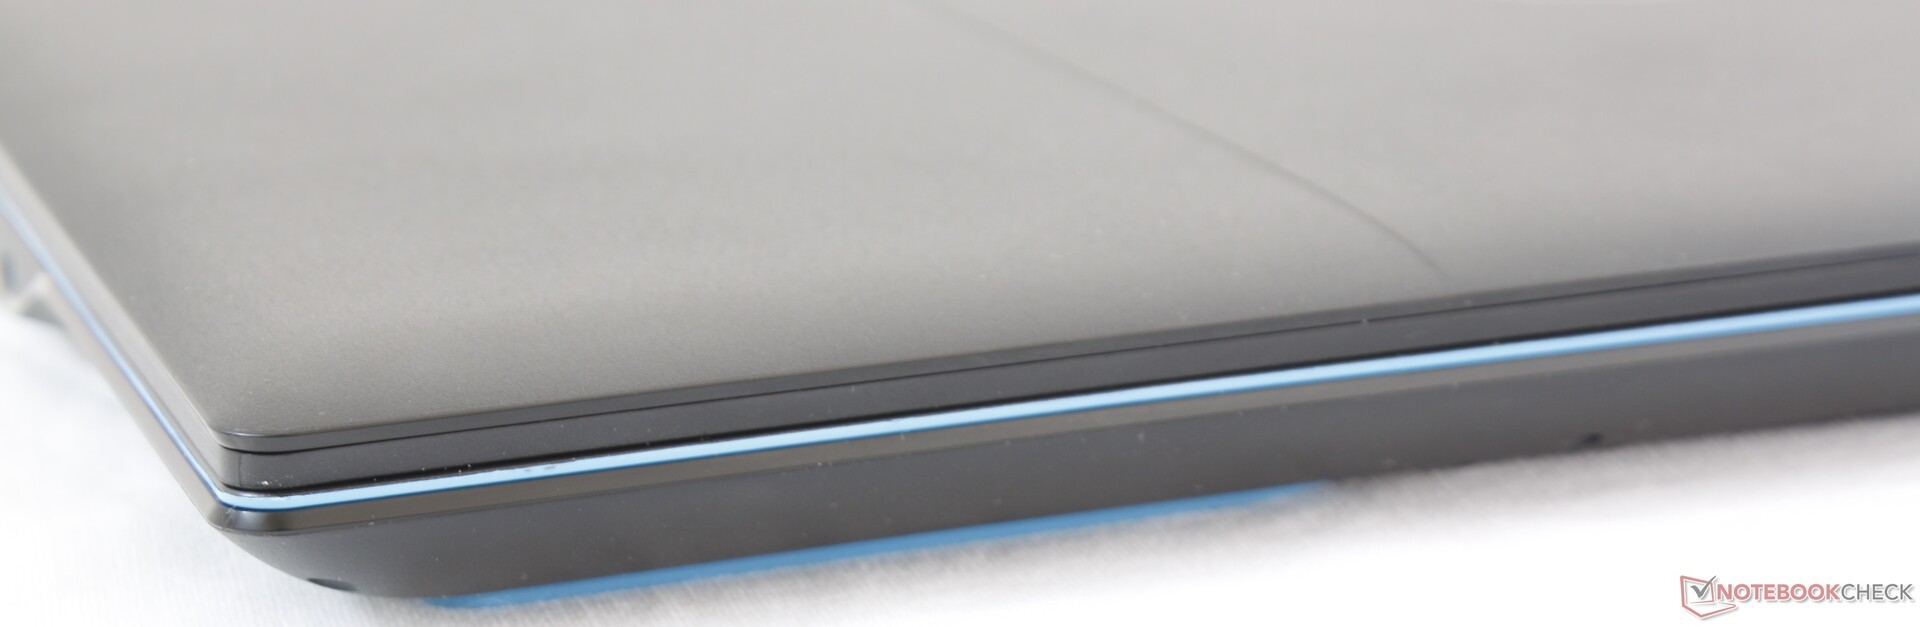
De rest van het systeem is typisch voor deze prijsklasse. De plastic behuizing, luidsprekers met hoge tonen, langzame SD-kaartlezer, 1x1 WLAN en een budget NVMe SSD zijn gemeengoed in budget game notebooks.
Als je € 1.000 uitgeeft aan een game notebook, dan kun je de stillere HP Pavilion Gaming 15 of de slankere AMD-aangedreven Asus Zephyrus G GA502-serie overwegen. De Dell G3 3590 mag dan iets goedkoper zijn, maar de luidere ventilatoren en slechtere beeldscherm zijn lastig aan te raden.
Dell G3 3590
- 11-10-2019 v7 (old)
Allen Ngo
Price comparison
