Kort testrapport Dell Inspiron 15 7000 7577 (i7-7700HQ, GTX 1060 Max-Q, 4K UHD) Laptop
| SD Card Reader | |
| average JPG Copy Test (av. of 3 runs) | |
| Gemiddelde van klas Gaming (20.9 - 210, n=54, laatste 2 jaar) | |
| Asus Zenbook Pro UX550VE-DB71T (Toshiba Exceria Pro SDXC 64 GB UHS-II) | |
| Dell Inspiron 15 7000 7577 4K (Toshiba Exceria Pro SDXC 64 GB UHS-II) | |
| MSI GF62VR 7RF-877 (Toshiba Exceria Pro SDXC 64 GB UHS-II) | |
| maximum AS SSD Seq Read Test (1GB) | |
| Gemiddelde van klas Gaming (25.5 - 261, n=51, laatste 2 jaar) | |
| Asus Zenbook Pro UX550VE-DB71T (Toshiba Exceria Pro SDXC 64 GB UHS-II) | |
| Dell Inspiron 15 7000 7577 4K (Toshiba Exceria Pro SDXC 64 GB UHS-II) | |
| MSI GF62VR 7RF-877 (Toshiba Exceria Pro SDXC 64 GB UHS-II) | |
| Networking | |
| iperf3 transmit AX12 | |
| MSI GF62VR 7RF-877 | |
| Dell Inspiron 15 7000 7577 4K | |
| Asus Zenbook Pro UX550VE-DB71T | |
| iperf3 receive AX12 | |
| MSI GF62VR 7RF-877 | |
| Dell Inspiron 15 7000 7577 4K | |
| Asus Zenbook Pro UX550VE-DB71T | |
| |||||||||||||||||||||||||
Helderheidsverdeling: 90 %
Helderheid in Batterij-modus: 322.9 cd/m²
Contrast: 897:1 (Zwart: 0.36 cd/m²)
ΔE ColorChecker Calman: 3.99 | ∀{0.5-29.43 Ø4.71}
ΔE Greyscale Calman: 5.3 | ∀{0.09-98 Ø4.96}
96.8% sRGB (Argyll 1.6.3 3D)
62.9% AdobeRGB 1998 (Argyll 1.6.3 3D)
69.6% AdobeRGB 1998 (Argyll 3D)
97.1% sRGB (Argyll 3D)
68.4% Display P3 (Argyll 3D)
Gamma: 2.041
CCT: 6941 K
| Dell Inspiron 15 7000 7577 4K Name: AU Optronics B156ZAN, IPS, 15.6", 3840x2160 | Asus Zenbook Pro UX550VE-DB71T N156HCE-EN1 (CMN15E8), IPS, 15.6", 1920x1080 | MSI GF62VR 7RF-877 Chi Mei N156HGA-EAL, TN LED, 15.6", 1920x1080 | Asus GL503VD-DB74 LG Philips LP156WF6, IPS, 15.6", 1920x1080 | Apple MacBook Pro 15 2017 (2.8 GHz, 555) APPA031, IPS, 15.4", 2880x1800 | Dell Inspiron 15 7000 7577 ID: LG Philips LGD053F, Name: 156WF6, Dell P/N: 4XK13, IPS, 15.6", 1920x1080 | |
|---|---|---|---|---|---|---|
| Display | -6% | 16% | -10% | 23% | -40% | |
| Display P3 Coverage (%) | 68.4 | 64.3 -6% | 85.6 25% | 64.3 -6% | 97.9 43% | 40.4 -41% |
| sRGB Coverage (%) | 97.1 | 90.4 -7% | 99.9 3% | 84.4 -13% | 99.9 3% | 60.5 -38% |
| AdobeRGB 1998 Coverage (%) | 69.6 | 65.3 -6% | 83.9 21% | 61.7 -11% | 85.9 23% | 41.77 -40% |
| Response Times | -19% | -14% | 3% | -28% | -8% | |
| Response Time Grey 50% / Grey 80% * (ms) | 35.2 ? | 43.2 ? -23% | 49.6 ? -41% | 36.4 ? -3% | 48 ? -36% | 41 ? -16% |
| Response Time Black / White * (ms) | 28.4 ? | 32.8 ? -15% | 24.4 ? 14% | 26.2 ? 8% | 33.8 ? -19% | 28 ? 1% |
| PWM Frequency (Hz) | 25510 ? | 25510 ? | 21010 ? | 119000 ? | ||
| Screen | -15% | -56% | -4% | 42% | -5% | |
| Brightness middle (cd/m²) | 322.9 | 288.2 -11% | 223.9 -31% | 315.9 -2% | 545 69% | 257 -20% |
| Brightness (cd/m²) | 309 | 266 -14% | 208 -33% | 304 -2% | 523 69% | 229 -26% |
| Brightness Distribution (%) | 90 | 75 -17% | 88 -2% | 88 -2% | 86 -4% | 84 -7% |
| Black Level * (cd/m²) | 0.36 | 0.3 17% | 0.56 -56% | 0.37 -3% | 0.44 -22% | 0.17 53% |
| Contrast (:1) | 897 | 961 7% | 400 -55% | 854 -5% | 1239 38% | 1512 69% |
| Colorchecker dE 2000 * | 3.99 | 5.5 -38% | 9.7 -143% | 4.9 -23% | 1.6 60% | 5.34 -34% |
| Colorchecker dE 2000 max. * | 8.97 | 11.3 -26% | 19.7 -120% | 9.7 -8% | 3.8 58% | 9.99 -11% |
| Greyscale dE 2000 * | 5.3 | 7.9 -49% | 12.9 -143% | 3.8 28% | 1.9 64% | 4.82 9% |
| Gamma | 2.041 108% | 2.09 105% | 2.18 101% | 2.24 98% | 2.26 97% | 2.46 89% |
| CCT | 6941 94% | 6559 99% | 15225 43% | 6847 95% | 6834 95% | 6587 99% |
| Color Space (Percent of AdobeRGB 1998) (%) | 62.9 | 58.5 -7% | 75 19% | 55 -13% | 38 -40% | |
| Color Space (Percent of sRGB) (%) | 96.8 | 90 -7% | 100 3% | 84 -13% | 60 -38% | |
| Totaal Gemiddelde (Programma / Instellingen) | -13% /
-13% | -18% /
-36% | -4% /
-5% | 12% /
27% | -18% /
-12% |
* ... kleiner is beter
Responstijd Scherm
| ↔ Responstijd Zwart naar Wit | ||
|---|---|---|
| 28.4 ms ... stijging ↗ en daling ↘ gecombineerd | ↗ 16 ms stijging | 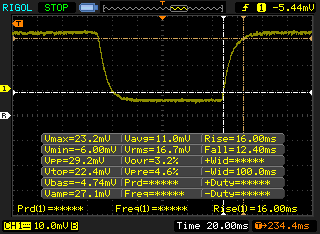 |
| ↘ 12.4 ms daling | ||
| Het scherm vertoonde relatief trage responstijden in onze tests en is misschien te traag voor games. Ter vergelijking: alle testtoestellen variëren van 0.1 (minimum) tot 240 (maximum) ms. » 75 % van alle toestellen zijn beter. Dit betekent dat de gemeten responstijd slechter is dan het gemiddelde (19.8 ms) van alle geteste toestellen. | ||
| ↔ Responstijd 50% Grijs naar 80% Grijs | ||
| 35.2 ms ... stijging ↗ en daling ↘ gecombineerd | ↗ 17.2 ms stijging | 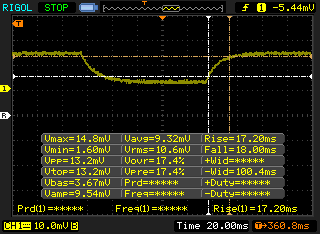 |
| ↘ 18 ms daling | ||
| Het scherm vertoonde trage responstijden in onze tests en is misschien te traag voor games. Ter vergelijking: alle testtoestellen variëren van 0.165 (minimum) tot 636 (maximum) ms. » 49 % van alle toestellen zijn beter. Dit betekent dat de gemeten responstijd slechter is dan het gemiddelde (31 ms) van alle geteste toestellen. | ||
Screen Flickering / PWM (Pulse-Width Modulation)
| Screen flickering / PWM niet waargenomen | 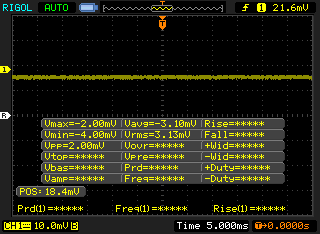 | ||
Ter vergelijking: 52 % van alle geteste toestellen maakten geen gebruik van PWM om de schermhelderheid te verlagen. Als het wel werd gebruikt, werd een gemiddelde van 7754 (minimum: 5 - maximum: 343500) Hz waargenomen. | |||
* ... kleiner is beter
| PCMark 8 Home Score Accelerated v2 | 3385 punten | |
| PCMark 8 Creative Score Accelerated v2 | 4806 punten | |
| PCMark 8 Work Score Accelerated v2 | 4102 punten | |
| PCMark 10 Score | 4306 punten | |
Help | ||
| Dell Inspiron 15 7000 7577 4K SK hynix SC311 M.2 | Asus Zenbook Pro UX550VE-DB71T Samsung PM961 NVMe MZVLW512HMJP | MSI GF62VR 7RF-877 Intel SSD 600p SSDPEKKW256G7 | Dell Inspiron 15 7000 7577 Samsung PM961 MZVLW256HEHP | Gemiddeld SK hynix SC311 M.2 | |
|---|---|---|---|---|---|
| AS SSD | 337% | 114% | 207% | 1% | |
| Copy Game MB/s (MB/s) | 185.4 | 477.1 157% | 471.7 154% | 382.5 106% | 164.3 ? -11% |
| Copy Program MB/s (MB/s) | 142.2 | 294.6 107% | 286.5 101% | 274.8 93% | 138.6 ? -3% |
| Copy ISO MB/s (MB/s) | 363.6 | 1269 249% | 1069 194% | 814 124% | 246 ? -32% |
| Score Total (Points) | 578 | 3721 544% | 1324 129% | 2405 316% | 639 ? 11% |
| Score Write (Points) | 227 | 1421 526% | 693 205% | 594 162% | 228 ? 0% |
| Score Read (Points) | 234 | 1541 559% | 448 91% | 1241 430% | 273 ? 17% |
| Access Time Write * (ms) | 0.058 | 0.034 41% | 0.03 48% | 0.037 36% | 0.058 ? -0% |
| Access Time Read * (ms) | 0.126 | 0.054 57% | 0.09 29% | 0.058 54% | 0.1233 ? 2% |
| 4K-64 Write (MB/s) | 127.2 | 1160 812% | 551 333% | 375.8 195% | 131.4 ? 3% |
| 4K-64 Read (MB/s) | 156.6 | 1269 710% | 280.1 79% | 929 493% | 196.5 ? 25% |
| 4K Write (MB/s) | 74 | 112.8 52% | 118.3 60% | 100.2 35% | 69.6 ? -6% |
| 4K Read (MB/s) | 26.24 | 51 94% | 31.27 19% | 46.95 79% | 26.3 ? 0% |
| Seq Write (MB/s) | 259.9 | 1475 468% | 234.9 -10% | 1181 354% | 270 ? 4% |
| Seq Read (MB/s) | 508 | 2208 335% | 1371 170% | 2652 422% | 504 ? -1% |
* ... kleiner is beter

| 3DMark 11 Performance | 11855 punten | |
| 3DMark Ice Storm Standard Score | 84441 punten | |
| 3DMark Cloud Gate Standard Score | 24667 punten | |
| 3DMark Fire Strike Score | 8861 punten | |
| 3DMark Fire Strike Extreme Score | 4610 punten | |
Help | ||
| Rise of the Tomb Raider | |
| 1920x1080 Very High Preset AA:FX AF:16x | |
| MSI Gaming Z GeForce GTX 1070 OC Bios Desktop PC | |
| Nvidia GeForce GTX 1060 Founders Edition 6 GB | |
| Nvidia GeForce GTX 1060 Founders Edition 6 GB | |
| DogHouse Systems Mobius SS | |
| Dell Inspiron 15 7000 7577 4K | |
| MSI GeForce GTX 1050 Ti | |
| Zotac GeForce GTX 1050 2GB | |
| 3840x2160 High Preset AA:FX AF:4x | |
| MSI Gaming Z GeForce GTX 1070 OC Bios Desktop PC | |
| Nvidia GeForce GTX 1060 Founders Edition 6 GB | |
| Nvidia GeForce GTX 1060 Founders Edition 6 GB | |
| Dell Inspiron 15 7000 7577 4K | |
| Zotac GeForce GTX 1050 2GB | |
| lage | gem. | hoge | ultra | 4K | |
|---|---|---|---|---|---|
| BioShock Infinite (2013) | 100.4 | ||||
| Metro: Last Light (2013) | 74 | ||||
| Thief (2014) | 70.4 | ||||
| The Witcher 3 (2015) | 70.1 | 36.8 | 24.4 | ||
| Batman: Arkham Knight (2015) | 129 | 81 | 53 | 26 | |
| Metal Gear Solid V (2015) | 60 | 60 | 42 | ||
| Fallout 4 (2015) | 78.4 | 64.6 | 25.8 | ||
| Rise of the Tomb Raider (2016) | 45.3 | 22.8 | |||
| Ashes of the Singularity (2016) | 59.8 | 52.9 | 21 | ||
| Overwatch (2016) | 165.8 | 102 | 50.3 | ||
| Prey (2017) | 120 | 101 | 34.6 | ||
| Dirt 4 (2017) | 119.5 | 84.9 | 48.3 | 28.8 | |
| F1 2017 (2017) | 98 | 60 | 26 | ||
| Middle-earth: Shadow of War (2017) | 82 | 60 | 46 | 17 | |
| Destiny 2 (2017) | 94.7 | 85.4 | 71.4 | 17.6 | |
| Final Fantasy XV Benchmark (2018) | 73 | 47.2 | 33.9 | 14.6 |
Geluidsniveau
| Onbelast |
| 28.8 / 29.2 / 29.2 dB (A) |
| Belasting |
| 34.6 / 49.3 dB (A) |
 | ||
30 dB stil 40 dB(A) hoorbaar 50 dB(A) luid |
||
min: | ||
| Dell Inspiron 15 7000 7577 4K GeForce GTX 1060 Max-Q, i7-7700HQ, SK hynix SC311 M.2 | Asus Zenbook Pro UX550VE-DB71T GeForce GTX 1050 Ti Mobile, i7-7700HQ, Samsung PM961 NVMe MZVLW512HMJP | Acer Swift 3 SF315-41-R4W1 Vega 8, R5 2500U, Intel SSD 600p SSDPEKKW256G7 | Dell Inspiron 15 7000 7577 GeForce GTX 1050 Mobile, i5-7300HQ, Seagate Mobile HDD 1TB ST1000LX015-1U7172 | Asus Zephyrus GX501 GeForce GTX 1080 Max-Q, i7-7700HQ, Samsung SSD SM961 1TB M.2 MZVKW1T0HMLH | MSI GE63VR 7RF Raider GeForce GTX 1070 Mobile, i7-7700HQ, Toshiba HG6 THNSNJ256G8NY | |
|---|---|---|---|---|---|---|
| Noise | -6% | -1% | -5% | -7% | -20% | |
| uit / omgeving * (dB) | 28.5 | 28.3 1% | 31.8 -12% | 31 -9% | 31 -9% | 30 -5% |
| Idle Minimum * (dB) | 28.8 | 30.4 -6% | 31.8 -10% | 32.7 -14% | 32 -11% | 33 -15% |
| Idle Average * (dB) | 29.2 | 31 -6% | 32.1 -10% | 32.7 -12% | 33 -13% | 35 -20% |
| Idle Maximum * (dB) | 29.2 | 31.2 -7% | 32.1 -10% | 32.7 -12% | 34 -16% | 40 -37% |
| Load Average * (dB) | 34.6 | 43.3 -25% | 33 5% | 38.7 -12% | 39 -13% | 48 -39% |
| Witcher 3 ultra * (dB) | 44.1 | 46.2 -5% | 39 12% | 42 5% | 50 -13% | |
| Load Maximum * (dB) | 49.3 | 46.2 6% | 34.8 29% | 44.6 10% | 46 7% | 55 -12% |
* ... kleiner is beter
(±) De maximumtemperatuur aan de bovenzijde bedraagt 42.6 °C / 109 F, vergeleken met het gemiddelde van 40.4 °C / 105 F, variërend van 21.2 tot 68.8 °C voor de klasse Gaming.
(-) De bodem warmt op tot een maximum van 46.2 °C / 115 F, vergeleken met een gemiddelde van 43.2 °C / 110 F
(+) Bij onbelast gebruik bedraagt de gemiddelde temperatuur voor de bovenzijde 27.1 °C / 81 F, vergeleken met het apparaatgemiddelde van 33.9 °C / 93 F.
(+) Bij het spelen van The Witcher 3 is de gemiddelde temperatuur voor de bovenzijde 28.9 °C / 84 F, vergeleken met het apparaatgemiddelde van 33.9 °C / 93 F.
(+) De palmsteunen en het touchpad zijn met een maximum van ###max## °C / 81 F koeler dan de huidtemperatuur en voelen daarom koel aan.
(±) De gemiddelde temperatuur van de handpalmsteun van soortgelijke toestellen bedroeg 28.8 °C / 83.8 F (+1.6 °C / 2.8 F).
| Uit / Standby | |
| Inactief | |
| Belasting |
|
Key:
min: | |
| Dell Inspiron 15 7000 7577 4K i7-7700HQ, GeForce GTX 1060 Max-Q, SK hynix SC311 M.2, IPS, 3840x2160, 15.6" | Asus Zenbook Pro UX550VE-DB71T i7-7700HQ, GeForce GTX 1050 Ti Mobile, Samsung PM961 NVMe MZVLW512HMJP, IPS, 1920x1080, 15.6" | Acer Swift 3 SF315-41-R4W1 R5 2500U, Vega 8, Intel SSD 600p SSDPEKKW256G7, IPS, 1920x1080, 15.6" | MSI GF62VR 7RF-877 i7-7700HQ, GeForce GTX 1060 Mobile, Intel SSD 600p SSDPEKKW256G7, TN LED, 1920x1080, 15.6" | Dell Inspiron 15 7000 7577 i5-7300HQ, GeForce GTX 1050 Mobile, Seagate Mobile HDD 1TB ST1000LX015-1U7172, IPS, 1920x1080, 15.6" | Asus Zephyrus GX501 i7-7700HQ, GeForce GTX 1080 Max-Q, Samsung SSD SM961 1TB M.2 MZVKW1T0HMLH, IPS, 1920x1080, 15.6" | |
|---|---|---|---|---|---|---|
| Power Consumption | 7% | 14% | -68% | 3% | -107% | |
| Idle Minimum * (Watt) | 5.5 | 6.3 -15% | 7.3 -33% | 16.2 -195% | 5.3 4% | 18 -227% |
| Idle Average * (Watt) | 10.5 | 7.9 25% | 9.7 8% | 18.2 -73% | 8.8 16% | 23 -119% |
| Idle Maximum * (Watt) | 10.9 | 8.1 26% | 13 -19% | 18.9 -73% | 9.7 11% | 31 -184% |
| Load Average * (Watt) | 72 | 84.9 -18% | 40.4 44% | 82.7 -15% | 100 -39% | 79 -10% |
| Witcher 3 ultra * (Watt) | 97.4 | 96.3 1% | 125.7 -29% | 87 11% | 148 -52% | |
| Load Maximum * (Watt) | 130.4 | 102.4 21% | 42.2 68% | 162.3 -24% | 109 16% | 196 -50% |
* ... kleiner is beter
| Dell Inspiron 15 7000 7577 4K i7-7700HQ, GeForce GTX 1060 Max-Q, 56 Wh | Asus Zenbook Pro UX550VE-DB71T i7-7700HQ, GeForce GTX 1050 Ti Mobile, 73 Wh | Acer Swift 3 SF315-41-R4W1 R5 2500U, Vega 8, 48 Wh | MSI GF62VR 7RF-877 i7-7700HQ, GeForce GTX 1060 Mobile, 41 Wh | Asus GL503VD-DB74 i7-7700HQ, GeForce GTX 1050 Mobile, 64 Wh | Dell Inspiron 15 7000 7577 i5-7300HQ, GeForce GTX 1050 Mobile, 56 Wh | |
|---|---|---|---|---|---|---|
| Batterijduur | 39% | 4% | -63% | -2% | 19% | |
| Reader / Idle (h) | 10 | 17.1 71% | 12.2 22% | 2.8 -72% | 10.8 8% | 11.1 11% |
| WiFi v1.3 (h) | 5.4 | 8.9 65% | 5.2 -4% | 1.9 -65% | 5.8 7% | 6.8 26% |
| Load (h) | 1.5 | 1.2 -20% | 1.4 -7% | 0.7 -53% | 1.2 -20% | 1.8 20% |
Pro
Contra
Voor het volledige, Engelse testrapport, klik hier.
Een 4K beeldscherm voor gamen is wellicht niet de beste optie voor een systeem met een GTX 1060 Max-Q GPU. Tenzij de notebook gebruikt gaat worden voor grote spreadsheets of niet-veeleisende games zoals Rocket League, LoL, Overwatch of DOTA 2, is de exorbitant grote meerprijs voor het 4K paneel niet te rechtvaardigen. Gebruikers zullen een krachtigere GPU nodig hebben om het 4K UHD beeldscherm volledig te benutten.
Indien het hierboven genoemde geen probleem is, zullen gebruikers tevreden zijn met de hogere helderheid en nauwkeurigere kleuren. Dezelfde voor- en nadelen uit ons Inspiron 15 7577 artikel zijn ook hier van toepassing, inclusief de sterke maar zware behuizing, stille maar slappe toetsen en toegankelijke componenten.
De 4K UHD versie van de Inspiron 15 7577 verslaat op papier de FHD variant, maar gamers zijn in de praktijk beter af door games op 1080p resolutie te spelen; de GTX 1060 Max-Q is simpelweg niet krachtig genoeg voor de UHD resolutie.
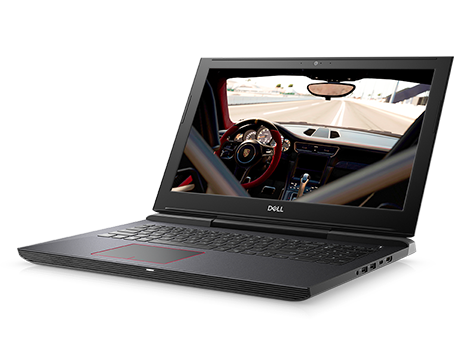
Dell Inspiron 15 7000 7577 4K
- 19-02-2018 v6 (old)
Allen Ngo
Price comparison
