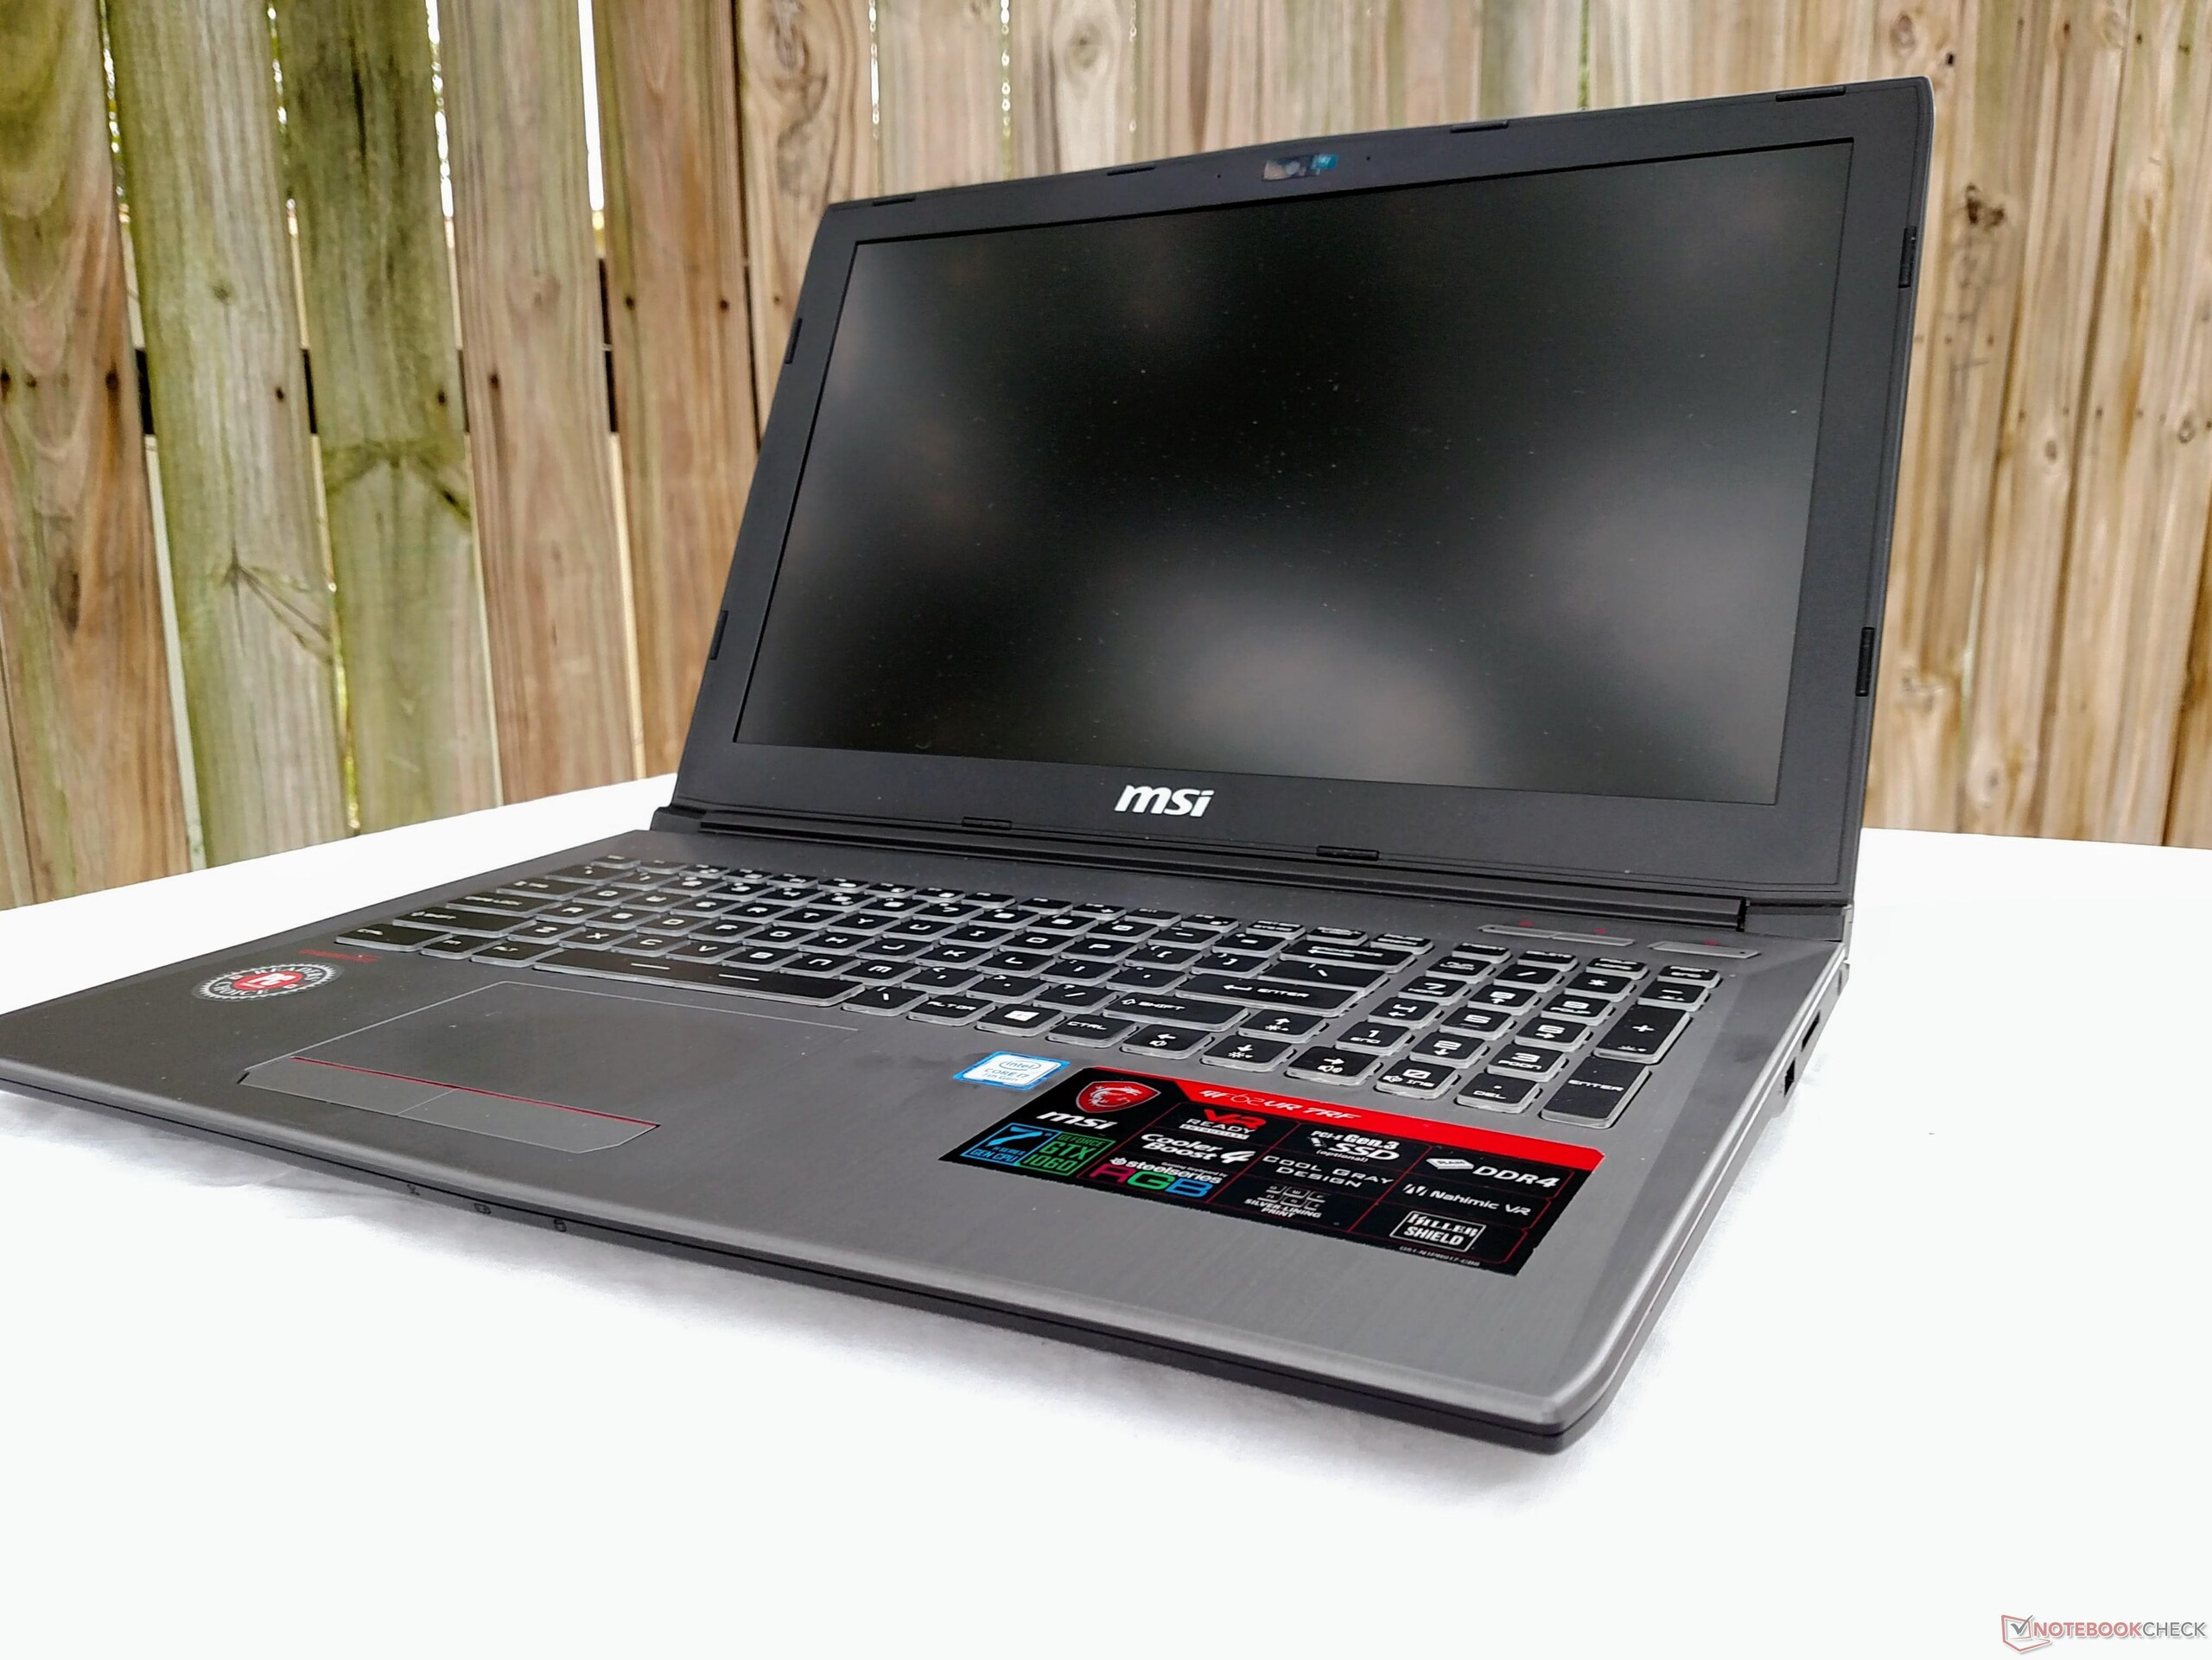
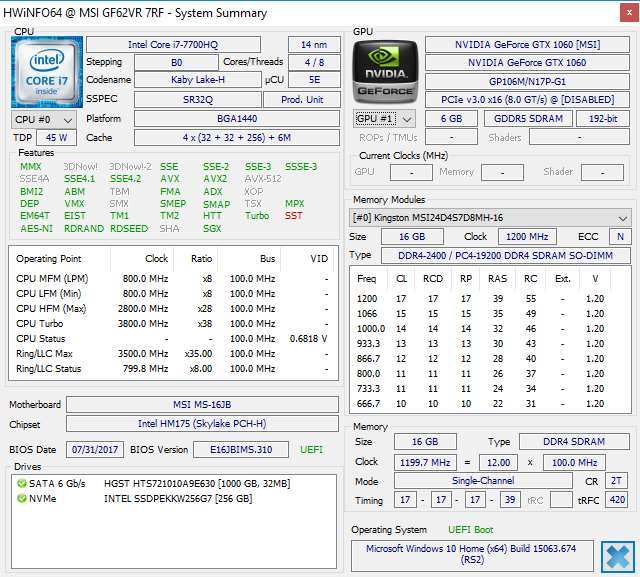
Kort testrapport MSI GF62VR 7RF (7700HQ, GTX 1060, FHD 60 Hz) Laptop
| SD Card Reader | |
| average JPG Copy Test (av. of 3 runs) | |
| Asus Strix GL502VM-DS74 | |
| Gigabyte Aero 15 | |
| Schenker XMG A517 | |
| HP Omen 15-ce002ng | |
| Gigabyte P55W v7 | |
| MSI GF62VR 7RF-877 | |
| MSI GE62VR 6RF-001US | |
| maximum AS SSD Seq Read Test (1GB) | |
| Asus Strix GL502VM-DS74 | |
| Gigabyte Aero 15 | |
| Gigabyte P55W v7 | |
| Schenker XMG A517 | |
| HP Omen 15-ce002ng | |
| MSI GF62VR 7RF-877 | |
| MSI GE62VR 6RF-001US | |
| |||||||||||||||||||||||||
Helderheidsverdeling: 88 %
Helderheid in Batterij-modus: 223.9 cd/m²
Contrast: 400:1 (Zwart: 0.56 cd/m²)
ΔE ColorChecker Calman: 9.7 | ∀{0.5-29.43 Ø4.71}
ΔE Greyscale Calman: 12.9 | ∀{0.09-98 Ø4.96}
100% sRGB (Argyll 1.6.3 3D)
75% AdobeRGB 1998 (Argyll 1.6.3 3D)
83.9% AdobeRGB 1998 (Argyll 3D)
99.9% sRGB (Argyll 3D)
85.6% Display P3 (Argyll 3D)
Gamma: 2.18
CCT: 15225 K
| MSI GF62VR 7RF-877 Chi Mei N156HGA-EAL, TN LED, 15.6", 1920x1080 | MSI GE62VR 6RF-001US IPS, 15.6", 1920x1080 | Schenker XMG A517 LG Philips LP156WF6 (LGD046F), IPS, 15.6", 1920x1080 | Gigabyte Aero 15 N156HCA-EA1 (CMN15D7), IPS, 15.6", 1920x1080 | Gigabyte P55W v7 LG Philips LP156WF6 (LGD046F), IPS, 15.6", 1920x1080 | Asus Strix GL502VM-DS74 IPS, 15.6", 1920x1080 | HP Omen 15-ce002ng AUO42ED, IPS, 15.6", 1920x1080 | Samsung Odyssey NP800G5M-X01US IPS, 15.6", 1920x1080 | |
|---|---|---|---|---|---|---|---|---|
| Display | -22% | -22% | -17% | -24% | -22% | -18% | -39% | |
| Display P3 Coverage (%) | 85.6 | 65.6 -23% | 65 -24% | 65.2 -24% | 63.5 -26% | 64.8 -24% | 65.8 -23% | 47.11 -45% |
| sRGB Coverage (%) | 99.9 | 84.3 -16% | 85.1 -15% | 92.5 -7% | 82 -18% | 84.9 -15% | 90.9 -9% | 70.4 -30% |
| AdobeRGB 1998 Coverage (%) | 83.9 | 61.7 -26% | 62.2 -26% | 66.5 -21% | 59.9 -29% | 62 -26% | 66.5 -21% | 48.71 -42% |
| Response Times | 9% | 15% | -9% | 12% | -10% | -8% | -8% | |
| Response Time Grey 50% / Grey 80% * (ms) | 49.6 ? | 36.8 ? 26% | 36 ? 27% | 42.8 ? 14% | 37 ? 25% | 42 ? 15% | 43.2 ? 13% | 38.8 ? 22% |
| Response Time Black / White * (ms) | 24.4 ? | 26.4 ? -8% | 24 ? 2% | 32 ? -31% | 25 ? -2% | 32.8 ? -34% | 31.2 ? -28% | 33.6 ? -38% |
| PWM Frequency (Hz) | 25510 ? | 21000 ? | 26000 ? | 19230 ? | ||||
| Screen | 63% | 38% | 38% | 38% | 40% | 50% | 11% | |
| Brightness middle (cd/m²) | 223.9 | 302 35% | 320 43% | 320 43% | 287 28% | 307.8 37% | 304 36% | 255.9 14% |
| Brightness (cd/m²) | 208 | 303 46% | 311 50% | 316 52% | 289 39% | 301 45% | 289 39% | 249 20% |
| Brightness Distribution (%) | 88 | 87 -1% | 90 2% | 90 2% | 87 -1% | 88 0% | 86 -2% | 90 2% |
| Black Level * (cd/m²) | 0.56 | 0.169 70% | 0.36 36% | 0.36 36% | 0.29 48% | 0.33 41% | 0.26 54% | 0.48 14% |
| Contrast (:1) | 400 | 1787 347% | 889 122% | 889 122% | 990 148% | 933 133% | 1169 192% | 533 33% |
| Colorchecker dE 2000 * | 9.7 | 4.61 52% | 5.08 48% | 4.62 52% | 4.92 49% | 4.5 54% | 3.46 64% | 5.9 39% |
| Colorchecker dE 2000 max. * | 19.7 | 9.98 49% | 10.73 46% | 9.75 51% | 11 44% | 10 49% | 7.72 61% | 18.9 4% |
| Greyscale dE 2000 * | 12.9 | 3.32 74% | 4.04 69% | 6 53% | 3.66 72% | 2.9 78% | 2.46 81% | 5.6 57% |
| Gamma | 2.18 101% | 2.24 98% | 2.34 94% | 2.46 89% | 2.32 95% | 2.22 99% | 2.38 92% | 2.21 100% |
| CCT | 15225 43% | 6358 102% | 7029 92% | 6761 96% | 6482 100% | 1136 572% | 6915 94% | 7250 90% |
| Color Space (Percent of AdobeRGB 1998) (%) | 75 | 55.4 -26% | 56 -25% | 60 -20% | 54 -28% | 55.4 -26% | 59 -21% | 44.8 -40% |
| Color Space (Percent of sRGB) (%) | 100 | 84.4 -16% | 85 -15% | 92 -8% | 82 -18% | 84.8 -15% | 91 -9% | 70.1 -30% |
| Totaal Gemiddelde (Programma / Instellingen) | 17% /
39% | 10% /
23% | 4% /
21% | 9% /
22% | 3% /
21% | 8% /
28% | -12% /
-1% |
* ... kleiner is beter
Responstijd Scherm
| ↔ Responstijd Zwart naar Wit | ||
|---|---|---|
| 24.4 ms ... stijging ↗ en daling ↘ gecombineerd | ↗ 20 ms stijging | 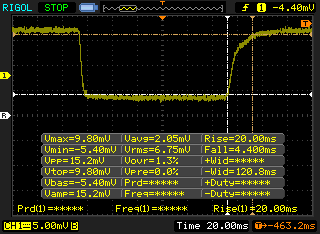 |
| ↘ 4.4 ms daling | ||
| Het scherm vertoonde prima responstijden in onze tests maar is misschien wat te traag voor competitieve games. Ter vergelijking: alle testtoestellen variëren van 0.1 (minimum) tot 240 (maximum) ms. » 58 % van alle toestellen zijn beter. Dit betekent dat de gemeten responstijd slechter is dan het gemiddelde (19.8 ms) van alle geteste toestellen. | ||
| ↔ Responstijd 50% Grijs naar 80% Grijs | ||
| 49.6 ms ... stijging ↗ en daling ↘ gecombineerd | ↗ 24.8 ms stijging | 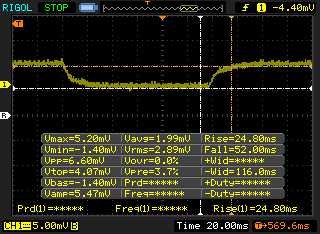 |
| ↘ 24.8 ms daling | ||
| Het scherm vertoonde trage responstijden in onze tests en is misschien te traag voor games. Ter vergelijking: alle testtoestellen variëren van 0.165 (minimum) tot 636 (maximum) ms. » 86 % van alle toestellen zijn beter. Dit betekent dat de gemeten responstijd slechter is dan het gemiddelde (30.9 ms) van alle geteste toestellen. | ||
Screen Flickering / PWM (Pulse-Width Modulation)
| Screen flickering / PWM waargenomen | 25510 Hz | ≤ 20 % helderheid instelling | 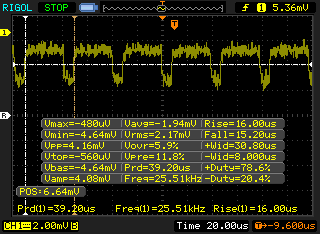 |
De achtergrondverlichting van het scherm flikkert op 25510 Hz (in het slechtste geval, bijvoorbeeld bij gebruik van PWM) aan een helderheid van 20 % en lager. Boven deze helderheid zou er geen flickering / PWM mogen optreden. De frequentie van 25510 Hz is redelijk hoog en de meeste mensen die gevoelig zijn aan flickering zouden dit dus niet mogen waarnemen of geïrriteerde ogen krijgen. Ter vergelijking: 52 % van alle geteste toestellen maakten geen gebruik van PWM om de schermhelderheid te verlagen. Als het wel werd gebruikt, werd een gemiddelde van 7748 (minimum: 5 - maximum: 343500) Hz waargenomen. | |||
| Cinebench R15 | |
| CPU Single 64Bit | |
| Aorus X9 | |
| Alienware 15 R3 Max-Q | |
| Lenovo Legion Y920-17IKB | |
| HP Omen 15-ce002ng | |
| Asus Strix GL502VM-DS74 | |
| Gigabyte P55W v7 | |
| Samsung Odyssey NP800G5M-X01US | |
| Lenovo Legion Y520-15IKBM 80YY001APB | |
| Acer Aspire VX15 VX5-591G-589S | |
| MSI GF62VR 7RF-877 | |
| Dell Inspiron 15 7566 PL | |
| MSI GE62VR 6RF-001US | |
| CPU Multi 64Bit | |
| Aorus X9 | |
| Lenovo Legion Y920-17IKB | |
| Lenovo Legion Y920-17IKB | |
| Alienware 15 R3 Max-Q | |
| Asus Strix GL502VM-DS74 | |
| HP Omen 15-ce002ng | |
| Samsung Odyssey NP800G5M-X01US | |
| MSI GF62VR 7RF-877 | |
| Gigabyte P55W v7 | |
| Dell Inspiron 15 7566 PL | |
| MSI GE62VR 6RF-001US | |
| Lenovo Legion Y520-15IKBM 80YY001APB | |
| Acer Aspire VX15 VX5-591G-589S | |
| wPrime 2.10 - 1024m | |
| Lenovo Legion Y520-15IKBM 80YY001APB | |
| Lenovo Legion Y920-17IKB | |
| Dell Inspiron 15 7566 PL | |
| MSI GE62VR 6RF-001US | |
| MSI GF62VR 7RF-877 | |
| Asus Strix GL502VM-DS74 | |
| Samsung Odyssey NP800G5M-X01US | |
* ... kleiner is beter
| PCMark 8 Home Score Accelerated v2 | 4069 punten | |
| PCMark 8 Creative Score Accelerated v2 | 5136 punten | |
| PCMark 8 Work Score Accelerated v2 | 5090 punten | |
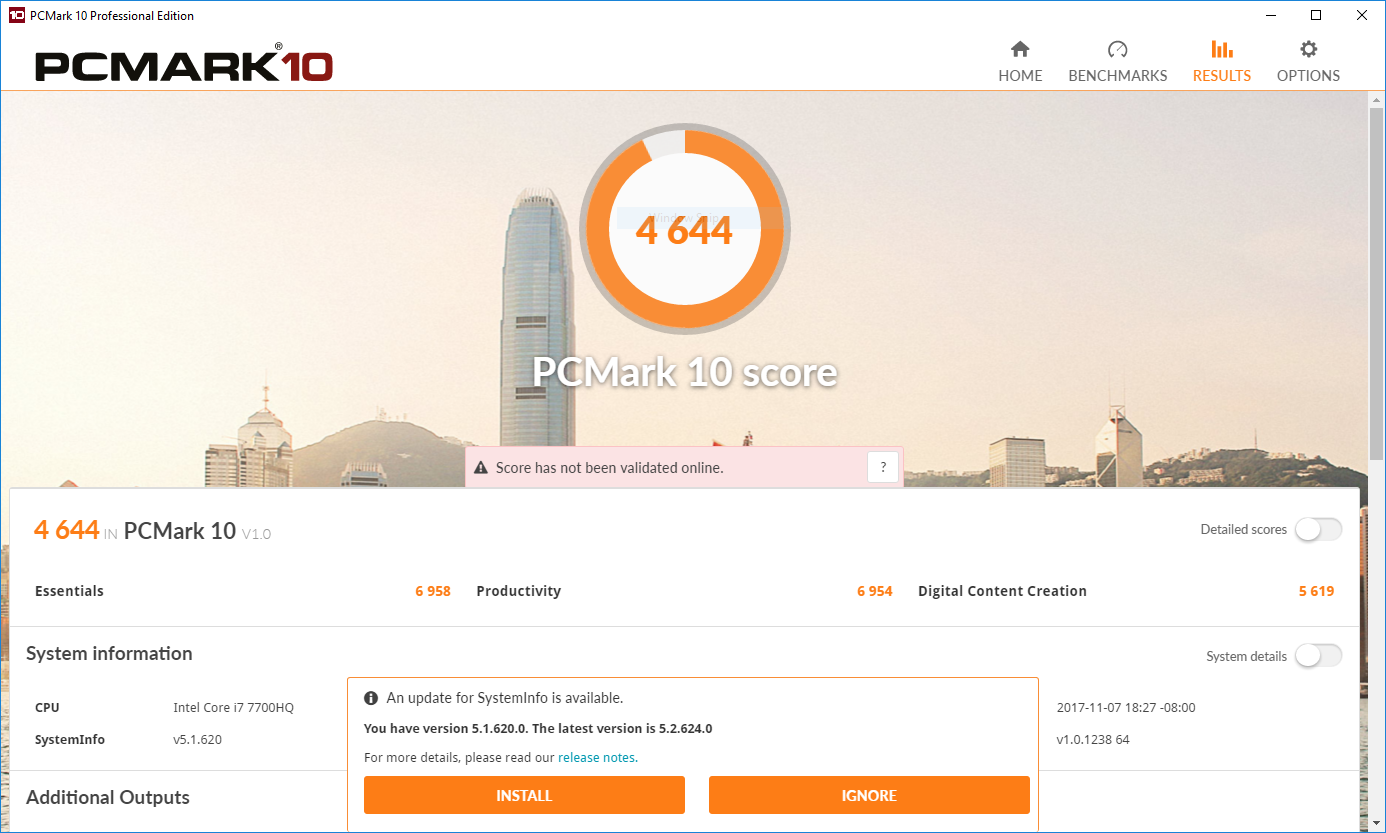
| PCMark 10 Score | 4644 punten | |
Help | ||
| MSI GF62VR 7RF-877 Intel SSD 600p SSDPEKKW256G7 | MSI GE62VR 6RF-001US Samsung SM951 MZVPV512HDGL m.2 PCI-e | Lenovo Legion Y520-15IKBM 80YY001APB ADATA SX7000NP 256 GB | Schenker XMG A517 Samsung SSD 960 Evo 500GB m.2 NVMe | Gigabyte P55W v7 Liteonit CV3-8D256 | Asus Strix GL502VM-DS74 Samsung SSD 960 Evo 250GB m.2 NVMe | Samsung Odyssey NP800G5M-X01US Samsung PM961 NVMe MZVLW128HEGR | Dell Inspiron 15 7566 PL Toshiba SG5 THNSNK128GVN8 | Acer Aspire VX15 VX5-591G-589S Hynix HFS128G39TND | |
|---|---|---|---|---|---|---|---|---|---|
| AS SSD | 93% | 4% | 180% | -41% | 39% | 33% | -50% | -89% | |
| Copy Game MB/s (MB/s) | 471.7 | 898 90% | 1100 133% | 240.5 -49% | 157.6 -67% | ||||
| Copy Program MB/s (MB/s) | 286.5 | 403.5 41% | 483.6 69% | 299.5 5% | 111.1 -61% | ||||
| Copy ISO MB/s (MB/s) | 1069 | 1225 15% | 1599 50% | 1560 46% | 195 -82% | ||||
| Score Total (Points) | 1324 | 2572 94% | 898 -32% | 4063 207% | 840 -37% | 3501 164% | 1592 20% | 710 -46% | 882 -33% |
| Score Write (Points) | 693 | 581 -16% | 291 -58% | 1575 127% | 248 -64% | 1028 48% | 376 -46% | 218 -69% | 218 -69% |
| Score Read (Points) | 448 | 1327 196% | 409 -9% | 1677 274% | 393 -12% | 1670 273% | 852 90% | 332 -26% | 444 -1% |
| Access Time Write * (ms) | 0.03 | 0.038 -27% | 0.033 -10% | 0.026 13% | 0.083 -177% | 0.3 -900% | 0.031 -3% | 0.08 -167% | 0.261 -770% |
| Access Time Read * (ms) | 0.09 | 0.039 57% | 0.069 23% | 0.036 60% | 0.088 2% | 0.41 -356% | 0.066 27% | 0.099 -10% | 0.077 14% |
| 4K-64 Write (MB/s) | 551 | 329.8 -40% | 100.7 -82% | 1263 129% | 166.6 -70% | 768 39% | 176.4 -68% | 111.8 -80% | 113.9 -79% |
| 4K-64 Read (MB/s) | 280.1 | 1092 290% | 255.9 -9% | 1359 385% | 318.3 14% | 1375 391% | 564 101% | 256.9 -8% | 361.4 29% |
| 4K Write (MB/s) | 118.3 | 103 -13% | 110.6 -7% | 147 24% | 48.47 -59% | 118 0% | 124.1 5% | 92.6 -22% | 90.8 -23% |
| 4K Read (MB/s) | 31.27 | 44.04 41% | 30.9 -1% | 48 54% | 23.34 -25% | 44.55 42% | 44.75 43% | 25.39 -19% | 32.29 3% |
| Seq Write (MB/s) | 234.9 | 1480 530% | 795 238% | 1662 608% | 328.1 40% | 1424 506% | 752 220% | 134.1 -43% | 130.2 -45% |
| Seq Read (MB/s) | 1371 | 1912 39% | 1221 -11% | 2694 96% | 514 -63% | 2505 83% | 2433 77% | 493.2 -64% | 507 -63% |
* ... kleiner is beter

| 3DMark | |
| 1280x720 Cloud Gate Standard Graphics | |
| Aorus X9 | |
| MSI GT75VR 7RF-012 Titan Pro | |
| Alienware 15 R3 Max-Q | |
| MSI GF62VR 7RF-877 | |
| Asus Strix GL502VM-DS74 | |
| Lenovo Legion Y920-17IKB | |
| MSI GE62VR 6RF-001US | |
| Lenovo Legion Y520-15IKBM 80YY001APB | |
| Gigabyte P55W v7 | |
| Acer Predator 15 G9-592-7925 | |
| Acer Aspire Nitro BE VN7-793G-5811 | |
| Asus Strix GL502VT-DS74 | |
| Samsung Odyssey NP800G5M-X01US | |
| 1920x1080 Fire Strike Graphics | |
| Aorus X9 | |
| MSI GT75VR 7RF-012 Titan Pro | |
| Alienware 15 R3 Max-Q | |
| Lenovo Legion Y920-17IKB | |
| MSI GF62VR 7RF-877 | |
| MSI GE62VR 6RF-001US | |
| Gigabyte P55W v7 | |
| Asus Strix GL502VM-DS74 | |
| Lenovo Legion Y520-15IKBM 80YY001APB | |
| Acer Aspire Nitro BE VN7-793G-5811 | |
| Acer Predator 15 G9-592-7925 | |
| Asus Strix GL502VT-DS74 | |
| Samsung Odyssey NP800G5M-X01US | |
| 1920x1080 Ice Storm Extreme Graphics | |
| Alienware 15 R3 Max-Q | |
| Asus Strix GL502VM-DS74 | |
| Acer Aspire Nitro BE VN7-793G-5811 | |
| MSI GF62VR 7RF-877 | |
| Asus Strix GL502VT-DS74 | |
| Samsung Odyssey NP800G5M-X01US | |
| MSI GE62VR 6RF-001US | |
| Lenovo Legion Y520-15IKBM 80YY001APB | |
| 3DMark Ice Storm Standard Score | 116682 punten | |
| 3DMark Cloud Gate Standard Score | 25422 punten | |
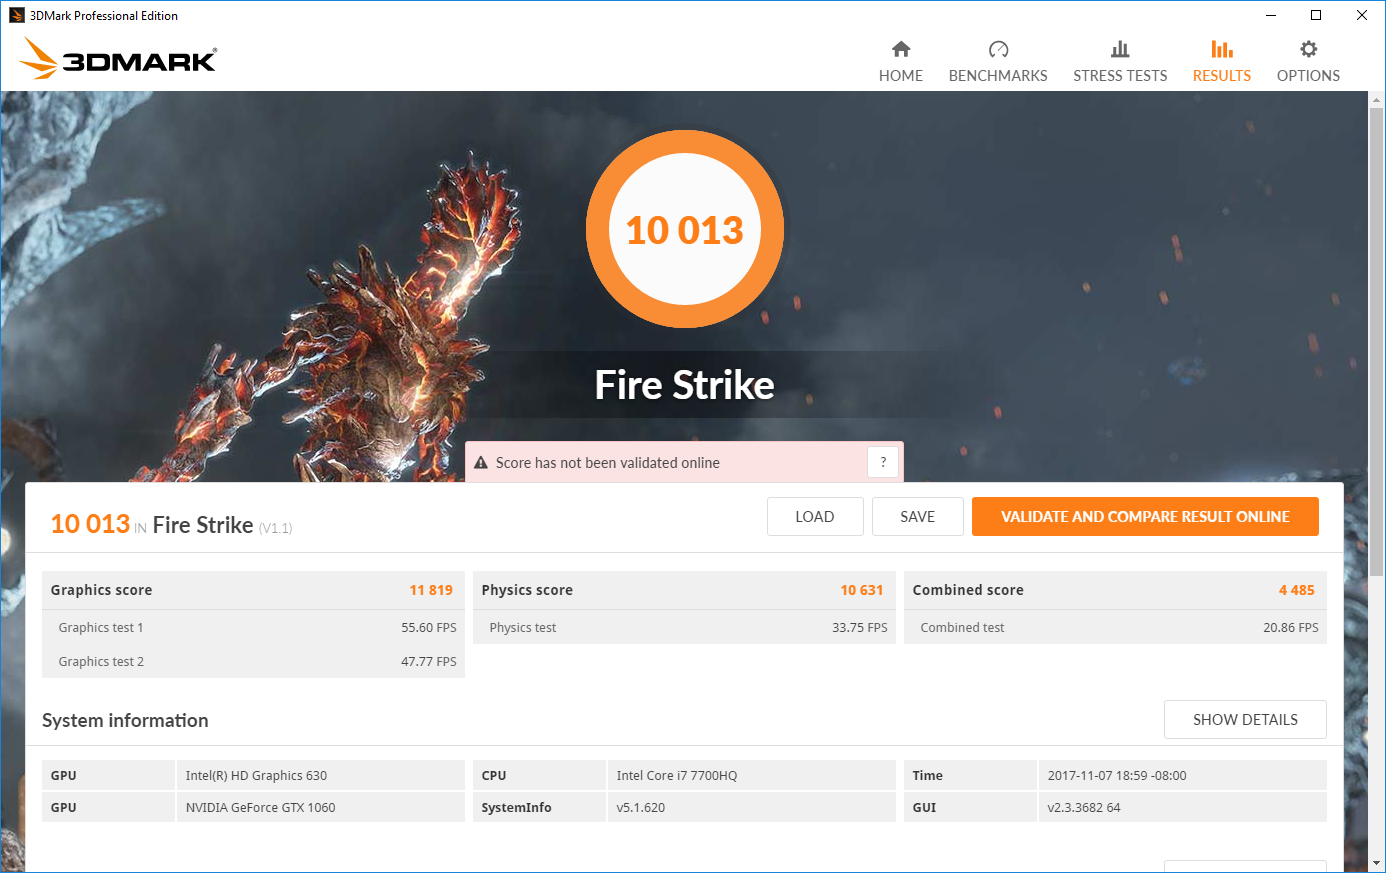
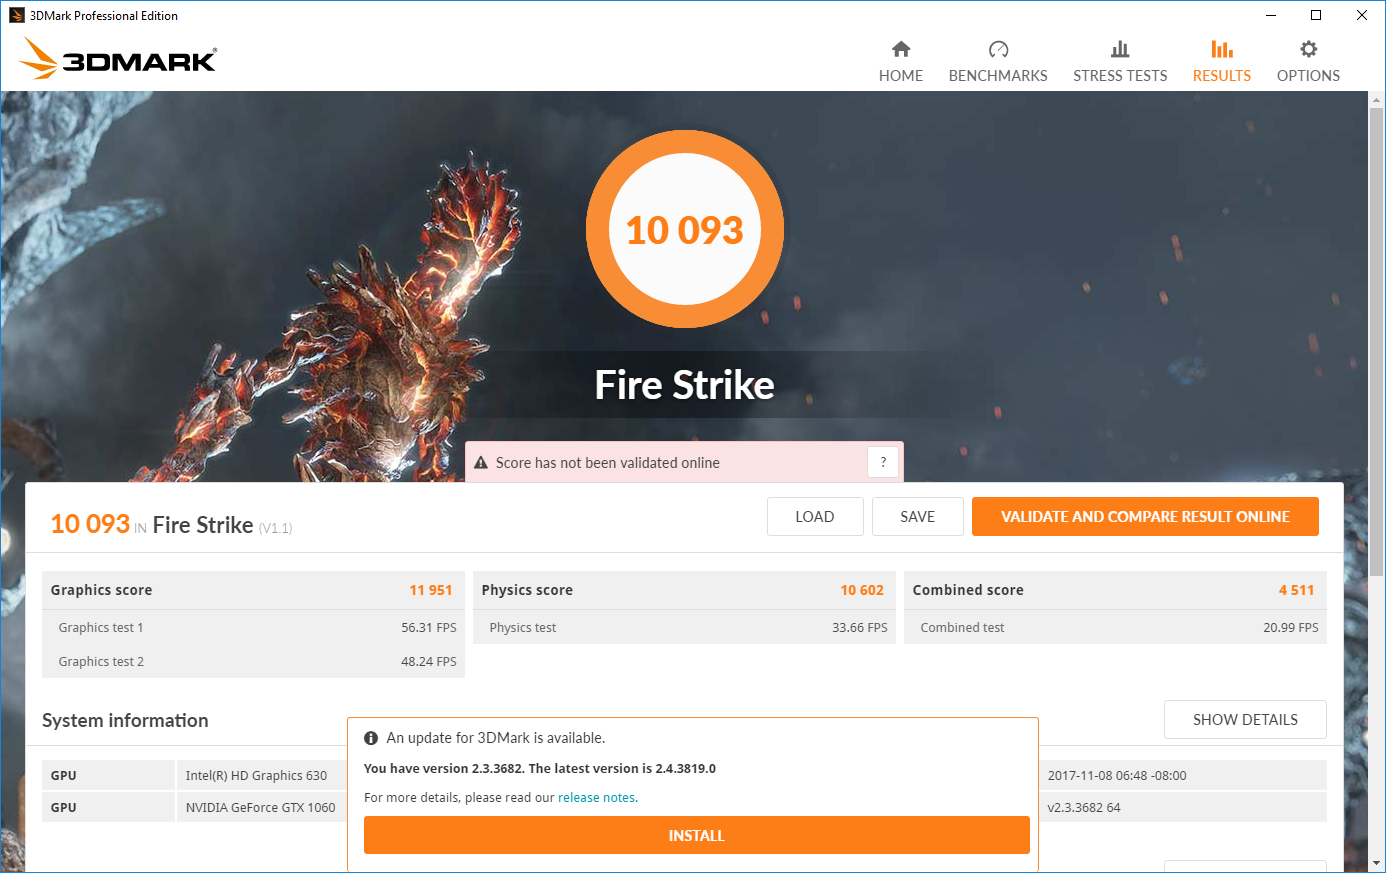
| 3DMark Fire Strike Score | 10093 punten | |
| 3DMark Fire Strike Extreme Score | 5256 punten | |
Help | ||
| BioShock Infinite - 1920x1080 Ultra Preset, DX11 (DDOF) | |
| Alienware 15 R3 Max-Q | |
| Lenovo Legion Y920-17IKB | |
| MSI GF62VR 7RF-877 | |
| Asus FX502VM-AS73 | |
| MSI GS63VR 7RF-228US | |
| Hyperbook N85-7300-8-12-1060 | |
| MSI GE72VR-6RF16H21 | |
| MSI GE62VR 6RF-001US | |
| Lenovo Legion Y520-15IKBM 80YY001APB | |
| Acer Aspire Nitro BE VN7-793G-5811 | |
| Acer Aspire VX15 VX5-591G-589S | |
| Dell Inspiron 15 7566 PL | |
| Metro: Last Light - 1920x1080 Very High (DX11) AF:16x | |
| Lenovo Legion Y920-17IKB | |
| Asus FX502VM-AS73 | |
| MSI GS63VR 7RF-228US | |
| MSI GF62VR 7RF-877 | |
| MSI GE62VR 6RF-001US | |
| Thief - 1920x1080 Very High Preset AA:FXAA & High SS AF:8x | |
| Lenovo Legion Y920-17IKB | |
| Asus FX502VM-AS73 | |
| MSI GS63VR 7RF-228US | |
| MSI GF62VR 7RF-877 | |
| MSI GE62VR 6RF-001US | |
| Hyperbook N85-7300-8-12-1060 | |
| Lenovo Legion Y520-15IKBM 80YY001APB | |
| Dell Inspiron 15 7566 PL | |
| The Witcher 3 | |
| 1920x1080 Ultra Graphics & Postprocessing (HBAO+) | |
| Aorus X9 | |
| Alienware 15 R3 Max-Q | |
| Lenovo Legion Y920-17IKB | |
| Lenovo Legion Y920-17IKB | |
| MSI GS63VR 7RF-228US | |
| Hyperbook N85-7300-8-12-1060 | |
| MSI GF62VR 7RF-877 | |
| Gigabyte P55W v7 | |
| Gigabyte Aero 15 | |
| MSI GE72VR-6RF16H21 | |
| Lenovo Legion Y520-15IKBM 80YY001APB | |
| HP Omen 15-ce002ng | |
| Acer Aspire Nitro BE VN7-793G-5811 | |
| Dell Inspiron 15 7566 PL | |
| 1920x1080 High Graphics & Postprocessing (Nvidia HairWorks Off) | |
| Aorus X9 | |
| Alienware 15 R3 Max-Q | |
| MSI GS63VR 7RF-228US | |
| Gigabyte P55W v7 | |
| Gigabyte Aero 15 | |
| MSI GF62VR 7RF-877 | |
| MSI GE72VR-6RF16H21 | |
| HP Omen 15-ce002ng | |
| Hyperbook N85-7300-8-12-1060 | |
| Lenovo Legion Y520-15IKBM 80YY001APB | |
| Acer Aspire Nitro BE VN7-793G-5811 | |
| Dell Inspiron 15 7566 PL | |
| Fallout 4 | |
| 1920x1080 Ultra Preset AA:T AF:16x | |
| Asus FX502VM-AS73 | |
| MSI GF62VR 7RF-877 | |
| MSI GS63VR 7RF-228US | |
| MSI GE62VR 6RF-001US | |
| 1920x1080 High Preset AA:T AF:16x | |
| MSI GF62VR 7RF-877 | |
| Rise of the Tomb Raider | |
| 1920x1080 Very High Preset AA:FX AF:16x | |
| Lenovo Legion Y920-17IKB | |
| MSI GS63VR 7RF-228US | |
| Gigabyte P55W v7 | |
| Asus FX502VM-AS73 | |
| MSI GF62VR 7RF-877 | |
| MSI GE72VR-6RF16H21 | |
| MSI GE62VR 6RF-001US | |
| HP Omen 15-ce002ng | |
| 1920x1080 High Preset AA:FX AF:4x | |
| MSI GF62VR 7RF-877 | |
| Gigabyte P55W v7 | |
| MSI GE72VR-6RF16H21 | |
| HP Omen 15-ce002ng | |
| Hitman 2016 | |
| 1920x1080 Ultra / On AA:SM AF:16x | |
| MSI GF62VR 7RF-877 | |
| 1920x1080 High / On AA:FX AF:8x | |
| MSI GF62VR 7RF-877 | |
| Doom | |
| 1920x1080 Ultra Preset AA:SM | |
| Asus FX502VM-AS73 | |
| MSI GF62VR 7RF-877 | |
| MSI GS63VR 7RF-228US | |
| HP Omen 15-ce002ng | |
| MSI GE62VR 6RF-001US | |
| 1920x1080 High Preset AA:FX | |
| MSI GF62VR 7RF-877 | |
| HP Omen 15-ce002ng | |
| Rocket League | |
| 1920x1080 High Quality AA:High FX | |
| Aorus X9 | |
| MSI GF62VR 7RF-877 | |
| HP Omen 15-ce002ng | |
| 3840x2160 High Quality AA:High FX | |
| Aorus X9 | |
| MSI GF62VR 7RF-877 | |
| HP Omen 15-ce002ng | |
| 1920x1080 Quality AA:Medium FX | |
| MSI GF62VR 7RF-877 | |
| HP Omen 15-ce002ng | |
| Dirt 4 | |
| 3840x2160 Ultra Preset AF:16x | |
| MSI GF62VR 7RF-877 | |
| 1920x1080 Ultra Preset AA:4xMS AF:16x | |
| Aorus X9 | |
| MSI GF62VR 7RF-877 | |
| HP Omen 15-ce002ng | |
| 1920x1080 High Preset AA:2xMS AF:8x | |
| Aorus X9 | |
| MSI GF62VR 7RF-877 | |
| HP Omen 15-ce002ng | |
| Playerunknown's Battlegrounds (PUBG) | |
| 1920x1080 Ultra Preset | |
| Aorus X9 | |
| MSI GF62VR 7RF-877 | |
| 1920x1080 High Preset | |
| Aorus X9 | |
| MSI GF62VR 7RF-877 | |
| lage | gem. | hoge | ultra | 4K | |
|---|---|---|---|---|---|
| BioShock Infinite (2013) | 108 | ||||
| Metro: Last Light (2013) | 75 | ||||
| Thief (2014) | 71 | ||||
| The Witcher 3 (2015) | 68 | 39 | |||
| Batman: Arkham Knight (2015) | 86 | 61 | |||
| Metal Gear Solid V (2015) | 60 | 60 | |||
| Fallout 4 (2015) | 83 | 69 | |||
| Just Cause 3 (2015) | 79 | 70 | |||
| Rise of the Tomb Raider (2016) | 73 | 60 | |||
| Hitman 2016 (2016) | 58 | 51 | |||
| Ashes of the Singularity (2016) | 45 | ||||
| Doom (2016) | 99 | 93 | |||
| Mafia 3 (2016) | 48 | 40 | |||
| Farming Simulator 17 (2016) | 162 | 150 | |||
| Resident Evil 7 (2017) | 104 | 83 | |||
| Rocket League (2017) | 238 | 171 | 64 | ||
| Dirt 4 (2017) | 98 | 58 | 31 | ||
| Playerunknown's Battlegrounds (PUBG) (2017) | 69 | 53 |
Geluidsniveau
| Onbelast |
| 33.5 / 33.5 / 33.5 dB (A) |
| Belasting |
| 41.3 / 53.5 dB (A) |
 | ||
30 dB stil 40 dB(A) hoorbaar 50 dB(A) luid |
||
min: | ||
| MSI GF62VR 7RF-877 GeForce GTX 1060 Mobile, i7-7700HQ, Intel SSD 600p SSDPEKKW256G7 | MSI GE62VR 6RF-001US GeForce GTX 1060 Mobile, 6700HQ, Samsung SM951 MZVPV512HDGL m.2 PCI-e | Gigabyte P55W v7 GeForce GTX 1060 Mobile, i7-7700HQ, Liteonit CV3-8D256 | Lenovo Legion Y520-15IKBM 80YY001APB GeForce GTX 1060 Max-Q, i5-7300HQ, ADATA SX7000NP 256 GB | Schenker XMG A517 GeForce GTX 1060 Mobile, i7-7700HQ, Samsung SSD 960 Evo 500GB m.2 NVMe | Gigabyte Aero 15 GeForce GTX 1060 Mobile, i7-7700HQ, Lite-On CX2-8B512-Q11 | Asus Strix GL502VM-DS74 GeForce GTX 1060 Mobile, i7-7700HQ, Samsung SSD 960 Evo 250GB m.2 NVMe | HP Omen 15-ce002ng GeForce GTX 1060 Max-Q, i7-7700HQ, Samsung PM961 MZVLW256HEHP | Samsung Odyssey NP800G5M-X01US GeForce GTX 1050 Mobile, i7-7700HQ, Samsung PM961 NVMe MZVLW128HEGR | |
|---|---|---|---|---|---|---|---|---|---|
| Noise | 0% | 0% | 6% | -1% | 3% | -2% | 2% | 5% | |
| uit / omgeving * (dB) | 28.1 | 28.2 -0% | 30 -7% | 30 -7% | 31 -10% | 30.8 -10% | 30 -7% | 28.1 -0% | |
| Idle Minimum * (dB) | 33.5 | 32.8 2% | 33 1% | 30.5 9% | 30 10% | 32 4% | 32 4% | 30 10% | 28.1 16% |
| Idle Average * (dB) | 33.5 | 32.9 2% | 34 -1% | 33 1% | 35 -4% | 33 1% | 32 4% | 33 1% | 29.1 13% |
| Idle Maximum * (dB) | 33.5 | 32.9 2% | 35 -4% | 36.1 -8% | 40 -19% | 34 -1% | 32 4% | 37 -10% | 29.1 13% |
| Load Average * (dB) | 41.3 | 41.6 -1% | 39 6% | 39.4 5% | 43 -4% | 39 6% | 48.3 -17% | 41 1% | 49.2 -19% |
| Witcher 3 ultra * (dB) | 48.5 | 43 11% | 43 11% | 42 13% | |||||
| Load Maximum * (dB) | 53.5 | 55 -3% | 50 7% | 41.5 22% | 49 8% | 50 7% | 51.2 4% | 50 7% | 49.2 8% |
* ... kleiner is beter
(-) De maximumtemperatuur aan de bovenzijde bedraagt 48.2 °C / 119 F, vergeleken met het gemiddelde van 40.4 °C / 105 F, variërend van 21.2 tot 68.8 °C voor de klasse Gaming.
(-) De bodem warmt op tot een maximum van 46 °C / 115 F, vergeleken met een gemiddelde van 43.2 °C / 110 F
(+) Bij onbelast gebruik bedraagt de gemiddelde temperatuur voor de bovenzijde 29.8 °C / 86 F, vergeleken met het apparaatgemiddelde van 33.9 °C / 93 F.
(±) Bij het spelen van The Witcher 3 is de gemiddelde temperatuur voor de bovenzijde 37.9 °C / 100 F, vergeleken met het apparaatgemiddelde van 33.9 °C / 93 F.
(-) De palmsteunen en het touchpad kunnen zeer heet aanvoelen met een maximum van ###max## °C / 111.6 F.
(-) De gemiddelde temperatuur van de handpalmsteun van soortgelijke toestellen bedroeg 28.8 °C / 83.8 F (-15.4 °C / -27.8 F).
MSI GF62VR 7RF-877 audioanalyse
(+) | luidsprekers kunnen relatief luid spelen (84.9 dB)
Bas 100 - 315 Hz
(-) | bijna geen lage tonen - gemiddeld 27.4% lager dan de mediaan
(±) | lineariteit van de lage tonen is gemiddeld (10.4% delta ten opzichte van de vorige frequentie)
Midden 400 - 2000 Hz
(±) | hogere middens - gemiddeld 8.5% hoger dan de mediaan
(±) | lineariteit van de middentonen is gemiddeld (9.5% delta ten opzichte van de vorige frequentie)
Hoog 2 - 16 kHz
(±) | higher highs - on average 8% higher than median
(±) | lineariteit van de hoogtepunten is gemiddeld (8% delta ten opzichte van de vorige frequentie)
Algemeen 100 - 16.000 Hz
(-) | het totale geluid is niet lineair (31.8% verschil met de mediaan)
Vergeleken met dezelfde klasse
» 97% van alle geteste apparaten in deze klasse waren beter, 1% vergelijkbaar, 2% slechter
» De beste had een delta van 6%, het gemiddelde was 18%, de slechtste was 132%
Vergeleken met alle geteste toestellen
» 91% van alle geteste apparaten waren beter, 2% gelijk, 7% slechter
» De beste had een delta van 4%, het gemiddelde was 23%, de slechtste was 134%
MSI GE62VR 6RF-001US audioanalyse
(±) | luidspreker luidheid is gemiddeld maar goed (76.9 dB)
Bas 100 - 315 Hz
(±) | verminderde zeebaars - gemiddeld 13.1% lager dan de mediaan
(±) | lineariteit van de lage tonen is gemiddeld (12% delta ten opzichte van de vorige frequentie)
Midden 400 - 2000 Hz
(+) | evenwichtige middens - slechts 3% verwijderd van de mediaan
(±) | lineariteit van de middentonen is gemiddeld (12% delta ten opzichte van de vorige frequentie)
Hoog 2 - 16 kHz
(+) | evenwichtige hoogtepunten - slechts 4.4% verwijderd van de mediaan
(±) | lineariteit van de hoogtepunten is gemiddeld (10.1% delta ten opzichte van de vorige frequentie)
Algemeen 100 - 16.000 Hz
(±) | lineariteit van het totale geluid is gemiddeld (18.6% verschil met de mediaan)
Vergeleken met dezelfde klasse
» 61% van alle geteste apparaten in deze klasse waren beter, 9% vergelijkbaar, 31% slechter
» De beste had een delta van 6%, het gemiddelde was 18%, de slechtste was 132%
Vergeleken met alle geteste toestellen
» 42% van alle geteste apparaten waren beter, 8% gelijk, 50% slechter
» De beste had een delta van 4%, het gemiddelde was 23%, de slechtste was 134%
| Uit / Standby | |
| Inactief | |
| Belasting |
|
Key:
min: | |
| MSI GF62VR 7RF-877 i7-7700HQ, GeForce GTX 1060 Mobile, Intel SSD 600p SSDPEKKW256G7, TN LED, 1920x1080, 15.6" | MSI GE62VR 6RF-001US 6700HQ, GeForce GTX 1060 Mobile, Samsung SM951 MZVPV512HDGL m.2 PCI-e, IPS, 1920x1080, 15.6" | Gigabyte P55W v7 i7-7700HQ, GeForce GTX 1060 Mobile, Liteonit CV3-8D256, IPS, 1920x1080, 15.6" | Lenovo Legion Y520-15IKBM 80YY001APB i5-7300HQ, GeForce GTX 1060 Max-Q, ADATA SX7000NP 256 GB, IPS, 1920x1080, 15.6" | Schenker XMG A517 i7-7700HQ, GeForce GTX 1060 Mobile, Samsung SSD 960 Evo 500GB m.2 NVMe, IPS, 1920x1080, 15.6" | Gigabyte Aero 15 i7-7700HQ, GeForce GTX 1060 Mobile, Lite-On CX2-8B512-Q11, IPS, 1920x1080, 15.6" | Asus Strix GL502VM-DS74 i7-7700HQ, GeForce GTX 1060 Mobile, Samsung SSD 960 Evo 250GB m.2 NVMe, IPS, 1920x1080, 15.6" | HP Omen 15-ce002ng i7-7700HQ, GeForce GTX 1060 Max-Q, Samsung PM961 MZVLW256HEHP, IPS, 1920x1080, 15.6" | Samsung Odyssey NP800G5M-X01US i7-7700HQ, GeForce GTX 1050 Mobile, Samsung PM961 NVMe MZVLW128HEGR, IPS, 1920x1080, 15.6" | |
|---|---|---|---|---|---|---|---|---|---|
| Power Consumption | -45% | 21% | 30% | 9% | 9% | -82% | -12% | 34% | |
| Idle Minimum * (Watt) | 16.2 | 25.4 -57% | 8 51% | 3.9 76% | 8 51% | 12 26% | 38.3 -136% | 18 -11% | 6.7 59% |
| Idle Average * (Watt) | 18.2 | 30.3 -66% | 13 29% | 10.7 41% | 12 34% | 15 18% | 40.5 -123% | 23 -26% | 8.9 51% |
| Idle Maximum * (Watt) | 18.9 | 31.5 -67% | 18 5% | 11.2 41% | 25 -32% | 20 -6% | 42.2 -123% | 30 -59% | 10.8 43% |
| Load Average * (Watt) | 82.7 | 111.8 -35% | 76 8% | 111.5 -35% | 85 -3% | 82 1% | 110.4 -33% | 85 -3% | 81.8 1% |
| Witcher 3 ultra * (Watt) | 125.7 | 110 12% | 111 12% | 96 24% | 92.2 27% | ||||
| Load Maximum * (Watt) | 162.3 | 163.2 -1% | 143 12% | 115.5 29% | 180 -11% | 161 1% | 155.7 4% | 158 3% | 122.7 24% |
* ... kleiner is beter
| MSI GF62VR 7RF-877 i7-7700HQ, GeForce GTX 1060 Mobile, 41 Wh | MSI GE62VR 6RF-001US 6700HQ, GeForce GTX 1060 Mobile, 51 Wh | Gigabyte P55W v7 i7-7700HQ, GeForce GTX 1060 Mobile, 63 Wh | Lenovo Legion Y520-15IKBM 80YY001APB i5-7300HQ, GeForce GTX 1060 Max-Q, 45 Wh | Schenker XMG A517 i7-7700HQ, GeForce GTX 1060 Mobile, 62 Wh | Gigabyte Aero 15 i7-7700HQ, GeForce GTX 1060 Mobile, 94.24 Wh | Asus Strix GL502VM-DS74 i7-7700HQ, GeForce GTX 1060 Mobile, 64 Wh | HP Omen 15-ce002ng i7-7700HQ, GeForce GTX 1060 Max-Q, 70 Wh | Samsung Odyssey NP800G5M-X01US i7-7700HQ, GeForce GTX 1050 Mobile, 43 Wh | |
|---|---|---|---|---|---|---|---|---|---|
| Batterijduur | -14% | 235% | 300% | 158% | 239% | -6% | 71% | 161% | |
| Reader / Idle (h) | 2.8 | 2.3 -18% | 13.2 371% | 11.2 300% | 7.5 168% | 10.6 279% | 1.7 -39% | 4.3 54% | 10.2 264% |
| WiFi v1.3 (h) | 1.9 | 1.7 -11% | 5.8 205% | 5 163% | 7 268% | 1.5 -21% | 3.3 74% | 4.4 132% | |
| Load (h) | 0.7 | 0.6 -14% | 1.6 129% | 1.7 143% | 1.9 171% | 1 43% | 1.3 86% | 1.3 86% | |
| WiFi (h) | 4 |
Pro
Contra

Dit is de verkorte versie van het originele artikel. Het volledige, Engelse testrapport vind je hier.
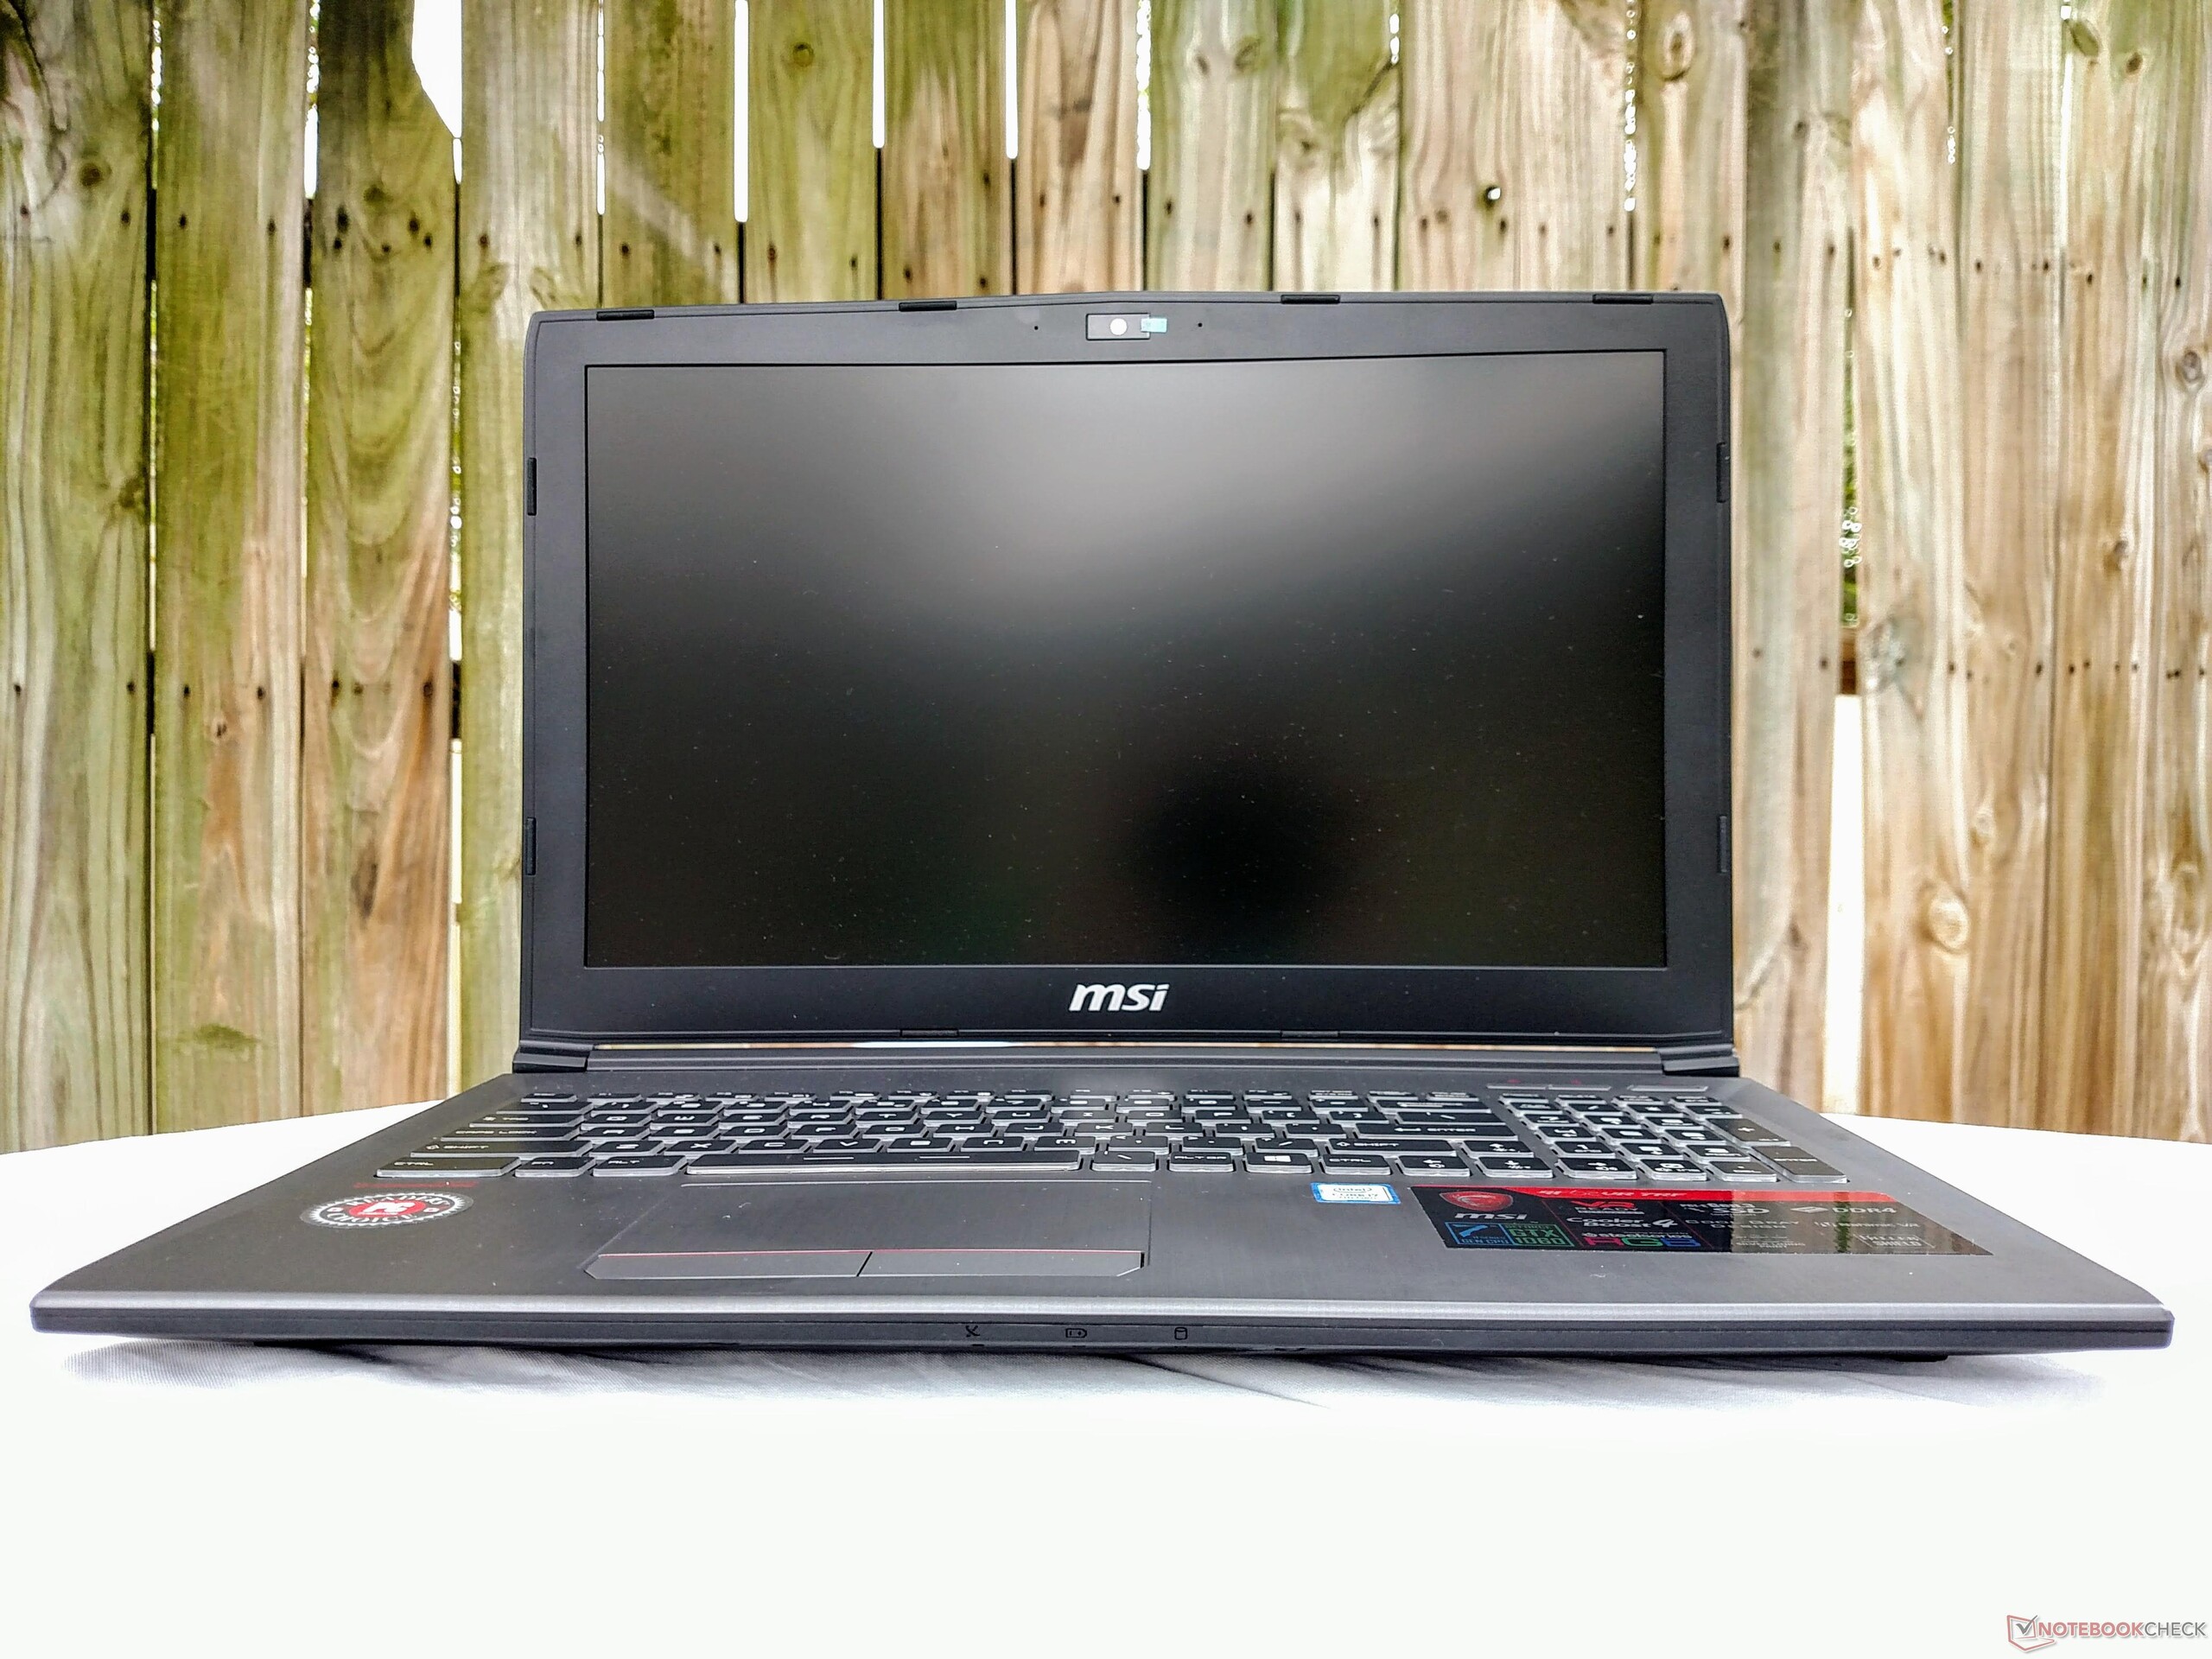
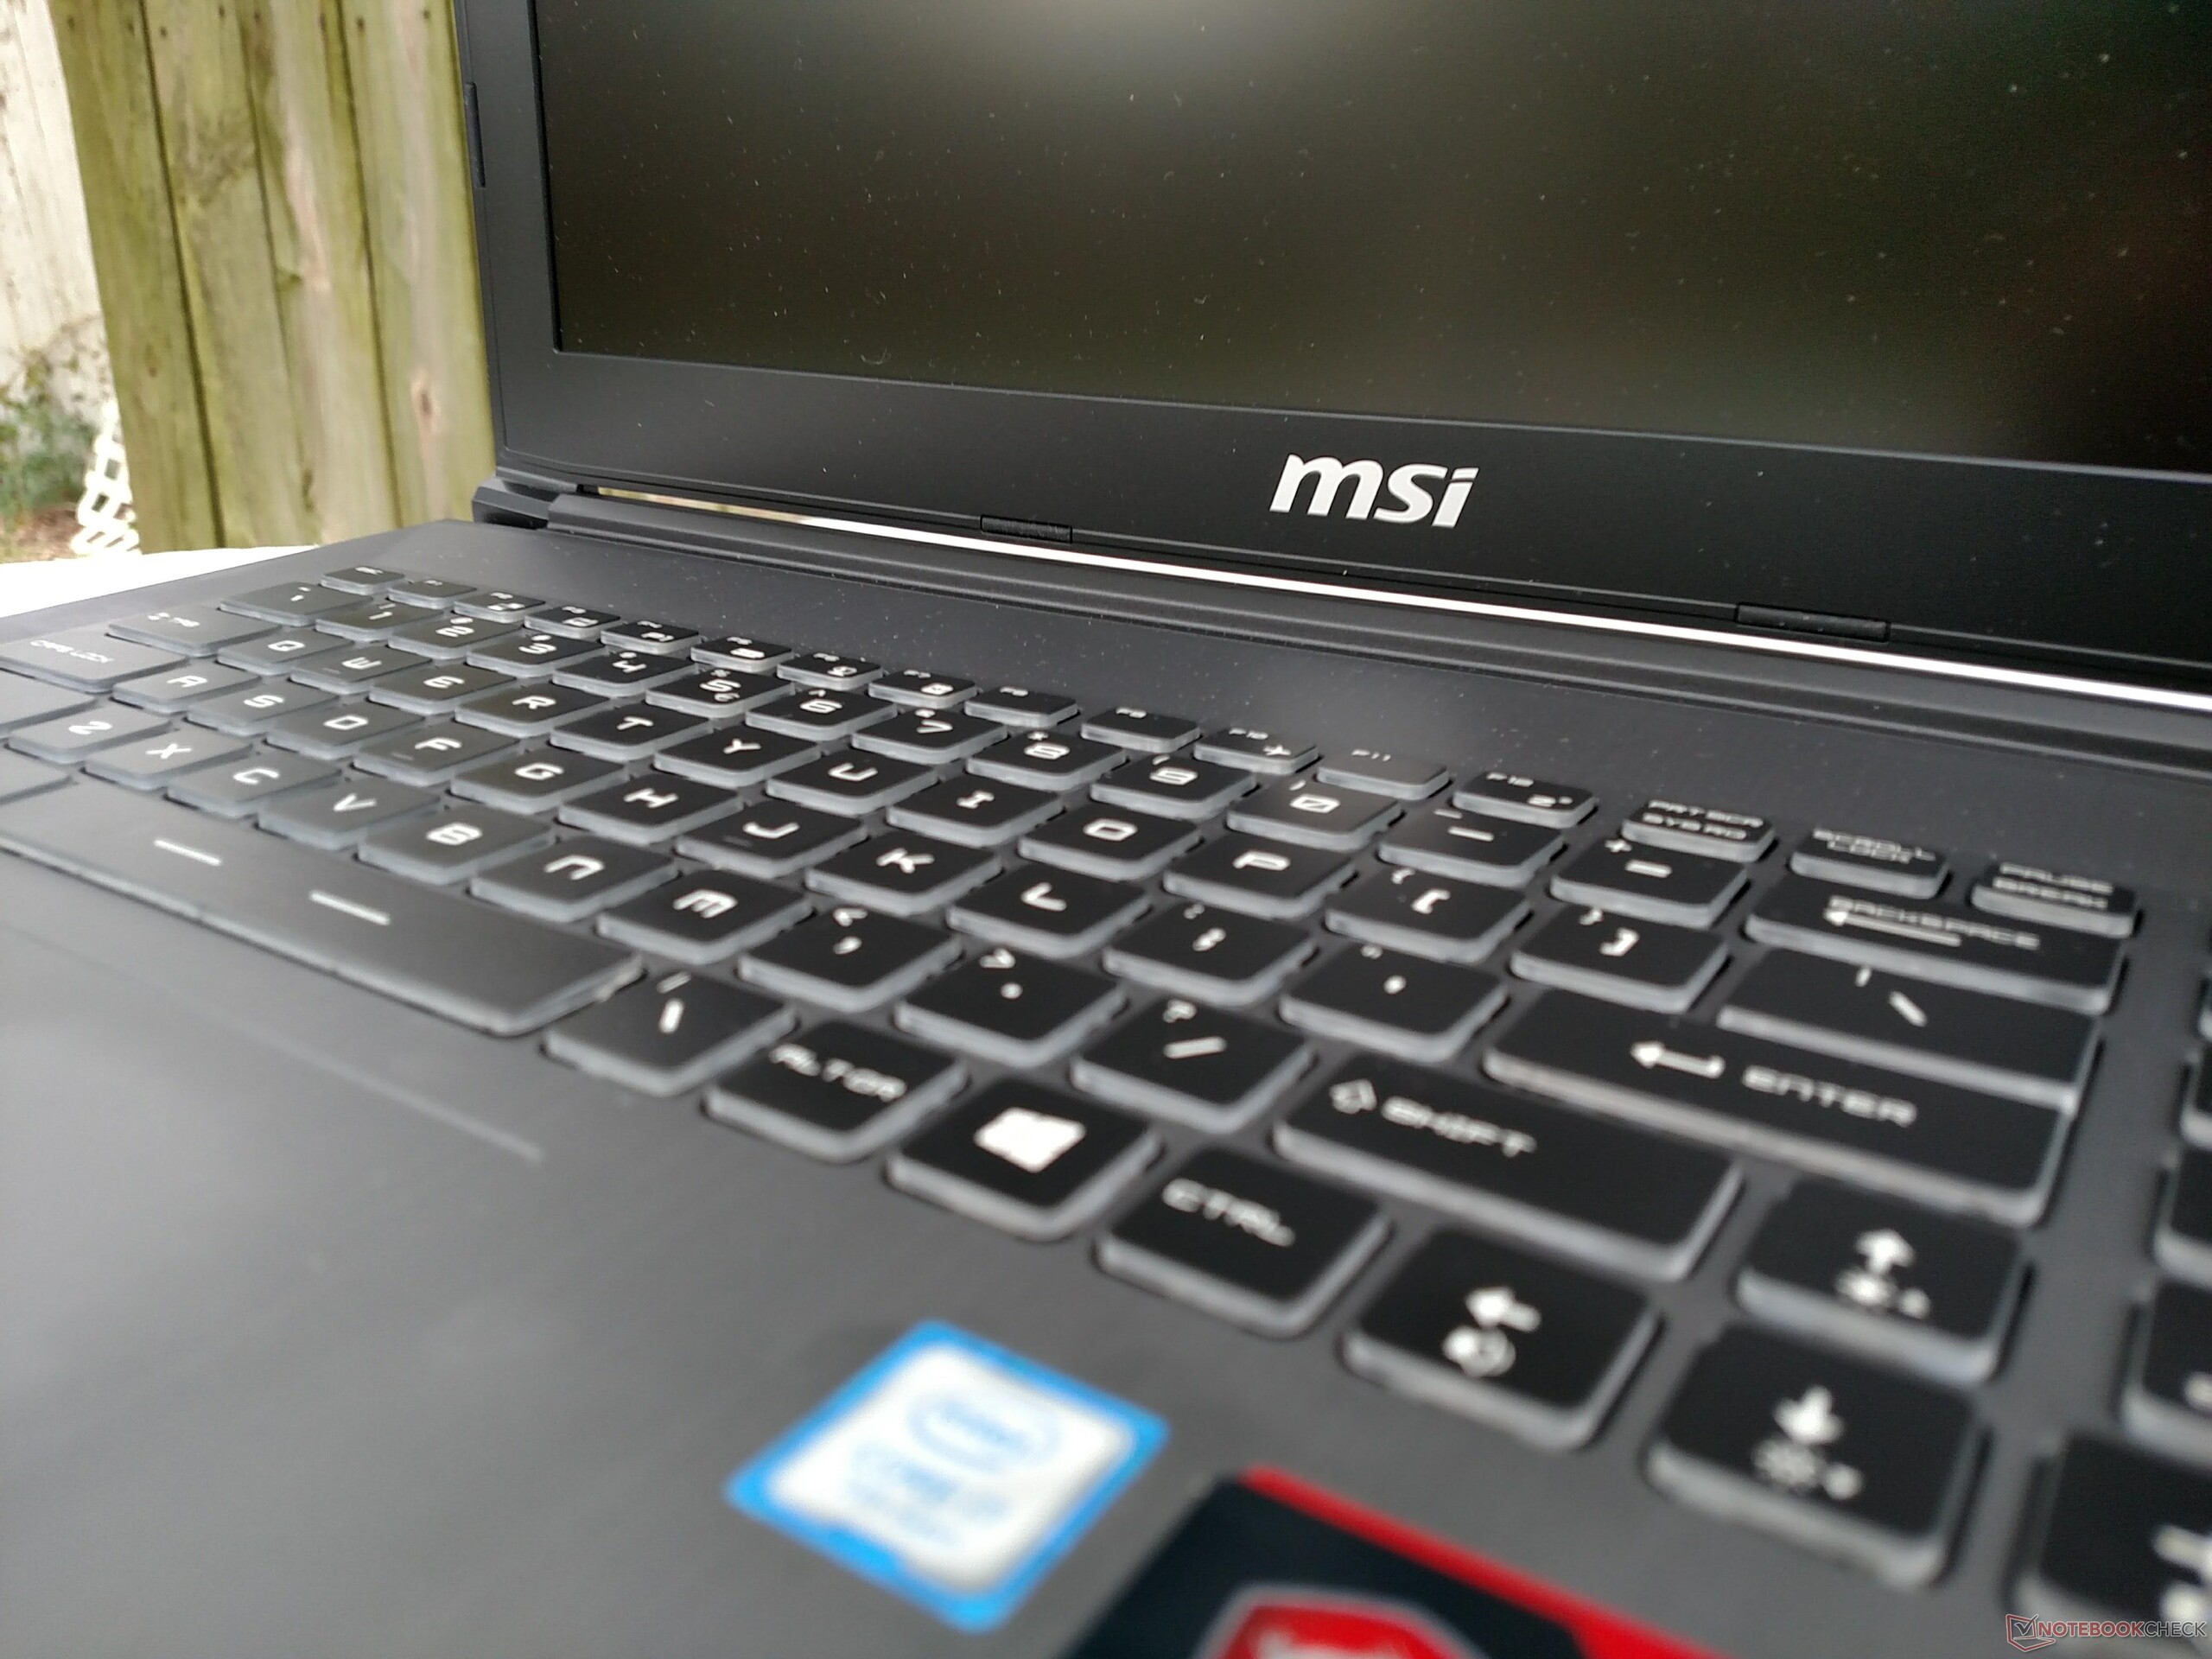
Op papier is er weinig bijzonder aan de MSI GF62VR. Hoewel het toestel goede, consistente prestaties en een kleurrijk scherm te bieden heeft, worden deze kwaliteiten ondermijnd door een TN-scherm van slechte kwaliteit en ventilatoren die een vervelend hoog geluid maken. Het verhaal van de GF62VR is er een van toegevingen; voor elke positief punt is er een negatief. Het eindresultaat is een uitstekende gaming-laptop die op een aantal vlakken tekortschiet (vooral schermkwaliteit, ventilatoren en bouwkwaliteit).
Als we het huidige prijskaartje in overweging nemen, wordt de notebook een stuk aantrekkelijker. De GF62VR valt met zijn $1300 in de prijsklasse voor notebooks met een GTX 1050 Ti. De meeste laptops met vergelijkbare componenten starten pas bij $200-300 meer. Voeg hieraan toe dat de gaming-prestaties die van de concurrentie overtreffen en de GF62VR wordt plots een koopje van een gaming-laptop.
Potentiële kopers dienen echter ook vrede te nemen met een groot minpunt. Voor de uitstekende prijs/prestaties-verhouding, krijg je ook een (laat ons eerlijk zijn) verschrikkelijk scherm dat smeekt om kalibratie, luidruchtige ventilatoren en een plastic behuizing dat faalt in het imiteren van een meer hoogwaardige behuizing. Voor sommige consumenten zijn dit misschien aanvaardbare opofferingen.
Voor gamers die weinig geven om esthetiek en gewoon onderweg willen gamen is de GF62VR een uitstekende keuze. De belangrijkste concurrent van de GF62VR is in feite zijn voorganger, de GE62VR. Als je op de tweedehandsmarkt een GE62VR met een IPS-scherm kan vinden, is dit waarschijnlijk een betere koop. Echter, voor wie een nieuwe, budgetvriendelijke gaming-notebook met een GTX 1060 zoekt, is de GF62 de absolute topkandidaat.
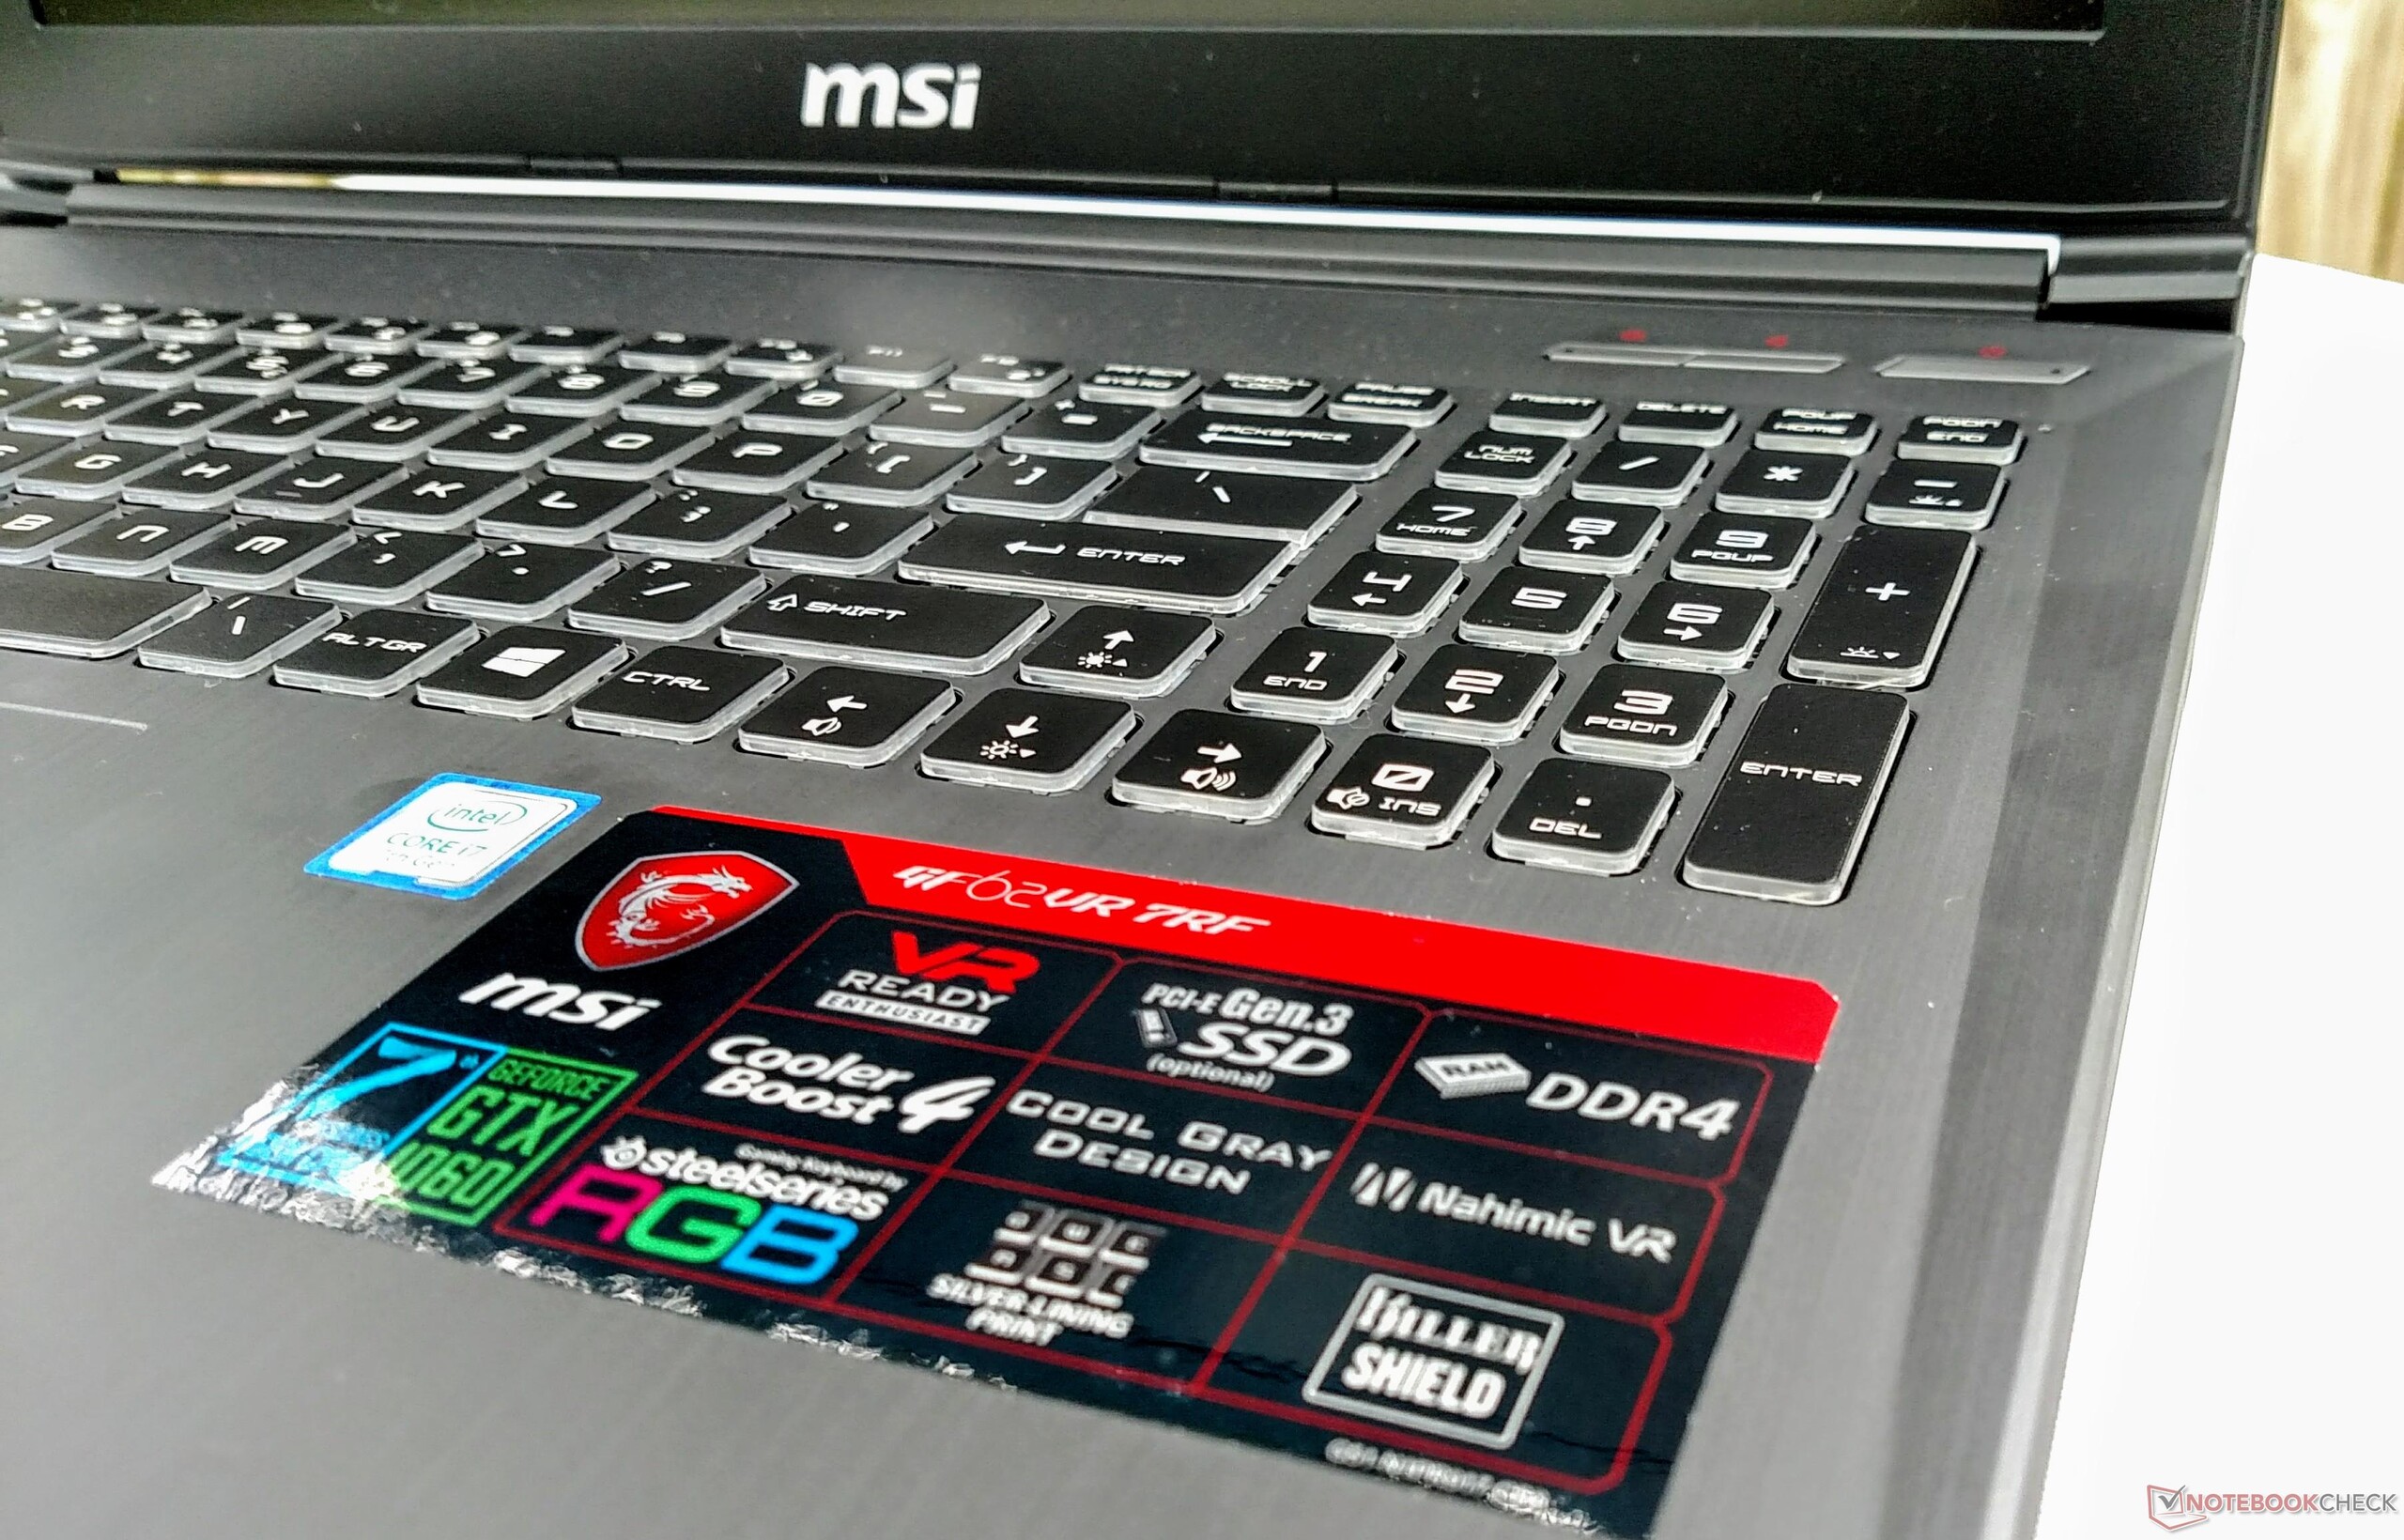
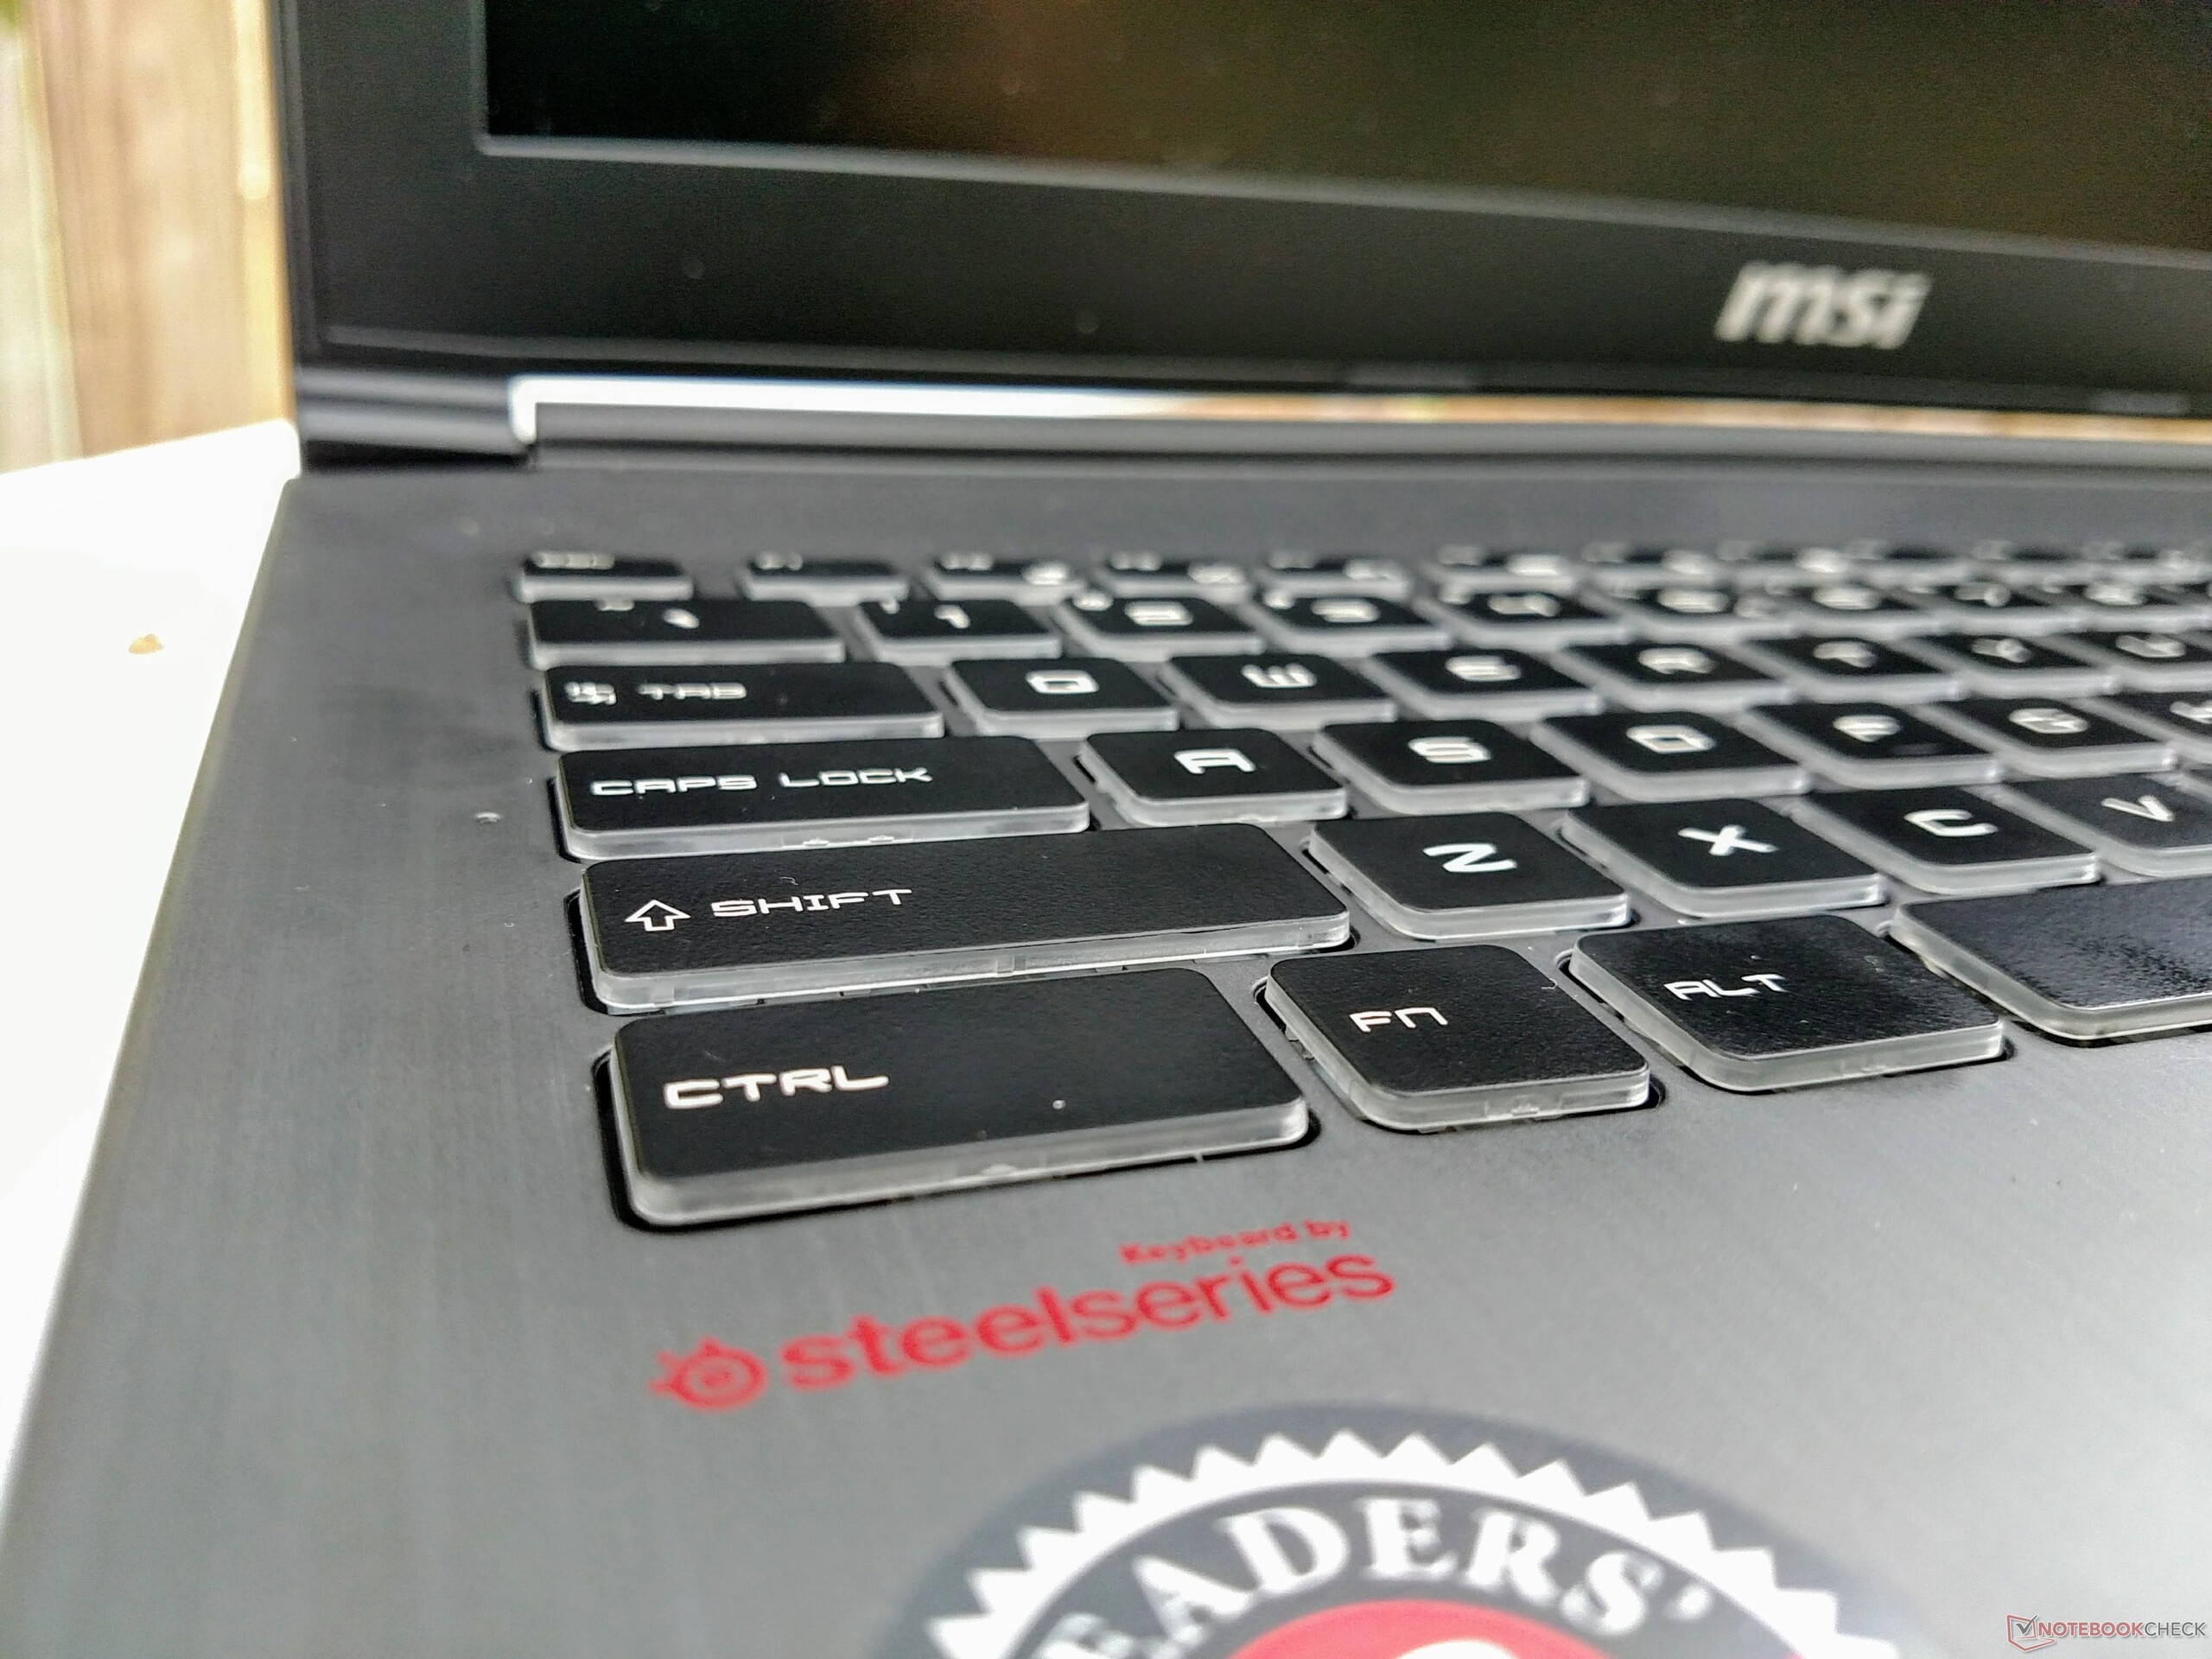
MSI GF62VR 7RF-877
- 10-11-2017 v6 (old)
Sam Medley
Price comparison
