Kort testrapport Dell Inspiron 15 7000 7567 Gaming Notebook

| SD Card Reader | |
| average JPG Copy Test (av. of 3 runs) | |
| Asus Strix GL502VM-DS74 | |
| Dell Inspiron 15 7559 | |
| MSI GE72 7RE-046 | |
| Acer Aspire VX5-591G-D0DD | |
| Dell Inspiron 15 7000 7567 | |
| maximum AS SSD Seq Read Test (1GB) | |
| Asus Strix GL502VM-DS74 | |
| Dell Inspiron 15 7559 | |
| Acer Aspire VX5-591G-D0DD | |
| MSI GE72 7RE-046 | |
| Dell Inspiron 15 7000 7567 | |
| Networking | |
| iperf3 transmit AX12 | |
| Acer Aspire VX5-591G-D0DD | |
| Asus Strix GL502VM-DS74 | |
| Dell Inspiron 15 7000 7567 (jseb) | |
| MSI GE72 7RE-046 | |
| iperf3 receive AX12 | |
| Acer Aspire VX5-591G-D0DD | |
| MSI GE72 7RE-046 | |
| Asus Strix GL502VM-DS74 | |
| Dell Inspiron 15 7000 7567 (jseb) | |
| |||||||||||||||||||||||||
Helderheidsverdeling: 75 %
Helderheid in Batterij-modus: 286 cd/m²
Contrast: 447:1 (Zwart: 0.55 cd/m²)
ΔE ColorChecker Calman: 10.97 | ∀{0.5-29.43 Ø4.73}
ΔE Greyscale Calman: 14.25 | ∀{0.09-98 Ø4.97}
55% sRGB (Argyll 1.6.3 3D)
35% AdobeRGB 1998 (Argyll 1.6.3 3D)
37.62% AdobeRGB 1998 (Argyll 3D)
54.9% sRGB (Argyll 3D)
36.42% Display P3 (Argyll 3D)
Gamma: 1.83
CCT: 11200 K
| Dell Inspiron 15 7000 7567 AU Optronics AUO38ED B156HTN 28H80, , 1920x1080, 15.6" | MSI GE72 7RE-046 N173HHE-G32 (CMN1747), , 1920x1080, 17.3" | Dell Inspiron 15 7559 LG Philips LGD04D9 / 156UD2 / Dell P/N: 53FC4, , 3840x2160, 15.6" | Asus Strix GL502VM-DS74 1920x1080, 15.6" | |
|---|---|---|---|---|
| Display | 119% | 70% | 66% | |
| Display P3 Coverage (%) | 36.42 | 90.7 149% | 63.4 74% | 64.8 78% |
| sRGB Coverage (%) | 54.9 | 99.9 82% | 90 64% | 84.9 55% |
| AdobeRGB 1998 Coverage (%) | 37.62 | 85.2 126% | 64.6 72% | 62 65% |
| Response Times | 50% | 20% | -4% | |
| Response Time Grey 50% / Grey 80% * (ms) | 36 ? | 27 ? 25% | 32 ? 11% | 42 ? -17% |
| Response Time Black / White * (ms) | 36 ? | 9 ? 75% | 26 ? 28% | 32.8 ? 9% |
| PWM Frequency (Hz) | ||||
| Screen | 57% | 26% | 52% | |
| Brightness middle (cd/m²) | 246 | 253 3% | 276 12% | 307.8 25% |
| Brightness (cd/m²) | 235 | 230 -2% | 273 16% | 301 28% |
| Brightness Distribution (%) | 75 | 86 15% | 85 13% | 88 17% |
| Black Level * (cd/m²) | 0.55 | 0.24 56% | 0.78 -42% | 0.33 40% |
| Contrast (:1) | 447 | 1054 136% | 354 -21% | 933 109% |
| Colorchecker dE 2000 * | 10.97 | 5.01 54% | 4.05 63% | 4.5 59% |
| Greyscale dE 2000 * | 14.25 | 7.26 49% | 4.68 67% | 2.9 80% |
| Gamma | 1.83 120% | 2.09 105% | 2.55 86% | 2.22 99% |
| CCT | 11200 58% | 6329 103% | 6871 95% | 1136 572% |
| Color Space (Percent of AdobeRGB 1998) (%) | 35 | 76 117% | 58 66% | 55.4 58% |
| Color Space (Percent of sRGB) (%) | 55 | 100 82% | 90 64% | 84.8 54% |
| Colorchecker dE 2000 max. * | 10.4 | 10 | ||
| Totaal Gemiddelde (Programma / Instellingen) | 75% /
69% | 39% /
35% | 38% /
47% |
* ... kleiner is beter
Responstijd Scherm
| ↔ Responstijd Zwart naar Wit | ||
|---|---|---|
| 36 ms ... stijging ↗ en daling ↘ gecombineerd | ↗ 19 ms stijging | 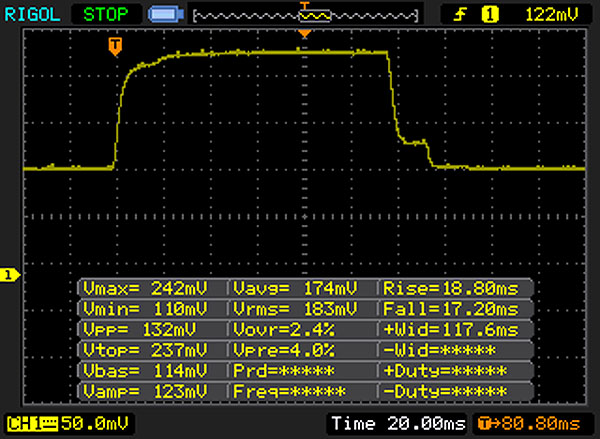 |
| ↘ 17 ms daling | ||
| Het scherm vertoonde trage responstijden in onze tests en is misschien te traag voor games. Ter vergelijking: alle testtoestellen variëren van 0.1 (minimum) tot 240 (maximum) ms. » 94 % van alle toestellen zijn beter. Dit betekent dat de gemeten responstijd slechter is dan het gemiddelde (19.9 ms) van alle geteste toestellen. | ||
| ↔ Responstijd 50% Grijs naar 80% Grijs | ||
| 36 ms ... stijging ↗ en daling ↘ gecombineerd | ↗ 17 ms stijging | 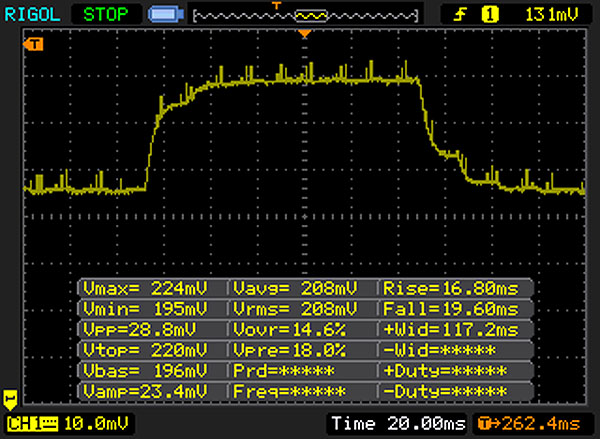 |
| ↘ 19 ms daling | ||
| Het scherm vertoonde trage responstijden in onze tests en is misschien te traag voor games. Ter vergelijking: alle testtoestellen variëren van 0.165 (minimum) tot 636 (maximum) ms. » 50 % van alle toestellen zijn beter. Dit betekent dat de gemeten responstijd slechter is dan het gemiddelde (31.1 ms) van alle geteste toestellen. | ||
Screen Flickering / PWM (Pulse-Width Modulation)
| Screen flickering / PWM niet waargenomen | ||
Ter vergelijking: 52 % van alle geteste toestellen maakten geen gebruik van PWM om de schermhelderheid te verlagen. Als het wel werd gebruikt, werd een gemiddelde van 7791 (minimum: 5 - maximum: 343500) Hz waargenomen. | ||
| PCMark 8 Home Score Accelerated v2 | 3850 punten | |
| PCMark 8 Work Score Accelerated v2 | 5068 punten | |
Help | ||
| Dell Inspiron 15 7000 7567 Intel SSDSCKKF256H6 | MSI GE72 7RE-046 Toshiba HG6 THNSNJ256G8NY | Dell Inspiron 15 7559 SK hynix SC300 M.2 | Asus Strix GL502VM-DS74 Samsung SSD 960 Evo 250GB m.2 NVMe | Acer Aspire VX5-591G-D0DD SK Hynix Canvas SC300 512GB M.2 (HFS512G39MND) | |
|---|---|---|---|---|---|
| CrystalDiskMark 3.0 | 19% | -11% | 171% | 3% | |
| Read Seq (MB/s) | 485.8 | 540 11% | 489.9 1% | 1747 260% | 494.2 2% |
| Write Seq (MB/s) | 422.8 | 495.7 17% | 205.1 -51% | 1477 249% | 449.6 6% |
| Read 512 (MB/s) | 338.9 | 455.1 34% | 354.3 5% | 863 155% | 348.1 3% |
| Write 512 (MB/s) | 304 | 481.4 58% | 211.5 -30% | 1115 267% | 418.2 38% |
| Read 4k (MB/s) | 27.11 | 22.7 -16% | 27.84 3% | 56.8 110% | 16.97 -37% |
| Write 4k (MB/s) | 85.4 | 112.9 32% | 68 -20% | 152.4 78% | 38.36 -55% |
| Read 4k QD32 (MB/s) | 279.6 | 372.5 33% | 348.2 25% | 652 133% | 394.9 41% |
| Write 4k QD32 (MB/s) | 255.1 | 212.9 -17% | 198.4 -22% | 542 112% | 317.4 24% |

| 3DMark 11 Performance | 8992 punten | |
| 3DMark Cloud Gate Standard Score | 21998 punten | |
| 3DMark Fire Strike Score | 6709 punten | |
Help | ||
| Rise of the Tomb Raider | |
| 1920x1080 High Preset AA:FX AF:4x | |
| Asus Strix GL502VT-DS74 | |
| MSI GE72 7RE-046 | |
| Acer Aspire VX5-591G-D0DD | |
| Dell Inspiron 15 7000 7567 | |
| MSI GL62M 7RD-077 | |
| Asus Strix GL753VD-GC045T | |
| 1920x1080 Very High Preset AA:FX AF:16x | |
| Asus Strix GL502VM-DS74 | |
| Asus Strix GL502VT-DS74 | |
| MSI GE72 7RE-046 | |
| Acer Aspire VX5-591G-D0DD | |
| Dell Inspiron 15 7000 7567 | |
| MSI GL62M 7RD-077 | |
| Asus Strix GL753VD-GC045T | |
| BioShock Infinite | |
| 1366x768 High Preset | |
| MSI GL62M 7RD-077 | |
| Dell Inspiron 15 7000 7567 | |
| Asus Strix GL502VT-DS74 | |
| Dell Inspiron 15 7559 | |
| Lenovo IdeaPad Z50-75 | |
| 1920x1080 Ultra Preset, DX11 (DDOF) | |
| Asus Strix GL502VM-DS74 | |
| Dell Inspiron 15 7000 7567 | |
| Asus Strix GL502VT-DS74 | |
| MSI GL62M 7RD-077 | |
| Dell Inspiron 15 7559 | |
| Lenovo IdeaPad Z50-75 | |
| Titanfall 2 | |
| 1920x1080 High / Enabled AA:TS AF:8x | |
| Dell Inspiron 15 7000 7567 | |
| Acer Aspire VX5-591G-D0DD | |
| MSI GE72 7RE-046 | |
| Asus Strix GL753VD-GC045T | |
| MSI GL62M 7RD-077 | |
| Dell XPS 15 2017 9560 (7300HQ, Full-HD) | |
| 1920x1080 Very High (Insane Texture Quality) / Enabled AA:TS AF:16x | |
| Dell Inspiron 15 7000 7567 | |
| Acer Aspire VX5-591G-D0DD | |
| Asus Strix GL753VD-GC045T | |
| MSI GE72 7RE-046 | |
| Dell XPS 15 2017 9560 (7300HQ, Full-HD) | |
| MSI GL62M 7RD-077 | |
| lage | gem. | hoge | ultra | |
|---|---|---|---|---|
| BioShock Infinite (2013) | 182.1 | 154.1 | 147 | 72.8 |
| GTA V (2015) | 135 | 118.8 | 60.3 | 36.1 |
| Metal Gear Solid V (2015) | 60 | 60 | 60 | 60 |
| Rise of the Tomb Raider (2016) | 117.5 | 86.6 | 46.6 | 38.3 |
| Doom (2016) | 117 | 105.3 | 69.1 | 67.5 |
| Mafia 3 (2016) | 61.3 | 44.3 | 28.6 | |
| Battlefield 1 (2016) | 114.7 | 99.7 | 56.9 | 51.2 |
| Farming Simulator 17 (2016) | 169.8 | 148.5 | 124.6 | 116 |
| Titanfall 2 (2016) | 143.4 | 131.9 | 75.8 | 66.7 |
| Call of Duty Infinite Warfare (2016) | 113.8 | 102 | 67.8 | 59 |
| Dishonored 2 (2016) | 87.9 | 72.2 | 46.3 | 39.9 |
| Watch Dogs 2 (2016) | 82.5 | 74.3 | 44.5 | 31.4 |
| Resident Evil 7 (2017) | 245.5 | 126.8 | 68.5 | 25.6 |
Geluidsniveau
| Onbelast |
| 30.9 / 30.9 / 31 dB (A) |
| HDD |
| 31.2 dB (A) |
| Belasting |
| 46.5 / 46.8 dB (A) |
 | ||
30 dB stil 40 dB(A) hoorbaar 50 dB(A) luid |
||
min: | ||
(±) De maximumtemperatuur aan de bovenzijde bedraagt 43.4 °C / 110 F, vergeleken met het gemiddelde van 40.4 °C / 105 F, variërend van 21.2 tot 68.8 °C voor de klasse Gaming.
(+) De bodem warmt op tot een maximum van 37.7 °C / 100 F, vergeleken met een gemiddelde van 43.2 °C / 110 F
(+) Bij onbelast gebruik bedraagt de gemiddelde temperatuur voor de bovenzijde 23.1 °C / 74 F, vergeleken met het apparaatgemiddelde van 33.9 °C / 93 F.
(+) De palmsteunen en het touchpad zijn met een maximum van ###max## °C / 79.9 F koeler dan de huidtemperatuur en voelen daarom koel aan.
(+) De gemiddelde temperatuur van de handpalmsteun van soortgelijke toestellen bedroeg 28.8 °C / 83.8 F (+2.2 °C / 3.9 F).
Dell Inspiron 15 7000 7567 audioanalyse
(±) | luidspreker luidheid is gemiddeld maar goed (74 dB)
Bas 100 - 315 Hz
(±) | verminderde zeebaars - gemiddeld 12.6% lager dan de mediaan
(±) | lineariteit van de lage tonen is gemiddeld (13.2% delta ten opzichte van de vorige frequentie)
Midden 400 - 2000 Hz
(+) | evenwichtige middens - slechts 1.8% verwijderd van de mediaan
(+) | de middentonen zijn lineair (4.3% delta ten opzichte van de vorige frequentie)
Hoog 2 - 16 kHz
(+) | evenwichtige hoogtepunten - slechts 4% verwijderd van de mediaan
(+) | de hoge tonen zijn lineair (3.9% delta naar de vorige frequentie)
Algemeen 100 - 16.000 Hz
(+) | het totale geluid is lineair (12% verschil met de mediaan)
Vergeleken met dezelfde klasse
» 12% van alle geteste apparaten in deze klasse waren beter, 4% vergelijkbaar, 84% slechter
» De beste had een delta van 6%, het gemiddelde was 18%, de slechtste was 132%
Vergeleken met alle geteste toestellen
» 9% van alle geteste apparaten waren beter, 2% gelijk, 88% slechter
» De beste had een delta van 4%, het gemiddelde was 24%, de slechtste was 134%
Apple MacBook 12 (Early 2016) 1.1 GHz audioanalyse
(+) | luidsprekers kunnen relatief luid spelen (83.6 dB)
Bas 100 - 315 Hz
(±) | verminderde zeebaars - gemiddeld 11.3% lager dan de mediaan
(±) | lineariteit van de lage tonen is gemiddeld (14.2% delta ten opzichte van de vorige frequentie)
Midden 400 - 2000 Hz
(+) | evenwichtige middens - slechts 2.4% verwijderd van de mediaan
(+) | de middentonen zijn lineair (5.5% delta ten opzichte van de vorige frequentie)
Hoog 2 - 16 kHz
(+) | evenwichtige hoogtepunten - slechts 2% verwijderd van de mediaan
(+) | de hoge tonen zijn lineair (4.5% delta naar de vorige frequentie)
Algemeen 100 - 16.000 Hz
(+) | het totale geluid is lineair (10.2% verschil met de mediaan)
Vergeleken met dezelfde klasse
» 7% van alle geteste apparaten in deze klasse waren beter, 2% vergelijkbaar, 91% slechter
» De beste had een delta van 5%, het gemiddelde was 18%, de slechtste was 53%
Vergeleken met alle geteste toestellen
» 5% van alle geteste apparaten waren beter, 1% gelijk, 94% slechter
» De beste had een delta van 4%, het gemiddelde was 24%, de slechtste was 134%
| Uit / Standby | |
| Inactief | |
| Belasting |
|
Key:
min: | |
| Dell Inspiron 15 7000 7567 i7-7700HQ, GeForce GTX 1050 Ti Mobile, Intel SSDSCKKF256H6, TN, 1920x1080, 15.6" | MSI GE72 7RE-046 i7-7700HQ, GeForce GTX 1050 Ti Mobile, Toshiba HG6 THNSNJ256G8NY, TN LED, 1920x1080, 17.3" | Dell Inspiron 15 7559 6700HQ, GeForce GTX 960M, SK hynix SC300 M.2, IPS, 3840x2160, 15.6" | Asus Strix GL502VM-DS74 i7-7700HQ, GeForce GTX 1060 Mobile, Samsung SSD 960 Evo 250GB m.2 NVMe, IPS, 1920x1080, 15.6" | |
|---|---|---|---|---|
| Power Consumption | -124% | -65% | -347% | |
| Idle Minimum * (Watt) | 4.4 | 14 -218% | 9.4 -114% | 38.3 -770% |
| Idle Average * (Watt) | 6.8 | 20 -194% | 14.4 -112% | 40.5 -496% |
| Idle Maximum * (Watt) | 8.3 | 25 -201% | 15 -81% | 42.2 -408% |
| Load Average * (Watt) | 81 | 82 -1% | 102 -26% | 110.4 -36% |
| Load Maximum * (Watt) | 127 | 135 -6% | 120 6% | 155.7 -23% |
* ... kleiner is beter
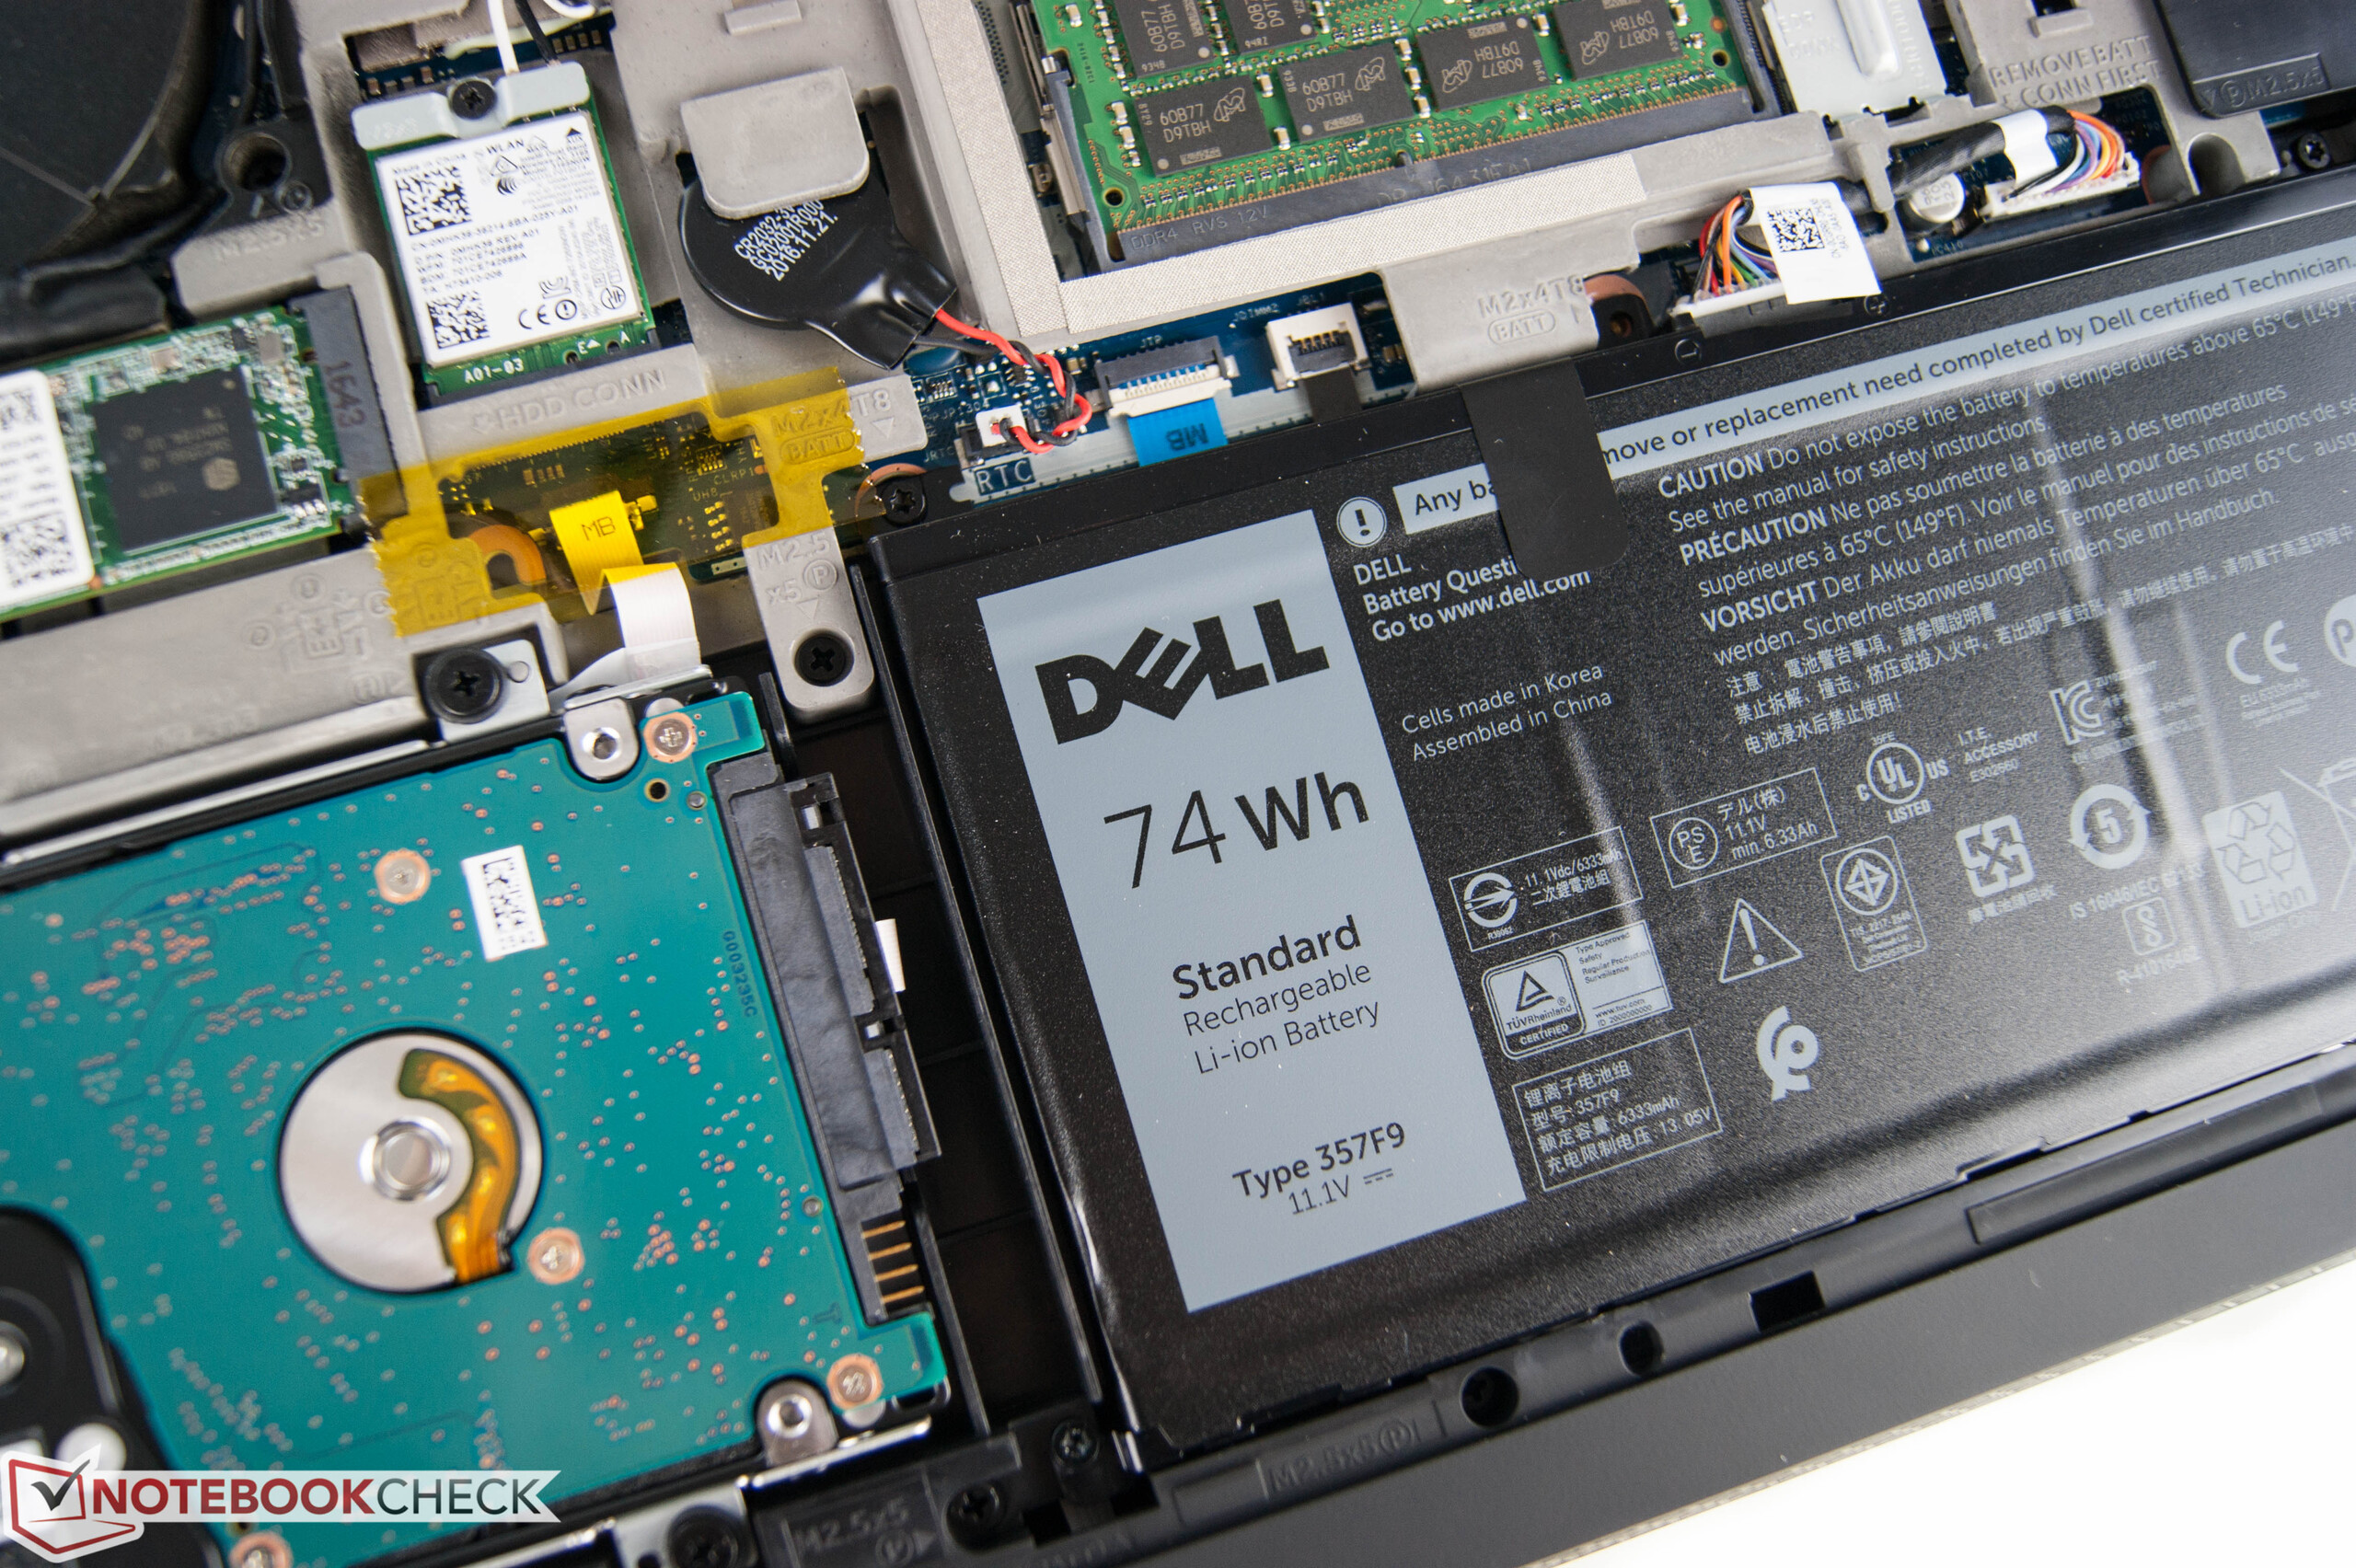
| Dell Inspiron 15 7000 7567 i7-7700HQ, GeForce GTX 1050 Ti Mobile, 74 Wh | MSI GE72 7RE-046 i7-7700HQ, GeForce GTX 1050 Ti Mobile, 51.4 Wh | Dell Inspiron 15 7559 6700HQ, GeForce GTX 960M, 74 Wh | Asus Strix GL502VM-DS74 i7-7700HQ, GeForce GTX 1060 Mobile, 64 Wh | Acer Aspire VX5-591G-D0DD i7-7700HQ, GeForce GTX 1050 Ti Mobile, 52 Wh | |
|---|---|---|---|---|---|
| Batterijduur | -64% | -36% | -69% | -41% | |
| Reader / Idle (h) | 19.6 | 11.8 -40% | 1.7 -91% | ||
| H.264 (h) | 7.6 | 3.3 -57% | |||
| WiFi v1.3 (h) | 10.4 | 3.1 -70% | 3.9 -62% | 1.5 -86% | 6.1 -41% |
| Load (h) | 1.4 | 1.3 -7% | 1 -29% |
Pro
Contra
Dit is de verkorte versie van het originele artikel. Het volledige, Engelse testrapport vind je hier.
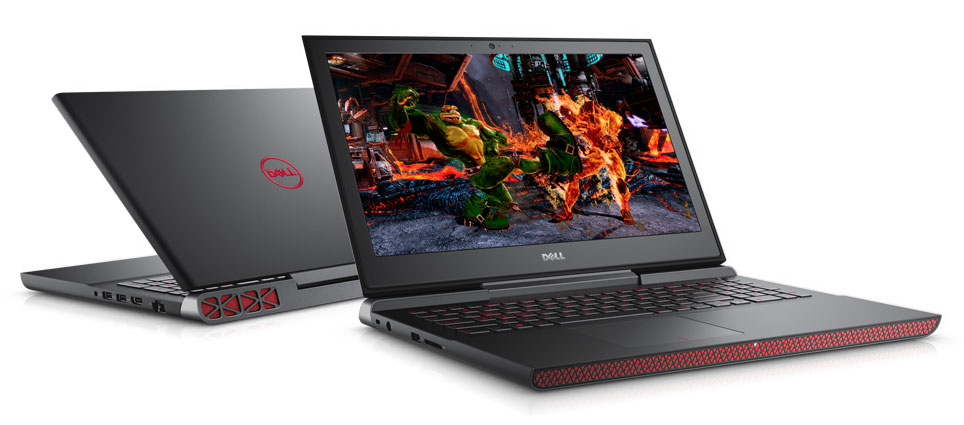
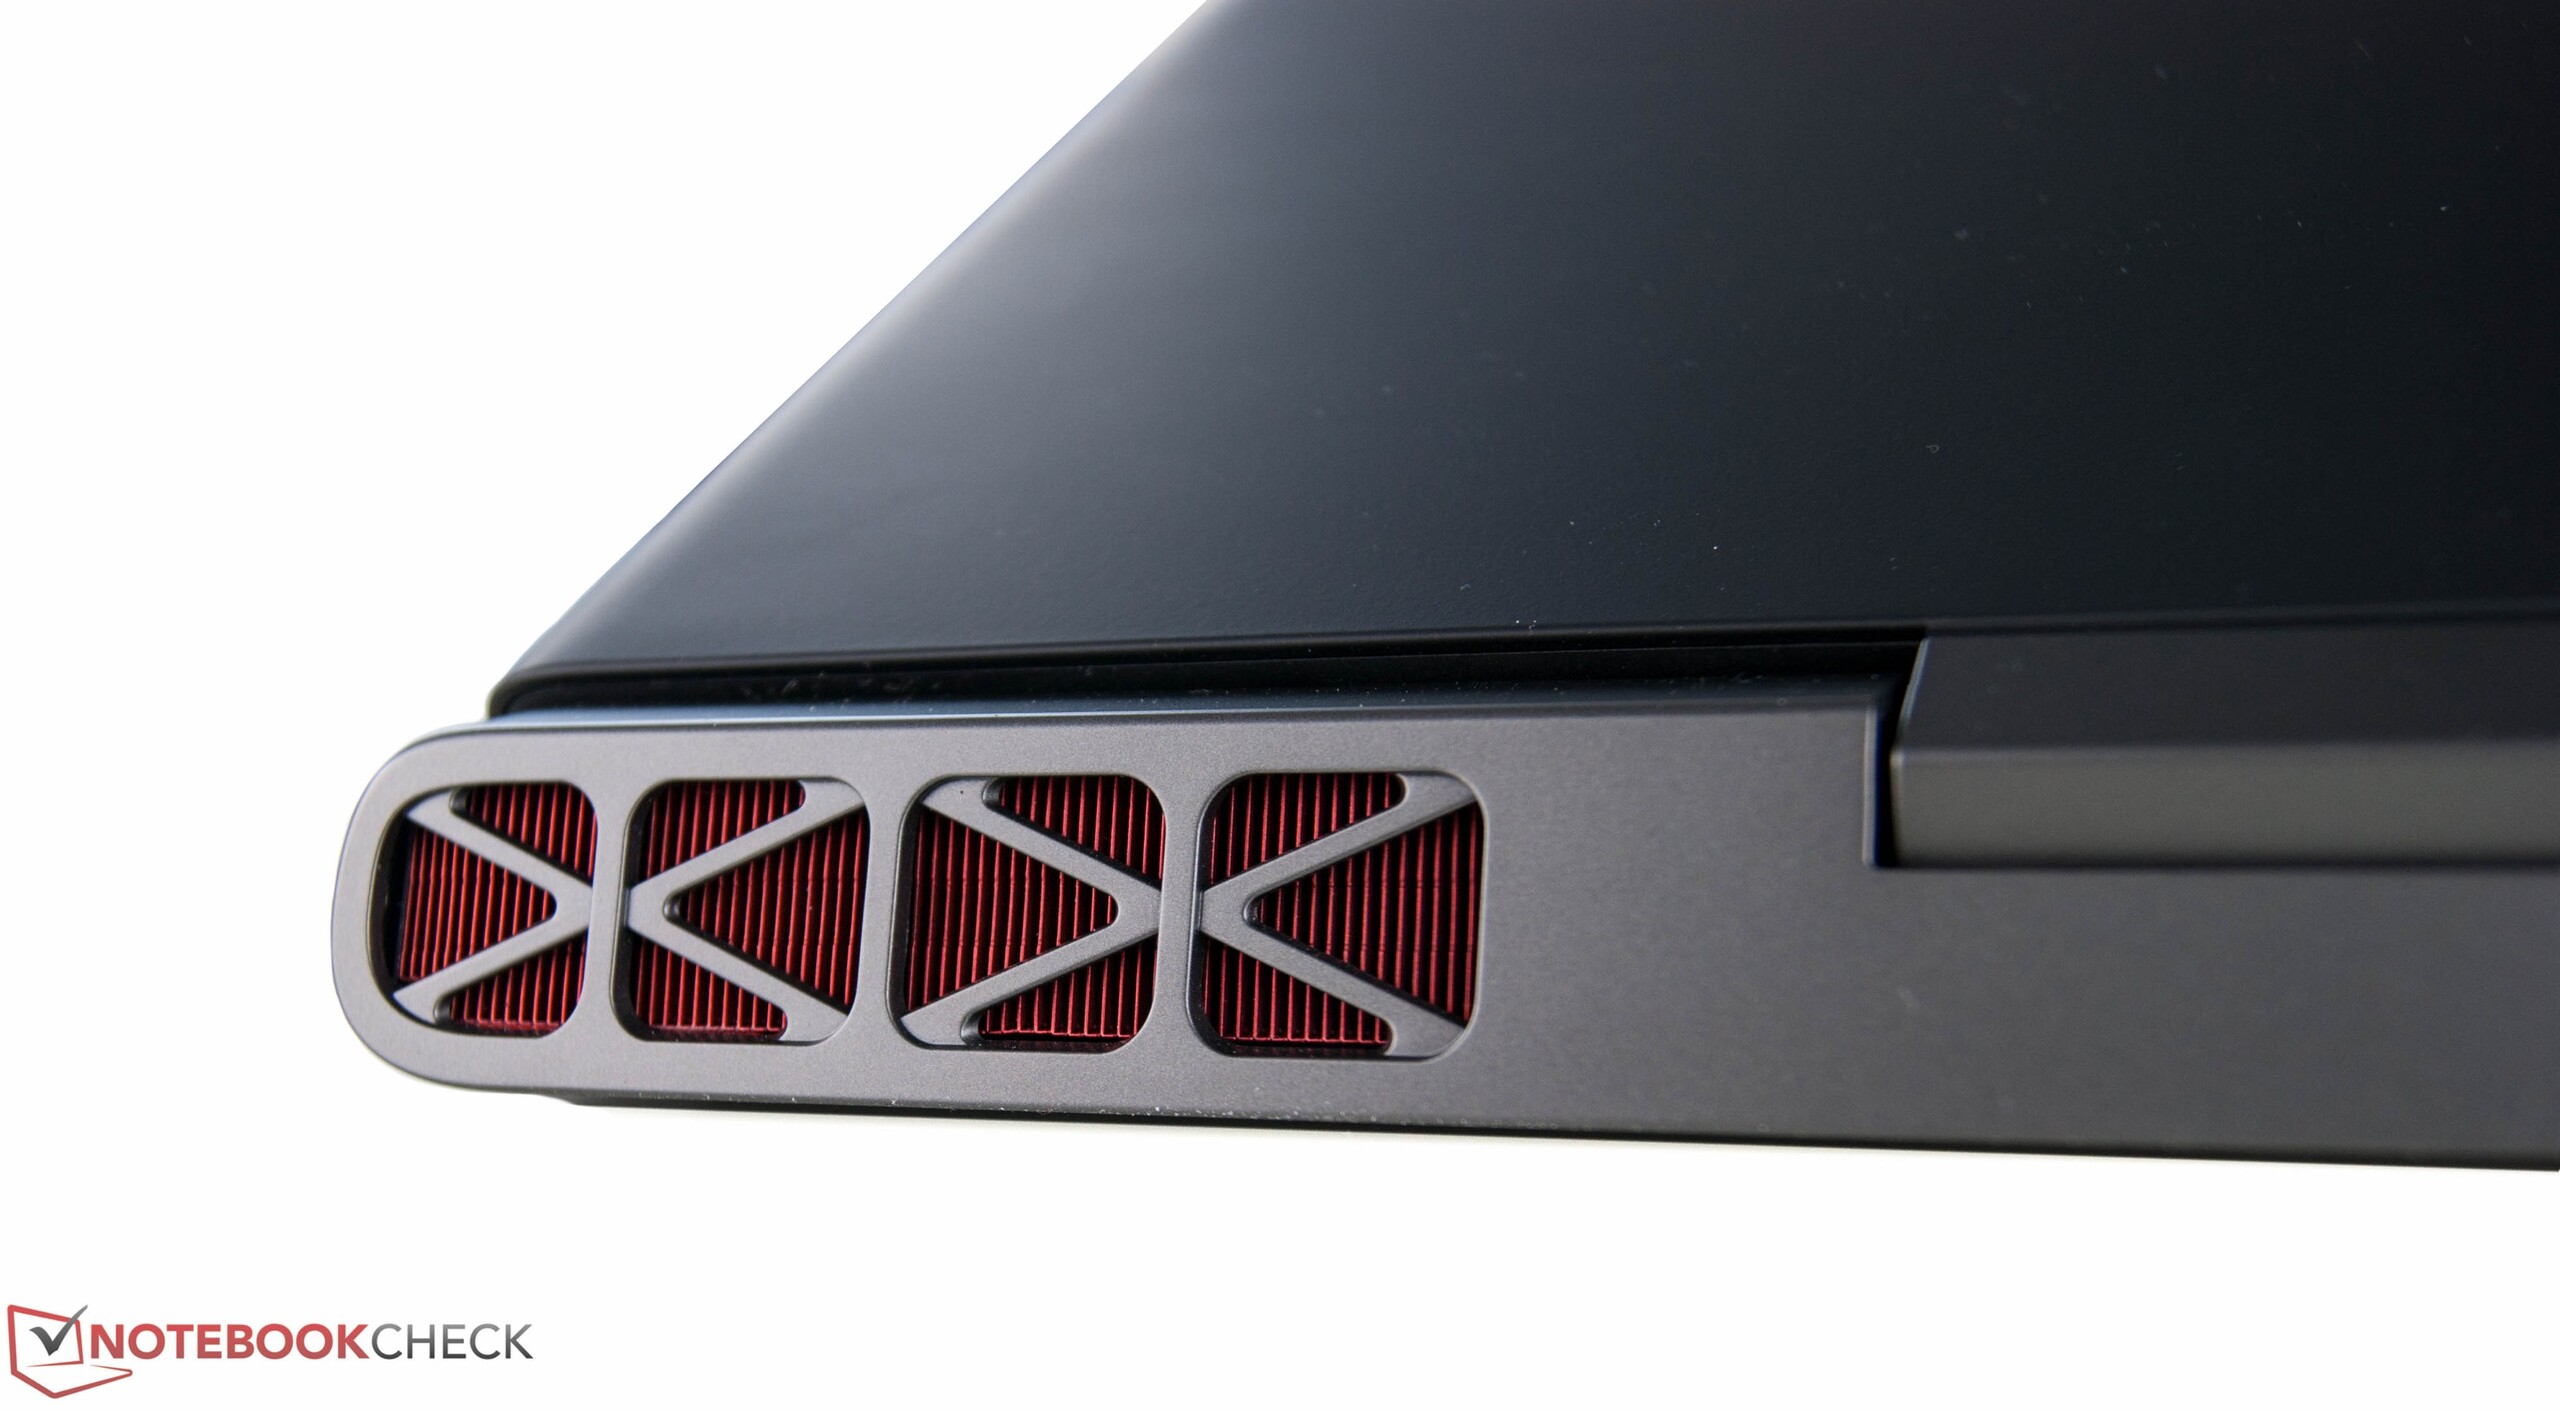
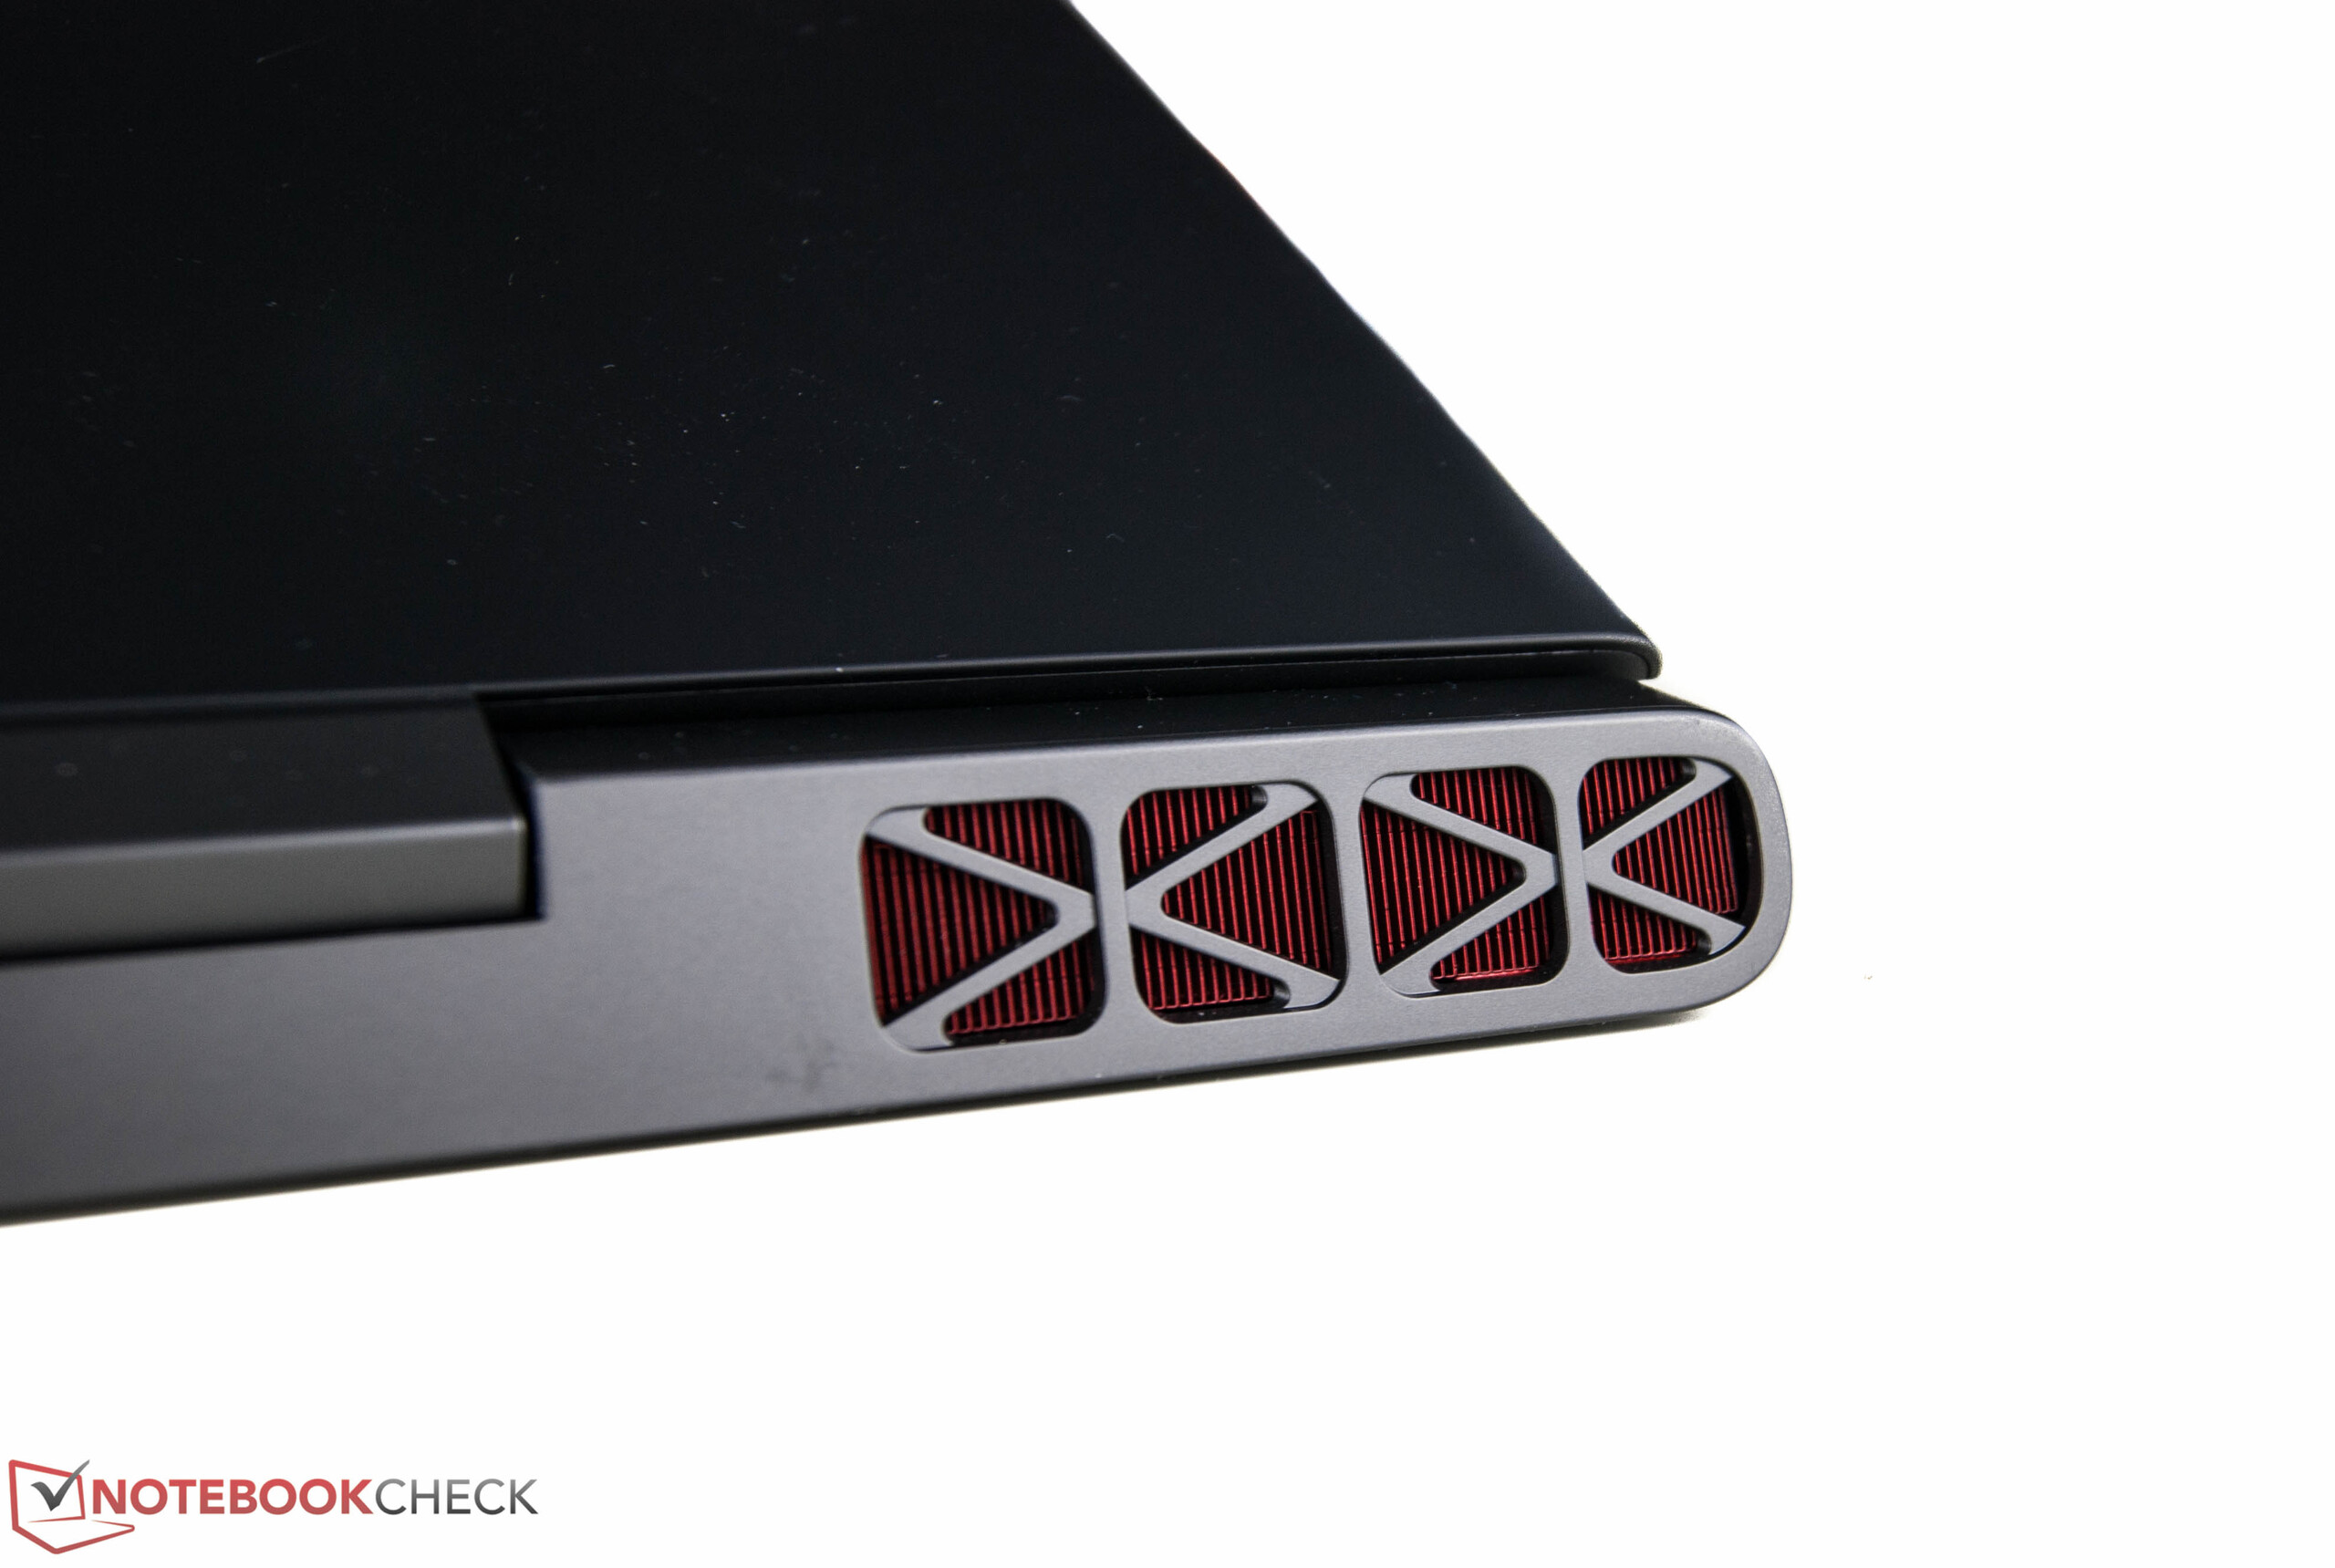
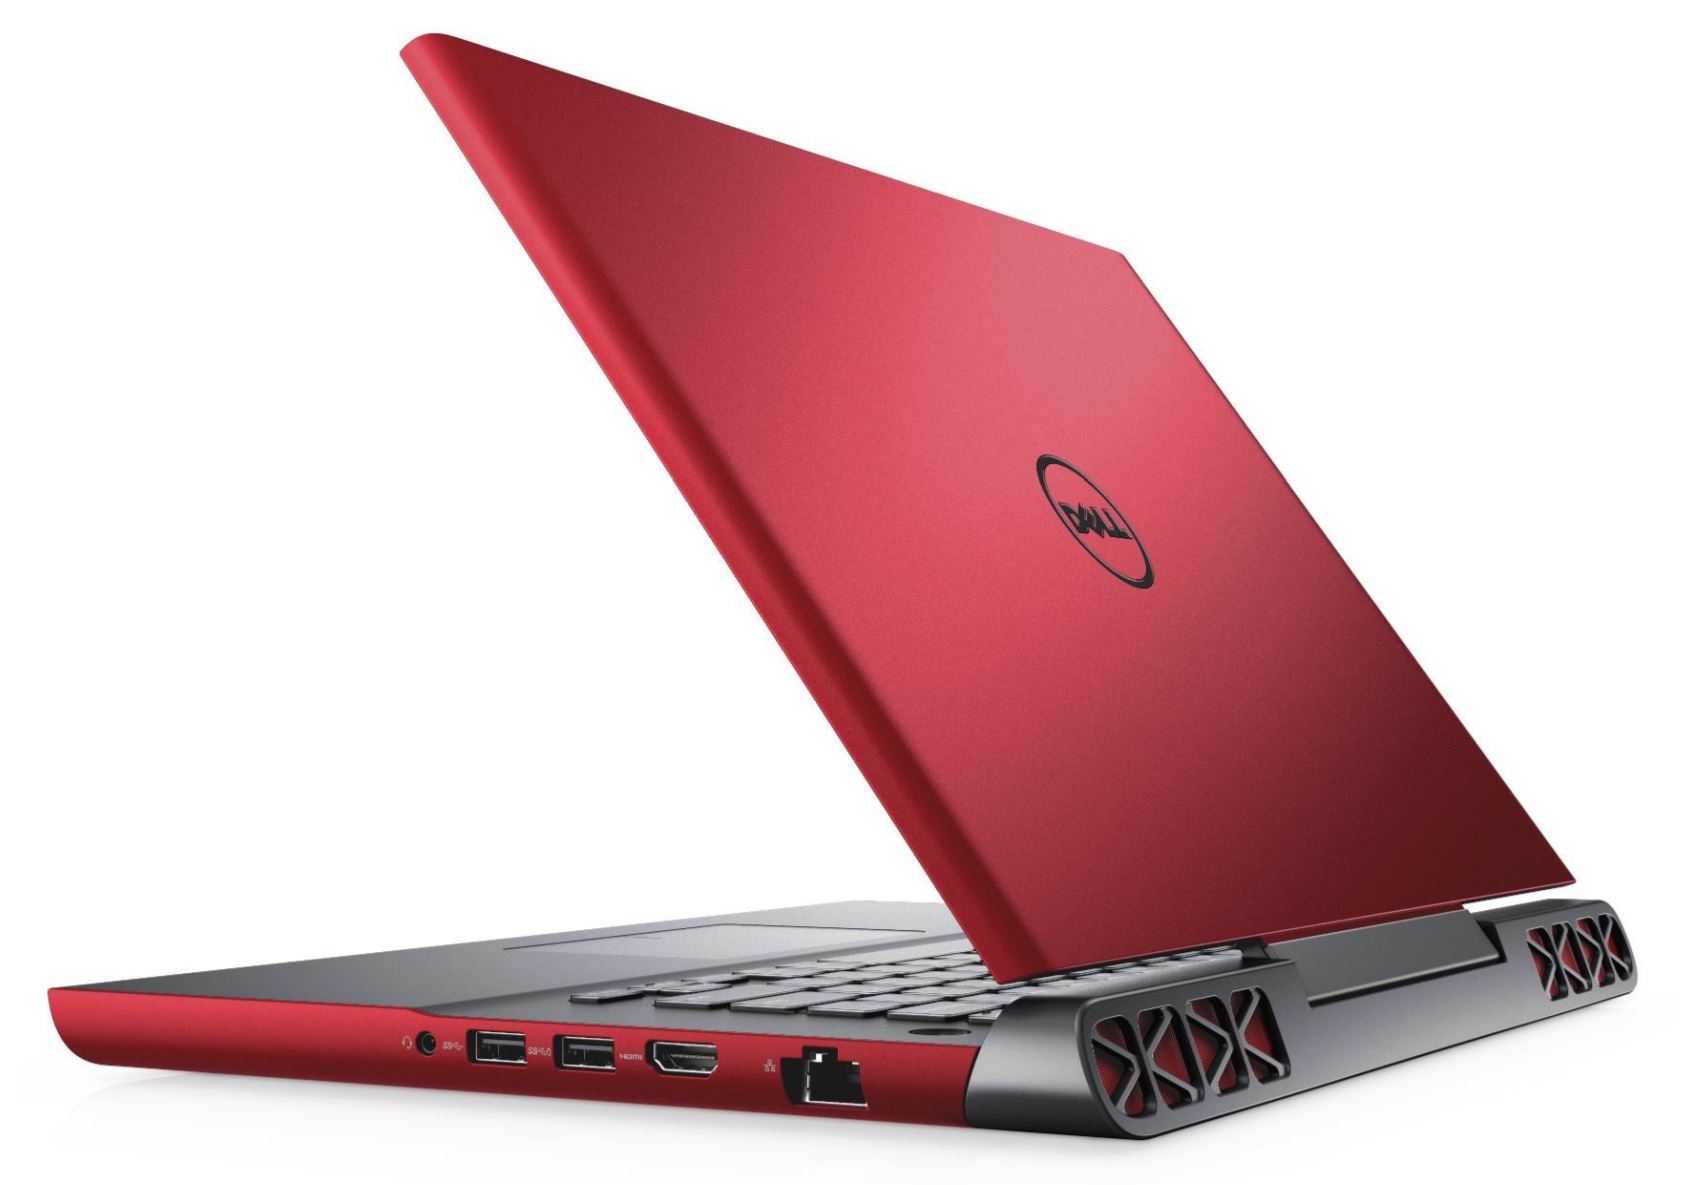
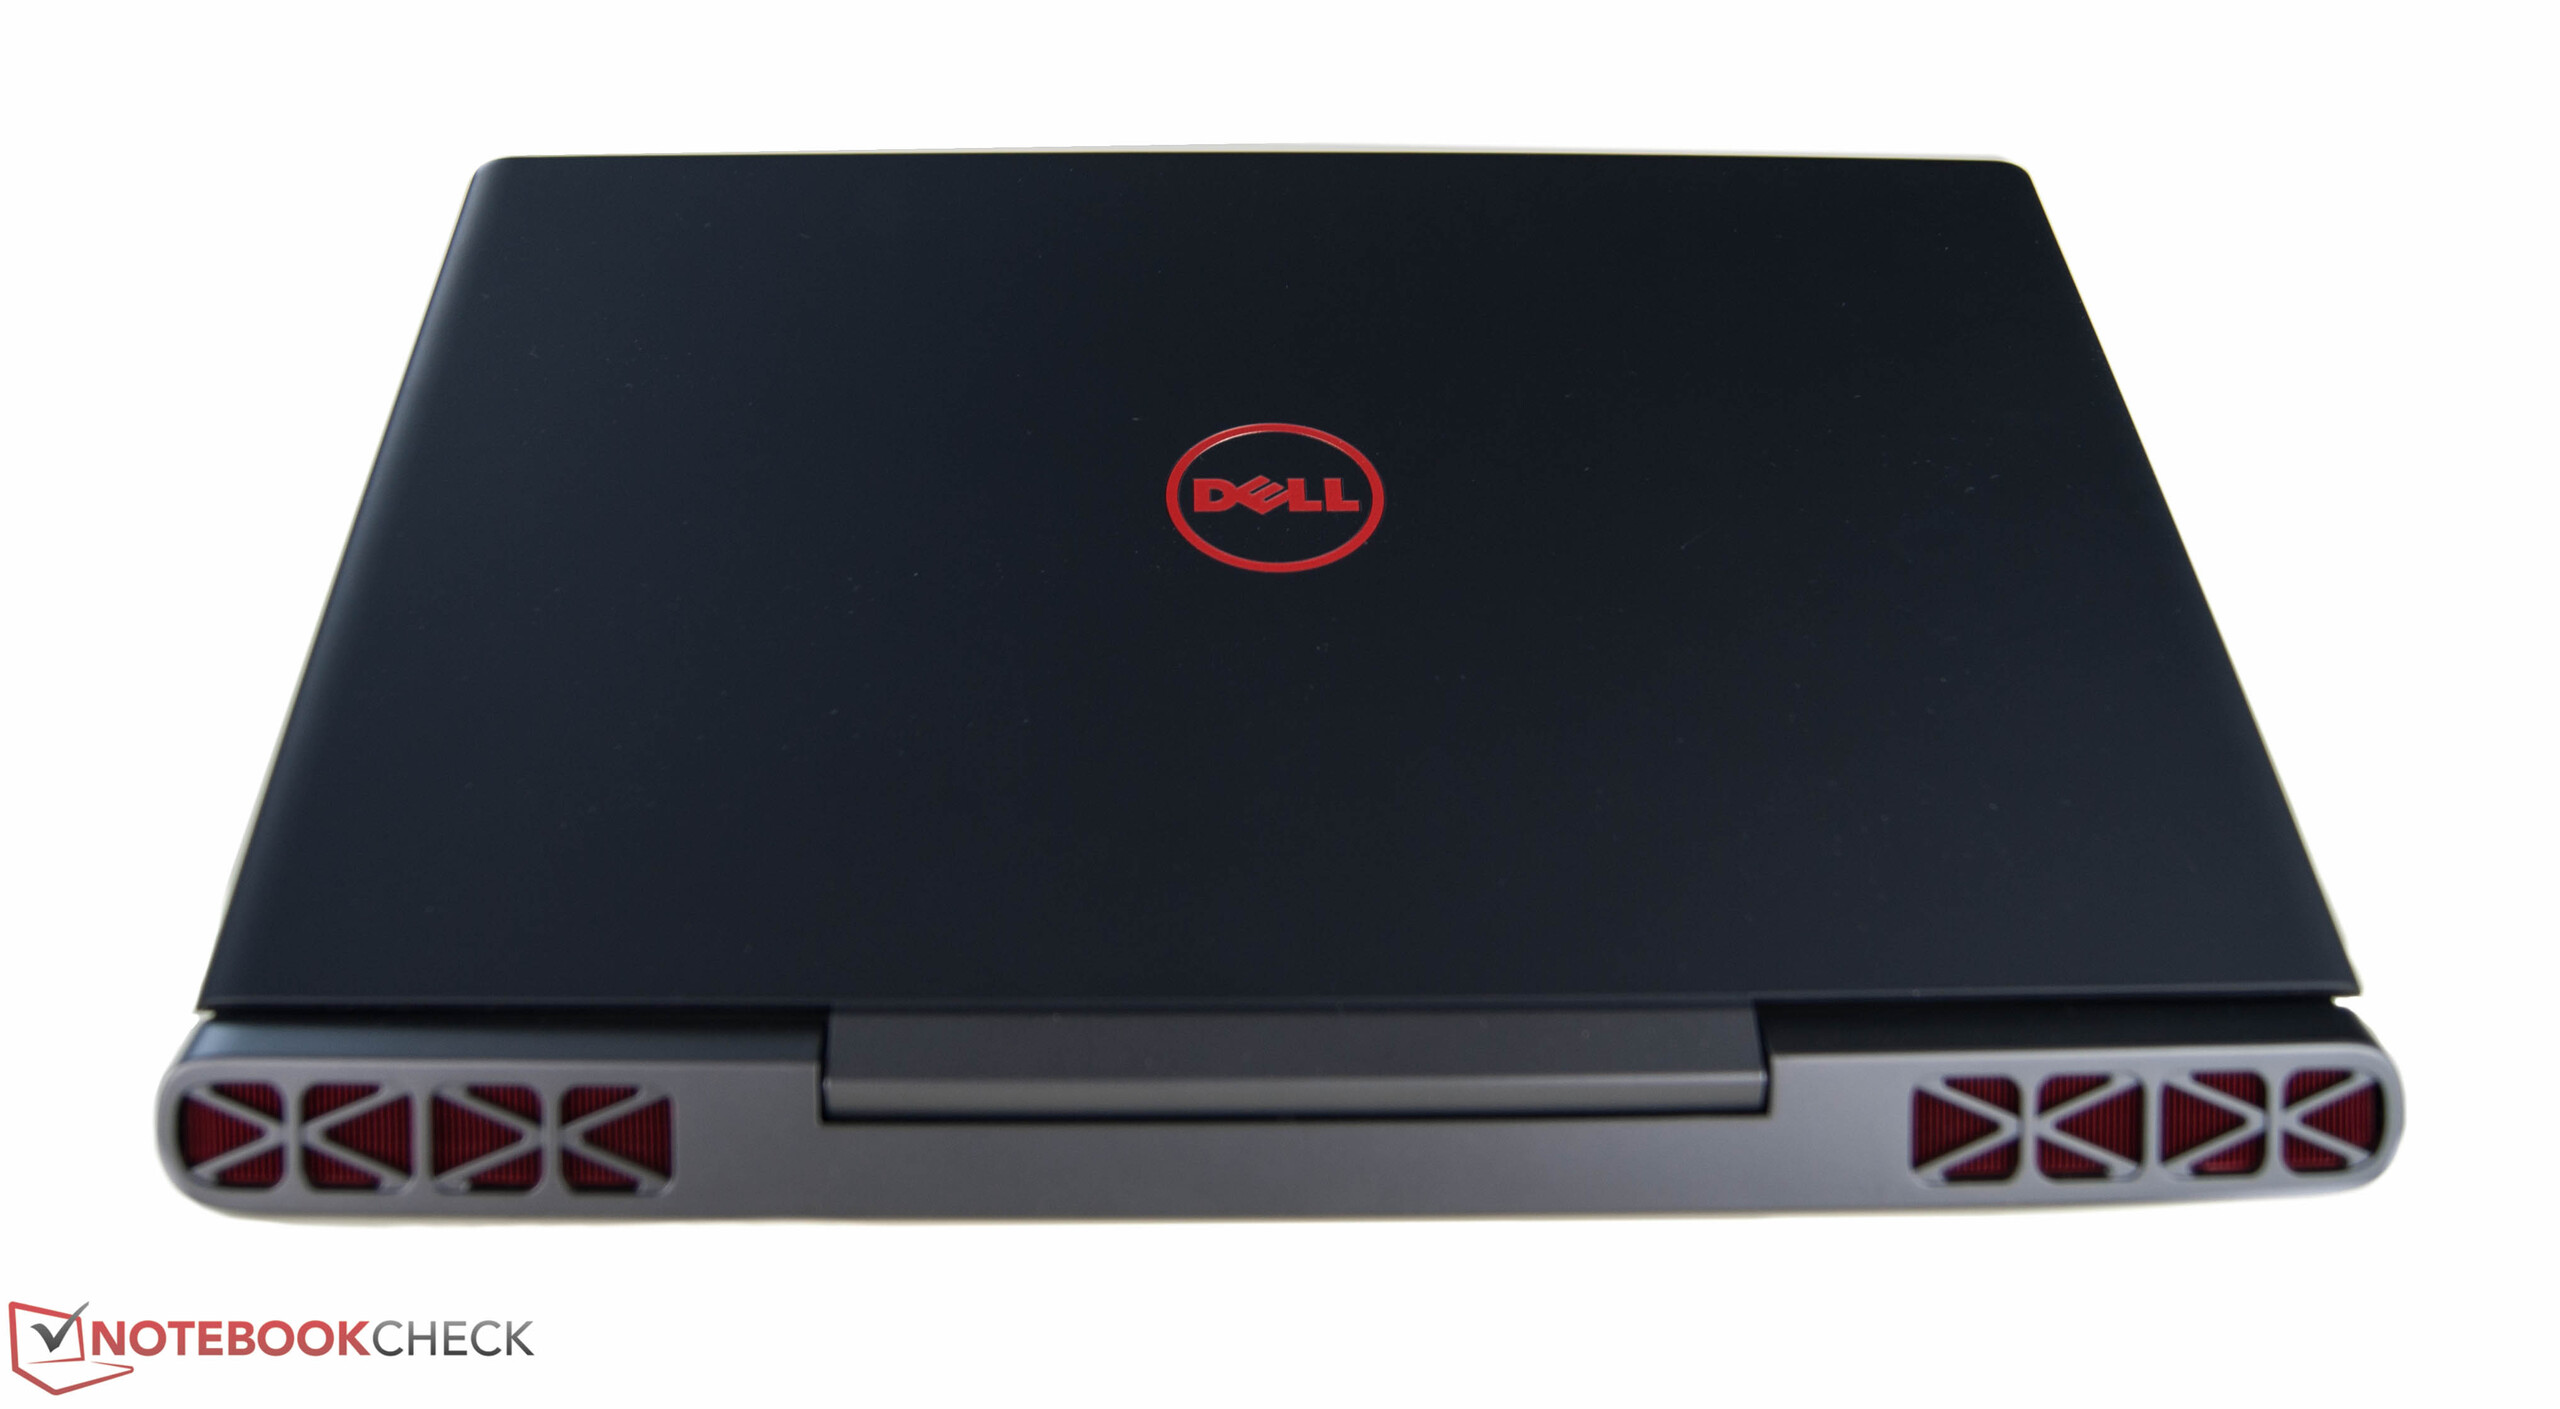
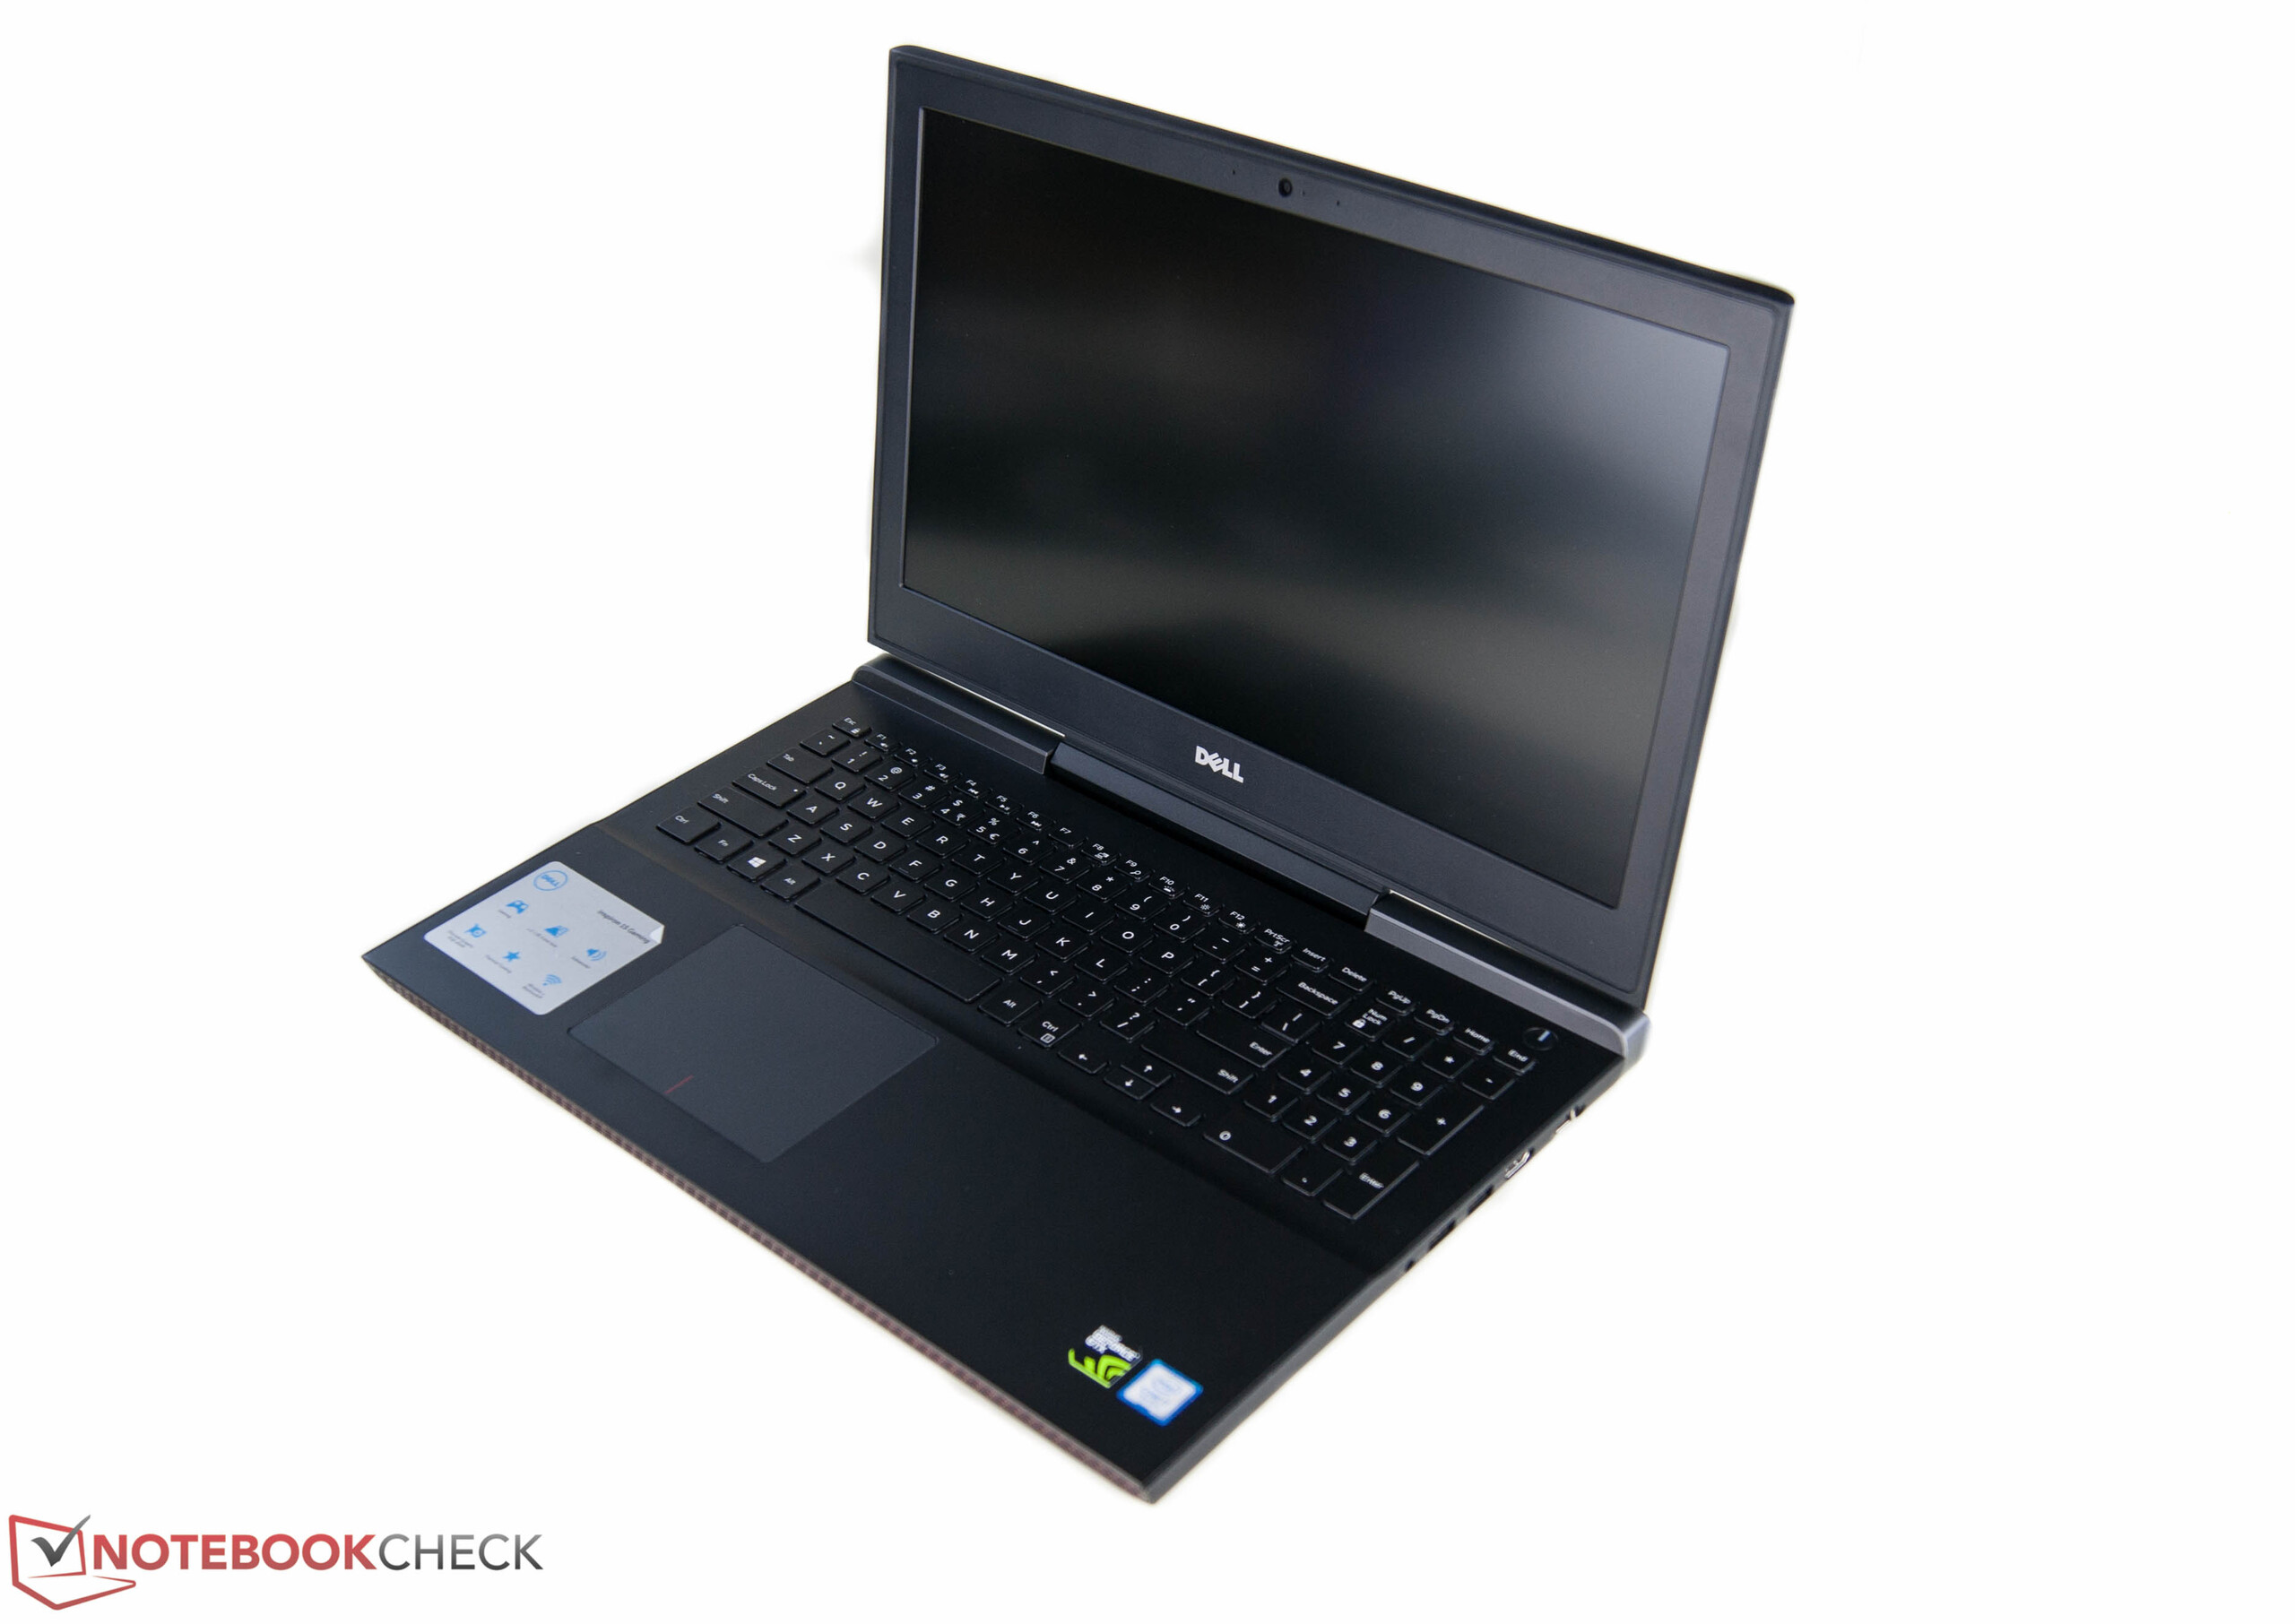
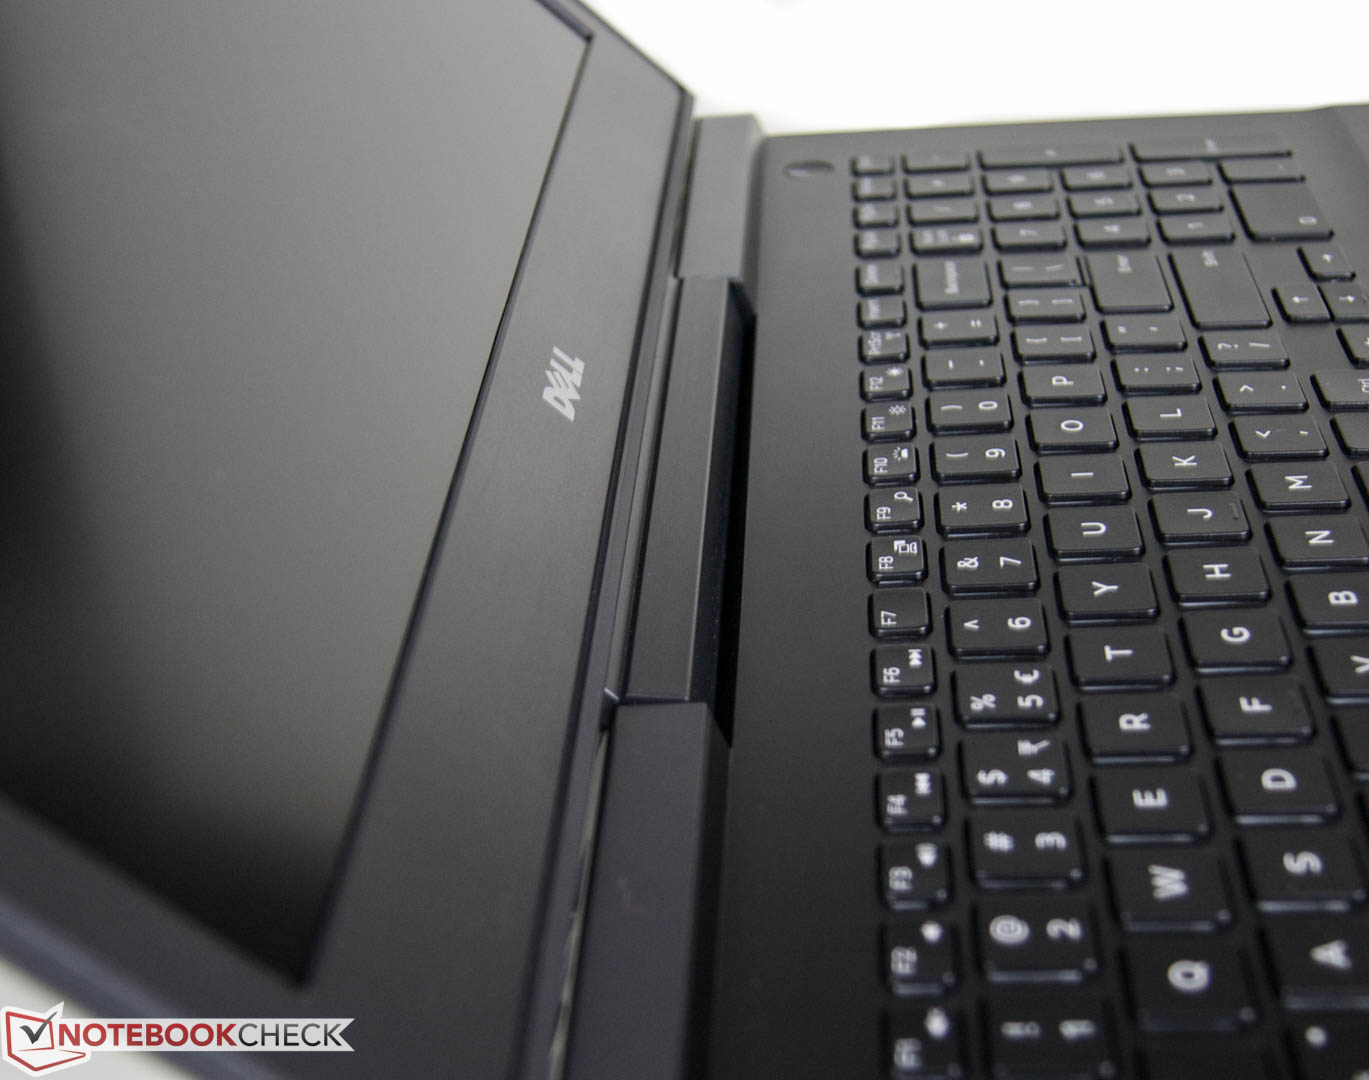
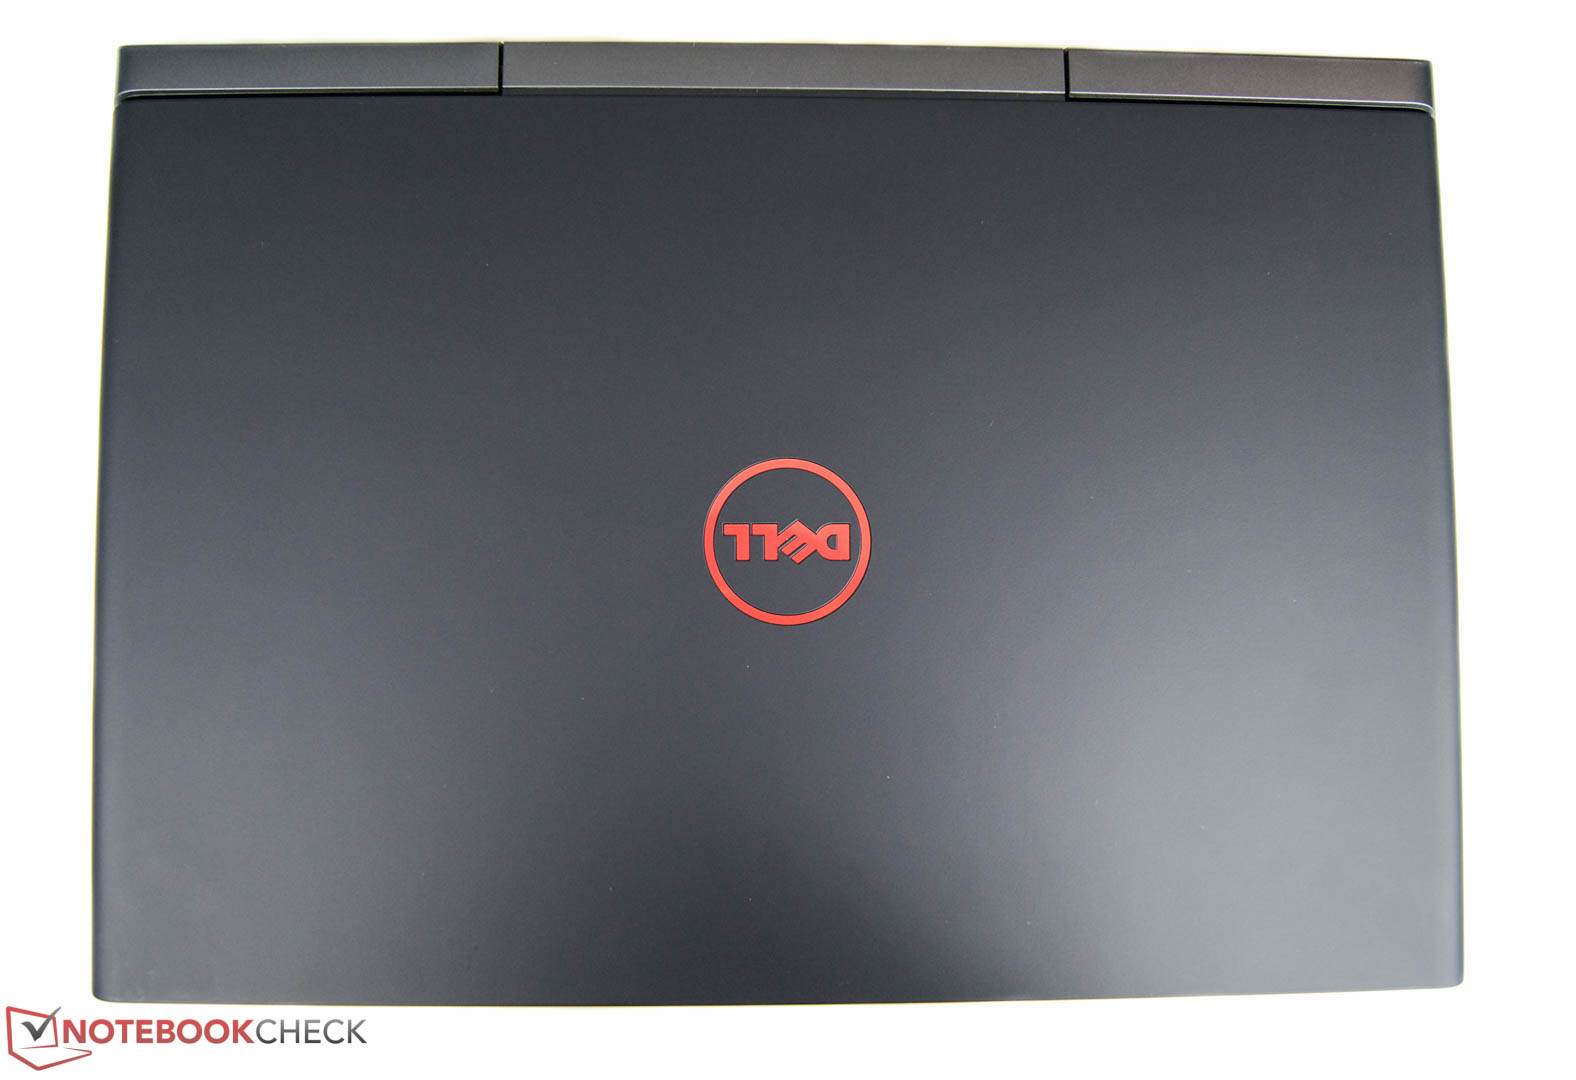
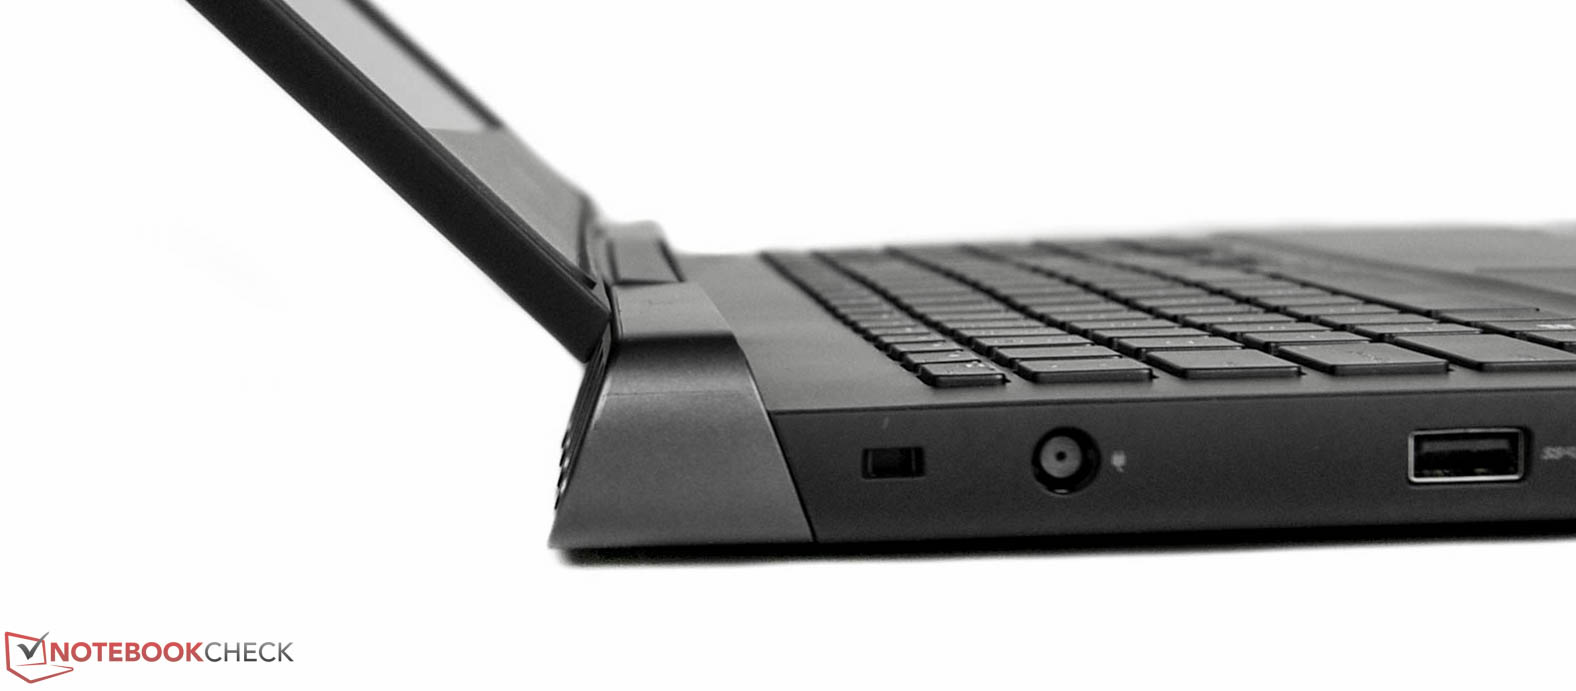
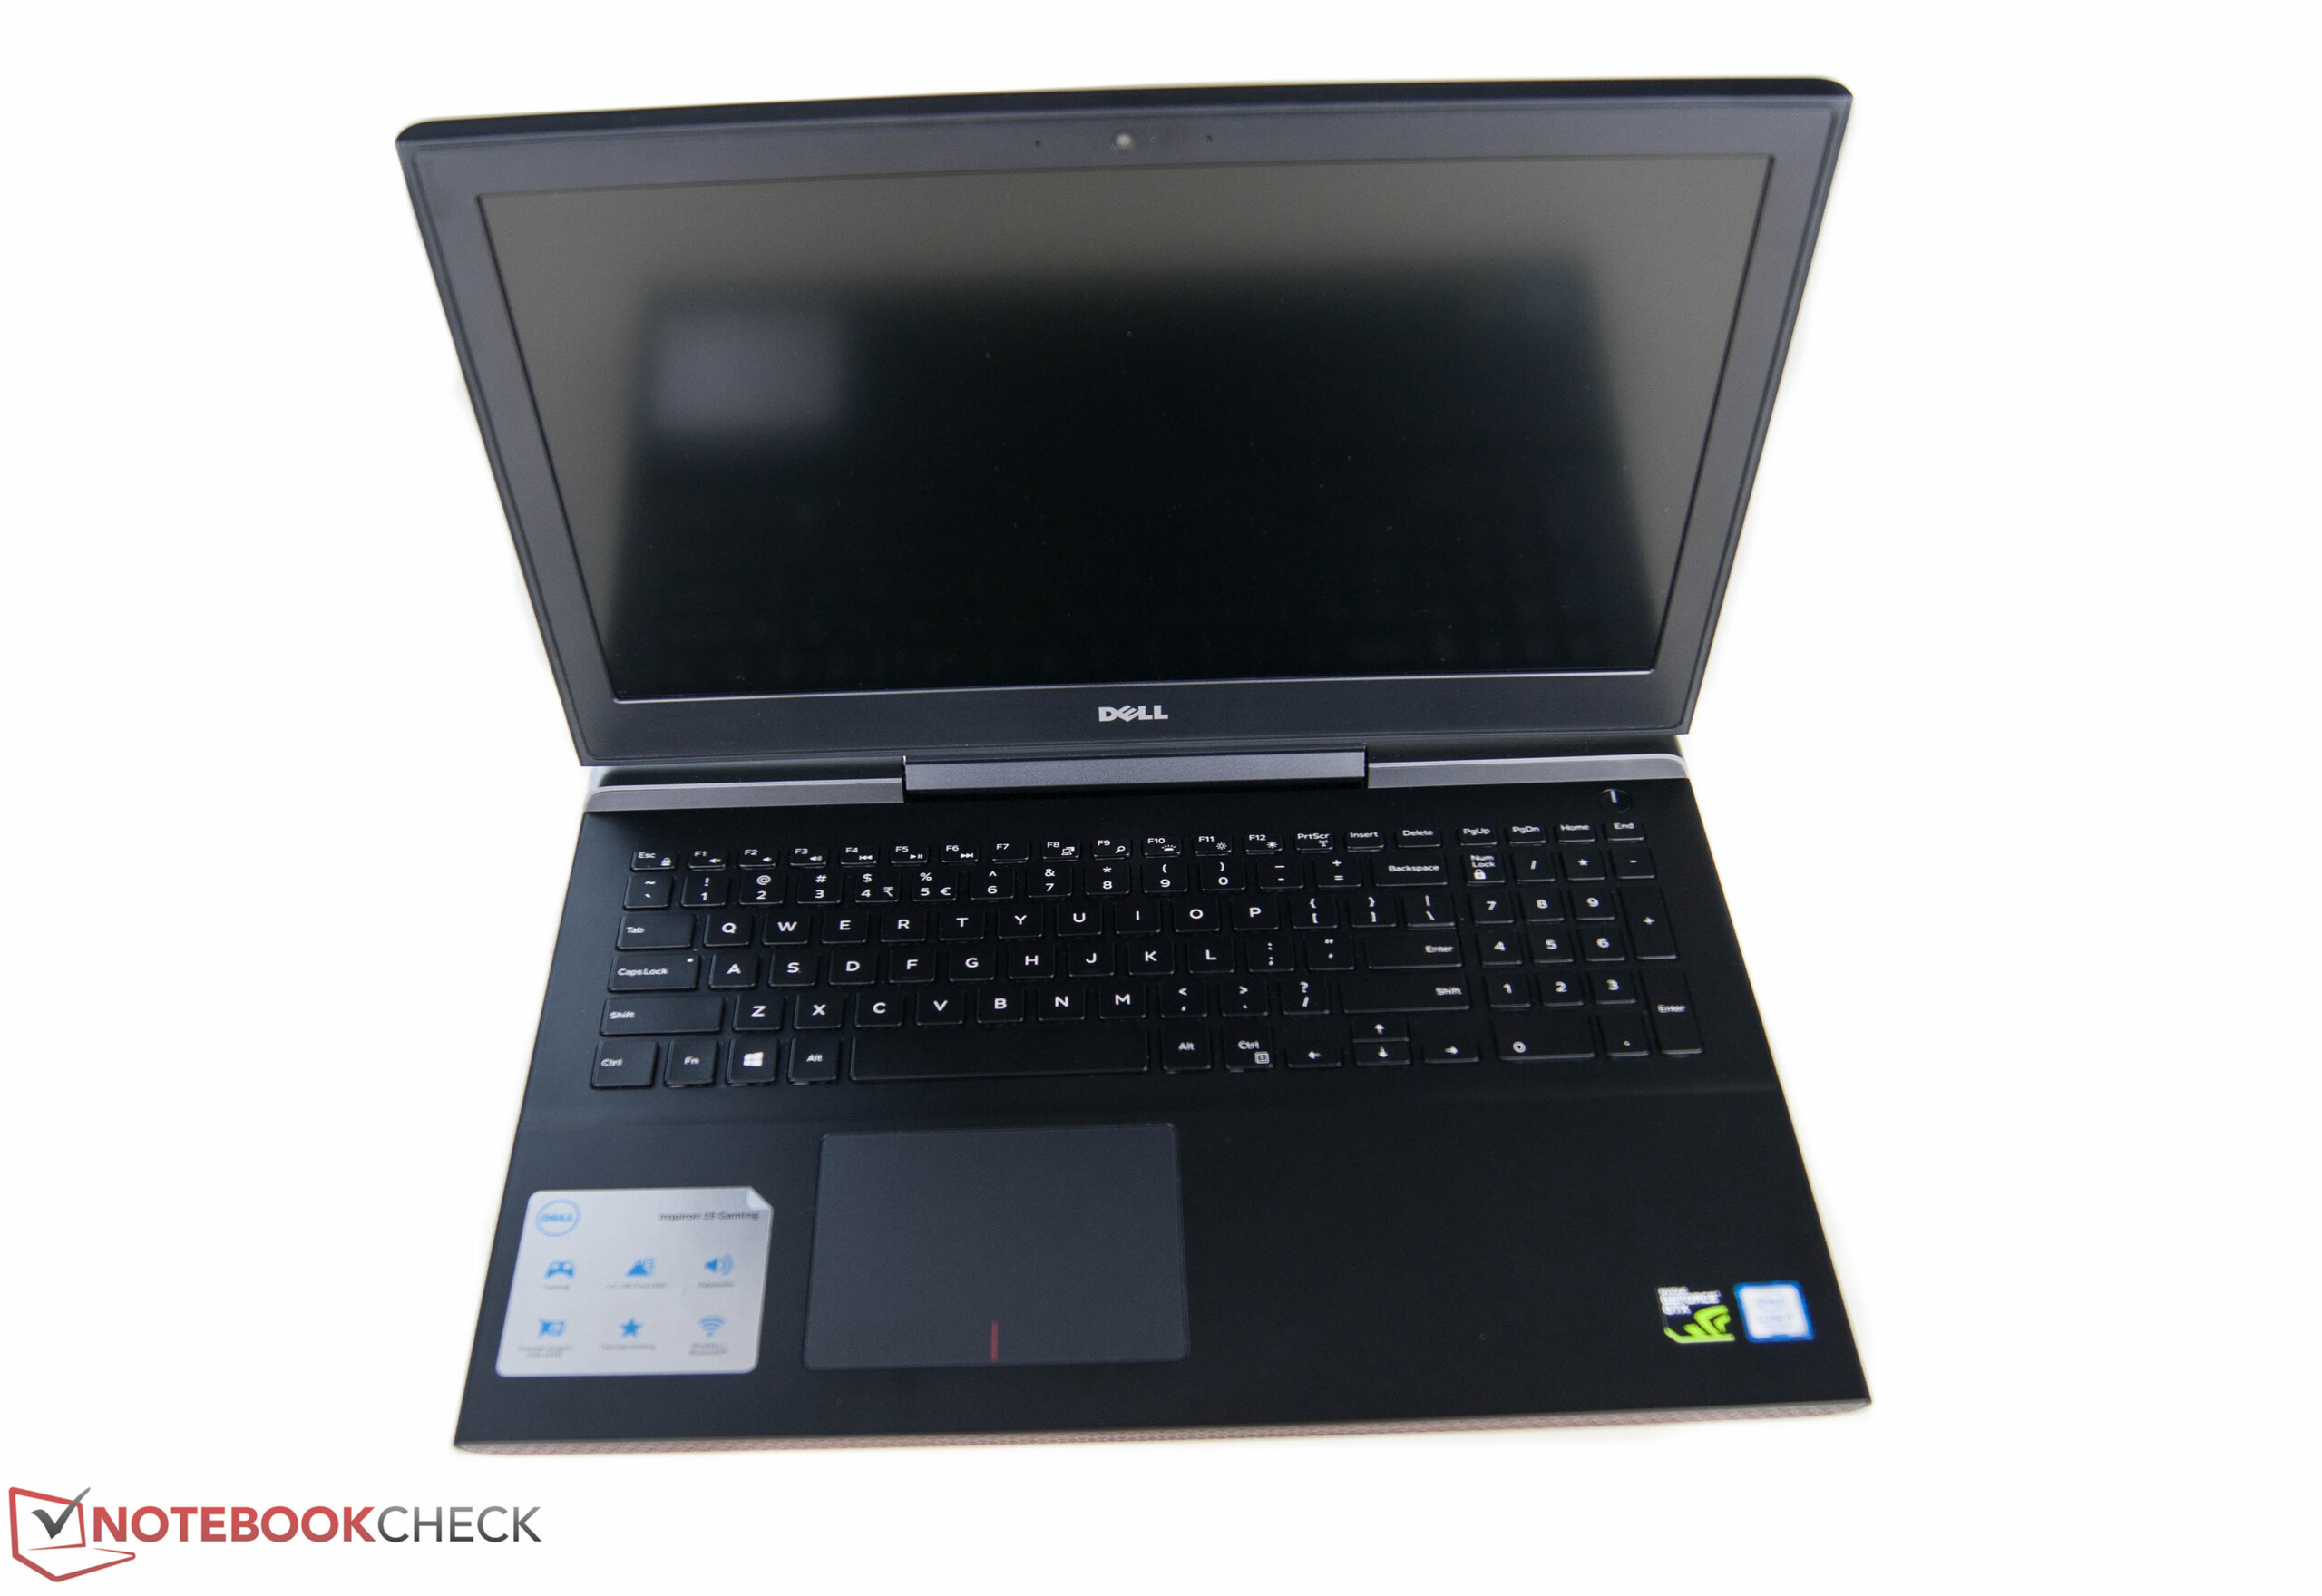
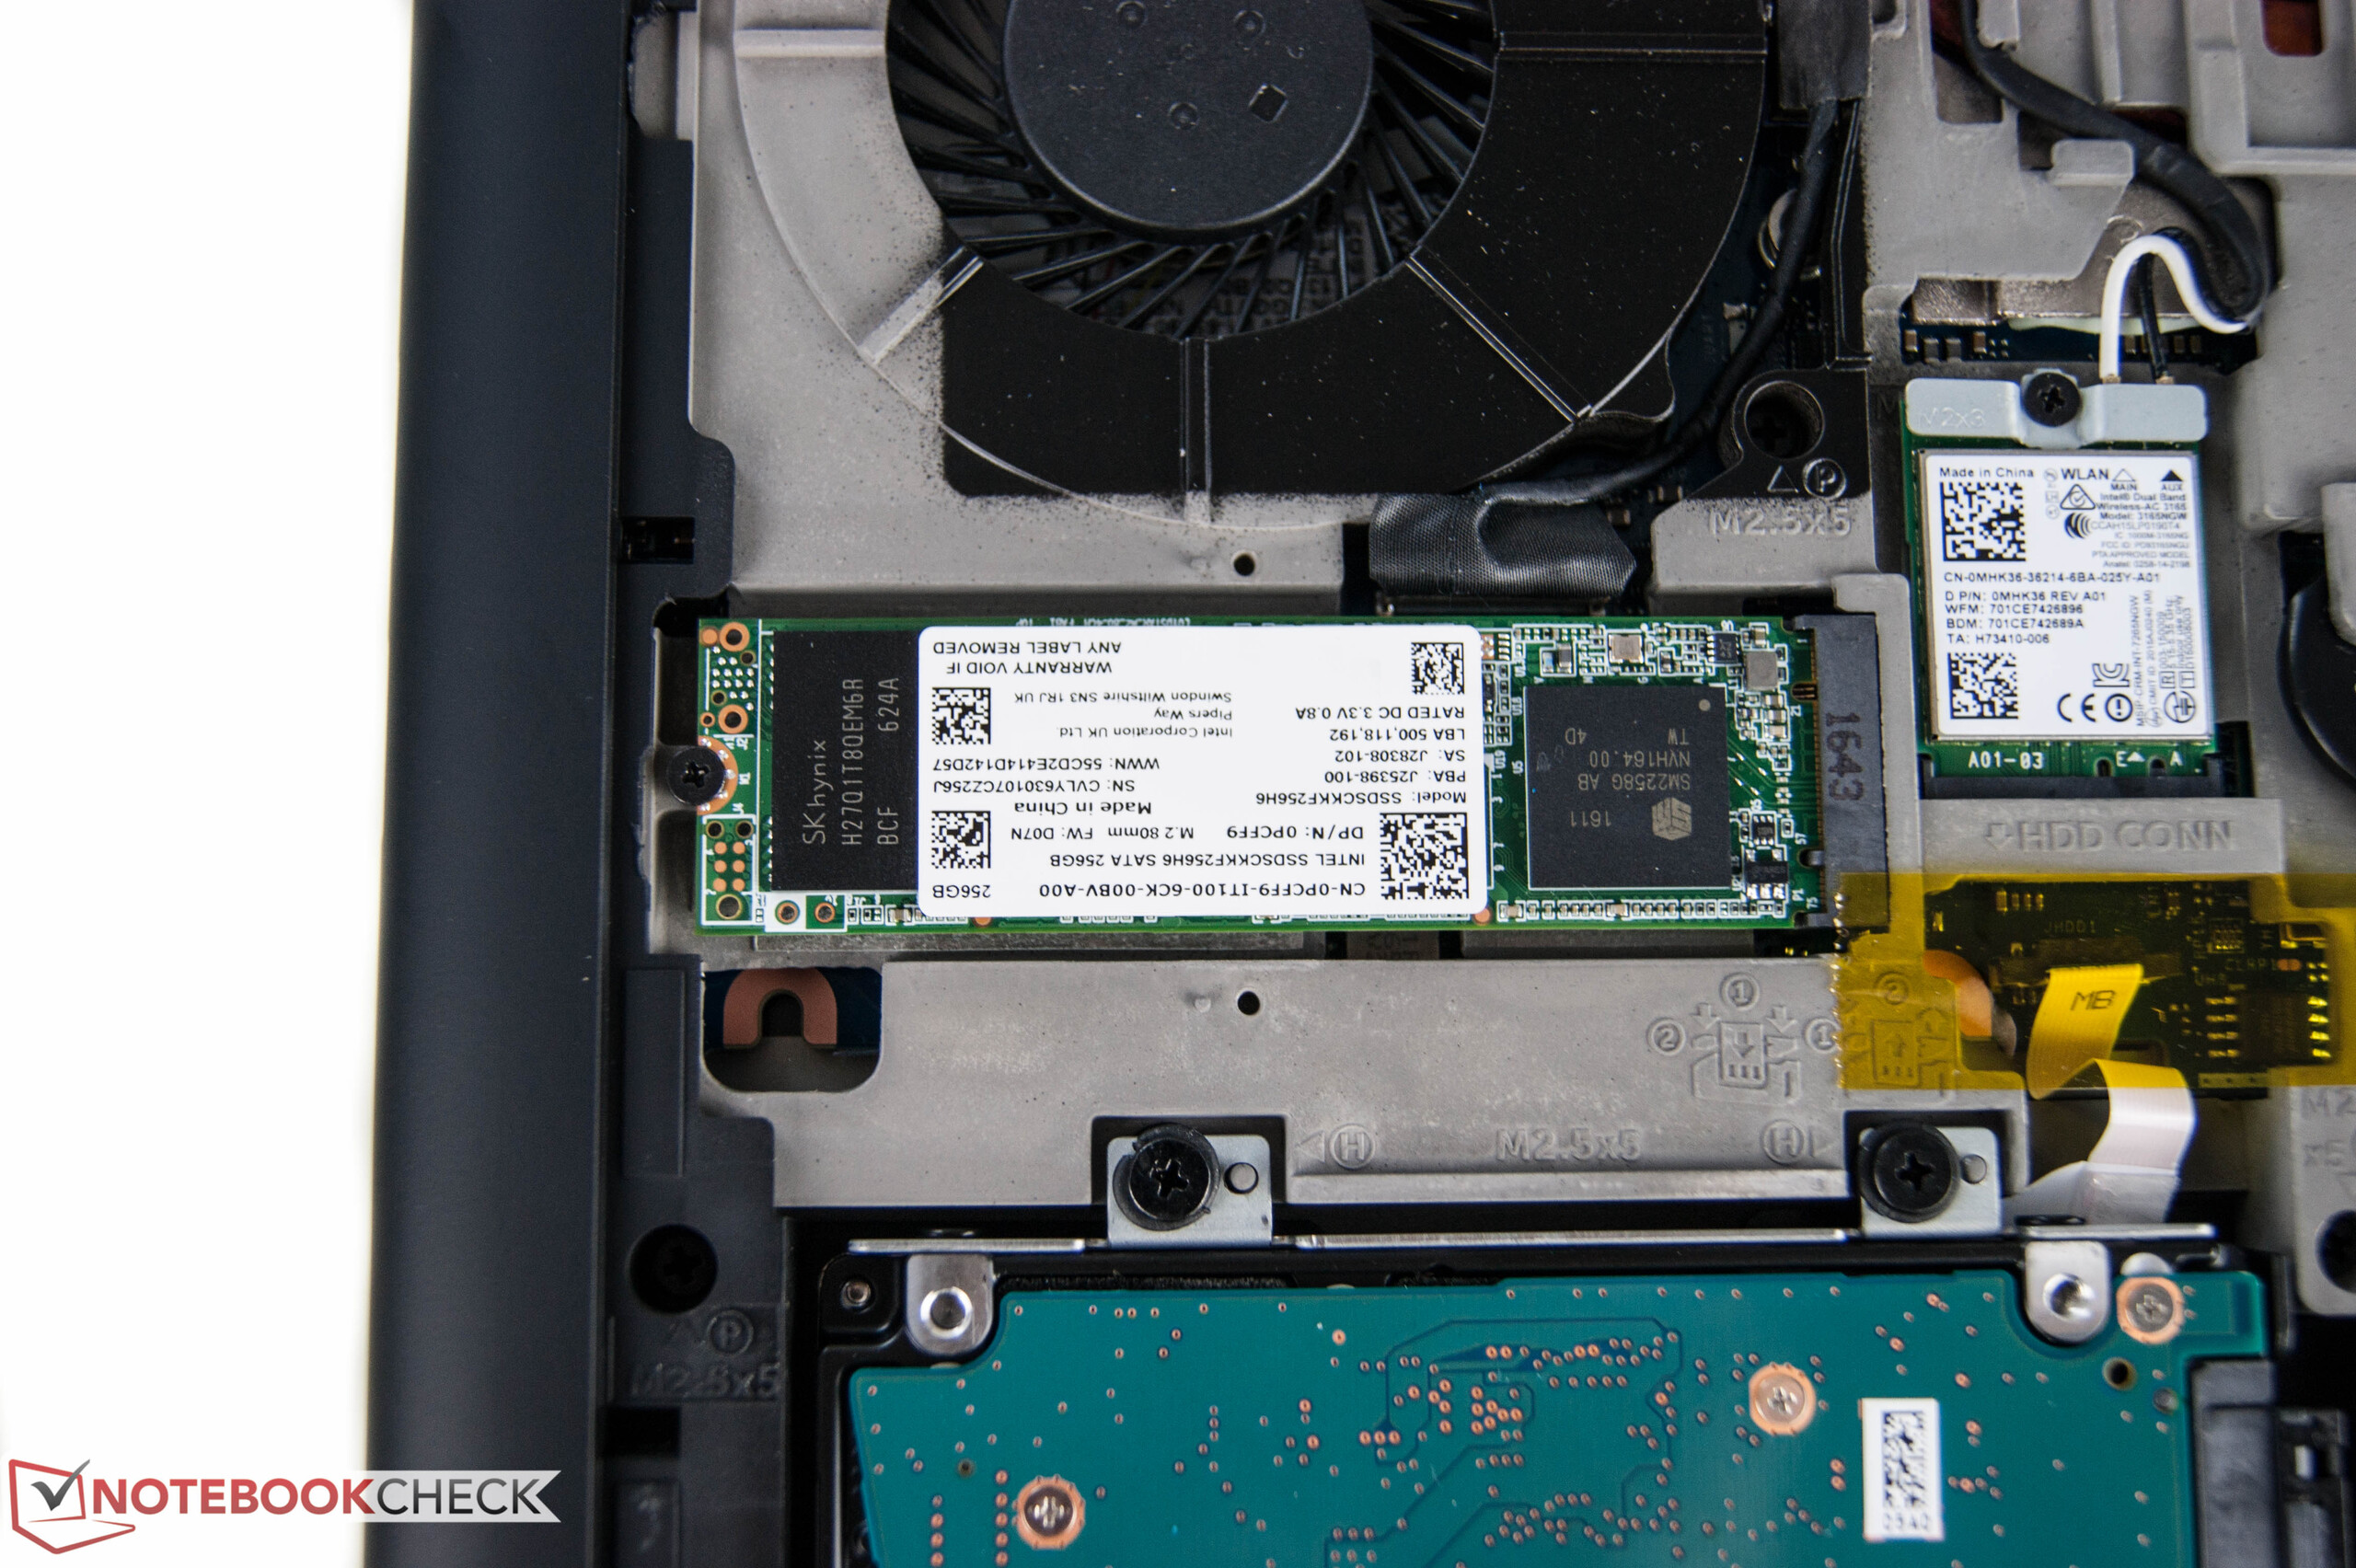
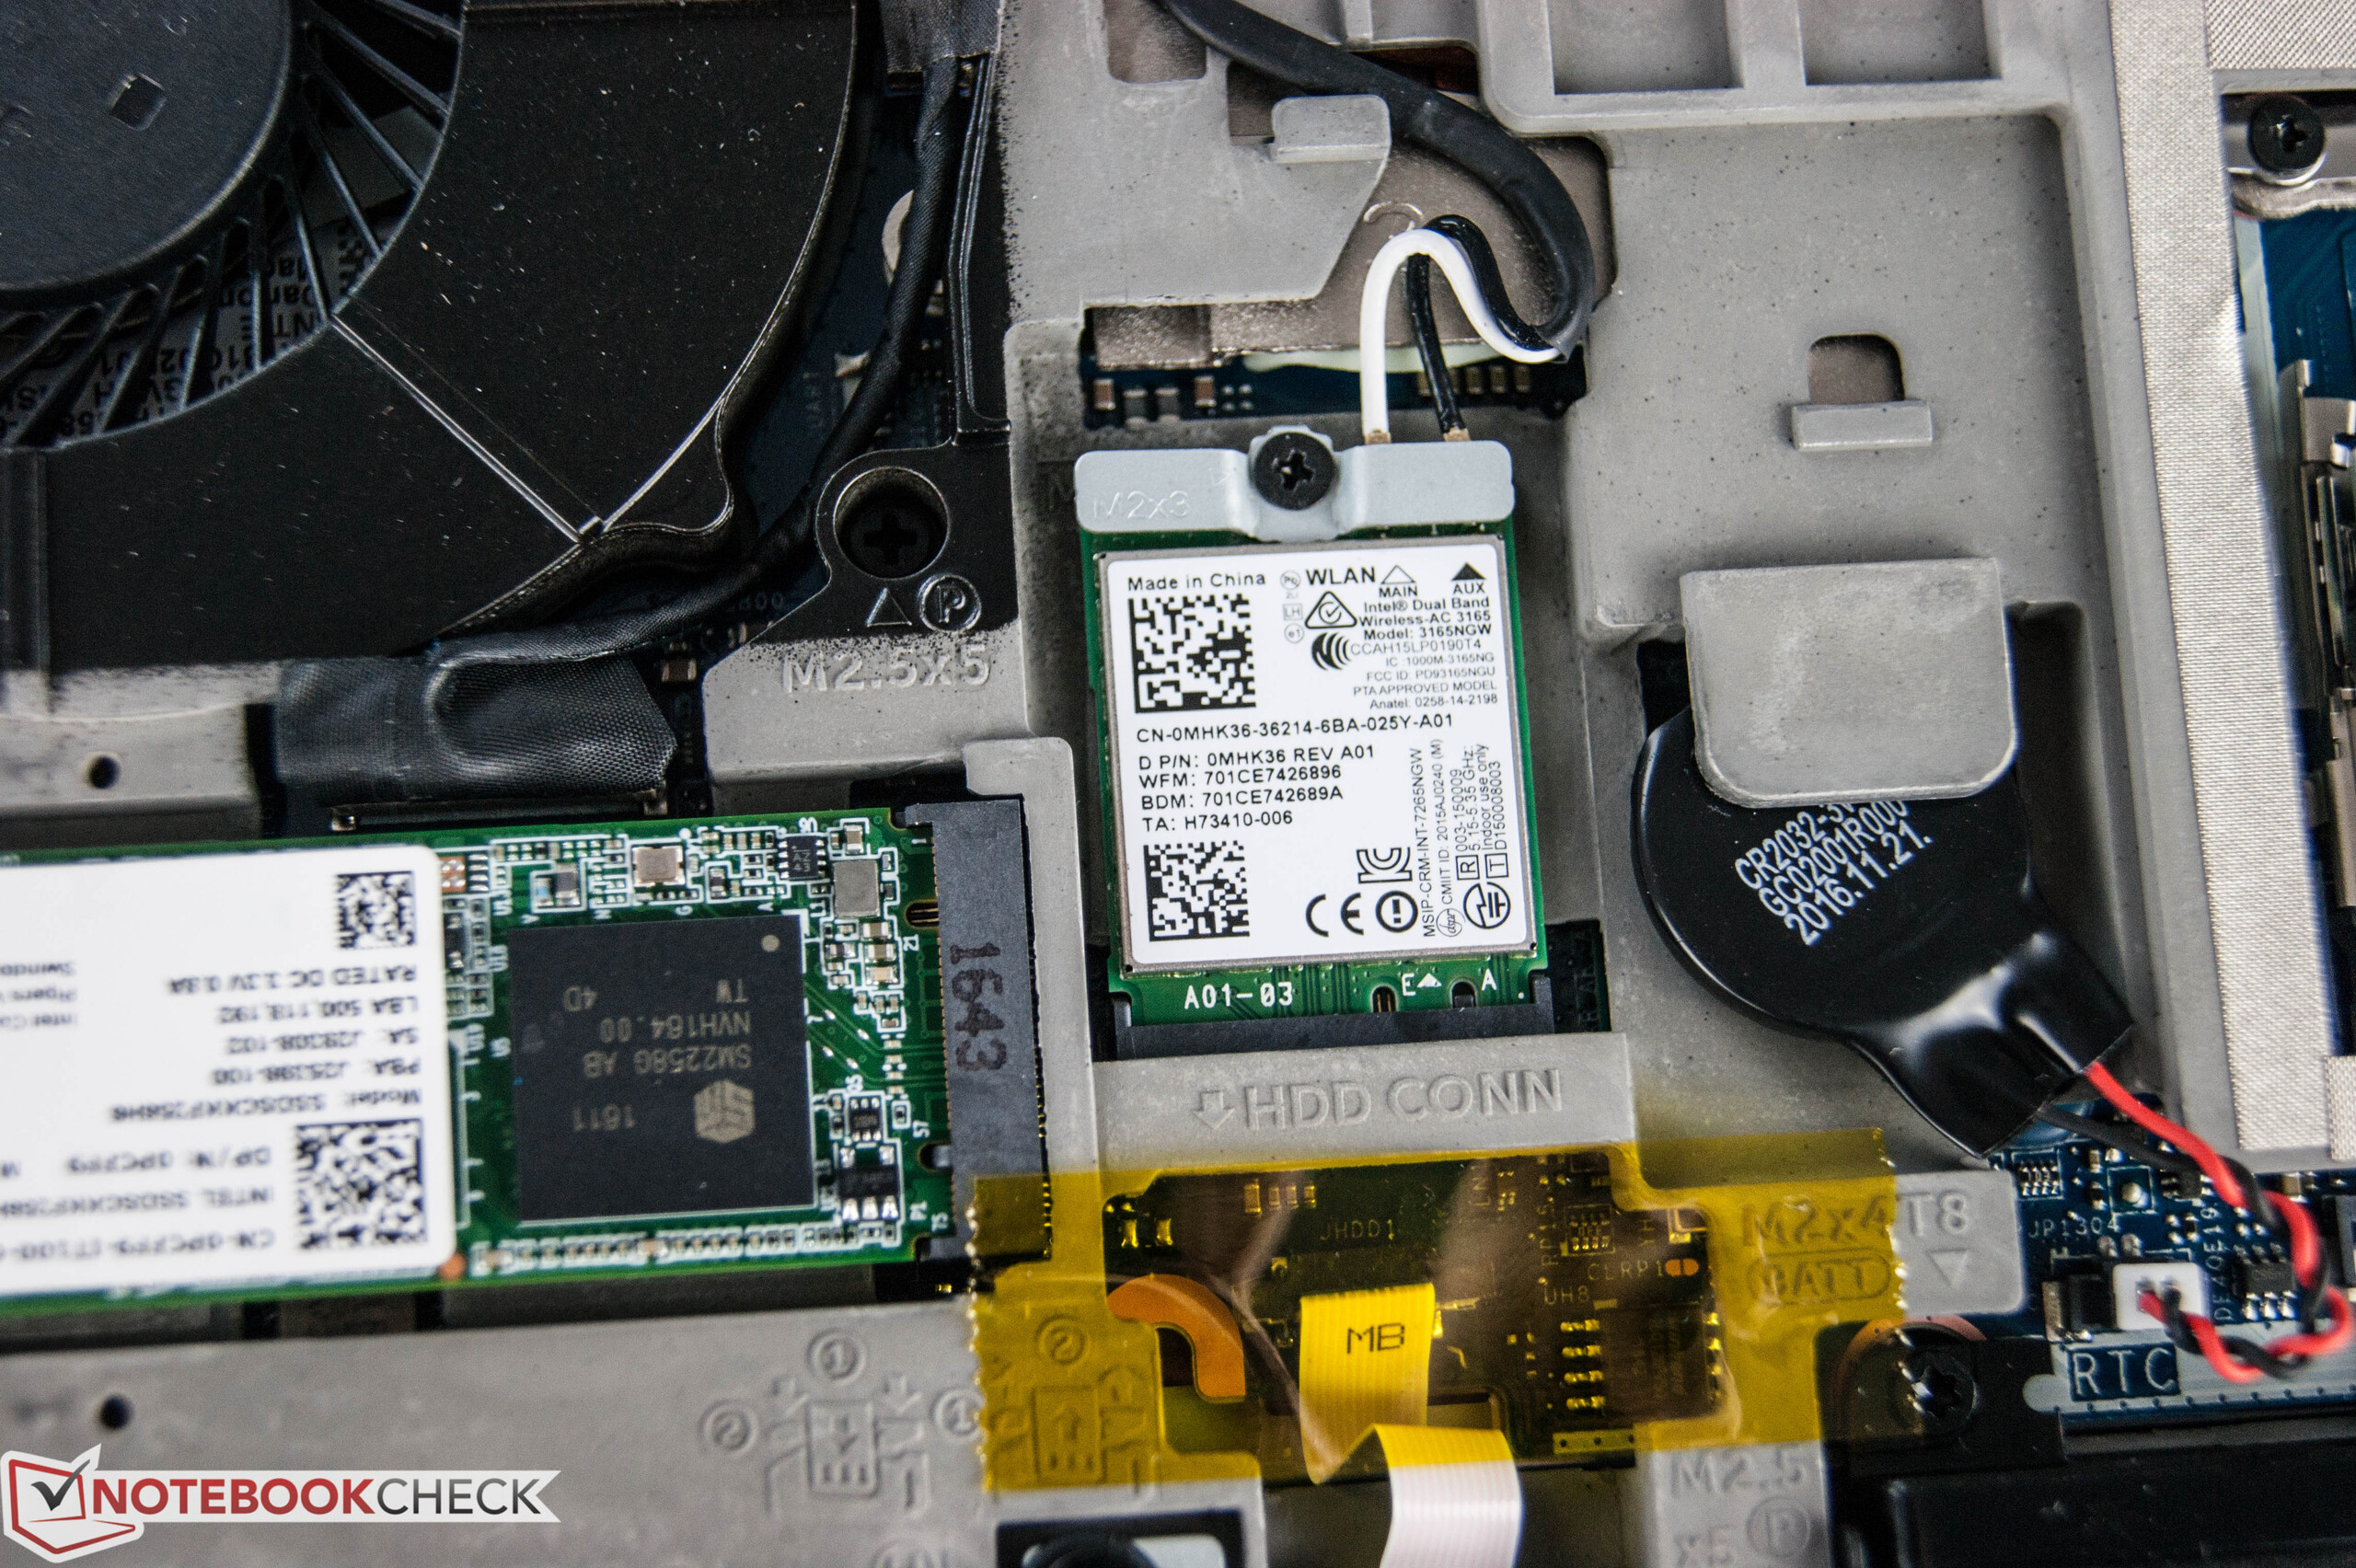
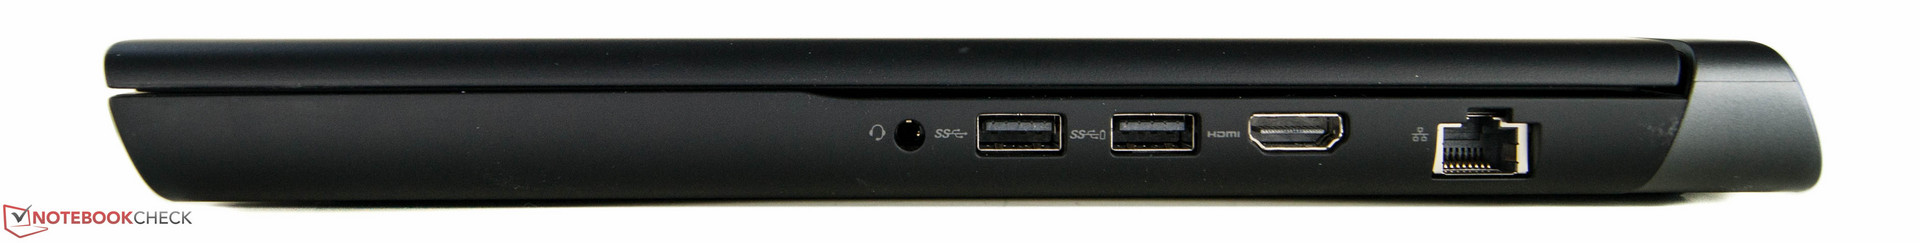
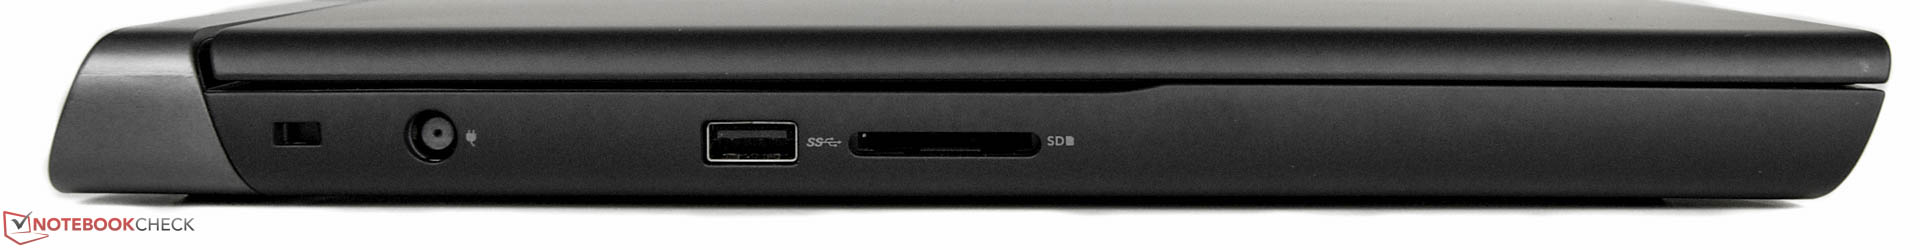
Een game notebook voor alledag. Dell's nieuwe Inspiron 15 uit de 7000 serie bewijst zijn bestaansrecht in de game notebook wereld. Dat begint met de goed gebouwde behuizing, die onderhoud makkelijk maakt. Er zijn voor een 15-inch notebook echter maar een beperkt aantal typen aansluitingen. Ook de prestaties van de SD-kaartlezer zijn slecht. De fabrikant biedt wel fatsoenlijke invoerapparaten. Het toetsenbord is zelfs verlicht, heeft een numeriek toetsendeel en is spatwaterresistent. We waren minder onder de indruk van de smalle pijltoetsen, wat vooral in race games onhandig is. Het enige echte teleurstellende aan de Inspiron 15 is het Full HD TN-paneel, wat niet alleen erg smalle kijkhoeken heeft, maar ook een erg zichtbare blauwe waas heeft. Dell had op zijn minst een IPS-beeldscherm optie moeten aanbieden.
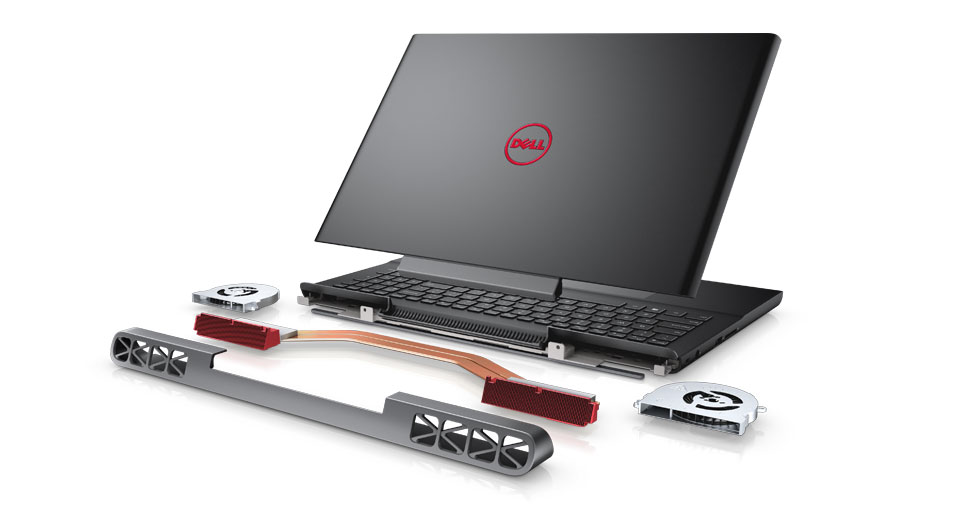
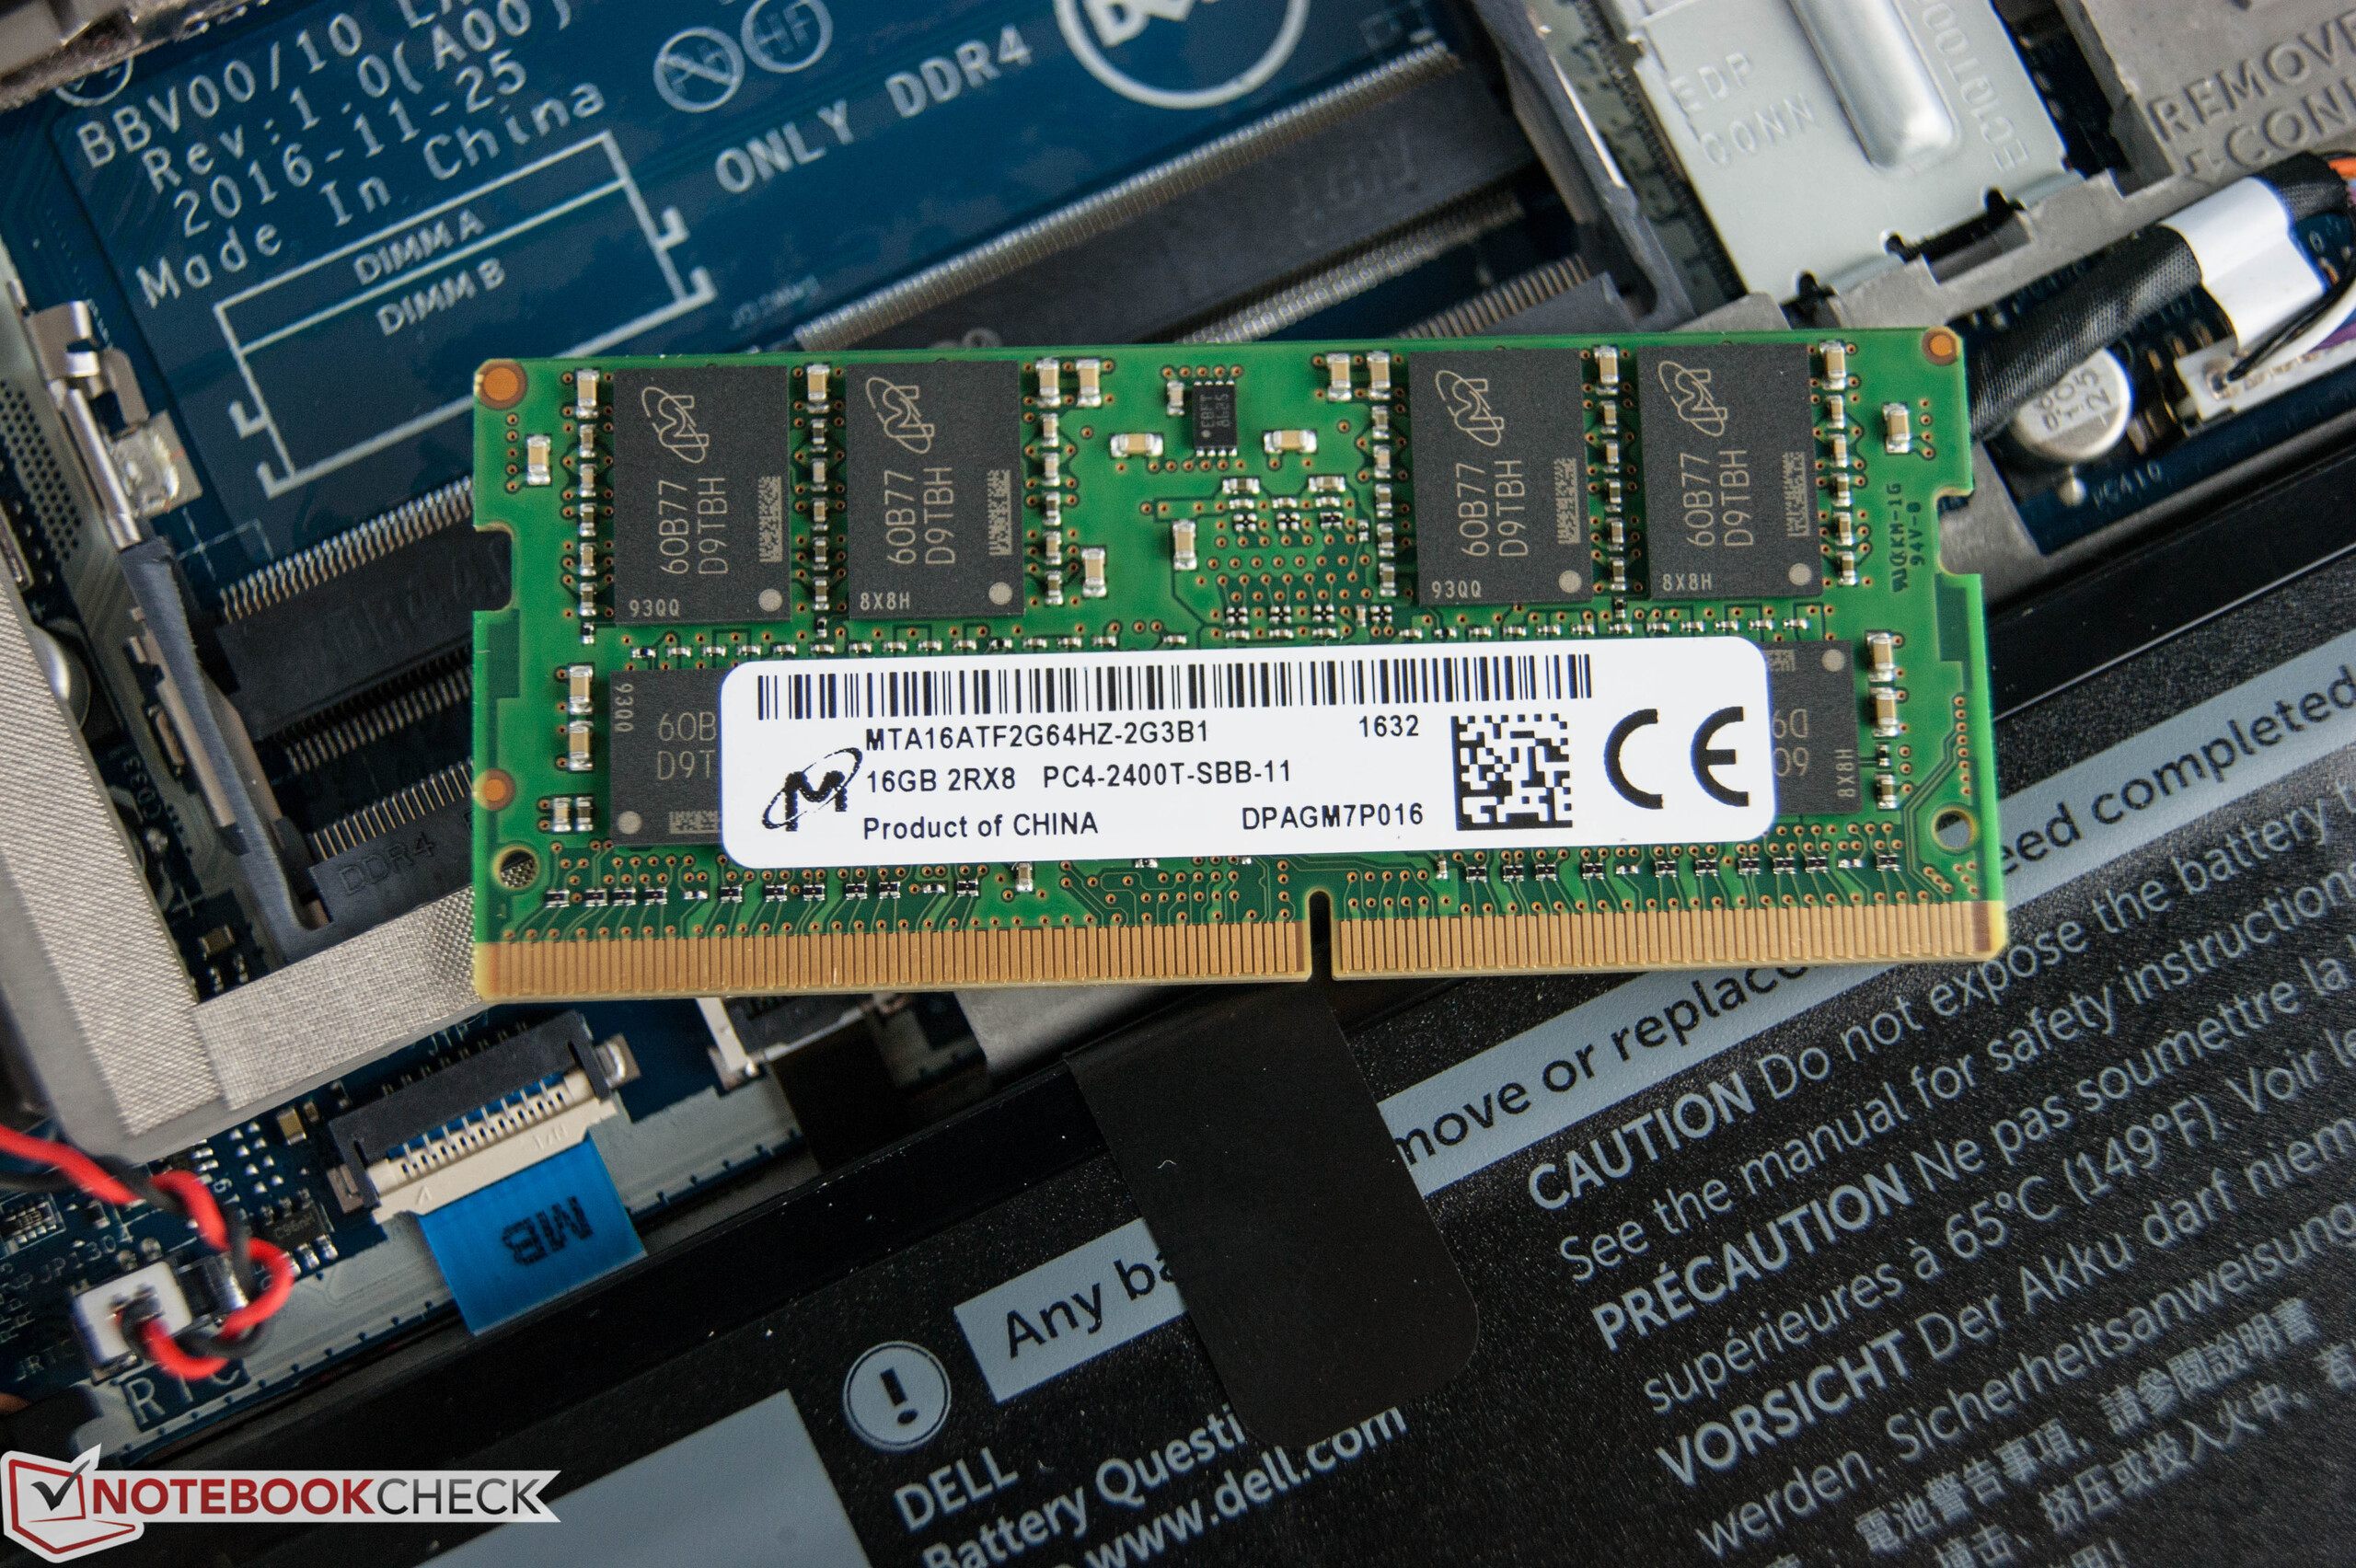
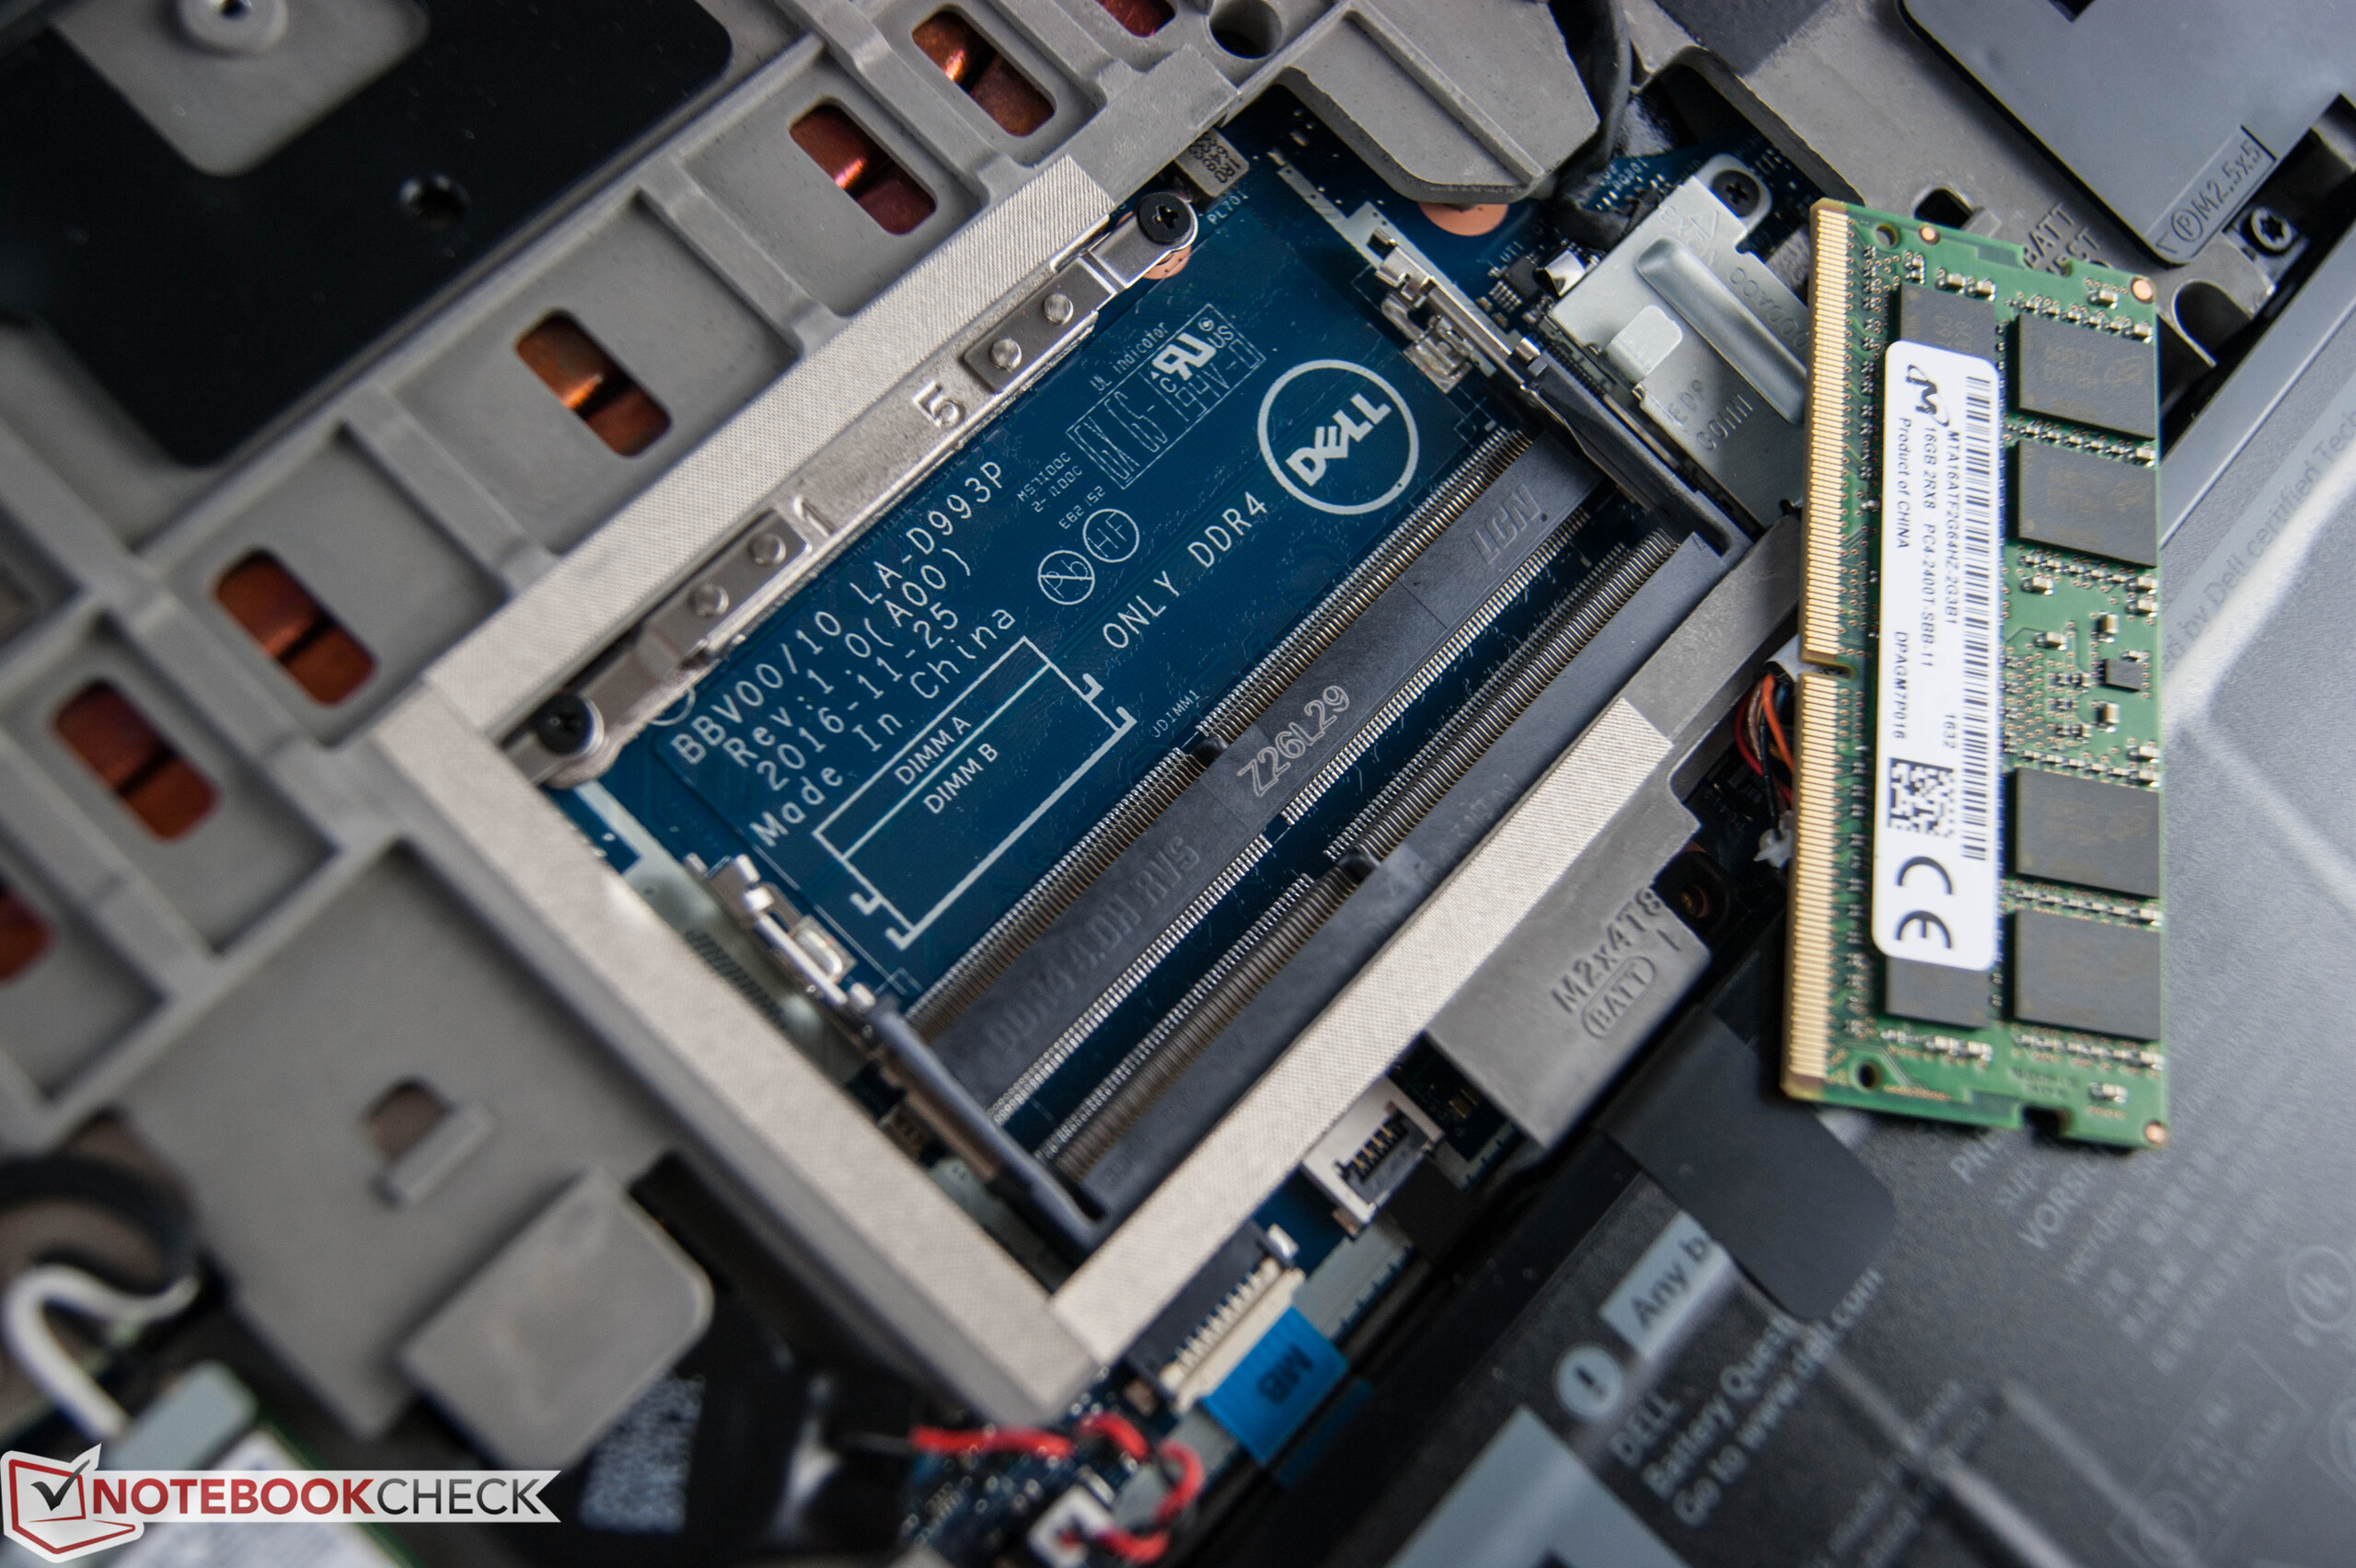
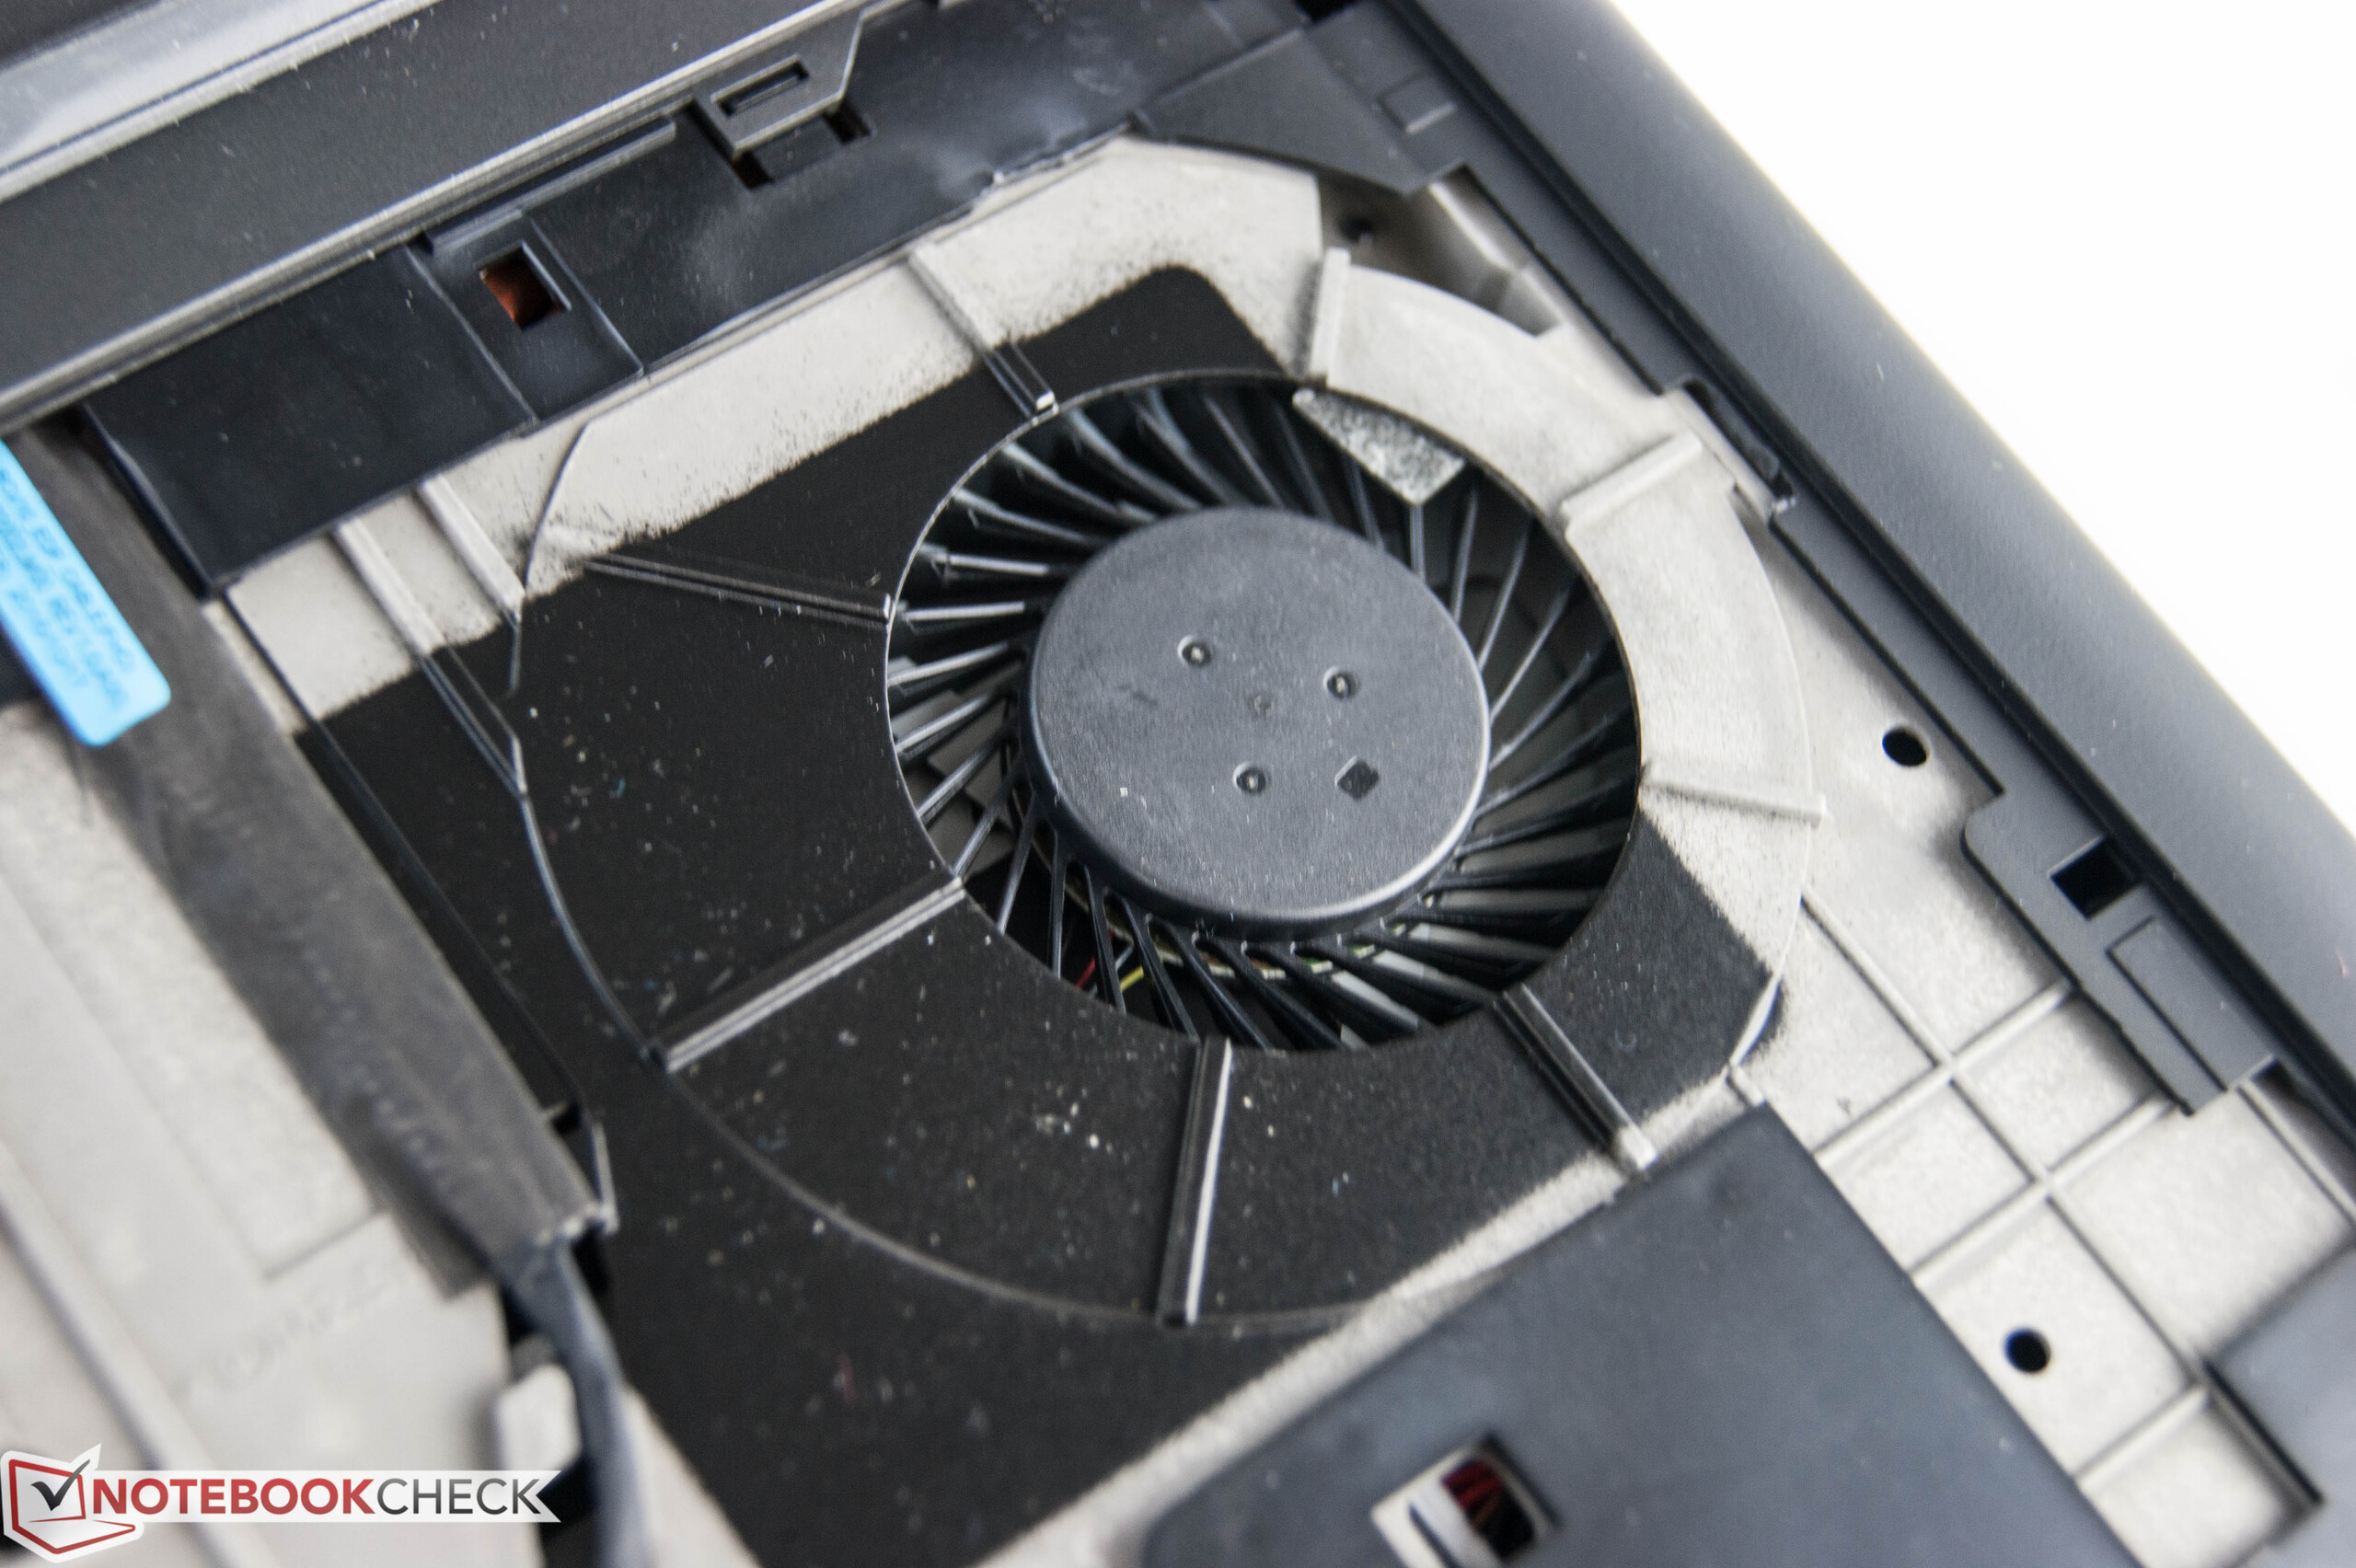
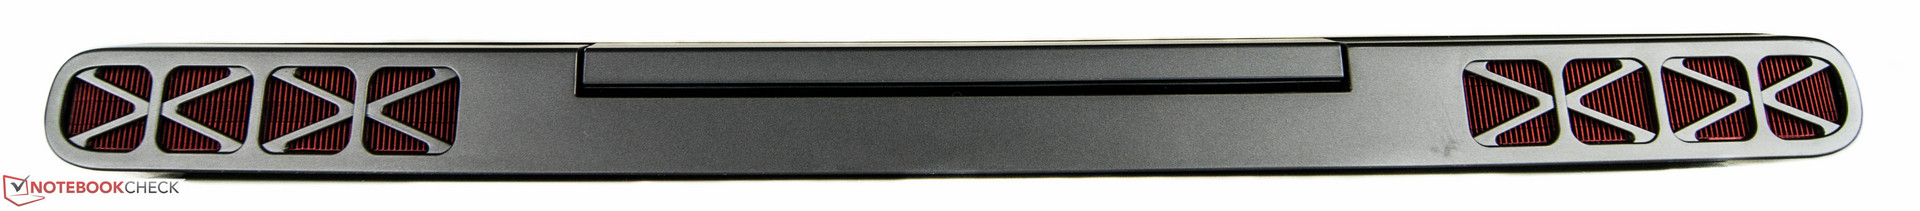
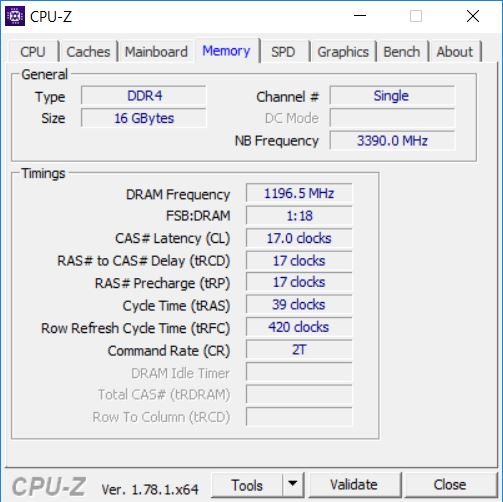
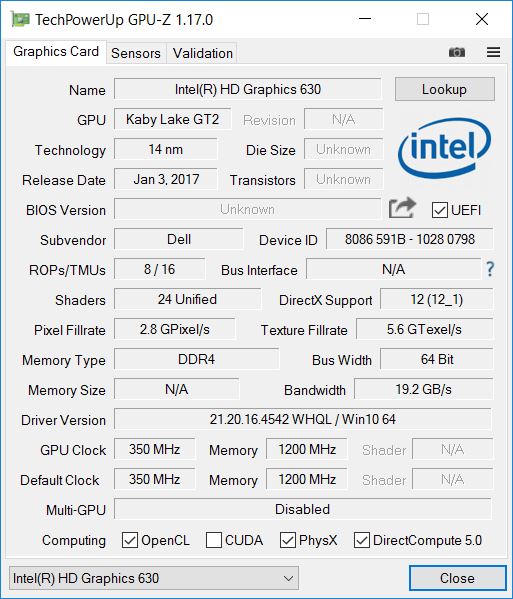
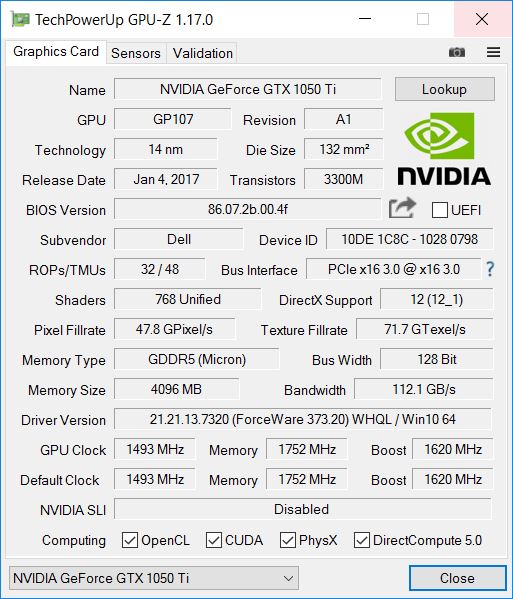
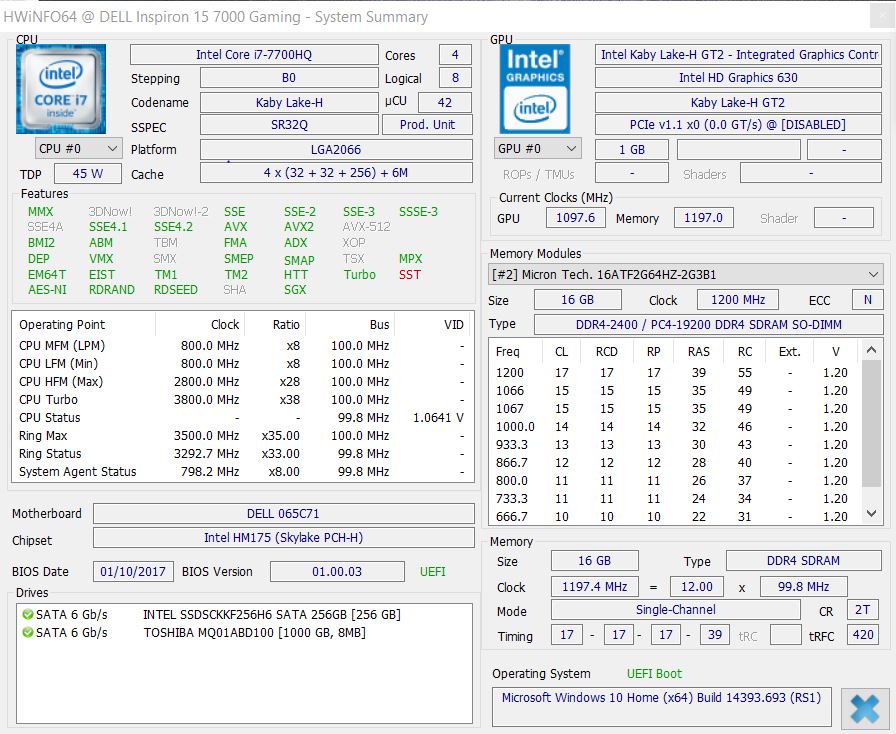
In de verschillende tests kan Dell's nieuwste game notebook zijn sterke punten laten zien: de Intel Core i7 processor en nVidia GeForce GTX 1050 Ti worden gecombineerd met een snelle SSD en 16 GB DDR4 RAM. Dit resulteert in uitstekende systeem- en game prestaties. De Inspiron 15 presteert echter ook erg goed op andere vlakken dan gamen. Bij normaal gebruik is de ventilator nauwelijks hoorbaar en de temperatuur blijft op een acceptabel niveau in elk scenario. Hoewel de game notebook door zijn hoogte en gewicht zelden erg mobiel gebruikt zal worden, zou de batterijlevensduur dit wel mogelijk maken. Ons testmodel heeft een groter uithoudingsvermogen dan verscheidene mobiele subnotebooks hebben.
Dell biedt een superieure game notebook aan voor een prijs vanaf 1.000 EUR (~$1062), en kan duurdere concurrenten met open vizier tegemoet treden.
Diegenen die onoverkomelijke bezwaren hebben tegen het beeldscherm kunnen de duurdere UHD variant overwegen. Het is nog maar afwachten of de Duitse versies van de Inspiron 15 in IPS varianten beschikbaar komen. Een ieder die nog hogere game prestaties en een IPS-paneel willen moeten de Asus ROG Strix GL502VM overwegen. overwegen.
Dell Inspiron 15 7000 7567
- 07-02-2017 v6 (old)
Nino Ricchizzi