Kort testrapport MSI GL62M 7RD-077 Notebook

| SD Card Reader | |
| average JPG Copy Test (av. of 3 runs) | |
| HP Omen 15-ax007ng | |
| Asus Strix GL502VM-FY039T | |
| MSI GL62M 7RD-077 | |
| MSI GL62-6QFi781H11 | |
| Acer Aspire VX5-591G-D0DD | |
| maximum AS SSD Seq Read Test (1GB) | |
| HP Omen 15-ax007ng | |
| Asus Strix GL502VM-FY039T | |
| Acer Aspire VX5-591G-D0DD | |
| MSI GL62M 7RD-077 | |
| MSI GL62-6QFi781H11 | |
| Networking | |
| iperf3 transmit AX12 | |
| Acer Aspire VX5-591G-D0DD | |
| Asus Strix GL502VM-FY039T | |
| MSI GL62M 7RD-077 (jseb) | |
| iperf3 receive AX12 | |
| Asus Strix GL502VM-FY039T | |
| Acer Aspire VX5-591G-D0DD | |
| MSI GL62M 7RD-077 (jseb) | |
| |||||||||||||||||||||||||
Helderheidsverdeling: 79 %
Helderheid in Batterij-modus: 256 cd/m²
Contrast: 478:1 (Zwart: 0.54 cd/m²)
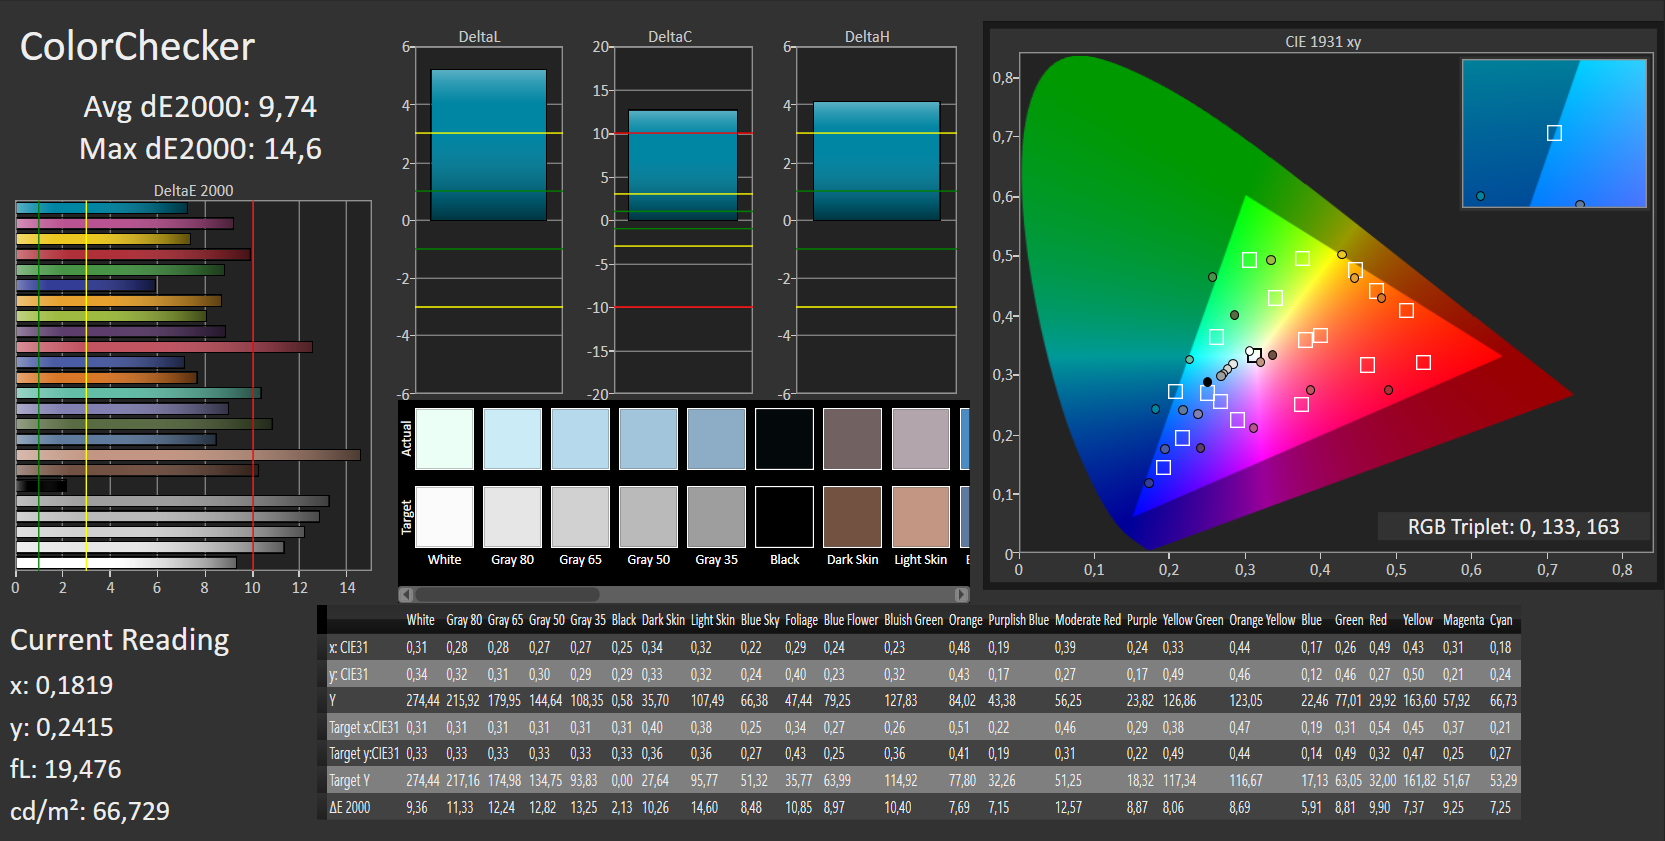
ΔE ColorChecker Calman: 9.74 | ∀{0.5-29.43 Ø4.73}
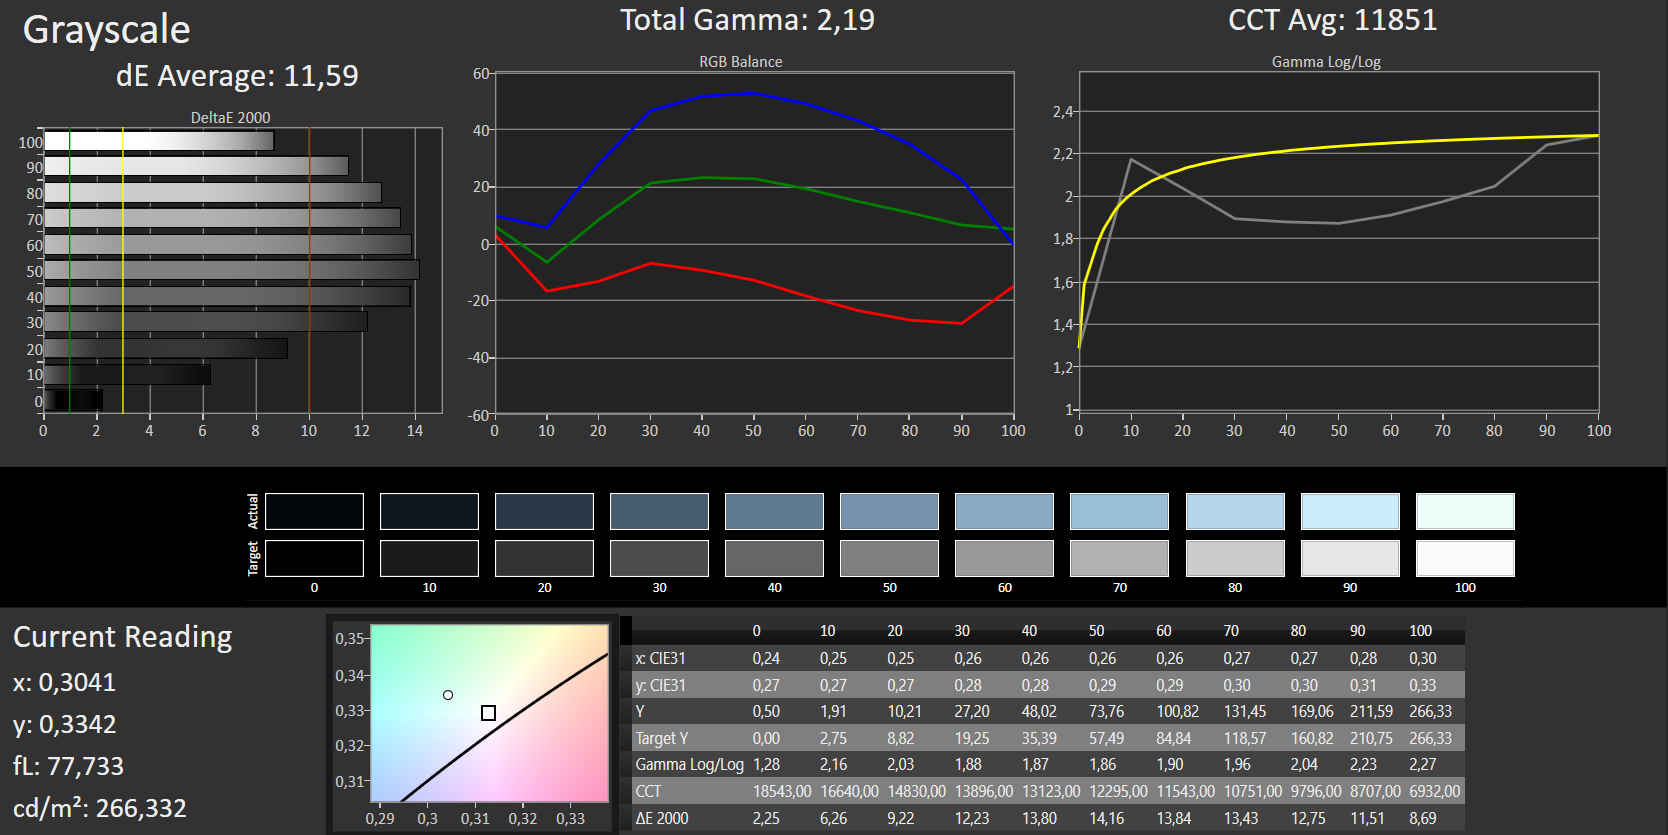
ΔE Greyscale Calman: 11.59 | ∀{0.09-98 Ø4.97}
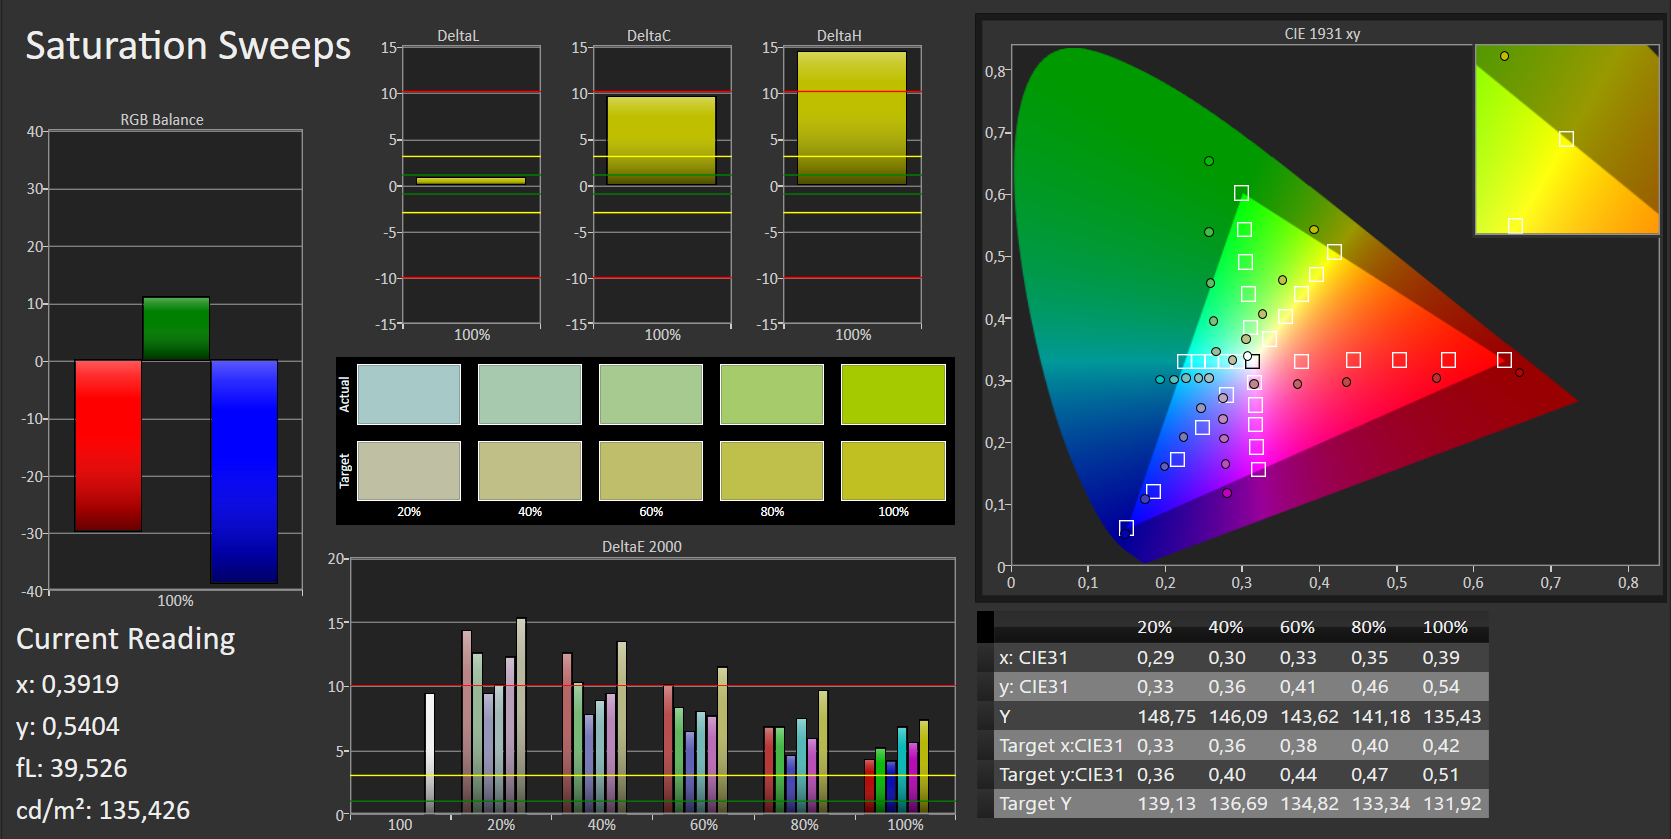
100% sRGB (Argyll 1.6.3 3D)
76% AdobeRGB 1998 (Argyll 1.6.3 3D)
83.8% AdobeRGB 1998 (Argyll 3D)
100% sRGB (Argyll 3D)
85.4% Display P3 (Argyll 3D)
Gamma: 2.19
CCT: 11851 K
| MSI GL62M 7RD-077 TN LED, 1920x1080, 15.6" | MSI GL62-6QFi781H11 TN LED, 1920x1080, 15.6" | Asus Strix GL502VM-FY039T IPS, 1920x1080, 15.6" | HP Omen 15-ax007ng IPS, 1920x1080, 15.6" | |
|---|---|---|---|---|
| Display | 0% | -23% | -36% | |
| Display P3 Coverage (%) | 85.4 | 85.8 0% | 64.5 -24% | 59.9 -30% 40.34 -53% |
| sRGB Coverage (%) | 100 | 99.8 0% | 83.4 -17% | 85.9 -14% 60.3 -40% |
| AdobeRGB 1998 Coverage (%) | 83.8 | 84.1 0% | 60.9 -27% | 61.6 -26% 41.73 -50% |
| Response Times | 12% | 12% | -16% | |
| Response Time Grey 50% / Grey 80% * (ms) | 44 ? | 43 ? 2% | 40 ? 9% | 55 ? -25% |
| Response Time Black / White * (ms) | 29 ? | 23 ? 21% | 25 ? 14% | 31 ? -7% |
| PWM Frequency (Hz) | 198 ? | 1000 ? | ||
| Screen | -3% | 32% | 9% | |
| Brightness middle (cd/m²) | 258 | 216 -16% | 321 24% | 214 -17% |
| Brightness (cd/m²) | 234 | 202 -14% | 296 26% | 203 -13% |
| Brightness Distribution (%) | 79 | 83 5% | 88 11% | 79 0% |
| Black Level * (cd/m²) | 0.54 | 0.48 11% | 0.33 39% | 0.28 48% |
| Contrast (:1) | 478 | 450 -6% | 973 104% | 764 60% |
| Colorchecker dE 2000 * | 9.74 | 9.98 -2% | 4.42 55% | 6.04 38% |
| Colorchecker dE 2000 max. * | 14.6 | 17.12 -17% | 9.78 33% | 12 18% |
| Greyscale dE 2000 * | 11.59 | 10.91 6% | 3.34 71% | 5.91 49% |
| Gamma | 2.19 100% | 2.31 95% | 2.4 92% | 2.44 90% |
| CCT | 11851 55% | 13185 49% | 6213 105% | 7362 88% |
| Color Space (Percent of AdobeRGB 1998) (%) | 76 | 75 -1% | 55 -28% | 38 -50% |
| Color Space (Percent of sRGB) (%) | 100 | 100 0% | 83 -17% | 60 -40% |
| Totaal Gemiddelde (Programma / Instellingen) | 3% /
-1% | 7% /
18% | -14% /
-8% |
* ... kleiner is beter
Screen Flickering / PWM (Pulse-Width Modulation)
| Screen flickering / PWM waargenomen | 198 Hz | ≤ 90 % helderheid instelling | 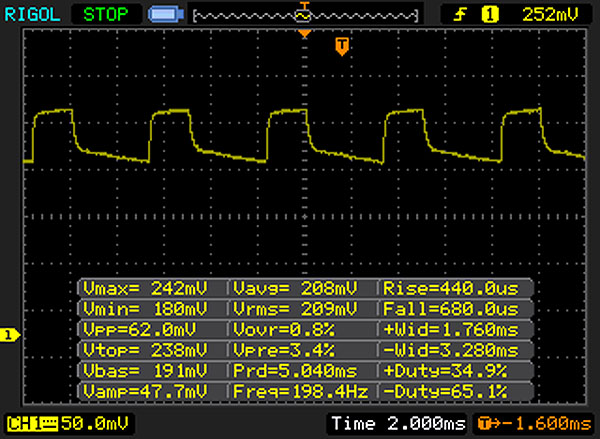 |
De achtergrondverlichting van het scherm flikkert op 198 Hz (in het slechtste geval, bijvoorbeeld bij gebruik van PWM) aan een helderheid van 90 % en lager. Boven deze helderheid zou er geen flickering / PWM mogen optreden. De frequentie van 198 Hz is redelijk laag en de meeste mensen die gevoelig zijn aan flickering kunnen dit dus waarnemen of geïrriteerde ogen krijgen (gebruikmakend van de vermelde helderheid en lager). Ter vergelijking: 52 % van alle geteste toestellen maakten geen gebruik van PWM om de schermhelderheid te verlagen. Als het wel werd gebruikt, werd een gemiddelde van 7801 (minimum: 5 - maximum: 343500) Hz waargenomen. | |||
Responstijd Scherm
| ↔ Responstijd Zwart naar Wit | ||
|---|---|---|
| 29 ms ... stijging ↗ en daling ↘ gecombineerd | ↗ 12 ms stijging | 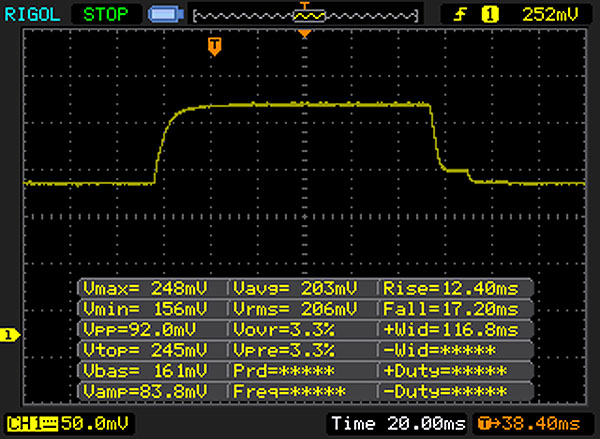 |
| ↘ 17 ms daling | ||
| Het scherm vertoonde relatief trage responstijden in onze tests en is misschien te traag voor games. Ter vergelijking: alle testtoestellen variëren van 0.1 (minimum) tot 240 (maximum) ms. » 77 % van alle toestellen zijn beter. Dit betekent dat de gemeten responstijd slechter is dan het gemiddelde (19.9 ms) van alle geteste toestellen. | ||
| ↔ Responstijd 50% Grijs naar 80% Grijs | ||
| 44 ms ... stijging ↗ en daling ↘ gecombineerd | ↗ 24 ms stijging | 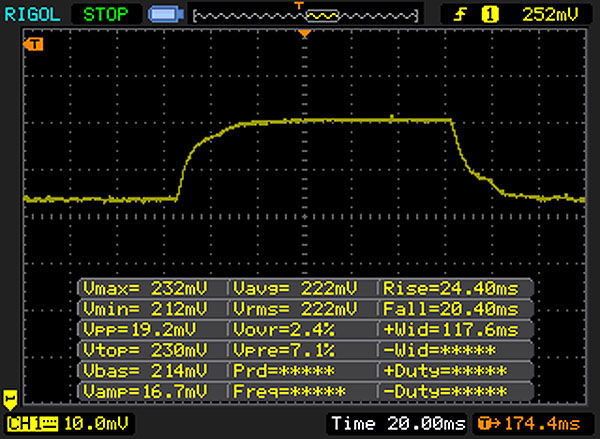 |
| ↘ 20 ms daling | ||
| Het scherm vertoonde trage responstijden in onze tests en is misschien te traag voor games. Ter vergelijking: alle testtoestellen variëren van 0.165 (minimum) tot 636 (maximum) ms. » 73 % van alle toestellen zijn beter. Dit betekent dat de gemeten responstijd slechter is dan het gemiddelde (31.1 ms) van alle geteste toestellen. | ||
| Cinebench R11.5 | |
| CPU Multi 64Bit | |
| MSI GL62M 7RD-077 | |
| Asus Strix GL753VD-GC045T | |
| Gigabyte P57X v7 | |
| Asus Strix GL502VM-FY039T | |
| MSI GL62-6QFi781H11 | |
| HP Omen 15-ax007ng | |
| Acer Aspire V15 Nitro BE VN7-592G-79DV | |
| CPU Single 64Bit | |
| Asus Strix GL753VD-GC045T | |
| Gigabyte P57X v7 | |
| HP Omen 15-ax007ng | |
| Asus Strix GL502VM-FY039T | |
| MSI GL62M 7RD-077 | |
| Acer Aspire V15 Nitro BE VN7-592G-79DV | |
| MSI GL62-6QFi781H11 | |
| Cinebench R10 | |
| Rendering Multiple CPUs 32Bit | |
| MSI GL62M 7RD-077 | |
| Asus Strix GL502VM-FY039T | |
| Acer Aspire V15 Nitro BE VN7-592G-79DV | |
| Rendering Single 32Bit | |
| MSI GL62M 7RD-077 | |
| Asus Strix GL502VM-FY039T | |
| Acer Aspire V15 Nitro BE VN7-592G-79DV | |
| Geekbench 3 | |
| 32 Bit Single-Core Score | |
| Asus Strix GL502VM-FY039T | |
| Acer Aspire V15 Nitro BE VN7-592G-79DV | |
| MSI GL62M 7RD-077 | |
| 32 Bit Multi-Core Score | |
| MSI GL62M 7RD-077 | |
| Acer Aspire V15 Nitro BE VN7-592G-79DV | |
| Asus Strix GL502VM-FY039T | |
| Geekbench 4.0 | |
| 64 Bit Single-Core Score | |
| Asus Strix GL502VM-FY039T | |
| MSI GL62M 7RD-077 | |
| 64 Bit Multi-Core Score | |
| Asus Strix GL502VM-FY039T | |
| MSI GL62M 7RD-077 | |
| JetStream 1.1 - 1.1 Total | |
| MSI GL62M 7RD-077 | |
| Asus Strix GL502VM-FY039T | |
| Acer Aspire V15 Nitro BE VN7-592G-79DV | |
| Octane V2 - Total Score | |
| MSI GL62M 7RD-077 | |
| Asus Strix GL502VM-FY039T | |
| Acer Aspire V15 Nitro BE VN7-592G-79DV | |
| Mozilla Kraken 1.1 - Total | |
| Acer Aspire V15 Nitro BE VN7-592G-79DV | |
| MSI GL62M 7RD-077 | |
| Asus Strix GL502VM-FY039T | |
* ... kleiner is beter
| PCMark 7 Score | 3818 punten | |
| PCMark 8 Home Score Accelerated v2 | 3899 punten | |
| PCMark 8 Creative Score Accelerated v2 | 4679 punten | |
| PCMark 8 Work Score Accelerated v2 | 4831 punten | |
Help | ||
| PCMark 8 | |
| Home Score Accelerated v2 | |
| Asus Strix GL502VM-FY039T | |
| Asus Strix GL753VD-GC045T | |
| HP Omen 15-ax007ng | |
| MSI GL62M 7RD-077 | |
| Acer Aspire VX5-591G-D0DD | |
| MSI GL62-6QFi781H11 | |
| Gigabyte P57X v7 | |
| Acer Aspire V15 Nitro BE VN7-592G-79DV | |
| Work Score Accelerated v2 | |
| Asus Strix GL502VM-FY039T | |
| HP Omen 15-ax007ng | |
| MSI GL62-6QFi781H11 | |
| MSI GL62M 7RD-077 | |
| Gigabyte P57X v7 | |
| Acer Aspire V15 Nitro BE VN7-592G-79DV | |

| MSI GL62M 7RD-077 HGST Travelstar 7K1000 HTS721010A9E630 | MSI GL62-6QFi781H11 Toshiba HG6 THNSNJ128G8NY | Asus Strix GL502VM-FY039T Micron SSD 1100 (MTFDDAV256TBN) | HP Omen 15-ax007ng Adata IM2S3138E-128GM-B | Acer Aspire VX5-591G-D0DD SK Hynix Canvas SC300 512GB M.2 (HFS512G39MND) | |
|---|---|---|---|---|---|
| CrystalDiskMark 3.0 | 6466% | 7690% | 6732% | 8809% | |
| Read Seq (MB/s) | 112.4 | 530 372% | 462.5 311% | 475.7 323% | 494.2 340% |
| Write Seq (MB/s) | 107.3 | 442.7 313% | 462.7 331% | 169.2 58% | 449.6 319% |
| Read 512 (MB/s) | 43.19 | 409.1 847% | 335 676% | 327.6 659% | 348.1 706% |
| Write 512 (MB/s) | 57 | 417.3 632% | 407.1 614% | 169.6 198% | 418.2 634% |
| Read 4k (MB/s) | 0.494 | 21.81 4315% | 25.61 5084% | 33.14 6609% | 16.97 3335% |
| Write 4k (MB/s) | 1.122 | 93 8189% | 86.3 7592% | 81.4 7155% | 38.36 3319% |
| Read 4k QD32 (MB/s) | 1.088 | 257 23521% | 246.7 22575% | 276.8 25341% | 394.9 36196% |
| Write 4k QD32 (MB/s) | 1.234 | 168.3 13539% | 301.5 24333% | 168 13514% | 317.4 25621% |
| 3DMark 06 Standard Score | 28117 punten | |
| 3DMark Vantage P Result | 26560 punten | |
| 3DMark 11 Performance | 7980 punten | |
| 3DMark Ice Storm Standard Score | 73713 punten | |
| 3DMark Cloud Gate Standard Score | 19877 punten | |
| 3DMark Fire Strike Score | 5729 punten | |
| 3DMark Fire Strike Extreme Score | 2743 punten | |
| 3DMark Time Spy Score | 1897 punten | |
Help | ||
| 3DMark 11 - 1280x720 Performance GPU | |
| Gigabyte P57X v7 | |
| Asus Strix GL502VM-FY039T | |
| Acer Aspire VX5-591G-D0DD | |
| MSI GL62M 7RD-077 | |
| HP Omen 15-ax007ng | |
| Asus X550IU | |
| Asus Strix GL753VD-GC045T | |
| Apple MacBook Pro 15 2016 (2.9 GHz, 460) | |
| Apple MacBook Pro 15 2016 (2.7 GHz, 455) | |
| Acer Aspire V15 Nitro BE VN7-592G-79DV | |
| MSI GL62-6QFi781H11 | |
| GFXBench (DX / GLBenchmark) 2.7 | |
| 1920x1080 T-Rex Offscreen | |
| MSI GL62M 7RD-077 | |
| Apple MacBook Pro 15 2016 (2.9 GHz, 460) | |
| Apple MacBook Pro 15 2016 (2.7 GHz, 455) | |
| T-Rex Onscreen | |
| MSI GL62M 7RD-077 | |
| Apple MacBook Pro 15 2016 (2.7 GHz, 455) | |
| GFXBench 3.0 | |
| 1920x1080 1080p Manhattan Offscreen | |
| MSI GL62M 7RD-077 | |
| Apple MacBook Pro 15 2016 (2.9 GHz, 460) | |
| Apple MacBook Pro 15 2016 (2.7 GHz, 455) | |
| on screen Manhattan Onscreen OGL | |
| MSI GL62M 7RD-077 | |
| Apple MacBook Pro 15 2016 (2.7 GHz, 455) | |
| GFXBench 3.1 | |
| 1920x1080 Manhattan ES 3.1 Offscreen | |
| MSI GL62M 7RD-077 | |
| on screen Manhattan ES 3.1 Onscreen | |
| MSI GL62M 7RD-077 | |
| GFXBench | |
| 1920x1080 Car Chase Offscreen | |
| MSI GL62M 7RD-077 | |
| on screen Car Chase Onscreen | |
| MSI GL62M 7RD-077 | |
| Geekbench 4.0 - Compute OpenCL Score | |
| MSI GL62M 7RD-077 | |
| Apple MacBook Pro 15 2016 (2.9 GHz, 460) | |
| Apple MacBook Pro 15 2016 (2.7 GHz, 455) | |
| lage | gem. | hoge | ultra | QHD | 4K | |
|---|---|---|---|---|---|---|
| Tomb Raider (2013) | 301.7 | 240.3 | 170.3 | 80.6 | ||
| BioShock Infinite (2013) | 196.6 | 160.4 | 156.2 | 66.2 | ||
| Battlefield 4 (2013) | 150.8 | 135 | 116.8 | 52 | ||
| Thief (2014) | 71.1 | 67.7 | 65.8 | 43.6 | ||
| Middle-earth: Shadow of Mordor (2014) | 156 | 102.7 | 59.4 | 45.3 | ||
| Dragon Age: Inquisition (2014) | 136 | 105 | 44.3 | 29.7 | ||
| Battlefield Hardline (2015) | 91.8 | 89.7 | 79.8 | 52.6 | ||
| GTA V (2015) | 129.4 | 116.9 | 65.9 | 17.9 | ||
| Dirt Rally (2015) | 223.2 | 117.1 | 88.4 | 53 | ||
| Batman: Arkham Knight (2015) | 94 | 84 | 39 | 28 | ||
| Call of Duty: Black Ops 3 (2015) | 119.7 | 73.9 | 52.2 | 49.1 | ||
| Star Wars Battlefront (2015) | 138 | 124.1 | 60.2 | 52.7 | ||
| Just Cause 3 (2015) | 101 | 86.1 | 48 | 45.1 | ||
| Rise of the Tomb Raider (2016) | 115.3 | 70 | 39.5 | 33.7 | ||
| Hitman 2016 (2016) | 58.4 | 57.3 | 42.3 | 41.1 | ||
| Need for Speed 2016 (2016) | 105 | 99.3 | 63.4 | 47.2 | ||
| Ashes of the Singularity (2016) | 50.5 | 34.4 | 29.1 | |||
| Overwatch (2016) | 56 | |||||
| Mirror's Edge Catalyst (2016) | 110.3 | 83.7 | 40.4 | 32.4 | ||
| Deus Ex Mankind Divided (2016) | 74.3 | 59.3 | 32.2 | 14.7 | ||
| Battlefield 1 (2016) | 114.7 | 97.6 | 49.9 | 44.4 | ||
| Civilization 6 (2016) | 66.8 | 54.5 | 42.4 | 34.1 | ||
| Titanfall 2 (2016) | 143.1 | 118 | 53.4 | 45.5 | ||
| Resident Evil 7 (2017) | 223.8 | 98.1 | 57.6 | 19.8 | ||
| Ghost Recon Wildlands (2017) | 90.8 | 39.3 | 32.6 | 4.1 | ||
| Mass Effect Andromeda (2017) | 96 | 43.8 | 24.6 | 20.4 | ||
| Rocket League (2017) | 109 | |||||
| Dirt 4 (2017) | 63.7 | 31 | ||||
| Ark Survival Evolved (2017) | 76 | 24.3 | 16.5 | |||
| FIFA 18 (2017) | 132 | 55.6 | ||||
| Fortnite (2018) | 187 | 135 | 51 | 40 | ||
| Final Fantasy XV Benchmark (2018) | 62 | 30.2 | 18.6 | |||
| Kingdom Come: Deliverance (2018) | 93 | 41.6 | 33.3 | 25.1 | ||
| World of Tanks enCore (2018) | 335 | 139 | 49.3 | 32 | 15.5 | |
| The Crew 2 (2018) | 60 | 42.7 | 36.8 | 32.2 | 9.2 | |
| FIFA 19 (2018) | 187 | 129 | 116 | 96 | 35.6 | |
| Apex Legends (2019) | 36.7 | 35.2 | ||||
| Far Cry New Dawn (2019) | 63 | 36 | 36 | 32 | ||
| Metro Exodus (2019) | 45.1 | 18.8 | 14.5 | 12 | ||
| Dirt Rally 2.0 (2019) | 53.1 | 44.8 | 23.9 | |||
| The Division 2 (2019) | 95 | 37.9 | 34.1 | 21.2 | ||
| Total War: Three Kingdoms (2019) | 152 | 56.2 | 31 | 20.5 | ||
| League of Legends (2019) | 157 | 148 | 135 | 146 | 138 | 113 |
| Control (2019) | 80 | 24.4 | 17.4 | |||
| FIFA 20 (2019) | 108 | 65 | 32.6 |
| BioShock Infinite - 1920x1080 Ultra Preset, DX11 (DDOF) | |
| Gigabyte P57X v7 | |
| Asus Strix GL502VM-FY039T | |
| MSI GL62M 7RD-077 | |
| Acer Aspire V15 Nitro BE VN7-592G-79DV | |
| Apple MacBook Pro 15 2016 (2.7 GHz, 455) | |
| Battlefield 4 - 1920x1080 Ultra Preset AA:4x MS | |
| Asus Strix GL502VM-FY039T | |
| MSI GL62M 7RD-077 | |
| Acer Aspire V15 Nitro BE VN7-592G-79DV | |
| Tomb Raider - 1920x1080 Ultra Preset AA:FX AF:16x | |
| Asus Strix GL502VM-FY039T | |
| MSI GL62M 7RD-077 | |
| Acer Aspire V15 Nitro BE VN7-592G-79DV | |
| Star Wars Battlefront - 1920x1080 Ultra Preset AA:FX | |
| MSI GL62M 7RD-077 | |
| Battlefield 1 - 1920x1080 High Preset AA:T | |
| Acer Aspire VX5-591G-D0DD | |
| MSI GL62M 7RD-077 | |
| Asus Strix GL753VD-GC045T | |
| Apple MacBook Pro 15 2016 (2.9 GHz, 460) | |
| Apple MacBook Pro 15 2016 (2.7 GHz, 455) | |
| Ashes of the Singularity - 1280x768 low | |
| Asus Strix GL502VM-FY039T | |
| MSI GL62M 7RD-077 | |
| Apple MacBook Pro 15 2016 (2.7 GHz, 455) | |
| Deus Ex Mankind Divided - 1366x768 Medium Preset AF:2x | |
| MSI GL62M 7RD-077 | |
| Asus Strix GL753VD-GC045T | |
| Rise of the Tomb Raider - 1366x768 Medium Preset AF:2x | |
| Acer Aspire VX5-591G-D0DD | |
| MSI GL62M 7RD-077 | |
| HP Omen 15-ax007ng | |
| Asus Strix GL753VD-GC045T | |
| Acer Aspire V15 Nitro BE VN7-592G-79DV | |
Geluidsniveau
| Onbelast |
| 32.5 / 32.5 / 32.5 dB (A) |
| HDD |
| 32.6 dB (A) |
| Belasting |
| 36.4 / 52.4 dB (A) |
 | ||
30 dB stil 40 dB(A) hoorbaar 50 dB(A) luid |
||
min: | ||
| MSI GL62M 7RD-077 i7-7700HQ, GeForce GTX 1050 Mobile | MSI GL62-6QFi781H11 6700HQ, GeForce GTX 960M | Asus Strix GL502VM-FY039T 6700HQ, GeForce GTX 1060 Mobile | HP Omen 15-ax007ng 6700HQ, GeForce GTX 965M | Gigabyte P57X v7 i7-7700HQ, GeForce GTX 1070 Mobile | Asus Strix GL753VD-GC045T i7-7700HQ, GeForce GTX 1050 Mobile | |
|---|---|---|---|---|---|---|
| Noise | -5% | -5% | -4% | -2% | -4% | |
| uit / omgeving * (dB) | 30.6 | 30 2% | 31 -1% | 30 2% | 29 5% | 28.8 6% |
| Idle Minimum * (dB) | 32.5 | 35 -8% | 32 2% | 32 2% | 30.4 6% | 33.9 -4% |
| Idle Average * (dB) | 32.5 | 36 -11% | 33 -2% | 33 -2% | 32.1 1% | 33.9 -4% |
| Idle Maximum * (dB) | 32.5 | 37 -14% | 34 -5% | 36 -11% | 32.1 1% | 37.8 -16% |
| Load Average * (dB) | 36.4 | 41 -13% | 44 -21% | 43 -18% | 45.6 -25% | 42.7 -17% |
| Load Maximum * (dB) | 52.4 | 46 12% | 53 -1% | 49 6% | 51.5 2% | 47.4 10% |
* ... kleiner is beter
(±) De maximumtemperatuur aan de bovenzijde bedraagt 44.9 °C / 113 F, vergeleken met het gemiddelde van 40.4 °C / 105 F, variërend van 21.2 tot 68.8 °C voor de klasse Gaming.
(+) De bodem warmt op tot een maximum van 38.2 °C / 101 F, vergeleken met een gemiddelde van 43.2 °C / 110 F
(+) Bij onbelast gebruik bedraagt de gemiddelde temperatuur voor de bovenzijde 25.6 °C / 78 F, vergeleken met het apparaatgemiddelde van 33.9 °C / 93 F.
(±) De palmsteunen en het touchpad kunnen zeer heet aanvoelen met een maximum van ###max## °C / 100.4 F.
(-) De gemiddelde temperatuur van de handpalmsteun van soortgelijke toestellen bedroeg 28.8 °C / 83.8 F (-9.2 °C / -16.6 F).
| MSI GL62M 7RD-077 i7-7700HQ, GeForce GTX 1050 Mobile | MSI GL62-6QFi781H11 6700HQ, GeForce GTX 960M | Asus Strix GL502VM-FY039T 6700HQ, GeForce GTX 1060 Mobile | HP Omen 15-ax007ng 6700HQ, GeForce GTX 965M | Gigabyte P57X v7 i7-7700HQ, GeForce GTX 1070 Mobile | Asus Strix GL753VD-GC045T i7-7700HQ, GeForce GTX 1050 Mobile | |
|---|---|---|---|---|---|---|
| Heat | -8% | -38% | -14% | -18% | 11% | |
| Maximum Upper Side * (°C) | 44.9 | 49.1 -9% | 65.3 -45% | 48.5 -8% | 51.2 -14% | 37.7 16% |
| Maximum Bottom * (°C) | 38.2 | 43.4 -14% | 64.4 -69% | 59 -54% | 56.8 -49% | 36.3 5% |
| Idle Upper Side * (°C) | 27.4 | 29.2 -7% | 35.4 -29% | 28.7 -5% | 29.2 -7% | 25.7 6% |
| Idle Bottom * (°C) | 29 | 29.6 -2% | 31.6 -9% | 25.7 11% | 29.2 -1% | 24.4 16% |
* ... kleiner is beter
MSI GL62M 7RD-077 audioanalyse
(+) | luidsprekers kunnen relatief luid spelen (86 dB)
Bas 100 - 315 Hz
(-) | bijna geen lage tonen - gemiddeld 28.4% lager dan de mediaan
(±) | lineariteit van de lage tonen is gemiddeld (9.6% delta ten opzichte van de vorige frequentie)
Midden 400 - 2000 Hz
(±) | hogere middens - gemiddeld 9% hoger dan de mediaan
(±) | lineariteit van de middentonen is gemiddeld (8.2% delta ten opzichte van de vorige frequentie)
Hoog 2 - 16 kHz
(±) | higher highs - on average 7% higher than median
(+) | de hoge tonen zijn lineair (6.8% delta naar de vorige frequentie)
Algemeen 100 - 16.000 Hz
(±) | lineariteit van het totale geluid is gemiddeld (27.7% verschil met de mediaan)
Vergeleken met dezelfde klasse
» 93% van alle geteste apparaten in deze klasse waren beter, 1% vergelijkbaar, 5% slechter
» De beste had een delta van 6%, het gemiddelde was 18%, de slechtste was 132%
Vergeleken met alle geteste toestellen
» 84% van alle geteste apparaten waren beter, 3% gelijk, 13% slechter
» De beste had een delta van 4%, het gemiddelde was 24%, de slechtste was 134%
Apple MacBook 12 (Early 2016) 1.1 GHz audioanalyse
(+) | luidsprekers kunnen relatief luid spelen (83.6 dB)
Bas 100 - 315 Hz
(±) | verminderde zeebaars - gemiddeld 11.3% lager dan de mediaan
(±) | lineariteit van de lage tonen is gemiddeld (14.2% delta ten opzichte van de vorige frequentie)
Midden 400 - 2000 Hz
(+) | evenwichtige middens - slechts 2.4% verwijderd van de mediaan
(+) | de middentonen zijn lineair (5.5% delta ten opzichte van de vorige frequentie)
Hoog 2 - 16 kHz
(+) | evenwichtige hoogtepunten - slechts 2% verwijderd van de mediaan
(+) | de hoge tonen zijn lineair (4.5% delta naar de vorige frequentie)
Algemeen 100 - 16.000 Hz
(+) | het totale geluid is lineair (10.2% verschil met de mediaan)
Vergeleken met dezelfde klasse
» 7% van alle geteste apparaten in deze klasse waren beter, 2% vergelijkbaar, 91% slechter
» De beste had een delta van 5%, het gemiddelde was 18%, de slechtste was 53%
Vergeleken met alle geteste toestellen
» 5% van alle geteste apparaten waren beter, 1% gelijk, 94% slechter
» De beste had een delta van 4%, het gemiddelde was 24%, de slechtste was 134%
| Uit / Standby | |
| Inactief | |
| Belasting |
|
Key:
min: | |
| MSI GL62M 7RD-077 i7-7700HQ, GeForce GTX 1050 Mobile | MSI GL62-6QFi781H11 6700HQ, GeForce GTX 960M | Asus Strix GL502VM-FY039T 6700HQ, GeForce GTX 1060 Mobile | HP Omen 15-ax007ng 6700HQ, GeForce GTX 965M | Gigabyte P57X v7 i7-7700HQ, GeForce GTX 1070 Mobile | Asus Strix GL753VD-GC045T i7-7700HQ, GeForce GTX 1050 Mobile | |
|---|---|---|---|---|---|---|
| Power Consumption | 1% | -25% | 11% | -69% | 15% | |
| Idle Minimum * (Watt) | 10.6 | 10 6% | 16 -51% | 7 34% | 15.7 -48% | 6.2 42% |
| Idle Average * (Watt) | 14.5 | 14 3% | 19 -31% | 11 24% | 23.4 -61% | 12.2 16% |
| Idle Maximum * (Watt) | 15 | 19 -27% | 23 -53% | 19 -27% | 23.5 -57% | 14.8 1% |
| Load Average * (Watt) | 90 | 82 9% | 68 24% | 79 12% | 184.6 -105% | 84.9 6% |
| Load Maximum * (Watt) | 135 | 118 13% | 157 -16% | 119 12% | 233.1 -73% | 120.7 11% |
* ... kleiner is beter
| MSI GL62M 7RD-077 i7-7700HQ, GeForce GTX 1050 Mobile, 41 Wh | MSI GL62-6QFi781H11 6700HQ, GeForce GTX 960M, 41.4 Wh | Asus Strix GL502VM-FY039T 6700HQ, GeForce GTX 1060 Mobile, 64 Wh | HP Omen 15-ax007ng 6700HQ, GeForce GTX 965M, 61.5 Wh | Gigabyte P57X v7 i7-7700HQ, GeForce GTX 1070 Mobile, 75.81 Wh | Asus Strix GL753VD-GC045T i7-7700HQ, GeForce GTX 1050 Mobile, 48 Wh | Acer Aspire VX5-591G-D0DD i7-7700HQ, GeForce GTX 1050 Ti Mobile, 52 Wh | |
|---|---|---|---|---|---|---|---|
| Batterijduur | 9% | 25% | 45% | 21% | 21% | 61% | |
| Reader / Idle (h) | 6.5 | 5.7 -12% | 5.3 -18% | 7.8 20% | 4.3 -34% | 8.6 32% | |
| H.264 (h) | 3.6 | 3.9 8% | 4.1 14% | ||||
| WiFi v1.3 (h) | 3.8 | 2.6 -32% | 3.7 -3% | 4.5 18% | 2.6 -32% | 4.4 16% | 6.1 61% |
| Load (h) | 0.7 | 1.2 71% | 1.5 114% | 1.6 129% | 1.6 129% | 0.8 14% |
Pro
Contra
Voor het volledige, Engelse testrapport, klik hier.
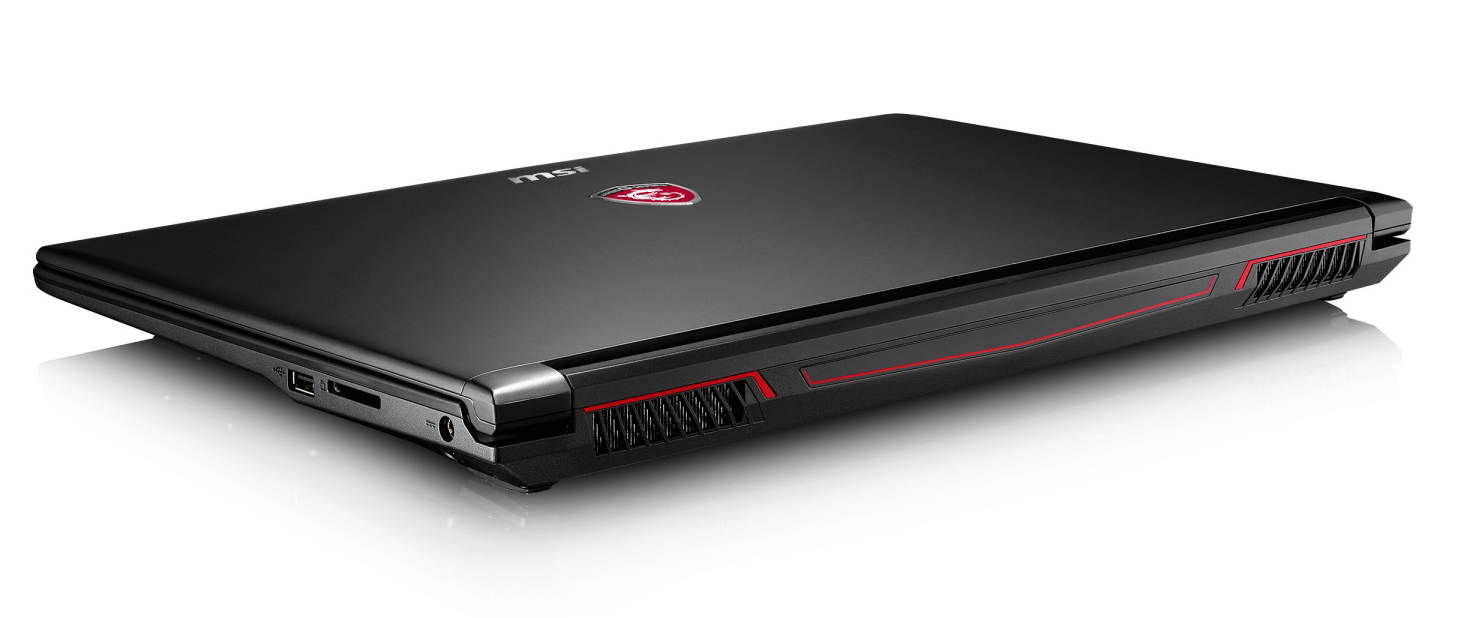
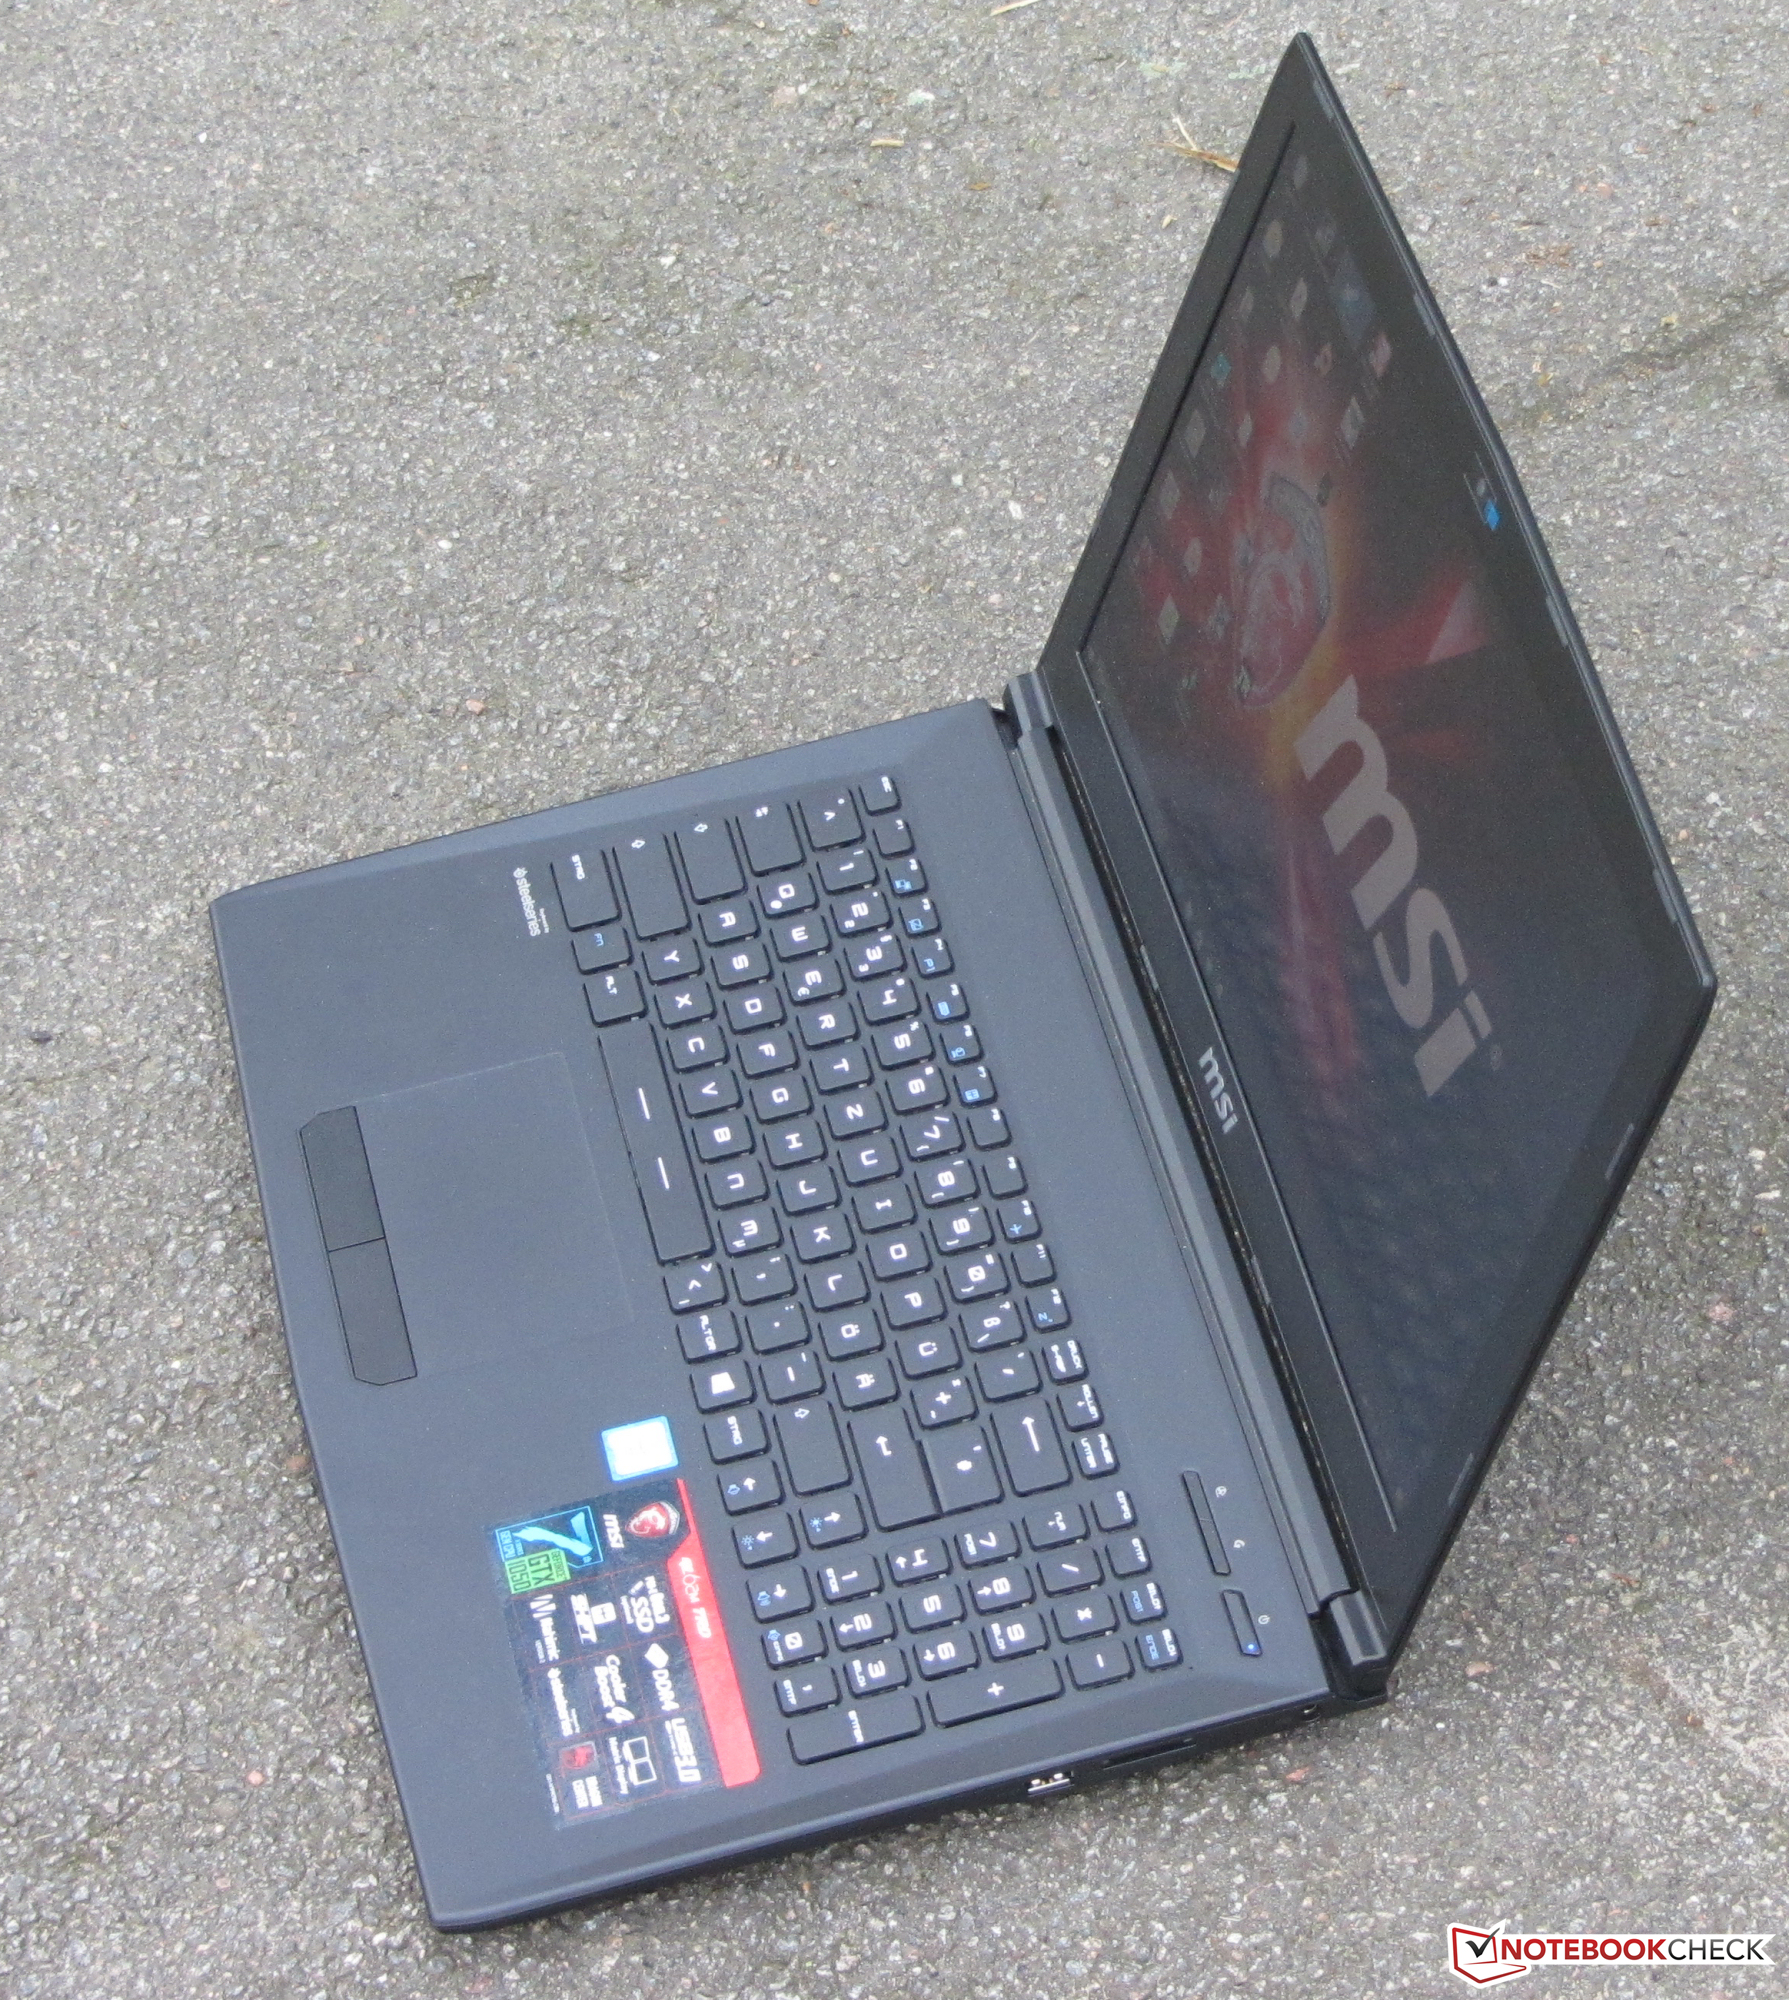
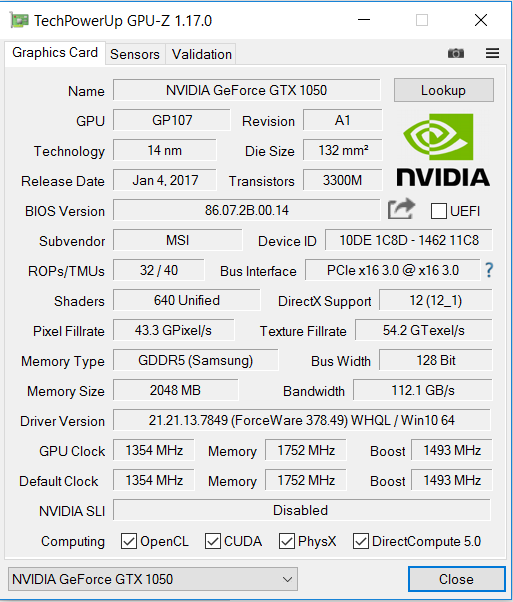
De GL62M is bedoeld als goedkoop instapmodel voor het gaming segment. De laptop is dan ook in staat om moderne games in hoge resolutie vloeiend te renderen op het matte Full HD beeldscherm. De Nvidia GeForce GTX 1050 GPU maakt dit mogelijk. De chip biedt aanzienlijk meer rekenkracht dan de voorganger. De notebook presteert dankzij de krachtige Kaby Lake CPU niet alleen goed op games, maar ook op andere vlakken. Ondanks de krachtige hardware blijft de notebook altijd koel.
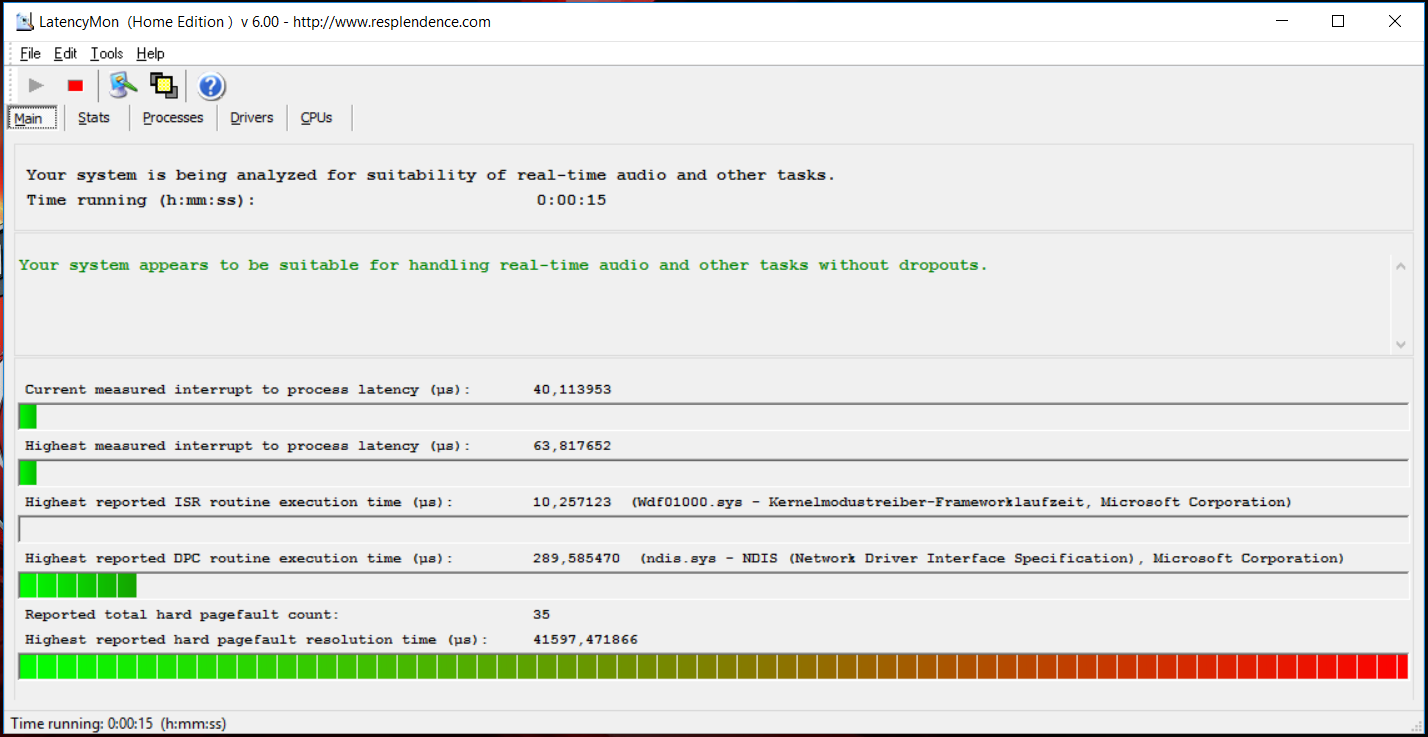
MSI zou een BIOS update moeten publiceren om de automatische ventilatorcontrole te verbeteren. De CPU ventilator draait ook als het systeem niet belast wordt en produceert een pulserend, huilend geluid. Gebruikers moeten dit nu nog zelf oplossen - onacceptabel.
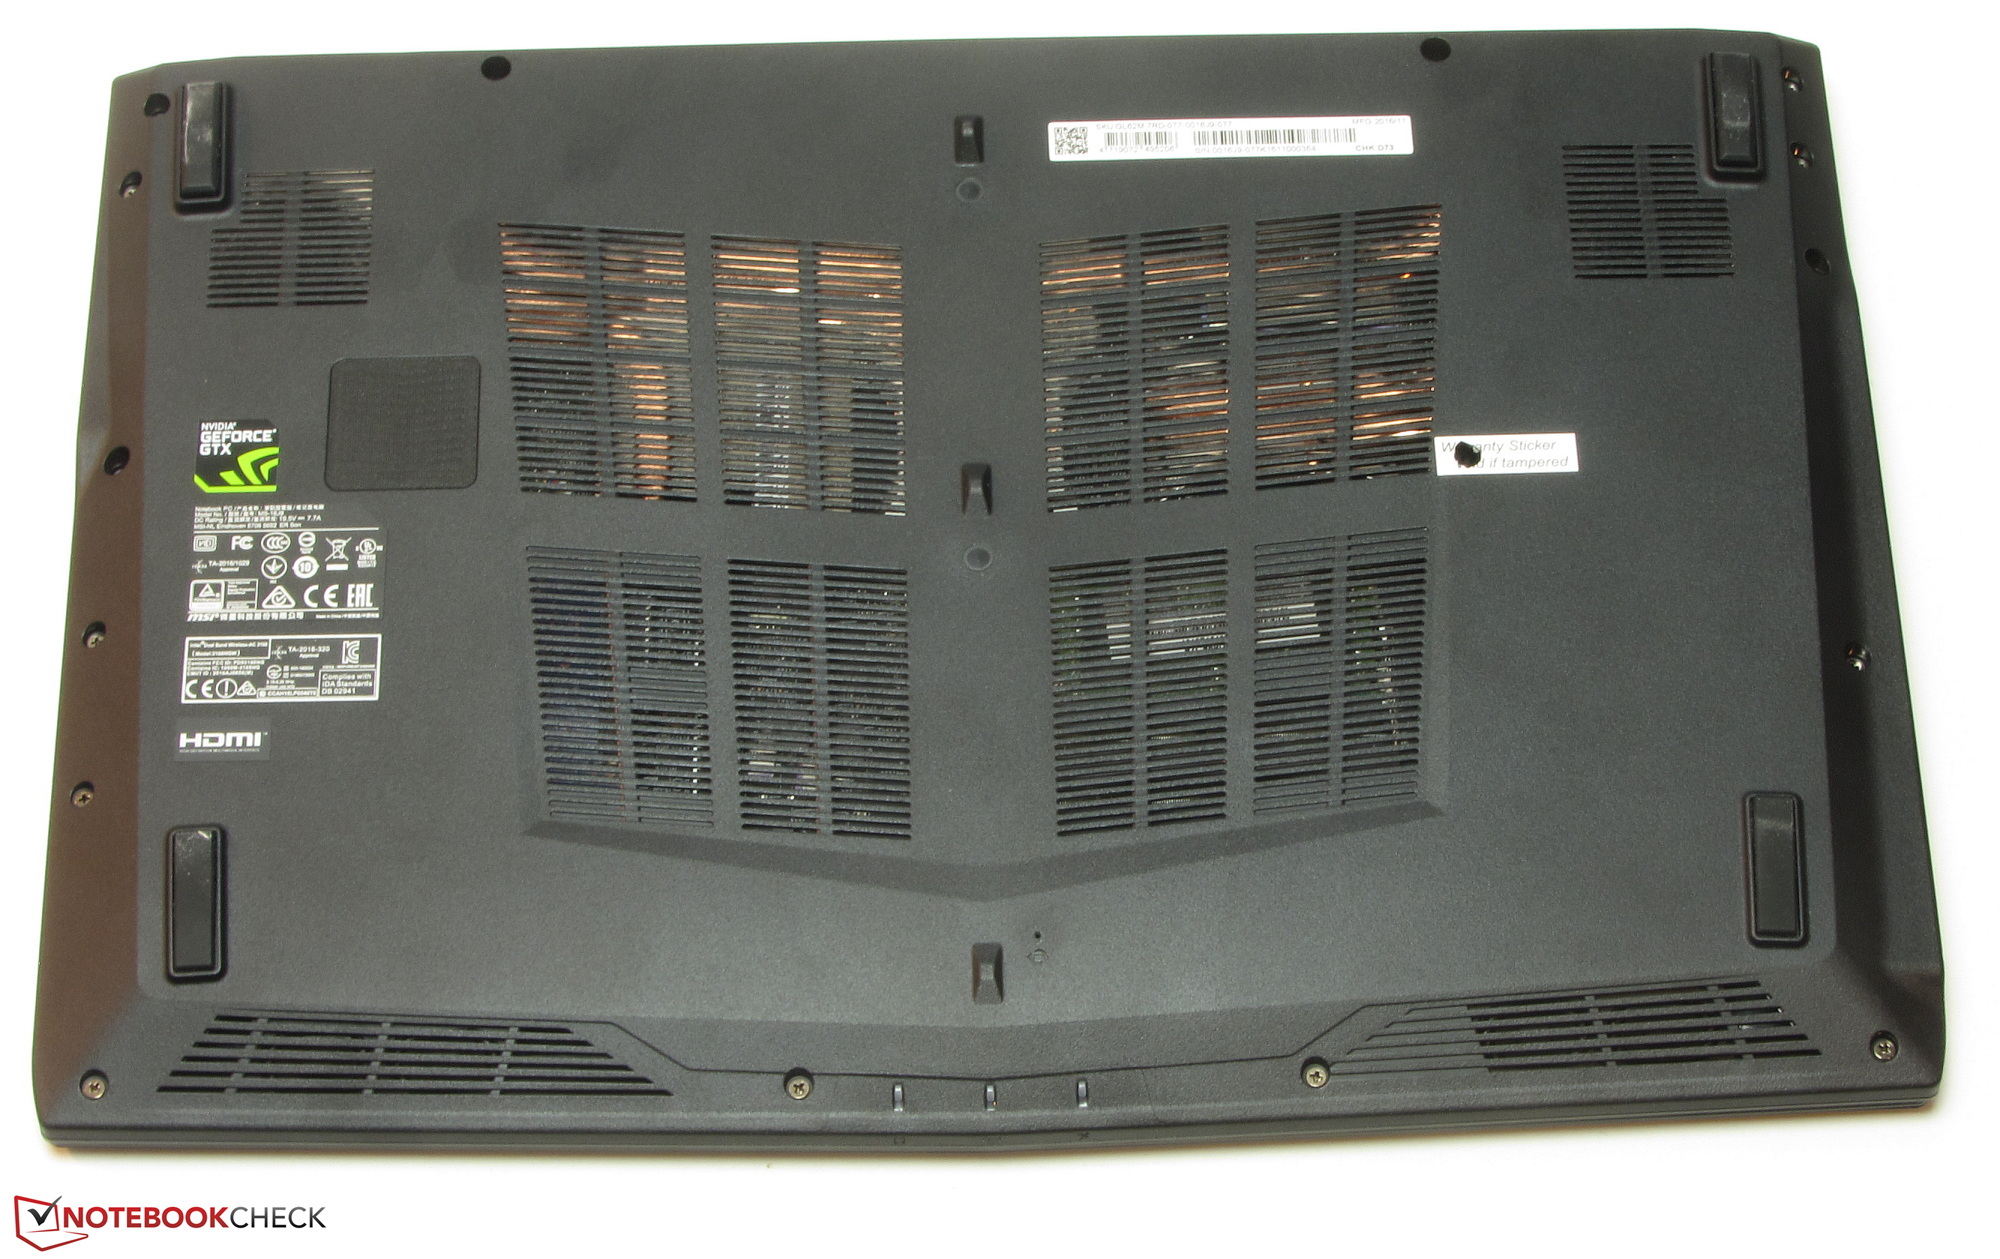
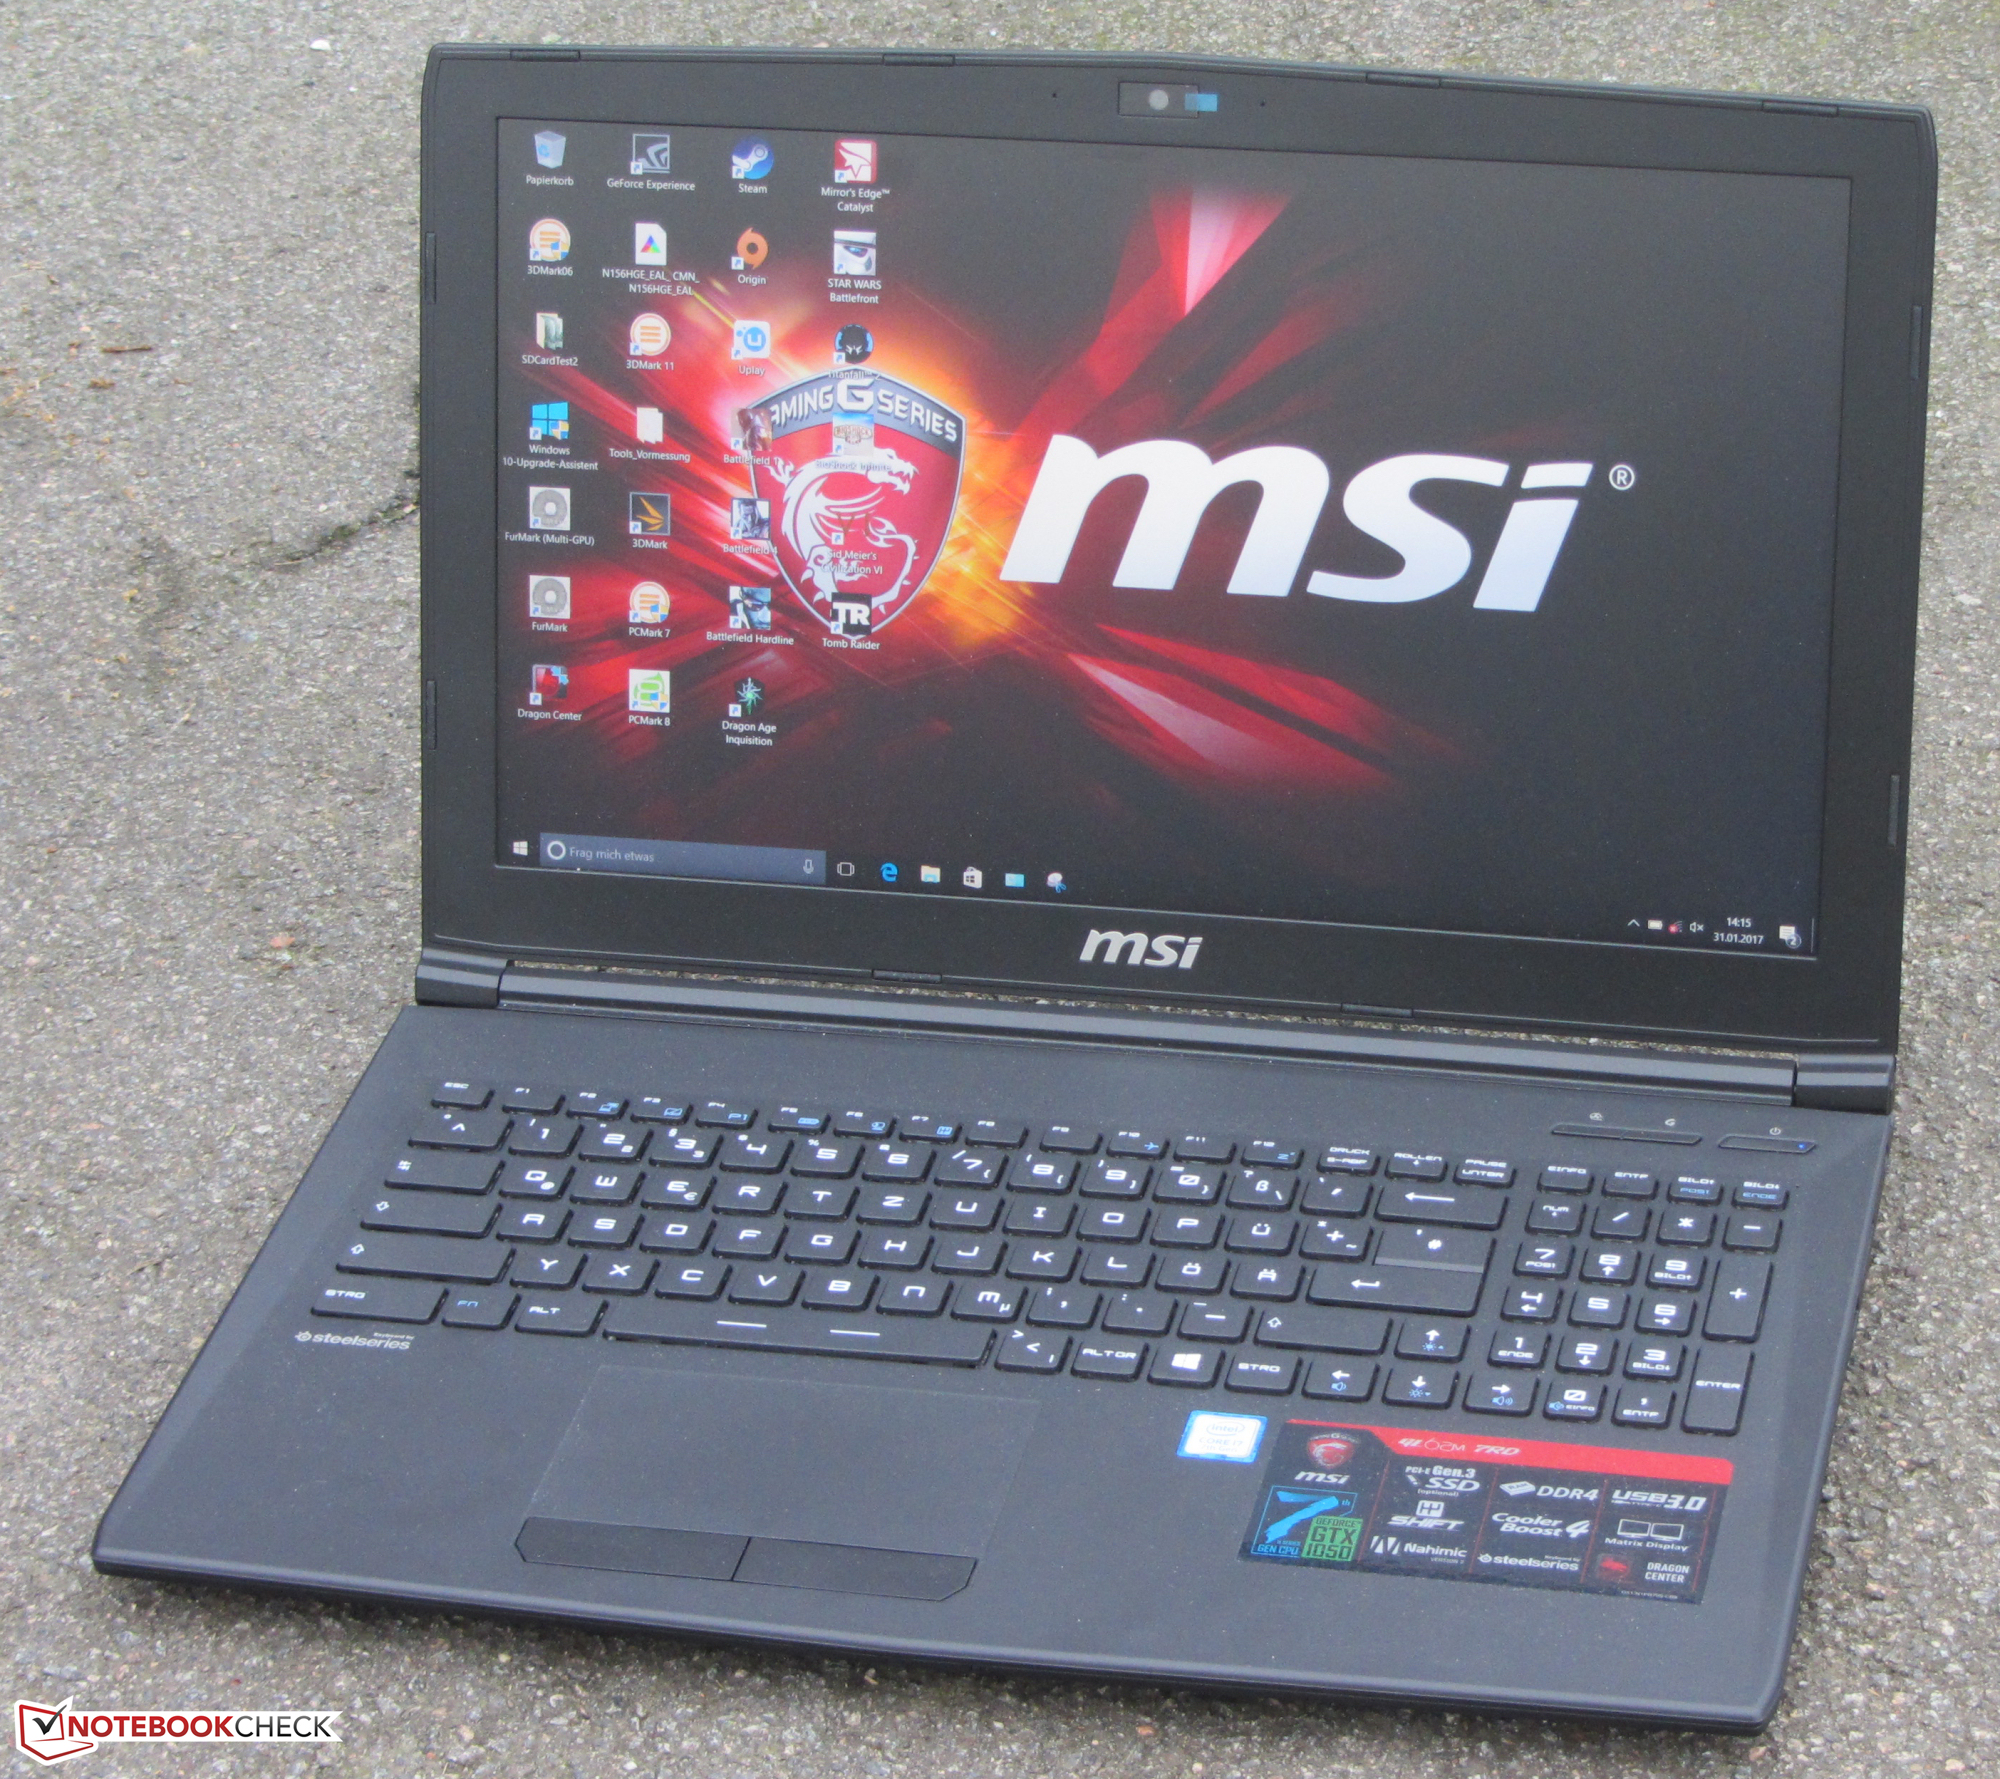
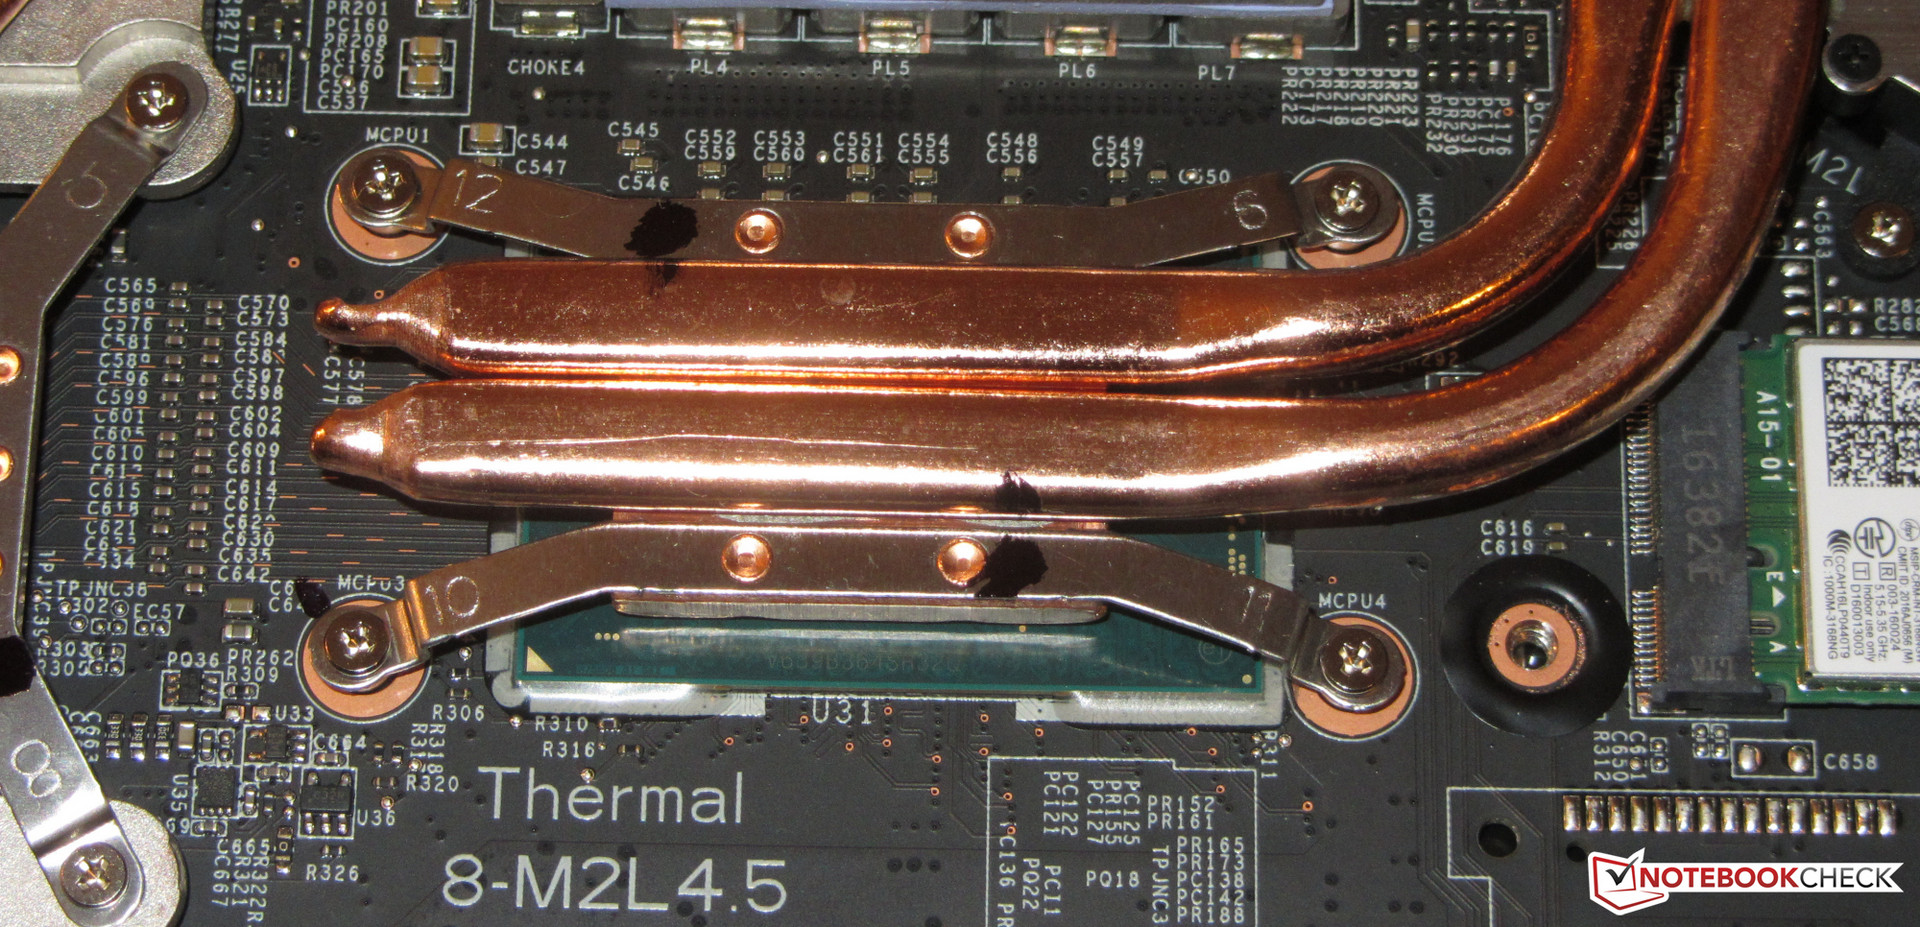
Het toetsenbord is aanvaardbaar en geschikt voor thuisgebruik, hoewel we graag toetsenbordverlichting hadden gezien. Dankzij een 1 TB 2,5 inch HDD is er voldoende opslagruimte aanwezig. Het is mogelijk deze harde schijf te vervangen na onderhoudspaneel verwijderd te hebben. In dit geval kan ook een M.2 SSD worden toegevoegd. De ingebouwde aansluiting ondersteunt SATA-3 en PCIe/NVMe modellen.
Het beeldscherm van de GL62M is ronduit teleurstellend.
MSI heeft gebruik gemaakt van een contrastarm, donker TN paneel met smalle kijkhoeken. Boven de €1000 grens verwachten we een helder, contrastrijk IPS beeldscherm. Ook de looptijden zijn niet overtuigend.
Alles bij elkaar heeft MSI teveel moeten bezuinigen om de computer betaalbaar te houden. Concurrenten bieden beter uitgekiende modellen, zoals de HP Omen 15-ax206ng. Dat apparaat gebruikt dezelfde CPU+GPU combinatie als de GL62M, maar biedt ook een IPS beeldscherm, verlicht toetsenbord en een SSD-HDD combinatie. De prijs is vergelijkbaar met het model van MSI.
MSI GL62M 7RD-077
- 07-02-2017 v6 (old)
Sascha Mölck