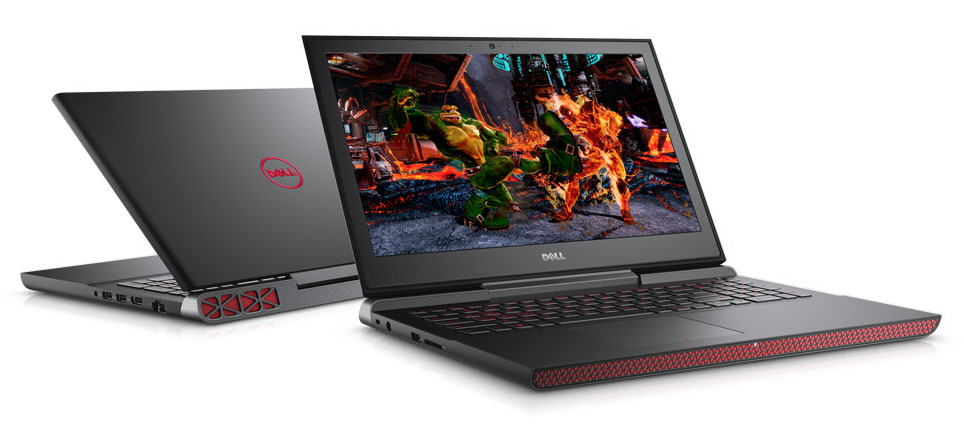
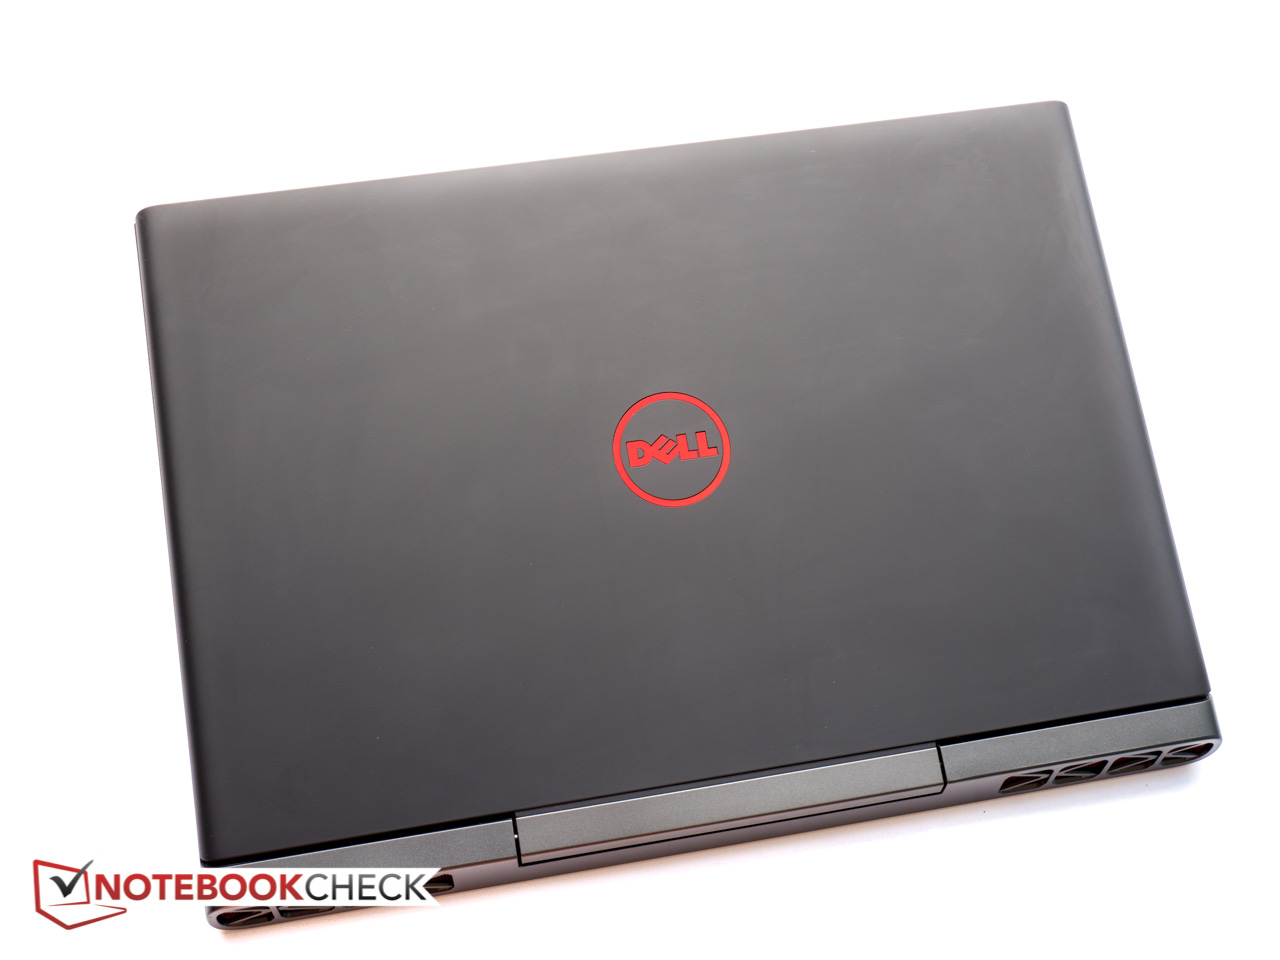
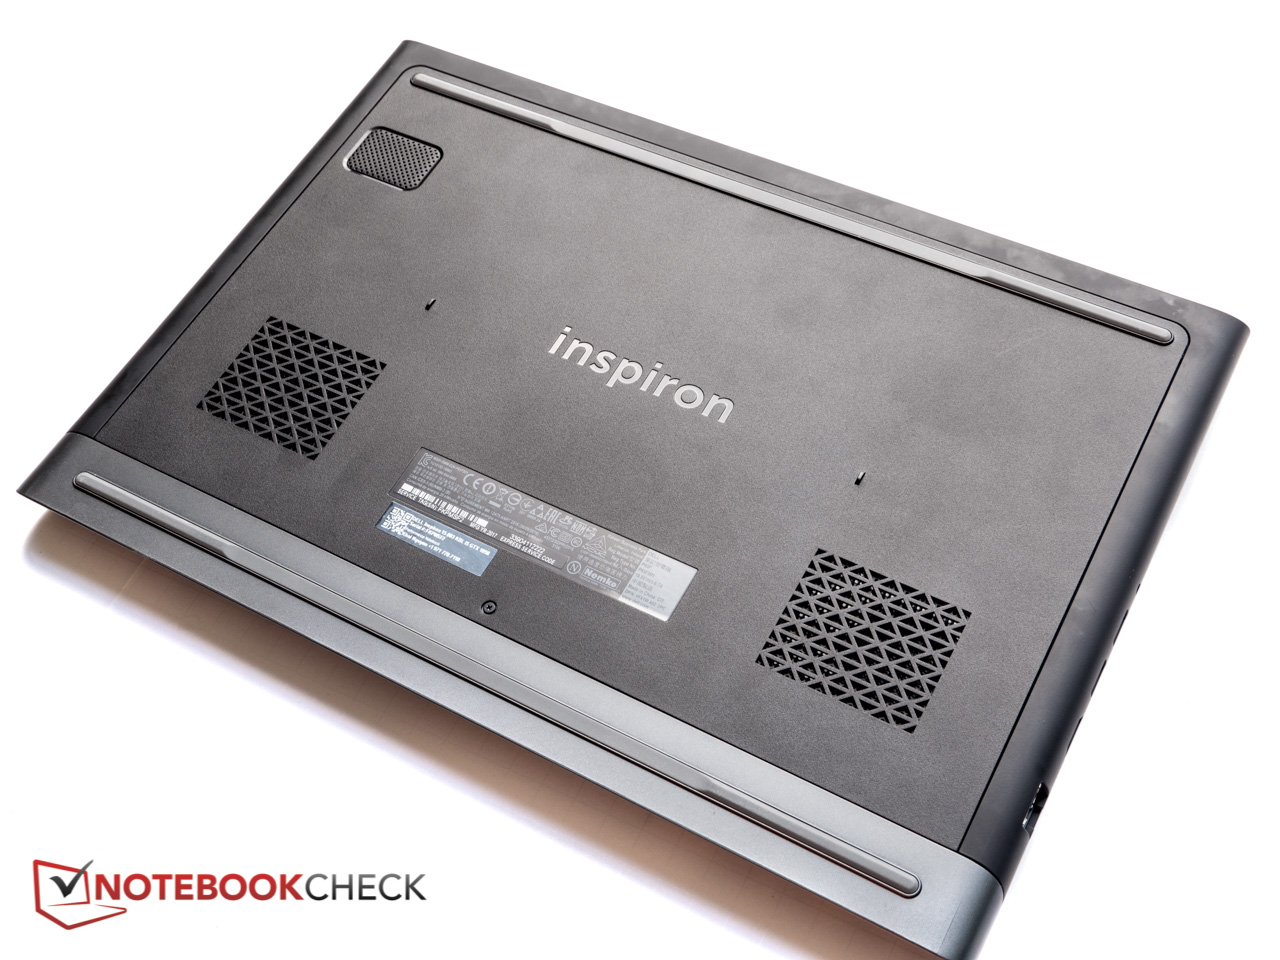
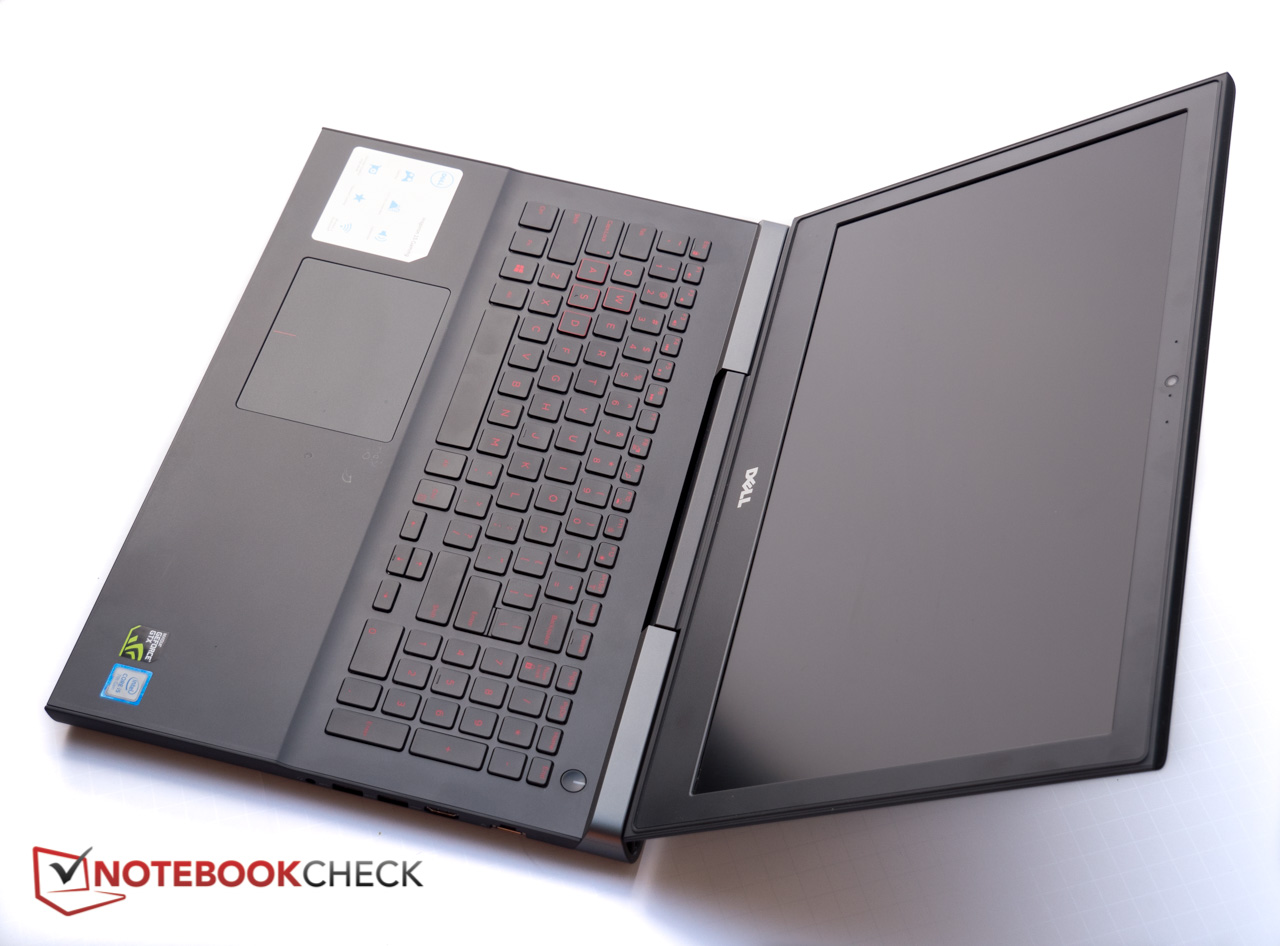
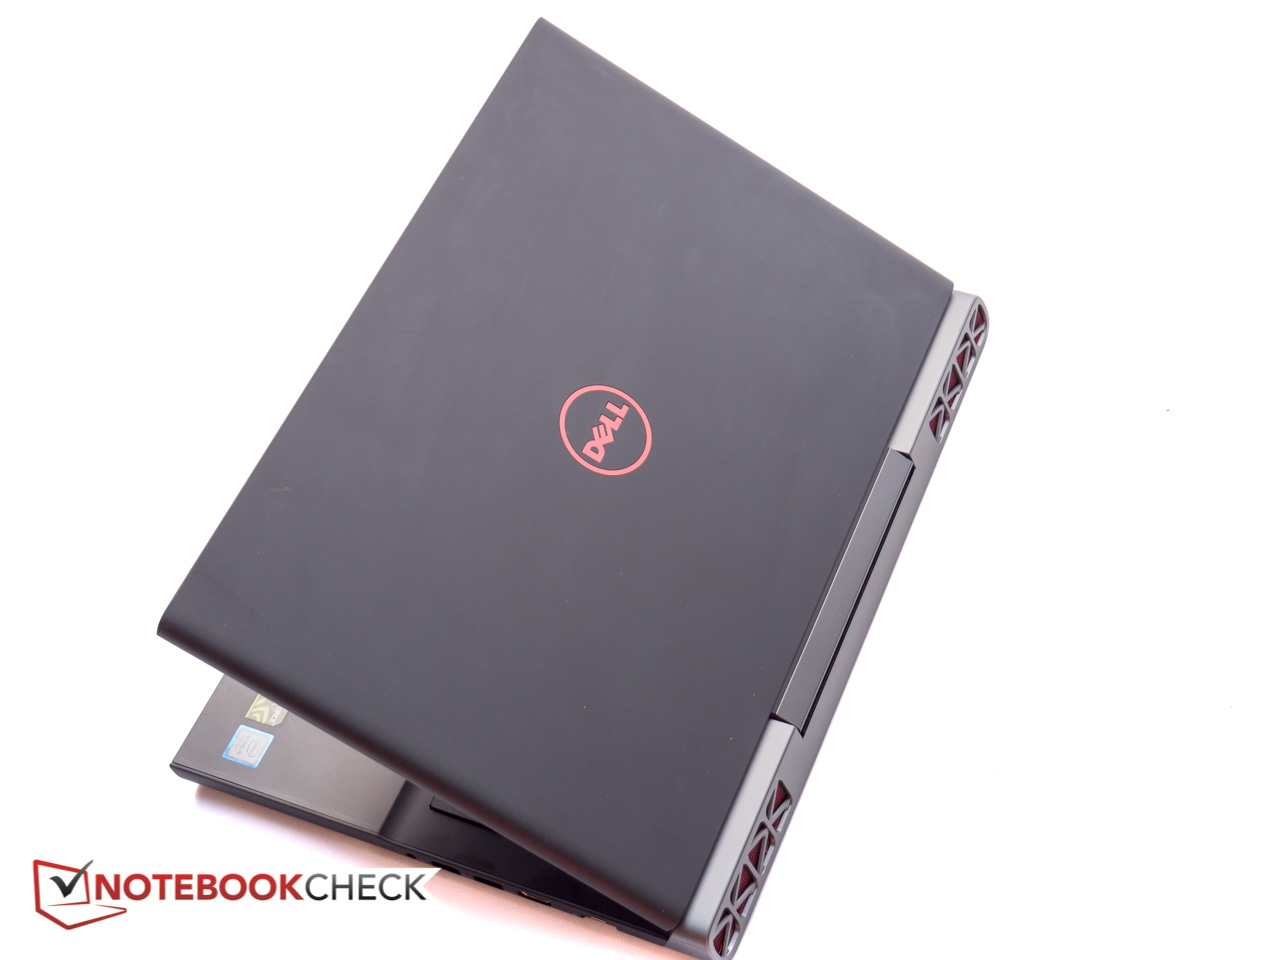
Kort testrapport Dell Inspiron 15 7000 7567 Gaming (i5-7300HQ, GTX 1050) Laptop

| |||||||||||||||||||||||||
Helderheidsverdeling: 88 %
Helderheid in Batterij-modus: 242.2 cd/m²
Contrast: 351:1 (Zwart: 0.69 cd/m²)
ΔE ColorChecker Calman: 11.6 | ∀{0.5-29.43 Ø4.73}
ΔE Greyscale Calman: 15.7 | ∀{0.09-98 Ø4.97}
57.55% sRGB (Argyll 1.6.3 3D)
39.47% AdobeRGB 1998 (Argyll 1.6.3 3D)
39.47% AdobeRGB 1998 (Argyll 3D)
57.5% sRGB (Argyll 3D)
38.2% Display P3 (Argyll 3D)
Gamma: 1.57
CCT: 11662 K
| Dell Inspiron 15 7000 7567 Gaming (Core i5-7300HQ, GTX 1050) AU Optronics AUO38ED B156HTN , TN, 15.6", 1920x1080 | Lenovo Legion Y520-15IKBN-80WK001KUS LP156WF6-SPK3, IPS, 15.6", 1920x1080 | Samsung Odyssey NP800G5M-X01US IPS, 15.6", 1920x1080 | Asus ROG Strix GL553VD-DS71 BOE HF NV156FHM-N43, IPS, 15.6", 1920x1080 | Gigabyte Sabre 15G ID: LGD0533, Name: LG Display LP156WF6-SPK3, IPS, 15.6", 1920x1080 | Acer Aspire VX15 VX5-591G-589S BOE CQ NV156HFM-N42, IPS, 15.6", 1920x1080 | |
|---|---|---|---|---|---|---|
| Display | 23% | 68% | 2% | 5% | ||
| Display P3 Coverage (%) | 38.2 | 47.11 23% | 67.6 77% | 38.97 2% | 40.56 6% | |
| sRGB Coverage (%) | 57.5 | 70.4 22% | 90.8 58% | 58.2 1% | 59.4 3% | |
| AdobeRGB 1998 Coverage (%) | 39.47 | 48.71 23% | 66.4 68% | 40.3 2% | 41.9 6% | |
| Response Times | -45% | -14% | -46% | 10% | -24% | |
| Response Time Grey 50% / Grey 80% * (ms) | 36.8 ? | 58.8 ? -60% | 38.8 ? -5% | 57.6 ? -57% | 32 ? 13% | 46 ? -25% |
| Response Time Black / White * (ms) | 27.6 ? | 36 ? -30% | 33.6 ? -22% | 37.2 ? -35% | 25.6 ? 7% | 34 ? -23% |
| PWM Frequency (Hz) | 21550 ? | 19230 ? | 20000 ? | 20000 ? | ||
| Screen | 21% | 25% | 62% | 25% | 49% | |
| Brightness middle (cd/m²) | 242.2 | 239 -1% | 255.9 6% | 289.3 19% | 248.4 3% | 277 14% |
| Brightness (cd/m²) | 235 | 244 4% | 249 6% | 280 19% | 241 3% | 268 14% |
| Brightness Distribution (%) | 88 | 88 0% | 90 2% | 93 6% | 84 -5% | 91 3% |
| Black Level * (cd/m²) | 0.69 | 0.35 49% | 0.48 30% | 0.29 58% | 0.3 57% | 0.26 62% |
| Contrast (:1) | 351 | 683 95% | 533 52% | 998 184% | 828 136% | 1065 203% |
| Colorchecker dE 2000 * | 11.6 | 7.3 37% | 5.9 49% | 3.1 73% | 7.5 35% | 5.05 56% |
| Colorchecker dE 2000 max. * | 19.4 | 24.7 -27% | 18.9 3% | 7.1 63% | 25.2 -30% | 8.93 54% |
| Greyscale dE 2000 * | 15.7 | 4.9 69% | 5.6 64% | 2.1 87% | 6.5 59% | 2.97 81% |
| Gamma | 1.57 140% | 2.19 100% | 2.21 100% | 2.22 99% | 2.19 100% | 2.39 92% |
| CCT | 11662 56% | 7332 89% | 7250 90% | 6226 104% | 7852 83% | 6466 101% |
| Color Space (Percent of AdobeRGB 1998) (%) | 39.47 | 35 -11% | 44.8 14% | 59 49% | 37 -6% | 38 -4% |
| Color Space (Percent of sRGB) (%) | 57.55 | 55 -4% | 70.1 22% | 91 58% | 57.9 1% | 59 3% |
| Totaal Gemiddelde (Programma / Instellingen) | -12% /
10% | 11% /
19% | 28% /
48% | 12% /
19% | 10% /
30% |
* ... kleiner is beter
Responstijd Scherm
| ↔ Responstijd Zwart naar Wit | ||
|---|---|---|
| 27.6 ms ... stijging ↗ en daling ↘ gecombineerd | ↗ 24.4 ms stijging | 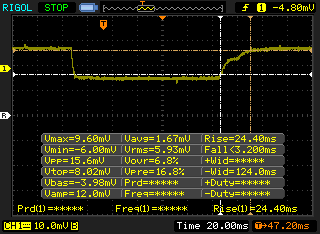 |
| ↘ 3.2 ms daling | ||
| Het scherm vertoonde relatief trage responstijden in onze tests en is misschien te traag voor games. Ter vergelijking: alle testtoestellen variëren van 0.1 (minimum) tot 240 (maximum) ms. » 70 % van alle toestellen zijn beter. Dit betekent dat de gemeten responstijd slechter is dan het gemiddelde (19.9 ms) van alle geteste toestellen. | ||
| ↔ Responstijd 50% Grijs naar 80% Grijs | ||
| 36.8 ms ... stijging ↗ en daling ↘ gecombineerd | ↗ 17.2 ms stijging | 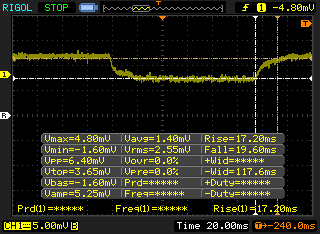 |
| ↘ 19.6 ms daling | ||
| Het scherm vertoonde trage responstijden in onze tests en is misschien te traag voor games. Ter vergelijking: alle testtoestellen variëren van 0.165 (minimum) tot 636 (maximum) ms. » 53 % van alle toestellen zijn beter. Dit betekent dat de gemeten responstijd slechter is dan het gemiddelde (31.1 ms) van alle geteste toestellen. | ||
Screen Flickering / PWM (Pulse-Width Modulation)
| Screen flickering / PWM niet waargenomen | 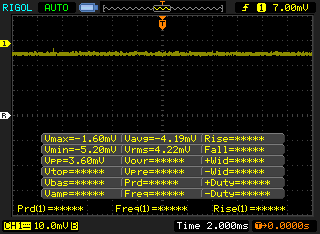 | ||
Ter vergelijking: 52 % van alle geteste toestellen maakten geen gebruik van PWM om de schermhelderheid te verlagen. Als het wel werd gebruikt, werd een gemiddelde van 7798 (minimum: 5 - maximum: 343500) Hz waargenomen. | |||
| wPrime 2.10 - 1024m | |
| Dell Inspiron 15 7000 7567 Gaming (Core i5-7300HQ, GTX 1050) | |
| Asus ROG Strix GL553VD-DS71 | |
| Gigabyte Sabre 15G | |
| Samsung Odyssey NP800G5M-X01US | |
* ... kleiner is beter
| PCMark 8 Home Score Accelerated v2 | 3638 punten | |
| PCMark 8 Creative Score Accelerated v2 | 4334 punten | |
| PCMark 8 Work Score Accelerated v2 | 4749 punten | |
| PCMark 10 Score | 3618 punten | |
Help | ||
| Dell Inspiron 15 7000 7567 Gaming (Core i5-7300HQ, GTX 1050) Toshiba MQ02ABD100H | Lenovo Legion Y520-15IKBN-80WK001KUS Samsung PM961 MZVLW256HEHP | Samsung Odyssey NP800G5M-X01US Samsung PM961 NVMe MZVLW128HEGR | Asus ROG Strix GL553VD-DS71 HGST Travelstar 7K1000 HTS721010A9E630 | Acer Aspire VX15 VX5-591G-589S Hynix HFS128G39TND | |
|---|---|---|---|---|---|
| CrystalDiskMark 3.0 | 21400% | 15742% | 56% | 11511% | |
| Read Seq (MB/s) | 84.7 | 2170 2462% | 1518 1692% | 93.5 10% | 510 502% |
| Write Seq (MB/s) | 65.4 | 1202 1738% | 798 1120% | 89.6 37% | 137.6 110% |
| Read 512 (MB/s) | 19.86 | 786 3858% | 460.5 2219% | 39.06 97% | 362.1 1723% |
| Write 512 (MB/s) | 28.43 | 822 2791% | 195.8 589% | 51.1 80% | 137.2 383% |
| Read 4k (MB/s) | 0.531 | 58.9 10992% | 47.16 8781% | 0.57 7% | 35.18 6525% |
| Write 4k (MB/s) | 0.481 | 146.4 30337% | 143.1 29651% | 1.05 118% | 104.8 21688% |
| Read 4k QD32 (MB/s) | 1.105 | 457.7 41321% | 521 47049% | 1.06 -4% | 375.8 33909% |
| Write 4k QD32 (MB/s) | 0.505 | 392.9 77702% | 176.4 34831% | 1.04 106% | 138.1 27247% |

| 3DMark 11 Performance | 7170 punten | |
| 3DMark Cloud Gate Standard Score | 13473 punten | |
| 3DMark Fire Strike Score | 5085 punten | |
| 3DMark Fire Strike Extreme Score | 2512 punten | |
Help | ||
| The Witcher 3 | |
| 1024x768 Low Graphics & Postprocessing (sorteer op waarde) | |
| Dell Inspiron 15 7000 7567 Gaming (Core i5-7300HQ, GTX 1050) | |
| Dell XPS 15 2017 9560 (7300HQ, Full-HD) | |
| 1366x768 Medium Graphics & Postprocessing (sorteer op waarde) | |
| Dell Inspiron 15 7000 7567 Gaming (Core i5-7300HQ, GTX 1050) | |
| Dell XPS 15 2017 9560 (7300HQ, Full-HD) | |
| 1920x1080 High Graphics & Postprocessing (Nvidia HairWorks Off) (sorteer op waarde) | |
| Dell Inspiron 15 7000 7567 Gaming (Core i5-7300HQ, GTX 1050) | |
| Samsung Odyssey NP800G5M-X01US | |
| Gigabyte Sabre 15G | |
| Dell XPS 15 2017 9560 (7300HQ, Full-HD) | |
| Acer Aspire VX5-591G-75C4 VX15 | |
| 1920x1080 Ultra Graphics & Postprocessing (HBAO+) (sorteer op waarde) | |
| Dell Inspiron 15 7000 7567 Gaming (Core i5-7300HQ, GTX 1050) | |
| Lenovo Legion Y520-15IKBN-80WK001KUS | |
| Samsung Odyssey NP800G5M-X01US | |
| Gigabyte Sabre 15G | |
| Dell XPS 15 2017 9560 (7300HQ, Full-HD) | |
| Acer Aspire VX5-591G-75C4 VX15 | |
| lage | gem. | hoge | ultra | |
|---|---|---|---|---|
| Metro 2033 (2010) | 85.5 | 80.7 | 72.7 | 44.6 |
| Dirt 3 (2011) | 194.4 | 106.9 | 127.4 | 101 |
| Sleeping Dogs (2012) | 174.9 | 135.8 | 114.6 | 98.5 |
| Hitman: Absolution (2012) | 79.1 | 73.9 | 66.8 | 41.8 |
| Tomb Raider (2013) | 252.5 | 208.6 | 167.7 | 79.9 |
| BioShock Infinite (2013) | 173.5 | 149.6 | 139.2 | 64.9 |
| GRID 2 (2013) | 120.4 | 103 | 96.2 | 75.3 |
| Company of Heroes 2 (2013) | 52.4 | 50.7 | 47.4 | 26 |
| Thief (2014) | 58 | 56.6 | 53.8 | 41.8 |
| GRID: Autosport (2014) | 141.6 | 98.7 | 87 | 71.3 |
| Middle-earth: Shadow of Mordor (2014) | 122.8 | 99 | 58.8 | 45.8 |
| The Witcher 3 (2015) | 95.9 | 69.2 | 39 | 21.9 |
| Batman: Arkham Knight (2015) | 80 | 76 | 50 | 32 |
| Rise of the Tomb Raider (2016) | 105.5 | 64.5 | 35.8 | 30.9 |
| Ashes of the Singularity (2016) | 37.1 | 31 | 28.6 |
Geluidsniveau
| Onbelast |
| 31.6 / 31.8 / 31.8 dB (A) |
| Belasting |
| 36.3 / 49 dB (A) |
 | ||
30 dB stil 40 dB(A) hoorbaar 50 dB(A) luid |
||
min: | ||
| Dell Inspiron 15 7000 7567 Gaming (Core i5-7300HQ, GTX 1050) GeForce GTX 1050 Mobile, i5-7300HQ, Toshiba MQ02ABD100H | Lenovo Legion Y520-15IKBN-80WK001KUS GeForce GTX 1050 Ti Mobile, i7-7700HQ, Samsung PM961 MZVLW256HEHP | Samsung Odyssey NP800G5M-X01US GeForce GTX 1050 Mobile, i7-7700HQ, Samsung PM961 NVMe MZVLW128HEGR | Asus ROG Strix GL553VD-DS71 GeForce GTX 1050 Mobile, i7-7700HQ, HGST Travelstar 7K1000 HTS721010A9E630 | Acer Aspire VX15 VX5-591G-589S GeForce GTX 1050 Mobile, i5-7300HQ, Hynix HFS128G39TND | Gigabyte Sabre 15G GeForce GTX 1050 Mobile, i7-7700HQ, Liteonit CV3-8D128 | Dell XPS 15 2017 9560 (7300HQ, Full-HD) GeForce GTX 1050 Mobile, i5-7300HQ, WDC WD10SPCX-75KHST0 + SanDisk Z400s M.2 2242 32 GB Cache | |
|---|---|---|---|---|---|---|---|
| Noise | 4% | -2% | -9% | 7% | -8% | -7% | |
| uit / omgeving * (dB) | 28 | 27.7 1% | 28.1 -0% | 30.6 -9% | 30 -7% | 28.2 -1% | 30.3 -8% |
| Idle Minimum * (dB) | 31.6 | 30.5 3% | 28.1 11% | 33.4 -6% | 30 5% | 33 -4% | 31.6 -0% |
| Idle Average * (dB) | 31.8 | 30.5 4% | 29.1 8% | 33.4 -5% | 30 6% | 33.3 -5% | 31.6 1% |
| Idle Maximum * (dB) | 31.8 | 30.6 4% | 29.1 8% | 33.4 -5% | 31.1 2% | 34.7 -9% | 33.4 -5% |
| Load Average * (dB) | 36.3 | 40 -10% | 49.2 -36% | 46.5 -28% | 31.3 14% | 44.5 -23% | 47.8 -32% |
| Witcher 3 ultra * (dB) | 46.3 | 40 14% | 49.2 -6% | ||||
| Load Maximum * (dB) | 49 | 42.6 13% | 49.2 -0% | 49.6 -1% | 38.9 21% | 52.8 -8% | 47.8 2% |
* ... kleiner is beter
(-) De maximumtemperatuur aan de bovenzijde bedraagt 47.2 °C / 117 F, vergeleken met het gemiddelde van 40.4 °C / 105 F, variërend van 21.2 tot 68.8 °C voor de klasse Gaming.
(±) De bodem warmt op tot een maximum van 43.2 °C / 110 F, vergeleken met een gemiddelde van 43.2 °C / 110 F
(+) Bij onbelast gebruik bedraagt de gemiddelde temperatuur voor de bovenzijde 26.4 °C / 80 F, vergeleken met het apparaatgemiddelde van 33.9 °C / 93 F.
(+) Bij het spelen van The Witcher 3 is de gemiddelde temperatuur voor de bovenzijde 29.5 °C / 85 F, vergeleken met het apparaatgemiddelde van 33.9 °C / 93 F.
(±) De palmsteunen en het touchpad kunnen zeer heet aanvoelen met een maximum van ###max## °C / 97.9 F.
(-) De gemiddelde temperatuur van de handpalmsteun van soortgelijke toestellen bedroeg 28.8 °C / 83.8 F (-7.8 °C / -14.1 F).
Dell Inspiron 15 7000 7567 Gaming (Core i5-7300HQ, GTX 1050) audioanalyse
(±) | luidspreker luidheid is gemiddeld maar goed (78.2 dB)
Bas 100 - 315 Hz
(±) | verminderde zeebaars - gemiddeld 11.4% lager dan de mediaan
(±) | lineariteit van de lage tonen is gemiddeld (11.2% delta ten opzichte van de vorige frequentie)
Midden 400 - 2000 Hz
(+) | evenwichtige middens - slechts 2.4% verwijderd van de mediaan
(±) | lineariteit van de middentonen is gemiddeld (7.8% delta ten opzichte van de vorige frequentie)
Hoog 2 - 16 kHz
(+) | evenwichtige hoogtepunten - slechts 4.1% verwijderd van de mediaan
(+) | de hoge tonen zijn lineair (6.7% delta naar de vorige frequentie)
Algemeen 100 - 16.000 Hz
(±) | lineariteit van het totale geluid is gemiddeld (16.6% verschil met de mediaan)
Vergeleken met dezelfde klasse
» 43% van alle geteste apparaten in deze klasse waren beter, 7% vergelijkbaar, 50% slechter
» De beste had een delta van 6%, het gemiddelde was 18%, de slechtste was 132%
Vergeleken met alle geteste toestellen
» 29% van alle geteste apparaten waren beter, 6% gelijk, 66% slechter
» De beste had een delta van 4%, het gemiddelde was 24%, de slechtste was 134%
Apple MacBook 12 (Early 2016) 1.1 GHz audioanalyse
(+) | luidsprekers kunnen relatief luid spelen (83.6 dB)
Bas 100 - 315 Hz
(±) | verminderde zeebaars - gemiddeld 11.3% lager dan de mediaan
(±) | lineariteit van de lage tonen is gemiddeld (14.2% delta ten opzichte van de vorige frequentie)
Midden 400 - 2000 Hz
(+) | evenwichtige middens - slechts 2.4% verwijderd van de mediaan
(+) | de middentonen zijn lineair (5.5% delta ten opzichte van de vorige frequentie)
Hoog 2 - 16 kHz
(+) | evenwichtige hoogtepunten - slechts 2% verwijderd van de mediaan
(+) | de hoge tonen zijn lineair (4.5% delta naar de vorige frequentie)
Algemeen 100 - 16.000 Hz
(+) | het totale geluid is lineair (10.2% verschil met de mediaan)
Vergeleken met dezelfde klasse
» 7% van alle geteste apparaten in deze klasse waren beter, 2% vergelijkbaar, 91% slechter
» De beste had een delta van 5%, het gemiddelde was 18%, de slechtste was 53%
Vergeleken met alle geteste toestellen
» 5% van alle geteste apparaten waren beter, 1% gelijk, 94% slechter
» De beste had een delta van 4%, het gemiddelde was 24%, de slechtste was 134%
| Uit / Standby | |
| Inactief | |
| Belasting |
|
Key:
min: | |
| Dell Inspiron 15 7000 7567 Gaming (Core i5-7300HQ, GTX 1050) i5-7300HQ, GeForce GTX 1050 Mobile, Toshiba MQ02ABD100H, TN, 1920x1080, 15.6" | Dell Inspiron 15 7000 7567 i7-7700HQ, GeForce GTX 1050 Ti Mobile, Intel SSDSCKKF256H6, TN, 1920x1080, 15.6" | Lenovo Legion Y520-15IKBN-80WK001KUS i7-7700HQ, GeForce GTX 1050 Ti Mobile, Samsung PM961 MZVLW256HEHP, IPS, 1920x1080, 15.6" | Samsung Odyssey NP800G5M-X01US i7-7700HQ, GeForce GTX 1050 Mobile, Samsung PM961 NVMe MZVLW128HEGR, IPS, 1920x1080, 15.6" | Asus ROG Strix GL553VD-DS71 i7-7700HQ, GeForce GTX 1050 Mobile, HGST Travelstar 7K1000 HTS721010A9E630, IPS, 1920x1080, 15.6" | Acer Aspire VX15 VX5-591G-589S i5-7300HQ, GeForce GTX 1050 Mobile, Hynix HFS128G39TND, IPS, 1920x1080, 15.6" | Gigabyte Sabre 15G i7-7700HQ, GeForce GTX 1050 Mobile, Liteonit CV3-8D128, IPS, 1920x1080, 15.6" | |
|---|---|---|---|---|---|---|---|
| Power Consumption | 21% | 3% | 5% | -2% | 2% | 3% | |
| Idle Minimum * (Watt) | 9.1 | 4.4 52% | 8.5 7% | 6.7 26% | 7.7 15% | 8.4 8% | 8 12% |
| Idle Average * (Watt) | 10.3 | 6.8 34% | 9.1 12% | 8.9 14% | 11.7 -14% | 13.1 -27% | 10.9 -6% |
| Idle Maximum * (Watt) | 13 | 8.3 36% | 9.7 25% | 10.8 17% | 12 8% | 14.2 -9% | 11 15% |
| Load Average * (Watt) | 75.6 | 81 -7% | 79.9 -6% | 81.8 -8% | 80.5 -6% | 50 34% | 76.7 -1% |
| Witcher 3 ultra * (Watt) | 83.8 | 97.7 -17% | 92.2 -10% | 94.9 -13% | |||
| Load Maximum * (Watt) | 115.2 | 127 -10% | 121.5 -5% | 122.7 -7% | 128.4 -11% | 111 4% | 106.4 8% |
* ... kleiner is beter
| Dell Inspiron 15 7000 7567 Gaming (Core i5-7300HQ, GTX 1050) i5-7300HQ, GeForce GTX 1050 Mobile, 74 Wh | Dell Inspiron 15 7000 7567 i7-7700HQ, GeForce GTX 1050 Ti Mobile, 74 Wh | Lenovo Legion Y520-15IKBN-80WK001KUS i7-7700HQ, GeForce GTX 1050 Ti Mobile, 45 Wh | Samsung Odyssey NP800G5M-X01US i7-7700HQ, GeForce GTX 1050 Mobile, 43 Wh | Asus ROG Strix GL553VD-DS71 i7-7700HQ, GeForce GTX 1050 Mobile, 48 Wh | Acer Aspire VX15 VX5-591G-589S i5-7300HQ, GeForce GTX 1050 Mobile, 52.5 Wh | Gigabyte Sabre 15G i7-7700HQ, GeForce GTX 1050 Mobile, 47 Wh | |
|---|---|---|---|---|---|---|---|
| Batterijduur | -4% | -57% | -44% | -57% | -42% | -48% | |
| Reader / Idle (h) | 18.2 | 19.6 8% | 8.5 -53% | 10.2 -44% | 7.3 -60% | 8.2 -55% | |
| WiFi v1.3 (h) | 9.5 | 10.4 9% | 4 -58% | 4.4 -54% | 4.6 -52% | 5.5 -42% | 4.4 -54% |
| Load (h) | 2 | 1.4 -30% | 0.8 -60% | 1.3 -35% | 0.8 -60% | 1.3 -35% |
Pro
Contra
Dit is de verkorte versie van het originele artikel. Het volledige, Engelse testrapport vind je hier.
In sommige opzichten was onze test van de Dell Inspiron 7000 7567 Gaming met i5-7300HQ en GTX 1050 niet zo simpel als we verwacht hadden: op papier is het geteste model simpelweg een minder krachtige versie van zijn higher-end familieleden. Hoewel de prestaties inderdaad lager zijn en eigenlijk als verwacht, is het verbazingwekkend dat het systeemgeluid luider is, de temperaturen hoger zijn en de batterijlevensduur ook iets korter is. Dit klinkt als een afknapper, maar dat valt in werkelijkheid mee: de Inspiron is goed gebouwd, stevig, ziet er goed uit, biedt fatsoenlijke prestaties en gaat makkelijk een hele dag mee bij alledaagse taken. De enige echte tekortkoming is het TN beeldscherm dat redelijk helder is, maar dat erg last heeft van het slechte contrast, onnauwkeurige kleuren en erg slechte kijkhoeken.
De Inspiron 15 7000 Gaming is een van de oudste budget game systeem series op de markt. De prijs van € 750 is ook alleszins redelijk.
Op moment van schrijven kan de Inspiron 15 7000 Gaming voor € 850 besteld worden met een 256 GB SSD, GTX 1050 Ti en ee 15.6-inch FHD (1920 x 1080) IPS beeldscherm. Gezien het lusteloze TN beeldscherm van ons testmodel moet je zonder twijfel dit duurdere model kiezen, mits je budget het toelaat.
Dell Inspiron 15 7000 7567 Gaming (Core i5-7300HQ, GTX 1050)
- 07-08-2017 v6 (old)
Bernie Pechlaner
Price comparison
