Kort testrapport Apple MacBook Pro 15 2017 (2.8 GHz, 555) Laptop


| |||||||||||||||||||||||||
Helderheidsverdeling: 86 %
Helderheid in Batterij-modus: 545 cd/m²
Contrast: 1239:1 (Zwart: 0.44 cd/m²)
ΔE ColorChecker Calman: 1.6 | ∀{0.5-29.43 Ø4.73}
ΔE Greyscale Calman: 1.9 | ∀{0.09-98 Ø4.97}
85.9% AdobeRGB 1998 (Argyll 3D)
99.9% sRGB (Argyll 3D)
97.9% Display P3 (Argyll 3D)
Gamma: 2.26
CCT: 6834 K
| Apple MacBook Pro 15 2017 (2.8 GHz, 555) APPA031, , 2880x1800, 15.4" | Apple MacBook Pro 15 2016 (2.6 GHz, 450) 2880x1800, 15.4" | Apple MacBook Pro 15 2016 (2.7 GHz, 455) APPA031, , 2880x1800, 15.4" | Apple MacBook Pro 15 2016 (2.9 GHz, 460) Apple APPA030, , 2880x1800, 15.4" | Dell XPS 15 9560 (i7-7700HQ, UHD) 3840x2160, 15.6" | Lenovo ThinkPad P51s 20HB000SGE BOE NV156QUM-N44, , 3840x2160, 15.6" | |
|---|---|---|---|---|---|---|
| Display | 1% | 1% | 3% | -20% | ||
| Display P3 Coverage (%) | 97.9 | 98.5 1% | 99 1% | 89.7 -8% | 69.7 -29% | |
| sRGB Coverage (%) | 99.9 | 99.9 0% | 100 0% | 100 0% | 91.2 -9% | |
| AdobeRGB 1998 Coverage (%) | 85.9 | 86.4 1% | 87.3 2% | 100 16% | 66.8 -22% | |
| Response Times | 5% | -7% | -31% | -18% | 24% | |
| Response Time Grey 50% / Grey 80% * (ms) | 48 ? | 47.3 ? 1% | 46.4 ? 3% | 46 ? 4% | 57.2 ? -19% | 38.4 ? 20% |
| Response Time Black / White * (ms) | 33.8 ? | 31.2 ? 8% | 39.2 ? -16% | 56 ? -66% | 39.2 ? -16% | 24.8 ? 27% |
| PWM Frequency (Hz) | 119000 ? | 117000 ? | 119000 ? | 962 | 980 ? | |
| Screen | 10% | 14% | -23% | -75% | -50% | |
| Brightness middle (cd/m²) | 545 | 483 -11% | 568 4% | 420 -23% | 370.1 -32% | 317 -42% |
| Brightness (cd/m²) | 523 | 465 -11% | 532 2% | 401 -23% | 356 -32% | 290 -45% |
| Brightness Distribution (%) | 86 | 92 7% | 83 -3% | 90 5% | 87 1% | 85 -1% |
| Black Level * (cd/m²) | 0.44 | 0.33 25% | 0.297 32% | 0.3 32% | 0.37 16% | 0.32 27% |
| Contrast (:1) | 1239 | 1464 18% | 1912 54% | 1400 13% | 1000 -19% | 991 -20% |
| Colorchecker dE 2000 * | 1.6 | 1.4 13% | 1.4 13% | 3.33 -108% | 5.3 -231% | 3.6 -125% |
| Colorchecker dE 2000 max. * | 3.8 | 3 21% | 2.7 29% | 5.11 -34% | 9.9 -161% | 6.6 -74% |
| Greyscale dE 2000 * | 1.9 | 1.5 21% | 2.3 -21% | 2.73 -44% | 4.6 -142% | 4.2 -121% |
| Gamma | 2.26 97% | 2.34 94% | 2.29 96% | 2.48 89% | 2.31 95% | 2.24 98% |
| CCT | 6834 95% | 6650 98% | 7165 91% | 6457 101% | 6284 103% | 6740 96% |
| Color Space (Percent of AdobeRGB 1998) (%) | 77.4 | 78.09 | 88.3 | 59.5 | ||
| Color Space (Percent of sRGB) (%) | 99.9 | 99.97 | 100 | 91.1 | ||
| Totaal Gemiddelde (Programma / Instellingen) | 8% /
9% | 3% /
8% | -18% /
-19% | -30% /
-48% | -15% /
-32% |
* ... kleiner is beter
Responstijd Scherm
| ↔ Responstijd Zwart naar Wit | ||
|---|---|---|
| 33.8 ms ... stijging ↗ en daling ↘ gecombineerd | ↗ 19.6 ms stijging | 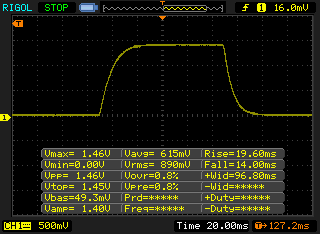 |
| ↘ 14.2 ms daling | ||
| Het scherm vertoonde trage responstijden in onze tests en is misschien te traag voor games. Ter vergelijking: alle testtoestellen variëren van 0.1 (minimum) tot 240 (maximum) ms. » 90 % van alle toestellen zijn beter. Dit betekent dat de gemeten responstijd slechter is dan het gemiddelde (19.9 ms) van alle geteste toestellen. | ||
| ↔ Responstijd 50% Grijs naar 80% Grijs | ||
| 48 ms ... stijging ↗ en daling ↘ gecombineerd | ↗ 23.6 ms stijging | 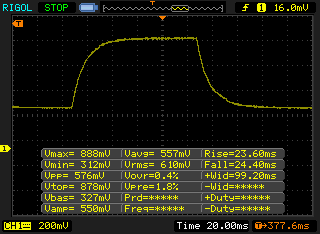 |
| ↘ 24.4 ms daling | ||
| Het scherm vertoonde trage responstijden in onze tests en is misschien te traag voor games. Ter vergelijking: alle testtoestellen variëren van 0.165 (minimum) tot 636 (maximum) ms. » 82 % van alle toestellen zijn beter. Dit betekent dat de gemeten responstijd slechter is dan het gemiddelde (31.1 ms) van alle geteste toestellen. | ||
Screen Flickering / PWM (Pulse-Width Modulation)
| Screen flickering / PWM waargenomen | 119000 Hz | ≤ 80 % helderheid instelling | 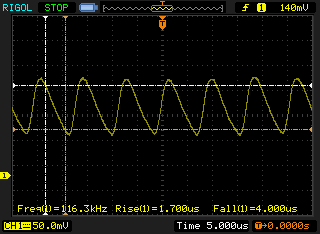 |
| ≤ 210 cd/m² helderheid | |||
De achtergrondverlichting van het scherm flikkert op 119000 Hz (in het slechtste geval, bijvoorbeeld bij gebruik van PWM) aan een helderheid van 80 % (210 cd/m²) en lager. Boven deze helderheid zou er geen flickering / PWM mogen optreden. De frequentie van 119000 Hz is redelijk hoog en de meeste mensen die gevoelig zijn aan flickering zouden dit dus niet mogen waarnemen of geïrriteerde ogen krijgen. Fllickering treedt zelfs op aan een relatief hoge helderheid. Daarom kan het de gebruiker in veel alledaagse situaties beïnvloeden. Ter vergelijking: 52 % van alle geteste toestellen maakten geen gebruik van PWM om de schermhelderheid te verlagen. Als het wel werd gebruikt, werd een gemiddelde van 7804 (minimum: 5 - maximum: 343500) Hz waargenomen. | |||
| PCMark 8 Home Score Accelerated v2 | 4054 punten | |
| PCMark 8 Creative Score Accelerated v2 | 4914 punten | |
| PCMark 8 Work Score Accelerated v2 | 4648 punten | |
| PCMark 10 Score | 4122 punten | |
Help | ||
| 3DMark 06 Standard Score | 26389 punten | |
| 3DMark 11 Performance | 5566 punten | |
| 3DMark Cloud Gate Standard Score | 15337 punten | |
| 3DMark Fire Strike Score | 3430 punten | |
| 3DMark Time Spy Score | 1207 punten | |
Help | ||
Geluidsniveau
| Onbelast |
| 31.3 / 31.3 / 31.7 dB (A) |
| Belasting |
| 39.7 / 48.6 dB (A) |
 | ||
30 dB stil 40 dB(A) hoorbaar 50 dB(A) luid |
||
min: | ||
| Apple MacBook Pro 15 2017 (2.8 GHz, 555) Radeon Pro 555, i7-7700HQ, Apple SSD SM0256L | Apple MacBook Pro 15 2016 (2.6 GHz, 450) Radeon Pro 450, 6700HQ, Apple SSD SM0256L | Apple MacBook Pro 15 2016 (2.7 GHz, 455) Radeon Pro 455, 6820HQ, Apple SSD SM0512L | Apple MacBook Pro 15 2016 (2.9 GHz, 460) Radeon Pro 460, 6920HQ, Apple SSD SM1024L | Dell XPS 15 9560 (i7-7700HQ, UHD) GeForce GTX 1050 Mobile, i7-7700HQ, Lite-On CX2-8B512-Q11 | Lenovo ThinkPad P51s 20HB000SGE Quadro M520, i7-7600U, Samsung SSD PM961 1TB M.2 PCIe 3.0 x4 NVMe (MZVLW1T0) | |
|---|---|---|---|---|---|---|
| Noise | 5% | 2% | 6% | -6% | 8% | |
| uit / omgeving * (dB) | 30.9 | 30.4 2% | 30.4 2% | 29 6% | 28.4 8% | 29.2 6% |
| Idle Minimum * (dB) | 31.3 | 30.6 2% | 30.8 2% | 30.3 3% | 29 7% | 29.2 7% |
| Idle Average * (dB) | 31.3 | 30.6 2% | 30.8 2% | 30.3 3% | 29 7% | 29.2 7% |
| Idle Maximum * (dB) | 31.7 | 30.6 3% | 30.8 3% | 30.3 4% | 32.2 -2% | 31.1 2% |
| Load Average * (dB) | 39.7 | 34.7 13% | 38.7 3% | 35.1 12% | 47.1 -19% | 36.7 8% |
| Witcher 3 ultra * (dB) | 35.5 | 52 -46% | ||||
| Load Maximum * (dB) | 48.6 | 46.3 5% | 48.8 -0% | 46 5% | 47.1 3% | 39.4 19% |
* ... kleiner is beter
(±) De maximumtemperatuur aan de bovenzijde bedraagt 44 °C / 111 F, vergeleken met het gemiddelde van 36.8 °C / 98 F, variërend van 21 tot 71 °C voor de klasse Multimedia.
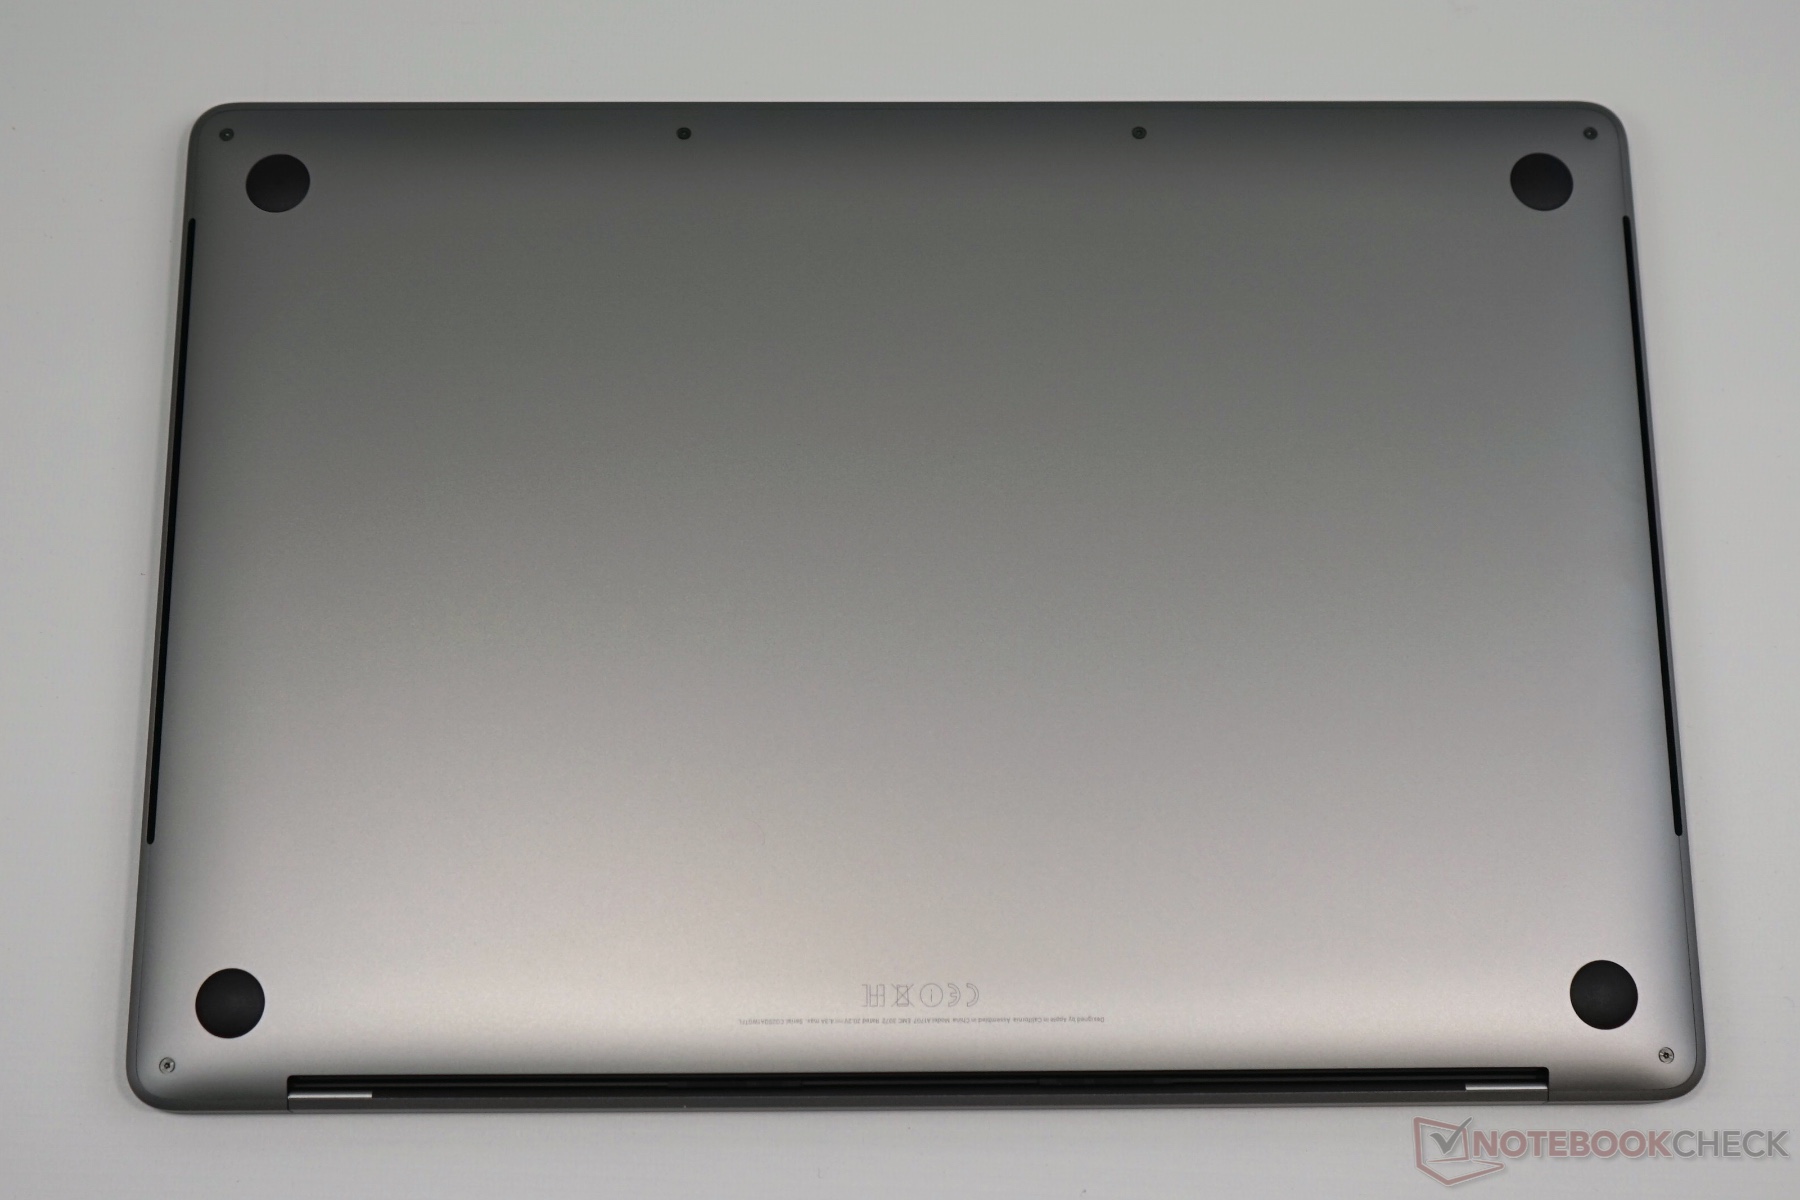
(±) De bodem warmt op tot een maximum van 41 °C / 106 F, vergeleken met een gemiddelde van 39.1 °C / 102 F
(+) Bij onbelast gebruik bedraagt de gemiddelde temperatuur voor de bovenzijde 22.8 °C / 73 F, vergeleken met het apparaatgemiddelde van 31.3 °C / 88 F.
(±) Bij het spelen van The Witcher 3 is de gemiddelde temperatuur voor de bovenzijde 36.6 °C / 98 F, vergeleken met het apparaatgemiddelde van 31.3 °C / 88 F.
(+) De palmsteunen en het touchpad zijn met een maximum van ###max## °C / 86 F koeler dan de huidtemperatuur en voelen daarom koel aan.
(±) De gemiddelde temperatuur van de handpalmsteun van soortgelijke toestellen bedroeg 28.7 °C / 83.7 F (-1.3 °C / -2.3 F).
Apple MacBook Pro 15 2017 (2.8 GHz, 555) audioanalyse
(+) | luidsprekers kunnen relatief luid spelen (87 dB)
Bas 100 - 315 Hz
(±) | verminderde zeebaars - gemiddeld 8.7% lager dan de mediaan
(±) | lineariteit van de lage tonen is gemiddeld (11.1% delta ten opzichte van de vorige frequentie)
Midden 400 - 2000 Hz
(+) | evenwichtige middens - slechts 2.5% verwijderd van de mediaan
(±) | lineariteit van de middentonen is gemiddeld (7.5% delta ten opzichte van de vorige frequentie)
Hoog 2 - 16 kHz
(+) | evenwichtige hoogtepunten - slechts 1.7% verwijderd van de mediaan
(+) | de hoge tonen zijn lineair (5% delta naar de vorige frequentie)
Algemeen 100 - 16.000 Hz
(+) | het totale geluid is lineair (7.9% verschil met de mediaan)
Vergeleken met dezelfde klasse
» 7% van alle geteste apparaten in deze klasse waren beter, 2% vergelijkbaar, 91% slechter
» De beste had een delta van 5%, het gemiddelde was 17%, de slechtste was 45%
Vergeleken met alle geteste toestellen
» 2% van alle geteste apparaten waren beter, 1% gelijk, 98% slechter
» De beste had een delta van 4%, het gemiddelde was 24%, de slechtste was 134%
Apple MacBook Pro 13 2017 Touchbar i5 audioanalyse
(+) | luidsprekers kunnen relatief luid spelen (86.2 dB)
Bas 100 - 315 Hz
(±) | verminderde zeebaars - gemiddeld 11.5% lager dan de mediaan
(±) | lineariteit van de lage tonen is gemiddeld (10.8% delta ten opzichte van de vorige frequentie)
Midden 400 - 2000 Hz
(±) | hogere middens - gemiddeld 5.2% hoger dan de mediaan
(+) | de middentonen zijn lineair (6.4% delta ten opzichte van de vorige frequentie)
Hoog 2 - 16 kHz
(+) | evenwichtige hoogtepunten - slechts 2.2% verwijderd van de mediaan
(+) | de hoge tonen zijn lineair (5.7% delta naar de vorige frequentie)
Algemeen 100 - 16.000 Hz
(+) | het totale geluid is lineair (11.9% verschil met de mediaan)
Vergeleken met dezelfde klasse
» 13% van alle geteste apparaten in deze klasse waren beter, 5% vergelijkbaar, 82% slechter
» De beste had een delta van 5%, het gemiddelde was 18%, de slechtste was 53%
Vergeleken met alle geteste toestellen
» 9% van alle geteste apparaten waren beter, 2% gelijk, 89% slechter
» De beste had een delta van 4%, het gemiddelde was 24%, de slechtste was 134%
Dell XPS 15 9560 (i7-7700HQ, UHD) audioanalyse
(-) | niet erg luide luidsprekers (70.9 dB)
Bas 100 - 315 Hz
(±) | verminderde zeebaars - gemiddeld 12.9% lager dan de mediaan
(±) | lineariteit van de lage tonen is gemiddeld (14.3% delta ten opzichte van de vorige frequentie)
Midden 400 - 2000 Hz
(+) | evenwichtige middens - slechts 3.5% verwijderd van de mediaan
(±) | lineariteit van de middentonen is gemiddeld (8.9% delta ten opzichte van de vorige frequentie)
Hoog 2 - 16 kHz
(+) | evenwichtige hoogtepunten - slechts 2.3% verwijderd van de mediaan
(±) | lineariteit van de hoogtepunten is gemiddeld (7.3% delta ten opzichte van de vorige frequentie)
Algemeen 100 - 16.000 Hz
(±) | lineariteit van het totale geluid is gemiddeld (16.2% verschil met de mediaan)
Vergeleken met dezelfde klasse
» 41% van alle geteste apparaten in deze klasse waren beter, 7% vergelijkbaar, 51% slechter
» De beste had een delta van 5%, het gemiddelde was 17%, de slechtste was 45%
Vergeleken met alle geteste toestellen
» 26% van alle geteste apparaten waren beter, 6% gelijk, 68% slechter
» De beste had een delta van 4%, het gemiddelde was 24%, de slechtste was 134%
| Apple MacBook Pro 15 2017 (2.8 GHz, 555) i7-7700HQ, Radeon Pro 555, 76 Wh | Apple MacBook Pro 15 2016 (2.6 GHz, 450) 6700HQ, Radeon Pro 450, 76 Wh | Apple MacBook Pro 15 2016 (2.7 GHz, 455) 6820HQ, Radeon Pro 455, 76 Wh | Apple MacBook Pro 15 2016 (2.9 GHz, 460) 6920HQ, Radeon Pro 460, 76 Wh | Dell Precision 3520 i7-7820HQ, Quadro M620, 68 Wh | Dell XPS 15 9560 (i7-7700HQ, UHD) i7-7700HQ, GeForce GTX 1050 Mobile, 97 Wh | Lenovo ThinkPad P51s 20HB000SGE i7-7600U, Quadro M520, 104 Wh | |
|---|---|---|---|---|---|---|---|
| Batterijduur | -5% | -6% | -2% | -1% | 19% | 163% | |
| H.264 (h) | 8.5 | 8.6 1% | 9.1 7% | 8.1 -5% | 11.7 38% | ||
| WiFi v1.3 (h) | 10.7 | 10 -7% | 10.6 -1% | 10.3 -4% | 7.6 -29% | 7.2 -33% | 11.9 11% |
| Witcher 3 ultra (h) | 1.5 | ||||||
| Load (h) | 1 | 0.9 -10% | 0.9 -10% | 0.9 -10% | 1.3 30% | 1.7 70% | 5.4 440% |
| Reader / Idle (h) | 16.6 | 13.9 | 26.4 |
Dit is de verkorte versie van het originele artikel. Het volledige, Engelse testrapport vind je hier.
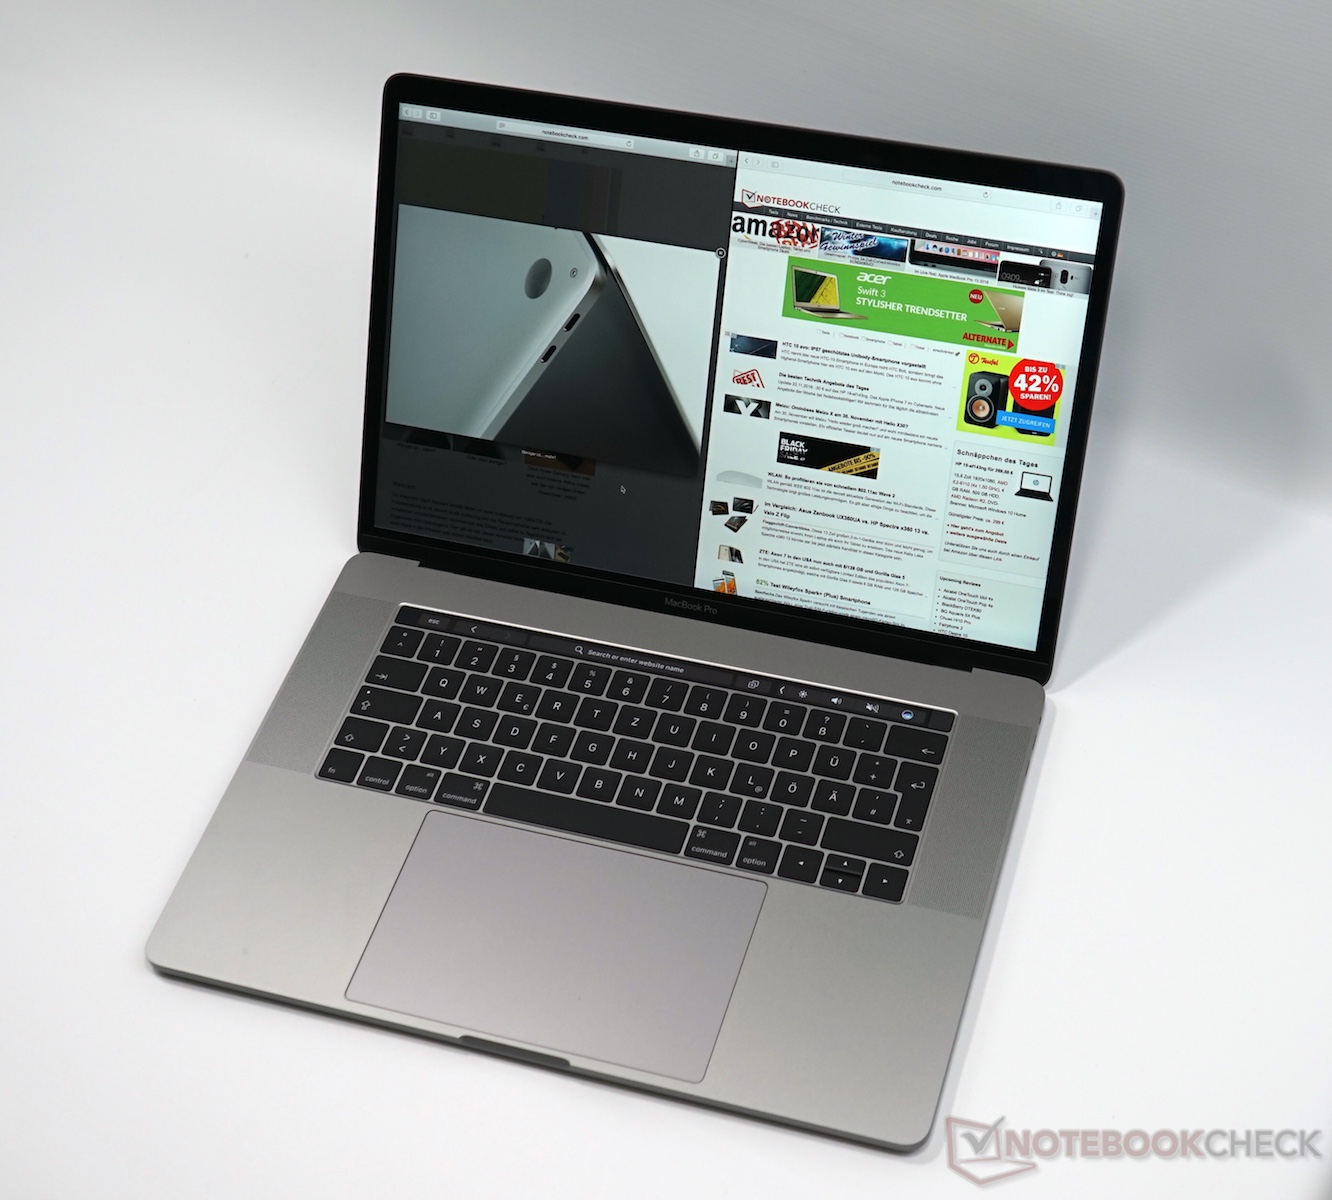
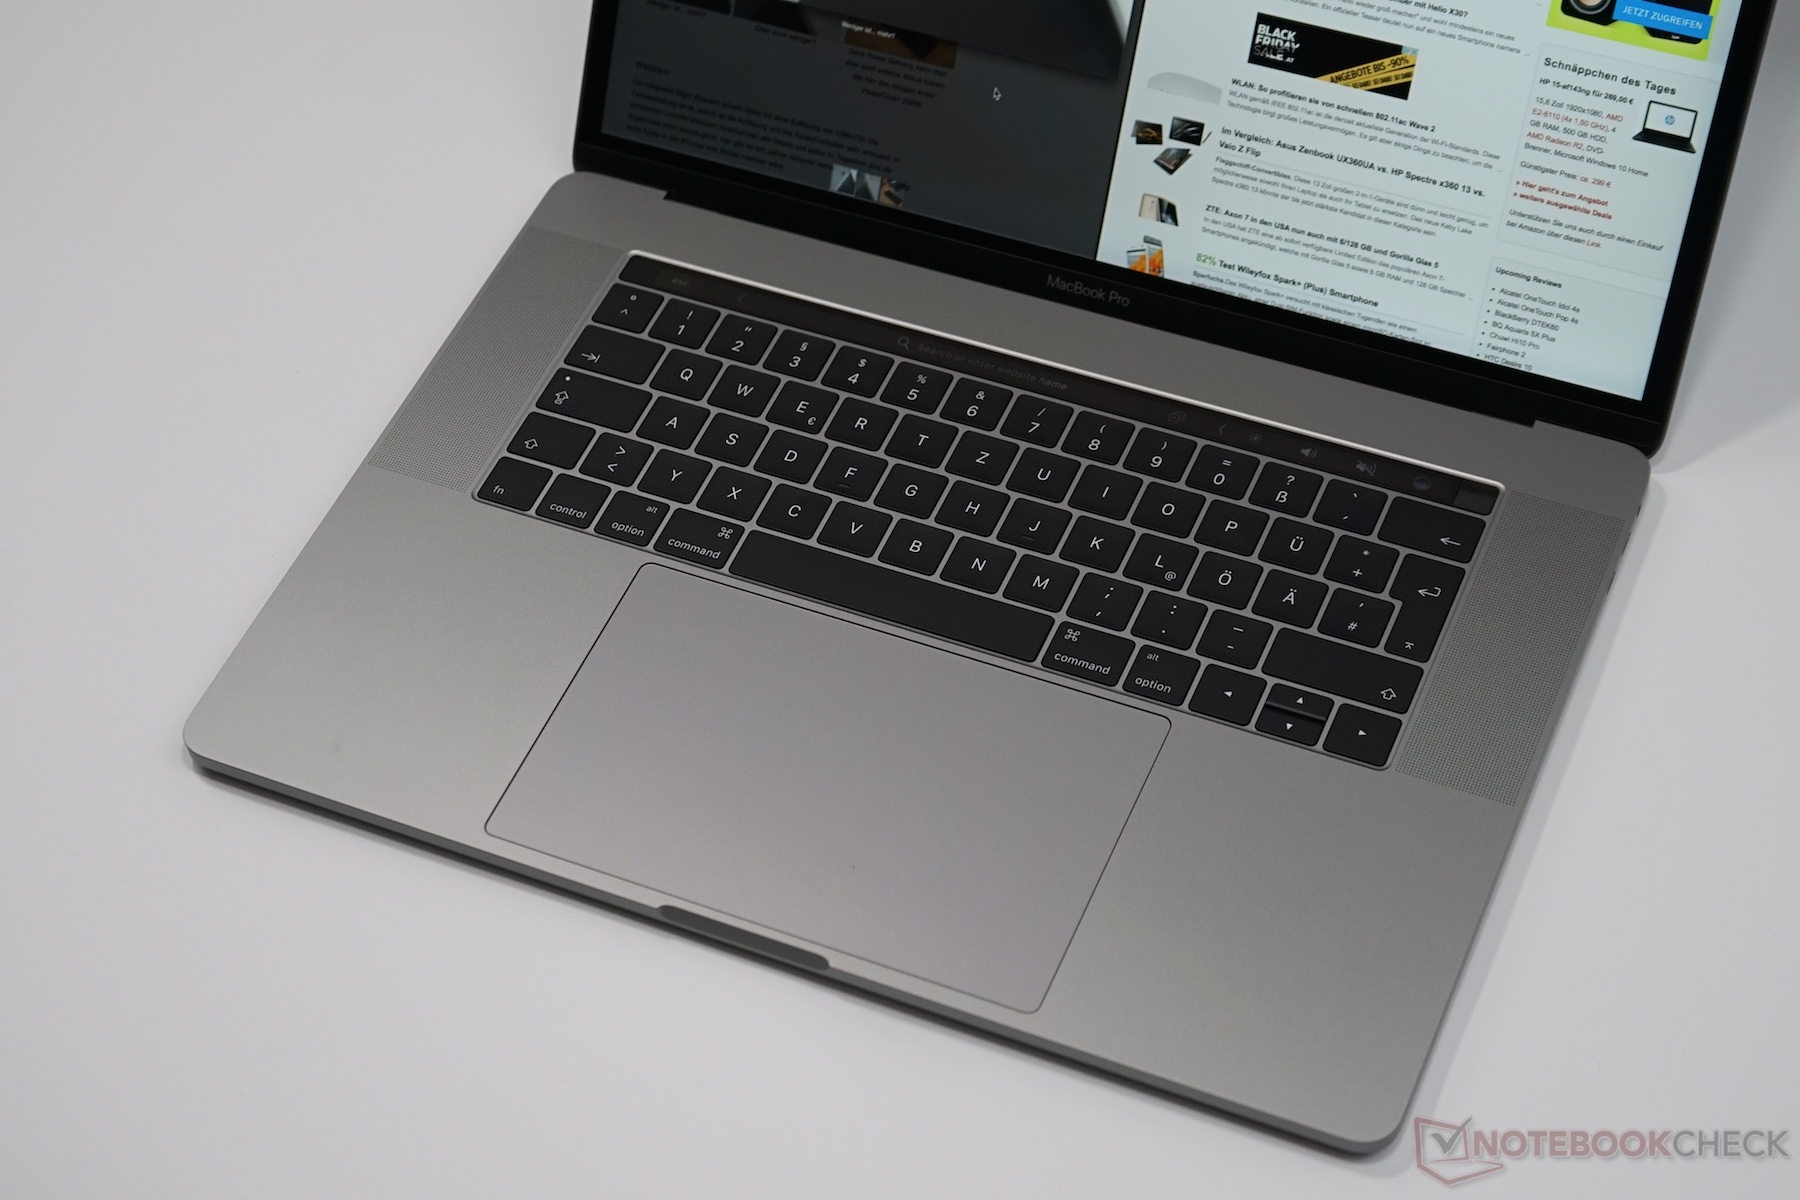
De eerste indruk van de huidige MacBook Pro 15 is na onze eerste tests goed. De prestaties zijn van een vergelijkbaar niveau als de concurrentie dankzij de nieuwe Kaby Lake processoren en de prestaties blijven constant bij langere periodes van belasting. Apple gebruikt nu standaard snellere GPU's. De prestaties hiervan kunnen niet op tegen de huidige middenklasse Pascal GPU's van nVidia, maar daar staat tegenover dat de AMD chips erg zuinig zijn.
We zullen het testrapport in de komende dagen afronden.
Price comparison
