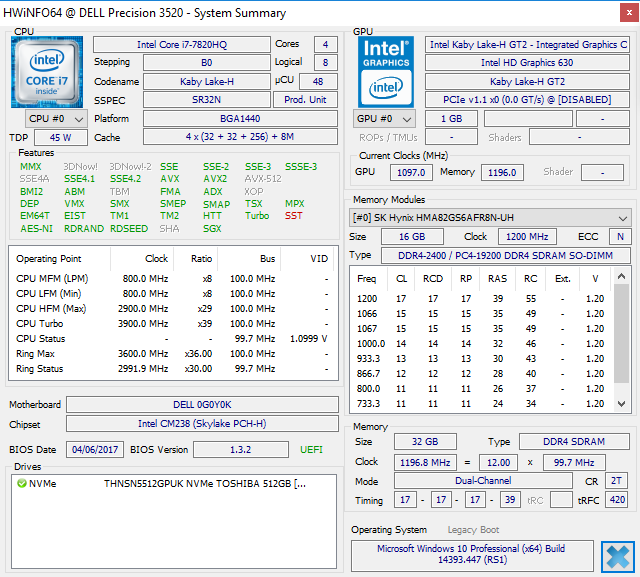
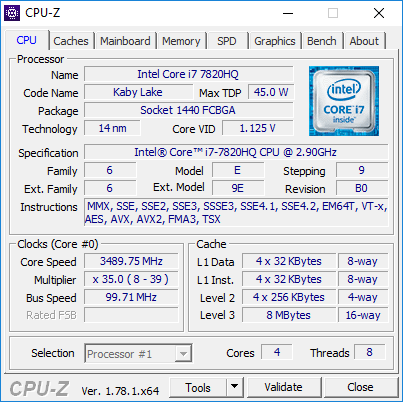
Kort testrapport Dell Precision 3520 (i7-7820HQ, M620M) Workstation
| SD Card Reader | |
| average JPG Copy Test (av. of 3 runs) | |
| Dell Precision 3520 | |
| Dell Precision 5520 UHD | |
| Dell Precision 3510 | |
| maximum AS SSD Seq Read Test (1GB) | |
| Dell Precision 5520 UHD | |
| Dell Precision 3510 | |
| Dell Precision 3520 | |
| Networking | |
| iperf3 transmit AX12 | |
| Dell Precision 5520 UHD | |
| Dell Precision 3520 | |
| iperf3 receive AX12 | |
| Dell Precision 3520 | |
| Dell Precision 5520 UHD | |
| |||||||||||||||||||||||||
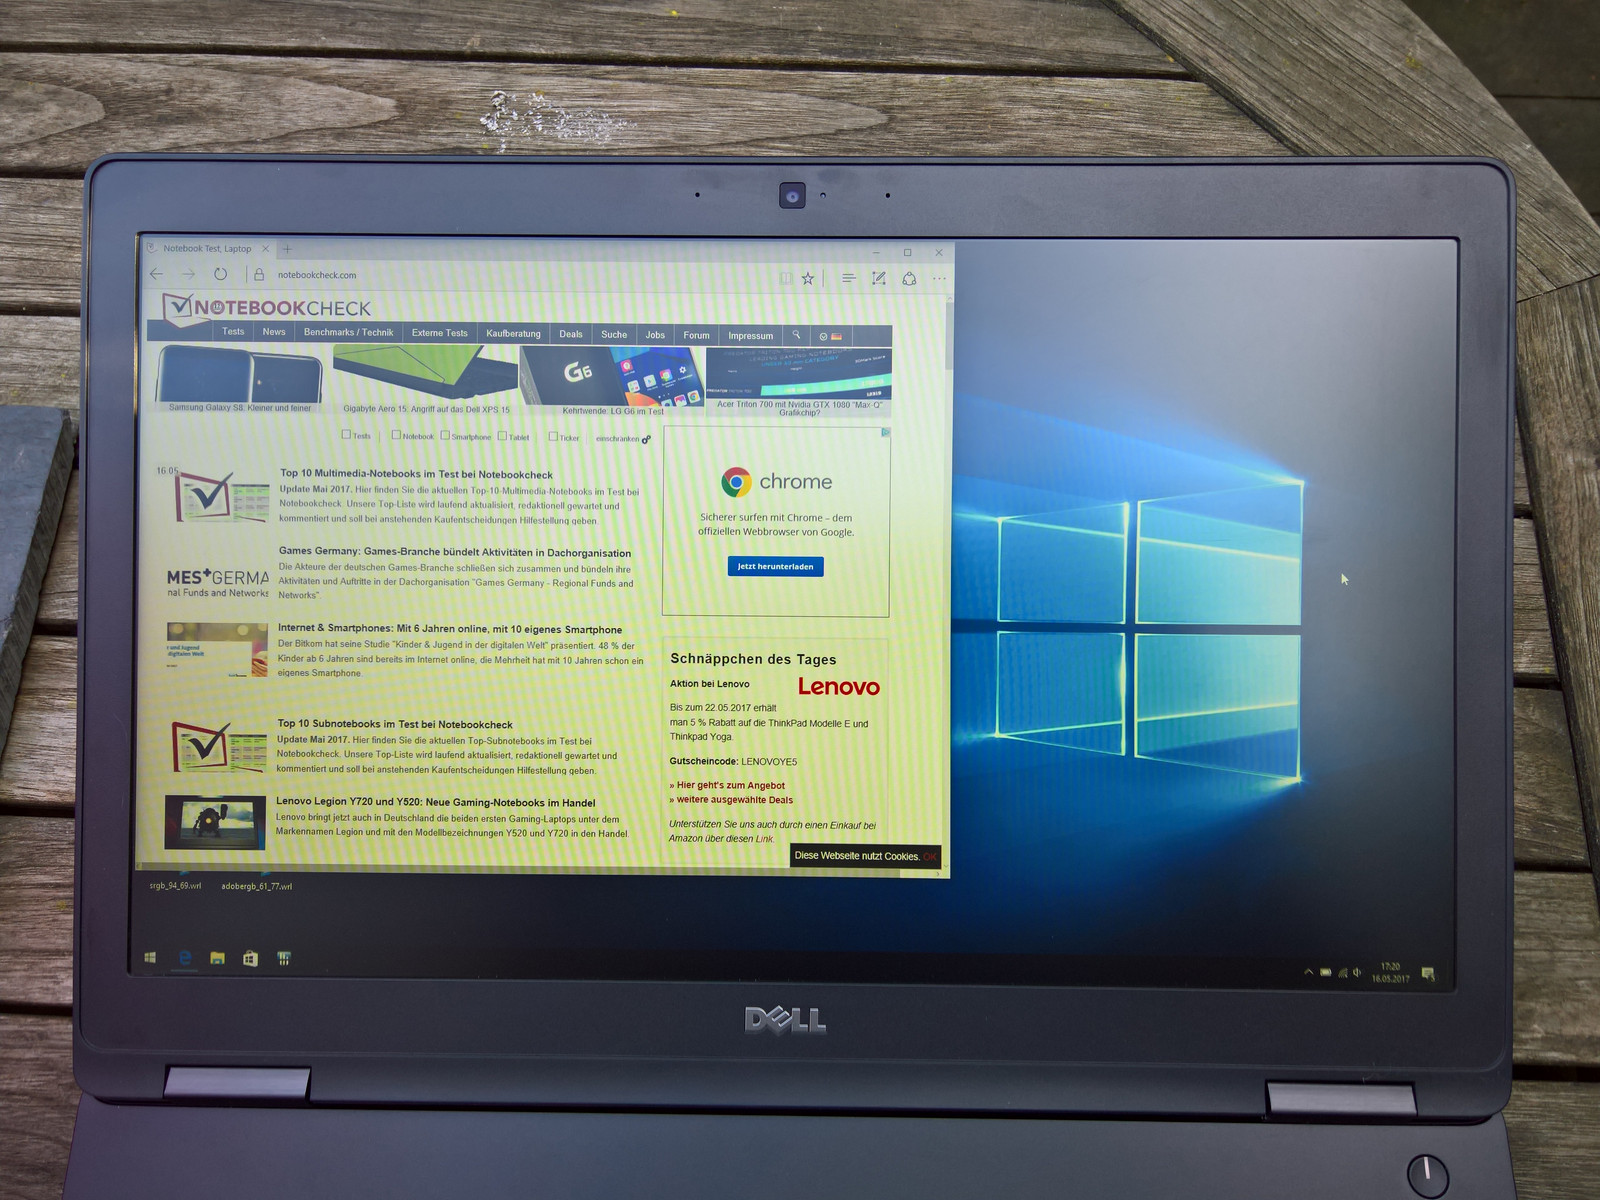
Helderheidsverdeling: 88 %
Helderheid in Batterij-modus: 346 cd/m²
Contrast: 932:1 (Zwart: 0.37 cd/m²)
ΔE ColorChecker Calman: 5 | ∀{0.5-29.43 Ø4.71}
ΔE Greyscale Calman: 6.2 | ∀{0.09-98 Ø4.96}
94.7% sRGB (Argyll 1.6.3 3D)
61.8% AdobeRGB 1998 (Argyll 1.6.3 3D)
69.3% AdobeRGB 1998 (Argyll 3D)
94.8% sRGB (Argyll 3D)
72.7% Display P3 (Argyll 3D)
Gamma: 2.35
CCT: 6702 K
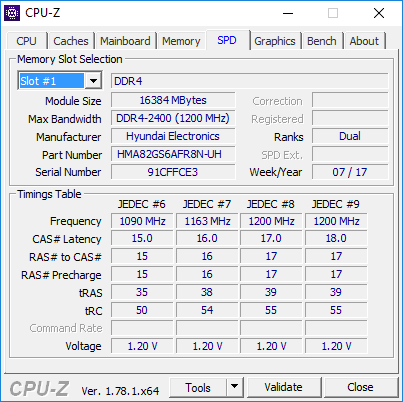
| Dell Precision 3520 1920x1080, 15.6" | Dell Precision 3510 LGD04AF, K96D2_156WHU, , 1366x768, 15.6" | Dell Precision 5520 UHD SHP1476, , 3840x2160, 15.6" | Lenovo ThinkPad P50 LP156WF6-SPK1, , 1920x1080, 15.6" | HP ZBook 15 G3 Samsung SDC5344, , 1920x1080, 15.6" | Lenovo ThinkPad T570-20HAS01E00 BOE NV156QUM-N44, , 3840x2160, 15.6" | |
|---|---|---|---|---|---|---|
| Display | -38% | -1% | -42% | -2% | -4% | |
| Display P3 Coverage (%) | 72.7 | 41.48 -43% | 67.4 -7% | 39.13 -46% | 66.8 -8% | 70 -4% |
| sRGB Coverage (%) | 94.8 | 62.4 -34% | 98.5 4% | 58.5 -38% | 95.5 1% | 91.1 -4% |
| AdobeRGB 1998 Coverage (%) | 69.3 | 42.86 -38% | 68.9 -1% | 40.45 -42% | 69 0% | 66.7 -4% |
| Response Times | 1% | -22% | 14% | -8% | 35% | |
| Response Time Grey 50% / Grey 80% * (ms) | 48 ? | 56 ? -17% | 59.2 ? -23% | 46 ? 4% | 54 ? -13% | 41.6 ? 13% |
| Response Time Black / White * (ms) | 34.4 ? | 28 ? 19% | 41.6 ? -21% | 26 ? 24% | 35.6 ? -3% | 15.2 ? 56% |
| PWM Frequency (Hz) | 1064 ? | 198 ? | 926 ? | |||
| Screen | -41% | 10% | -6% | -6% | 3% | |
| Brightness middle (cd/m²) | 345 | 199 -42% | 372.4 8% | 263 -24% | 306 -11% | 339 -2% |
| Brightness (cd/m²) | 329 | 201 -39% | 368 12% | 236 -28% | 289 -12% | 314 -5% |
| Brightness Distribution (%) | 88 | 83 -6% | 90 2% | 78 -11% | 85 -3% | 89 1% |
| Black Level * (cd/m²) | 0.37 | 0.4 -8% | 0.48 -30% | 0.34 8% | 0.34 8% | 0.36 3% |
| Contrast (:1) | 932 | 498 -47% | 776 -17% | 774 -17% | 900 -3% | 942 1% |
| Colorchecker dE 2000 * | 5 | 9 -80% | 2.6 48% | 2.35 53% | 5.1 -2% | 4.2 16% |
| Colorchecker dE 2000 max. * | 8 | 13.3 -66% | 5.6 30% | 9.9 -24% | 7.8 2% | |
| Greyscale dE 2000 * | 6.2 | 9.6 -55% | 3.7 40% | 3.33 46% | 7.4 -19% | 5.1 18% |
| Gamma | 2.35 94% | 2.41 91% | 2.14 103% | 2.38 92% | 2.37 93% | 2.16 102% |
| CCT | 6702 97% | 10695 61% | 7096 92% | 6917 94% | 7263 89% | 6569 99% |
| Color Space (Percent of AdobeRGB 1998) (%) | 61.8 | 39.6 -36% | 63 2% | 37 -40% | 63 2% | 59.4 -4% |
| Color Space (Percent of sRGB) (%) | 94.7 | 62.4 -34% | 99 5% | 58 -39% | 95 0% | 91 -4% |
| Totaal Gemiddelde (Programma / Instellingen) | -26% /
-35% | -4% /
3% | -11% /
-11% | -5% /
-6% | 11% /
6% |
* ... kleiner is beter
Screen Flickering / PWM (Pulse-Width Modulation)
| Screen flickering / PWM waargenomen | 1064 Hz | ≤ 90 % helderheid instelling | 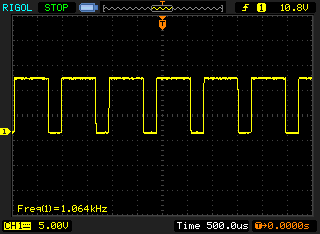 |
De achtergrondverlichting van het scherm flikkert op 1064 Hz (in het slechtste geval, bijvoorbeeld bij gebruik van PWM) aan een helderheid van 90 % en lager. Boven deze helderheid zou er geen flickering / PWM mogen optreden. De frequentie van 1064 Hz is redelijk hoog en de meeste mensen die gevoelig zijn aan flickering zouden dit dus niet mogen waarnemen of geïrriteerde ogen krijgen. Ter vergelijking: 52 % van alle geteste toestellen maakten geen gebruik van PWM om de schermhelderheid te verlagen. Als het wel werd gebruikt, werd een gemiddelde van 7754 (minimum: 5 - maximum: 343500) Hz waargenomen. | |||
Responstijd Scherm
| ↔ Responstijd Zwart naar Wit | ||
|---|---|---|
| 34.4 ms ... stijging ↗ en daling ↘ gecombineerd | ↗ 17.2 ms stijging | 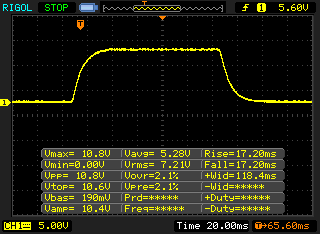 |
| ↘ 17.2 ms daling | ||
| Het scherm vertoonde trage responstijden in onze tests en is misschien te traag voor games. Ter vergelijking: alle testtoestellen variëren van 0.1 (minimum) tot 240 (maximum) ms. » 92 % van alle toestellen zijn beter. Dit betekent dat de gemeten responstijd slechter is dan het gemiddelde (19.8 ms) van alle geteste toestellen. | ||
| ↔ Responstijd 50% Grijs naar 80% Grijs | ||
| 48 ms ... stijging ↗ en daling ↘ gecombineerd | ↗ 24.4 ms stijging | 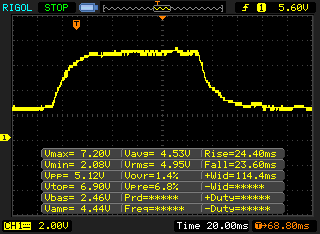 |
| ↘ 23.6 ms daling | ||
| Het scherm vertoonde trage responstijden in onze tests en is misschien te traag voor games. Ter vergelijking: alle testtoestellen variëren van 0.165 (minimum) tot 636 (maximum) ms. » 82 % van alle toestellen zijn beter. Dit betekent dat de gemeten responstijd slechter is dan het gemiddelde (31 ms) van alle geteste toestellen. | ||
| PCMark 8 | |
| Home Score Accelerated v2 | |
| Dell Precision 3510 | |
| Lenovo ThinkPad P50 | |
| Dell Precision 3520 | |
| HP ZBook 15 G3 | |
| Dell Precision 5520 UHD | |
| Work Score Accelerated v2 | |
| Dell Precision 3510 | |
| HP ZBook 15 G3 | |
| Dell Precision 3520 | |
| Lenovo ThinkPad P50 | |
| Dell Precision 5520 UHD | |
| PCMark 8 Home Score Accelerated v2 | 4183 punten | |
| PCMark 8 Work Score Accelerated v2 | 5194 punten | |
Help | ||
| Dell Precision 3520 Toshiba XG4 NVMe (THNSN5512GPUK) | Dell Precision 5520 UHD Samsung SM961 MZVKW512HMJP m.2 PCI-e | HP ZBook 15 G3 Samsung SM951 MZVPV512HDGL m.2 PCI-e | Lenovo ThinkPad T570-20HAS01E00 Samsung PM961 NVMe MZVLW512HMJP | Lenovo ThinkPad P51 20HH0016GE Samsung PM961 NVMe MZVLW512HMJP | |
|---|---|---|---|---|---|
| CrystalDiskMark 3.0 | 87% | 86% | 43% | 79% | |
| Read Seq (MB/s) | 1096 | 2253 106% | 1502 37% | 1210 10% | 1705 56% |
| Write Seq (MB/s) | 476.3 | 1662 249% | 1538 223% | 1134 138% | 1541 224% |
| Read 512 (MB/s) | 829 | 459.1 -45% | 1164 40% | 789 -5% | 1038 25% |
| Write 512 (MB/s) | 456.1 | 1611 253% | 1432 214% | 903 98% | 1157 154% |
| Read 4k (MB/s) | 35.2 | 56.1 59% | 59.1 68% | 58.4 66% | 61.3 74% |
| Write 4k (MB/s) | 128 | 169.4 32% | 207.3 62% | 144.1 13% | 176 38% |
| Read 4k QD32 (MB/s) | 552 | 633 15% | 798 45% | 559 1% | 664 20% |
| Write 4k QD32 (MB/s) | 396.1 | 506 28% | 393.8 -1% | 474.4 20% | 560 41% |

| LuxMark v2.0 64Bit | |
| Room GPUs-only | |
| Dell Precision 5520 UHD | |
| HP ZBook 15 G3 | |
| Dell Precision 3520 | |
| Lenovo ThinkPad P50 | |
| Lenovo ThinkPad P70-20ER000BMS | |
| Dell Precision 3510 | |
| Sala GPUs-only | |
| Dell Precision 5520 UHD | |
| HP ZBook 15 G3 | |
| Dell Precision 3520 | |
| Lenovo ThinkPad P50 | |
| Lenovo ThinkPad P70-20ER000BMS | |
| Dell Precision 3510 | |
| SiSoft Sandra 2016 | |
| Image Processing | |
| HP ZBook 15 G3 | |
| Lenovo ThinkPad P50 | |
| Dell Precision 3520 | |
| GP Cryptography (Higher Security AES256+SHA2-512) | |
| Lenovo ThinkPad P50 | |
| HP ZBook 15 G3 | |
| Dell Precision 3520 | |
| GP Financial Analysis (FP High/Double Precision) | |
| HP ZBook 15 G3 | |
| Lenovo ThinkPad P50 | |
| Dell Precision 3520 | |
| SPECviewperf 11 | |
| 1920x1080 Siemens NX | |
| Lenovo ThinkPad P50 | |
| HP ZBook 15 G3 | |
| Dell Precision 3520 | |
| Lenovo ThinkPad P70-20ER000BMS | |
| Dell Precision 3510 | |
| 1920x1080 Tcvis | |
| HP ZBook 15 G3 | |
| Lenovo ThinkPad P50 | |
| Dell Precision 3520 | |
| Lenovo ThinkPad P70-20ER000BMS | |
| Dell Precision 3510 | |
| 1920x1080 SolidWorks | |
| Dell Precision 3520 | |
| HP ZBook 15 G3 | |
| Lenovo ThinkPad P70-20ER000BMS | |
| Lenovo ThinkPad P50 | |
| Dell Precision 3510 | |
| 1920x1080 Pro/ENGINEER | |
| HP ZBook 15 G3 | |
| Dell Precision 3520 | |
| Lenovo ThinkPad P50 | |
| Lenovo ThinkPad P70-20ER000BMS | |
| Dell Precision 3510 | |
| 1920x1080 Maya | |
| HP ZBook 15 G3 | |
| Lenovo ThinkPad P50 | |
| Dell Precision 3520 | |
| Lenovo ThinkPad P70-20ER000BMS | |
| Dell Precision 3510 | |
| 1920x1080 Lightwave | |
| Dell Precision 3520 | |
| Lenovo ThinkPad P70-20ER000BMS | |
| HP ZBook 15 G3 | |
| Lenovo ThinkPad P50 | |
| Dell Precision 3510 | |
| 1920x1080 Ensight | |
| HP ZBook 15 G3 | |
| Lenovo ThinkPad P50 | |
| Dell Precision 3520 | |
| Lenovo ThinkPad P70-20ER000BMS | |
| Dell Precision 3510 | |
| 1920x1080 Catia | |
| Lenovo ThinkPad P50 | |
| HP ZBook 15 G3 | |
| Dell Precision 3520 | |
| Lenovo ThinkPad P70-20ER000BMS | |
| Dell Precision 3510 | |
| Unigine Heaven 2.1 - 1280x1024 high, Tesselation (normal), DirectX11 AA:off AF:1x | |
| Lenovo ThinkPad P50 | |
| HP ZBook 15 G3 | |
| Dell Precision 3520 | |
| Dell Precision 3510 | |
| Unigine Valley 1.0 | |
| 1920x1080 Extreme HD DirectX AA:x8 | |
| Lenovo ThinkPad P50 | |
| HP ZBook 15 G3 | |
| Dell Precision 3520 | |
| 1920x1080 Extreme HD Preset OpenGL AA:x8 | |
| HP ZBook 15 G3 | |
| Dell Precision 3520 | |
| Lenovo ThinkPad P50 | |
| 3DMark 11 - 1280x720 Performance GPU | |
| Lenovo ThinkPad P50 | |
| Dell Precision 5520 UHD | |
| HP ZBook 15 G3 | |
| Dell Precision 3520 | |
| Lenovo ThinkPad P70-20ER000BMS | |
| 3DMark | |
| 1280x720 Cloud Gate Standard Graphics | |
| Lenovo ThinkPad P50 | |
| HP ZBook 15 G3 | |
| Dell Precision 5520 UHD | |
| Dell Precision 3520 | |
| Lenovo ThinkPad P70-20ER000BMS | |
| Dell Precision 3510 | |
| 1920x1080 Fire Strike Graphics | |
| Dell Precision 5520 UHD | |
| Lenovo ThinkPad P50 | |
| HP ZBook 15 G3 | |
| Dell Precision 3520 | |
| Lenovo ThinkPad P70-20ER000BMS | |
| Dell Precision 3510 | |
| 1280x720 Ice Storm Standard Graphics | |
| Dell Precision 3520 | |
| HP ZBook 15 G3 | |
| Lenovo ThinkPad P50 | |
| Lenovo ThinkPad P70-20ER000BMS | |
| Dell Precision 5520 UHD | |
| Unigine Heaven 4.0 | |
| Extreme Preset OpenGL | |
| Lenovo ThinkPad P70-20ER000BMS | |
| Dell Precision 3520 | |
| Extreme Preset DX11 | |
| Lenovo ThinkPad P70-20ER000BMS | |
| Dell Precision 3520 | |
| 3DMark 06 Standard Score | 24751 punten | |
| 3DMark Vantage P Result | 17237 punten | |
| 3DMark 11 Performance | 4200 punten | |
| 3DMark Ice Storm Standard Score | 103599 punten | |
| 3DMark Cloud Gate Standard Score | 15759 punten | |
| 3DMark Fire Strike Score | 3059 punten | |
Help | ||
| BioShock Infinite - 1366x768 High Preset | |
| Dell Precision 5520 UHD | |
| HP ZBook 15 G3 | |
| Lenovo ThinkPad P50 | |
| Dell Precision 3520 | |
| Lenovo ThinkPad P70-20ER000BMS | |
| Lenovo ThinkPad T570-20HAS01E00 | |
| Rise of the Tomb Raider - 1920x1080 High Preset AA:FX AF:4x | |
| HP ZBook 15 G3 | |
| Dell Precision 3520 | |
| Lenovo ThinkPad P70-20ER000BMS | |
| Star Wars Battlefront - 1920x1080 Ultra Preset AA:FX | |
| Lenovo ThinkPad P50 | |
| Dell Precision 3520 | |
| Lenovo ThinkPad P70-20ER000BMS | |
| lage | gem. | hoge | ultra | |
|---|---|---|---|---|
| BioShock Infinite (2013) | 176.4 | 105.6 | 92.3 | 35.6 |
| GRID 2 (2013) | 192.8 | 147.4 | 126 | 39.1 |
| Company of Heroes 2 (2013) | 51.7 | 44.4 | 27.1 | 11.7 |
| Total War: Rome II (2013) | 190.5 | 139.6 | 114.4 | 17.8 |
| Dirt Rally (2015) | 249 | 118.5 | 62 | 28.2 |
| The Witcher 3 (2015) | 53.9 | 32.83 | 18.62 | 10 |
| Star Wars Battlefront (2015) | 110.6 | 64.3 | 28.92 | 24.37 |
| Rise of the Tomb Raider (2016) | 62.2 | 36.6 | 20.4 | |
| Doom (2016) | 60.4 | 46.3 | 25.2 | 19.5 |
| Warhammer 40.000: Dawn of War III (2017) | 70.3 | 18.7 |
Geluidsniveau
| Onbelast |
| 29.6 / 29.6 / 31.2 dB (A) |
| Belasting |
| 43 / 46.9 dB (A) |
 | ||
30 dB stil 40 dB(A) hoorbaar 50 dB(A) luid |
||
min: | ||
(-) De maximumtemperatuur aan de bovenzijde bedraagt 45.8 °C / 114 F, vergeleken met het gemiddelde van 38.2 °C / 101 F, variërend van 22.2 tot 69.8 °C voor de klasse Workstation.
(-) De bodem warmt op tot een maximum van 57.1 °C / 135 F, vergeleken met een gemiddelde van 41.1 °C / 106 F
(+) Bij onbelast gebruik bedraagt de gemiddelde temperatuur voor de bovenzijde 23.7 °C / 75 F, vergeleken met het apparaatgemiddelde van 32 °C / 90 F.
(±) Bij het spelen van The Witcher 3 is de gemiddelde temperatuur voor de bovenzijde 32 °C / 90 F, vergeleken met het apparaatgemiddelde van 32 °C / 90 F.
(+) De handpalmsteunen en het touchpad bereiken maximaal de huidtemperatuur (34.1 °C / 93.4 F) en zijn dus niet heet.
(-) De gemiddelde temperatuur van de handpalmsteun van soortgelijke toestellen bedroeg 27.8 °C / 82 F (-6.3 °C / -11.4 F).
Dell Precision 3520 audioanalyse
(+) | luidsprekers kunnen relatief luid spelen (85.6 dB)
Bas 100 - 315 Hz
(-) | bijna geen lage tonen - gemiddeld 16.2% lager dan de mediaan
(±) | lineariteit van de lage tonen is gemiddeld (7% delta ten opzichte van de vorige frequentie)
Midden 400 - 2000 Hz
(±) | hogere middens - gemiddeld 5.2% hoger dan de mediaan
(+) | de middentonen zijn lineair (3.9% delta ten opzichte van de vorige frequentie)
Hoog 2 - 16 kHz
(+) | evenwichtige hoogtepunten - slechts 3.7% verwijderd van de mediaan
(+) | de hoge tonen zijn lineair (3.5% delta naar de vorige frequentie)
Algemeen 100 - 16.000 Hz
(±) | lineariteit van het totale geluid is gemiddeld (15.2% verschil met de mediaan)
Vergeleken met dezelfde klasse
» 33% van alle geteste apparaten in deze klasse waren beter, 10% vergelijkbaar, 57% slechter
» De beste had een delta van 7%, het gemiddelde was 17%, de slechtste was 35%
Vergeleken met alle geteste toestellen
» 22% van alle geteste apparaten waren beter, 4% gelijk, 74% slechter
» De beste had een delta van 4%, het gemiddelde was 23%, de slechtste was 134%
Apple MacBook 12 (Early 2016) 1.1 GHz audioanalyse
(+) | luidsprekers kunnen relatief luid spelen (83.6 dB)
Bas 100 - 315 Hz
(±) | verminderde zeebaars - gemiddeld 11.3% lager dan de mediaan
(±) | lineariteit van de lage tonen is gemiddeld (14.2% delta ten opzichte van de vorige frequentie)
Midden 400 - 2000 Hz
(+) | evenwichtige middens - slechts 2.4% verwijderd van de mediaan
(+) | de middentonen zijn lineair (5.5% delta ten opzichte van de vorige frequentie)
Hoog 2 - 16 kHz
(+) | evenwichtige hoogtepunten - slechts 2% verwijderd van de mediaan
(+) | de hoge tonen zijn lineair (4.5% delta naar de vorige frequentie)
Algemeen 100 - 16.000 Hz
(+) | het totale geluid is lineair (10.2% verschil met de mediaan)
Vergeleken met dezelfde klasse
» 7% van alle geteste apparaten in deze klasse waren beter, 2% vergelijkbaar, 90% slechter
» De beste had een delta van 5%, het gemiddelde was 18%, de slechtste was 53%
Vergeleken met alle geteste toestellen
» 5% van alle geteste apparaten waren beter, 1% gelijk, 94% slechter
» De beste had een delta van 4%, het gemiddelde was 23%, de slechtste was 134%
| Uit / Standby | |
| Inactief | |
| Belasting |
|
Key:
min: | |
| Dell Precision 3520 i7-7820HQ, Quadro M620, Toshiba XG4 NVMe (THNSN5512GPUK), IPS LED, 1920x1080, 15.6" | Dell Precision 3510 6700HQ, FirePro W5130M, Samsung SM951 MZVPV256HDGL m.2 PCI-e, TN LED, 1366x768, 15.6" | Dell Precision 5520 UHD E3-1505M v6, Quadro M1200, Samsung SM961 MZVKW512HMJP m.2 PCI-e, IPS, 3840x2160, 15.6" | Lenovo ThinkPad P50 6820HQ, Quadro M2000M, Samsung SSD PM871 MZNLN256HCHP, IPS, 1920x1080, 15.6" | HP ZBook 15 G3 E3-1505M v5, Quadro M2000M, Samsung SM951 MZVPV512HDGL m.2 PCI-e, UWVA-IPS, 1920x1080, 15.6" | |
|---|---|---|---|---|---|
| Power Consumption | 28% | -32% | 10% | -6% | |
| Idle Minimum * (Watt) | 5.8 | 4.2 28% | 8.9 -53% | 5.6 3% | 5.7 2% |
| Idle Average * (Watt) | 10.7 | 6.5 39% | 13.6 -27% | 8.6 20% | 12.2 -14% |
| Idle Maximum * (Watt) | 13.3 | 7.1 47% | 14.1 -6% | 9.3 30% | 12.6 5% |
| Load Average * (Watt) | 78.2 | 74.6 5% | 100.3 -28% | 89.5 -14% | 83.1 -6% |
| Witcher 3 ultra * (Watt) | 58.8 | 100.2 -70% | |||
| Load Maximum * (Watt) | 116 | 92.2 21% | 126.3 -9% | 105 9% | 138.2 -19% |
* ... kleiner is beter
| Dell Precision 3520 i7-7820HQ, Quadro M620, 68 Wh | Dell Precision 3510 6700HQ, FirePro W5130M, 84 Wh | Dell Precision 5520 UHD E3-1505M v6, Quadro M1200, 97 Wh | HP ZBook 15 G3 E3-1505M v5, Quadro M2000M, 90 Wh | Lenovo ThinkPad T570-20HAS01E00 i7-7500U, GeForce 940MX, 56 Wh | Lenovo ThinkPad P50 6820HQ, Quadro M2000M, 90 Wh | |
|---|---|---|---|---|---|---|
| Batterijduur | 30% | -32% | -1% | 24% | 13% | |
| Reader / Idle (h) | 16.6 | 19.5 17% | 12.1 -27% | 13.7 -17% | 13.3 -20% | 14.3 -14% |
| H.264 (h) | 8.1 | 10.1 25% | 7.5 -7% | 8.1 0% | 8.9 10% | |
| WiFi v1.3 (h) | 7.6 | 9.9 30% | 4.2 -45% | 6.4 -16% | 6.9 -9% | 8.3 9% |
| Load (h) | 1.3 | 1.9 46% | 1 -23% | 1.8 38% | 2.9 123% | 1.9 46% |
Pro
Contra
Voor het volledige, Engelse testrapport, klik hier.
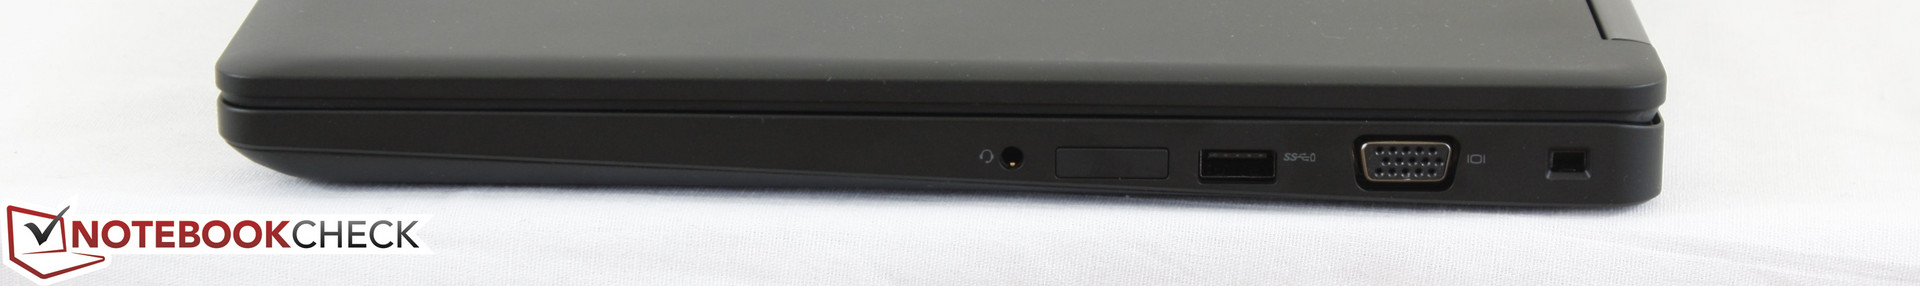
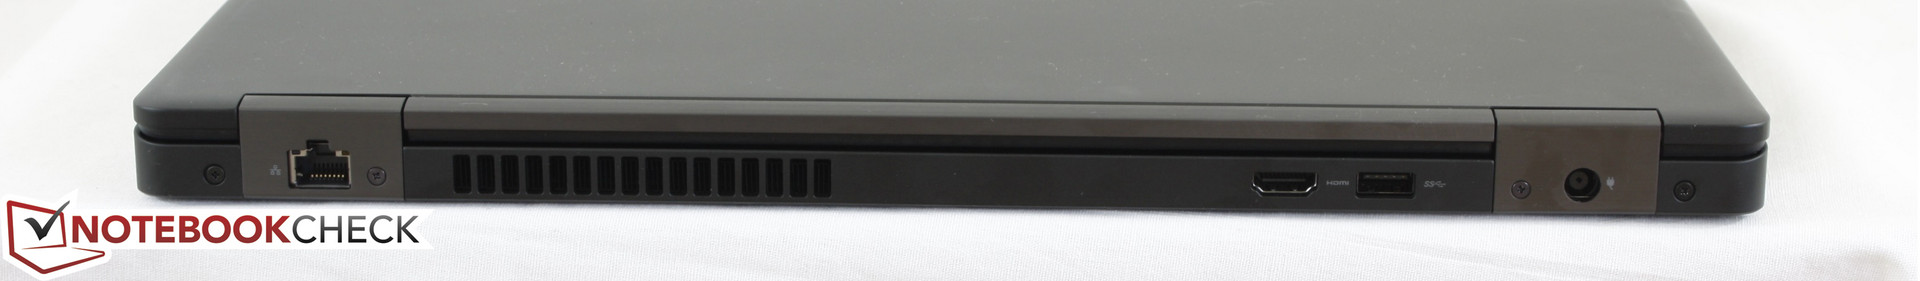
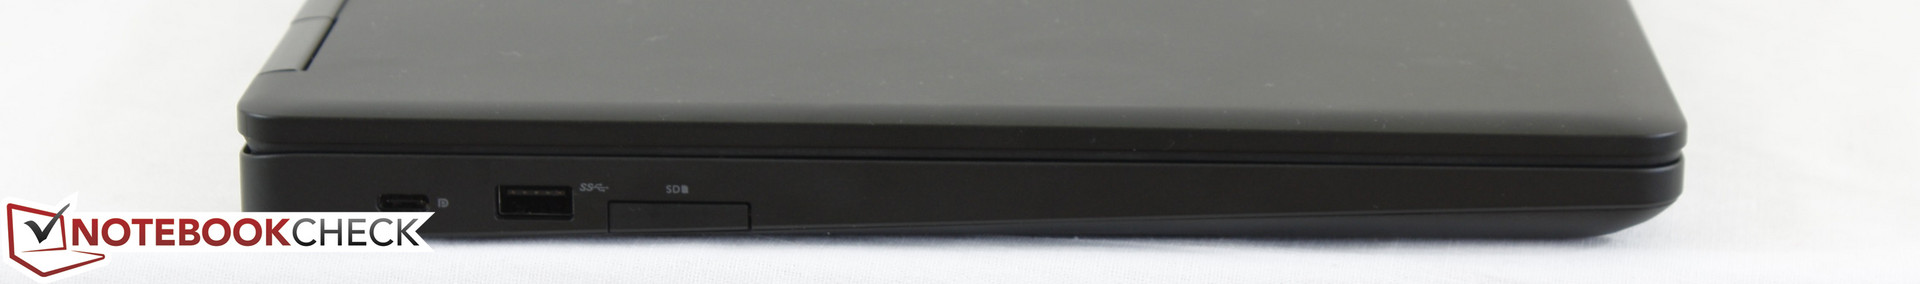
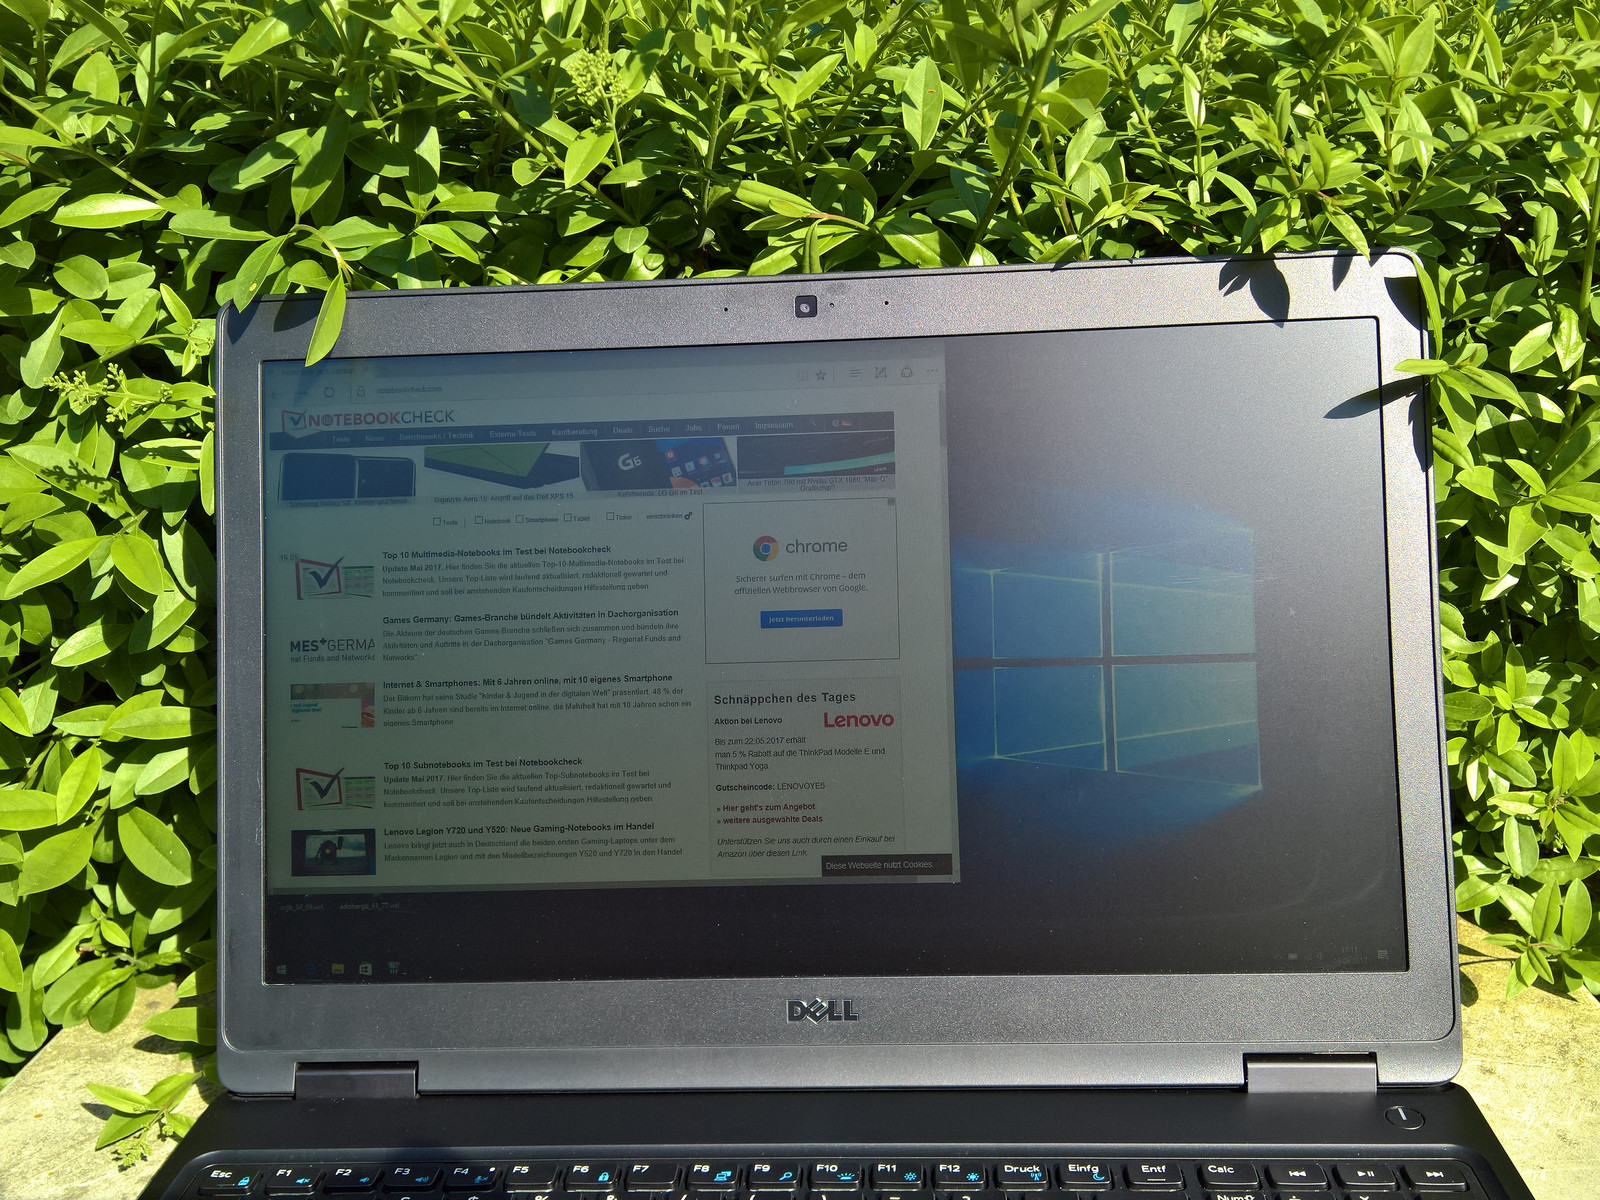
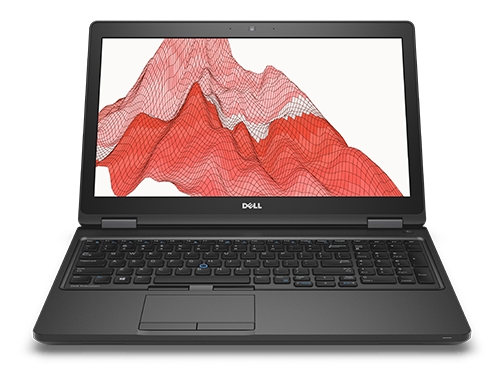
De Precision 3520 heeft zeker sterke kanten. Ten eerste is er het heldere, levendige beeldscherm. Daarnaast is de batterijlevensduur goed voor een werkstation. De grotere 92 Wh batterij zal het nog langer volhouden. Het aanbod van aansluitingen is ook voldoende. De behuizing en invoerapparaten zijn goed genoeg voor een werkstation, maar ook niet perfect.
Helaas stelt de Precision teleur op het belangrijkste vlak voor werkstations: prestaties en geluidsproductie. De beperking tot een 35 Watt TDP processor is al ongebruikelijk - een sterker koelsysteem voor een krachtigere CPU was waarschijnlijk te duur voor Dell. We vragen ons af of kiezen voor een standaard langzamere CPU wellicht een betere keuze was geweest. Onze tests tonen namelijk aan dat de CPU prestaties nogal fluctueren, hoewel dit met firmware updates verbeterd kan worden. Dit geldt helaas ook voor de ventilator, die regelmatig draait wanneer er weinig belasting is. Na de benchmarks duurde het een lange tijd voordat het apparaat weer stil was. Tenslotte produceert de 3520 een vervelend zoemend geluid.
De Precision 3520 is een degelijk werkstation - maar zou een aantal verbeteringen goed kunnen gebruiken.
Alles bij elkaar kunnen we concluderen dat de Precision 3520 zeker potentie heeft. De notebook is behoorlijk krachtig en biedt een relatief goede prijs/prestaties verhouding. Immers, werkstations zitten meestal in hoge prijsklassen. Dell moet het apparaat heroverwegen en zich buigen over de ventilator en prestaties. Zodra deze inhaalslag is gemaakt kan de 3520 zeker een aanbeveling krijgen van ons.
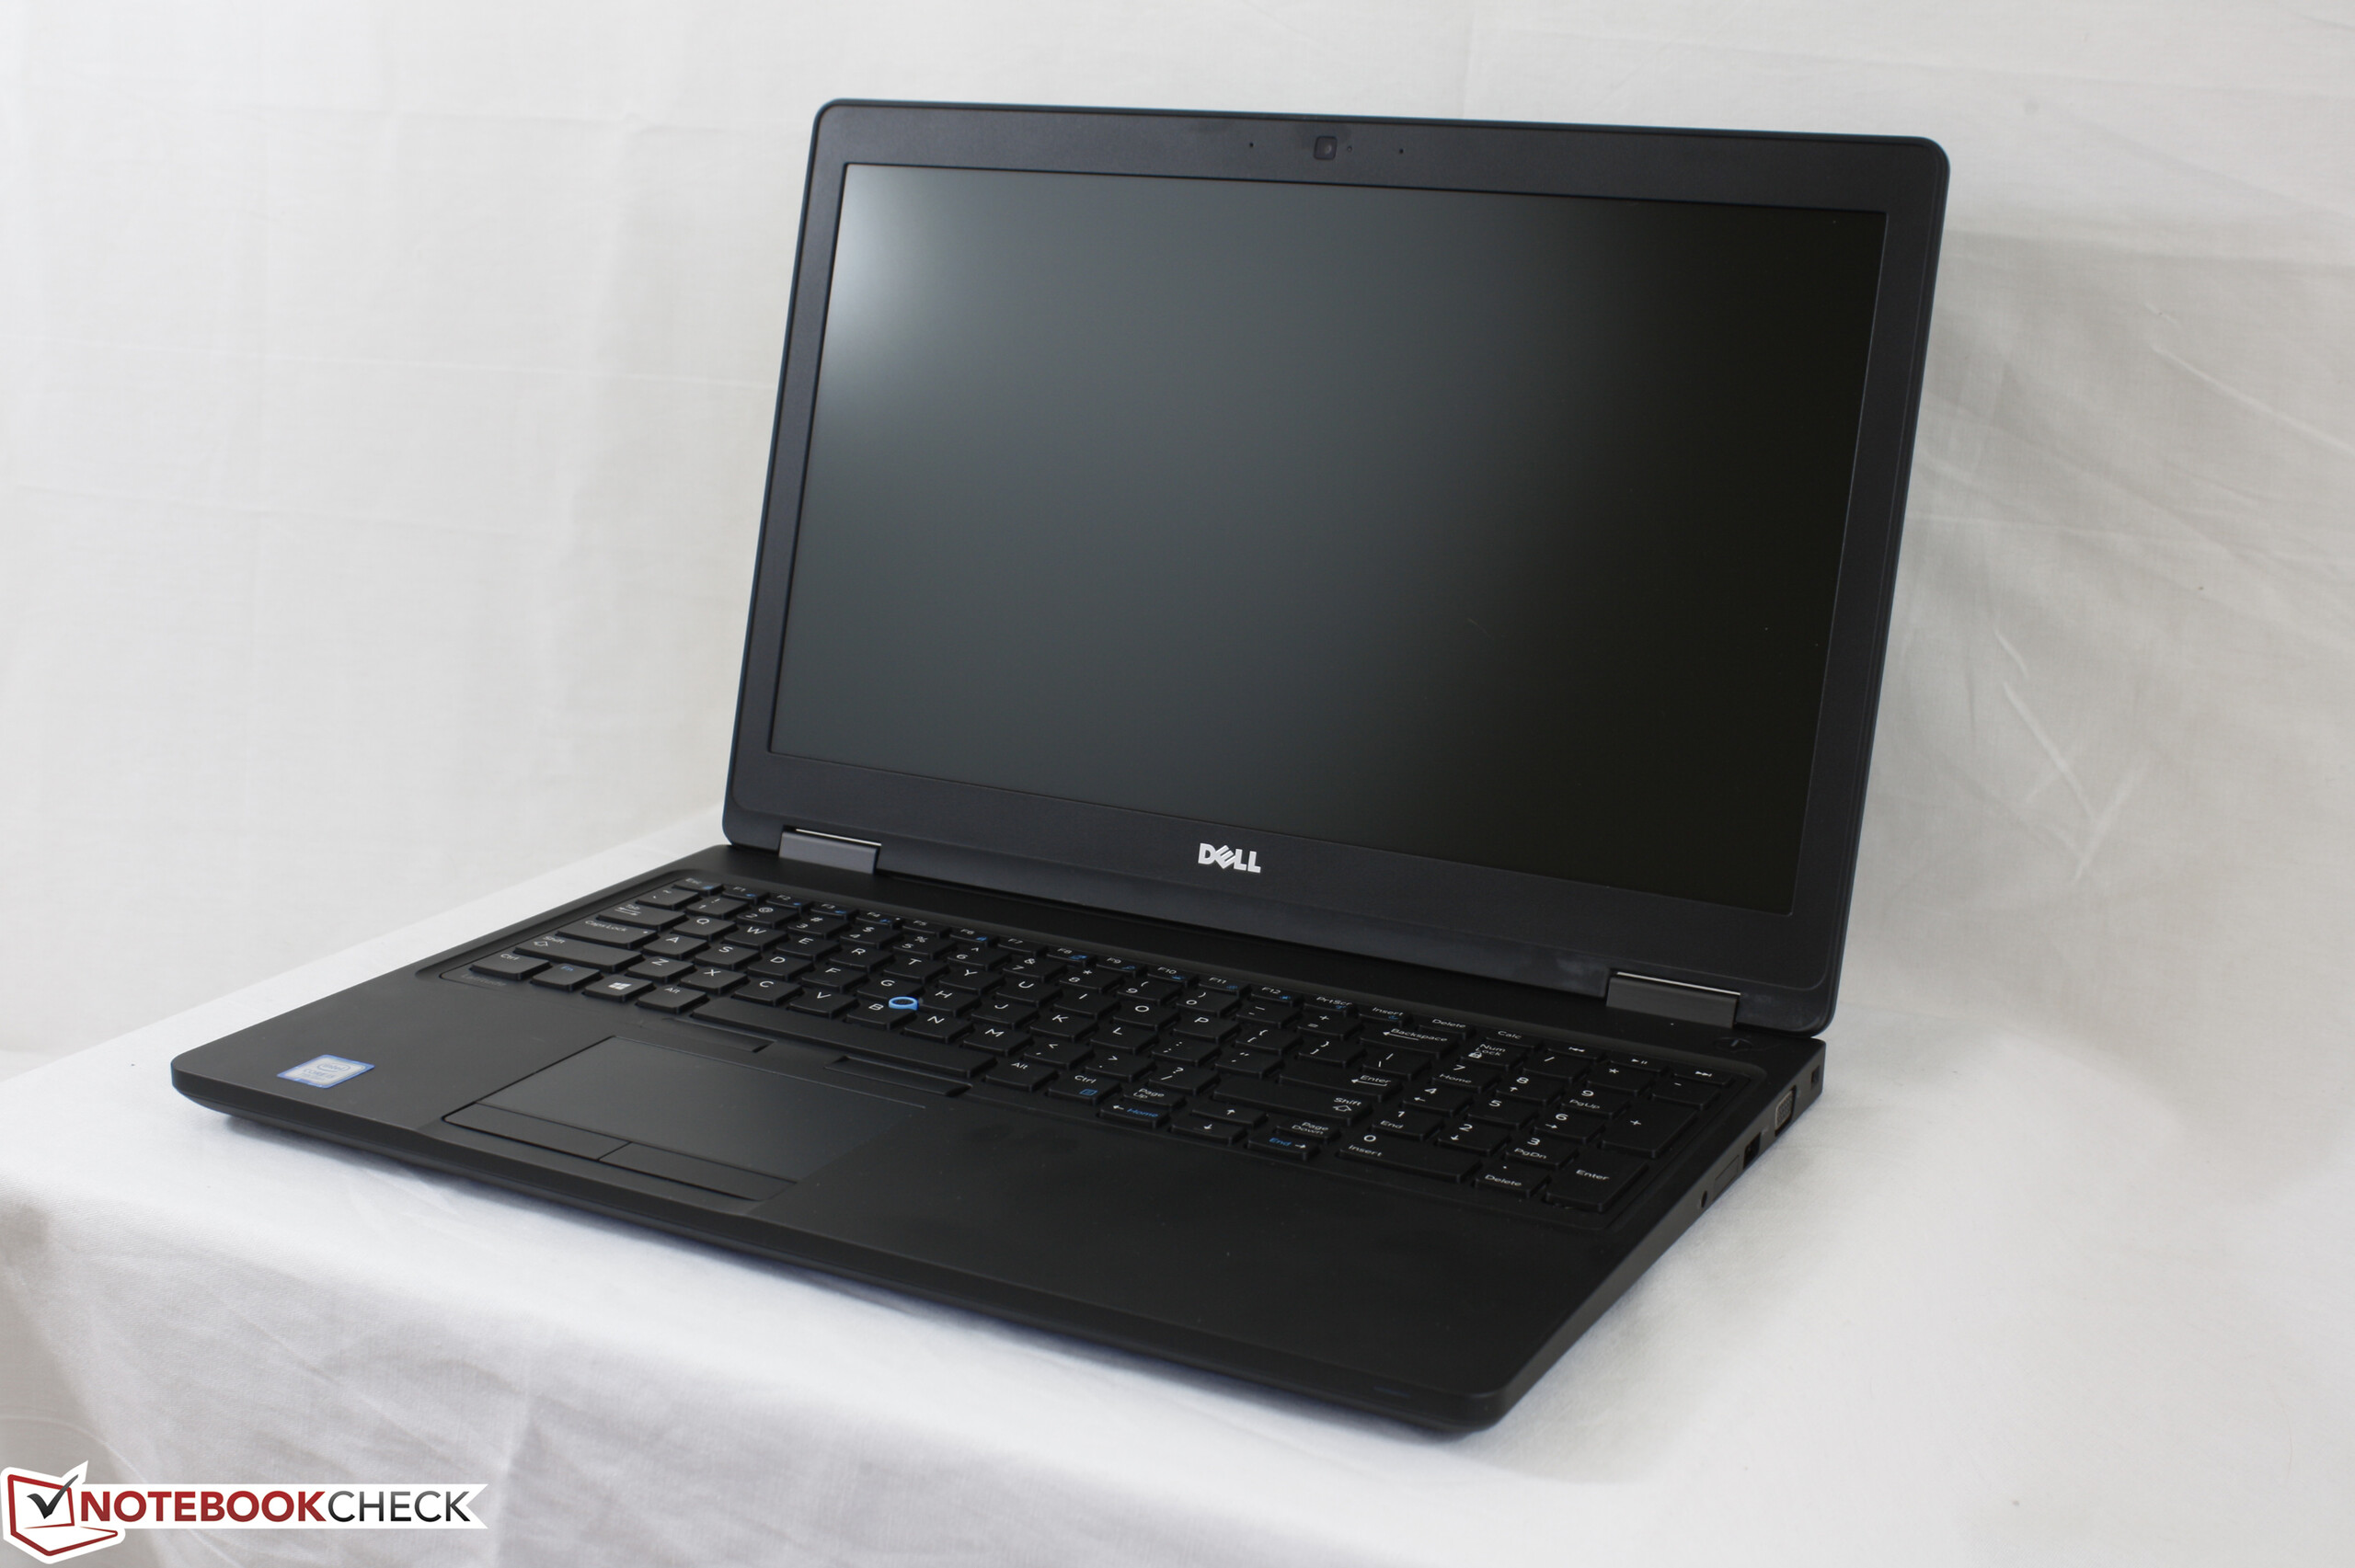
Dell Precision 3520
- 25-05-2017 v6 (old)
Benjamin Herzig
Price comparison
