Kort testrapport Dell Precision 3510 Workstation
| SD Card Reader | |
| average JPG Copy Test (av. of 3 runs) | |
| Dell Precision 3510 | |
| HP ZBook 15 G3 | |
| Lenovo ThinkPad P50 | |
| maximum AS SSD Seq Read Test (1GB) | |
| HP ZBook 15 G3 | |
| Dell Precision 3510 | |
| Lenovo ThinkPad P50 | |
| Networking | |
| Wi-Fi Client 1m | |
| Wi-Fi Server 1m |
| |||||||||||||||||||||||||
Helderheidsverdeling: 83 %
Helderheid in Batterij-modus: 199 cd/m²
Contrast: 498:1 (Zwart: 0.4 cd/m²)
ΔE ColorChecker Calman: 9 | ∀{0.5-29.43 Ø4.71}
ΔE Greyscale Calman: 9.6 | ∀{0.09-98 Ø4.96}
73.7% sRGB (Calman 2D)
62.4% sRGB (Argyll 1.6.3 3D)
39.6% AdobeRGB 1998 (Argyll 1.6.3 3D)
42.86% AdobeRGB 1998 (Argyll 3D)
62.4% sRGB (Argyll 3D)
41.48% Display P3 (Argyll 3D)
Gamma: 2.41
CCT: 10695 K
| Dell Precision 3510 LGD04AF, K96D2_156WHU, , 1366x768, 15.6" | Dell Precision 3510 52452051.2 LG Display LGD049B / 156WF6, Dell P/N: F7HH2, , 1920x1080, 15.6" | Dell Precision 7510 (4K IGZO) Sharp LQ156D1, , 3840x2160, 15.6" | Dell Precision 5510 SHP143E, 7PHPT_LQ156D1, , 3840x2160, 15.6" | Lenovo ThinkPad P50 LQ156D1JW05, , 3840x2160, 15.6" | HP ZBook 15 G3 Samsung SDC5344, , 1920x1080, 15.6" | |
|---|---|---|---|---|---|---|
| Display | 54% | 100% | 102% | 98% | 58% | |
| Display P3 Coverage (%) | 41.48 | 68.9 66% | 86.2 108% | 88.4 113% | 85.8 107% | 66.8 61% |
| sRGB Coverage (%) | 62.4 | 88.9 42% | 99.7 60% | 100 60% | 98.6 58% | 95.5 53% |
| AdobeRGB 1998 Coverage (%) | 42.86 | 65.4 53% | 99 131% | 99.5 132% | 98.2 129% | 69 61% |
| Response Times | 15% | -11% | 26% | -12% | ||
| Response Time Grey 50% / Grey 80% * (ms) | 56 ? | 40.4 ? 28% | 56.4 ? -1% | 39.2 ? 30% | 54 ? 4% | |
| Response Time Black / White * (ms) | 28 ? | 27.6 ? 1% | 34 ? -21% | 22 ? 21% | 35.6 ? -27% | |
| PWM Frequency (Hz) | 198.4 ? | 217 | 198 ? | |||
| Screen | 47% | 57% | 65% | 42% | 40% | |
| Brightness middle (cd/m²) | 199 | 364.6 83% | 279.2 40% | 391 96% | 250 26% | 306 54% |
| Brightness (cd/m²) | 201 | 335 67% | 271 35% | 361 80% | 250 24% | 289 44% |
| Brightness Distribution (%) | 83 | 83 0% | 83 0% | 87 5% | 86 4% | 85 2% |
| Black Level * (cd/m²) | 0.4 | 0.4 -0% | 0.266 33% | 0.4 -0% | 0.31 23% | 0.34 15% |
| Contrast (:1) | 498 | 912 83% | 1050 111% | 978 96% | 806 62% | 900 81% |
| Colorchecker dE 2000 * | 9 | 4.14 54% | 4.85 46% | 4.5 50% | 5.1 43% | |
| Colorchecker dE 2000 max. * | 13.3 | 6.56 51% | 9.3 30% | 9.9 26% | ||
| Greyscale dE 2000 * | 9.6 | 3.26 66% | 4.01 58% | 7.2 25% | 7.4 23% | |
| Gamma | 2.41 91% | 2.19 100% | 2.18 101% | 2.31 95% | 2.37 93% | |
| CCT | 10695 61% | 6375 102% | 7340 89% | 6399 102% | 7263 89% | |
| Color Space (Percent of AdobeRGB 1998) (%) | 39.6 | 85.68 116% | 96 142% | 85 115% | 63 59% | |
| Color Space (Percent of sRGB) (%) | 62.4 | 99.72 60% | 100 60% | 98.6 58% | 95 52% | |
| Totaal Gemiddelde (Programma / Instellingen) | 51% /
49% | 57% /
60% | 52% /
62% | 55% /
51% | 29% /
37% |
* ... kleiner is beter
Responstijd Scherm
| ↔ Responstijd Zwart naar Wit | ||
|---|---|---|
| 28 ms ... stijging ↗ en daling ↘ gecombineerd | ↗ 11 ms stijging | |
| ↘ 17 ms daling | ||
| Het scherm vertoonde relatief trage responstijden in onze tests en is misschien te traag voor games. Ter vergelijking: alle testtoestellen variëren van 0.1 (minimum) tot 240 (maximum) ms. » 71 % van alle toestellen zijn beter. Dit betekent dat de gemeten responstijd slechter is dan het gemiddelde (19.8 ms) van alle geteste toestellen. | ||
| ↔ Responstijd 50% Grijs naar 80% Grijs | ||
| 56 ms ... stijging ↗ en daling ↘ gecombineerd | ↗ 27 ms stijging | |
| ↘ 29 ms daling | ||
| Het scherm vertoonde trage responstijden in onze tests en is misschien te traag voor games. Ter vergelijking: alle testtoestellen variëren van 0.165 (minimum) tot 636 (maximum) ms. » 93 % van alle toestellen zijn beter. Dit betekent dat de gemeten responstijd slechter is dan het gemiddelde (31 ms) van alle geteste toestellen. | ||
Screen Flickering / PWM (Pulse-Width Modulation)
| Screen flickering / PWM niet waargenomen | ||
Ter vergelijking: 52 % van alle geteste toestellen maakten geen gebruik van PWM om de schermhelderheid te verlagen. Als het wel werd gebruikt, werd een gemiddelde van 7754 (minimum: 5 - maximum: 343500) Hz waargenomen. | ||
| PCMark 8 | |
| Home Score Accelerated v2 | |
| Dell Precision 3510 | |
| Lenovo ThinkPad P50 | |
| Dell Precision 7510 (4K IGZO) | |
| HP ZBook 15u G3 | |
| HP ZBook 15 G3 | |
| Dell Precision 5510 | |
| Work Score Accelerated v2 | |
| Dell Precision 3510 | |
| HP ZBook 15 G3 | |
| Dell Precision 5510 | |
| HP ZBook 15u G3 | |
| Lenovo ThinkPad P50 | |
| Dell Precision 7510 (4K IGZO) | |
| PCMark 8 Home Score Accelerated v2 | 4405 punten | |
| PCMark 8 Creative Score Accelerated v2 | 5244 punten | |
| PCMark 8 Work Score Accelerated v2 | 5258 punten | |
Help | ||
| Dell Precision 3510 Samsung SM951 MZVPV256HDGL m.2 PCI-e | Dell Precision 5510 SK hynix SC920 512 GB | Dell Precision 7510 (4K IGZO) Samsung SSD SM951a 512GB M.2 PCIe 3.0 x4 NVMe (MZVKV512) | Lenovo ThinkPad P50 Samsung SM951 MZVPV256HDGL m.2 PCI-e | HP ZBook 15u G3 Samsung SM951 MZVPV256HDGL m.2 PCI-e | HP ZBook 15 G3 Samsung SM951 MZVPV512HDGL m.2 PCI-e | |
|---|---|---|---|---|---|---|
| AS SSD | -58% | 18% | 16% | 13% | 13% | |
| Seq Write (MB/s) | 1093 | 389 -64% | 1484 36% | 1252 15% | 1106 1% | 1181 8% |
| Seq Read (MB/s) | 1897 | 474 -75% | 1953 3% | 1930 2% | 1859 -2% | 1841 -3% |
| 4K-64 Write (MB/s) | 294.1 | 257 -13% | 375.7 28% | 340.7 16% | 335.6 14% | 257 -13% |
| 4K-64 Read (MB/s) | 1114 | 327 -71% | 1067 -4% | 1077 -3% | 1781 60% | 1066 -4% |
| 4K Write (MB/s) | 121.7 | 82.2 -32% | 145.1 19% | 212.2 74% | 126.2 4% | 173.1 42% |
| 4K Read (MB/s) | 46.76 | 17.95 -62% | 49.22 5% | 54.2 16% | 48.7 4% | 52.5 12% |
| Access Time Read * (ms) | 0.059 | 0.111 -88% | 0.036 39% | 0.062 -5% | 0.053 10% | 0.031 47% |
* ... kleiner is beter

| SPECviewperf 11 | |
| 1920x1080 Siemens NX | |
| Lenovo ThinkPad P50 | |
| HP ZBook 15 G3 | |
| Dell Precision 5510 | |
| Dell Precision 3510 | |
| Asus GL552VW-DK725T | |
| 1920x1080 Tcvis | |
| HP ZBook 15 G3 | |
| Lenovo ThinkPad P50 | |
| Dell Precision 5510 | |
| Dell Precision 3510 | |
| Asus GL552VW-DK725T | |
| 1920x1080 SolidWorks | |
| Lenovo ThinkPad P50 | |
| Dell Precision 5510 | |
| HP ZBook 15 G3 | |
| Dell Precision 3510 | |
| Asus GL552VW-DK725T | |
| 1920x1080 Pro/ENGINEER | |
| HP ZBook 15 G3 | |
| Lenovo ThinkPad P50 | |
| Dell Precision 5510 | |
| Dell Precision 3510 | |
| Asus GL552VW-DK725T | |
| 1920x1080 Maya | |
| HP ZBook 15 G3 | |
| Lenovo ThinkPad P50 | |
| Dell Precision 5510 | |
| Dell Precision 3510 | |
| Asus GL552VW-DK725T | |
| 1920x1080 Lightwave | |
| Lenovo ThinkPad P50 | |
| Dell Precision 5510 | |
| HP ZBook 15 G3 | |
| Dell Precision 3510 | |
| Asus GL552VW-DK725T | |
| 1920x1080 Ensight | |
| HP ZBook 15 G3 | |
| Lenovo ThinkPad P50 | |
| Dell Precision 5510 | |
| Asus GL552VW-DK725T | |
| Dell Precision 3510 | |
| 1920x1080 Catia | |
| Lenovo ThinkPad P50 | |
| Dell Precision 5510 | |
| HP ZBook 15 G3 | |
| Asus GL552VW-DK725T | |
| Dell Precision 3510 | |
| 3DMark 11 - 1280x720 Performance GPU | |
| Lenovo ThinkPad P50 | |
| Dell Precision 7510 (4K IGZO) | |
| HP ZBook 15 G3 | |
| Dell Precision 5510 | |
| HP ZBook 15u G3 | |
| 3DMark | |
| 1280x720 Cloud Gate Standard Graphics | |
| HP ZBook 15 G3 | |
| Dell Precision 7510 (4K IGZO) | |
| Lenovo ThinkPad P50 | |
| Dell Precision 5510 | |
| Dell Precision 3510 | |
| HP ZBook 15u G3 | |
| 1920x1080 Fire Strike Graphics | |
| Dell Precision 7510 (4K IGZO) | |
| HP ZBook 15 G3 | |
| Lenovo ThinkPad P50 | |
| Dell Precision 5510 | |
| Dell Precision 3510 | |
| HP ZBook 15u G3 | |
| 3DMark 06 Standard Score | 15680 punten | |
| 3DMark Cloud Gate Standard Score | 11740 punten | |
| 3DMark Fire Strike Score | 2001 punten | |
Help | ||
| lage | gem. | hoge | ultra | |
|---|---|---|---|---|
| Tomb Raider (2013) | 158 | 75 | 58 | 25 |
| BioShock Infinite (2013) | 137 | 66 | 57 | 22 |
| Total War: Rome II (2013) | 106 | 80 | 66 | 23 |
| Middle-earth: Shadow of Mordor (2014) | 66 | 41 | 23 | 21 |
| Dirt Rally (2015) | 216 | 71 | 47 | 19 |
| The Witcher 3 (2015) | 31 | 21 | 10 |
Geluidsniveau
| Onbelast |
| 30 / 30 / 30 dB (A) |
| Belasting |
| 38.1 / 44.4 dB (A) |
 | ||
30 dB stil 40 dB(A) hoorbaar 50 dB(A) luid |
||
min: | ||
(-) De maximumtemperatuur aan de bovenzijde bedraagt 54.6 °C / 130 F, vergeleken met het gemiddelde van 38.2 °C / 101 F, variërend van 22.2 tot 69.8 °C voor de klasse Workstation.
(-) De bodem warmt op tot een maximum van 59.4 °C / 139 F, vergeleken met een gemiddelde van 41.1 °C / 106 F
(+) Bij onbelast gebruik bedraagt de gemiddelde temperatuur voor de bovenzijde 28 °C / 82 F, vergeleken met het apparaatgemiddelde van 32 °C / 90 F.
(+) De palmsteunen en het touchpad zijn met een maximum van ###max## °C / 88.7 F koeler dan de huidtemperatuur en voelen daarom koel aan.
(-) De gemiddelde temperatuur van de handpalmsteun van soortgelijke toestellen bedroeg 27.8 °C / 82 F (-3.7 °C / -6.7 F).
| Uit / Standby | |
| Inactief | |
| Belasting |
|
Key:
min: | |
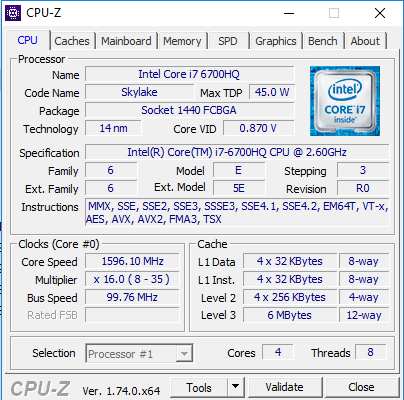
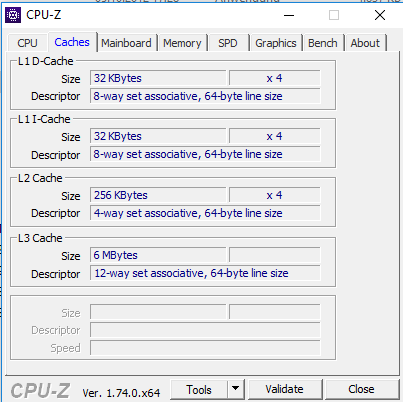
| Dell Precision 3510 6700HQ, FirePro W5130M, Samsung SM951 MZVPV256HDGL m.2 PCI-e, TN LED, 1366x768, 15.6" | Dell Precision 5510 E3-1505M v5, Quadro M1000M, SK hynix SC920 512 GB, IGZO LED, 3840x2160, 15.6" | Dell Precision 7510 (4K IGZO) E3-1535M v5, Quadro M2000M, Samsung SSD SM951a 512GB M.2 PCIe 3.0 x4 NVMe (MZVKV512), IGZO IPS, 3840x2160, 15.6" | Lenovo ThinkPad P50 E3-1505M v5, Quadro M2000M, Samsung SM951 MZVPV256HDGL m.2 PCI-e, IPS, 3840x2160, 15.6" | HP ZBook 15 G3 E3-1505M v5, Quadro M2000M, Samsung SM951 MZVPV512HDGL m.2 PCI-e, UWVA-IPS, 1920x1080, 15.6" | |
|---|---|---|---|---|---|
| Power Consumption | -89% | -247% | -102% | -52% | |
| Idle Minimum * (Watt) | 4.2 | 8.6 -105% | 23.9 -469% | 10.2 -143% | 5.7 -36% |
| Idle Average * (Watt) | 6.5 | 16.2 -149% | 28.9 -345% | 17.8 -174% | 12.2 -88% |
| Idle Maximum * (Watt) | 7.1 | 16.7 -135% | 30 -323% | 18.3 -158% | 12.6 -77% |
| Load Average * (Watt) | 74.6 | 82.6 -11% | 95.2 -28% | 76.9 -3% | 83.1 -11% |
| Load Maximum * (Watt) | 92.2 | 131.8 -43% | 157.1 -70% | 123.5 -34% | 138.2 -50% |
* ... kleiner is beter
| Dell Precision 3510 6700HQ, FirePro W5130M, 84 Wh | Dell Precision 5510 E3-1505M v5, Quadro M1000M, 56 Wh | Dell Precision 7510 (4K IGZO) E3-1535M v5, Quadro M2000M, 91 Wh | Lenovo ThinkPad P50 E3-1505M v5, Quadro M2000M, 90 Wh | HP ZBook 15 G3 E3-1505M v5, Quadro M2000M, 90 Wh | HP ZBook 15u G3 6600U, FirePro W4190M, 90 Wh | |
|---|---|---|---|---|---|---|
| Batterijduur | -47% | -58% | -42% | -24% | -19% | |
| Reader / Idle (h) | 19.5 | 7.1 -64% | 4.5 -77% | 9 -54% | 13.7 -30% | 12.6 -35% |
| H.264 (h) | 10.1 | 3.3 -67% | 5.5 -46% | 7.5 -26% | ||
| WiFi v1.3 (h) | 9.9 | 4.8 -52% | 4 -60% | 4.8 -52% | 6.4 -35% | 5.2 -47% |
| Load (h) | 1.9 | 1.8 -5% | 1.2 -37% | 1.6 -16% | 1.8 -5% | 2.4 26% |
| WiFi (h) | 5 |
Pro
Contra
Dit is de verkorte versie van het originele artikel. Het volledige, Engelse testrapport vind je hier.
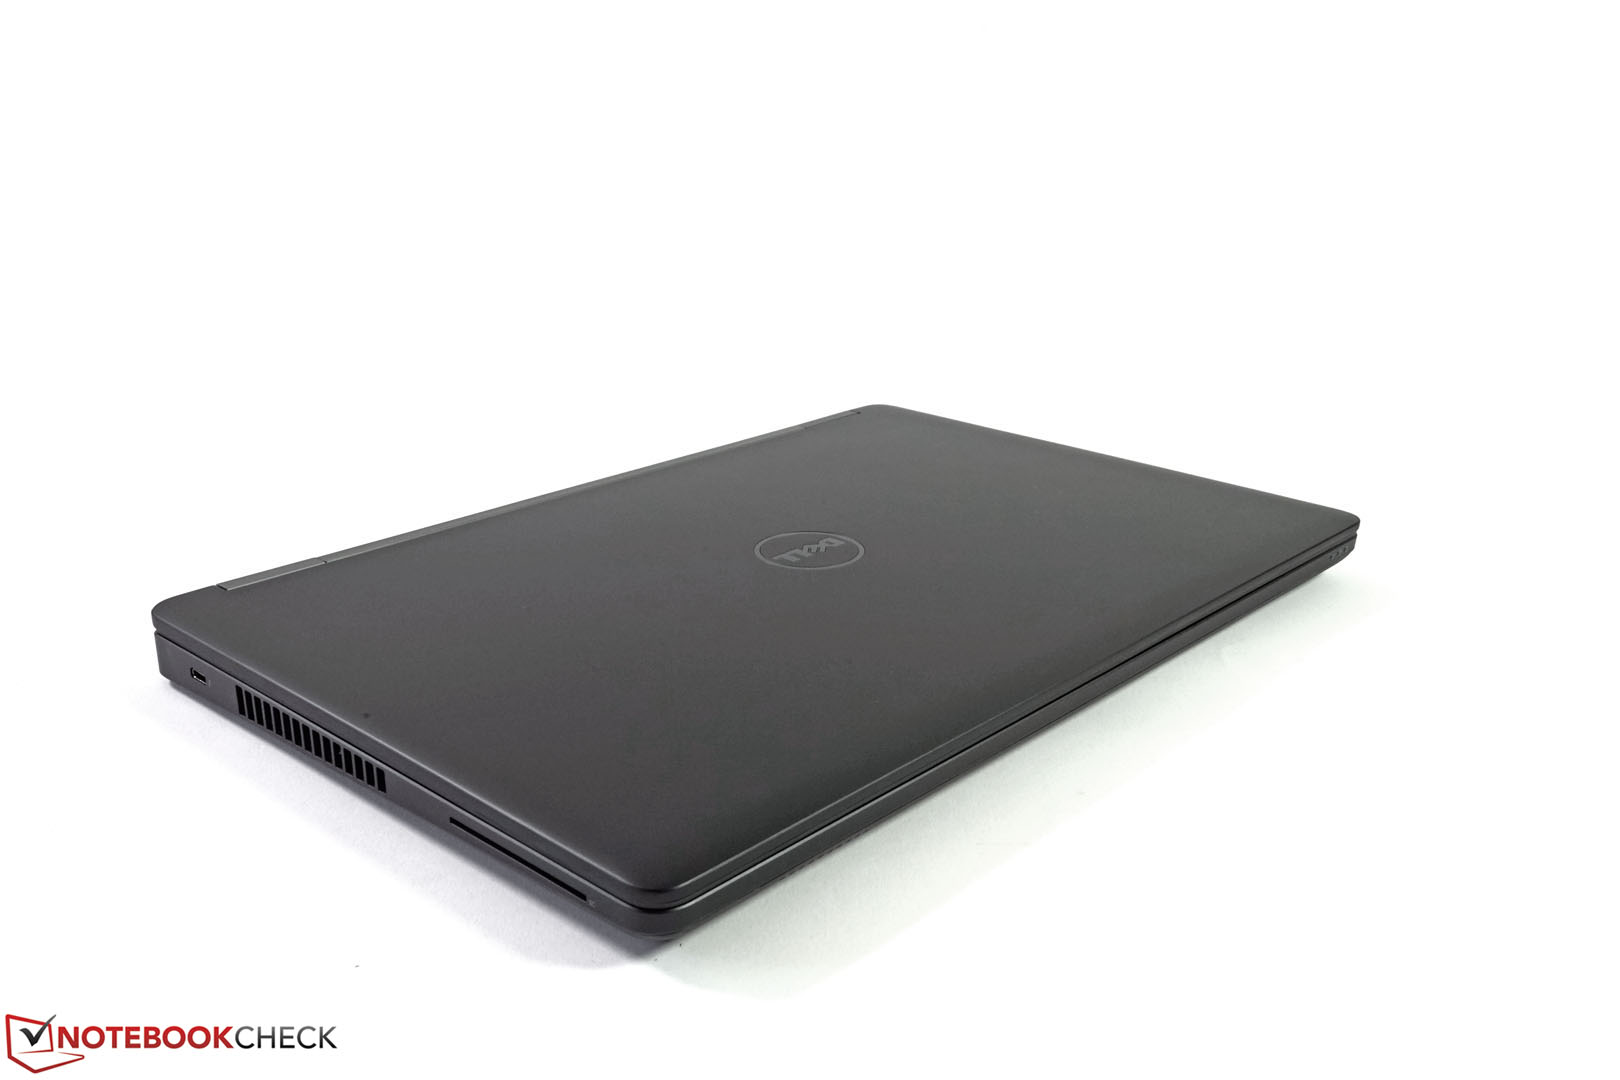
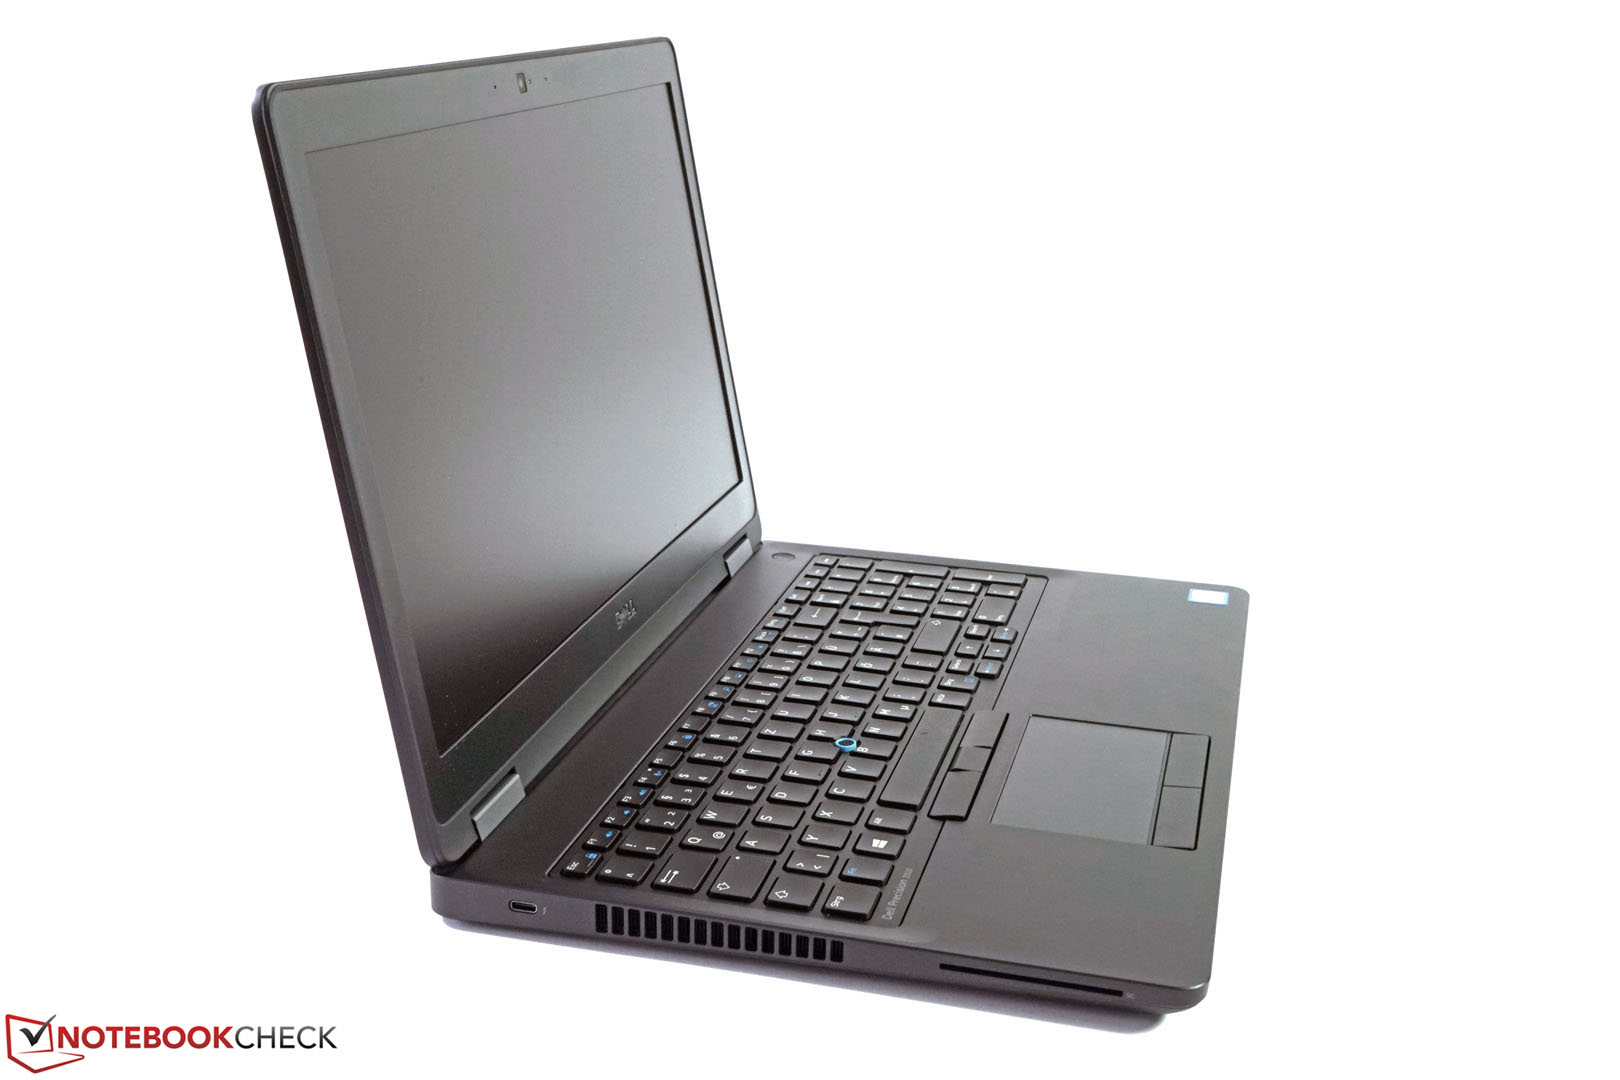
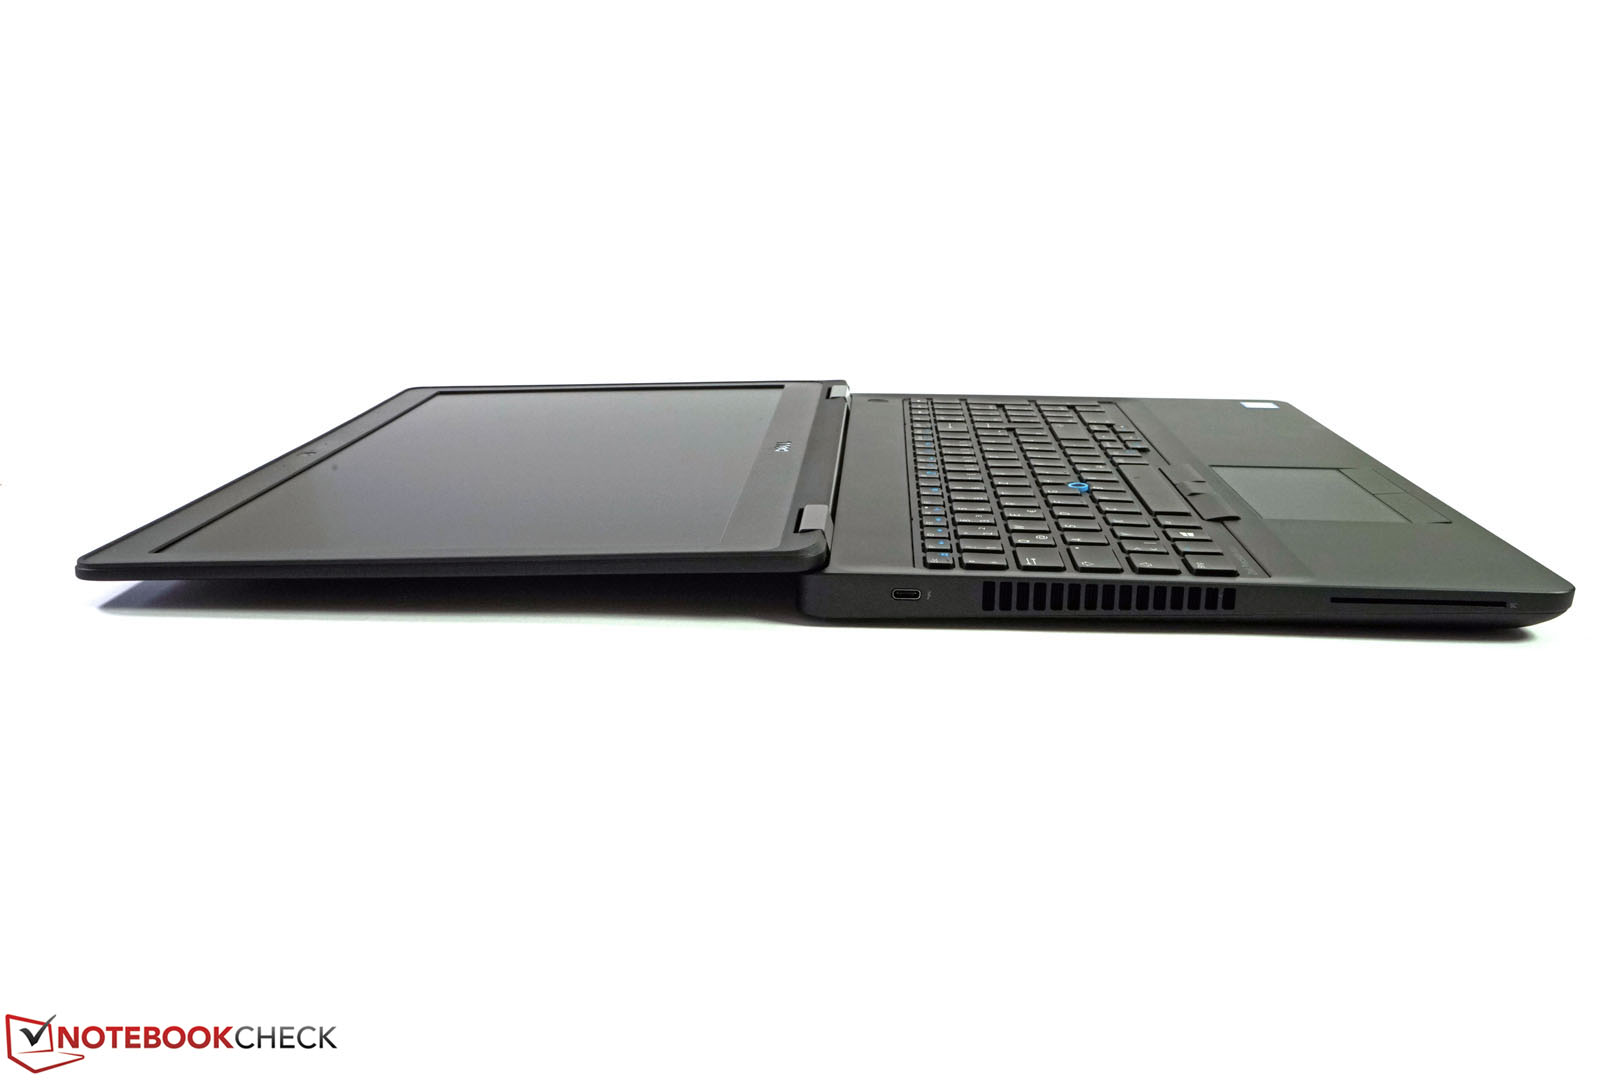
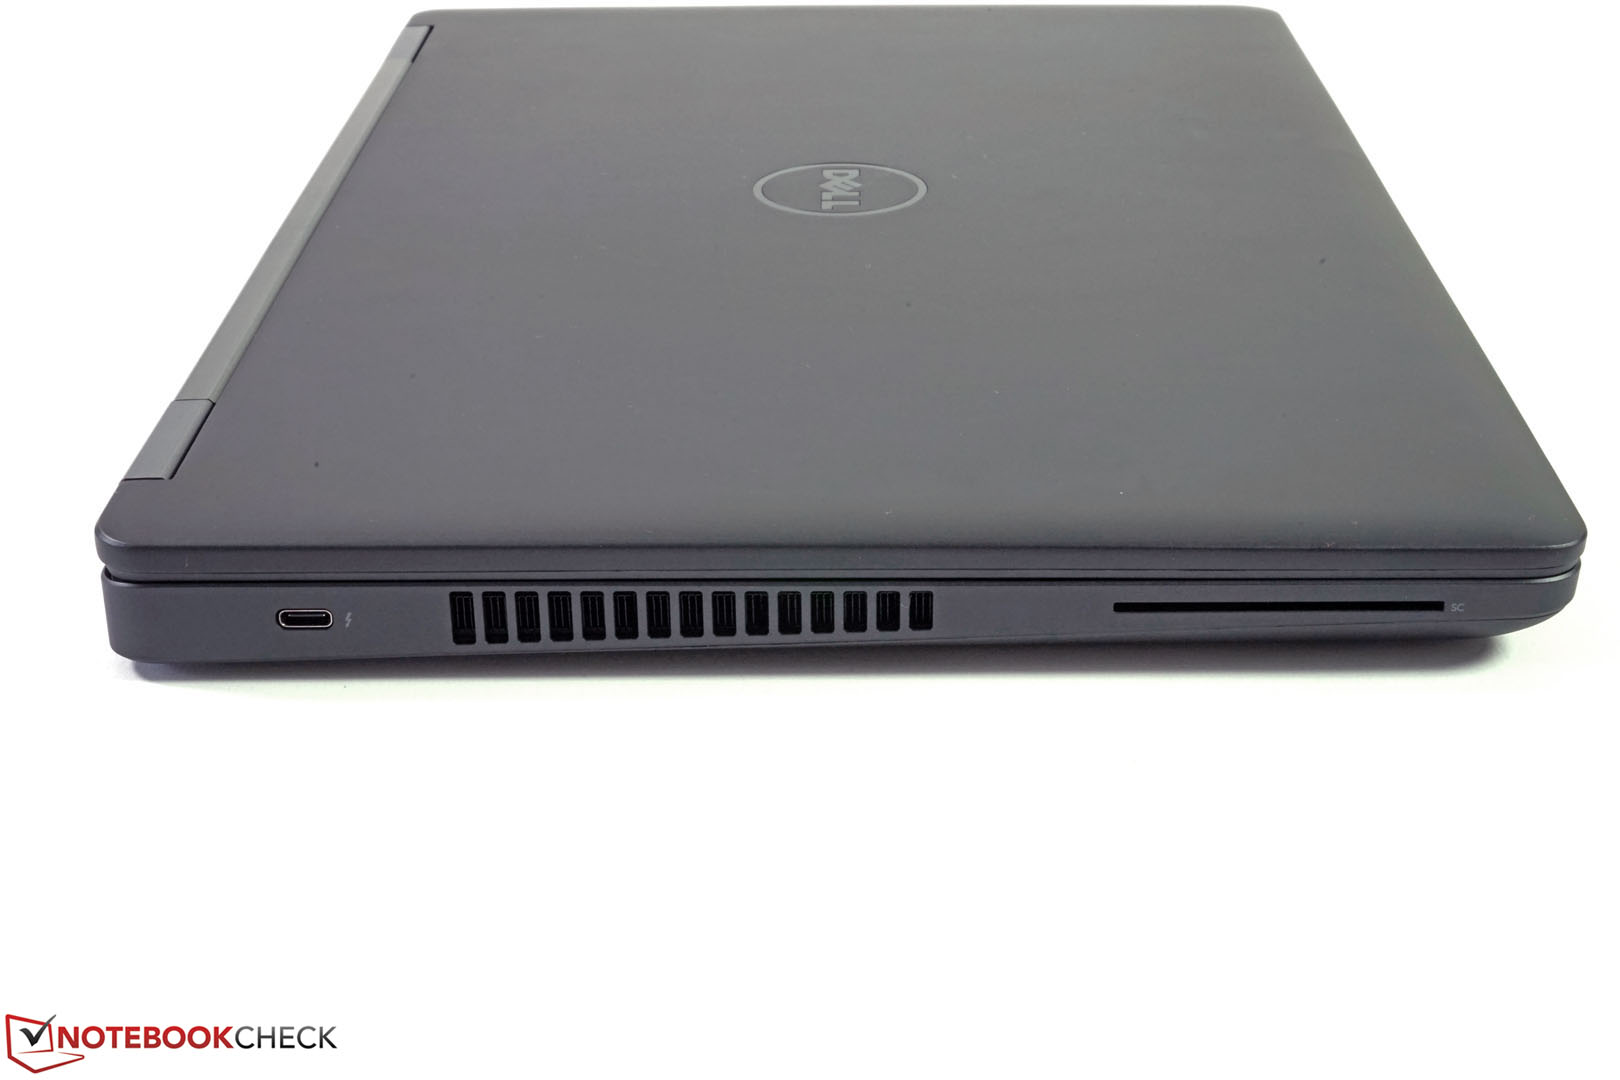
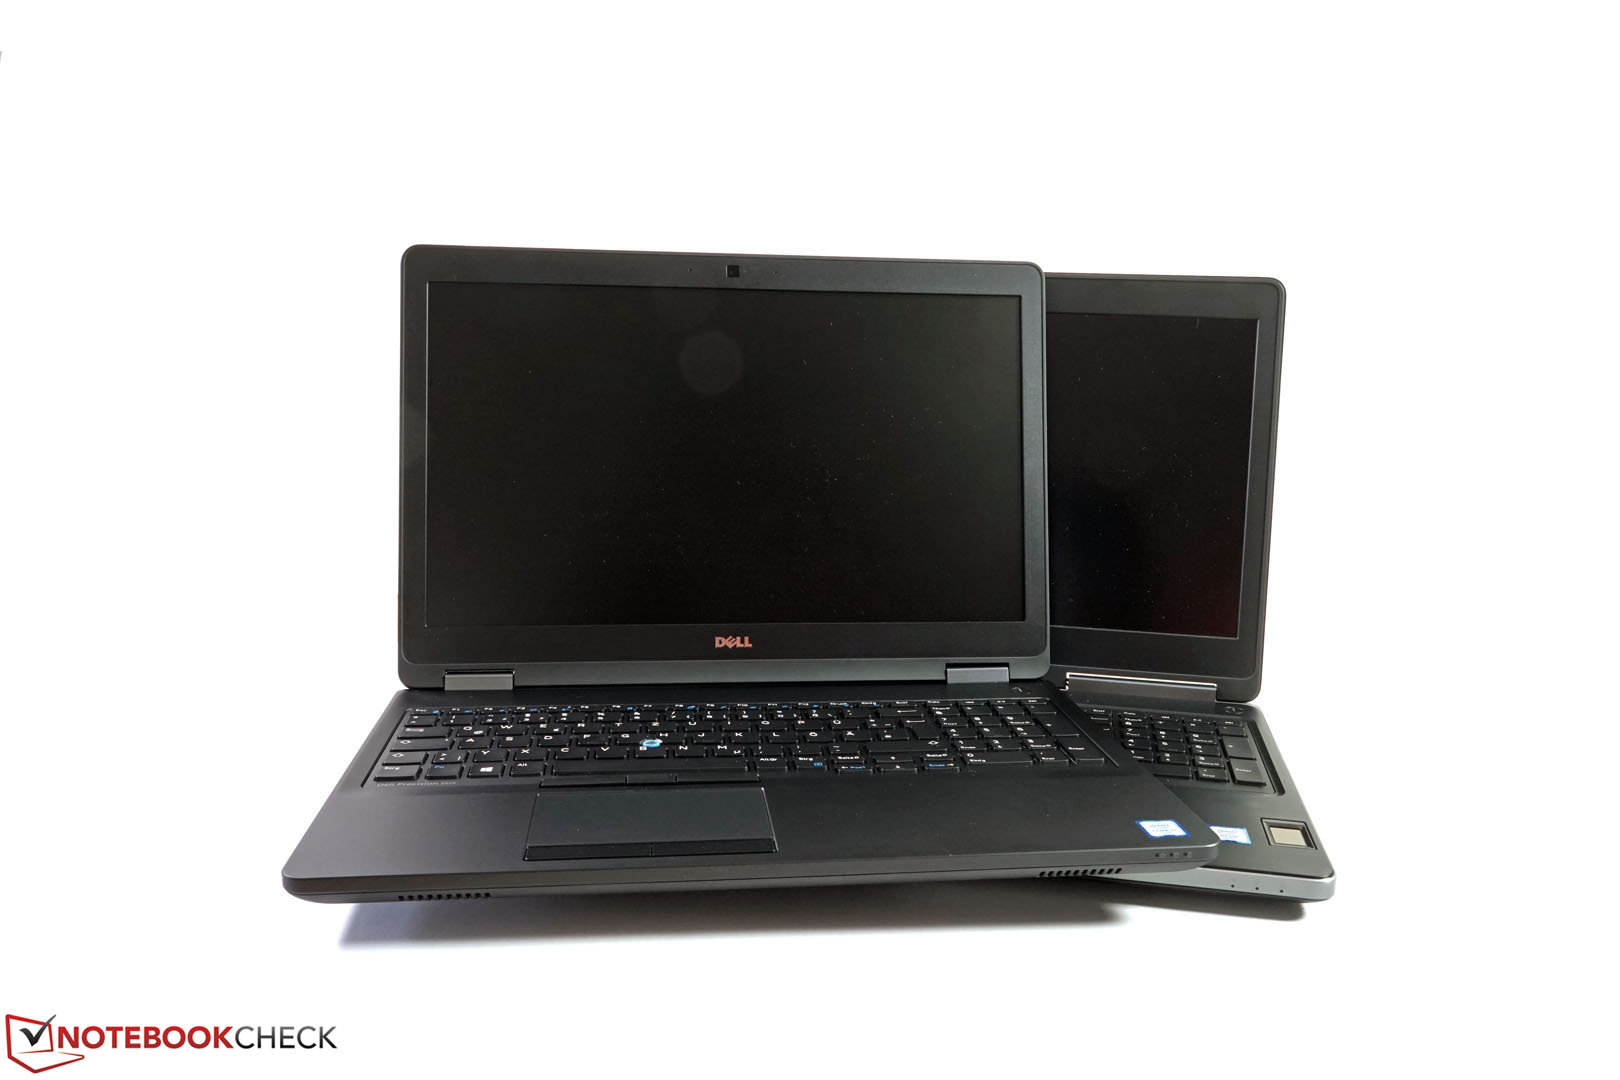
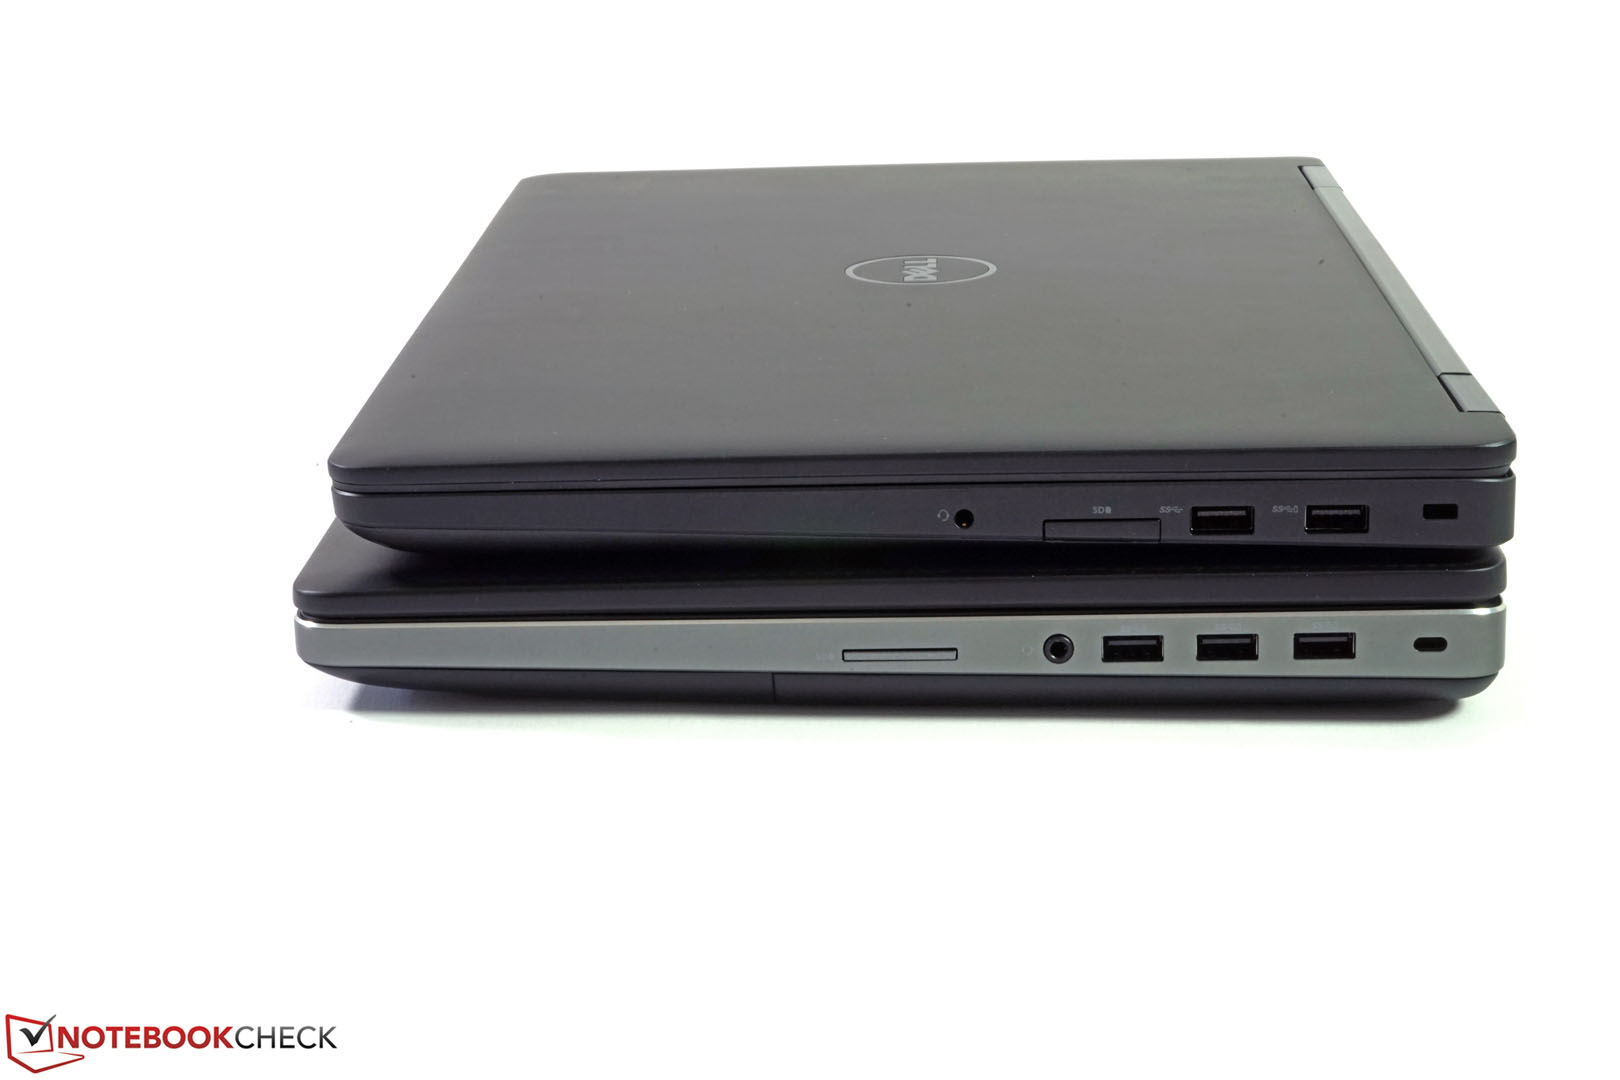
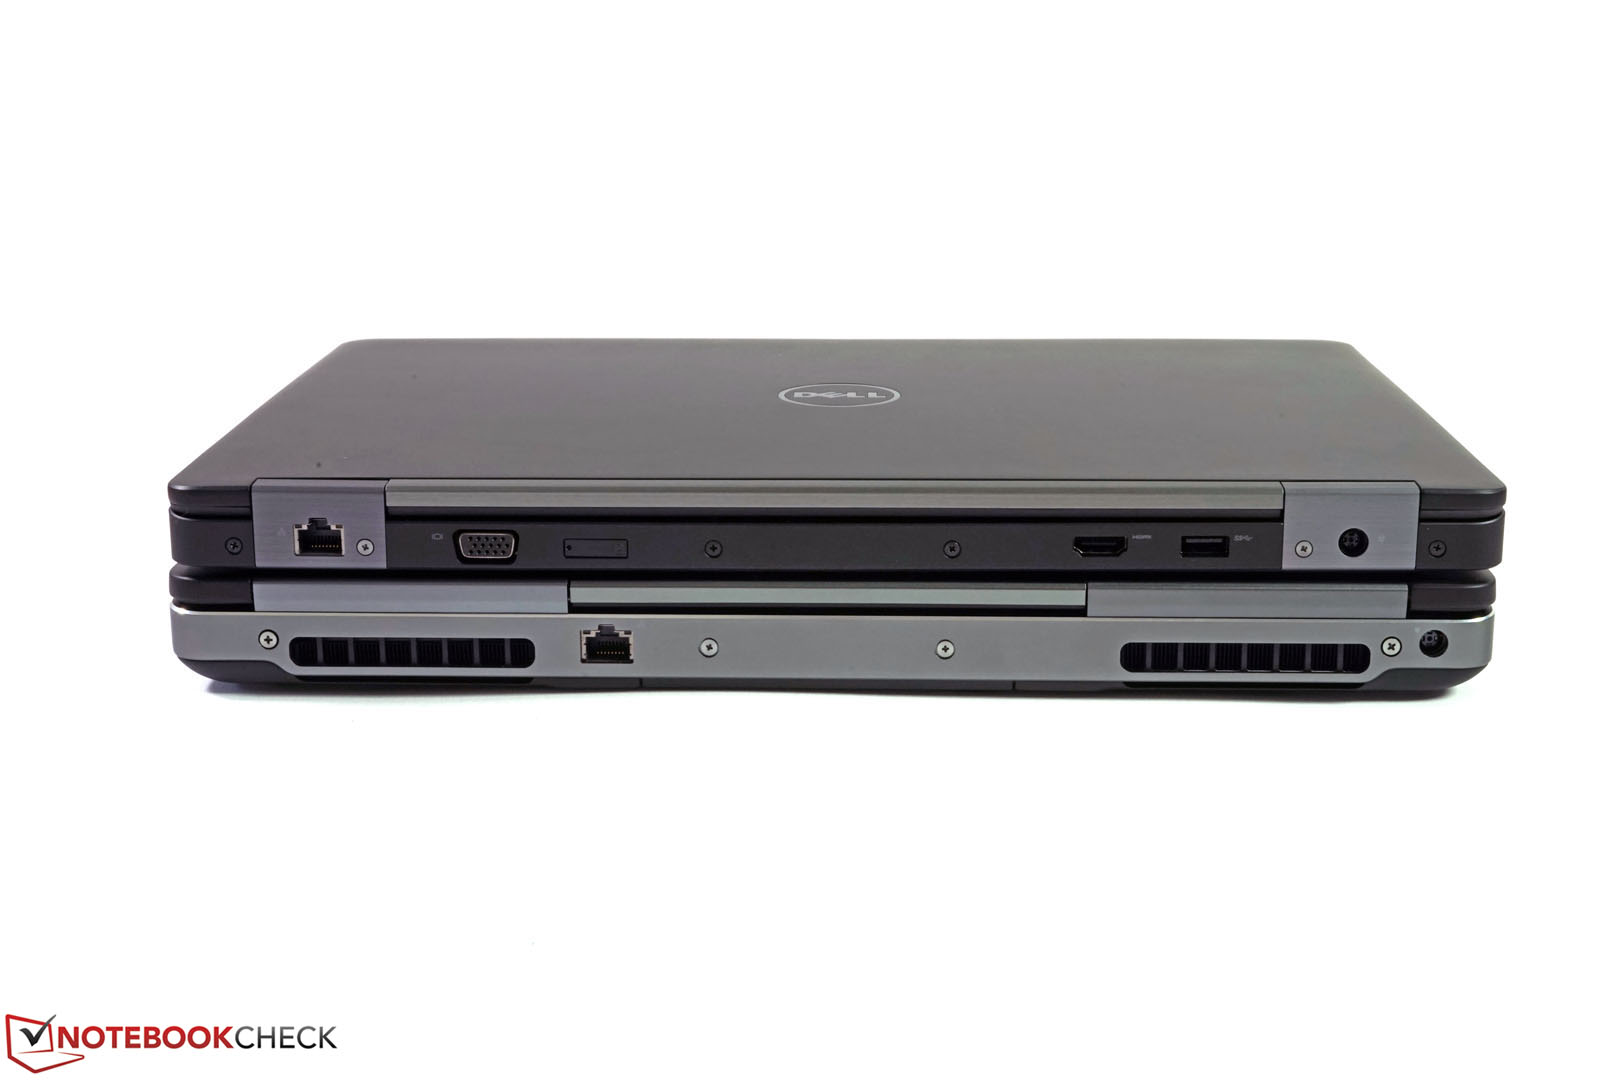
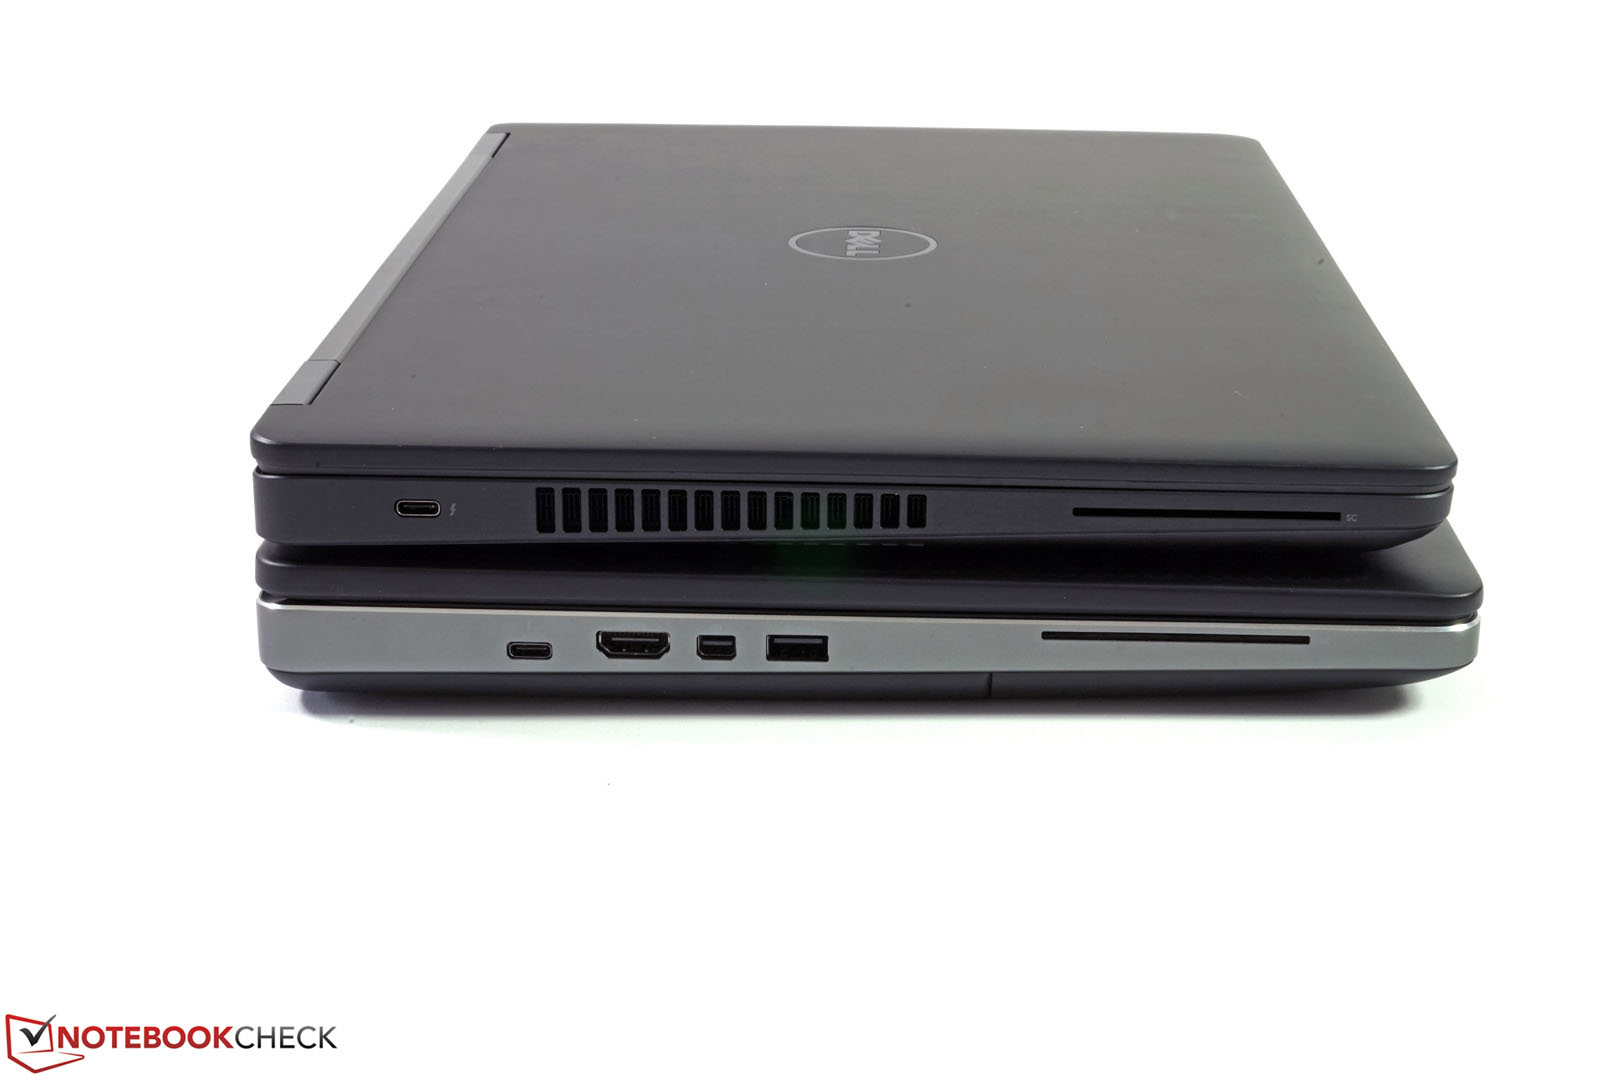
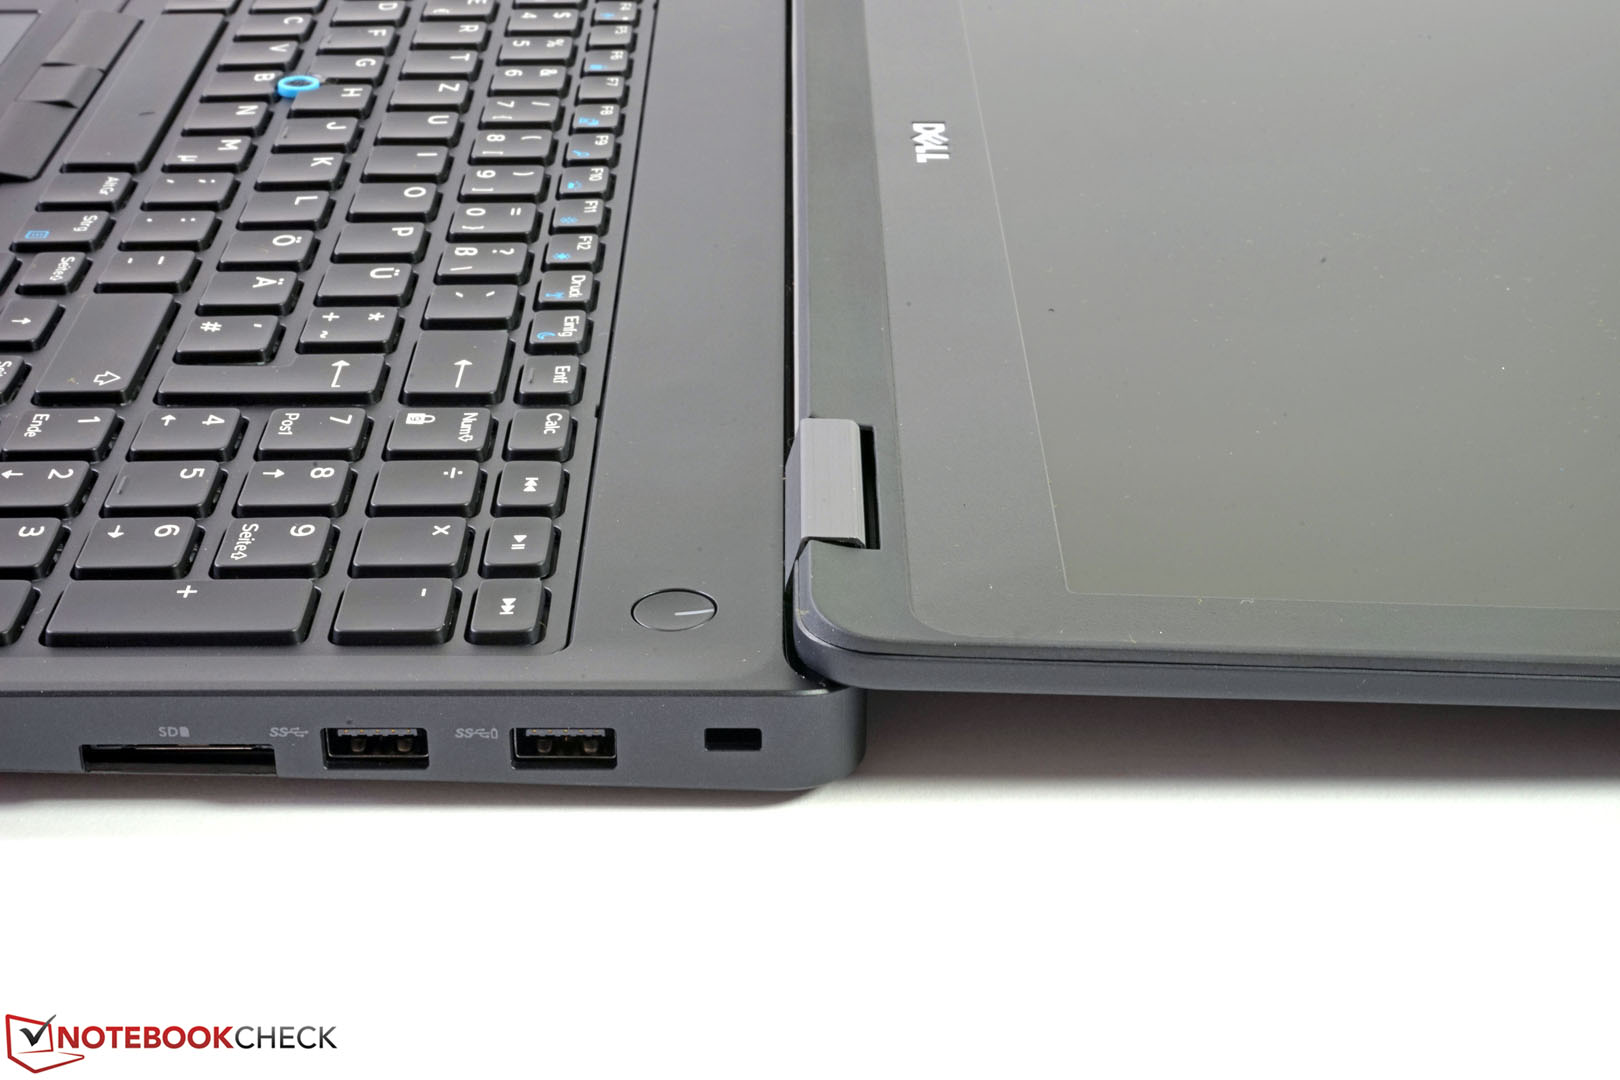
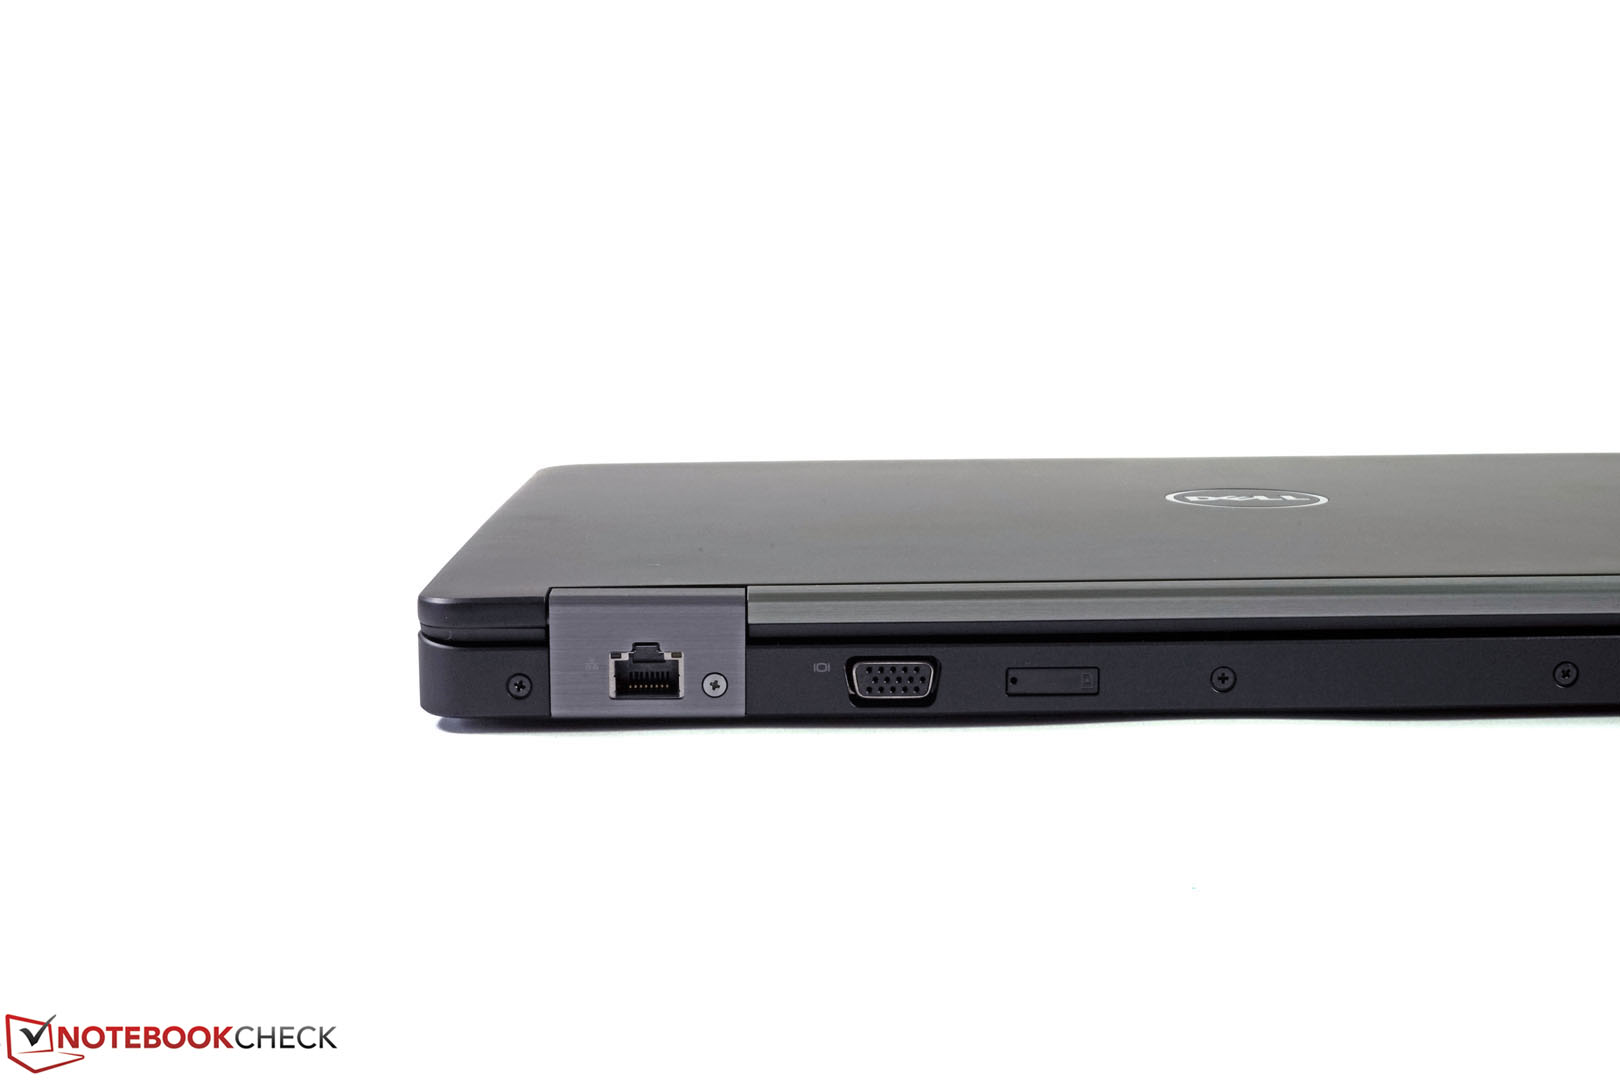
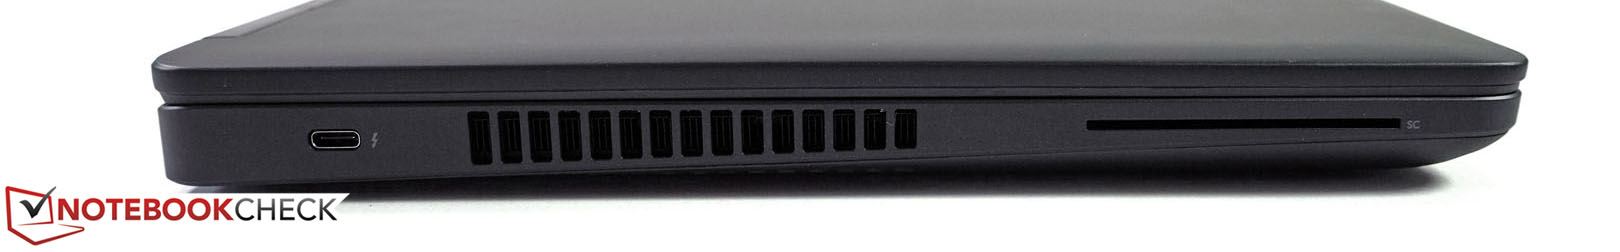
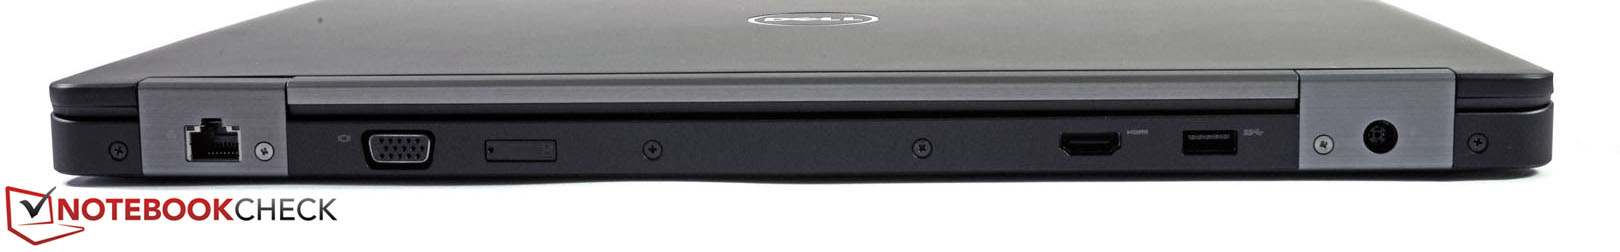
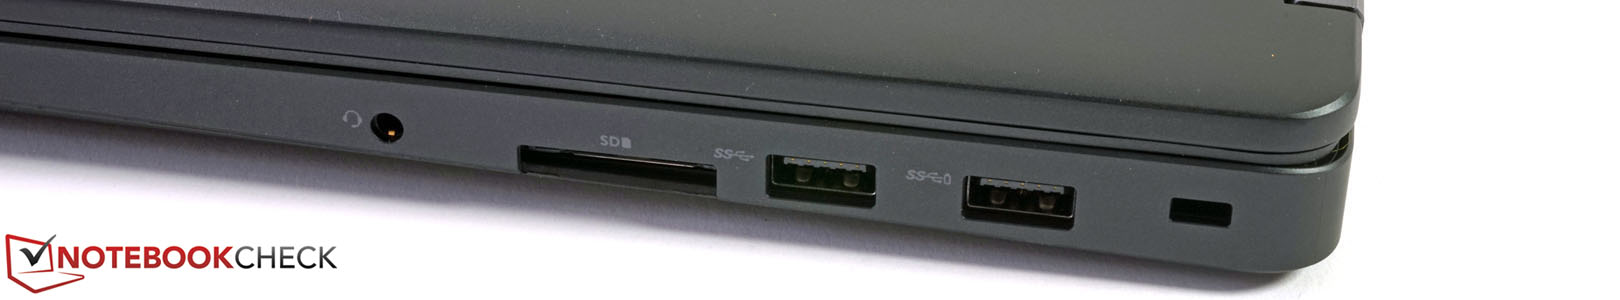
De Dell Precision 3510 is een professioneel toestel met een duidelijke focus op mobiliteit. Dankzij zijn dunne constructie, lange batterijduur en stevige behuizing is het een erg interessante optie voor personeel dat zijn toestel onderweg gebruikt. Andere voordelen van deze mobiele workstation zijn de handige selectie van poorten en de opties voor garantie en support.
De prijs van de serie is eveneens aantrekkelijk en laat toe om voor relatief weinig geld een stap te zetten in de wereld van de mobiele workstations.
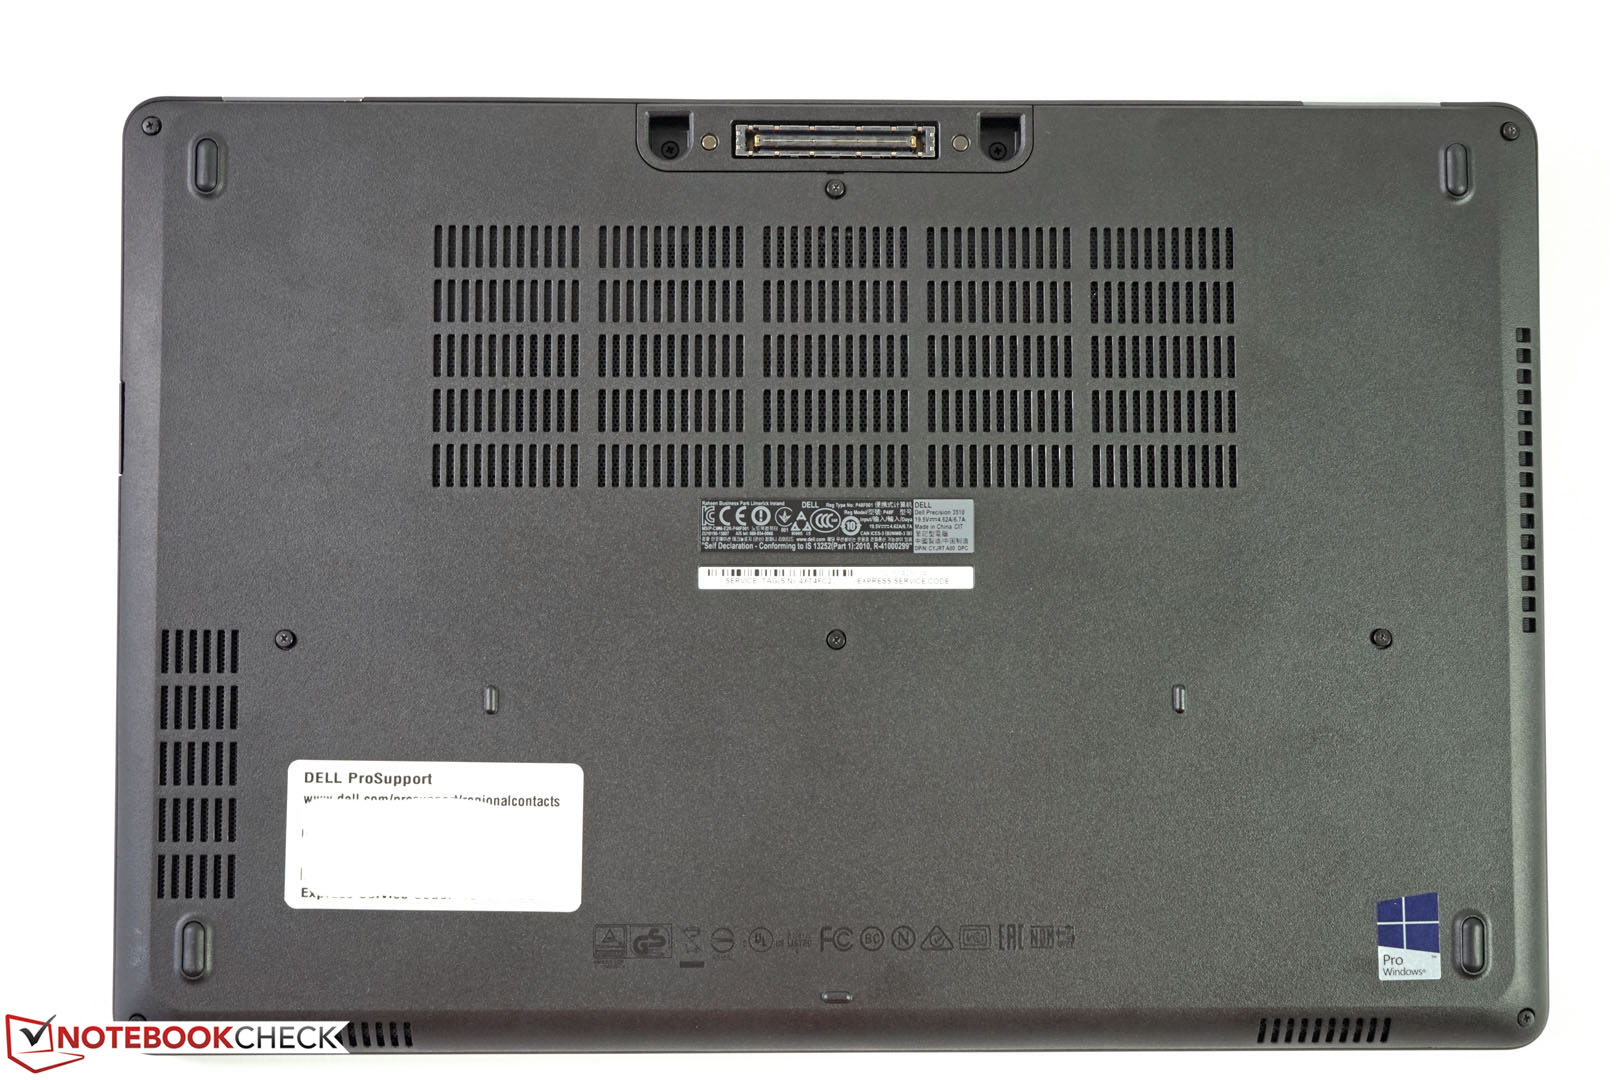
Je zal echter een aantal toegevingen moeten doen op een niet onbelangrijk vlak: de prestaties zakken immers merkbaar bij aanhoudende belasting en de emissies lopen oncomfortabel hoog op in deze scenario's. Andere suboptimale punten zijn de beperkte upgradebaarheid en de CAD-prestaties in het algemeen. Sommige concurrenten hebben hier simpelweg meer te bieden.
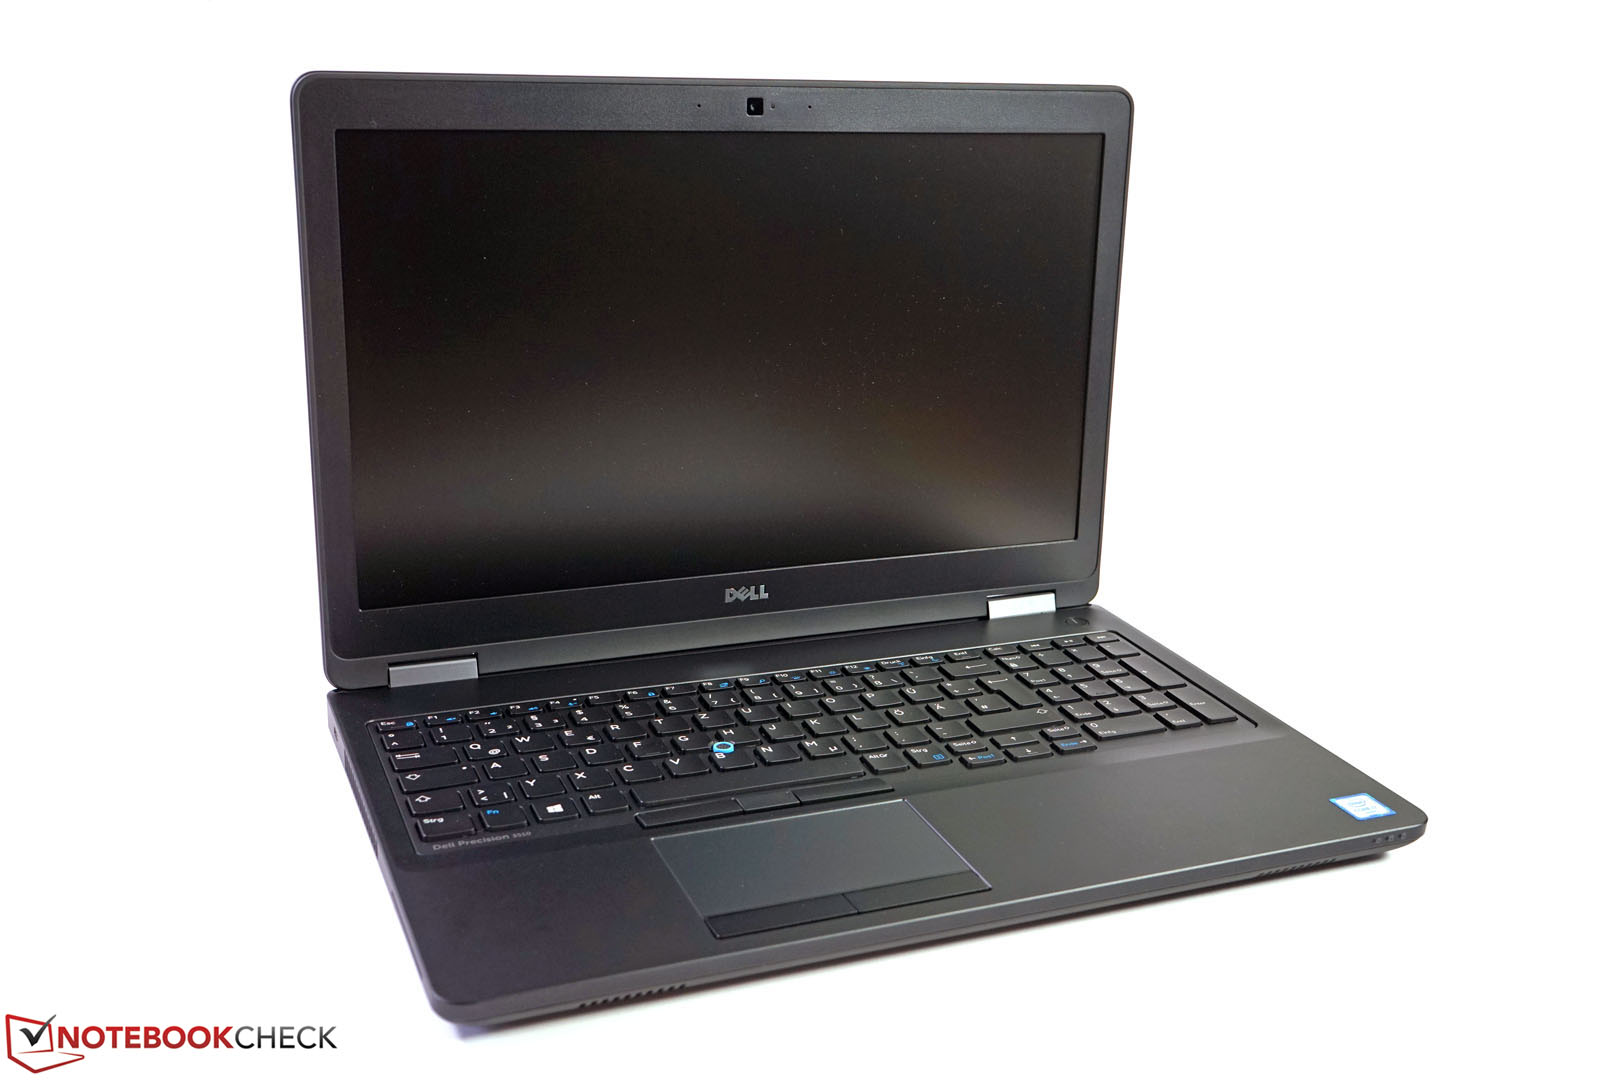
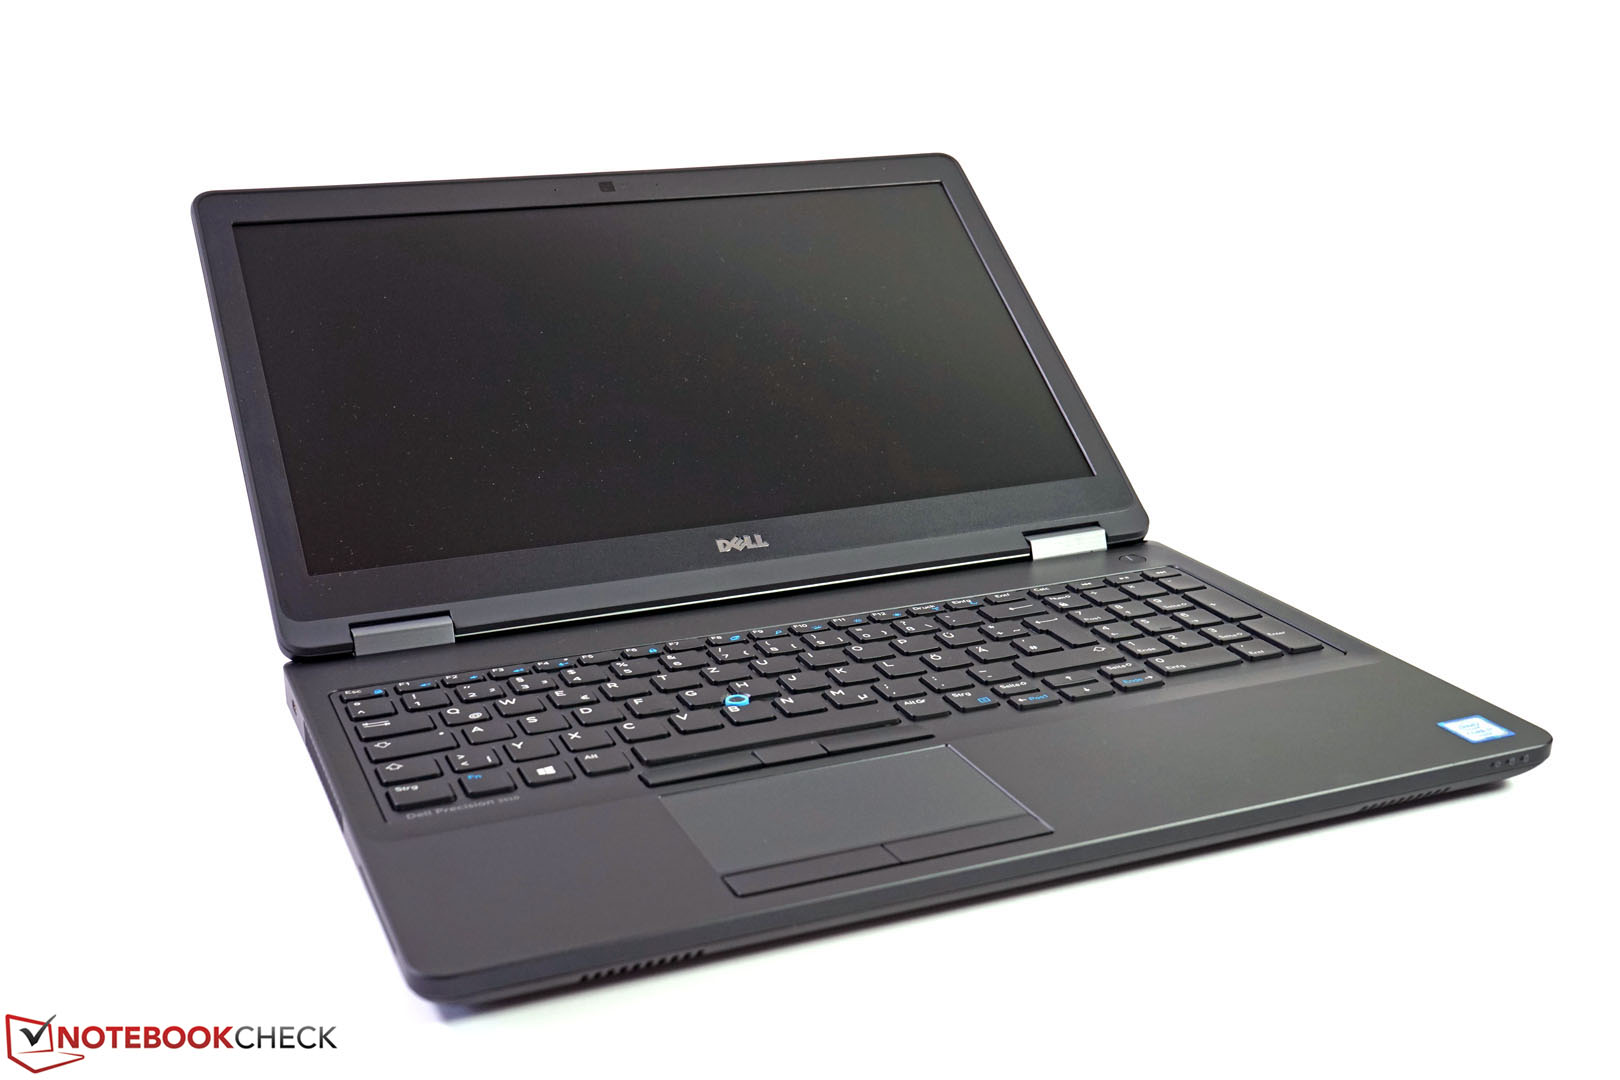
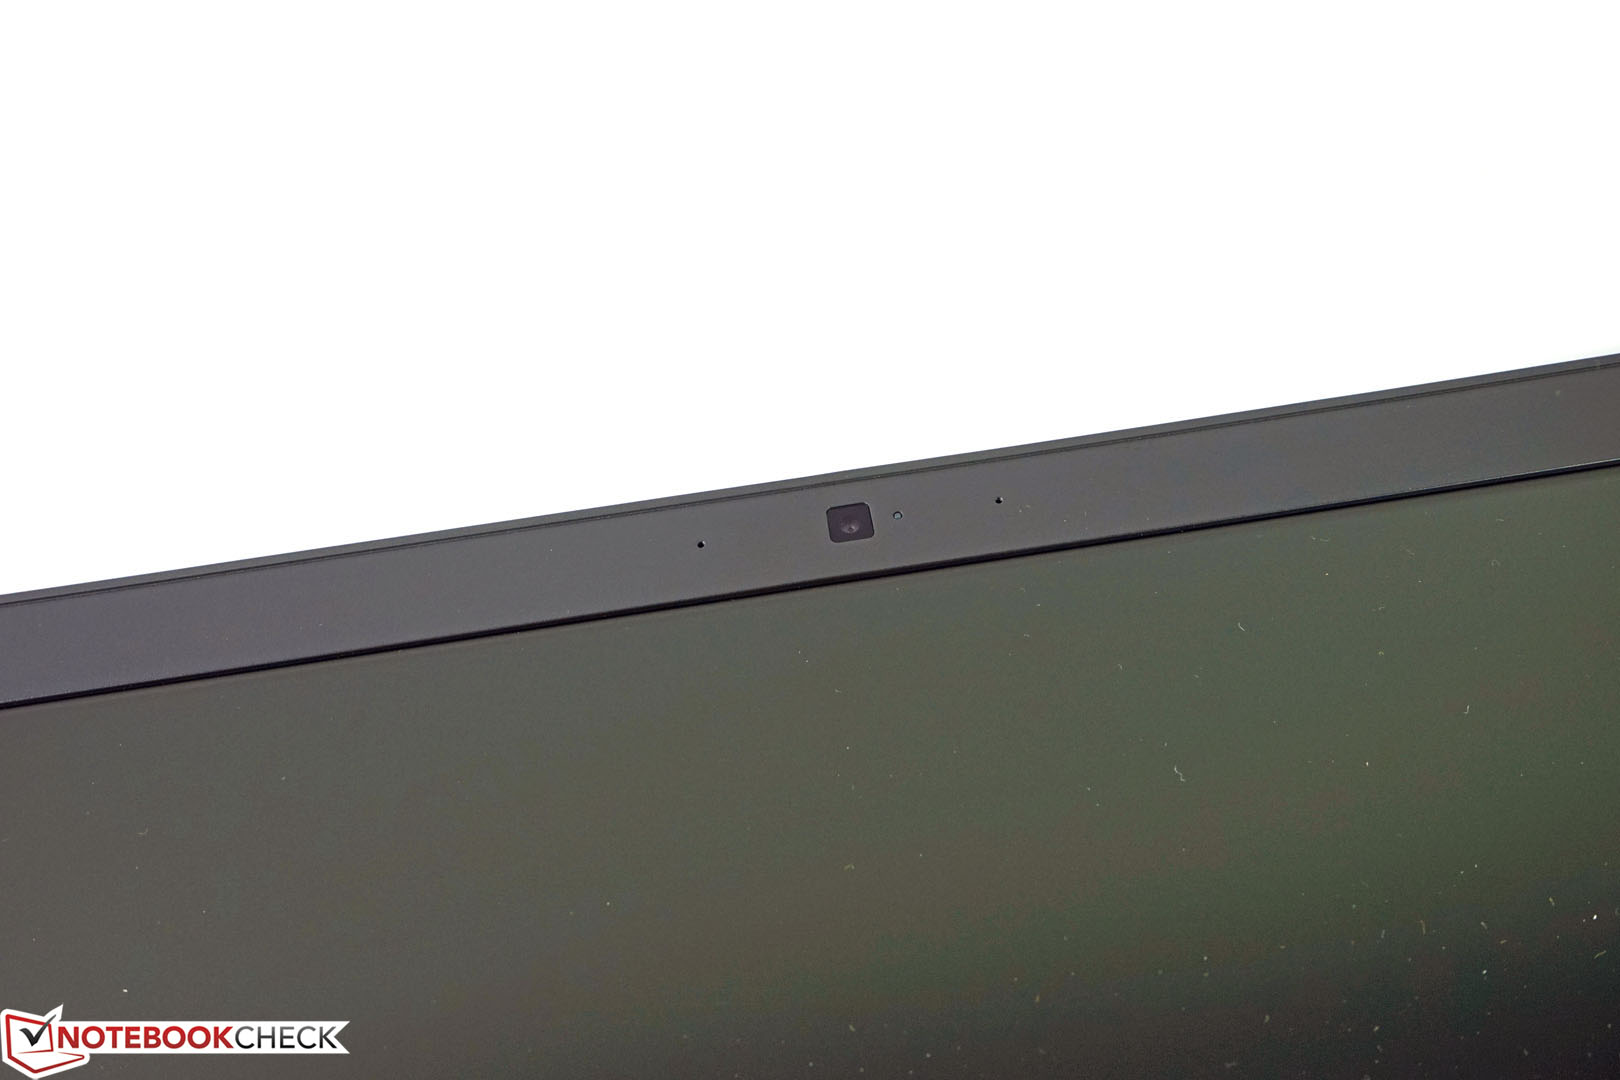
Hoewel al deze zaken, afhankelijk van het specifieke gebruiksscenario, nog tolereerbaar zijn, zal het scherm van ons testtoestel niet in de smaak vallen bij de gebruikers. Gezien de professionele oriëntatie van dit toestel, is geen enkel eigenschap van het scherm (resolutie, helderheid, contrast, kleurdekking, helderheidsverdeling, stabiliteit van kijkhoeken) toereikend voor het beoogde doelpubliek.
Gelukkig biedt Dell meerdere schermvarianten aan in zijn webwinkel, waardoor dit probleem volledig omzeild kan worden en het toestel ineens een veel betere indruk zou maken.
Dell Precision 3510
- 17-07-2016 v5.1 (old)
Tobias Winkler
Price comparison
