Kort testrapport MSI GS75 Stealth 9SG Laptop: een slanke en krachtige gaming-laptop met goede batterijduur

| |||||||||||||||||||||||||
Helderheidsverdeling: 91 %
Helderheid in Batterij-modus: 366 cd/m²
Contrast: 1262:1 (Zwart: 0.29 cd/m²)
ΔE ColorChecker Calman: 1.51 | ∀{0.5-29.43 Ø4.71}
calibrated: 0.71
ΔE Greyscale Calman: 1.93 | ∀{0.09-98 Ø4.96}
94% sRGB (Argyll 1.6.3 3D)
60% AdobeRGB 1998 (Argyll 1.6.3 3D)
64.7% AdobeRGB 1998 (Argyll 3D)
93.5% sRGB (Argyll 3D)
62.6% Display P3 (Argyll 3D)
Gamma: 2.38
CCT: 6881 K
| MSI GS75 Stealth 9SG Chi Mei N173HCE-G33 (CMN175C), IPS, 1920x1080 | Schenker XMG Neo 17 BOEhydis NV173FHM-N44 (BOE07B6), IPS, 1920x1080 | Dell G7 17 7790 AU Optronics AUO409D, B173HAN, IPS, 1920x1080 | Alienware m17 P37E AU Optronics B173ZAN01.0, IPS, 3840x2160 | Asus Zephyrus S GX701GX B173HAN04.0 (AUO409D), IPS, 1920x1080 | Lenovo Legion Y740-17ICH AU Optronics B173HAN03.2, IPS, 1920x1080 | |
|---|---|---|---|---|---|---|
| Display | 2% | -2% | 33% | -2% | -0% | |
| Display P3 Coverage (%) | 62.6 | 65.2 4% | 61.9 -1% | 86.4 38% | 62.9 0% | 64 2% |
| sRGB Coverage (%) | 93.5 | 92.2 -1% | 89.6 -4% | 99.9 7% | 87.8 -6% | 90.4 -3% |
| AdobeRGB 1998 Coverage (%) | 64.7 | 66.5 3% | 63.2 -2% | 99.1 53% | 63.9 -1% | 64.8 0% |
| Response Times | -91% | -80% | -287% | 2% | -73% | |
| Response Time Grey 50% / Grey 80% * (ms) | 7.2 ? | 18.8 ? -161% | 17.2 ? -139% | 35.6 ? -394% | 7.2 ? -0% | 15.6 ? -117% |
| Response Time Black / White * (ms) | 10 ? | 12 ? -20% | 12 ? -20% | 28 ? -180% | 9.6 ? 4% | 12.8 ? -28% |
| PWM Frequency (Hz) | 25510 ? | 971 ? | ||||
| Screen | -32% | -77% | -135% | -30% | -104% | |
| Brightness middle (cd/m²) | 366 | 304 -17% | 308.6 -16% | 357.9 -2% | 288 -21% | 299.1 -18% |
| Brightness (cd/m²) | 343 | 289 -16% | 299 -13% | 347 1% | 287 -16% | 273 -20% |
| Brightness Distribution (%) | 91 | 90 -1% | 92 1% | 94 3% | 91 0% | 81 -11% |
| Black Level * (cd/m²) | 0.29 | 0.26 10% | 0.29 -0% | 0.33 -14% | 0.2 31% | 0.27 7% |
| Contrast (:1) | 1262 | 1169 -7% | 1064 -16% | 1085 -14% | 1440 14% | 1108 -12% |
| Colorchecker dE 2000 * | 1.51 | 2.65 -75% | 4.26 -182% | 6.57 -335% | 2.33 -54% | 5.07 -236% |
| Colorchecker dE 2000 max. * | 3.22 | 6.11 -90% | 7.83 -143% | 9.86 -206% | 5.34 -66% | 10.55 -228% |
| Colorchecker dE 2000 calibrated * | 0.71 | 1.5 -111% | 2.93 -313% | 6.74 -849% | 2.47 -248% | 3.31 -366% |
| Greyscale dE 2000 * | 1.93 | 2.75 -42% | 5 -159% | 4.3 -123% | 1.19 38% | 6.8 -252% |
| Gamma | 2.38 92% | 2.46 89% | 2.07 106% | 2.6 85% | 2.41 91% | 2.46 89% |
| CCT | 6881 94% | 6763 96% | 7488 87% | 6403 102% | 6710 97% | 7805 83% |
| Color Space (Percent of AdobeRGB 1998) (%) | 60 | 60 0% | 57.8 -4% | 88.4 47% | 57 -5% | 58.5 -2% |
| Color Space (Percent of sRGB) (%) | 94 | 92 -2% | 89.2 -5% | 100 6% | 88 -6% | 89.9 -4% |
| Totaal Gemiddelde (Programma / Instellingen) | -40% /
-33% | -53% /
-64% | -130% /
-123% | -10% /
-21% | -59% /
-81% |
* ... kleiner is beter
Responstijd Scherm
| ↔ Responstijd Zwart naar Wit | ||
|---|---|---|
| 10 ms ... stijging ↗ en daling ↘ gecombineerd | ↗ 5.2 ms stijging | 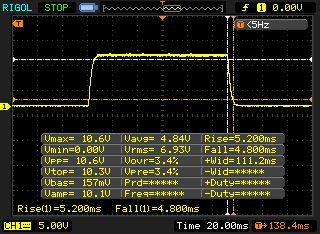 |
| ↘ 4.8 ms daling | ||
| Het scherm vertoonde prima responstijden in onze tests maar is misschien wat te traag voor competitieve games. Ter vergelijking: alle testtoestellen variëren van 0.1 (minimum) tot 240 (maximum) ms. » 27 % van alle toestellen zijn beter. Dit betekent dat de gemeten responstijd beter is dan het gemiddelde (19.8 ms) van alle geteste toestellen. | ||
| ↔ Responstijd 50% Grijs naar 80% Grijs | ||
| 7.2 ms ... stijging ↗ en daling ↘ gecombineerd | ↗ 3.8 ms stijging | 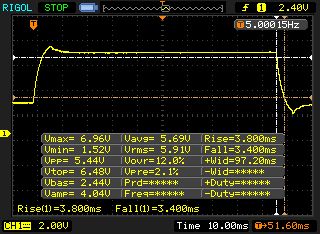 |
| ↘ 3.4 ms daling | ||
| Het scherm vertoonde erg snelle responstijden in onze tests en zou zeer geschikt moeten zijn voor snelle games. Ter vergelijking: alle testtoestellen variëren van 0.165 (minimum) tot 636 (maximum) ms. » 20 % van alle toestellen zijn beter. Dit betekent dat de gemeten responstijd beter is dan het gemiddelde (30.9 ms) van alle geteste toestellen. | ||
Screen Flickering / PWM (Pulse-Width Modulation)
| Screen flickering / PWM waargenomen | 25510 Hz | ≤ 17 % helderheid instelling | 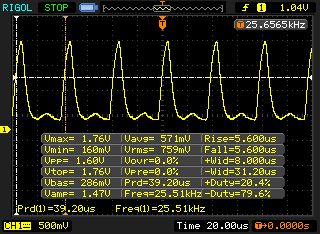 |
De achtergrondverlichting van het scherm flikkert op 25510 Hz (in het slechtste geval, bijvoorbeeld bij gebruik van PWM) aan een helderheid van 17 % en lager. Boven deze helderheid zou er geen flickering / PWM mogen optreden. De frequentie van 25510 Hz is redelijk hoog en de meeste mensen die gevoelig zijn aan flickering zouden dit dus niet mogen waarnemen of geïrriteerde ogen krijgen. Ter vergelijking: 52 % van alle geteste toestellen maakten geen gebruik van PWM om de schermhelderheid te verlagen. Als het wel werd gebruikt, werd een gemiddelde van 7744 (minimum: 5 - maximum: 343500) Hz waargenomen. | |||

| Cinebench R10 | |
| Rendering Single 32Bit | |
| Gemiddelde van klas Gaming (7457 - 12575, n=9, laatste 2 jaar) | |
| MSI GS75 Stealth 9SG | |
| Rendering Multiple CPUs 32Bit | |
| Gemiddelde van klas Gaming (42932 - 102066, n=9, laatste 2 jaar) | |
| MSI GS75 Stealth 9SG | |
| Cinebench R20 | |
| CPU (Single Core) | |
| Gemiddelde van klas Gaming (622 - 913, n=103, laatste 2 jaar) | |
| MSI GS75 Stealth 9SG | |
| CPU (Multi Core) | |
| Gemiddelde van klas Gaming (4029 - 16433, n=103, laatste 2 jaar) | |
| MSI GS75 Stealth 9SG | |
| Geekbench 3 | |
| 32 Bit Multi-Core Score | |
| MSI GS75 Stealth 9SG | |
| 32 Bit Single-Core Score | |
| MSI GS75 Stealth 9SG | |
| Geekbench 4.4 | |
| 64 Bit Multi-Core Score | |
| Gemiddelde van klas Gaming (89200 - 101054, n=3, laatste 2 jaar) | |
| MSI GS75 Stealth 9SG | |
| 64 Bit Single-Core Score | |
| Gemiddelde van klas Gaming (9335 - 9775, n=3, laatste 2 jaar) | |
| MSI GS75 Stealth 9SG | |
| Mozilla Kraken 1.1 - Total | |
| Lenovo Legion Y740-17ICH (Edge 44.17763.1.0) | |
| MSI GS75 Stealth 9SG (Edge 44) | |
| Gemiddelde van klas Gaming (391 - 590, n=100, laatste 2 jaar) | |
| Octane V2 - Total Score | |
| Gemiddelde van klas Gaming (93292 - 139447, n=26, laatste 2 jaar) | |
| MSI GS75 Stealth 9SG (Edge 44) | |
| Lenovo Legion Y740-17ICH (Edge 44.17763.1.0) | |
| JetStream 1.1 - 1.1 Total | |
| Gemiddelde van klas Gaming (549 - 647, n=2, laatste 2 jaar) | |
| MSI GS75 Stealth 9SG (Edge 44) | |
| Lenovo Legion Y740-17ICH (Edge 44.17763.1.0) | |
* ... kleiner is beter
| PCMark 7 Score | 6948 punten | |
| PCMark 8 Home Score Accelerated v2 | 4461 punten | |
| PCMark 8 Creative Score Accelerated v2 | 4193 punten | |
| PCMark 8 Work Score Accelerated v2 | 5716 punten | |
| PCMark 10 Score | 5804 punten | |
Help | ||
| PCMark 8 | |
| Home Score Accelerated v2 | |
| Gemiddelde van klas Gaming (n=1laatste 2 jaar) | |
| Lenovo Legion Y740-17ICH | |
| MSI GS75 Stealth 9SG | |
| Dell G7 17 7790 | |
| Alienware m17 P37E | |
| Work Score Accelerated v2 | |
| Lenovo Legion Y740-17ICH | |
| MSI GS75 Stealth 9SG | |
| Dell G7 17 7790 | |
| Alienware m17 P37E | |
| Gemiddelde van klas Gaming (n=1laatste 2 jaar) | |

| MSI GS75 Stealth 9SG 2x Samsung SSD PM981 MZVLB1T0HALR (RAID 0) | Schenker XMG Neo 17 Samsung SSD 970 EVO Plus 1TB | Dell G7 17 7790 Toshiba BG3 KBG30ZMS256G | Alienware m17 P37E SK Hynix PC401 512GB M.2 (HFS512GD9TNG) | Asus Zephyrus S GX701GX Samsung SSD PM981 MZVLB1T0HALR | Lenovo Legion Y740-17ICH Samsung SSD PM981 MZVLB256HAHQ | |
|---|---|---|---|---|---|---|
| CrystalDiskMark 5.2 / 6 | -21% | -56% | -17% | -27% | -18% | |
| Write 4K (MB/s) | 95.5 | 92.7 -3% | 78.6 -18% | 120.2 26% | 92.4 -3% | 99.8 5% |
| Read 4K (MB/s) | 42.59 | 41.4 -3% | 31.89 -25% | 44.3 4% | 39.59 -7% | 40.81 -4% |
| Write Seq (MB/s) | 2851 | 1363 -52% | 230.4 -92% | 1278 -55% | 1221 -57% | 1385 -51% |
| Read Seq (MB/s) | 2696 | 1259 -53% | 925 -66% | 1389 -48% | 1005 -63% | 2089 -23% |
| Write 4K Q32T1 (MB/s) | 402.6 | 289.7 -28% | 159.1 -60% | 436.2 8% | 292.5 -27% | 380 -6% |
| Read 4K Q32T1 (MB/s) | 443.9 | 337.5 -24% | 315.6 -29% | 515 16% | 330.8 -25% | 445.5 0% |
| Write Seq Q32T1 (MB/s) | 3420 | 3332 -3% | 230.7 -93% | 1157 -66% | 2385 -30% | 1380 -60% |
| Read Seq Q32T1 (MB/s) | 3514 | 3477 -1% | 1323 -62% | 2671 -24% | 3339 -5% | 3471 -1% |
| 3DMark 06 Standard Score | 37968 punten | |
| 3DMark 11 Performance | 21390 punten | |
| 3DMark Cloud Gate Standard Score | 34168 punten | |
| 3DMark Fire Strike Score | 17182 punten | |
| 3DMark Time Spy Score | 7518 punten | |
Help | ||
| The Witcher 3 - 1920x1080 Ultra Graphics & Postprocessing (HBAO+) | |
| Gemiddelde van klas Gaming (104.7 - 240, n=7, laatste 2 jaar) | |
| Asus Zephyrus S GX701GX | |
| MSI GS75 Stealth 9SG | |
| Alienware m17 P37E | |
| Lenovo Legion Y740-17ICH | |
| Schenker XMG Neo 17 | |
| Dell G7 17 7790 | |
| BioShock Infinite - 1920x1080 Ultra Preset, DX11 (DDOF) | |
| Alienware m17 P37E | |
| MSI GS75 Stealth 9SG | |
| Lenovo Legion Y740-17ICH | |
| Dell G7 17 7790 | |
| Far Cry New Dawn - 1920x1080 Ultra Preset | |
| MSI GS75 Stealth 9SG | |
| Schenker XMG Neo 17 | |
| Batman: Arkham Knight - 1920x1080 High / On AA:SM AF:16x | |
| MSI GS75 Stealth 9SG | |
| lage | gem. | hoge | ultra | |
|---|---|---|---|---|
| BioShock Infinite (2013) | 331.1 | 289.6 | 263.6 | 163.7 |
| The Witcher 3 (2015) | 286.3 | 217.2 | 135 | 76.9 |
| Batman: Arkham Knight (2015) | 172 | 161 | 134 | 92 |
| Ashes of the Singularity (2016) | 82.5 | 80.7 | 81.3 | |
| Ark Survival Evolved (2017) | 160.9 | 87.9 | 63.5 | 43.9 |
| Final Fantasy XV Benchmark (2018) | 127.4 | 100.7 | 74 | |
| Far Cry 5 (2018) | 123 | 109 | 99 | 95 |
| Far Cry New Dawn (2019) | 116 | 98 | 94 | 85 |
| Anno 1800 (2019) | 98.5 | 93.9 | 77.7 | 41.2 |
| Rage 2 (2019) | 206.6 | 112.2 | 96.1 | 93.3 |
Geluidsniveau
| Onbelast |
| 31 / 32 / 38 dB (A) |
| Belasting |
| 47 / 49 dB (A) |
 | ||
30 dB stil 40 dB(A) hoorbaar 50 dB(A) luid |
||
min: | ||
| MSI GS75 Stealth 9SG i7-9750H, GeForce RTX 2080 Max-Q | Schenker XMG Neo 17 i7-8750H, GeForce RTX 2070 Mobile | Dell G7 17 7790 i7-8750H, GeForce RTX 2070 Max-Q | Alienware m17 P37E i9-8950HK, GeForce RTX 2080 Max-Q | Asus Zephyrus S GX701GX i7-8750H, GeForce RTX 2080 Max-Q | Lenovo Legion Y740-17ICH i7-8750H, GeForce RTX 2080 Max-Q | Gemiddelde van klas Gaming | |
|---|---|---|---|---|---|---|---|
| Noise | 4% | 10% | 4% | 2% | 10% | 11% | |
| uit / omgeving * (dB) | 30 | 29 3% | 28.2 6% | 28.2 6% | 29 3% | 28.3 6% | 24.1 ? 20% |
| Idle Minimum * (dB) | 31 | 29 6% | 28.6 8% | 28.2 9% | 29 6% | 31.5 -2% | 25.9 ? 16% |
| Idle Average * (dB) | 32 | 32 -0% | 28.6 11% | 28.2 12% | 32 -0% | 31.6 1% | 27.4 ? 14% |
| Idle Maximum * (dB) | 38 | 33 13% | 28.6 25% | 31 18% | 33 13% | 31.6 17% | 30.1 ? 21% |
| Load Average * (dB) | 47 | 42 11% | 31.8 32% | 50.8 -8% | 47 -0% | 32.3 31% | 43.7 ? 7% |
| Witcher 3 ultra * (dB) | 48 | 49 -2% | 50.6 -5% | 50.8 -6% | 49 -2% | 43 10% | |
| Load Maximum * (dB) | 49 | 49 -0% | 50.8 -4% | 50.8 -4% | 51 -4% | 45.5 7% | 54.3 ? -11% |
* ... kleiner is beter
(-) De maximumtemperatuur aan de bovenzijde bedraagt 55 °C / 131 F, vergeleken met het gemiddelde van 40.4 °C / 105 F, variërend van 21.2 tot 68.8 °C voor de klasse Gaming.
(-) De bodem warmt op tot een maximum van 65 °C / 149 F, vergeleken met een gemiddelde van 43.2 °C / 110 F
(+) Bij onbelast gebruik bedraagt de gemiddelde temperatuur voor de bovenzijde 28.9 °C / 84 F, vergeleken met het apparaatgemiddelde van 33.9 °C / 93 F.
(-) Bij het spelen van The Witcher 3 is de gemiddelde temperatuur voor de bovenzijde 47.1 °C / 117 F, vergeleken met het apparaatgemiddelde van 33.9 °C / 93 F.
(-) De palmsteunen en het touchpad kunnen zeer heet aanvoelen met een maximum van ###max## °C / 113 F.
(-) De gemiddelde temperatuur van de handpalmsteun van soortgelijke toestellen bedroeg 28.8 °C / 83.8 F (-16.2 °C / -29.2 F).
| MSI GS75 Stealth 9SG i7-9750H, GeForce RTX 2080 Max-Q | Schenker XMG Neo 17 i7-8750H, GeForce RTX 2070 Mobile | Dell G7 17 7790 i7-8750H, GeForce RTX 2070 Max-Q | Alienware m17 P37E i9-8950HK, GeForce RTX 2080 Max-Q | Asus Zephyrus S GX701GX i7-8750H, GeForce RTX 2080 Max-Q | Lenovo Legion Y740-17ICH i7-8750H, GeForce RTX 2080 Max-Q | Gemiddelde van klas Gaming | |
|---|---|---|---|---|---|---|---|
| Heat | 11% | 1% | 2% | 11% | 13% | 9% | |
| Maximum Upper Side * (°C) | 55 | 47 15% | 46.6 15% | 55 -0% | 53 4% | 38.6 30% | 45.1 ? 18% |
| Maximum Bottom * (°C) | 65 | 56 14% | 57 12% | 60 8% | 50 23% | 43.6 33% | 48.1 ? 26% |
| Idle Upper Side * (°C) | 30 | 28 7% | 34.4 -15% | 30.4 -1% | 27 10% | 30.2 -1% | 31 ? -3% |
| Idle Bottom * (°C) | 32 | 30 6% | 34.6 -8% | 31.8 1% | 30 6% | 35 -9% | 34.2 ? -7% |
* ... kleiner is beter
MSI GS75 Stealth 9SG audioanalyse
(±) | luidspreker luidheid is gemiddeld maar goed (81 dB)
Bas 100 - 315 Hz
(-) | bijna geen lage tonen - gemiddeld 28.4% lager dan de mediaan
(±) | lineariteit van de lage tonen is gemiddeld (7.8% delta ten opzichte van de vorige frequentie)
Midden 400 - 2000 Hz
(±) | lagere middens - gemiddeld 5.8% lager dan de mediaan
(±) | lineariteit van de middentonen is gemiddeld (10% delta ten opzichte van de vorige frequentie)
Hoog 2 - 16 kHz
(+) | evenwichtige hoogtepunten - slechts 2.3% verwijderd van de mediaan
(+) | de hoge tonen zijn lineair (3.9% delta naar de vorige frequentie)
Algemeen 100 - 16.000 Hz
(±) | lineariteit van het totale geluid is gemiddeld (23.2% verschil met de mediaan)
Vergeleken met dezelfde klasse
» 84% van alle geteste apparaten in deze klasse waren beter, 4% vergelijkbaar, 11% slechter
» De beste had een delta van 6%, het gemiddelde was 18%, de slechtste was 132%
Vergeleken met alle geteste toestellen
» 70% van alle geteste apparaten waren beter, 5% gelijk, 25% slechter
» De beste had een delta van 4%, het gemiddelde was 23%, de slechtste was 134%
MSI GE75 9SG audioanalyse
(+) | luidsprekers kunnen relatief luid spelen (92.8 dB)
Bas 100 - 315 Hz
(±) | verminderde zeebaars - gemiddeld 12.2% lager dan de mediaan
(±) | lineariteit van de lage tonen is gemiddeld (8.7% delta ten opzichte van de vorige frequentie)
Midden 400 - 2000 Hz
(±) | hogere middens - gemiddeld 6.7% hoger dan de mediaan
(±) | lineariteit van de middentonen is gemiddeld (11.5% delta ten opzichte van de vorige frequentie)
Hoog 2 - 16 kHz
(+) | evenwichtige hoogtepunten - slechts 2.9% verwijderd van de mediaan
(±) | lineariteit van de hoogtepunten is gemiddeld (7.6% delta ten opzichte van de vorige frequentie)
Algemeen 100 - 16.000 Hz
(±) | lineariteit van het totale geluid is gemiddeld (16.5% verschil met de mediaan)
Vergeleken met dezelfde klasse
» 42% van alle geteste apparaten in deze klasse waren beter, 7% vergelijkbaar, 51% slechter
» De beste had een delta van 6%, het gemiddelde was 18%, de slechtste was 132%
Vergeleken met alle geteste toestellen
» 28% van alle geteste apparaten waren beter, 6% gelijk, 66% slechter
» De beste had een delta van 4%, het gemiddelde was 23%, de slechtste was 134%
| Uit / Standby | |
| Inactief | |
| Belasting |
|
Key:
min: | |
| MSI GS75 Stealth 9SG i7-9750H, GeForce RTX 2080 Max-Q | Schenker XMG Neo 17 i7-8750H, GeForce RTX 2070 Mobile | Dell G7 17 7790 i7-8750H, GeForce RTX 2070 Max-Q | Alienware m17 P37E i9-8950HK, GeForce RTX 2080 Max-Q | Asus Zephyrus S GX701GX i7-8750H, GeForce RTX 2080 Max-Q | Lenovo Legion Y740-17ICH i7-8750H, GeForce RTX 2080 Max-Q | Gemiddelde van klas Gaming | |
|---|---|---|---|---|---|---|---|
| Power Consumption | 5% | 10% | -36% | -16% | -15% | -7% | |
| Idle Minimum * (Watt) | 13 | 13 -0% | 9.5 27% | 21.2 -63% | 19 -46% | 20.2 -55% | 13.1 ? -1% |
| Idle Average * (Watt) | 17 | 16 6% | 16.2 5% | 29.6 -74% | 22 -29% | 27.2 -60% | 19 ? -12% |
| Idle Maximum * (Watt) | 25 | 21 16% | 23.8 5% | 34 -36% | 30 -20% | 28.7 -15% | 24.6 ? 2% |
| Load Average * (Watt) | 96 | 96 -0% | 101.7 -6% | 130.9 -36% | 104 -8% | 90.8 5% | 111.3 ? -16% |
| Witcher 3 ultra * (Watt) | 156 | 172 -10% | 155 1% | 177.5 -14% | 167 -7% | 152.1 2% | |
| Load Maximum * (Watt) | 239 | 191 20% | 172.2 28% | 219.7 8% | 203 15% | 165.4 31% | 260 ? -9% |
* ... kleiner is beter
| MSI GS75 Stealth 9SG i7-9750H, GeForce RTX 2080 Max-Q, 80.25 Wh | Schenker XMG Neo 17 i7-8750H, GeForce RTX 2070 Mobile, 46.74 Wh | Dell G7 17 7790 i7-8750H, GeForce RTX 2070 Max-Q, 60 Wh | Alienware m17 P37E i9-8950HK, GeForce RTX 2080 Max-Q, 90 Wh | Asus Zephyrus S GX701GX i7-8750H, GeForce RTX 2080 Max-Q, 76 Wh | Lenovo Legion Y740-17ICH i7-8750H, GeForce RTX 2080 Max-Q, 76 Wh | Gemiddelde van klas Gaming | |
|---|---|---|---|---|---|---|---|
| Batterijduur | -31% | 14% | -11% | -32% | -47% | 17% | |
| Reader / Idle (h) | 7.7 | 5.3 -31% | 8.5 10% | 9.1 18% | 5 -35% | 7.84 ? 2% | |
| H.264 (h) | 6.8 | 8.27 ? 22% | |||||
| WiFi v1.3 (h) | 6 | 3.7 -38% | 3.9 -35% | 4.9 -18% | 3.8 -37% | 3.2 -47% | 7.08 ? 18% |
| Load (h) | 1.2 | 0.9 -25% | 2 67% | 0.8 -33% | 0.9 -25% | 1.496 ? 25% |
Pro
Contra
Dit is de verkorte versie van het originele artikel. Het volledige, Engelse testrapport vind je hier.
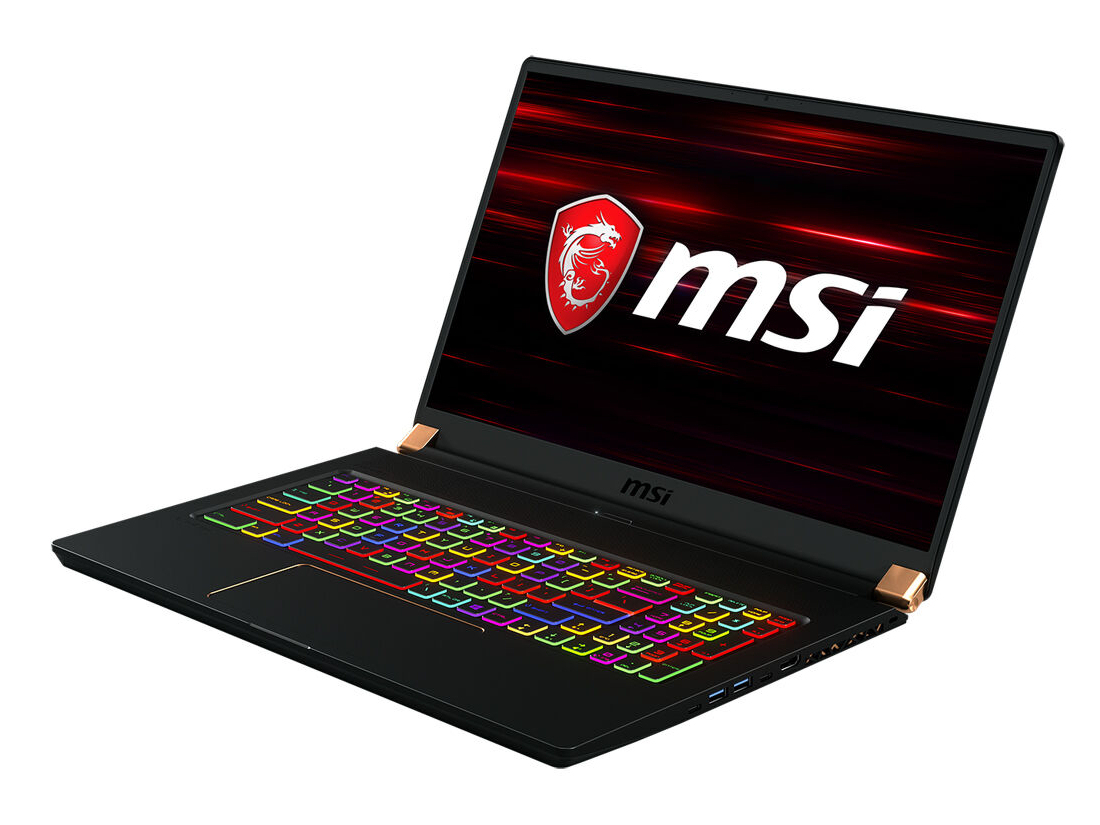
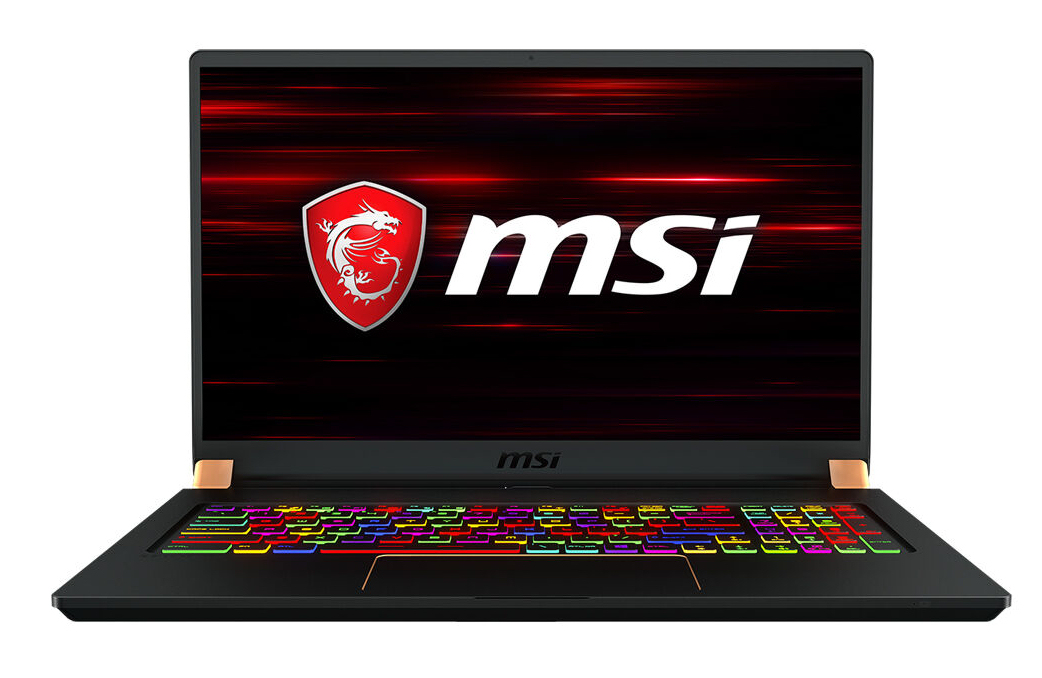
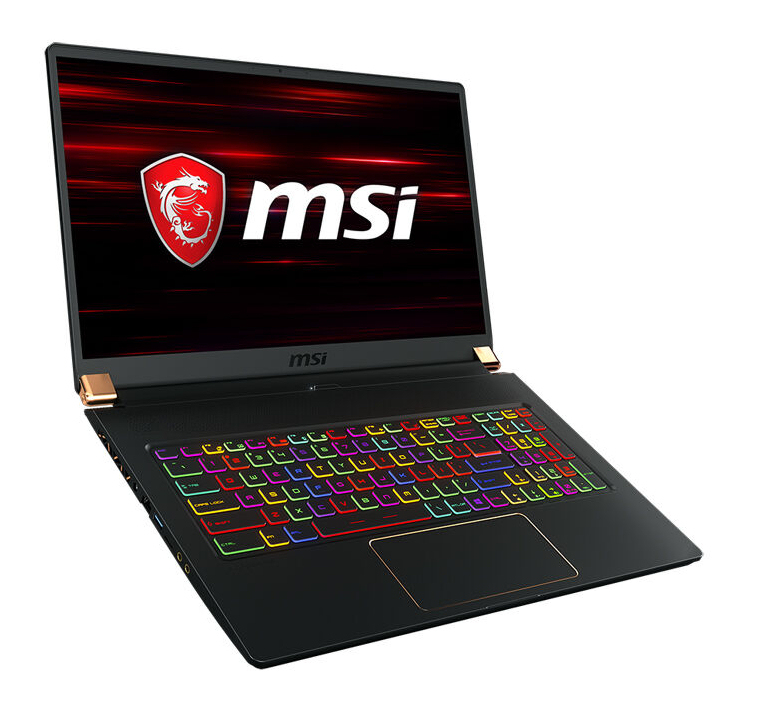
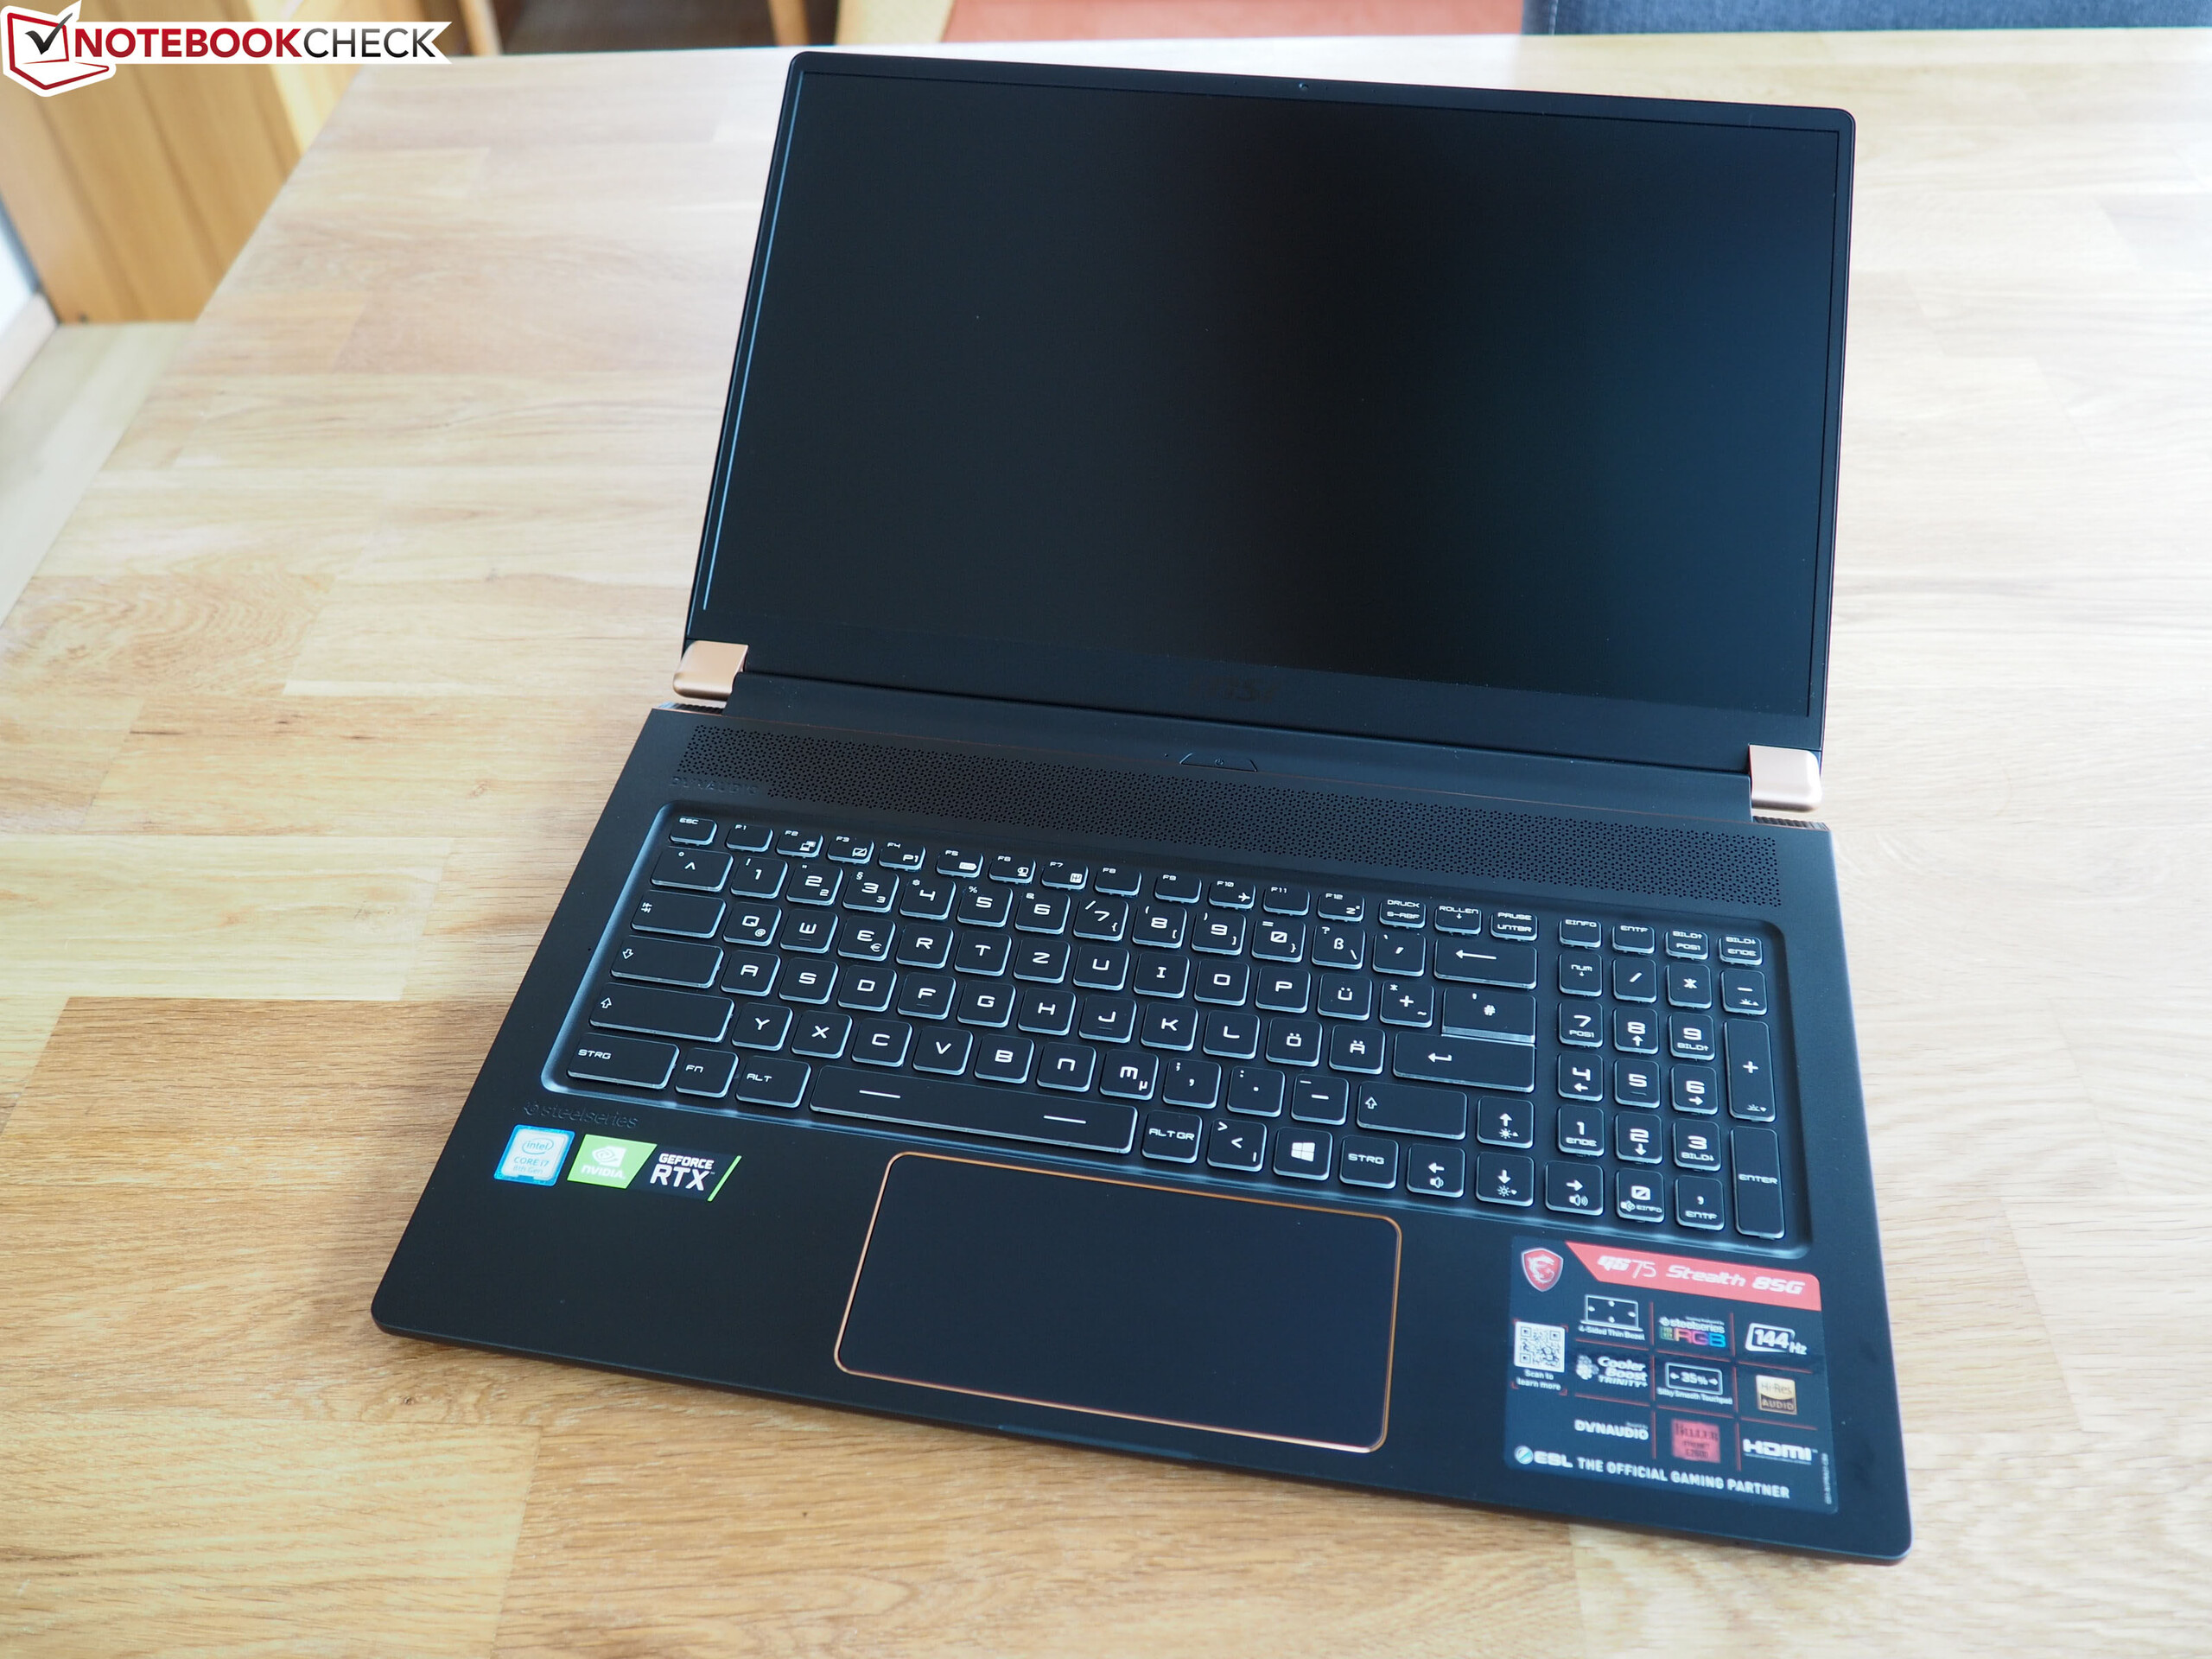
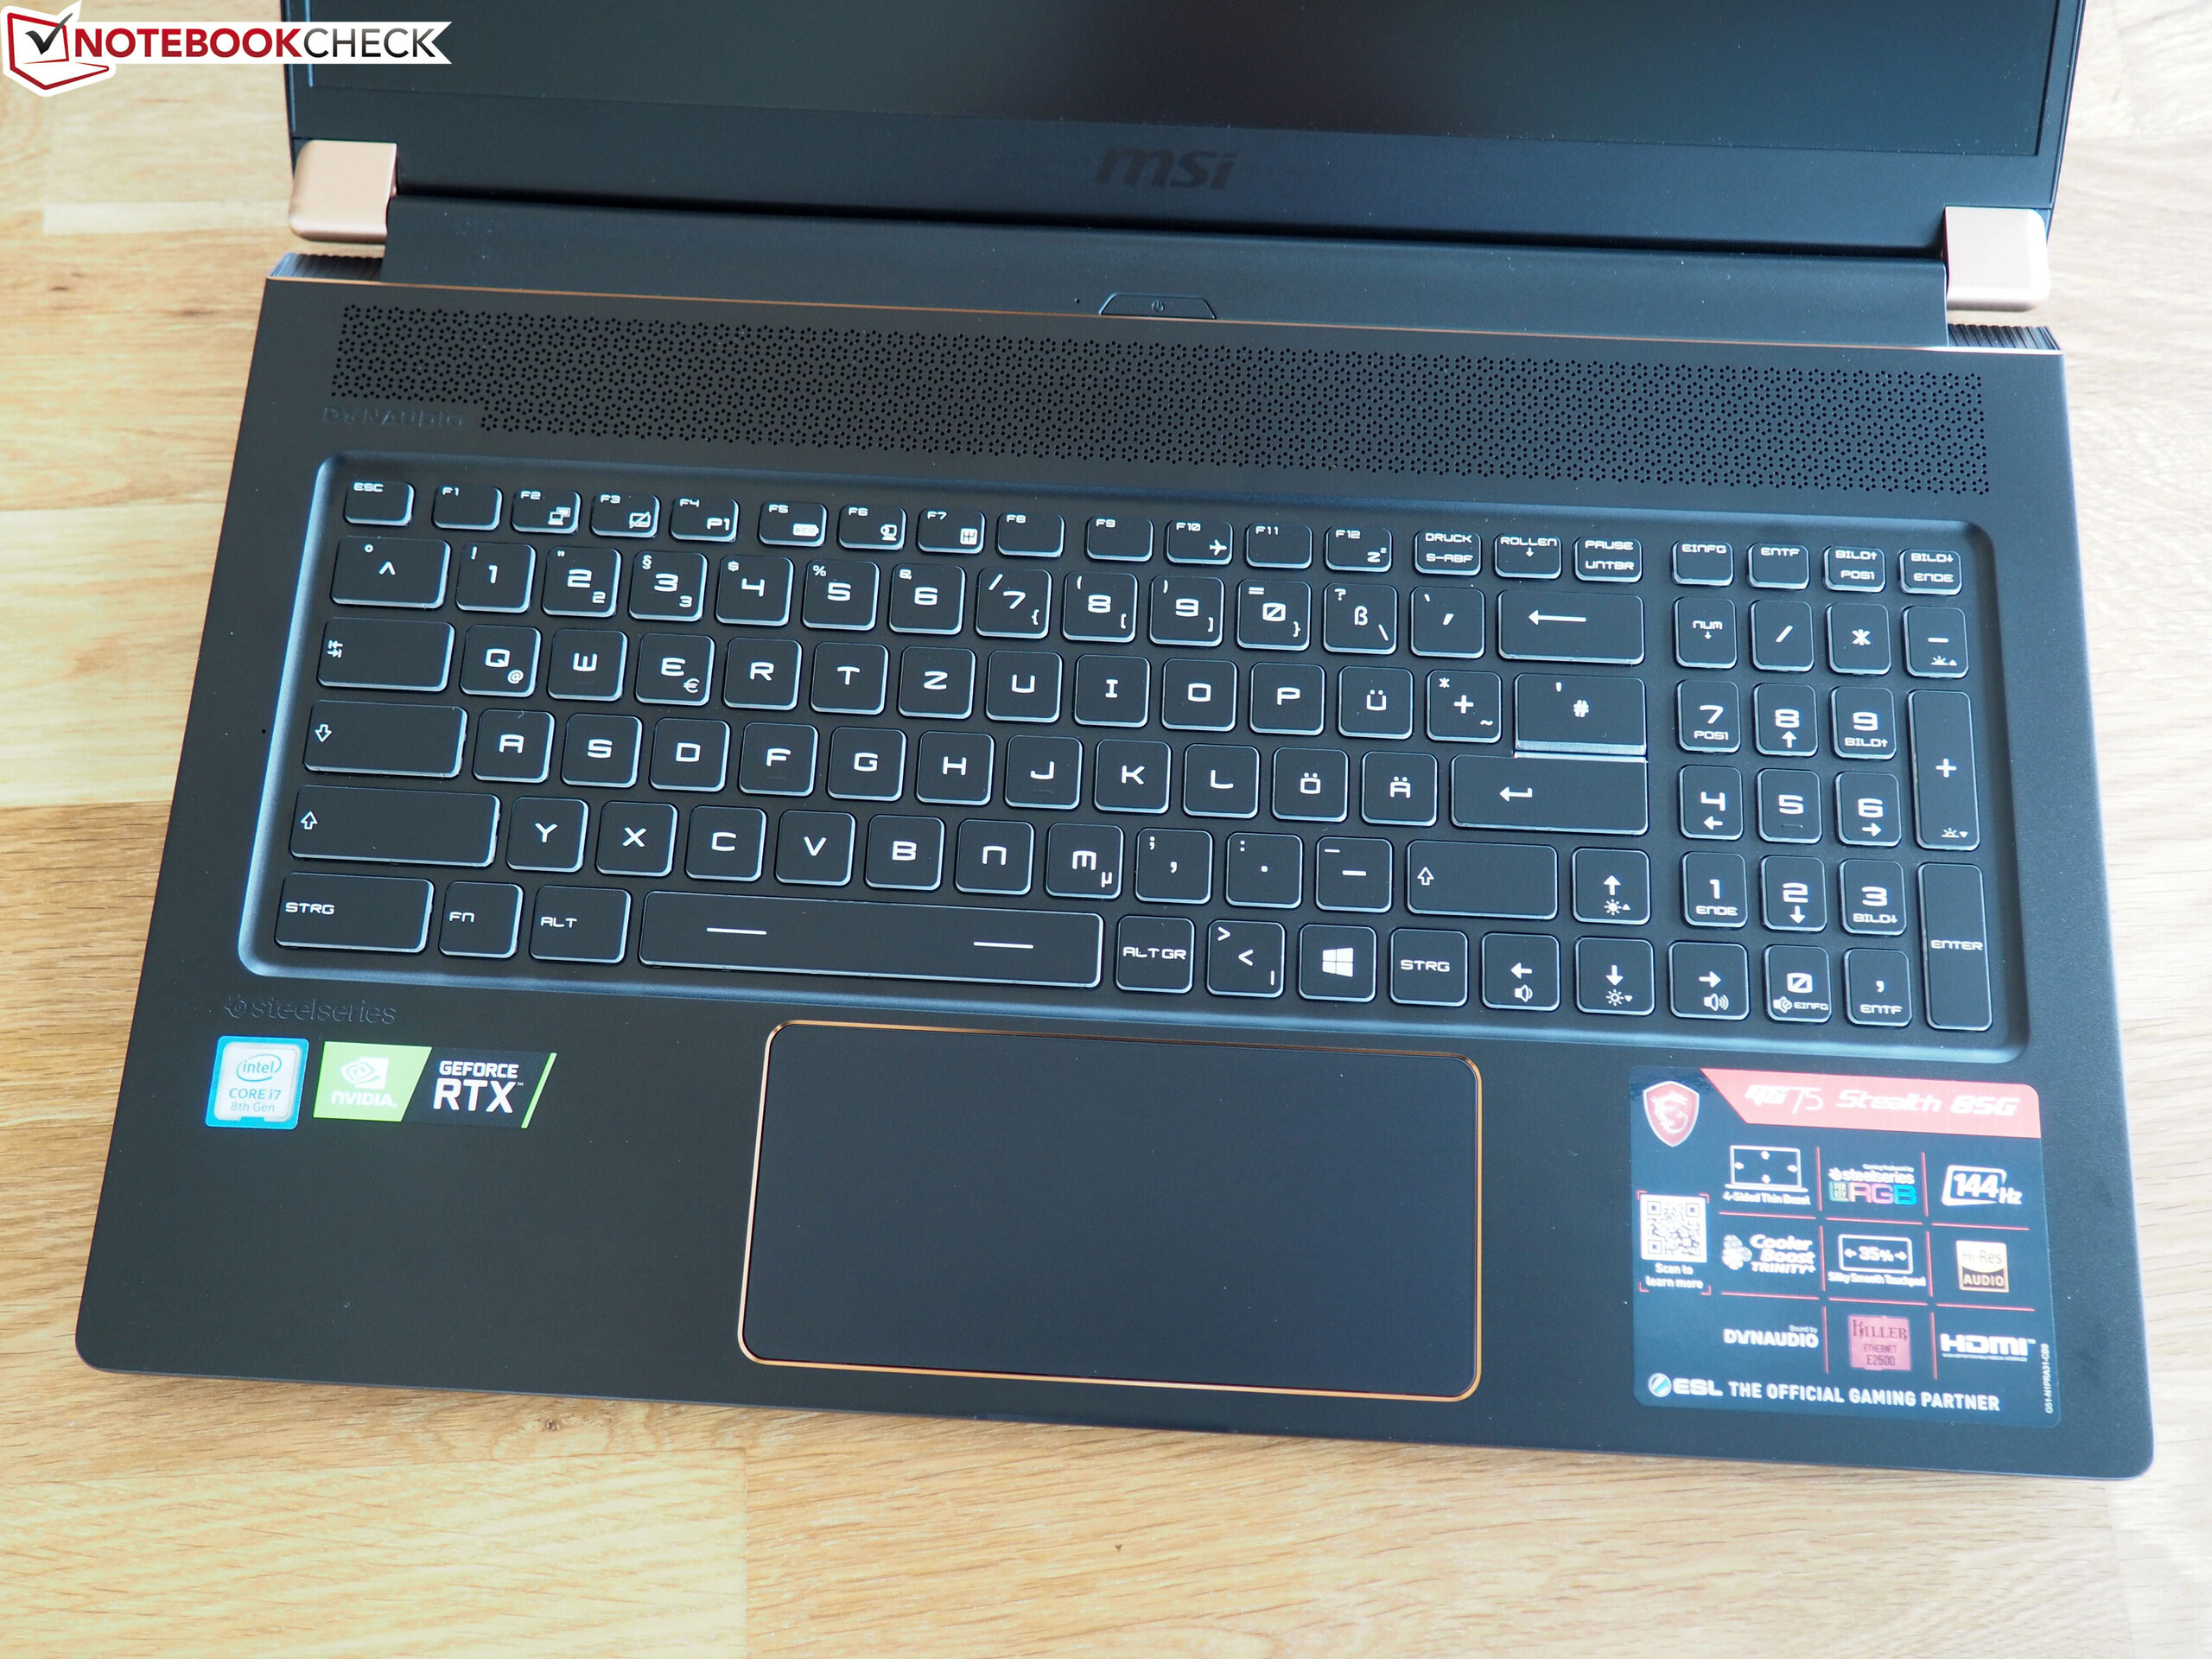
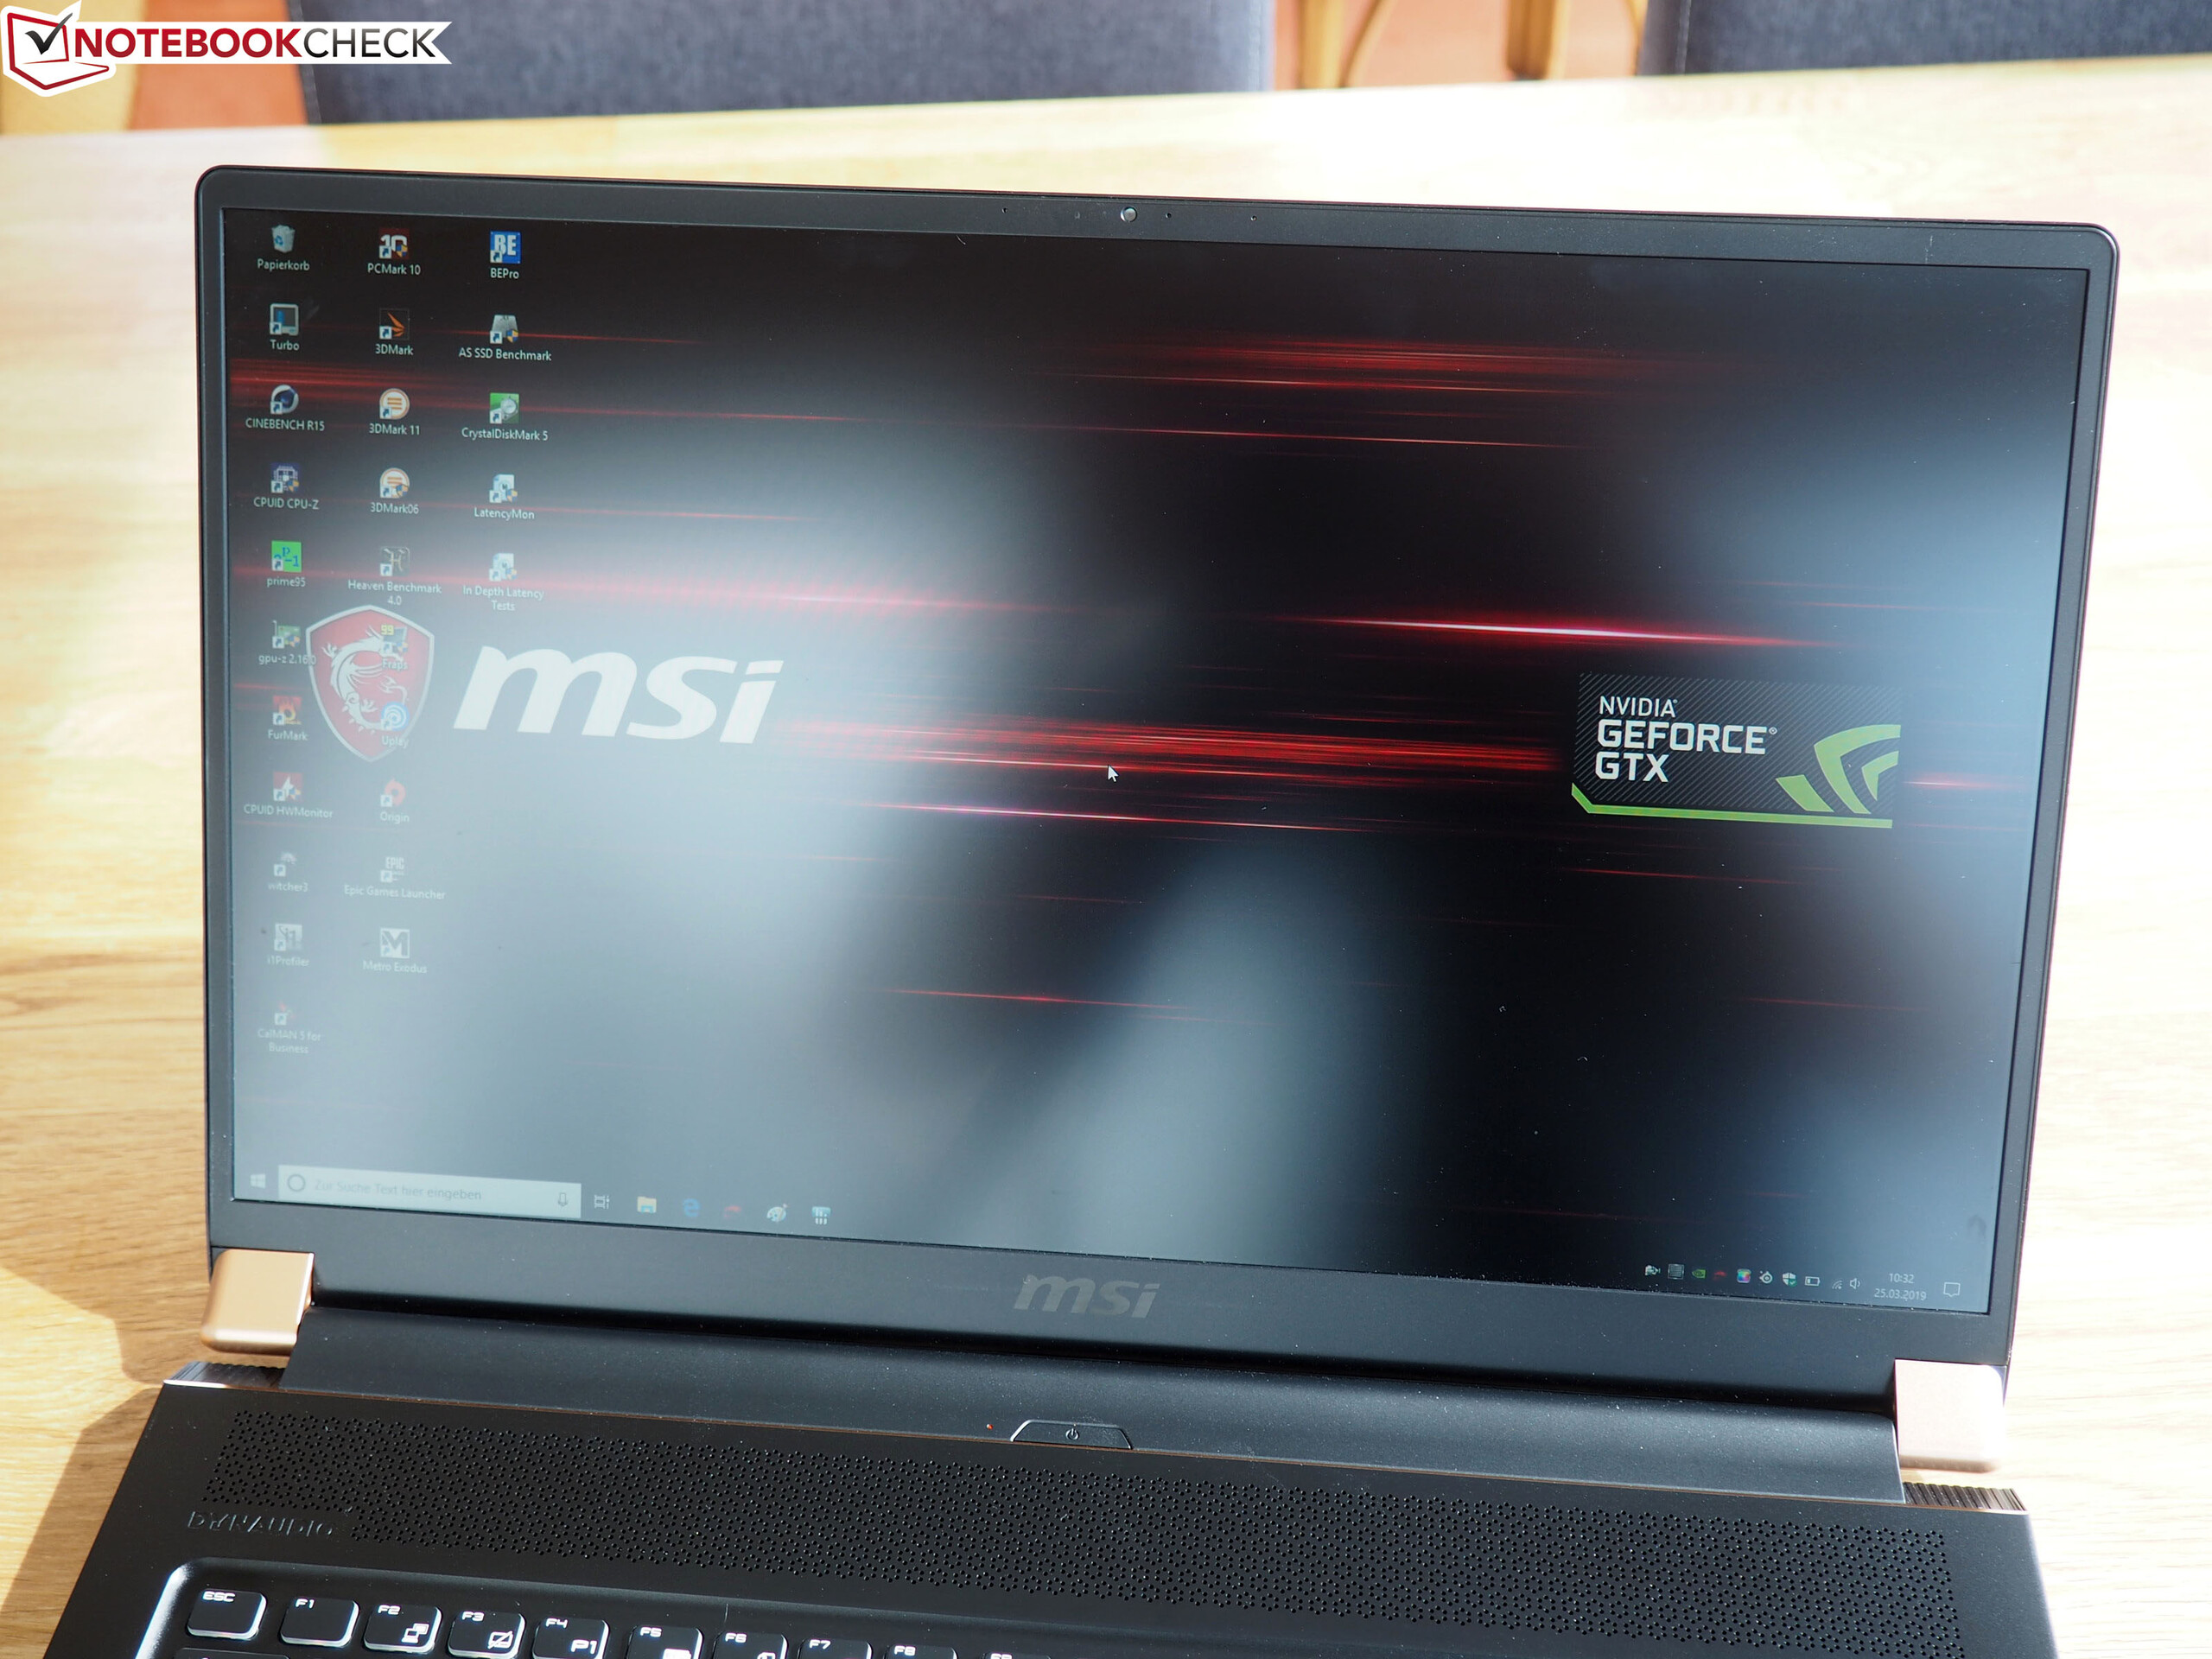
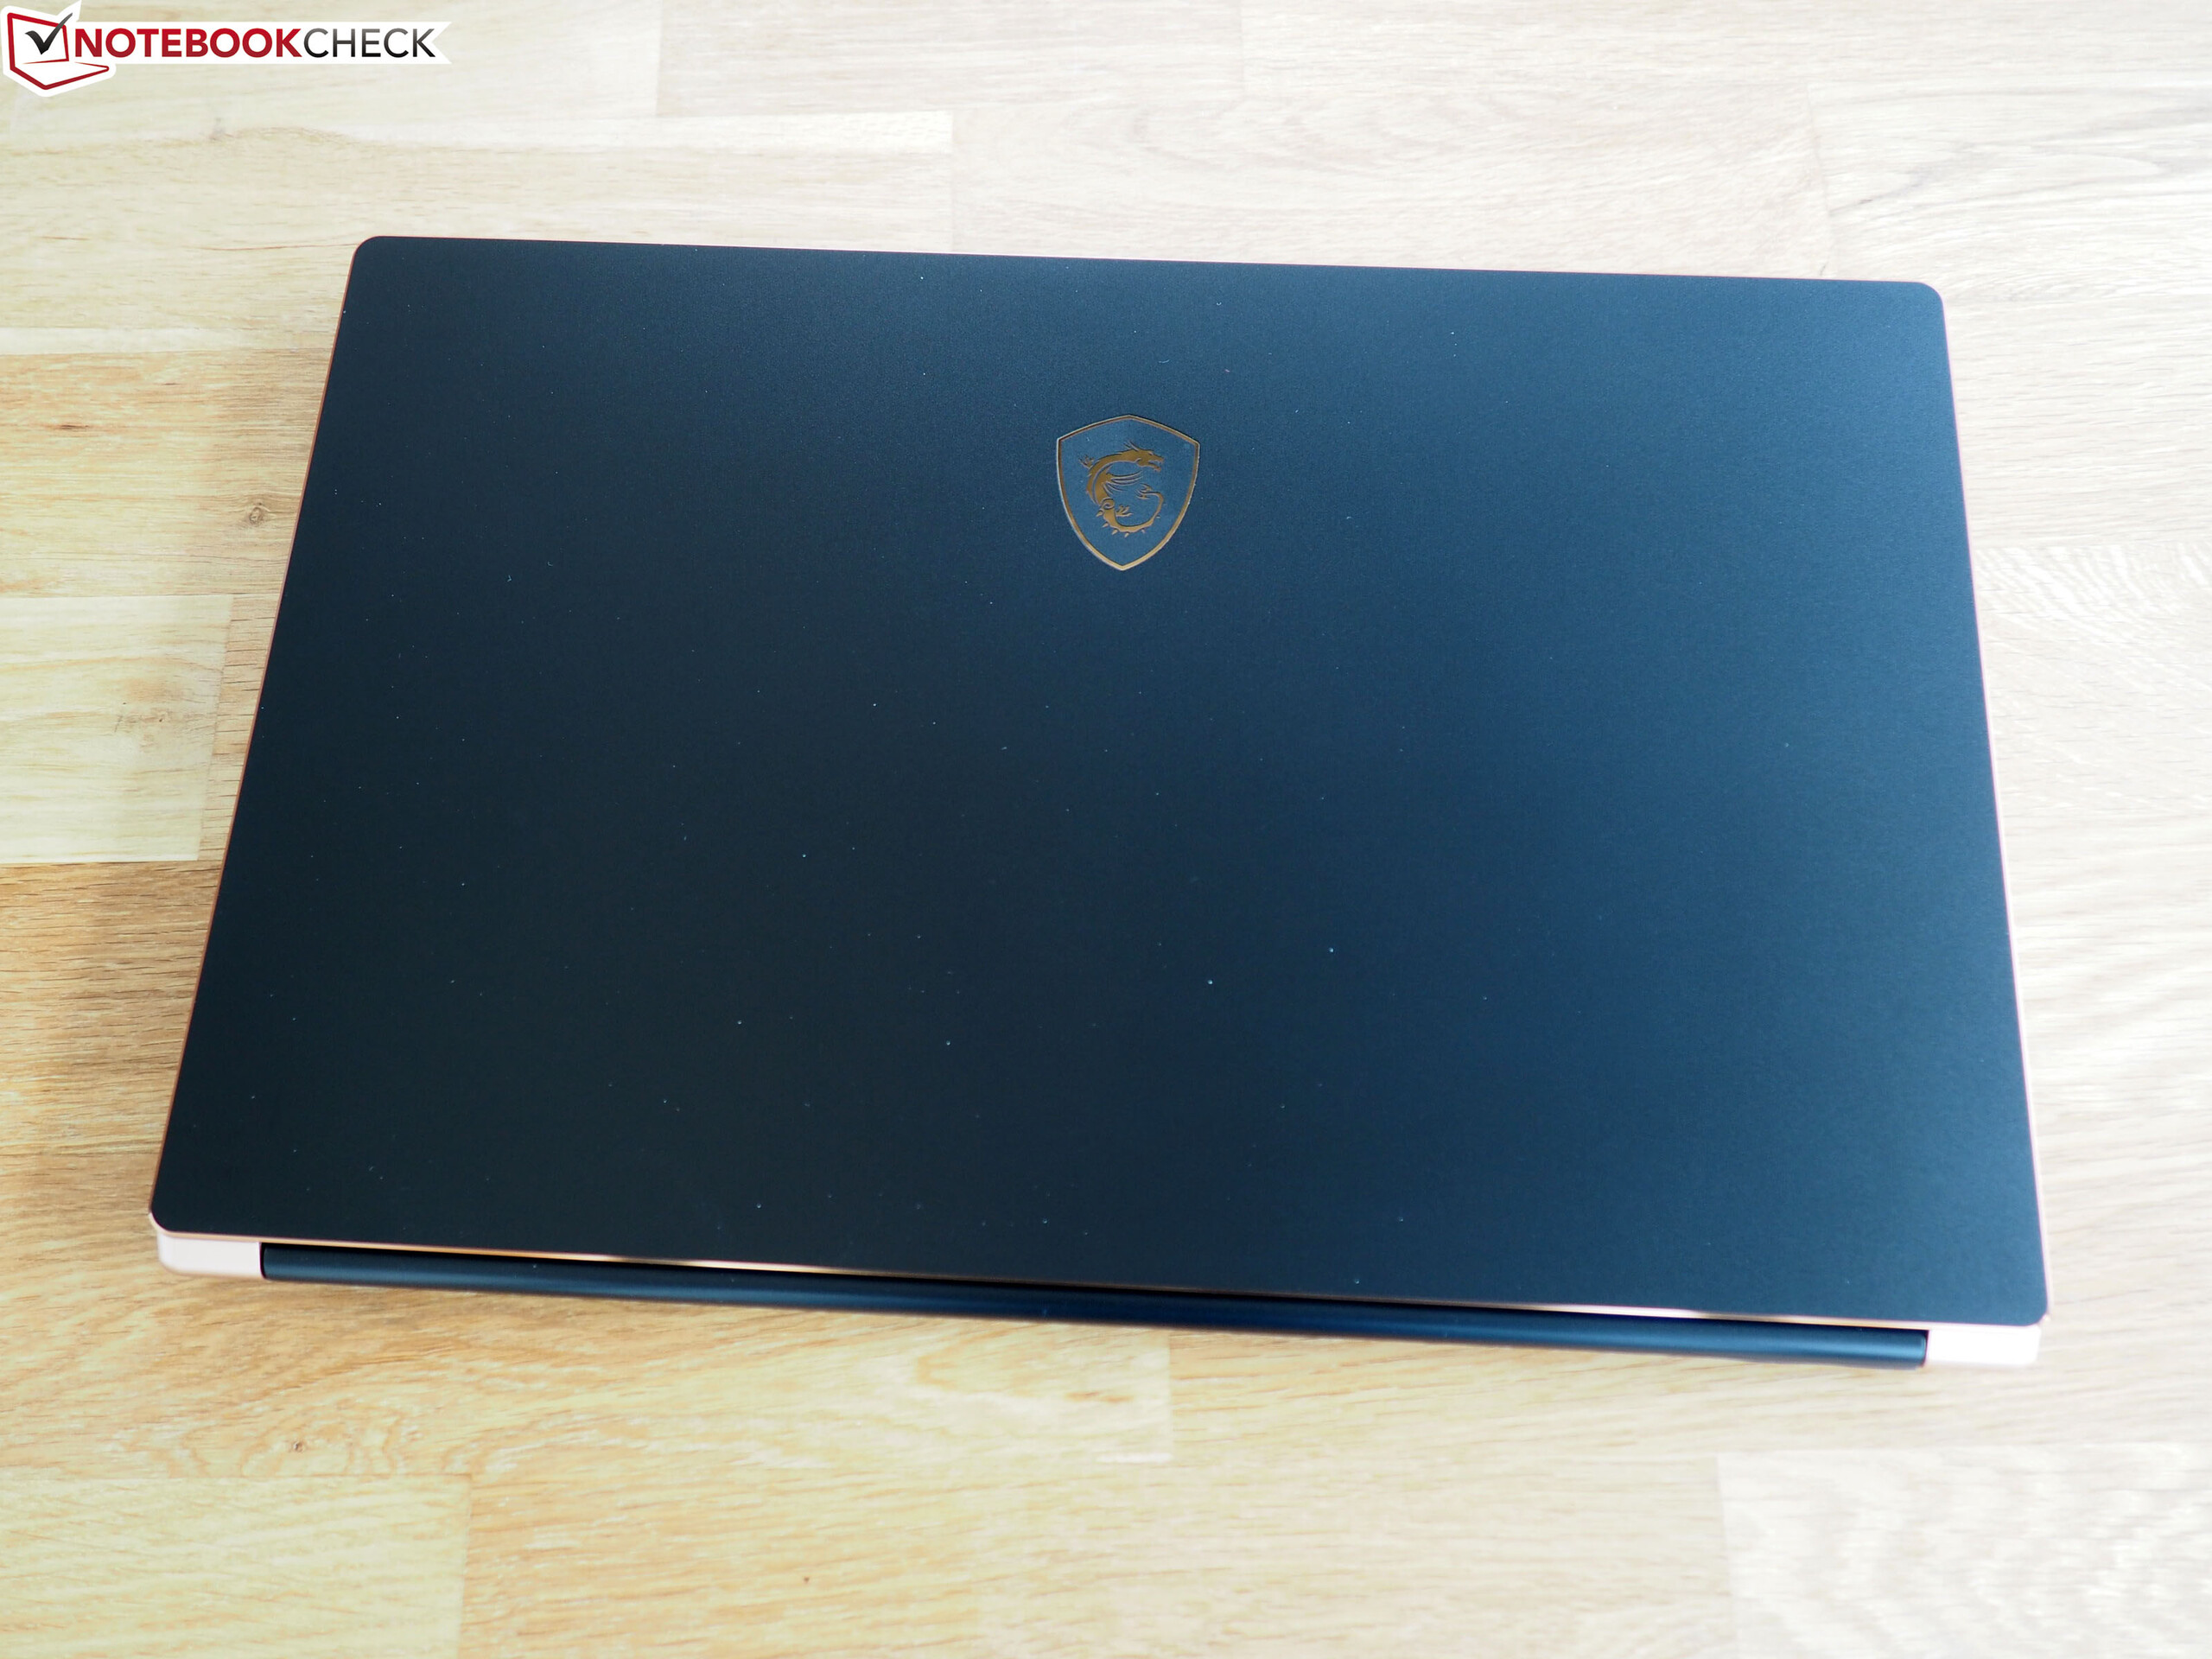
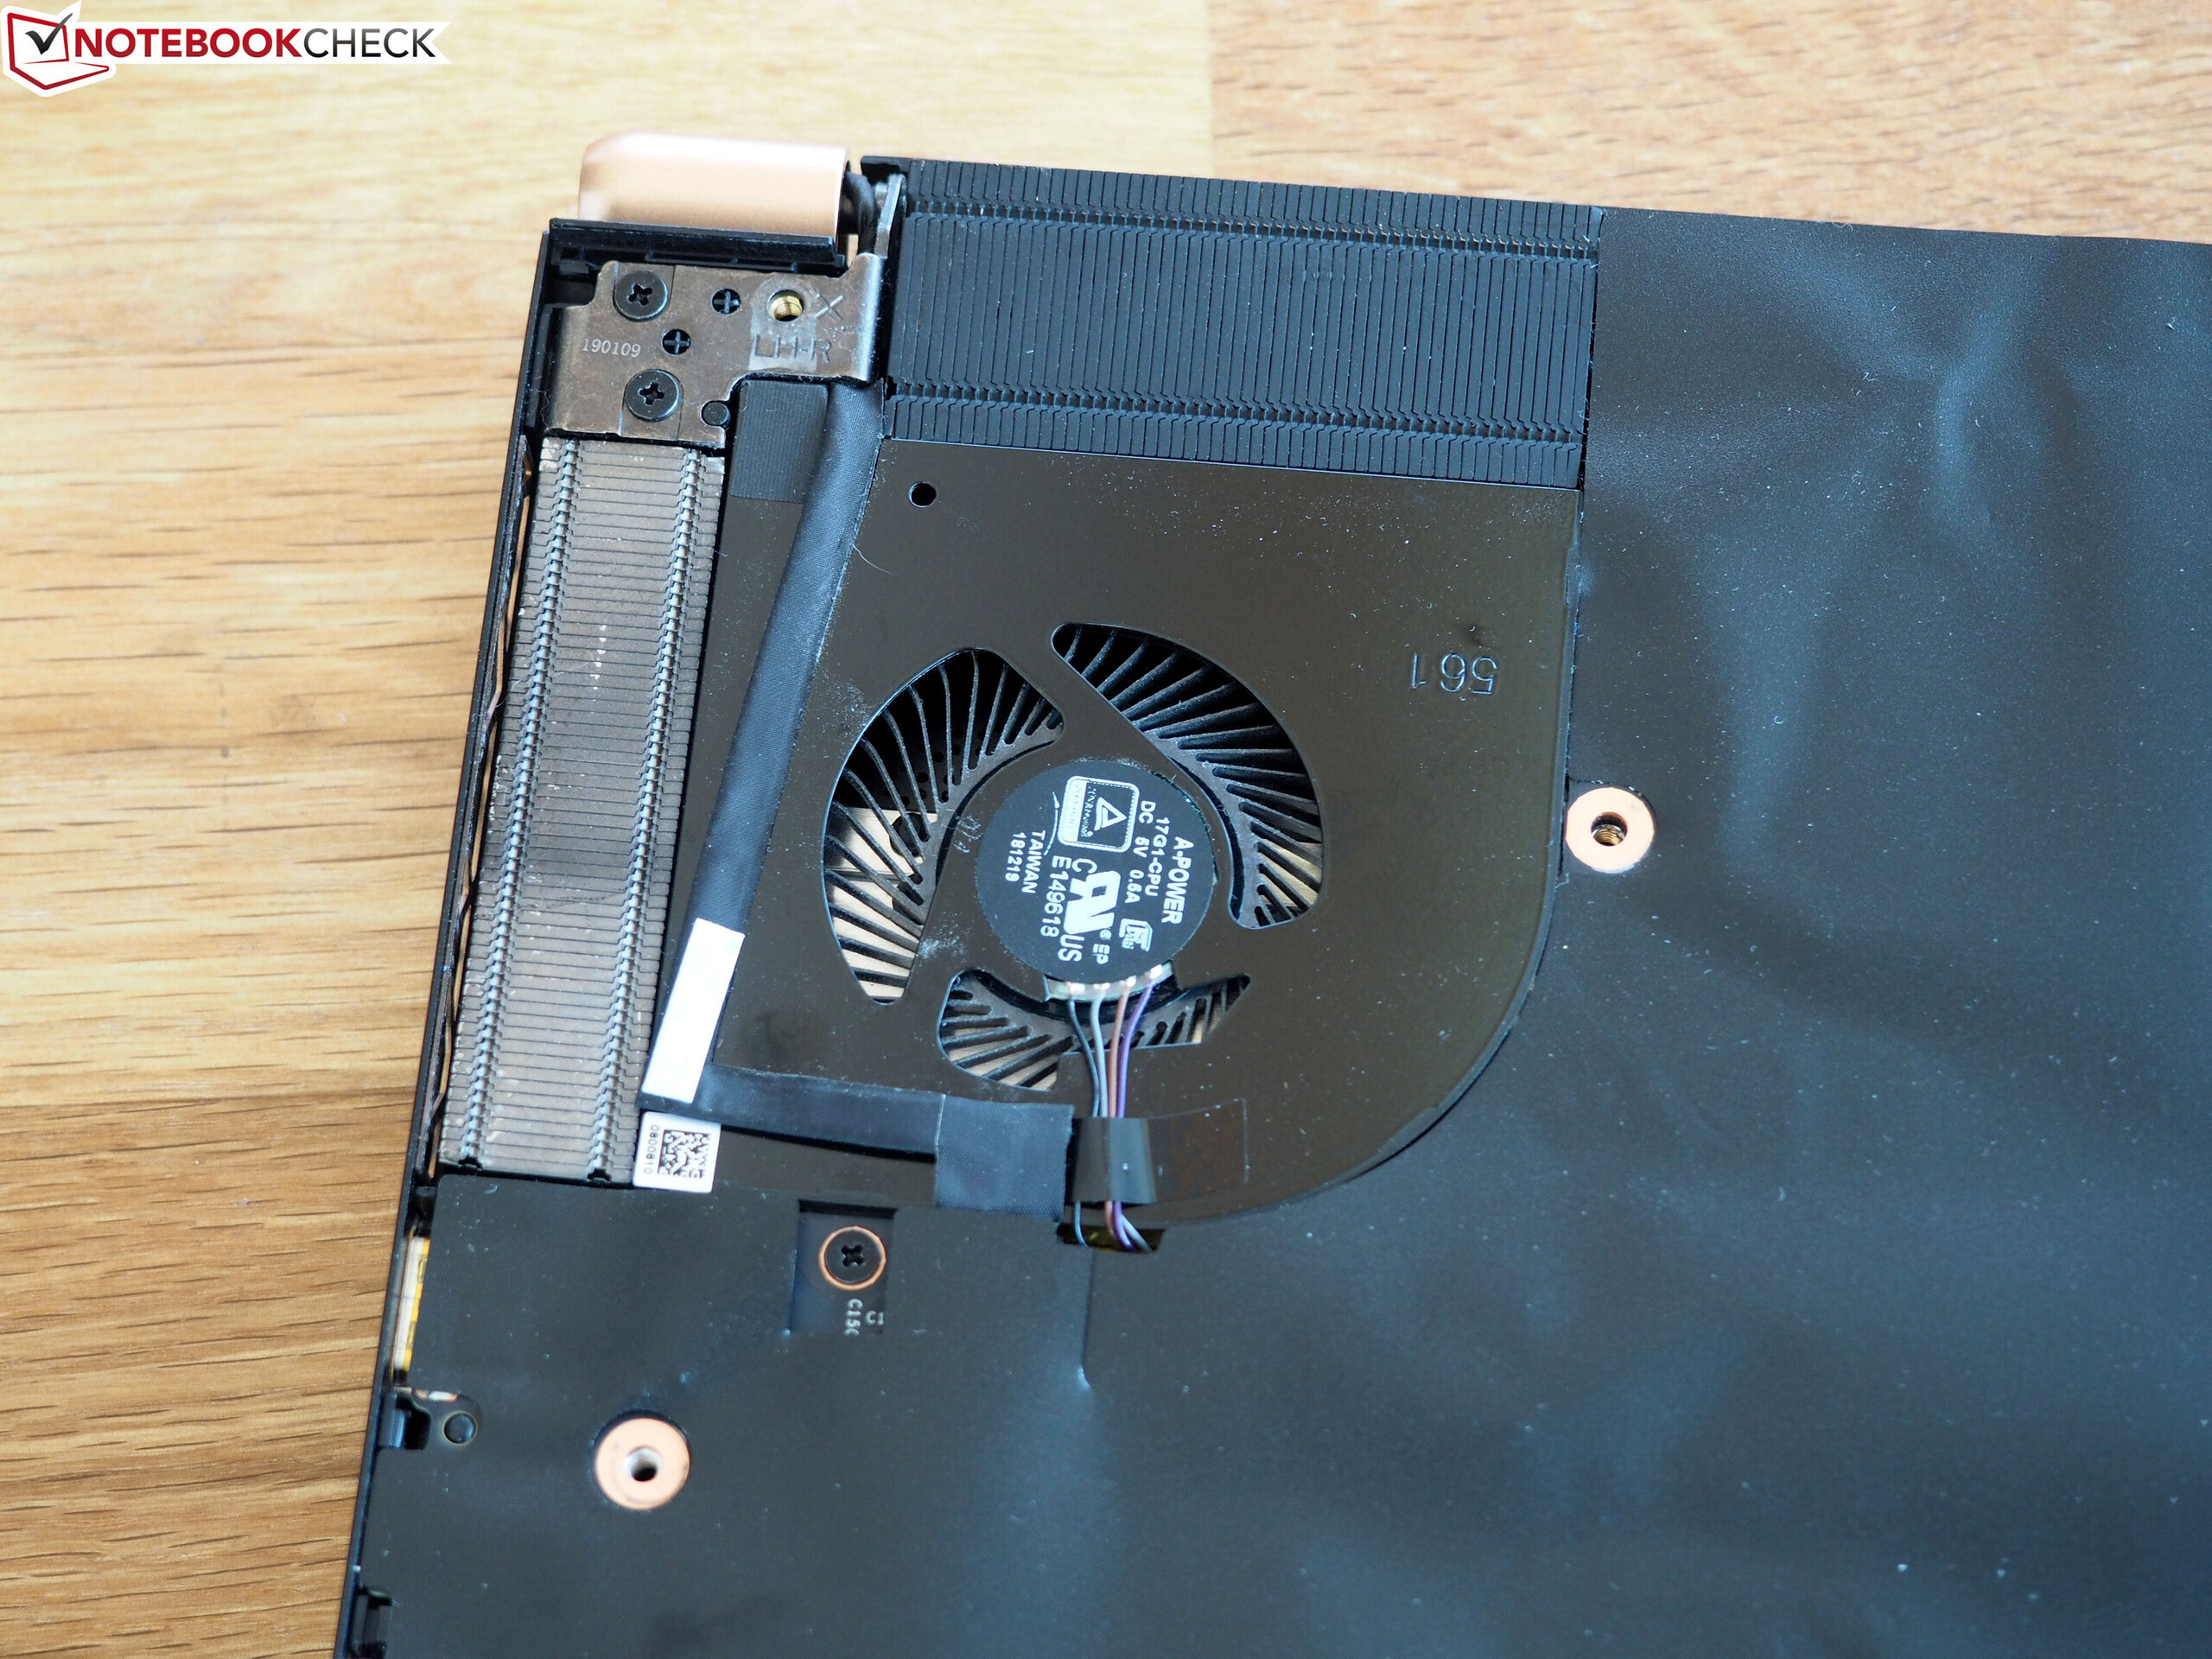
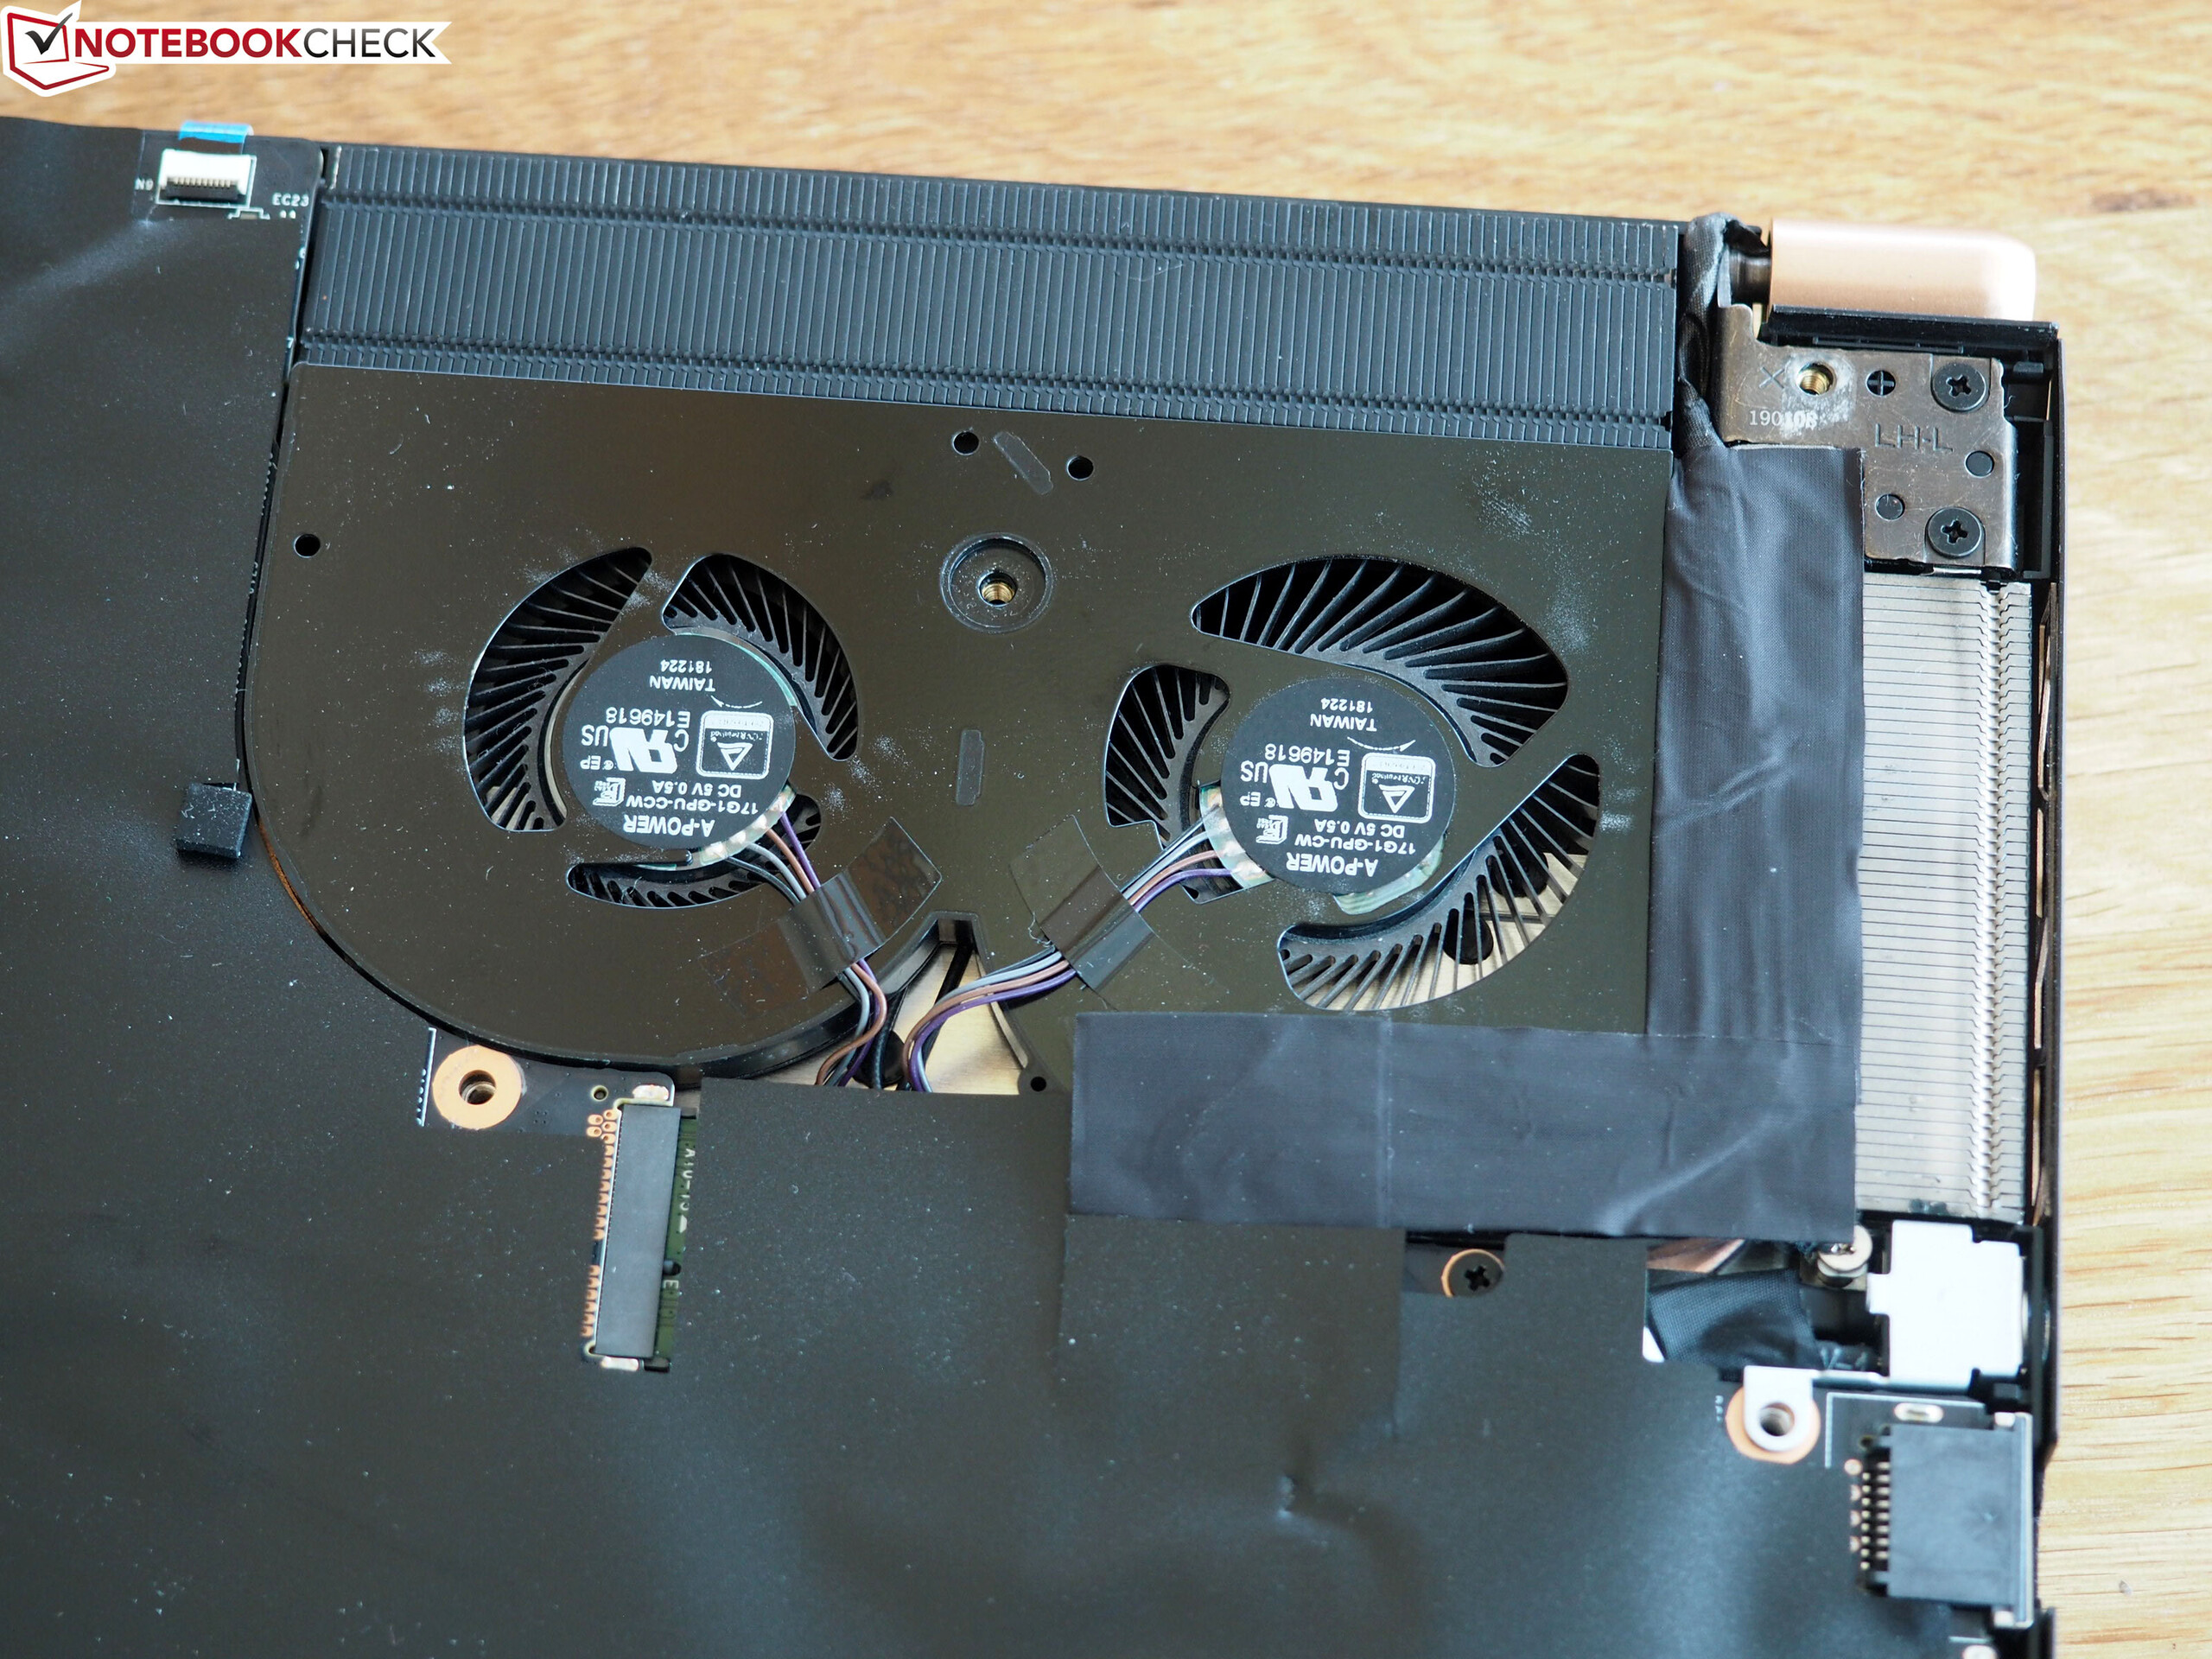
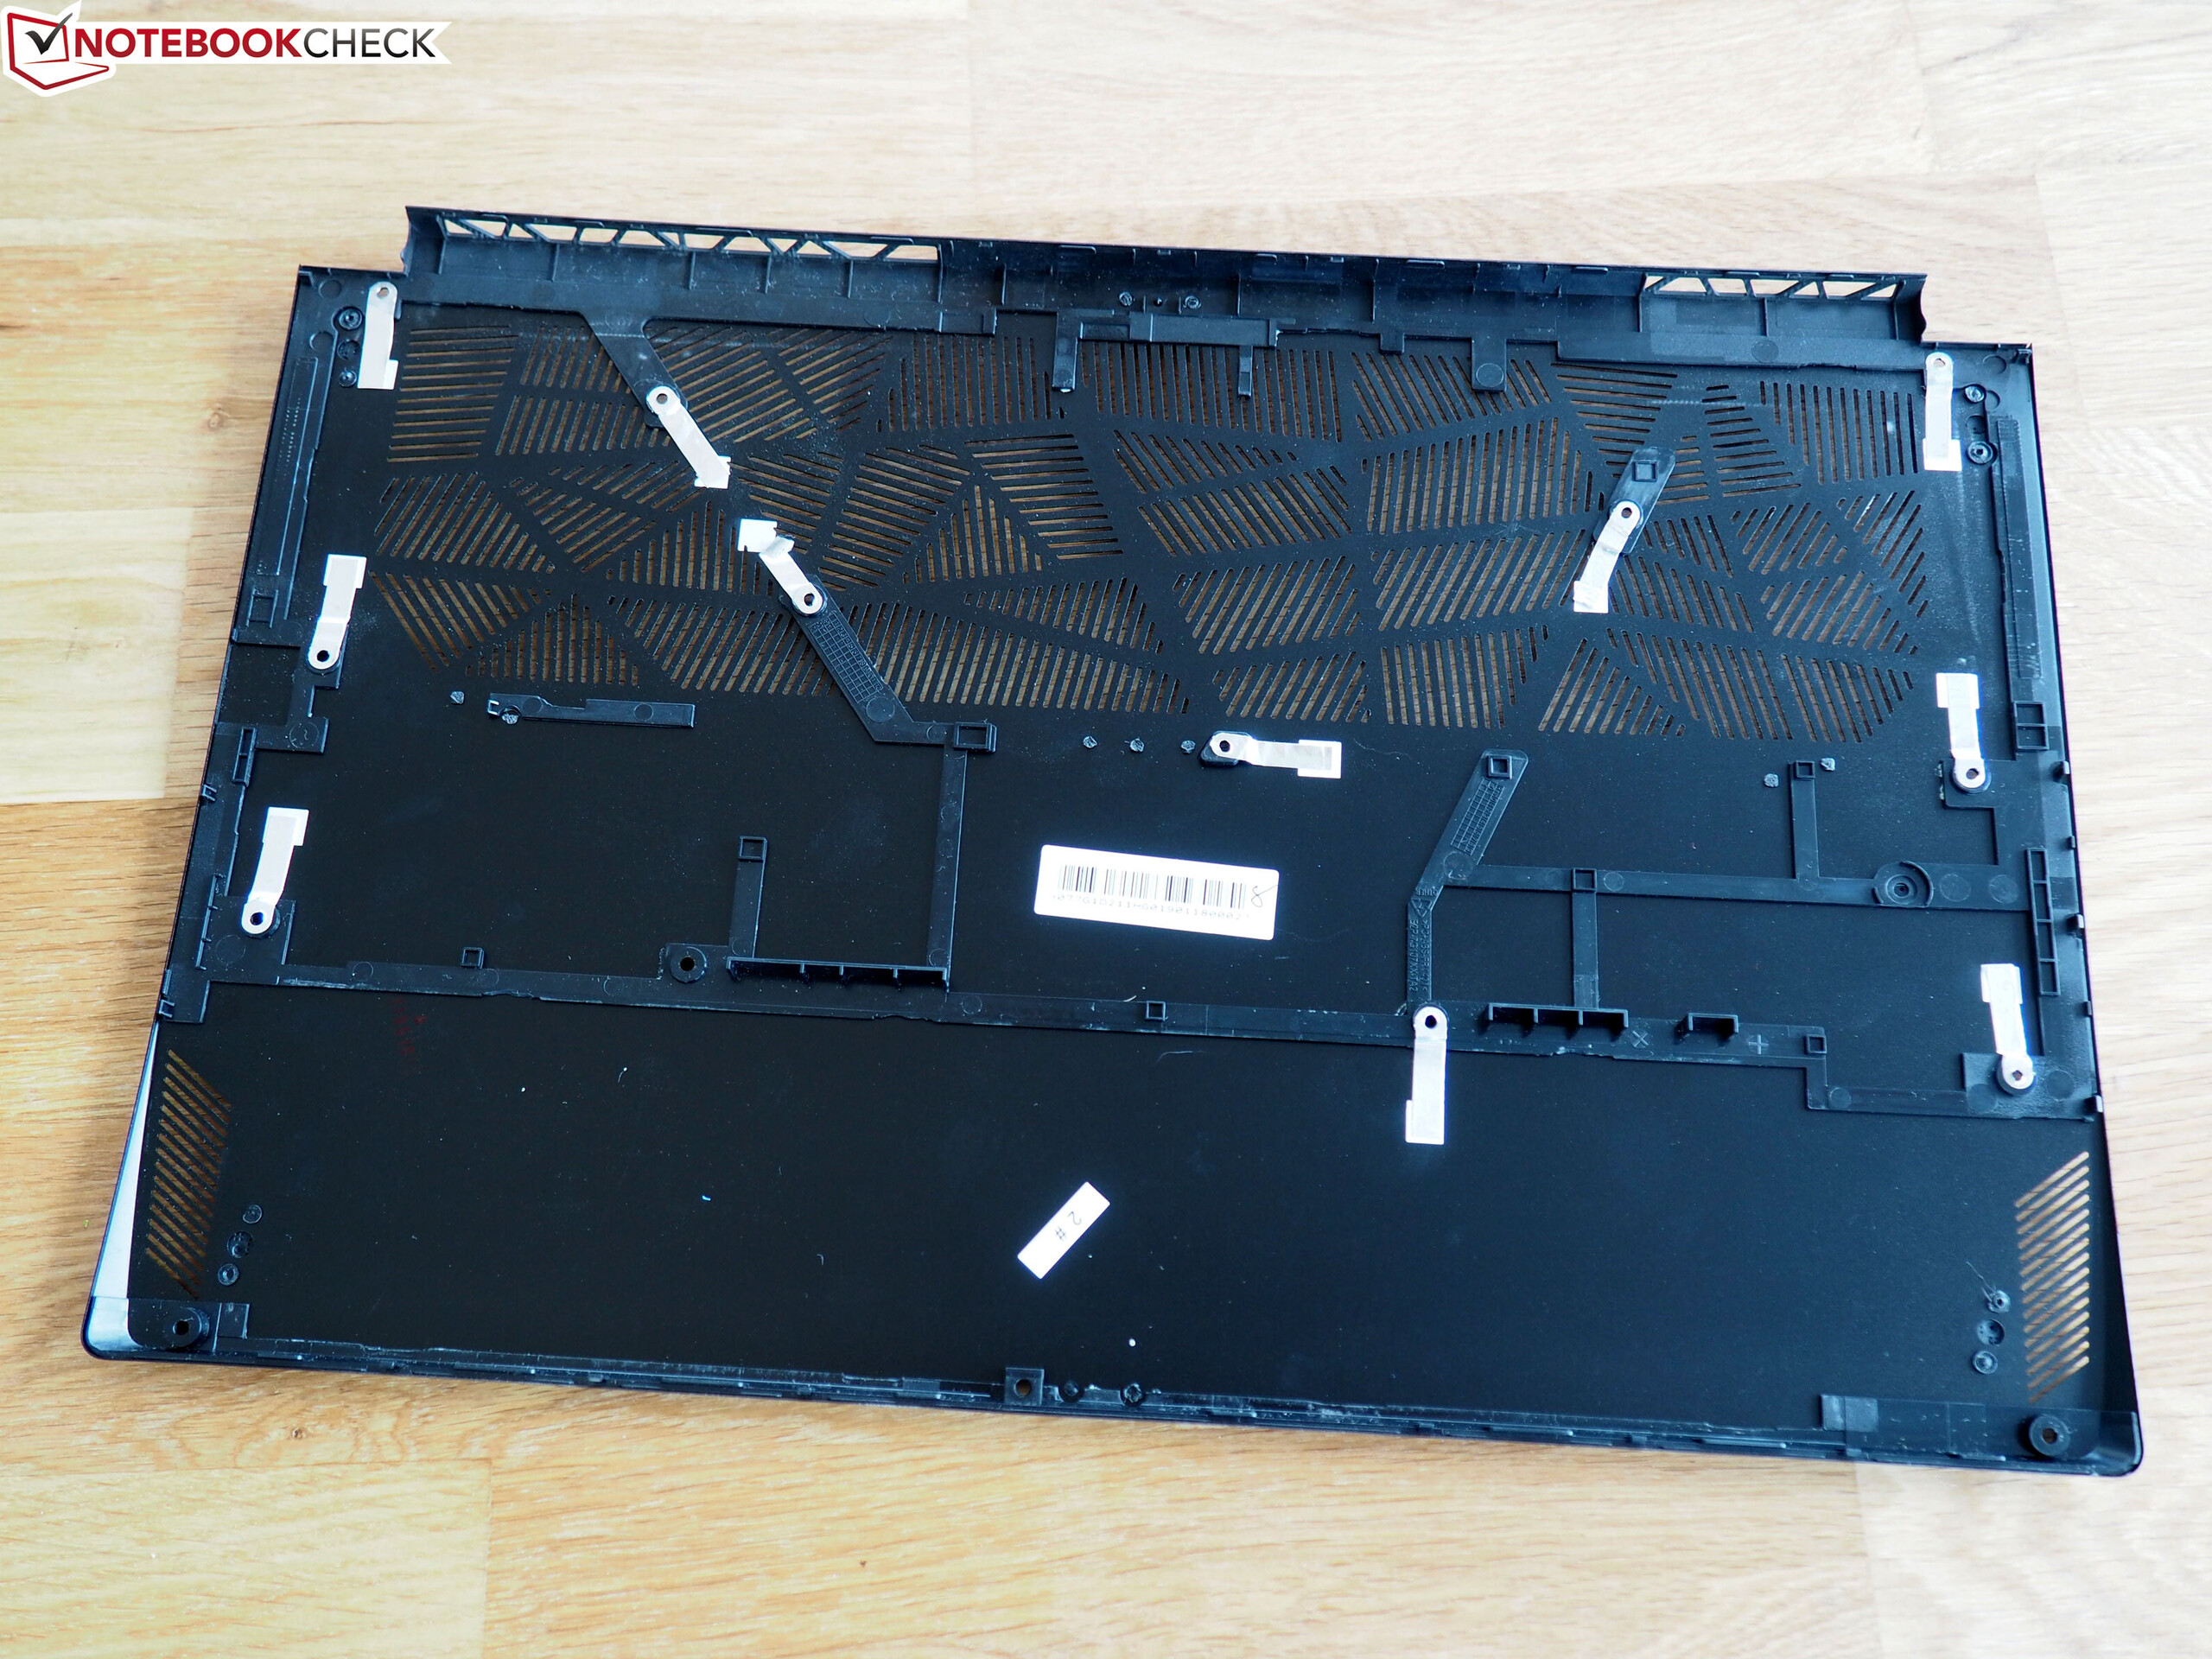
De MSI GS75 Stealth 9SG is een slanke 17.3-inch gaming-laptop die rake klappen kan uitdelen. Hoewel het toestel er stijlvol uitziet voor een gaming-machine, zou hij echter wel wat steviger mogen zijn. Hopelijk kan MSI dit oplossen in toekomstige modellen door de behuizing te versterken of anders te ontwerpen.
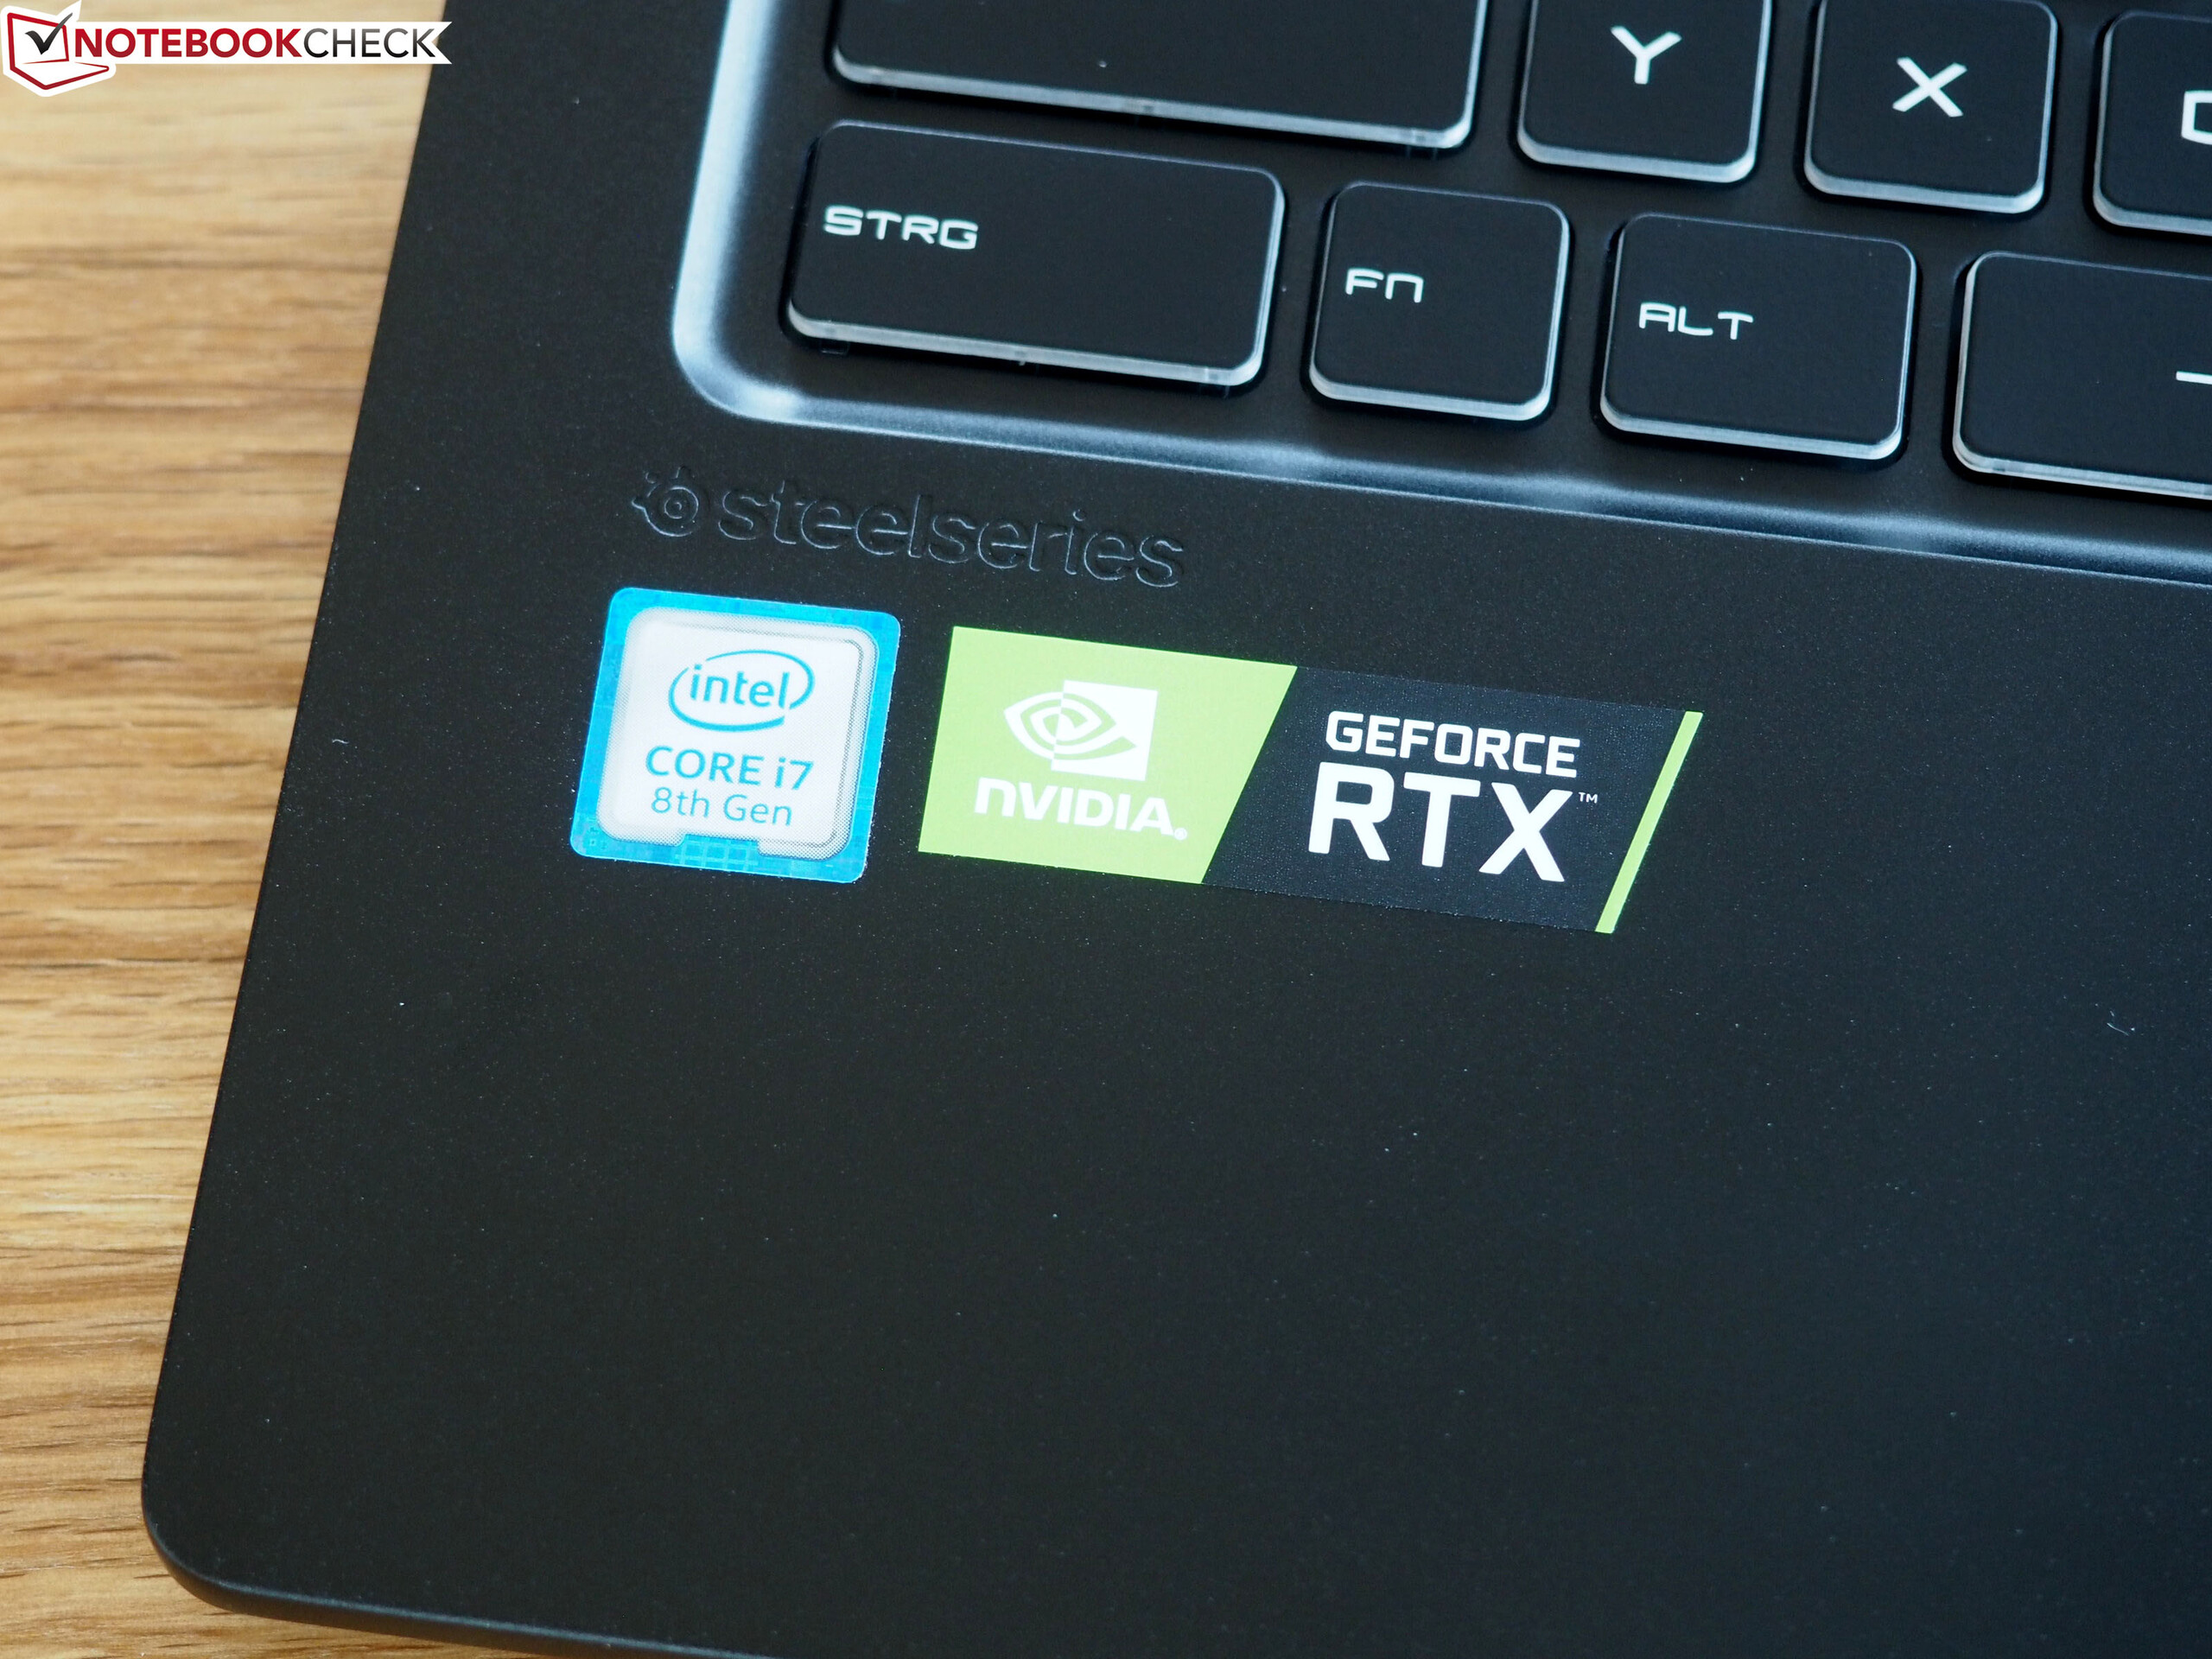
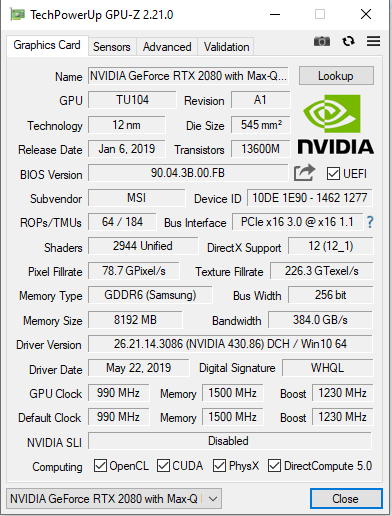
Intern zorgt de combinatie van de Core i7-9750H en GeForce RTX 2080 Max-Q voor uitstekende gaming-prestaties. Deze componenten laten de 9SG toe om de voordelen van zijn 144-Hz-scherm ten volle te benutten: de meeste moderne AAA-games halen gemiddeld rond 90 FPS met maximale grafische instellingen. Het scherm scoort uitstekend met zijn stabiele kijkhoeken, hoge helderheid, goed contrast, korte responstijden en accurate kleurweergave.
De MSI GS75 Stealth 9SG is een krachtige gaming-laptop waar de meest gamers blij mee zullen zijn. De onstabiele behuizing en hoge winkelprijs zijn echter redenen om elders te kijken.
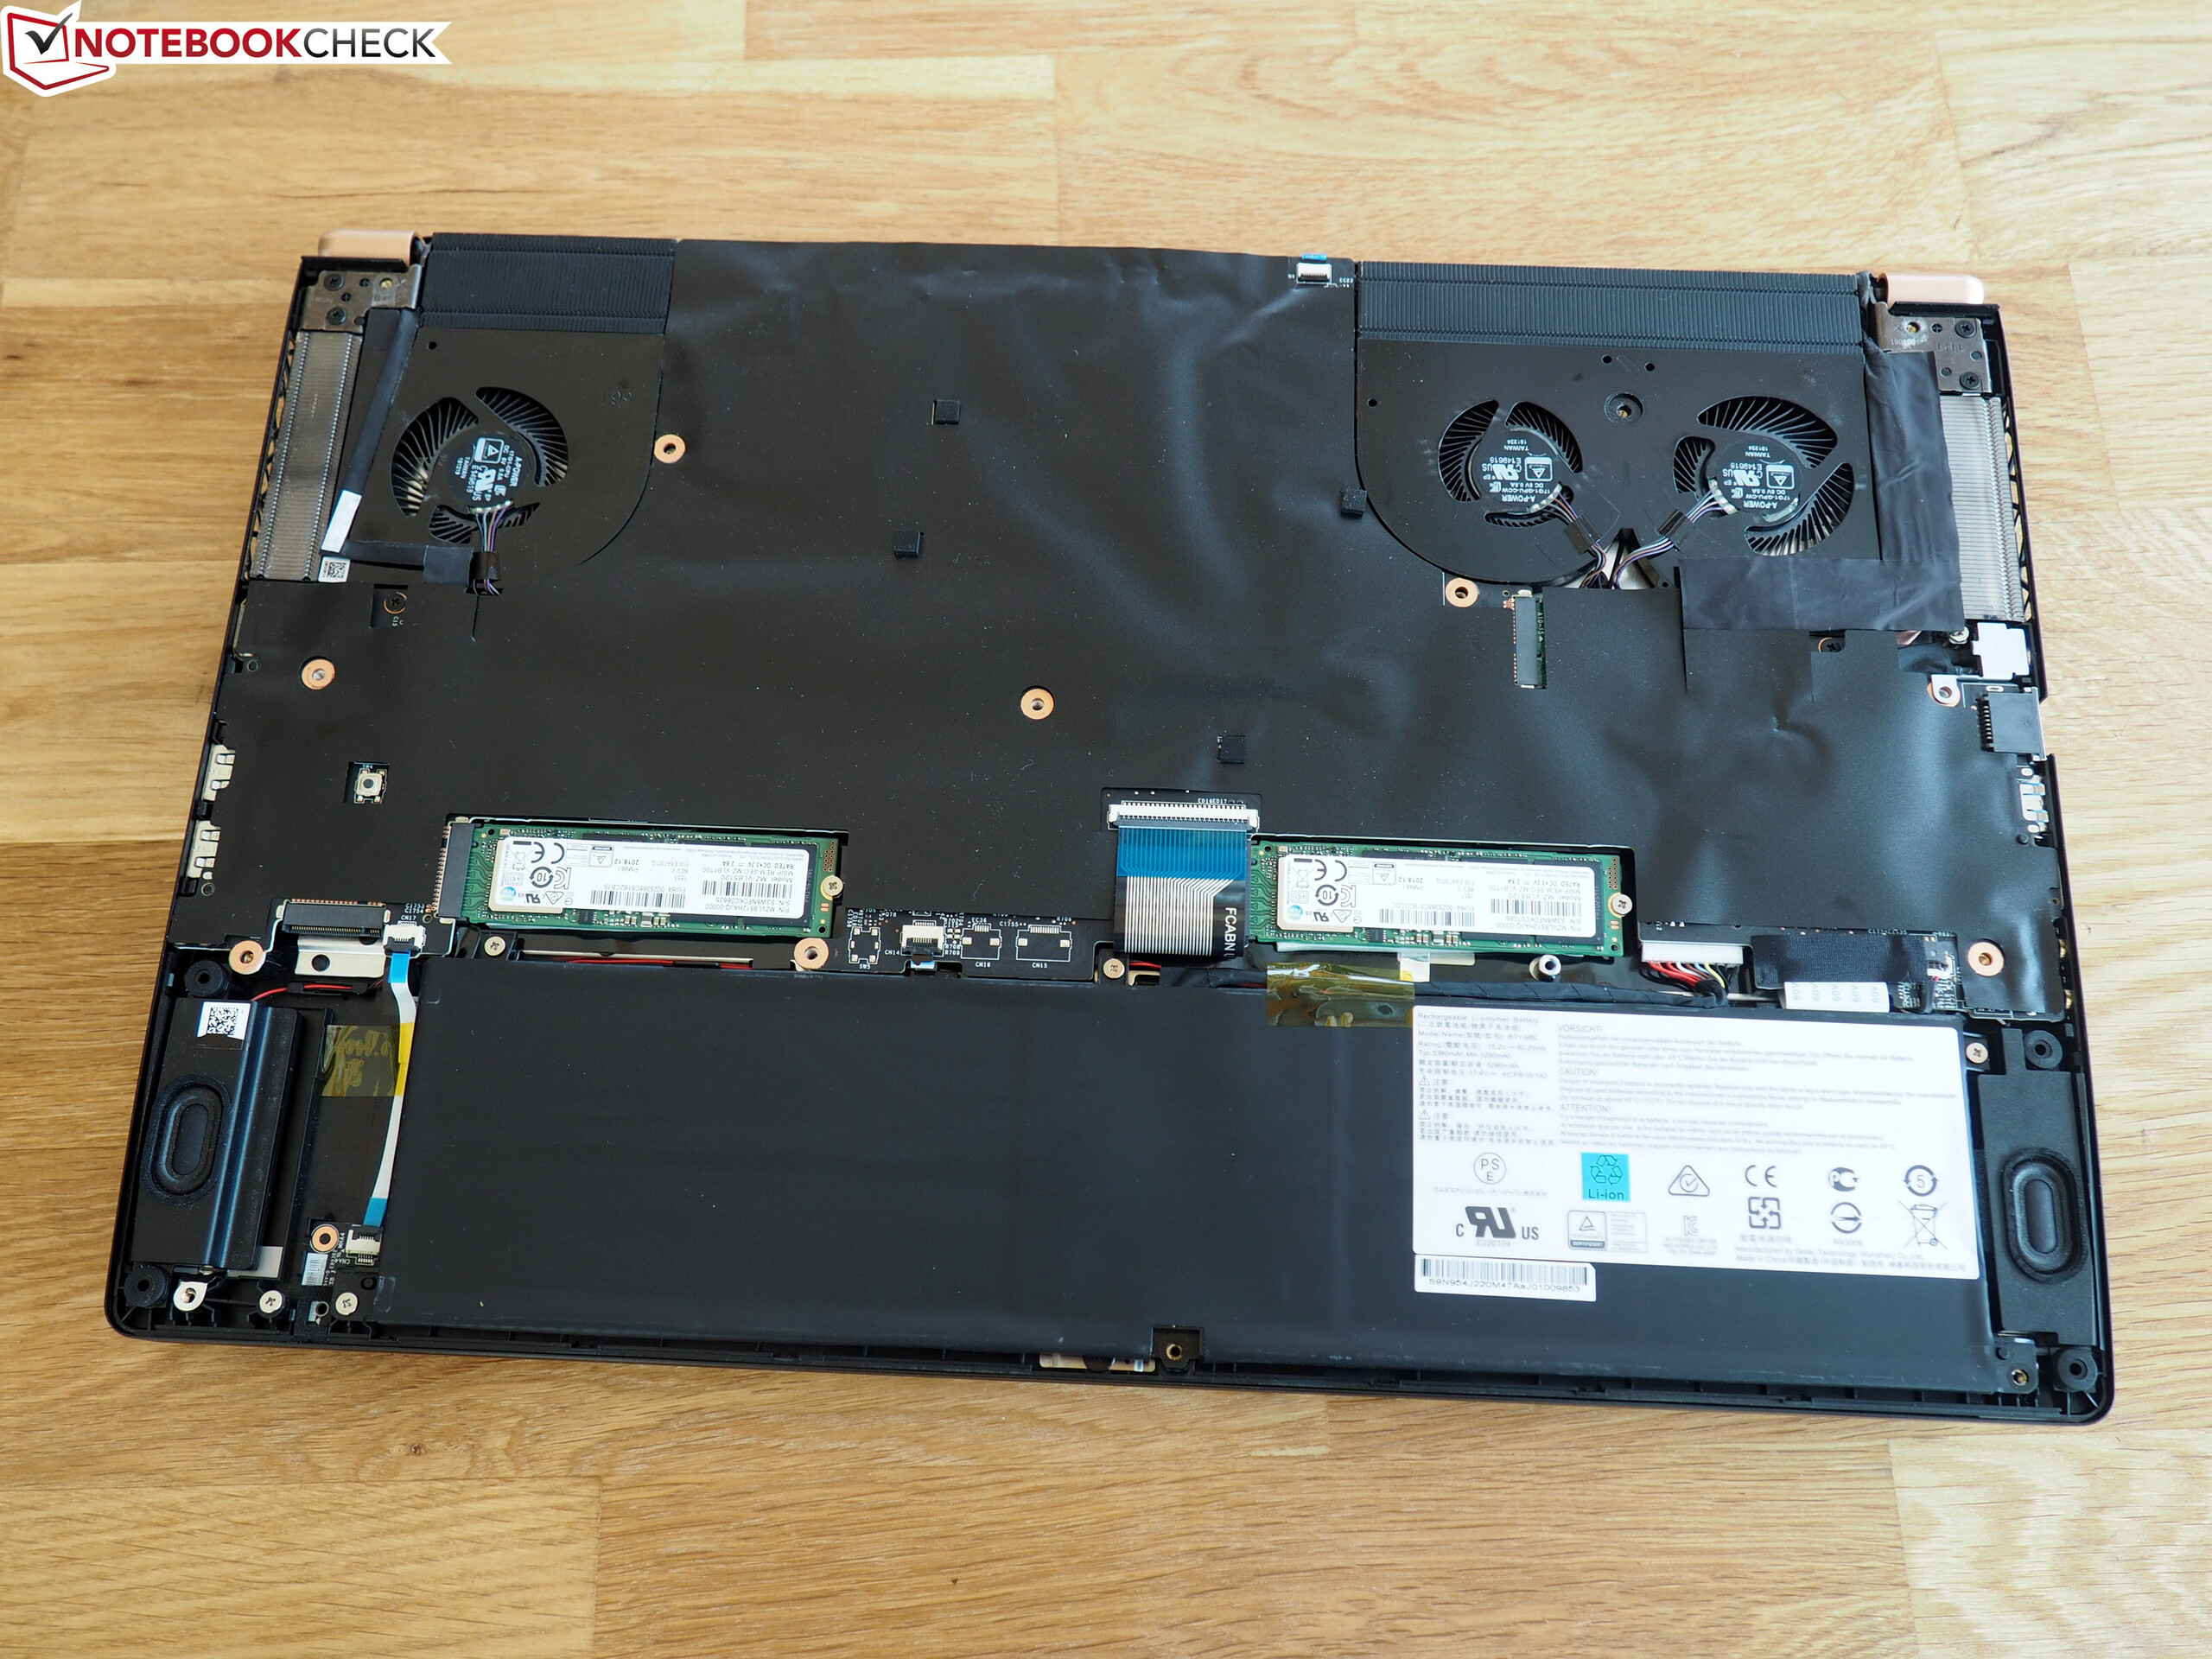
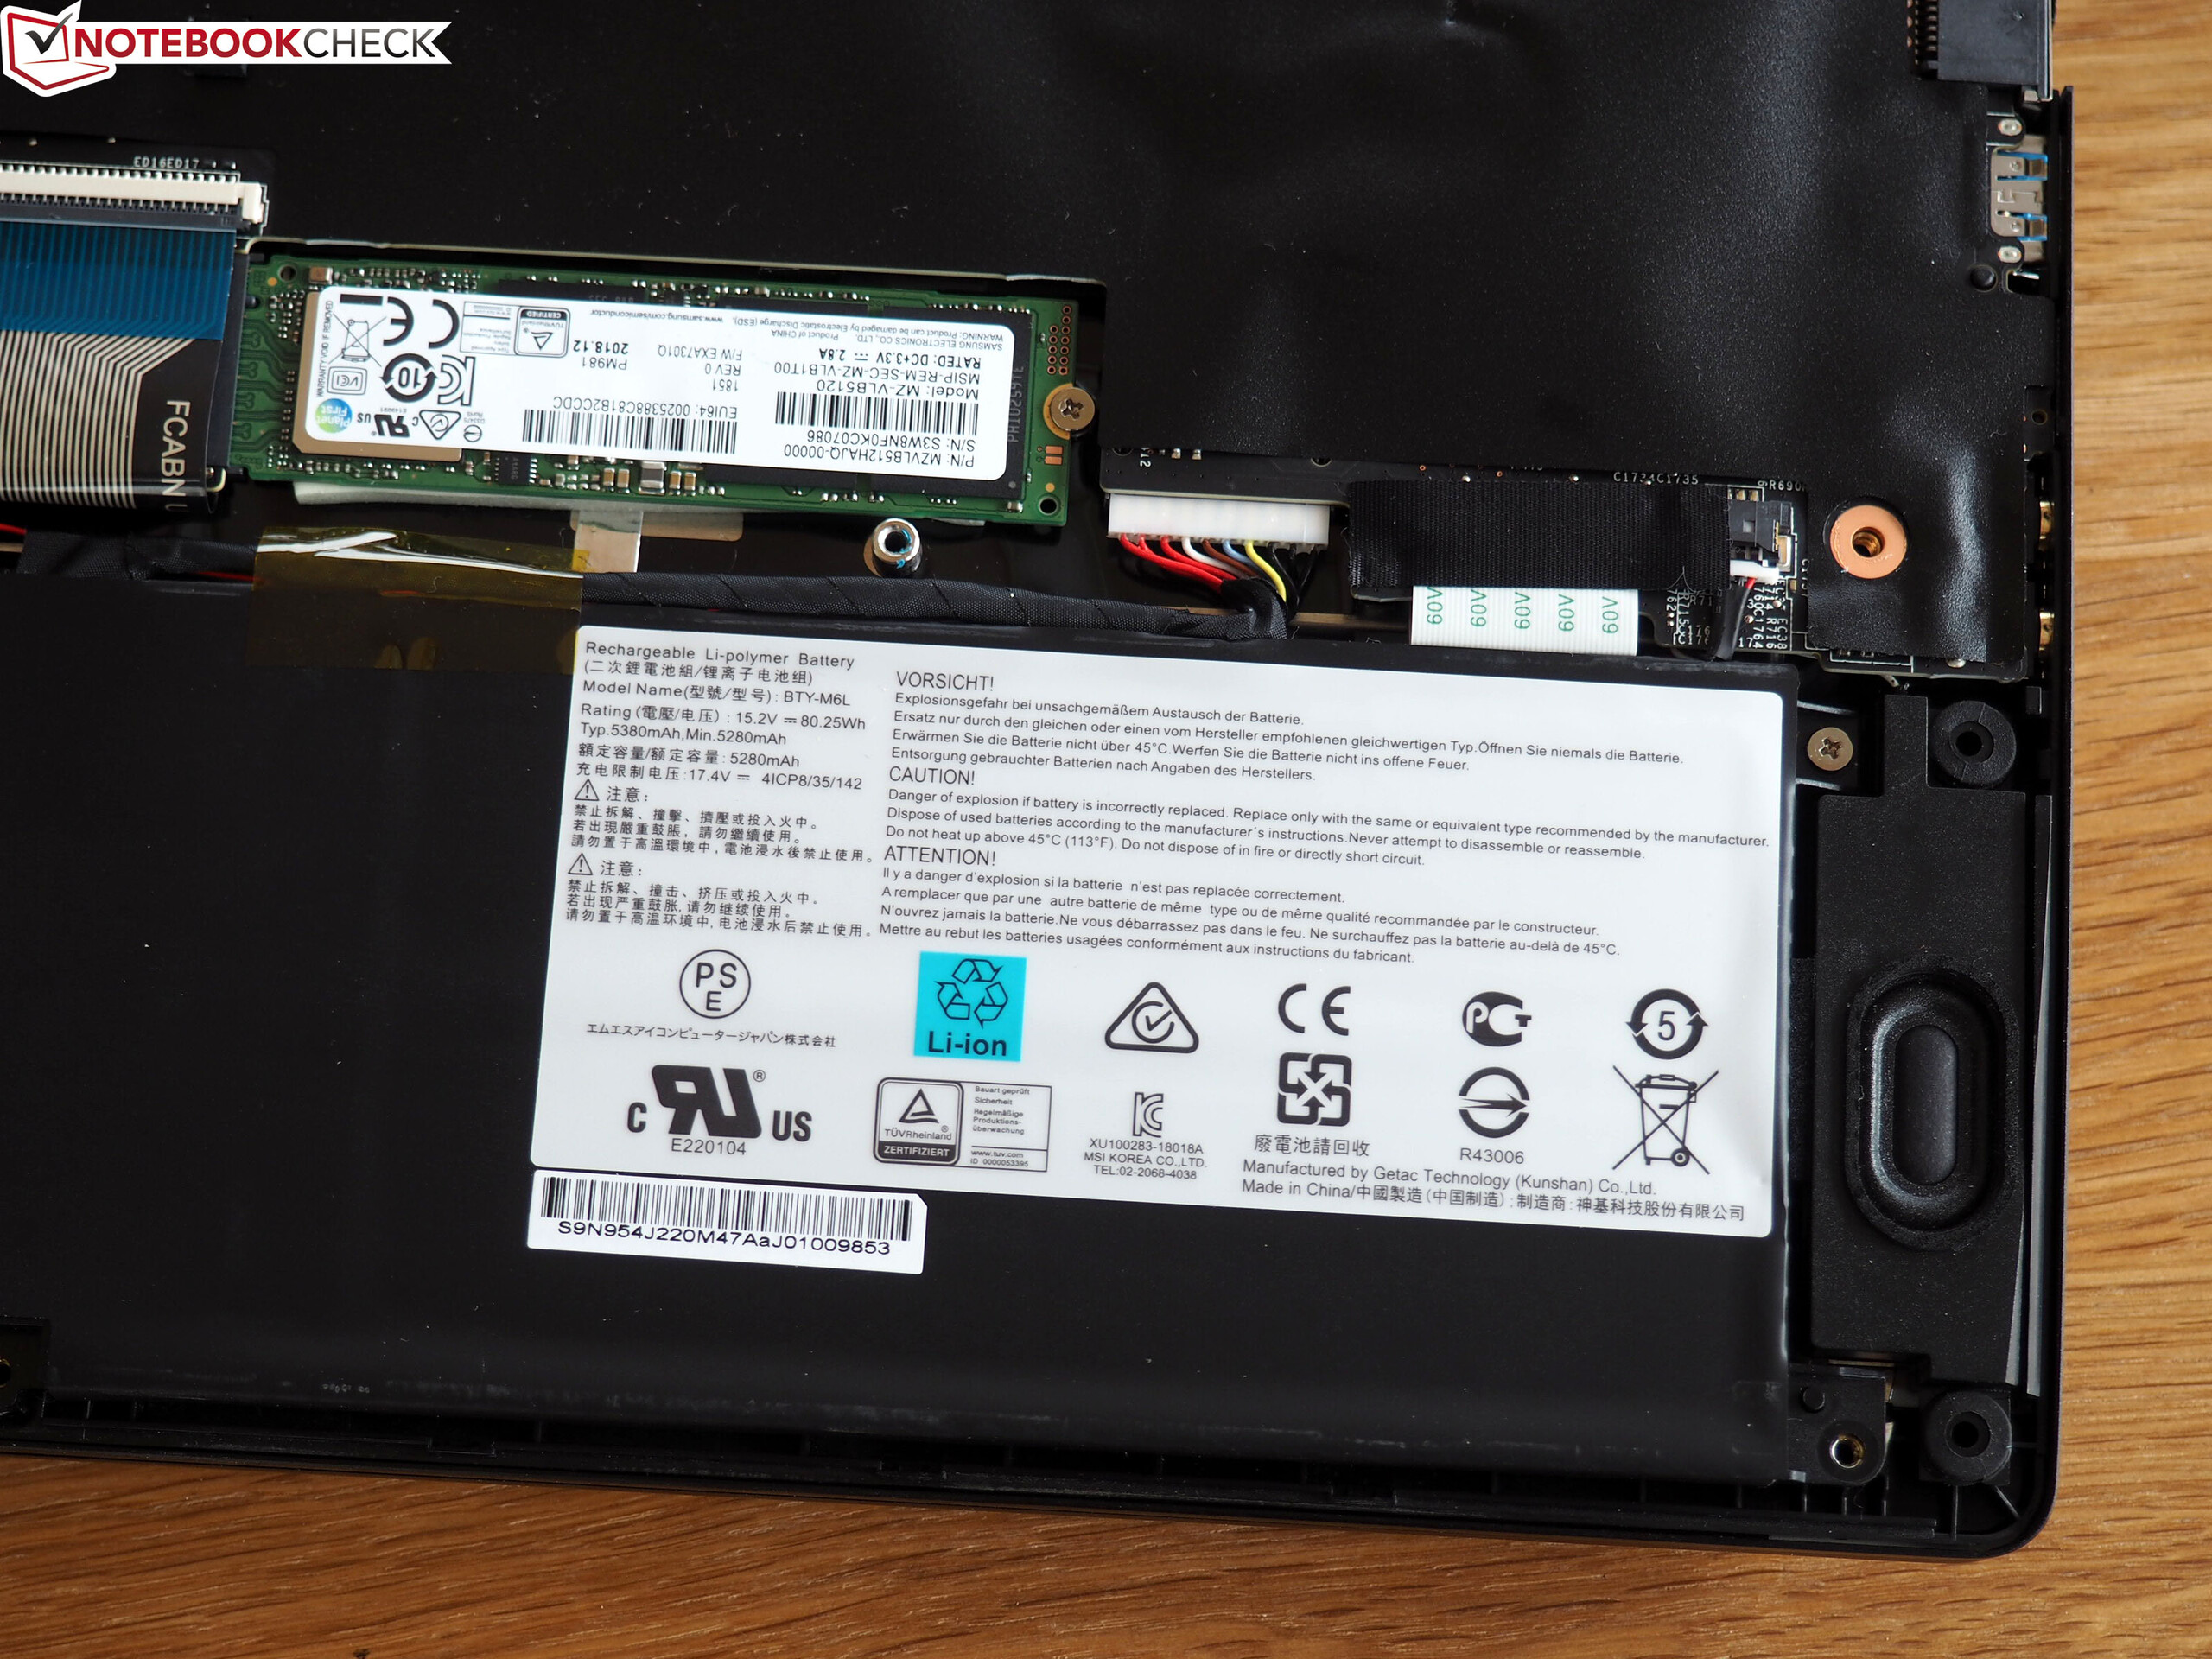
We zijn blij met de keuze van MSI om twee NVMe-SSD's in RAID-0 te installeren. Deze keuze geeft de 9SG erg goede overdrachtsnelheden en een gezonde 2 TB opslagruimte. Je kan zelfs een derde M.2 2280-schijf toevoegen als je meer opslag nodig zou hebben, al opteerde MSI hier helaas voor een tragere SATA III-connector in plaats van NVMe.
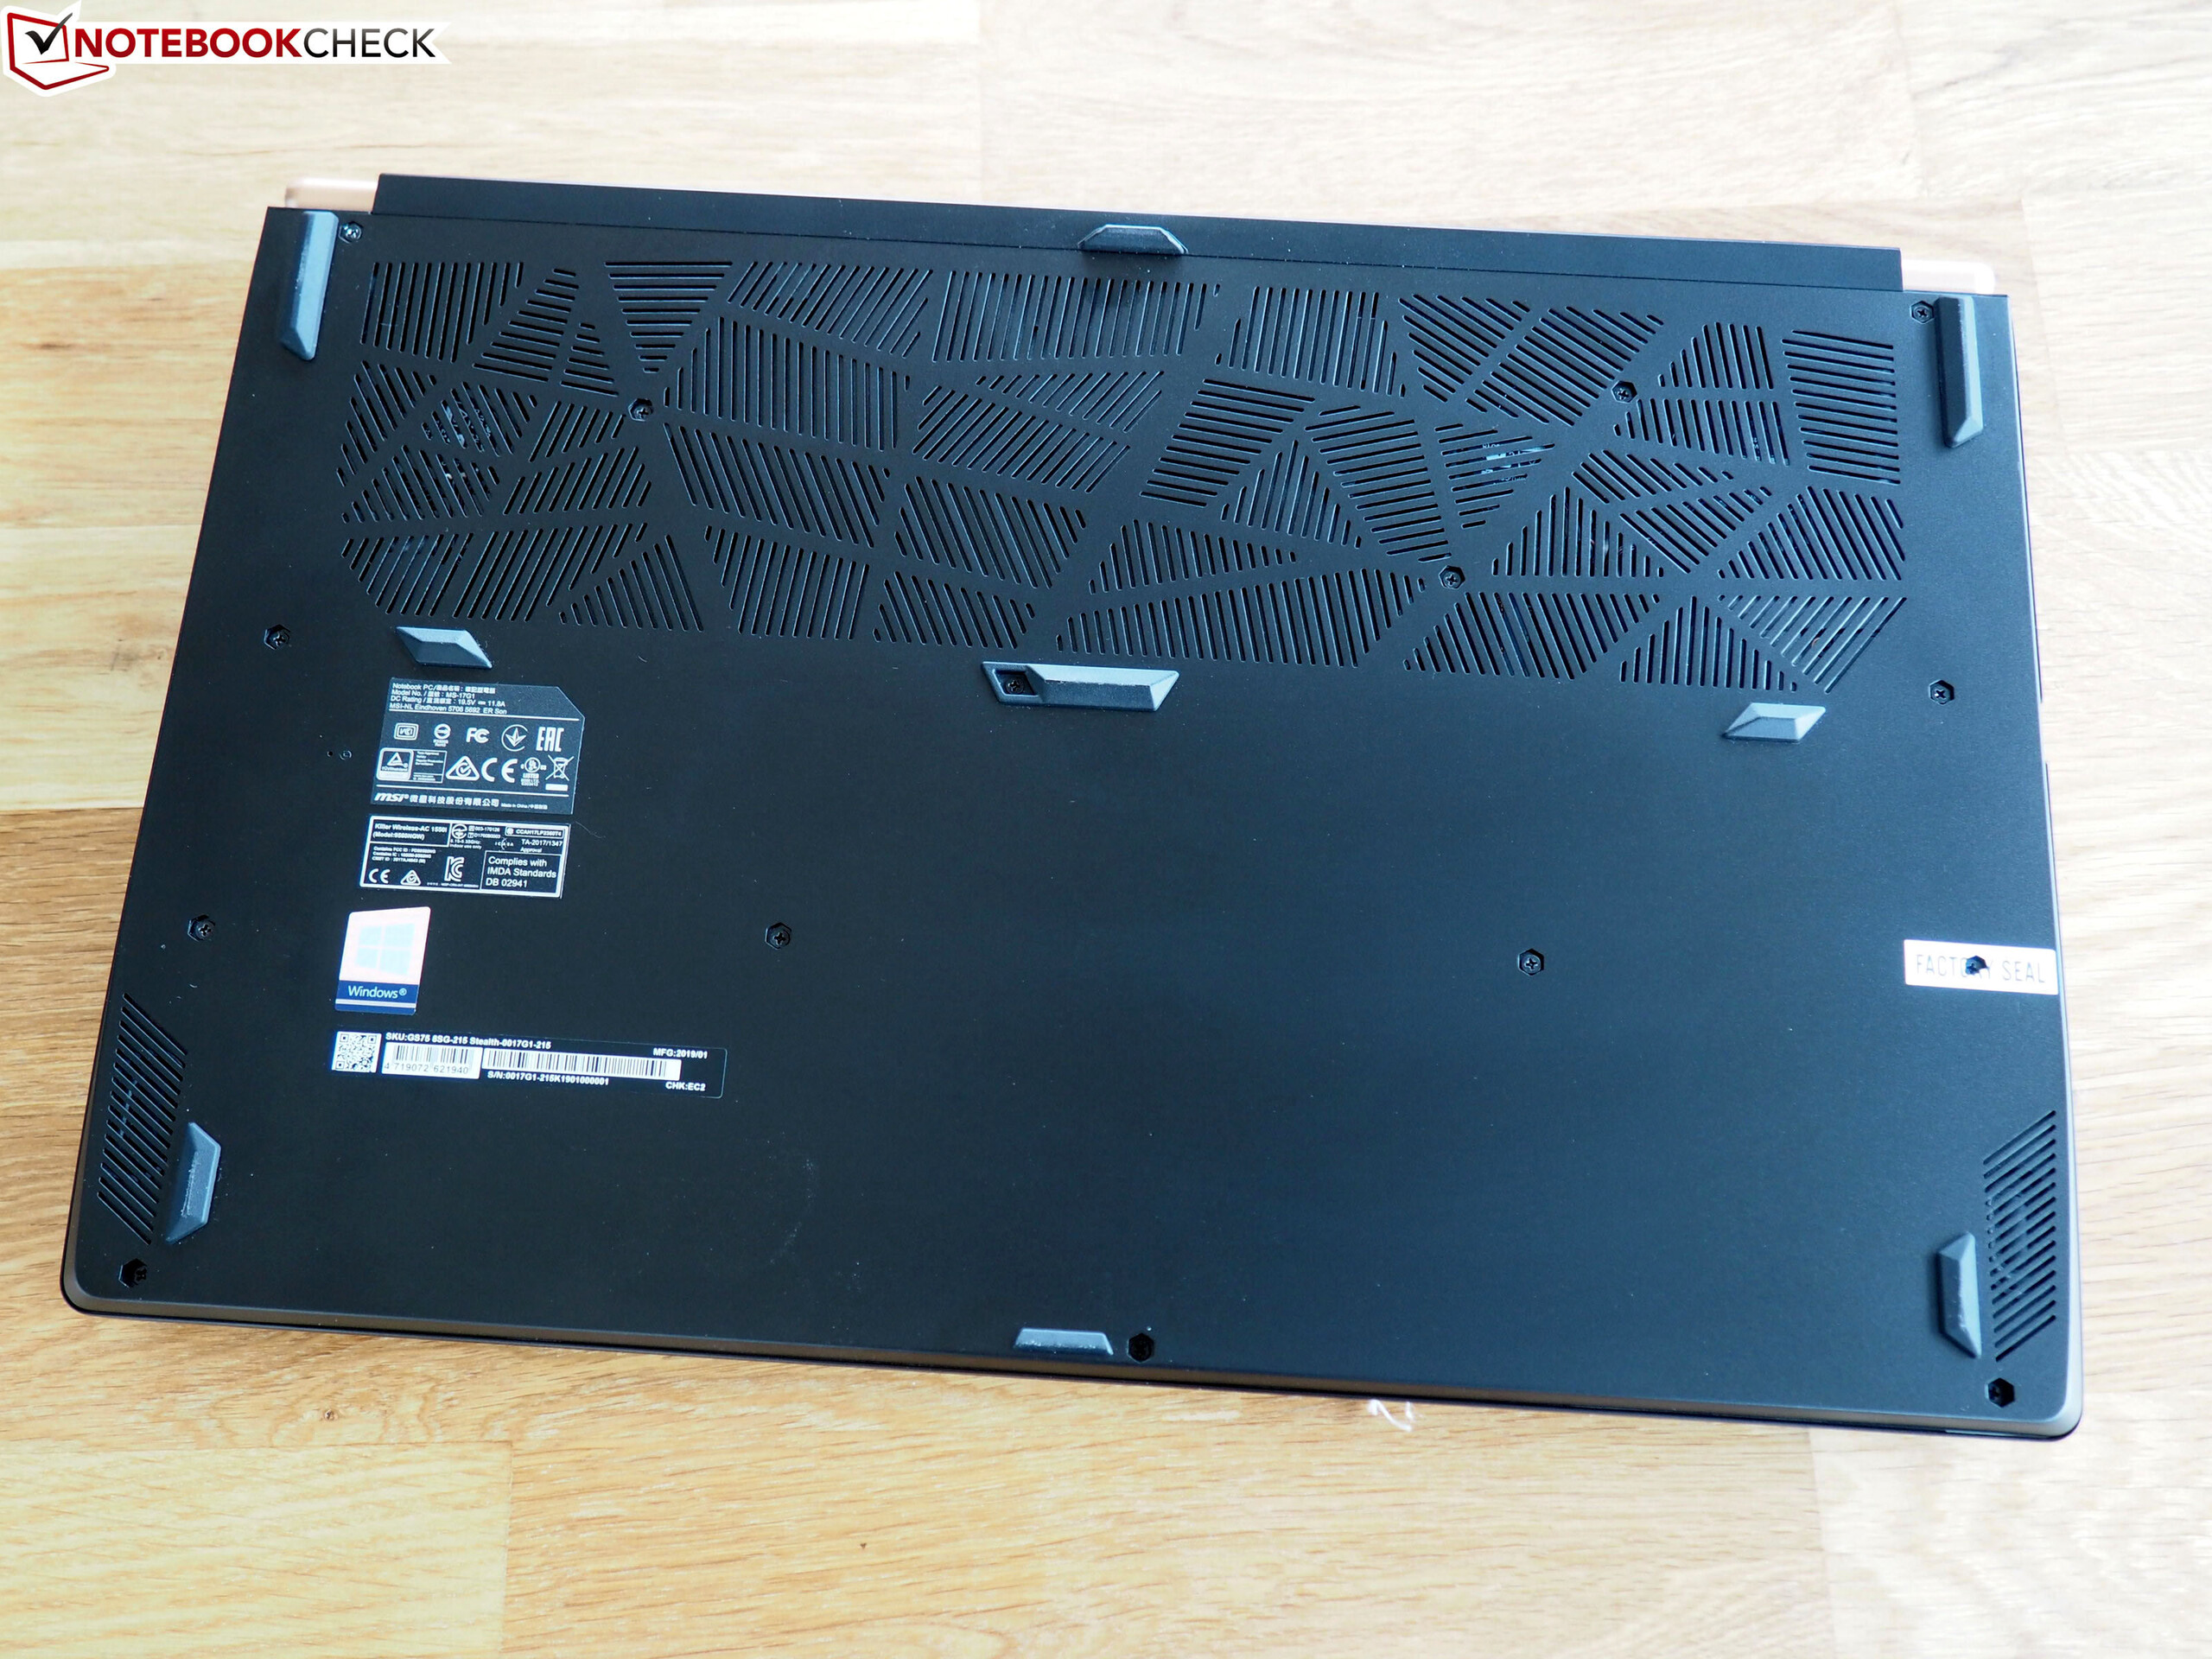
De 9SG heeft dankzij zijn 80.25-Wh-batterij een relatief goede batterijduur en zou het een volledige dag moeten uithouden zonder netstroom. De onstabiele behuizing helpt bij het laag houden van het gewicht, dat slechts 2,28 kg bedraagt. De integratie van Thunderbolt 3 was een slimme zet en hoewel er genoeg poorten zouden moeten zijn voor de meeste mensen, had MSI ruimte om er nog meer toe te voegen. Al bij al is de MSI GS75 Stealth 9SG een goede optie voor wie op zoek is naar een mobiele 17.3-inch gaming-laptop. Als je de tekortkomingen van het design door de vingers kan zien, zal de 9SG je belonen met eersteklas prestaties op een prachtig 144-Hz-scherm.
MSI GS75 Stealth 9SG
- 14-05-2020 v7 (old)
Sascha Mölck
Price comparison
