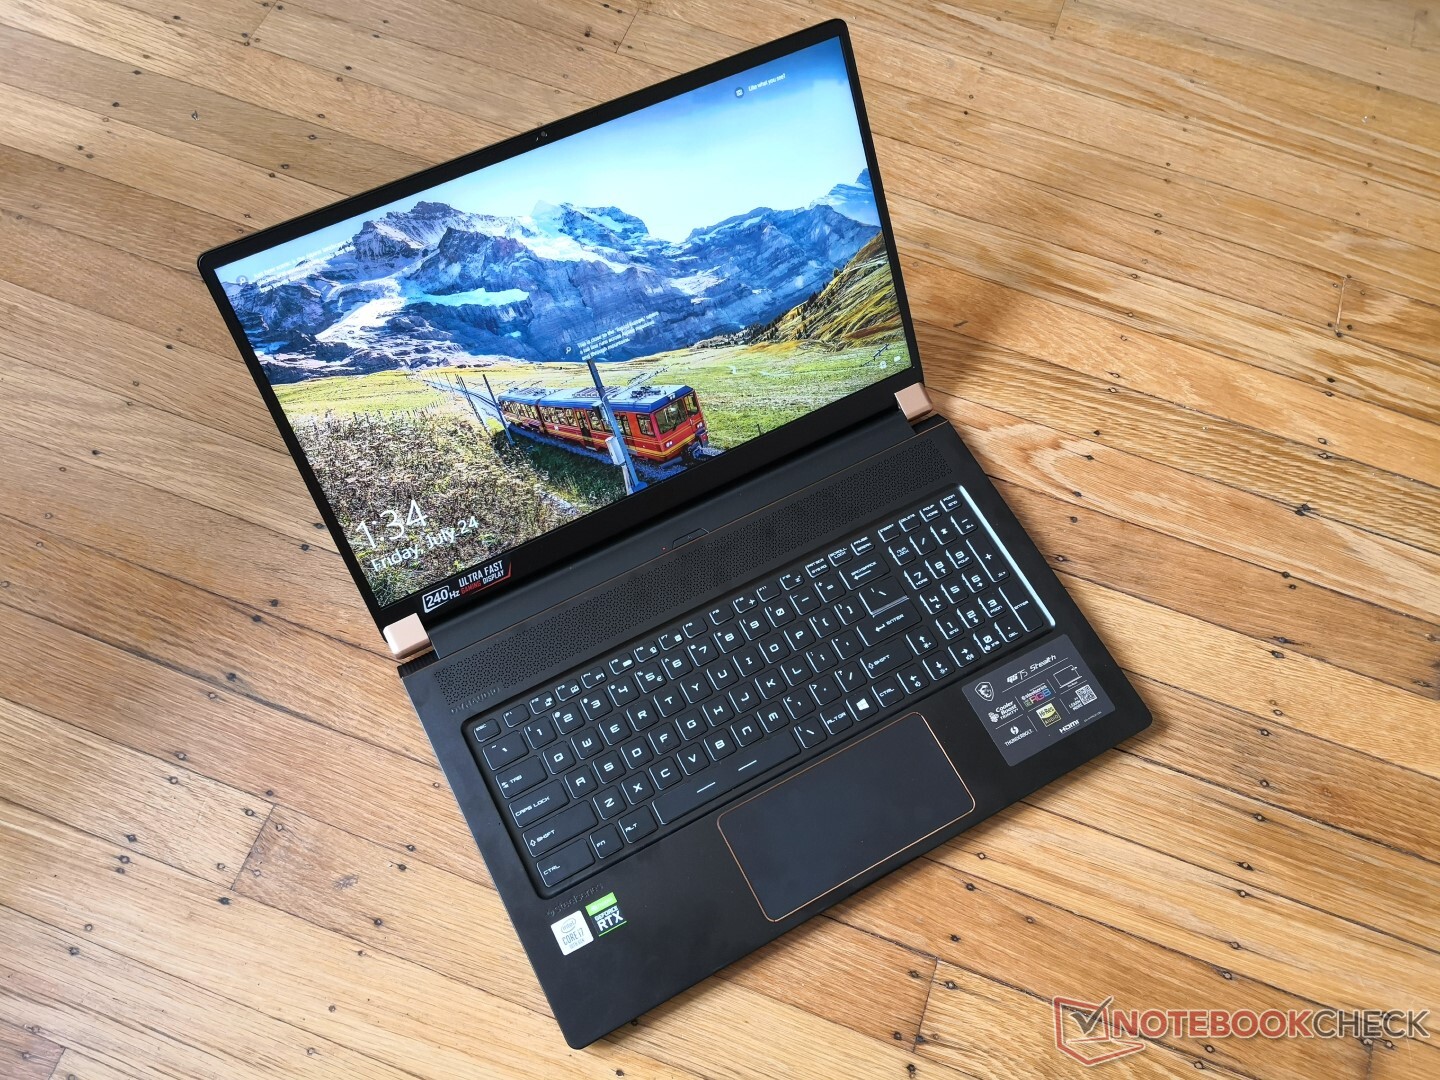
Kort testrapport MSI GS75 Stealth 10SF Laptop: fantastische Core i7-10875H prestaties
Evaluatie | Datum | Model | Gewicht | Hoogte | Formaat | Resolutie | Beste prijs |
|---|---|---|---|---|---|---|---|
| 83.7 % v7 (old) | 07-2020 | MSI GS75 10SF-609US i7-10875H, GeForce RTX 2070 Max-Q | 2.3 kg | 18.9 mm | 17.30" | 1920x1080 | |
| 87.4 % v7 (old) | 06-2020 | Razer Blade Pro 17 RTX 2070 Max-Q 300 Hz i7-10875H, GeForce RTX 2070 Max-Q | 2.7 kg | 19.9 mm | 17.30" | 1920x1080 | |
| 86.5 % v7 (old) | 05-2020 | Aorus 17G XB i7-10875H, GeForce RTX 2070 Super Max-Q | 2.7 kg | 26 mm | 17.30" | 1920x1080 | |
| 87 % v7 (old) | 04-2020 | Gigabyte Aero 17 HDR XB i7-10875H, GeForce RTX 2070 Super Max-Q | 2.7 kg | 21 mm | 17.30" | 3840x2160 | |
| 84.2 % v7 (old) | 02-2020 | Alienware m17 R2 P41E i9-9980HK, GeForce RTX 2080 Max-Q | 2.6 kg | 20.5 mm | 17.30" | 1920x1080 | |
| 82.4 % v7 (old) | 08-2020 | Asus Zephyrus S17 GX701LXS i7-10875H, GeForce RTX 2080 Super Max-Q | 2.6 kg | 18.7 mm | 17.30" | 1920x1080 |
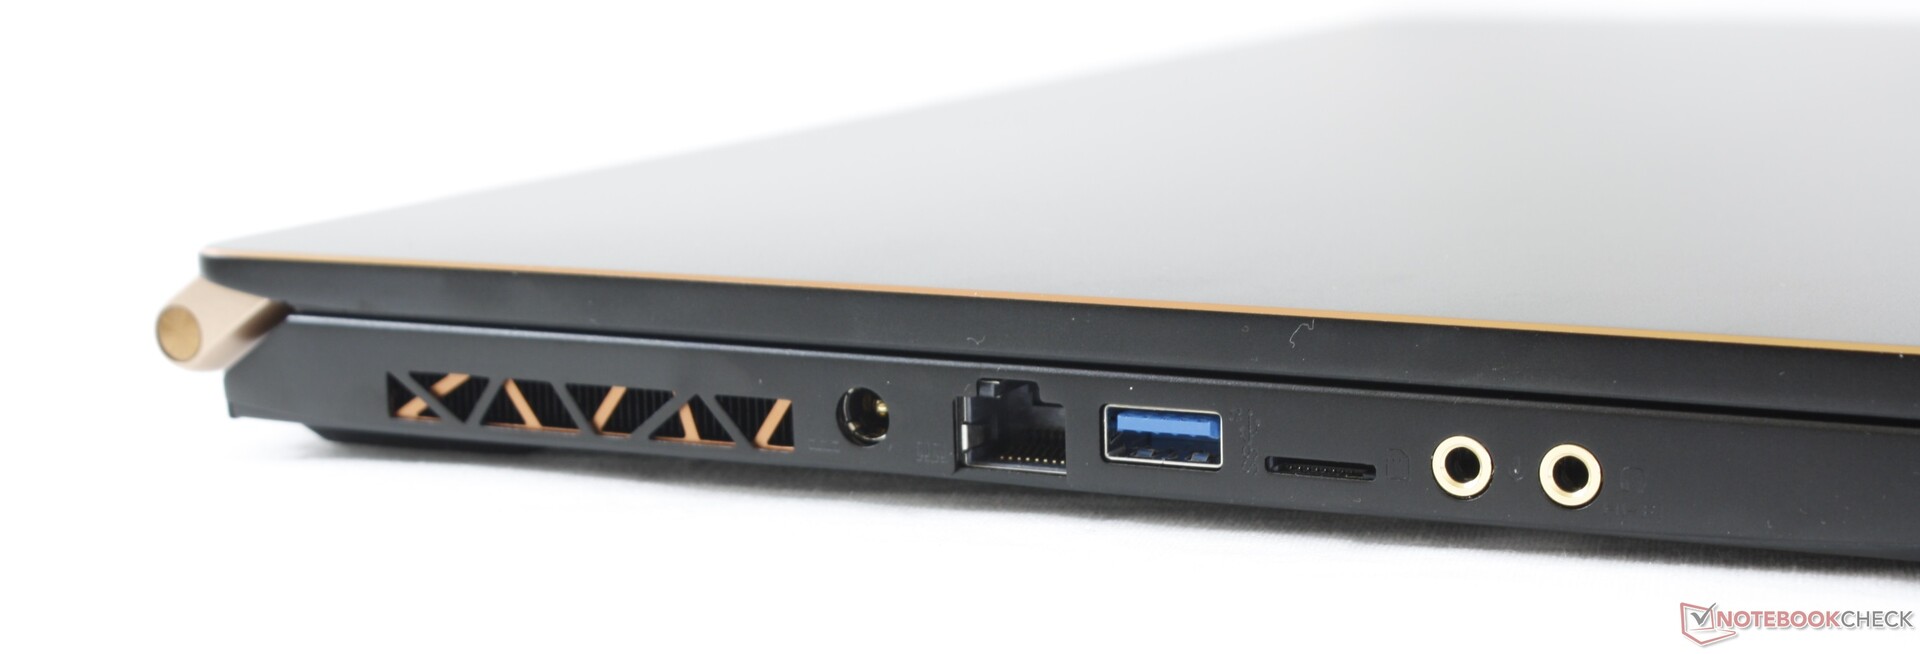
| SD Card Reader | |
| average JPG Copy Test (av. of 3 runs) | |
| Aorus 17G XB (Toshiba Exceria Pro SDXC 64 GB UHS-II) | |
| Razer Blade Pro 17 RTX 2070 Max-Q 300 Hz (Toshiba Exceria Pro SDXC 64 GB UHS-II) | |
| Gigabyte Aero 17 HDR XB (Toshiba Exceria Pro SDXC 64 GB UHS-II) | |
| MSI GS75 10SF-609US (Toshiba Exceria Pro M501 UHS-II) | |
| MSI GS73 Stealth 8RF-011 (Toshiba Exceria Pro SDXC 64 GB UHS-II) | |
| maximum AS SSD Seq Read Test (1GB) | |
| Aorus 17G XB (Toshiba Exceria Pro SDXC 64 GB UHS-II) | |
| Gigabyte Aero 17 HDR XB (Toshiba Exceria Pro SDXC 64 GB UHS-II) | |
| MSI GS73 Stealth 8RF-011 (Toshiba Exceria Pro SDXC 64 GB UHS-II) | |
| MSI GS75 10SF-609US (Toshiba Exceria Pro M501 UHS-II) | |
| Razer Blade Pro 17 RTX 2070 Max-Q 300 Hz (Toshiba Exceria Pro SDXC 64 GB UHS-II) | |


| |||||||||||||||||||||||||
Helderheidsverdeling: 84 %
Helderheid in Batterij-modus: 299.4 cd/m²
Contrast: 966:1 (Zwart: 0.31 cd/m²)
ΔE ColorChecker Calman: 1.82 | ∀{0.5-29.43 Ø4.71}
calibrated: 1.59
ΔE Greyscale Calman: 2.7 | ∀{0.09-98 Ø4.96}
99.8% sRGB (Argyll 1.6.3 3D)
67.1% AdobeRGB 1998 (Argyll 1.6.3 3D)
75.1% AdobeRGB 1998 (Argyll 3D)
99.8% sRGB (Argyll 3D)
75.6% Display P3 (Argyll 3D)
Gamma: 2.18
CCT: 6837 K
| MSI GS75 10SF-609US Sharp LQ173M1JW05, IPS, 17.3", 1920x1080 | Razer Blade Pro 17 RTX 2070 Max-Q 300 Hz Sharp LQ173M1JW02, IPS, 17.3", 1920x1080 | Aorus 17G XB AU Optronics B173HAN05.0 (AUO509D), IPS, 17.3", 1920x1080 | Alienware m17 R2 P41E Chi Mei 173HCE, CMN175F, IPS, 17.3", 1920x1080 | Asus ROG Zephyrus S GX701GXR AU Optronics B173HAN05.1, IPS, 17.3", 1920x1080 | MSI GS73 Stealth 8RF-011 CMN N173HHE-G32 (CMN1747), TN, 17.3", 1920x1080 | |
|---|---|---|---|---|---|---|
| Display | -3% | -4% | -4% | -5% | 11% | |
| Display P3 Coverage (%) | 75.6 | 72.2 -4% | 70.6 -7% | 70.8 -6% | 70 -7% | 90.8 20% |
| sRGB Coverage (%) | 99.8 | 98.5 -1% | 97.2 -3% | 98.5 -1% | 96.6 -3% | 99.9 0% |
| AdobeRGB 1998 Coverage (%) | 75.1 | 73 -3% | 72.8 -3% | 72.2 -4% | 72.3 -4% | 85.8 14% |
| Response Times | -29% | -151% | -154% | -14% | -25% | |
| Response Time Grey 50% / Grey 80% * (ms) | 5 ? | 5.6 ? -12% | 16 ? -220% | 17.2 ? -244% | 5.6 ? -12% | 7.8 ? -56% |
| Response Time Black / White * (ms) | 6.6 ? | 9.6 ? -45% | 12 ? -82% | 10.8 ? -64% | 7.6 ? -15% | 6.2 ? 6% |
| PWM Frequency (Hz) | 26320 ? | 25510 ? | ||||
| Screen | -44% | 19% | 18% | 3% | -17% | |
| Brightness middle (cd/m²) | 299.4 | 328 10% | 293 -2% | 384.2 28% | 288 -4% | 262 -12% |
| Brightness (cd/m²) | 299 | 329 10% | 285 -5% | 357 19% | 276 -8% | 261 -13% |
| Brightness Distribution (%) | 84 | 78 -7% | 95 13% | 90 7% | 93 11% | 94 12% |
| Black Level * (cd/m²) | 0.31 | 0.35 -13% | 0.24 23% | 0.29 6% | 0.24 23% | 0.2 35% |
| Contrast (:1) | 966 | 937 -3% | 1221 26% | 1325 37% | 1200 24% | 1310 36% |
| Colorchecker dE 2000 * | 1.82 | 4.74 -160% | 1.27 30% | 1.35 26% | 1.92 -5% | 3.96 -118% |
| Colorchecker dE 2000 max. * | 3.91 | 8.99 -130% | 2.24 43% | 3.45 12% | 4.57 -17% | 7.29 -86% |
| Colorchecker dE 2000 calibrated * | 1.59 | 2.12 -33% | 1.06 33% | 1.42 11% | 1.14 28% | 2.18 -37% |
| Greyscale dE 2000 * | 2.7 | 6.8 -152% | 1.34 50% | 1.2 56% | 3.08 -14% | 3.09 -14% |
| Gamma | 2.18 101% | 2.2 100% | 2.38 92% | 2.23 99% | 2.42 91% | 2.48 89% |
| CCT | 6837 95% | 6446 101% | 6542 99% | 6580 99% | 7055 92% | 6977 93% |
| Color Space (Percent of AdobeRGB 1998) (%) | 67.1 | 64.8 -3% | 73 9% | 65.5 -2% | 65 -3% | 76 13% |
| Color Space (Percent of sRGB) (%) | 99.8 | 98.6 -1% | 94 -6% | 98.5 -1% | 96 -4% | 100 0% |
| Totaal Gemiddelde (Programma / Instellingen) | -25% /
-34% | -45% /
-6% | -47% /
-8% | -5% /
-1% | -10% /
-13% |
* ... kleiner is beter
Responstijd Scherm
| ↔ Responstijd Zwart naar Wit | ||
|---|---|---|
| 6.6 ms ... stijging ↗ en daling ↘ gecombineerd | ↗ 2.6 ms stijging | 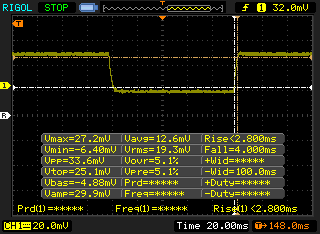 |
| ↘ 4 ms daling | ||
| Het scherm vertoonde erg snelle responstijden in onze tests en zou zeer geschikt moeten zijn voor snelle games. Ter vergelijking: alle testtoestellen variëren van 0.1 (minimum) tot 240 (maximum) ms. » 21 % van alle toestellen zijn beter. Dit betekent dat de gemeten responstijd beter is dan het gemiddelde (19.8 ms) van alle geteste toestellen. | ||
| ↔ Responstijd 50% Grijs naar 80% Grijs | ||
| 5 ms ... stijging ↗ en daling ↘ gecombineerd | ↗ 2.2 ms stijging | 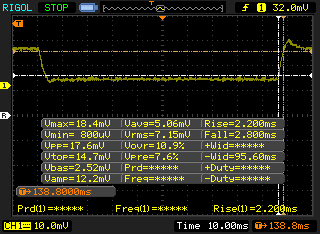 |
| ↘ 2.8 ms daling | ||
| Het scherm vertoonde erg snelle responstijden in onze tests en zou zeer geschikt moeten zijn voor snelle games. Ter vergelijking: alle testtoestellen variëren van 0.165 (minimum) tot 636 (maximum) ms. » 17 % van alle toestellen zijn beter. Dit betekent dat de gemeten responstijd beter is dan het gemiddelde (31 ms) van alle geteste toestellen. | ||
Screen Flickering / PWM (Pulse-Width Modulation)
| Screen flickering / PWM niet waargenomen | 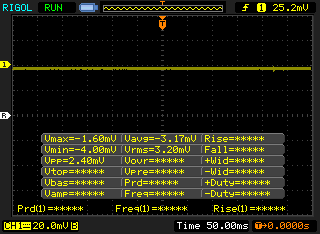 | ||
Ter vergelijking: 52 % van alle geteste toestellen maakten geen gebruik van PWM om de schermhelderheid te verlagen. Als het wel werd gebruikt, werd een gemiddelde van 7757 (minimum: 5 - maximum: 343500) Hz waargenomen. | |||
Cinebench R15: CPU Multi 64Bit | CPU Single 64Bit
Blender: v2.79 BMW27 CPU
7-Zip 18.03: 7z b 4 -mmt1 | 7z b 4
Geekbench 5.5: Single-Core | Multi-Core
HWBOT x265 Benchmark v2.2: 4k Preset
LibreOffice : 20 Documents To PDF
R Benchmark 2.5: Overall mean
| Cinebench R20 / CPU (Multi Core) | |
| Eurocom Sky X4C i9-9900KS | |
| Asus Zephyrus G14 GA401IV | |
| Asus TUF A17 FA706IU-AS76 | |
| MSI GS75 10SF-609US | |
| Asus Strix Scar 17 G732LXS | |
| MSI GE75 9SG | |
| Gemiddeld Intel Core i7-10875H (1986 - 4176, n=32) | |
| Acer Nitro 5 AN515-44-R5FT | |
| MSI GE75 Raider 10SE-008US | |
| Asus ROG Zephyrus S GX701GXR | |
| MSI GF75 Thin 10SCXR | |
| Cinebench R20 / CPU (Single Core) | |
| Eurocom Sky X4C i9-9900KS | |
| Asus Zephyrus G14 GA401IV | |
| Asus Strix Scar 17 G732LXS | |
| Gemiddeld Intel Core i7-10875H (430 - 524, n=32) | |
| Asus TUF A17 FA706IU-AS76 | |
| MSI GS75 10SF-609US | |
| MSI GE75 Raider 10SE-008US | |
| MSI GE75 9SG | |
| MSI GF75 Thin 10SCXR | |
| Acer Nitro 5 AN515-44-R5FT | |
| Asus ROG Zephyrus S GX701GXR | |
| Cinebench R15 / CPU Multi 64Bit | |
| Eurocom Sky X4C i9-9900KS | |
| Asus Zephyrus G14 GA401IV | |
| Asus TUF A17 FA706IU-AS76 | |
| Asus Strix Scar 17 G732LXS | |
| MSI GE75 9SG | |
| MSI GS75 10SF-609US | |
| Gemiddeld Intel Core i7-10875H (1003 - 1833, n=38) | |
| Acer Nitro 5 AN515-44-R5FT | |
| MSI GE75 Raider 10SE-008US | |
| Asus ROG Zephyrus S GX701GXR | |
| MSI GF75 Thin 10SCXR | |
| Cinebench R15 / CPU Single 64Bit | |
| Eurocom Sky X4C i9-9900KS | |
| Gemiddeld Intel Core i7-10875H (190 - 220, n=37) | |
| Asus Strix Scar 17 G732LXS | |
| MSI GS75 10SF-609US | |
| Asus Zephyrus G14 GA401IV | |
| MSI GE75 9SG | |
| Asus TUF A17 FA706IU-AS76 | |
| MSI GE75 Raider 10SE-008US | |
| MSI GF75 Thin 10SCXR | |
| Acer Nitro 5 AN515-44-R5FT | |
| Asus ROG Zephyrus S GX701GXR | |
| Blender / v2.79 BMW27 CPU | |
| MSI GF75 Thin 10SCXR | |
| MSI GE75 Raider 10SE-008US | |
| Acer Nitro 5 AN515-44-R5FT | |
| Gemiddeld Intel Core i7-10875H (259 - 535, n=30) | |
| Asus Zephyrus G14 GA401IV | |
| MSI GE75 9SG | |
| Asus Strix Scar 17 G732LXS | |
| MSI GS75 10SF-609US | |
| Asus TUF A17 FA706IU-AS76 | |
| Eurocom Sky X4C i9-9900KS | |
| 7-Zip 18.03 / 7z b 4 -mmt1 | |
| Eurocom Sky X4C i9-9900KS | |
| Gemiddeld Intel Core i7-10875H (5071 - 5780, n=31) | |
| Asus Strix Scar 17 G732LXS | |
| MSI GS75 10SF-609US | |
| MSI GE75 Raider 10SE-008US | |
| MSI GE75 9SG | |
| Asus TUF A17 FA706IU-AS76 | |
| MSI GF75 Thin 10SCXR | |
| Asus Zephyrus G14 GA401IV | |
| Acer Nitro 5 AN515-44-R5FT | |
| 7-Zip 18.03 / 7z b 4 | |
| Eurocom Sky X4C i9-9900KS | |
| Asus TUF A17 FA706IU-AS76 | |
| Asus Zephyrus G14 GA401IV | |
| MSI GS75 10SF-609US | |
| MSI GE75 9SG | |
| Asus Strix Scar 17 G732LXS | |
| Gemiddeld Intel Core i7-10875H (29844 - 49562, n=31) | |
| Acer Nitro 5 AN515-44-R5FT | |
| MSI GE75 Raider 10SE-008US | |
| MSI GF75 Thin 10SCXR | |
| Geekbench 5.5 / Single-Core | |
| Eurocom Sky X4C i9-9900KS | |
| Gemiddeld Intel Core i7-10875H (1233 - 1371, n=29) | |
| Asus Strix Scar 17 G732LXS | |
| MSI GS75 10SF-609US | |
| MSI GE75 Raider 10SE-008US | |
| Asus Zephyrus G14 GA401IV | |
| Asus TUF A17 FA706IU-AS76 | |
| MSI GF75 Thin 10SCXR | |
| Acer Nitro 5 AN515-44-R5FT | |
| Geekbench 5.5 / Multi-Core | |
| Eurocom Sky X4C i9-9900KS | |
| Asus Strix Scar 17 G732LXS | |
| MSI GS75 10SF-609US | |
| Asus TUF A17 FA706IU-AS76 | |
| Gemiddeld Intel Core i7-10875H (5715 - 8620, n=29) | |
| Asus Zephyrus G14 GA401IV | |
| MSI GE75 Raider 10SE-008US | |
| Acer Nitro 5 AN515-44-R5FT | |
| MSI GF75 Thin 10SCXR | |
| HWBOT x265 Benchmark v2.2 / 4k Preset | |
| Eurocom Sky X4C i9-9900KS | |
| MSI GS75 10SF-609US | |
| Asus Strix Scar 17 G732LXS | |
| Asus TUF A17 FA706IU-AS76 | |
| Asus Zephyrus G14 GA401IV | |
| MSI GE75 9SG | |
| Gemiddeld Intel Core i7-10875H (7.27 - 14.1, n=27) | |
| MSI GE75 Raider 10SE-008US | |
| Acer Nitro 5 AN515-44-R5FT | |
| MSI GF75 Thin 10SCXR | |
| LibreOffice / 20 Documents To PDF | |
| Acer Nitro 5 AN515-44-R5FT | |
| Asus TUF A17 FA706IU-AS76 | |
| MSI GF75 Thin 10SCXR | |
| MSI GE75 Raider 10SE-008US | |
| Asus Strix Scar 17 G732LXS | |
| Gemiddeld Intel Core i7-10875H (30.2 - 84.3, n=30) | |
| MSI GS75 10SF-609US | |
| R Benchmark 2.5 / Overall mean | |
| MSI GF75 Thin 10SCXR | |
| Acer Nitro 5 AN515-44-R5FT | |
| MSI GE75 Raider 10SE-008US | |
| Asus TUF A17 FA706IU-AS76 | |
| MSI GS75 10SF-609US | |
| Gemiddeld Intel Core i7-10875H (0.546 - 0.662, n=29) | |
| Asus Strix Scar 17 G732LXS | |
* ... kleiner is beter
| PCMark 8 Home Score Accelerated v2 | 4780 punten | |
| PCMark 8 Work Score Accelerated v2 | 6191 punten | |
| PCMark 10 Score | 6582 punten | |
Help | ||
| DPC Latencies / LatencyMon - interrupt to process latency (max), Web, Youtube, Prime95 | |
| Asus TUF A17 FA706IU-AS76 | |
| Aorus 17G XB | |
| Asus Strix Scar 17 G732LXS | |
| MSI GF75 Thin 10SCXR | |
| Gigabyte Aero 17 HDR XB | |
| MSI GE75 Raider 10SE-008US | |
| Razer Blade Pro 17 RTX 2070 Max-Q 300 Hz | |
| MSI GS75 10SF-609US | |
* ... kleiner is beter
| MSI GS75 10SF-609US WDC PC SN730 SDBPNTY-512G | Razer Blade Pro 17 RTX 2070 Max-Q 300 Hz Lite-On CA5-8D512 | Aorus 17G XB Samsung SSD PM981a MZVLB512HBJQ | Alienware m17 R2 P41E 2x SK Hynix PC601 NVMe 512 GB (RAID 0) | Asus ROG Zephyrus S GX701GXR Samsung SSD PM981 MZVLB1T0HALR | MSI GS73 Stealth 8RF-011 Samsung PM961 MZVLW256HEHP | |
|---|---|---|---|---|---|---|
| AS SSD | -30% | 29% | -9% | 8% | -10% | |
| Seq Read (MB/s) | 2327 | 2019 -13% | 1791 -23% | 1938 -17% | 1662 -29% | 1749 -25% |
| Seq Write (MB/s) | 2479 | 1314 -47% | 2193 -12% | 2094 -16% | 2266 -9% | 1173 -53% |
| 4K Read (MB/s) | 45.46 | 46.61 3% | 50.7 12% | 25.88 -43% | 46.86 3% | 42.81 -6% |
| 4K Write (MB/s) | 157.4 | 90.2 -43% | 116.8 -26% | 100.8 -36% | 101.1 -36% | 98.4 -37% |
| 4K-64 Read (MB/s) | 1050 | 665 -37% | 1525 45% | 1217 16% | 1419 35% | 1238 18% |
| 4K-64 Write (MB/s) | 938 | 813 -13% | 1958 109% | 1137 21% | 1746 86% | 691 -26% |
| Access Time Read * (ms) | 0.076 | 0.058 24% | 0.07 8% | 0.051 33% | 0.047 38% | 0.077 -1% |
| Access Time Write * (ms) | 0.071 | 0.167 -135% | 0.032 55% | 0.107 -51% | 0.037 48% | 0.038 46% |
| Score Read (Points) | 1328 | 913 -31% | 1755 32% | 1437 8% | 1632 23% | 1456 10% |
| Score Write (Points) | 1343 | 1034 -23% | 2294 71% | 1447 8% | 2074 54% | 906 -33% |
| Score Total (Points) | 3366 | 2392 -29% | 4972 48% | 3624 8% | 4576 36% | 3083 -8% |
| Copy ISO MB/s (MB/s) | 3092 | 1715 -45% | 1926 -38% | 1398 -55% | ||
| Copy Program MB/s (MB/s) | 733 | 622 -15% | 626 -15% | 438.9 -40% | ||
| Copy Game MB/s (MB/s) | 1683 | 1506 -11% | 1533 -9% | 996 -41% | ||
| CrystalDiskMark 5.2 / 6 | -7% | -3% | -10% | -29% | -38% | |
| Write 4K (MB/s) | 177.9 | 119 -33% | 123.4 -31% | 110.6 -38% | 96.1 -46% | 90.1 -49% |
| Read 4K (MB/s) | 47.42 | 51.9 9% | 45.02 -5% | 41.46 -13% | 40.86 -14% | 39.07 -18% |
| Write Seq (MB/s) | 2707 | 2258 -17% | 2526 -7% | 2378 -12% | 1317 -51% | 1192 -56% |
| Read Seq (MB/s) | 2369 | 2283 -4% | 2062 -13% | 2114 -11% | 1030 -57% | 1135 -52% |
| Write 4K Q32T1 (MB/s) | 427.8 | 491 15% | 497.9 16% | 445.4 4% | 350.4 -18% | 290.9 -32% |
| Read 4K Q32T1 (MB/s) | 543 | 540 -1% | 579 7% | 509 -6% | 404.1 -26% | 343.9 -37% |
| Write Seq Q32T1 (MB/s) | 2703 | 2253 -17% | 2982 10% | 2735 1% | 2396 -11% | 1194 -56% |
| Read Seq Q32T1 (MB/s) | 3387 | 3172 -6% | 3440 2% | 3206 -5% | 3194 -6% | 3199 -6% |
| Totaal Gemiddelde (Programma / Instellingen) | -19% /
-21% | 13% /
16% | -10% /
-10% | -11% /
-5% | -24% /
-22% |
* ... kleiner is beter

Disk Throttling: DiskSpd Read Loop, Queue Depth 8
| 3DMark 11 Performance | 22303 punten | |
| 3DMark Cloud Gate Standard Score | 51136 punten | |
| 3DMark Fire Strike Score | 17066 punten | |
| 3DMark Time Spy Score | 7392 punten | |
Help | ||
| lage | gem. | hoge | ultra | |
|---|---|---|---|---|
| The Witcher 3 (2015) | 349.7 | 231.3 | 131.3 | 67.5 |
| Dota 2 Reborn (2015) | 164 | 141 | 133 | 126 |
| X-Plane 11.11 (2018) | 112 | 100 | 83.7 | |
| Shadow of the Tomb Raider (2018) | 161 | 110 | 98 | 89 |
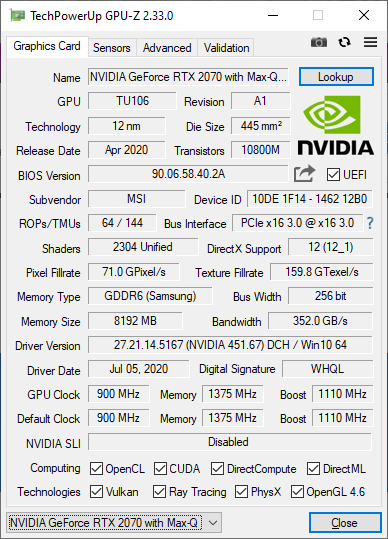
| MSI GS75 10SF-609US GeForce RTX 2070 Max-Q, i7-10875H, WDC PC SN730 SDBPNTY-512G | Razer Blade Pro 17 RTX 2070 Max-Q 300 Hz GeForce RTX 2070 Max-Q, i7-10875H, Lite-On CA5-8D512 | Aorus 17G XB GeForce RTX 2070 Super Max-Q, i7-10875H, Samsung SSD PM981a MZVLB512HBJQ | Alienware m17 R2 P41E GeForce RTX 2080 Max-Q, i9-9980HK, 2x SK Hynix PC601 NVMe 512 GB (RAID 0) | Asus ROG Zephyrus S GX701GXR GeForce RTX 2080 Max-Q, i7-9750H, Samsung SSD PM981 MZVLB1T0HALR | MSI GS73 Stealth 8RF-011 GeForce GTX 1070 Max-Q, i7-8750H, Samsung PM961 MZVLW256HEHP | |
|---|---|---|---|---|---|---|
| Noise | 6% | -5% | 3% | 2% | 4% | |
| uit / omgeving * (dB) | 26.2 | 28.2 -8% | 30 -15% | 29.1 -11% | 30 -15% | 30 -15% |
| Idle Minimum * (dB) | 31.2 | 28.2 10% | 35 -12% | 29.4 6% | 32 -3% | 30 4% |
| Idle Average * (dB) | 31.4 | 28.2 10% | 36 -15% | 29.4 6% | 33 -5% | 34 -8% |
| Idle Maximum * (dB) | 34 | 30.5 10% | 41 -21% | 31.5 7% | 34 -0% | 36 -6% |
| Load Average * (dB) | 49.5 | 42.2 15% | 47 5% | 49.7 -0% | 40 19% | 43 13% |
| Witcher 3 ultra * (dB) | 50.6 | 53 -5% | 48 5% | 49.5 2% | 49 3% | 45 11% |
| Load Maximum * (dB) | 60.7 | 55.5 9% | 49 19% | 53.3 12% | 50 18% | 45 26% |
* ... kleiner is beter
Geluidsniveau
| Onbelast |
| 31.2 / 31.4 / 34 dB (A) |
| Belasting |
| 49.5 / 60.7 dB (A) |
 | ||
30 dB stil 40 dB(A) hoorbaar 50 dB(A) luid |
||
min: | ||
(-) De maximumtemperatuur aan de bovenzijde bedraagt 49.8 °C / 122 F, vergeleken met het gemiddelde van 40.4 °C / 105 F, variërend van 21.2 tot 68.8 °C voor de klasse Gaming.
(-) De bodem warmt op tot een maximum van 55.6 °C / 132 F, vergeleken met een gemiddelde van 43.2 °C / 110 F
(+) Bij onbelast gebruik bedraagt de gemiddelde temperatuur voor de bovenzijde 25.9 °C / 79 F, vergeleken met het apparaatgemiddelde van 33.9 °C / 93 F.
(±) Bij het spelen van The Witcher 3 is de gemiddelde temperatuur voor de bovenzijde 34.8 °C / 95 F, vergeleken met het apparaatgemiddelde van 33.9 °C / 93 F.
(+) De handpalmsteunen en het touchpad bereiken maximaal de huidtemperatuur (33.8 °C / 92.8 F) en zijn dus niet heet.
(-) De gemiddelde temperatuur van de handpalmsteun van soortgelijke toestellen bedroeg 28.8 °C / 83.8 F (-5 °C / -9 F).
MSI GS75 10SF-609US audioanalyse
(+) | luidsprekers kunnen relatief luid spelen (93.4 dB)
Bas 100 - 315 Hz
(-) | bijna geen lage tonen - gemiddeld 28.5% lager dan de mediaan
(+) | de lage tonen zijn lineair (3% delta naar de vorige frequentie)
Midden 400 - 2000 Hz
(+) | evenwichtige middens - slechts 4.8% verwijderd van de mediaan
(+) | de middentonen zijn lineair (6.3% delta ten opzichte van de vorige frequentie)
Hoog 2 - 16 kHz
(+) | evenwichtige hoogtepunten - slechts 1.5% verwijderd van de mediaan
(+) | de hoge tonen zijn lineair (2.6% delta naar de vorige frequentie)
Algemeen 100 - 16.000 Hz
(±) | lineariteit van het totale geluid is gemiddeld (17.8% verschil met de mediaan)
Vergeleken met dezelfde klasse
» 53% van alle geteste apparaten in deze klasse waren beter, 10% vergelijkbaar, 37% slechter
» De beste had een delta van 6%, het gemiddelde was 18%, de slechtste was 132%
Vergeleken met alle geteste toestellen
» 36% van alle geteste apparaten waren beter, 8% gelijk, 56% slechter
» De beste had een delta van 4%, het gemiddelde was 23%, de slechtste was 134%
Apple MacBook 12 (Early 2016) 1.1 GHz audioanalyse
(+) | luidsprekers kunnen relatief luid spelen (83.6 dB)
Bas 100 - 315 Hz
(±) | verminderde zeebaars - gemiddeld 11.3% lager dan de mediaan
(±) | lineariteit van de lage tonen is gemiddeld (14.2% delta ten opzichte van de vorige frequentie)
Midden 400 - 2000 Hz
(+) | evenwichtige middens - slechts 2.4% verwijderd van de mediaan
(+) | de middentonen zijn lineair (5.5% delta ten opzichte van de vorige frequentie)
Hoog 2 - 16 kHz
(+) | evenwichtige hoogtepunten - slechts 2% verwijderd van de mediaan
(+) | de hoge tonen zijn lineair (4.5% delta naar de vorige frequentie)
Algemeen 100 - 16.000 Hz
(+) | het totale geluid is lineair (10.2% verschil met de mediaan)
Vergeleken met dezelfde klasse
» 7% van alle geteste apparaten in deze klasse waren beter, 2% vergelijkbaar, 90% slechter
» De beste had een delta van 5%, het gemiddelde was 18%, de slechtste was 53%
Vergeleken met alle geteste toestellen
» 5% van alle geteste apparaten waren beter, 1% gelijk, 94% slechter
» De beste had een delta van 4%, het gemiddelde was 23%, de slechtste was 134%
| Uit / Standby | |
| Inactief | |
| Belasting |
|
Key:
min: | |
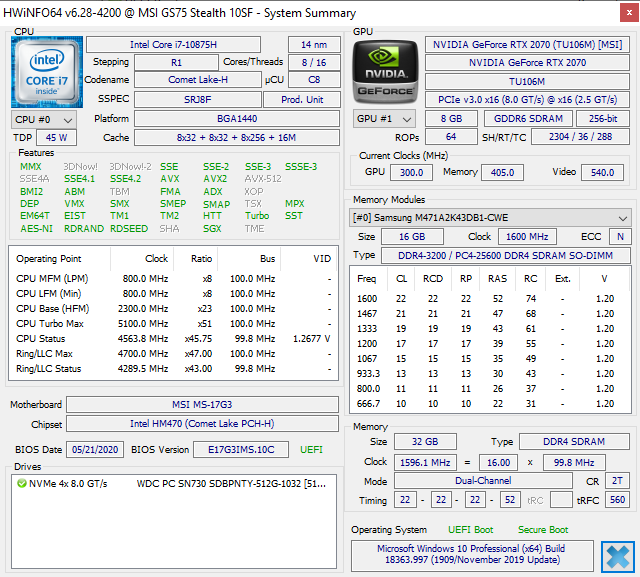
| MSI GS75 10SF-609US i7-10875H, GeForce RTX 2070 Max-Q, WDC PC SN730 SDBPNTY-512G, IPS, 1920x1080, 17.3" | Razer Blade Pro 17 RTX 2070 Max-Q 300 Hz i7-10875H, GeForce RTX 2070 Max-Q, Lite-On CA5-8D512, IPS, 1920x1080, 17.3" | Aorus 17G XB i7-10875H, GeForce RTX 2070 Super Max-Q, Samsung SSD PM981a MZVLB512HBJQ, IPS, 1920x1080, 17.3" | Asus ROG Zephyrus S GX701GXR i7-9750H, GeForce RTX 2080 Max-Q, Samsung SSD PM981 MZVLB1T0HALR, IPS, 1920x1080, 17.3" | MSI GS73 Stealth 8RF-011 i7-8750H, GeForce GTX 1070 Max-Q, Samsung PM961 MZVLW256HEHP, TN, 1920x1080, 17.3" | MSI GS75 Stealth 9SG i7-9750H, GeForce RTX 2080 Max-Q, 2x Samsung SSD PM981 MZVLB1T0HALR (RAID 0), IPS, 1920x1080, 17.3" | |
|---|---|---|---|---|---|---|
| Power Consumption | 1% | -2% | -14% | 28% | 17% | |
| Idle Minimum * (Watt) | 19.2 | 19.6 -2% | 20 -4% | 32 -67% | 8 58% | 13 32% |
| Idle Average * (Watt) | 22.4 | 21.7 3% | 23 -3% | 34 -52% | 14 37% | 17 24% |
| Idle Maximum * (Watt) | 34.7 | 36.1 -4% | 38 -10% | 36 -4% | 22 37% | 25 28% |
| Load Average * (Watt) | 106.7 | 115.6 -8% | 105 2% | 95 11% | 92 14% | 96 10% |
| Witcher 3 ultra * (Watt) | 160.5 | 157 2% | 158 2% | 155 3% | 154 4% | 156 3% |
| Load Maximum * (Watt) | 248.7 | 219.9 12% | 243 2% | 187 25% | 207 17% | 239 4% |
* ... kleiner is beter
| MSI GS75 10SF-609US i7-10875H, GeForce RTX 2070 Max-Q, 80.25 Wh | Razer Blade Pro 17 RTX 2070 Max-Q 300 Hz i7-10875H, GeForce RTX 2070 Max-Q, 70 Wh | Aorus 17G XB i7-10875H, GeForce RTX 2070 Super Max-Q, 94 Wh | Alienware m17 R2 P41E i9-9980HK, GeForce RTX 2080 Max-Q, 76 Wh | Asus ROG Zephyrus S GX701GXR i7-9750H, GeForce RTX 2080 Max-Q, 76 Wh | MSI GS73 Stealth 8RF-011 i7-8750H, GeForce GTX 1070 Max-Q, 51 Wh | |
|---|---|---|---|---|---|---|
| Batterijduur | 0% | 8% | -36% | -54% | -47% | |
| Reader / Idle (h) | 8.6 | 10 16% | 7.1 -17% | 4.1 -52% | 5.8 -33% | |
| WiFi v1.3 (h) | 4.9 | 4.9 0% | 7.5 53% | 4.8 -2% | 3 -39% | 3.3 -33% |
| Load (h) | 4.1 | 2.2 -46% | 0.5 -88% | 1.2 -71% | 1 -76% |
Pro
Contra

Voor het volledige, Engelse testrapport, klik hier.
Het grootste pluspunt van de GS75 is zijn zeer hoge prestaties per gewicht ratio. Je gaat niet nog een 17,3-inch gaming laptop vinden met zowel Core i9 als GeForce RTX 2080 Max-Q graphics die zo licht is als onze MSI.
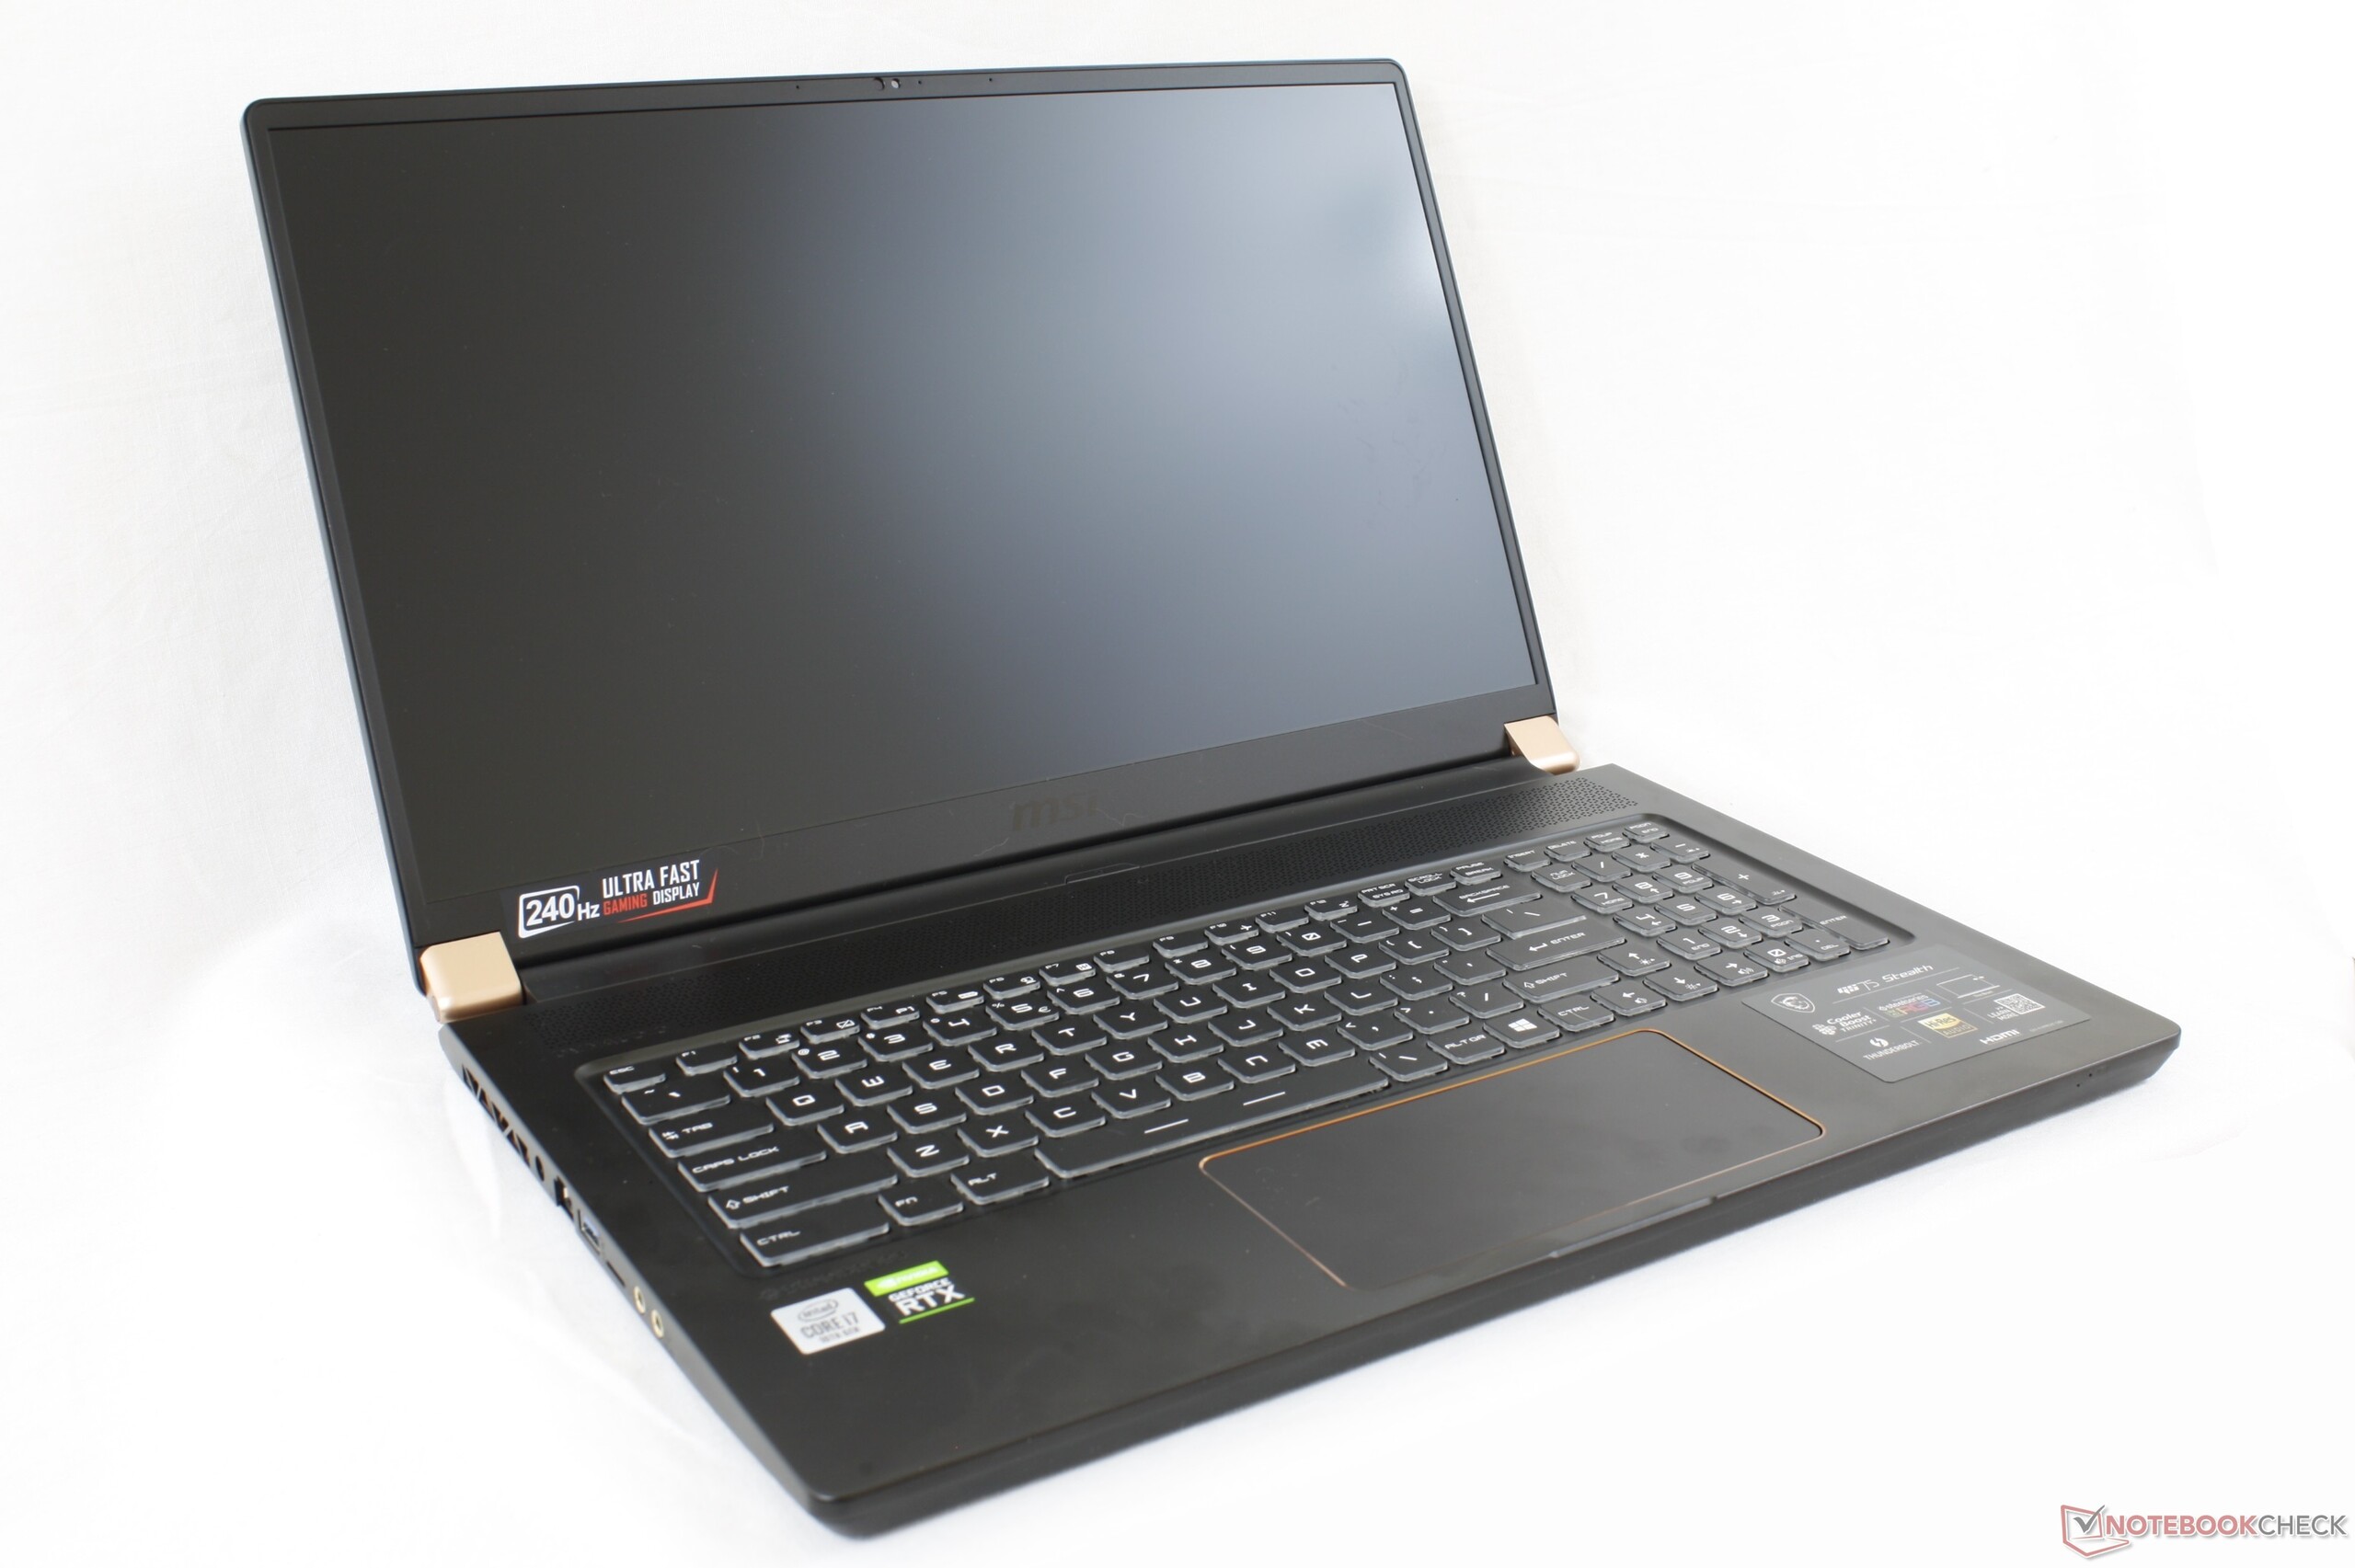
Het grootste voordeel van het systeem is echter direct gekoppeld aan het grootste nadeel. Omdat het zo licht is, kraakt en buigt het chassis meer dan de meeste andere uiltra-dunne game-laptops, waaronder de Razer Blade Pro of Alienware m17. U wilt waarschijnlijk een hoogwaardige draagtas als u van plan bent om veel met het systeem te reizen.
Wat betreft de nieuwe CPU en GPU opties, bieden de Core i9 en RTX 2070 Super Max-Q slechts zeer marginale verbeteringen ten opzichte van de Core i7-10875H en RTX 2070 Max-Q, respectievelijk. Gebruikers krijgen betere prestaties per dollar door hier vast te houden aan onze Core i7 en RTX 2070 Max-Q configuratie of alles uit te voeren voor de RTX 2080 Super Max-Q.
Als u veel reist, dan zal de lichtgewicht MSI GS75 een aantrekkelijk pakket zijn, vooral gezien de zeer hoogwaardige hardware. Als u voornamelijk binnenshuis of in een kantoor werkt of gamed, zijn er ook andere opties beschikbaar met een steviger chassis.
MSI GS75 10SF-609US
- 29-07-2020 v7 (old)
Allen Ngo
Price comparison
