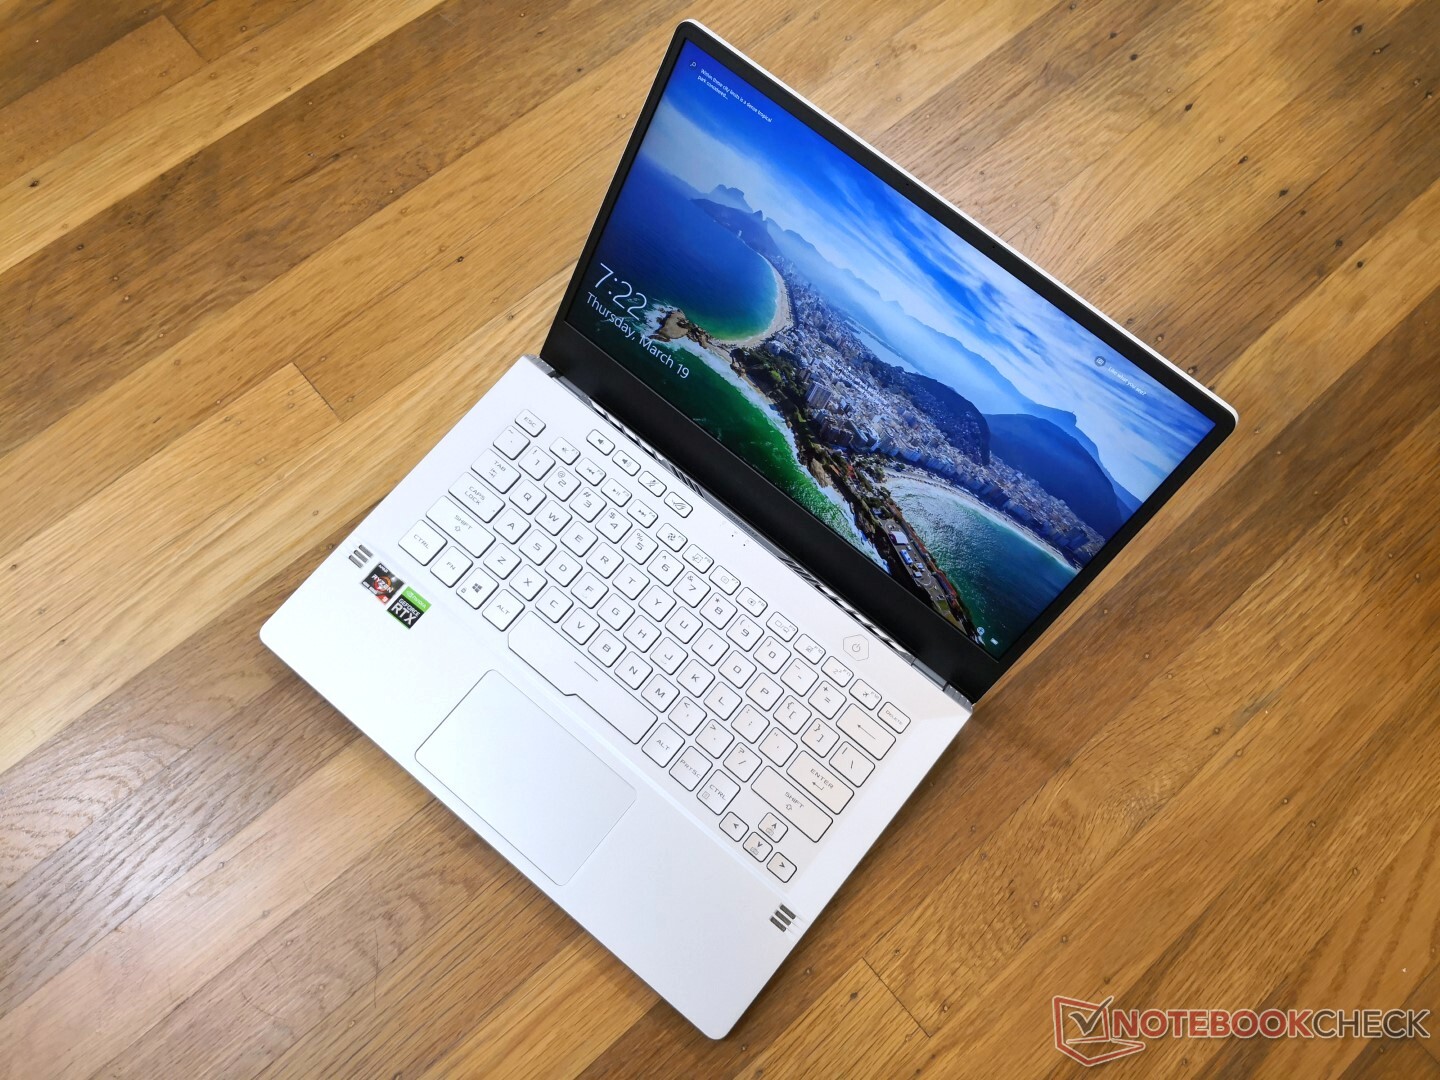
Kort testrapport Asus Zephyrus G14 Ryzen 9 GeForce RTX 2060 Max-Q Laptop: de Core i9 bij het grofvuil
Evaluatie | Datum | Model | Gewicht | Hoogte | Formaat | Resolutie | Beste prijs |
|---|---|---|---|---|---|---|---|
| 83.6 % v7 (old) | 03-2020 | Asus Zephyrus G14 GA401IV R9 4900HS, GeForce RTX 2060 Max-Q | 1.6 kg | 17.9 mm | 14.00" | 1920x1080 | |
| 82.9 % v7 (old) | 10-2019 | Asus ROG Zephyrus M15 GU502GU-XB74 i7-9750H, GeForce GTX 1660 Ti Mobile | 2 kg | 18.9 mm | 15.60" | 1920x1080 | |
| 84.2 % v7 (old) | 09-2019 | Razer Blade 15 GTX 1660 Ti i7-9750H, GeForce GTX 1660 Ti Mobile | 2.1 kg | 19.9 mm | 15.60" | 1920x1080 | |
| 83.8 % v7 (old) | 03-2020 | MSI GS65 Stealth 9SG i7-9750H, GeForce RTX 2080 Max-Q | 2 kg | 18 mm | 15.60" | 1920x1080 | |
| 83 % v7 (old) | 09-2019 | Alienware m15 R2 P87F i7-9750H, GeForce RTX 2080 Max-Q | 2.2 kg | 18.3 mm | 15.60" | 1920x1080 | |
| 84.2 % v7 (old) | 02-2020 | MSI Prestige 14 A10SC-009 i7-10710U, GeForce GTX 1650 Max-Q | 1.3 kg | 16 mm | 14.00" | 3840x2160 |
| |||||||||||||||||||||||||
Helderheidsverdeling: 87 %
Helderheid in Batterij-modus: 192.3 cd/m²
Contrast: 1239:1 (Zwart: 0.26 cd/m²)
ΔE ColorChecker Calman: 2.43 | ∀{0.5-29.43 Ø4.71}
calibrated: 2.29
ΔE Greyscale Calman: 3.3 | ∀{0.09-98 Ø4.96}
91.9% sRGB (Argyll 1.6.3 3D)
60% AdobeRGB 1998 (Argyll 1.6.3 3D)
67.2% AdobeRGB 1998 (Argyll 3D)
92% sRGB (Argyll 3D)
66.5% Display P3 (Argyll 3D)
Gamma: 2.22
CCT: 6902 K
| Asus Zephyrus G14 GA401IV CEC PA LM140LF-1F01, IPS, 14", 1920x1080 | Asus ROG Zephyrus M15 GU502GU-XB74 AU Optronics B156HAN08.2, IPS, 15.6", 1920x1080 | Razer Blade 15 GTX 1660 Ti BOE NV156FHM-N4K, IPS, 15.6", 1920x1080 | MSI GS65 Stealth 9SG Sharp LQ156M1JW03 (SHP14C5), IPS, 15.6", 1920x1080 | Alienware m15 R2 P87F Sharp LQ156M1, IPS, 15.6", 1920x1080 | MSI Prestige 14 A10SC-009 IPS, 14", 3840x2160 | |
|---|---|---|---|---|---|---|
| Display | -1% | -1% | 4% | -0% | ||
| Display P3 Coverage (%) | 66.5 | 66.5 0% | 65.3 -2% | 67.6 2% | 65.3 -2% | |
| sRGB Coverage (%) | 92 | 90.8 -1% | 91.8 0% | 97.5 6% | 95.1 3% | |
| AdobeRGB 1998 Coverage (%) | 67.2 | 66.5 -1% | 66.5 -1% | 68.9 3% | 65.9 -2% | |
| Response Times | 80% | 70% | 68% | 69% | -15% | |
| Response Time Grey 50% / Grey 80% * (ms) | 43.6 ? | 6.4 ? 85% | 13.6 ? 69% | 13.6 ? 69% | 16.4 ? 62% | 55 ? -26% |
| Response Time Black / White * (ms) | 34.8 ? | 8.8 ? 75% | 10 ? 71% | 12 ? 66% | 8.8 ? 75% | 36 ? -3% |
| PWM Frequency (Hz) | 200 ? | 23260 ? | 23810 ? | |||
| Screen | -17% | -17% | 13% | -39% | 24% | |
| Brightness middle (cd/m²) | 322.2 | 297.7 -8% | 312.7 -3% | 282.3 -12% | 324.2 1% | 567 76% |
| Brightness (cd/m²) | 302 | 280 -7% | 305 1% | 269 -11% | 304 1% | 516 71% |
| Brightness Distribution (%) | 87 | 84 -3% | 90 3% | 90 3% | 90 3% | 86 -1% |
| Black Level * (cd/m²) | 0.26 | 0.43 -65% | 0.27 -4% | 0.32 -23% | 0.38 -46% | 0.445 -71% |
| Contrast (:1) | 1239 | 692 -44% | 1158 -7% | 882 -29% | 853 -31% | 1274 3% |
| Colorchecker dE 2000 * | 2.43 | 3.13 -29% | 4.57 -88% | 1.17 52% | 5.01 -106% | 1.55 36% |
| Colorchecker dE 2000 max. * | 5.07 | 7.1 -40% | 6.81 -34% | 3.29 35% | 12.7 -150% | 5.14 -1% |
| Colorchecker dE 2000 calibrated * | 2.29 | 3.06 -34% | 2.91 -27% | 1.06 54% | 1.64 28% | 1.24 46% |
| Greyscale dE 2000 * | 3.3 | 1.9 42% | 4.3 -30% | 1.3 61% | 7.9 -139% | 1.48 55% |
| Gamma | 2.22 99% | 2.23 99% | 2.29 96% | 2.2 100% | 2.35 94% | 2.19 100% |
| CCT | 6902 94% | 6325 103% | 7098 92% | 6643 98% | 8455 77% | 6741 96% |
| Color Space (Percent of AdobeRGB 1998) (%) | 60 | 59.2 -1% | 59.4 -1% | 63.8 6% | 60.8 1% | |
| Color Space (Percent of sRGB) (%) | 91.9 | 90.5 -2% | 91.3 -1% | 97.5 6% | 95.5 4% | |
| Totaal Gemiddelde (Programma / Instellingen) | 21% /
-2% | 17% /
-3% | 28% /
18% | 10% /
-19% | 5% /
17% |
* ... kleiner is beter
Responstijd Scherm
| ↔ Responstijd Zwart naar Wit | ||
|---|---|---|
| 34.8 ms ... stijging ↗ en daling ↘ gecombineerd | ↗ 20.4 ms stijging | 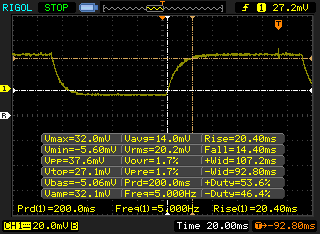 |
| ↘ 14.4 ms daling | ||
| Het scherm vertoonde trage responstijden in onze tests en is misschien te traag voor games. Ter vergelijking: alle testtoestellen variëren van 0.1 (minimum) tot 240 (maximum) ms. » 92 % van alle toestellen zijn beter. Dit betekent dat de gemeten responstijd slechter is dan het gemiddelde (19.8 ms) van alle geteste toestellen. | ||
| ↔ Responstijd 50% Grijs naar 80% Grijs | ||
| 43.6 ms ... stijging ↗ en daling ↘ gecombineerd | ↗ 21.2 ms stijging | 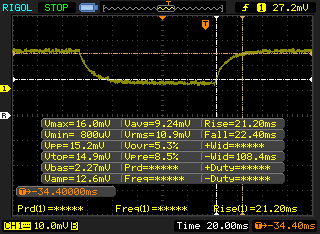 |
| ↘ 22.4 ms daling | ||
| Het scherm vertoonde trage responstijden in onze tests en is misschien te traag voor games. Ter vergelijking: alle testtoestellen variëren van 0.165 (minimum) tot 636 (maximum) ms. » 73 % van alle toestellen zijn beter. Dit betekent dat de gemeten responstijd slechter is dan het gemiddelde (30.9 ms) van alle geteste toestellen. | ||
Screen Flickering / PWM (Pulse-Width Modulation)
| Screen flickering / PWM niet waargenomen | 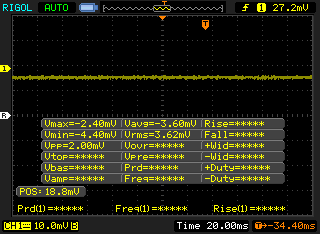 | ||
Ter vergelijking: 52 % van alle geteste toestellen maakten geen gebruik van PWM om de schermhelderheid te verlagen. Als het wel werd gebruikt, werd een gemiddelde van 7741 (minimum: 5 - maximum: 343500) Hz waargenomen. | |||
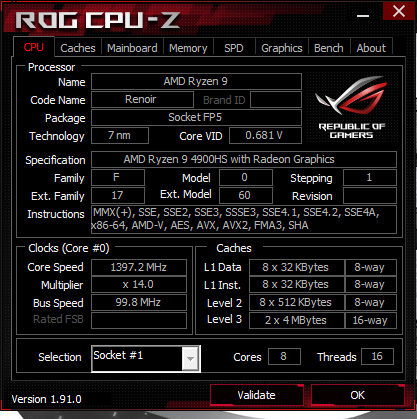
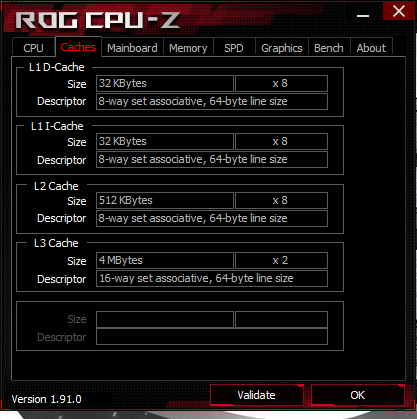
| Cinebench R11.5 | |
| CPU Single 64Bit | |
| Corsair One i160 | |
| AMD Radeon RX Vega 64 | |
| Asus Zephyrus G14 GA401IV | |
| MSI GE75 9SG | |
| CPU Multi 64Bit | |
| AMD Radeon RX Vega 64 | |
| Corsair One i160 | |
| MSI GE75 9SG | |
| Asus Zephyrus G14 GA401IV | |
| wPrime 2.10 - 1024m | |
| MSI GE75 9SG | |
| Corsair One i160 | |
| Asus Zephyrus G14 GA401IV | |
| AMD Radeon RX Vega 64 | |
* ... kleiner is beter
| PCMark 8 Home Score Accelerated v2 | 4815 punten | |
| PCMark 8 Work Score Accelerated v2 | 5738 punten | |
| PCMark 10 Score | 5751 punten | |
Help | ||
| Asus Zephyrus G14 GA401IV Intel SSD 660p 1TB SSDPEKNW010T8 | Asus ROG Zephyrus M15 GU502GU-XB74 Intel SSD 660p SSDPEKNW512G8 | MSI GS65 Stealth 9SG Samsung SSD PM981 MZVLB512HAJQ | Alienware m15 R2 P87F 2x Toshiba XG6 KXG60ZNV512G (RAID 0) | MSI Prestige 14 A10SC-009 Samsung SSD PM981 MZVLB1T0HALR | |
|---|---|---|---|---|---|
| AS SSD | -30% | 47% | 23% | 60% | |
| Seq Read (MB/s) | 1278 | 1221 -4% | 2005 57% | 1925 51% | 2300 80% |
| Seq Write (MB/s) | 1624 | 911 -44% | 1580 -3% | 2371 46% | 2051 26% |
| 4K Read (MB/s) | 57.8 | 48.24 -17% | 49.33 -15% | 37.2 -36% | 46.23 -20% |
| 4K Write (MB/s) | 163 | 99.2 -39% | 103.8 -36% | 108.9 -33% | 84.6 -48% |
| 4K-64 Read (MB/s) | 582 | 321.4 -45% | 1241 113% | 1177 102% | 1552 167% |
| 4K-64 Write (MB/s) | 849 | 744 -12% | 1730 104% | 1135 34% | 1789 111% |
| Access Time Read * (ms) | 0.036 | 0.071 -97% | 0.054 -50% | 0.065 -81% | 0.049 -36% |
| Access Time Write * (ms) | 0.112 | 0.139 -24% | 0.036 68% | 0.108 4% | 0.045 60% |
| Score Read (Points) | 768 | 492 -36% | 1490 94% | 1407 83% | 1828 138% |
| Score Write (Points) | 1174 | 934 -20% | 1991 70% | 1481 26% | 2079 77% |
| Score Total (Points) | 2372 | 1681 -29% | 4230 78% | 3633 53% | 4831 104% |
| Copy ISO MB/s (MB/s) | 1660 | 906 -45% | 3025 82% | 2073 25% | |
| Copy Program MB/s (MB/s) | 443.5 | 486.6 10% | 713 61% | 576 30% | |
| Copy Game MB/s (MB/s) | 1162 | 952 -18% | 1554 34% | 1426 23% | |
| CrystalDiskMark 5.2 / 6 | -19% | -3% | 20% | 7% | |
| Write 4K (MB/s) | 189.5 | 156 -18% | 91.3 -52% | 108.8 -43% | 163.8 -14% |
| Read 4K (MB/s) | 62.7 | 60.7 -3% | 40.73 -35% | 45.41 -28% | 48.6 -22% |
| Write Seq (MB/s) | 1735 | 968 -44% | 1915 10% | 2467 42% | 2269 31% |
| Read Seq (MB/s) | 1608 | 1619 1% | 2051 28% | 2456 53% | 1963 22% |
| Write 4K Q32T1 (MB/s) | 475.5 | 485 2% | 308.3 -35% | 532 12% | 289.8 -39% |
| Read 4K Q32T1 (MB/s) | 555 | 337.3 -39% | 417.4 -25% | 590 6% | 373.6 -33% |
| Write Seq Q32T1 (MB/s) | 1802 | 969 -46% | 1922 7% | 2801 55% | 2395 33% |
| Read Seq Q32T1 (MB/s) | 1929 | 1825 -5% | 3395 76% | 3172 64% | 3479 80% |
| Totaal Gemiddelde (Programma / Instellingen) | -25% /
-26% | 22% /
29% | 22% /
22% | 34% /
38% |
* ... kleiner is beter

| 3DMark | |
| 1920x1080 Fire Strike Graphics | |
| KFA2 GeForce RTX 2080 Ti EX | |
| Alienware m17 R2 P41E | |
| MSI RTX 2060 Gaming Z 6G | |
| Walmart EVOO Gaming 17 | |
| Schenker XMG Neo 15 XNE15M19 | |
| Asus Zephyrus G14 GA401IV | |
| Maingear Vector 15 | |
| Asus Zephyrus S GX531GM | |
| Lenovo IdeaPad S740-15IRH | |
| Asus TUF FX705GE-EW096T | |
| 2560x1440 Time Spy Graphics | |
| KFA2 GeForce RTX 2080 Ti EX | |
| Alienware m17 R2 P41E | |
| MSI RTX 2060 Gaming Z 6G | |
| Walmart EVOO Gaming 17 | |
| Schenker XMG Neo 15 XNE15M19 | |
| Asus Zephyrus G14 GA401IV | |
| Maingear Vector 15 | |
| Asus Zephyrus S GX531GM | |
| Lenovo IdeaPad S740-15IRH | |
| Asus TUF FX705GE-EW096T | |
| 2560x1440 Port Royal Graphics | |
| KFA2 GeForce RTX 2080 Ti EX | |
| Alienware m17 R2 P41E | |
| Walmart EVOO Gaming 17 | |
| Schenker XMG Neo 15 XNE15M19 | |
| Asus Zephyrus G14 GA401IV | |
| 2560x1440 Time Spy Score | |
| KFA2 GeForce RTX 2080 Ti EX | |
| Alienware m17 R2 P41E | |
| MSI RTX 2060 Gaming Z 6G | |
| Walmart EVOO Gaming 17 | |
| Schenker XMG Neo 15 XNE15M19 | |
| Asus Zephyrus G14 GA401IV | |
| Maingear Vector 15 | |
| Asus Zephyrus S GX531GM | |
| Lenovo IdeaPad S740-15IRH | |
| Asus TUF FX705GE-EW096T | |
| 3DMark 11 | |
| 1280x720 Performance GPU | |
| KFA2 GeForce RTX 2080 Ti EX | |
| Alienware m17 R2 P41E | |
| MSI RTX 2060 Gaming Z 6G | |
| Walmart EVOO Gaming 17 | |
| Schenker XMG Neo 15 XNE15M19 | |
| Asus Zephyrus G14 GA401IV | |
| Maingear Vector 15 | |
| Asus Zephyrus S GX531GM | |
| Lenovo IdeaPad S740-15IRH | |
| Asus TUF FX705GE-EW096T | |
| 1280x720 Performance Combined | |
| KFA2 GeForce RTX 2080 Ti EX | |
| Alienware m17 R2 P41E | |
| MSI RTX 2060 Gaming Z 6G | |
| Asus Zephyrus G14 GA401IV | |
| Walmart EVOO Gaming 17 | |
| Maingear Vector 15 | |
| Schenker XMG Neo 15 XNE15M19 | |
| Lenovo IdeaPad S740-15IRH | |
| Asus TUF FX705GE-EW096T | |
| Asus Zephyrus S GX531GM | |
| 3DMark 06 Standard Score | 37332 punten | |
| 3DMark Vantage P Result | 50957 punten | |
| 3DMark 11 Performance | 18937 punten | |
| 3DMark Ice Storm Standard Score | 85539 punten | |
| 3DMark Cloud Gate Standard Score | 38287 punten | |
| 3DMark Fire Strike Score | 14649 punten | |
| 3DMark Time Spy Score | 6171 punten | |
Help | ||
| Shadow of the Tomb Raider | |
| 1280x720 Lowest Preset | |
| Eurocom Sky X4C i9-9900KS | |
| MSI GE65 Raider 9SF-049US | |
| Alienware m17 R2 P41E | |
| MSI GF65 9SD | |
| MSI RTX 2060 Gaming Z 6G | |
| Walmart EVOO Gaming 17 | |
| HP Omen X 2S 15-dg0075cl | |
| Asus Zephyrus G14 GA401IV | |
| Lenovo Yoga C940-15IRH | |
| Asus ROG Zephyrus G15 GA502DU | |
| 1920x1080 High Preset AA:SM | |
| Eurocom Sky X4C i9-9900KS | |
| Alienware m17 R2 P41E | |
| MSI RTX 2060 Gaming Z 6G | |
| MSI GE65 Raider 9SF-049US | |
| Walmart EVOO Gaming 17 | |
| HP Omen X 2S 15-dg0075cl | |
| Asus Zephyrus G14 GA401IV | |
| MSI GF65 9SD | |
| Asus TUF FX705GM | |
| Asus ROG Zephyrus G15 GA502DU | |
| Lenovo Yoga C940-15IRH | |
| 1920x1080 Highest Preset AA:T | |
| Eurocom Sky X4C i9-9900KS | |
| Alienware m17 R2 P41E | |
| MSI GE65 Raider 9SF-049US | |
| MSI RTX 2060 Gaming Z 6G | |
| HP Omen X 2S 15-dg0075cl | |
| Walmart EVOO Gaming 17 | |
| Asus Zephyrus G14 GA401IV | |
| MSI GF65 9SD | |
| Asus ROG Zephyrus G15 GA502DU | |
| Asus TUF FX705GM | |
| Lenovo Yoga C940-15IRH | |
| The Witcher 3 | |
| 1024x768 Low Graphics & Postprocessing | |
| Eurocom Sky X4C i9-9900KS | |
| Alienware m17 R2 P41E | |
| HP Omen X 2S 15-dg0075cl | |
| Walmart EVOO Gaming 17 | |
| MSI GE65 Raider 9SF-049US | |
| MSI GF65 9SD | |
| MSI RTX 2060 Gaming Z 6G | |
| Asus Zephyrus G14 GA401IV | |
| Lenovo Yoga C940-15IRH | |
| Asus ROG Zephyrus G15 GA502DU | |
| 1920x1080 Ultra Graphics & Postprocessing (HBAO+) | |
| Eurocom Sky X4C i9-9900KS | |
| MSI GE65 Raider 9SF-049US | |
| Alienware m17 R2 P41E | |
| MSI RTX 2060 Gaming Z 6G | |
| HP Omen X 2S 15-dg0075cl | |
| Walmart EVOO Gaming 17 | |
| MSI GF65 9SD | |
| Asus Zephyrus G14 GA401IV | |
| Asus ROG Zephyrus G15 GA502DU | |
| Asus TUF FX705GM | |
| Lenovo Yoga C940-15IRH | |
| Rocket League | |
| 1280x720 Performance | |
| Lenovo Yoga C940-15IRH | |
| Asus Zephyrus G14 GA401IV | |
| MSI RTX 2060 Gaming Z 6G | |
| Asus ROG Zephyrus G15 GA502DU | |
| 1920x1080 High Quality AA:High FX | |
| MSI RTX 2060 Gaming Z 6G | |
| Asus Zephyrus G14 GA401IV | |
| Lenovo Yoga C940-15IRH | |
| Asus ROG Zephyrus G15 GA502DU | |
| lage | gem. | hoge | ultra | |
|---|---|---|---|---|
| Guild Wars 2 (2012) | 130.3 | 67.3 | 67.4 | |
| BioShock Infinite (2013) | 278.3 | 252.3 | 229.5 | 126.2 |
| The Witcher 3 (2015) | 232.2 | 168.2 | 100.6 | 58.4 |
| Metal Gear Solid V (2015) | 60 | 60 | 60 | 59.2 |
| Dota 2 Reborn (2015) | 120.8 | 115.1 | 107.8 | 103.8 |
| Ashes of the Singularity (2016) | 100.4 | 72.8 | 66.8 | |
| Doom (2016) | 125 | 125 | 118.2 | 111.5 |
| Overwatch (2016) | 299.9 | 299.7 | 229.7 | 146.9 |
| Rocket League (2017) | 246.9 | 249.7 | 219.3 | |
| Middle-earth: Shadow of War (2017) | 155 | 123 | 97 | 76 |
| Fortnite (2018) | 124 | 110.2 | 107.4 | 81.2 |
| Final Fantasy XV Benchmark (2018) | 141 | 82.7 | 62.4 | |
| X-Plane 11.11 (2018) | 94.9 | 81.9 | 69.7 | |
| Monster Hunter World (2018) | 104.5 | 94.2 | 75.6 | 63.6 |
| Shadow of the Tomb Raider (2018) | 118 | 90 | 84 | 74 |
| Assassin´s Creed Odyssey (2018) | 97 | 79 | 65 | 45 |
| Apex Legends (2019) | 143.6 | 142.8 | 126.2 | 116.6 |
| Metro Exodus (2019) | 129.6 | 72.7 | 55.2 | 43.8 |
| The Division 2 (2019) | 154 | 92 | 74 | 56 |
| Anno 1800 (2019) | 81.5 | 81.6 | 61.4 | 36.5 |
| Total War: Three Kingdoms (2019) | 201.1 | 103.3 | 69.2 | 50.7 |
| F1 2019 (2019) | 196 | 137 | 116 | 101 |
| Borderlands 3 (2019) | 117 | 89.5 | 61.9 | 48.3 |
| Ghost Recon Breakpoint (2019) | 123 | 82 | 75 | 55 |
| Need for Speed Heat (2019) | 103.2 | 88.7 | 82.2 | 79 |
| Escape from Tarkov (2020) | 78.5 | 68.5 | 68.2 | 85.3 |
| Hunt Showdown (2020) | 194.2 | 96.3 | 75.7 | |
| Doom Eternal (2020) | 176.1 | 108.7 | 95.7 | 93.3 |
| Asus Zephyrus G14 GA401IV GeForce RTX 2060 Max-Q, R9 4900HS, Intel SSD 660p 1TB SSDPEKNW010T8 | Asus ROG Zephyrus M15 GU502GU-XB74 GeForce GTX 1660 Ti Mobile, i7-9750H, Intel SSD 660p SSDPEKNW512G8 | Razer Blade 15 GTX 1660 Ti GeForce GTX 1660 Ti Mobile, i7-9750H, Samsung SSD PM981 MZVLB256HAHQ | MSI GS65 Stealth 9SG GeForce RTX 2080 Max-Q, i7-9750H, Samsung SSD PM981 MZVLB512HAJQ | Alienware m15 R2 P87F GeForce RTX 2080 Max-Q, i7-9750H, 2x Toshiba XG6 KXG60ZNV512G (RAID 0) | MSI Prestige 14 A10SC-009 GeForce GTX 1650 Max-Q, i7-10710U, Samsung SSD PM981 MZVLB1T0HALR | |
|---|---|---|---|---|---|---|
| Noise | -1% | 1% | 2% | -10% | 1% | |
| uit / omgeving * (dB) | 28.1 | 28.2 -0% | 28.5 -1% | 28.3 -1% | 28.3 -1% | 30.3 -8% |
| Idle Minimum * (dB) | 30.4 | 28.7 6% | 30.3 -0% | 30.4 -0% | 28.5 6% | 30.3 -0% |
| Idle Average * (dB) | 31.5 | 30.5 3% | 30.5 3% | 30.5 3% | 28.5 10% | 30.3 4% |
| Idle Maximum * (dB) | 33.7 | 31 8% | 30.5 9% | 30.6 9% | 49 -45% | 30.3 10% |
| Load Average * (dB) | 34.3 | 39 -14% | 41 -20% | 37.6 -10% | 49 -43% | 40.2 -17% |
| Witcher 3 ultra * (dB) | 53.5 | 54.2 -1% | 48 10% | 46 14% | 49 8% | |
| Load Maximum * (dB) | 53.5 | 59.6 -11% | 51.9 3% | 55.1 -3% | 55 -3% | 43.5 19% |
* ... kleiner is beter
Geluidsniveau
| Onbelast |
| 30.4 / 31.5 / 33.7 dB (A) |
| Belasting |
| 34.3 / 53.5 dB (A) |
 | ||
30 dB stil 40 dB(A) hoorbaar 50 dB(A) luid |
||
min: | ||
(+) De maximumtemperatuur aan de bovenzijde bedraagt 36 °C / 97 F, vergeleken met het gemiddelde van 40.4 °C / 105 F, variërend van 21.2 tot 68.8 °C voor de klasse Gaming.
(-) De bodem warmt op tot een maximum van 46.4 °C / 116 F, vergeleken met een gemiddelde van 43.2 °C / 110 F
(+) Bij onbelast gebruik bedraagt de gemiddelde temperatuur voor de bovenzijde 25 °C / 77 F, vergeleken met het apparaatgemiddelde van 33.9 °C / 93 F.
(±) Bij het spelen van The Witcher 3 is de gemiddelde temperatuur voor de bovenzijde 34.5 °C / 94 F, vergeleken met het apparaatgemiddelde van 33.9 °C / 93 F.
(+) De palmsteunen en het touchpad zijn met een maximum van ###max## °C / 82.8 F koeler dan de huidtemperatuur en voelen daarom koel aan.
(±) De gemiddelde temperatuur van de handpalmsteun van soortgelijke toestellen bedroeg 28.8 °C / 83.8 F (+0.6 °C / 1 F).
| Uit / Standby | |
| Inactief | |
| Belasting |
|
Key:
min: | |
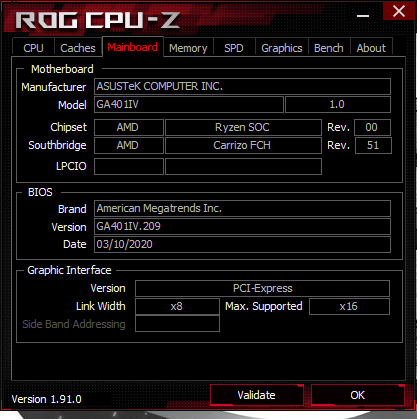
| Asus Zephyrus G14 GA401IV R9 4900HS, GeForce RTX 2060 Max-Q, Intel SSD 660p 1TB SSDPEKNW010T8, IPS, 1920x1080, 14" | Asus ROG Zephyrus M15 GU502GU-XB74 i7-9750H, GeForce GTX 1660 Ti Mobile, Intel SSD 660p SSDPEKNW512G8, IPS, 1920x1080, 15.6" | MSI GS65 Stealth 9SG i7-9750H, GeForce RTX 2080 Max-Q, Samsung SSD PM981 MZVLB512HAJQ, IPS, 1920x1080, 15.6" | MSI Prestige 14 A10SC-009 i7-10710U, GeForce GTX 1650 Max-Q, Samsung SSD PM981 MZVLB1T0HALR, IPS, 3840x2160, 14" | Razer Blade Stealth i7-1065G7 Iris Plus i7-1065G7, Iris Plus Graphics G7 (Ice Lake 64 EU), Samsung SSD PM981 MZVLB256HAHQ, IPS, 1920x1080, 13.3" | Dell G7 7590 i7-9750H, GeForce RTX 2060 Mobile, Toshiba BG3 KBG30ZMS256G, IPS, 1920x1080, 15.6" | |
|---|---|---|---|---|---|---|
| Power Consumption | -117% | -86% | 13% | 36% | -74% | |
| Idle Minimum * (Watt) | 5.5 | 17.6 -220% | 18.3 -233% | 5.2 5% | 5.9 -7% | 11.2 -104% |
| Idle Average * (Watt) | 9.3 | 24.7 -166% | 22 -137% | 12.2 -31% | 8.1 13% | 16.3 -75% |
| Idle Maximum * (Watt) | 15.8 | 56.3 -256% | 28.8 -82% | 14.3 9% | 11.2 29% | 46.2 -192% |
| Load Average * (Watt) | 92.2 | 111.1 -20% | 93 -1% | 67 27% | 44.3 52% | 123.3 -34% |
| Witcher 3 ultra * (Watt) | 112.4 | 149 -33% | 142.6 -27% | 41.9 63% | 135.6 -21% | |
| Load Maximum * (Watt) | 156.6 | 170 -9% | 215.9 -38% | 67 57% | 50.2 68% | 181.5 -16% |
* ... kleiner is beter
| Asus Zephyrus G14 GA401IV R9 4900HS, GeForce RTX 2060 Max-Q, 76 Wh | Asus ROG Zephyrus M15 GU502GU-XB74 i7-9750H, GeForce GTX 1660 Ti Mobile, 76 Wh | Razer Blade 15 GTX 1660 Ti i7-9750H, GeForce GTX 1660 Ti Mobile, 65 Wh | MSI GS65 Stealth 9SG i7-9750H, GeForce RTX 2080 Max-Q, 82 Wh | Alienware m15 R2 P87F i7-9750H, GeForce RTX 2080 Max-Q, 76 Wh | MSI Prestige 14 A10SC-009 i7-10710U, GeForce GTX 1650 Max-Q, 52 Wh | |
|---|---|---|---|---|---|---|
| Batterijduur | -41% | -43% | -37% | -52% | -23% | |
| Reader / Idle (h) | 19 | 7.1 -63% | 9.2 -52% | 9.9 -48% | ||
| WiFi v1.3 (h) | 9.6 | 4.5 -53% | 5.5 -43% | 6 -37% | 5.5 -43% | 5.9 -39% |
| Load (h) | 1.8 | 1.7 -6% | 0.7 -61% | 2.1 17% |
Pro
Contra
Dit is de verkorte versie van het originele artikel. Het volledige, Engelse testrapport vind je hier.
Alle gelekte AMD dia's en benchmarks die de Ryzen 9 met de Core i9 vergelijken blijken waar te zijn. De 7 nm Ryzen 9 4900HS presteert met mult-thread belastingen veruit beter dan de 14 nm Core i9-9880H. En is op alle andere vlakken gelijkwaardig aan de Core i9-9980H. Vergeleken met de snelste mobiele AMD CPU van vorig jaar, de Ryzen 7 3750H was, biedt de Ryzen 9 4900HS een significante sprong met betrekking tot de prestaties en prestaties-per-watt. Intel heeft veel in te halen wanneer ze hun concurrerende 10e generatie Comet Lake-H series uitbrengen komende maanden.
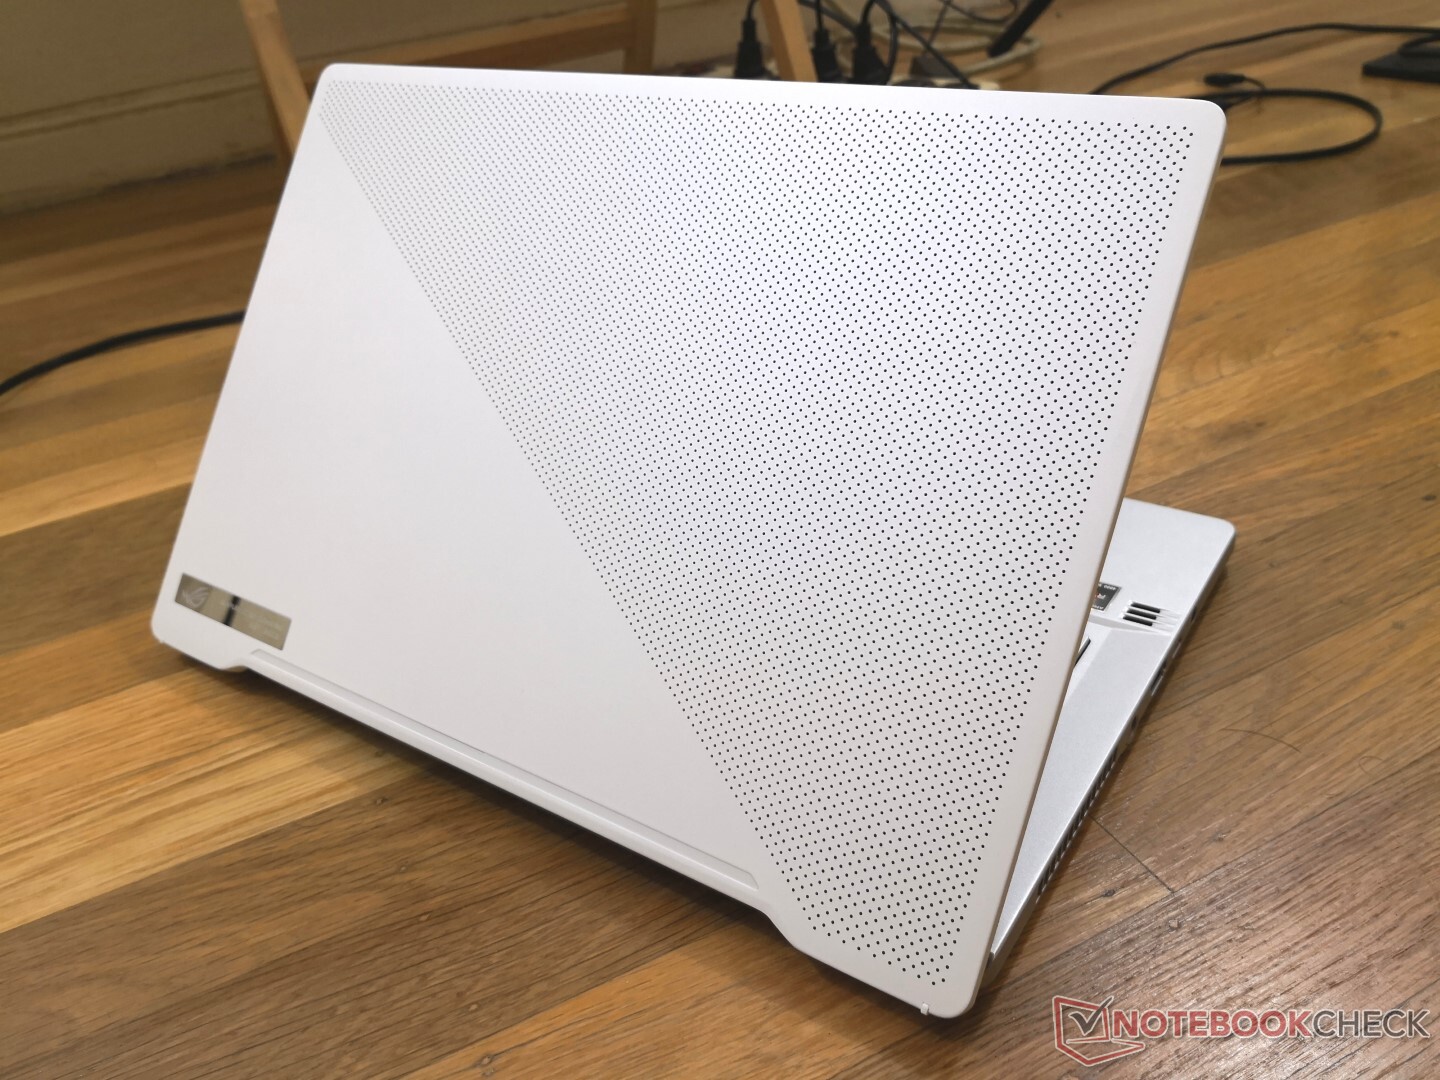
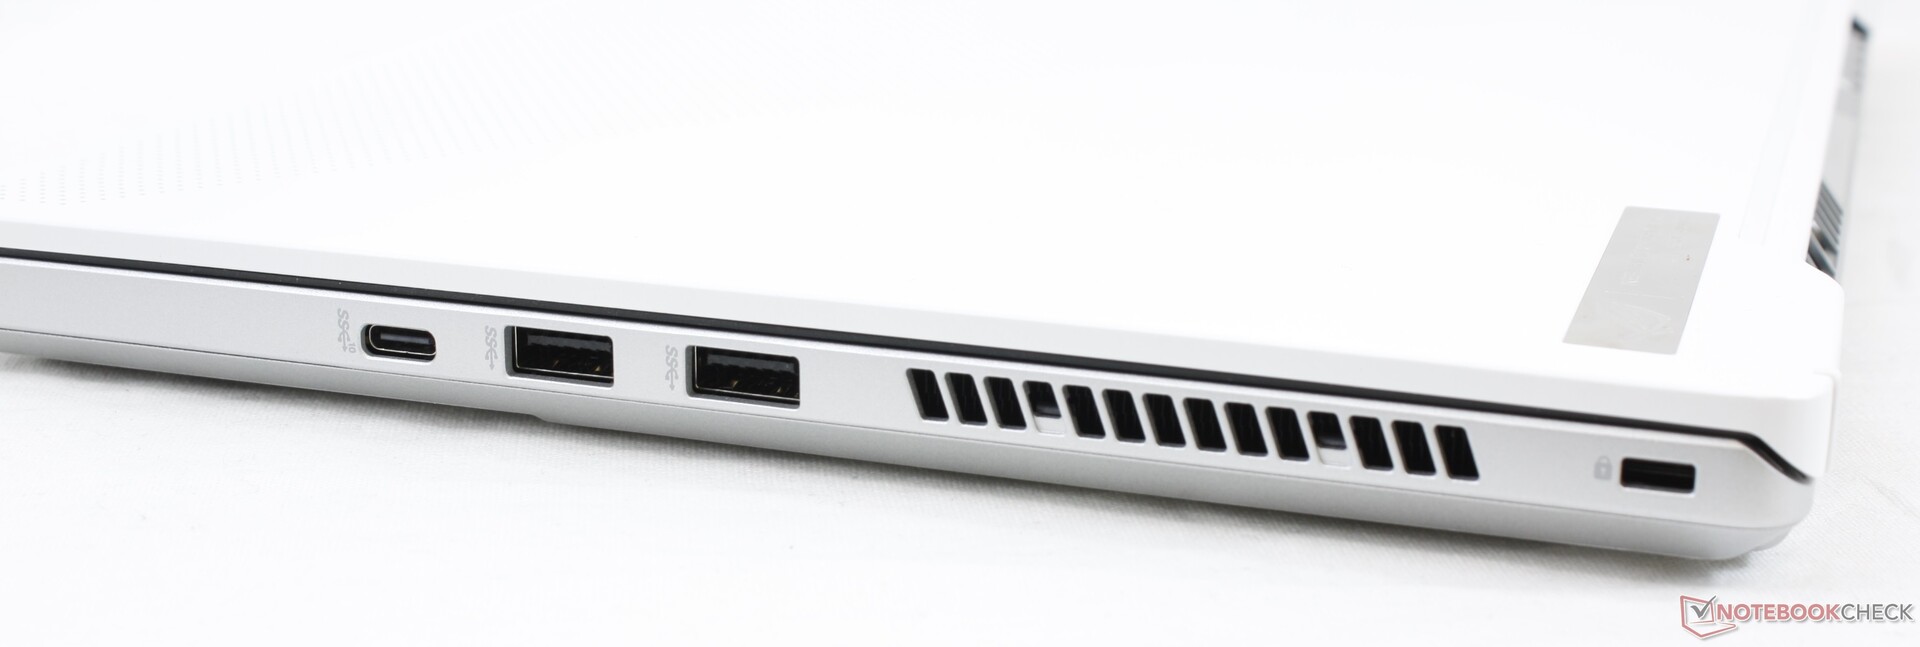
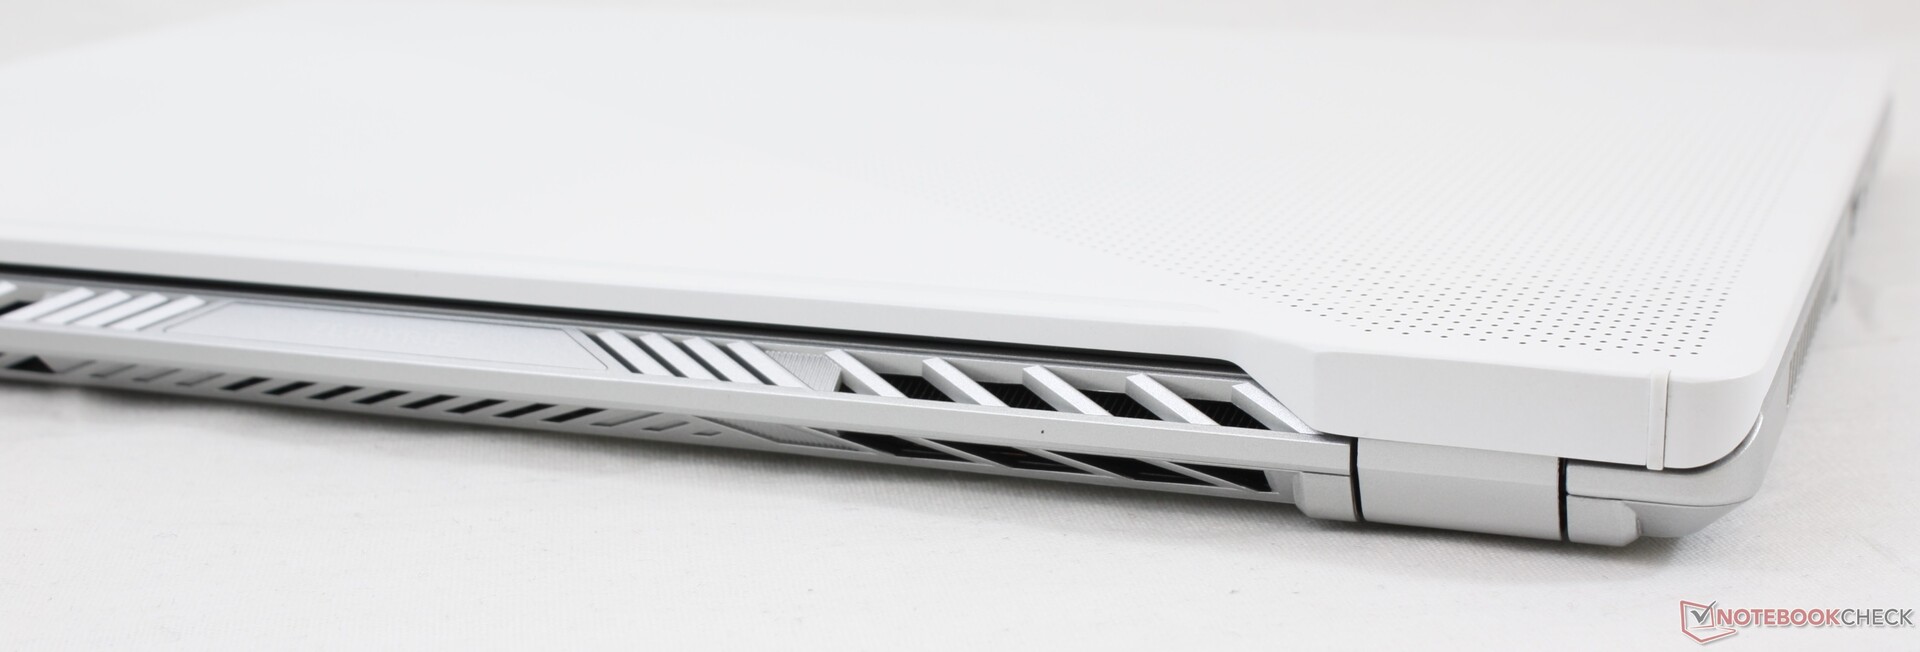
Behalve de nieuwe AMD processor zijn we verbijsterd over het feit dat Asus zoveel rekenkracht in een 14-inch behuizing met smalle schermranden kan stoppen zonder dat dit hevige throttling als gevolg heeft. We hebben het hier over prestaties die hoger zijn dan een Core i9 in een notebook dat eigenlijk een subnotebook is. Het onderhoudsgemak, vervangbare RAM en SSD, 120 Hz FreeSync beeldscherm, unieke Micro-LED rand verlichting en de USB Type-C poort zijn allen een kers op de taart en maken de Zephyrus G14 nog unieker dan deze al is.
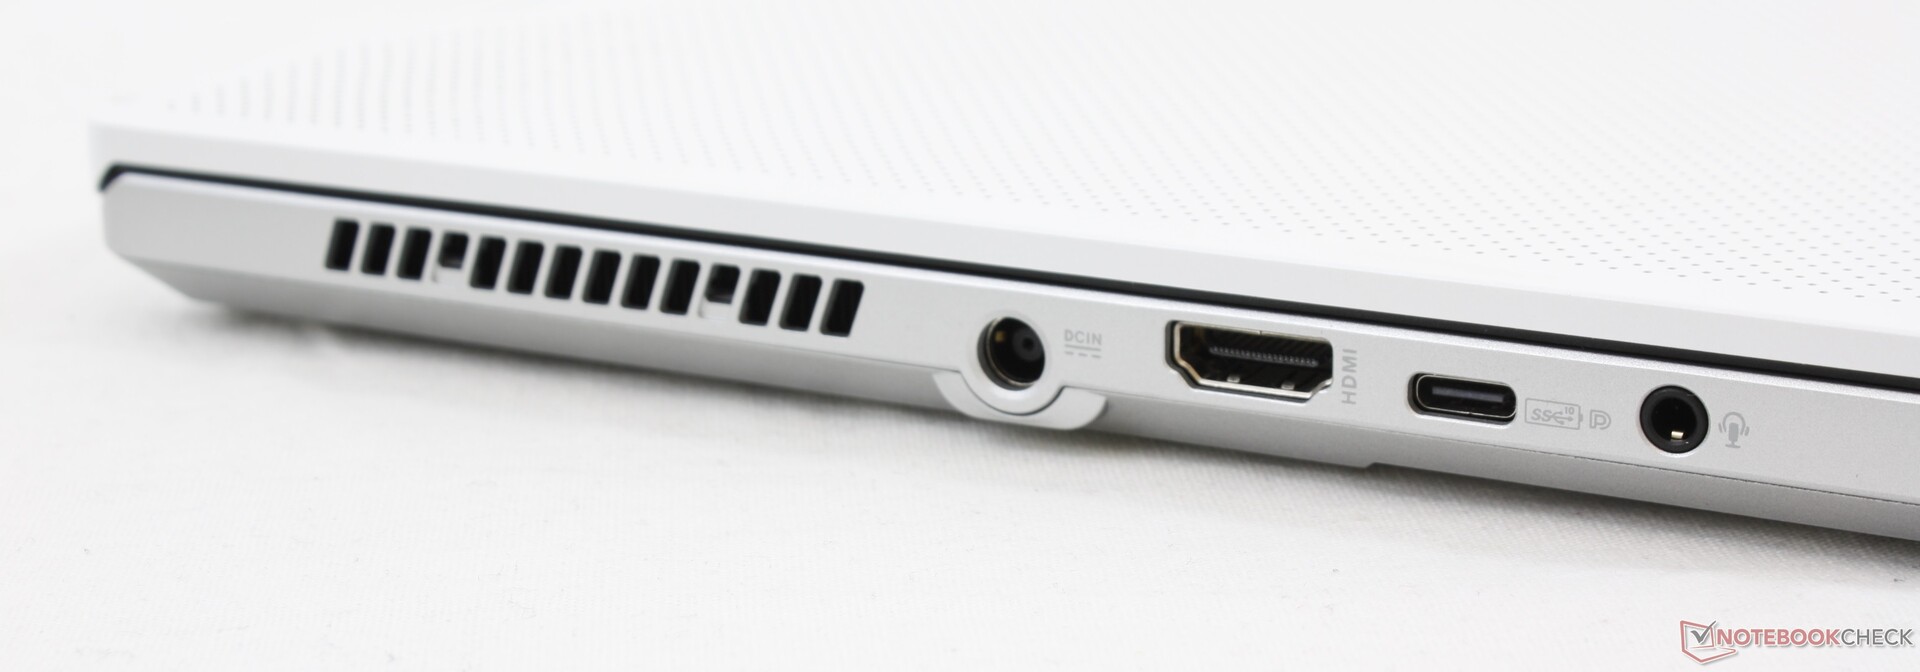
Er zijn wel een paar belangrijke minpunten. Ten eerste is de batterijduur hooguit matig. Ten tweede is het ventilatorgeluid erg luid en pulseert de ventilator meer dan we comfortabel vinden. Dit laatste leid erg als je gamed zonder een koptelefoon. Ten derde mocht de schermrand wel iets steviger zijn aangezien deze meer buigt dan Asus' ZenBook-laptops. Tot slot is de 20 ms zwart / wit responstijd van het scherm trager dan op veel 15.6-inch gaming laptops waar 3 ms en 5 ms de norm is. Het voelt fantastisch om games te kunnen spelen op zo een klein en krachtig systeem. Helaas herinnert de matige ghosting en de merkbare ventilatorgeluiden je eraan wat de beperkingen zijn.
Als je veel op reis bent en gebruik kunt maken van de belachelijke snelheid van het notebook, zullen de prestaties van de Zephyrus G14 je niet teleurstellen. Het alternatieven die er bij in de buurt komen zijn de 13.3-inch Razer Blade Stealth of de 14-inch MSI Prestige 14, maar deze systemen komen met tragere Core U CPU's en de GTX 1650 Max-Q GPU.
De Zephyrus G14 bevat een ongelooflijk hoeveelheid kracht, iets wat nooit vertoond is in dit formaat. Na verloop van tijd zal je de nadelen opmerken, maar je zou bereid kunnen zijn om deze te negeren als je realiseert hoeveel prestaties je ervoor terugkrijgt.
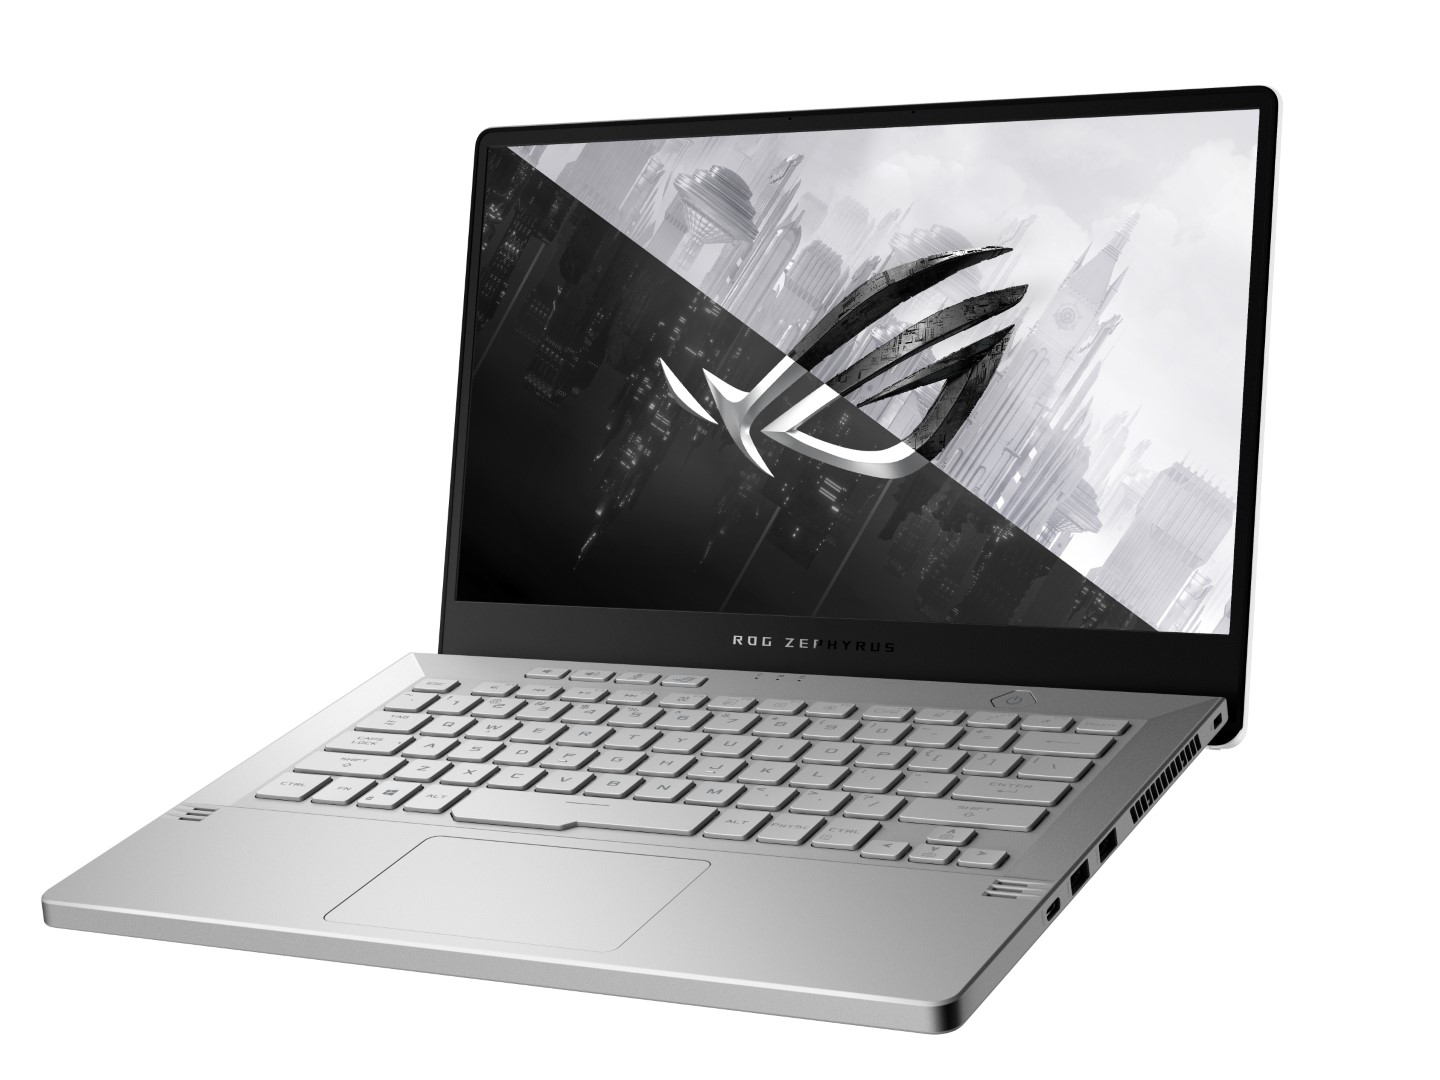
Asus Zephyrus G14 GA401IV
- 09-06-2020 v7 (old)
Allen Ngo
Price comparison
