Kort testrapport Dell G7 15 7590 Laptop: Alienware prestaties voor minder
Evaluatie | Datum | Model | Gewicht | Hoogte | Formaat | Resolutie | Beste prijs |
|---|---|---|---|---|---|---|---|
| 82.3 % v7 (old) | 10-2019 | Dell G7 7590 i7-9750H, GeForce RTX 2060 Mobile | 2.5 kg | 19.9 mm | 15.60" | 1920x1080 | |
| 80.8 % v7 (old) | 10-2019 | MSI GL65 9SEK i7-9750H, GeForce RTX 2060 Mobile | 2.3 kg | 27.5 mm | 15.60" | 1920x1080 | |
| 85.5 % v6 (old) | 08-2019 | Aorus 15-SA i7-9750H, GeForce GTX 1660 Ti Mobile | 2.1 kg | 24.4 mm | 15.60" | 1920x1080 | |
| 84.5 % v6 (old) | 08-2018 | Dell G7 15-7588 i7-8750H, GeForce GTX 1060 Max-Q | 2.6 kg | 24.95 mm | 15.60" | 1920x1080 |
| SD Card Reader | |
| average JPG Copy Test (av. of 3 runs) | |
| Dell XPS 15 7590 i5 iGPU FHD (Toshiba Exceria Pro SDXC 64 GB UHS-II) | |
| Dell XPS 13 7390 2-in-1 Core i7 (Toshiba Exceria Pro M501 64 GB UHS-II) | |
| MSI GL65 9SEK (Toshiba Exceria Pro SDXC 64 GB UHS-II) | |
| Dell G7 7590 (Toshiba Exceria Pro SDXC 64 GB UHS-II) | |
| Dell G3 3590 (Toshiba Exceria Pro SDXC 64 GB UHS-II) | |
| maximum AS SSD Seq Read Test (1GB) | |
| Dell XPS 15 7590 i5 iGPU FHD (Toshiba Exceria Pro SDXC 64 GB UHS-II) | |
| Dell XPS 13 7390 2-in-1 Core i7 (Toshiba Exceria Pro M501 64 GB UHS-II) | |
| Dell G7 7590 (Toshiba Exceria Pro SDXC 64 GB UHS-II) | |
| Dell G3 3590 (Toshiba Exceria Pro SDXC 64 GB UHS-II) | |
| MSI GL65 9SEK (Toshiba Exceria Pro SDXC 64 GB UHS-II) | |
| Networking | |
| iperf3 transmit AX12 | |
| Lenovo Legion Y740-15ICHg | |
| Asus Strix Scar III G531GW-AZ062T | |
| Alienware m15 R2 P87F | |
| Dell G7 7590 | |
| Dell G3 3590 | |
| iperf3 receive AX12 | |
| Dell G7 7590 | |
| Alienware m15 R2 P87F | |
| Asus Strix Scar III G531GW-AZ062T | |
| Lenovo Legion Y740-15ICHg | |
| Dell G3 3590 | |
| |||||||||||||||||||||||||
Helderheidsverdeling: 91 %
Helderheid in Batterij-modus: 330.5 cd/m²
Contrast: 465:1 (Zwart: 0.71 cd/m²)
ΔE ColorChecker Calman: 5.33 | ∀{0.5-29.43 Ø4.71}
calibrated: 3.63
ΔE Greyscale Calman: 6.7 | ∀{0.09-98 Ø4.96}
89.5% sRGB (Argyll 1.6.3 3D)
58.3% AdobeRGB 1998 (Argyll 1.6.3 3D)
65.3% AdobeRGB 1998 (Argyll 3D)
90% sRGB (Argyll 3D)
64.4% Display P3 (Argyll 3D)
Gamma: 2.24
CCT: 8035 K
| Dell G7 7590 AU Optronics B156HAN, IPS, 15.6", 1920x1080 | Lenovo Legion Y740-15ICHg LP156WFG-SPB2, IPS, 15.6", 1920x1080 | HP Omen X 2S 15-dg0075cl AU Optronics AUO82ED, IPS, 15.6", 1920x1080 | Asus Strix Scar III G531GW-AZ062T Sharp LQ156M1JW09 (SHP14D3), IPS, 15.6", 1920x1080 | Dell G3 3590 BOE NV15N3D, IPS, 15.6", 1920x1080 | Alienware m15 R2 P87F Sharp LQ156M1, IPS, 15.6", 1920x1080 | Dell G7 15-7588 LG Philips LGD053F, IPS, 15.6", 1920x1080 | |
|---|---|---|---|---|---|---|---|
| Display | 0% | 3% | 5% | -36% | 3% | -40% | |
| Display P3 Coverage (%) | 64.4 | 63.5 -1% | 66.2 3% | 66.2 3% | 40.13 -38% | 65.3 1% | 37.82 -41% |
| sRGB Coverage (%) | 90 | 92.4 3% | 92.3 3% | 97.1 8% | 59.8 -34% | 95.1 6% | 56.2 -38% |
| AdobeRGB 1998 Coverage (%) | 65.3 | 64.7 -1% | 67.2 3% | 67.6 4% | 41.47 -36% | 65.9 1% | 39.2 -40% |
| Response Times | -26% | -3% | 7% | -209% | 2% | -158% | |
| Response Time Grey 50% / Grey 80% * (ms) | 14 ? | 18.8 ? -34% | 15.2 ? -9% | 15 ? -7% | 46 ? -229% | 16.4 ? -17% | 38.8 ? -177% |
| Response Time Black / White * (ms) | 11.2 ? | 13.2 ? -18% | 10.8 ? 4% | 9 ? 20% | 32.4 ? -189% | 8.8 ? 21% | 26.8 ? -139% |
| PWM Frequency (Hz) | 250 ? | 200 ? | 23810 ? | ||||
| Screen | 24% | 26% | 21% | 0% | 14% | -21% | |
| Brightness middle (cd/m²) | 330.5 | 320.4 -3% | 324.8 -2% | 309 -7% | 276.2 -16% | 324.2 -2% | 250.9 -24% |
| Brightness (cd/m²) | 324 | 298 -8% | 316 -2% | 284 -12% | 261 -19% | 304 -6% | 246 -24% |
| Brightness Distribution (%) | 91 | 85 -7% | 84 -8% | 88 -3% | 86 -5% | 90 -1% | 89 -2% |
| Black Level * (cd/m²) | 0.71 | 0.42 41% | 0.26 63% | 0.42 41% | 0.24 66% | 0.38 46% | 0.34 52% |
| Contrast (:1) | 465 | 763 64% | 1249 169% | 736 58% | 1151 148% | 853 83% | 738 59% |
| Colorchecker dE 2000 * | 5.33 | 3.21 40% | 4.96 7% | 3.99 25% | 5.56 -4% | 5.01 6% | 7.34 -38% |
| Colorchecker dE 2000 max. * | 11.08 | 5.54 50% | 8.95 19% | 8.3 25% | 23.45 -112% | 12.7 -15% | 28.66 -159% |
| Colorchecker dE 2000 calibrated * | 3.63 | 2.36 35% | 3.23 11% | 1.12 69% | 5.23 -44% | 1.64 55% | 4.42 -22% |
| Greyscale dE 2000 * | 6.7 | 3.6 46% | 5 25% | 5.43 19% | 2.8 58% | 7.9 -18% | 6.8 -1% |
| Gamma | 2.24 98% | 2.27 97% | 2.21 100% | 2.57 86% | 2.37 93% | 2.35 94% | 2.164 102% |
| CCT | 8035 81% | 6503 100% | 7742 84% | 7767 84% | 6710 97% | 8455 77% | 6780 96% |
| Color Space (Percent of AdobeRGB 1998) (%) | 58.3 | 59 1% | 59.8 3% | 63 8% | 37.8 -35% | 60.8 4% | 36 -38% |
| Color Space (Percent of sRGB) (%) | 89.5 | 92 3% | 91.8 3% | 97 8% | 59 -34% | 95.5 7% | 56 -37% |
| Totaal Gemiddelde (Programma / Instellingen) | -1% /
13% | 9% /
18% | 11% /
16% | -82% /
-33% | 6% /
11% | -73% /
-42% |
* ... kleiner is beter
Responstijd Scherm
| ↔ Responstijd Zwart naar Wit | ||
|---|---|---|
| 11.2 ms ... stijging ↗ en daling ↘ gecombineerd | ↗ 6 ms stijging | 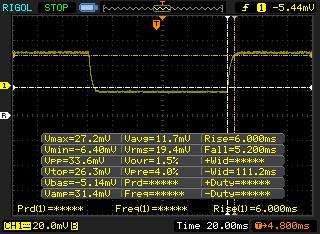 |
| ↘ 5.2 ms daling | ||
| Het scherm vertoonde prima responstijden in onze tests maar is misschien wat te traag voor competitieve games. Ter vergelijking: alle testtoestellen variëren van 0.1 (minimum) tot 240 (maximum) ms. » 30 % van alle toestellen zijn beter. Dit betekent dat de gemeten responstijd beter is dan het gemiddelde (19.8 ms) van alle geteste toestellen. | ||
| ↔ Responstijd 50% Grijs naar 80% Grijs | ||
| 14 ms ... stijging ↗ en daling ↘ gecombineerd | ↗ 7.2 ms stijging | 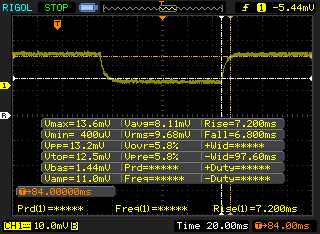 |
| ↘ 6.8 ms daling | ||
| Het scherm vertoonde prima responstijden in onze tests maar is misschien wat te traag voor competitieve games. Ter vergelijking: alle testtoestellen variëren van 0.165 (minimum) tot 636 (maximum) ms. » 28 % van alle toestellen zijn beter. Dit betekent dat de gemeten responstijd beter is dan het gemiddelde (30.9 ms) van alle geteste toestellen. | ||
Screen Flickering / PWM (Pulse-Width Modulation)
| Screen flickering / PWM niet waargenomen |  | ||
Ter vergelijking: 52 % van alle geteste toestellen maakten geen gebruik van PWM om de schermhelderheid te verlagen. Als het wel werd gebruikt, werd een gemiddelde van 7748 (minimum: 5 - maximum: 343500) Hz waargenomen. | |||
| PCMark 8 Home Score Accelerated v2 | 4317 punten | |
| PCMark 8 Work Score Accelerated v2 | 5558 punten | |
| PCMark 10 Score | 5368 punten | |
Help | ||
| Dell G7 7590 Toshiba BG3 KBG30ZMS256G | Lenovo Legion Y740-15ICHg Samsung SSD PM981 MZVLB256HAHQ | HP Omen X 2S 15-dg0075cl WDC PC SN720 SDAPNTW-1T00 | Asus Strix Scar III G531GW-AZ062T Intel SSD 660p SSDPEKNW512G8 | Dell G3 3590 Toshiba BG4 KBG40ZNS128G | |
|---|---|---|---|---|---|
| AS SSD | 301% | 436% | 118% | -26% | |
| Seq Read (MB/s) | 1013 | 1953 93% | 2105 108% | 1163 15% | 1174 16% |
| Seq Write (MB/s) | 203.8 | 1629 699% | 2493 1123% | 919 351% | 186 -9% |
| 4K Read (MB/s) | 29.57 | 33.2 12% | 25.01 -15% | 48.88 65% | 34.01 15% |
| 4K Write (MB/s) | 71.4 | 88.1 23% | 108.7 52% | 90.1 26% | 69.4 -3% |
| 4K-64 Read (MB/s) | 332.1 | 757 128% | 1604 383% | 323.8 -2% | 424 28% |
| 4K-64 Write (MB/s) | 152.9 | 1501 882% | 1593 942% | 403.8 164% | 68.8 -55% |
| Access Time Read * (ms) | 0.183 | 0.077 58% | 0.046 75% | 0.24 -31% | 0.168 8% |
| Access Time Write * (ms) | 0.248 | 0.043 83% | 0.102 59% | 0.046 81% | 0.94 -279% |
| Score Read (Points) | 463 | 985 113% | 1840 297% | 489 6% | 575 24% |
| Score Write (Points) | 245 | 1752 615% | 1951 696% | 586 139% | 157 -36% |
| Score Total (Points) | 913 | 3230 254% | 4743 419% | 1332 46% | 987 8% |
| Copy ISO MB/s (MB/s) | 263.6 | 1872 610% | 2250 754% | 1269 381% | 215.7 -18% |
| Copy Program MB/s (MB/s) | 213.8 | 478.2 124% | 896 319% | 452.8 112% | 108.2 -49% |
| Copy Game MB/s (MB/s) | 188 | 1165 520% | 1854 886% | 755 302% | 165.9 -12% |
* ... kleiner is beter

| 3DMark 11 Performance | 17814 punten | |
| 3DMark Cloud Gate Standard Score | 36639 punten | |
| 3DMark Fire Strike Score | 14249 punten | |
| 3DMark Time Spy Score | 6192 punten | |
Help | ||
| Shadow of the Tomb Raider - 1920x1080 Highest Preset AA:T | |
| MSI RTX 2060 Gaming Z 6G | |
| Alienware m15 R2 P87F | |
| Alienware m15 P79F | |
| Asus Strix Scar III G531GW-AZ062T | |
| MSI GL65 9SEK | |
| Dell G7 7590 | |
| Gemiddeld NVIDIA GeForce RTX 2060 Mobile (54 - 86, n=22) | |
| Razer Blade 15 GTX 1660 Ti | |
| Asus ROG Zephyrus G15 GA502DU | |
| Asus Zephyrus S GX531GM | |
| lage | gem. | hoge | ultra | |
|---|---|---|---|---|
| BioShock Infinite (2013) | 323.1 | 285.3 | 266.3 | 141.5 |
| The Witcher 3 (2015) | 288 | 185.7 | 113.4 | 62.4 |
| Shadow of the Tomb Raider (2018) | 126 | 91 | 84 | 75 |
| Dell G7 7590 GeForce RTX 2060 Mobile, i7-9750H, Toshiba BG3 KBG30ZMS256G | Lenovo Legion Y740-15ICHg GeForce RTX 2070 Max-Q, i7-8750H, Samsung SSD PM981 MZVLB256HAHQ | HP Omen X 2S 15-dg0075cl GeForce RTX 2070 Max-Q, i7-9750H, WDC PC SN720 SDAPNTW-1T00 | Asus Strix Scar III G531GW-AZ062T GeForce RTX 2070 Mobile, i7-9750H, Intel SSD 660p SSDPEKNW512G8 | Dell G3 3590 GeForce GTX 1650 Mobile, i5-9300H, Toshiba BG4 KBG40ZNS128G | Alienware m15 R2 P87F GeForce RTX 2080 Max-Q, i7-9750H, 2x Toshiba XG6 KXG60ZNV512G (RAID 0) | |
|---|---|---|---|---|---|---|
| Noise | 4% | -1% | -2% | 4% | -10% | |
| uit / omgeving * (dB) | 28.4 | 28 1% | 29 -2% | 30 -6% | 28.4 -0% | 28.3 -0% |
| Idle Minimum * (dB) | 29.5 | 32.6 -11% | 30.5 -3% | 30.6 -4% | 29.2 1% | 28.5 3% |
| Idle Average * (dB) | 29.6 | 32.7 -10% | 31.5 -6% | 30.6 -3% | 29.4 1% | 28.5 4% |
| Idle Maximum * (dB) | 29.6 | 32.7 -10% | 31.5 -6% | 37.7 -27% | 29.4 1% | 49 -66% |
| Load Average * (dB) | 45 | 33.3 26% | 40.6 10% | 36.5 19% | 39 13% | 49 -9% |
| Witcher 3 ultra * (dB) | 51.5 | 41.6 19% | 49.5 4% | 52.1 -1% | 49.5 4% | 49 5% |
| Load Maximum * (dB) | 53 | 45.2 15% | 53.4 -1% | 48.1 9% | 49.7 6% | 55 -4% |
* ... kleiner is beter
Geluidsniveau
| Onbelast |
| 29.5 / 29.6 / 29.6 dB (A) |
| Belasting |
| 45 / 53 dB (A) |
 | ||
30 dB stil 40 dB(A) hoorbaar 50 dB(A) luid |
||
min: | ||
(-) De maximumtemperatuur aan de bovenzijde bedraagt 52 °C / 126 F, vergeleken met het gemiddelde van 40.4 °C / 105 F, variërend van 21.2 tot 68.8 °C voor de klasse Gaming.
(-) De bodem warmt op tot een maximum van 48.8 °C / 120 F, vergeleken met een gemiddelde van 43.2 °C / 110 F
(+) Bij onbelast gebruik bedraagt de gemiddelde temperatuur voor de bovenzijde 30.7 °C / 87 F, vergeleken met het apparaatgemiddelde van 33.9 °C / 93 F.
(-) Bij het spelen van The Witcher 3 is de gemiddelde temperatuur voor de bovenzijde 39.5 °C / 103 F, vergeleken met het apparaatgemiddelde van 33.9 °C / 93 F.
(+) De handpalmsteunen en het touchpad bereiken maximaal de huidtemperatuur (35.4 °C / 95.7 F) en zijn dus niet heet.
(-) De gemiddelde temperatuur van de handpalmsteun van soortgelijke toestellen bedroeg 28.8 °C / 83.8 F (-6.6 °C / -11.9 F).
Dell G7 7590 audioanalyse
(+) | luidsprekers kunnen relatief luid spelen (89.8 dB)
Bas 100 - 315 Hz
(-) | bijna geen lage tonen - gemiddeld 22.8% lager dan de mediaan
(±) | lineariteit van de lage tonen is gemiddeld (8.6% delta ten opzichte van de vorige frequentie)
Midden 400 - 2000 Hz
(±) | hogere middens - gemiddeld 5.7% hoger dan de mediaan
(±) | lineariteit van de middentonen is gemiddeld (7.3% delta ten opzichte van de vorige frequentie)
Hoog 2 - 16 kHz
(+) | evenwichtige hoogtepunten - slechts 4.6% verwijderd van de mediaan
(±) | lineariteit van de hoogtepunten is gemiddeld (9.3% delta ten opzichte van de vorige frequentie)
Algemeen 100 - 16.000 Hz
(±) | lineariteit van het totale geluid is gemiddeld (21.9% verschil met de mediaan)
Vergeleken met dezelfde klasse
» 79% van alle geteste apparaten in deze klasse waren beter, 6% vergelijkbaar, 16% slechter
» De beste had een delta van 6%, het gemiddelde was 18%, de slechtste was 132%
Vergeleken met alle geteste toestellen
» 63% van alle geteste apparaten waren beter, 7% gelijk, 30% slechter
» De beste had een delta van 4%, het gemiddelde was 23%, de slechtste was 134%
Apple MacBook 12 (Early 2016) 1.1 GHz audioanalyse
(+) | luidsprekers kunnen relatief luid spelen (83.6 dB)
Bas 100 - 315 Hz
(±) | verminderde zeebaars - gemiddeld 11.3% lager dan de mediaan
(±) | lineariteit van de lage tonen is gemiddeld (14.2% delta ten opzichte van de vorige frequentie)
Midden 400 - 2000 Hz
(+) | evenwichtige middens - slechts 2.4% verwijderd van de mediaan
(+) | de middentonen zijn lineair (5.5% delta ten opzichte van de vorige frequentie)
Hoog 2 - 16 kHz
(+) | evenwichtige hoogtepunten - slechts 2% verwijderd van de mediaan
(+) | de hoge tonen zijn lineair (4.5% delta naar de vorige frequentie)
Algemeen 100 - 16.000 Hz
(+) | het totale geluid is lineair (10.2% verschil met de mediaan)
Vergeleken met dezelfde klasse
» 7% van alle geteste apparaten in deze klasse waren beter, 2% vergelijkbaar, 90% slechter
» De beste had een delta van 5%, het gemiddelde was 18%, de slechtste was 53%
Vergeleken met alle geteste toestellen
» 5% van alle geteste apparaten waren beter, 1% gelijk, 94% slechter
» De beste had een delta van 4%, het gemiddelde was 23%, de slechtste was 134%
| Uit / Standby | |
| Inactief | |
| Belasting |
|
Key:
min: | |
| Dell G7 7590 i7-9750H, GeForce RTX 2060 Mobile, Toshiba BG3 KBG30ZMS256G, IPS, 1920x1080, 15.6" | Alienware m15 R2 P87F i7-9750H, GeForce RTX 2080 Max-Q, 2x Toshiba XG6 KXG60ZNV512G (RAID 0), IPS, 1920x1080, 15.6" | Razer Blade 15 GTX 1660 Ti i7-9750H, GeForce GTX 1660 Ti Mobile, Samsung SSD PM981 MZVLB256HAHQ, IPS, 1920x1080, 15.6" | Alienware 15 R3 Max-Q i7-7820HK, GeForce GTX 1080 Max-Q, LiteOn CX2-8B256, IPS, 1920x1080, 15.6" | Lenovo Legion Y7000P-1060 i7-8750H, GeForce GTX 1060 Mobile, Samsung SSD PM981 MZVLB256HAHQ, IPS, 1920x1080, 15.6" | MSI GL65 9SEK i7-9750H, GeForce RTX 2060 Mobile, WDC PC SN520 SDAPNUW-512G, IPS, 1920x1080, 15.6" | |
|---|---|---|---|---|---|---|
| Power Consumption | -49% | -22% | -22% | 32% | -75% | |
| Idle Minimum * (Watt) | 11.2 | 19 -70% | 18.7 -67% | 22 -96% | 4.9 56% | 41 -266% |
| Idle Average * (Watt) | 16.3 | 40.5 -148% | 30.7 -88% | 26 -60% | 8.1 50% | 45.3 -178% |
| Idle Maximum * (Watt) | 46.2 | 52 -13% | 33.9 27% | 33 29% | 16.5 64% | 47.1 -2% |
| Load Average * (Watt) | 123.3 | 132.3 -7% | 93.4 24% | 86 30% | 109.2 11% | 94.9 23% |
| Witcher 3 ultra * (Watt) | 135.6 | 183.3 -35% | 158.9 -17% | 159 -17% | 124.6 8% | 149.4 -10% |
| Load Maximum * (Watt) | 181.5 | 217.2 -20% | 195.3 -8% | 215 -18% | 175.2 3% | 214.2 -18% |
* ... kleiner is beter
| Dell G7 7590 i7-9750H, GeForce RTX 2060 Mobile, 60 Wh | Lenovo Legion Y740-15ICHg i7-8750H, GeForce RTX 2070 Max-Q, 57 Wh | HP Omen X 2S 15-dg0075cl i7-9750H, GeForce RTX 2070 Max-Q, 72 Wh | Asus Strix Scar III G531GW-AZ062T i7-9750H, GeForce RTX 2070 Mobile, 66 Wh | Dell G3 3590 i5-9300H, GeForce GTX 1650 Mobile, 51 Wh | Alienware m15 R2 P87F i7-9750H, GeForce RTX 2080 Max-Q, 76 Wh | |
|---|---|---|---|---|---|---|
| Batterijduur | -53% | -49% | 22% | 15% | -19% | |
| Reader / Idle (h) | 11.1 | 3.9 -65% | 3.7 -67% | 13.5 22% | 9.2 -17% | |
| WiFi v1.3 (h) | 4.6 | 2.8 -39% | 2.2 -52% | 5.6 22% | 6.7 46% | 5.5 20% |
| Load (h) | 1.8 | 0.8 -56% | 1.3 -28% | 1.4 -22% | 0.7 -61% |
Pro
Contra
Dit is de verkorte versie van het originele artikel. Het volledige, Engelse testrapport vind je hier.
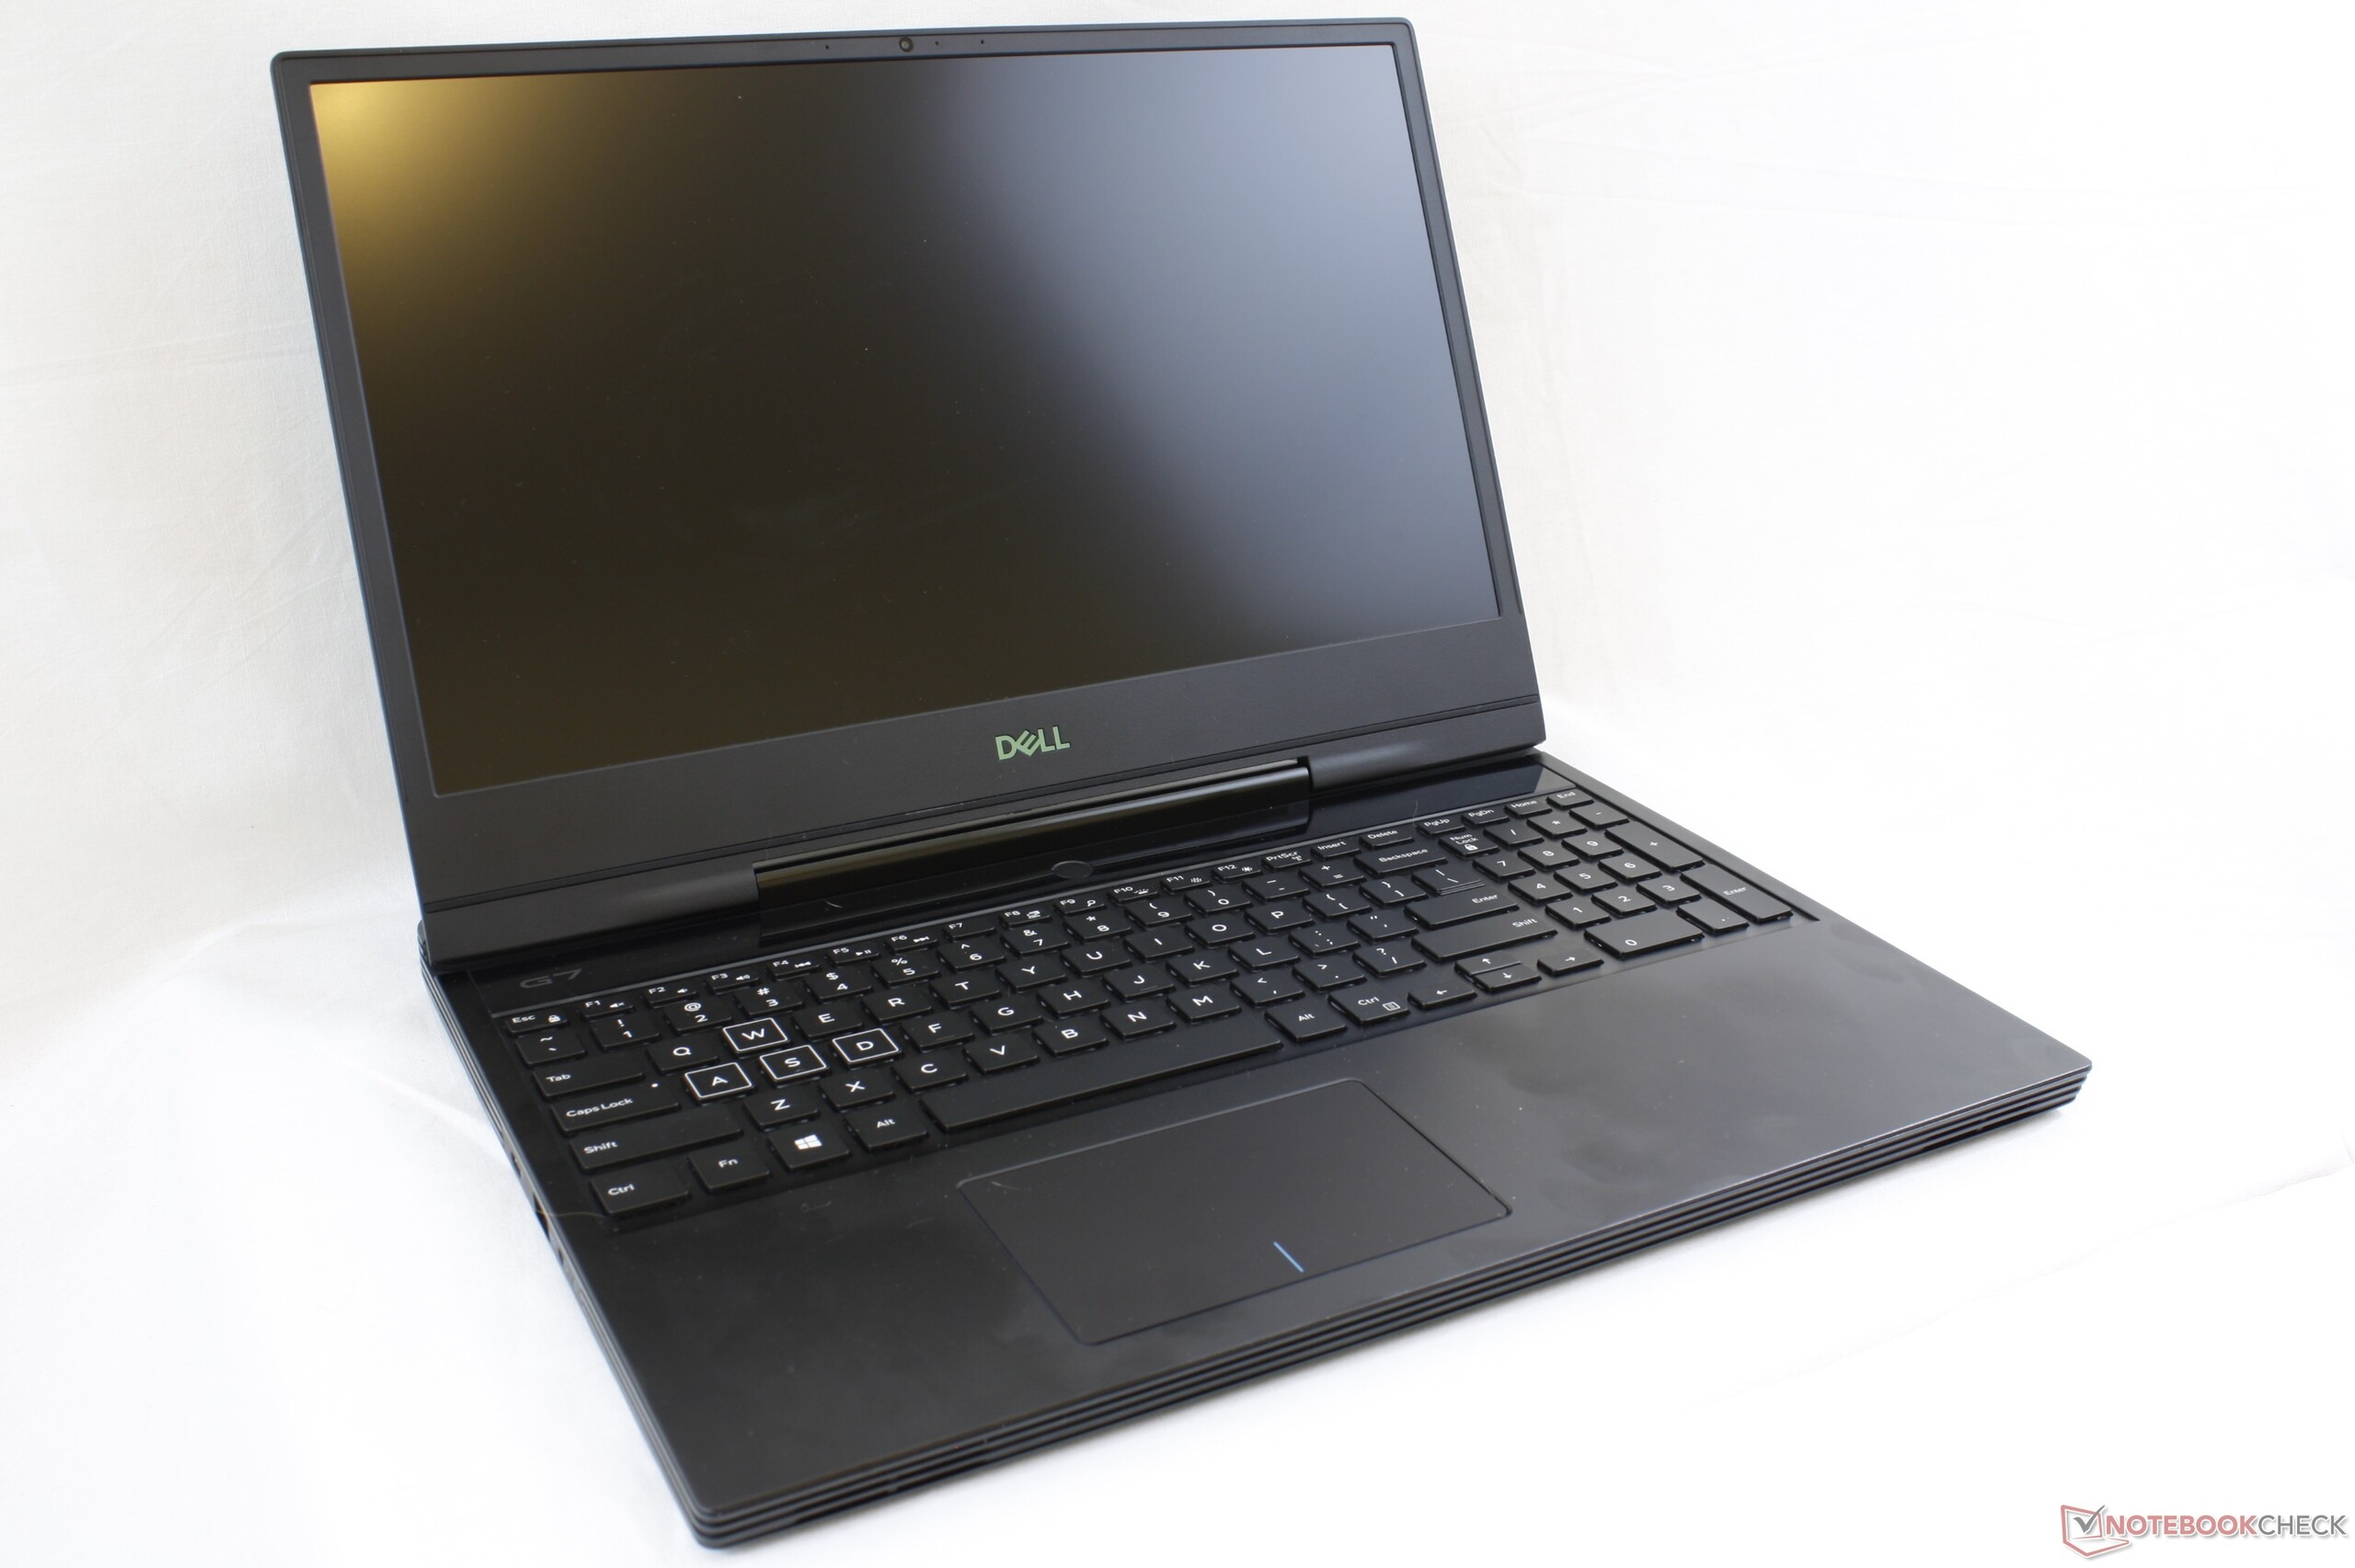
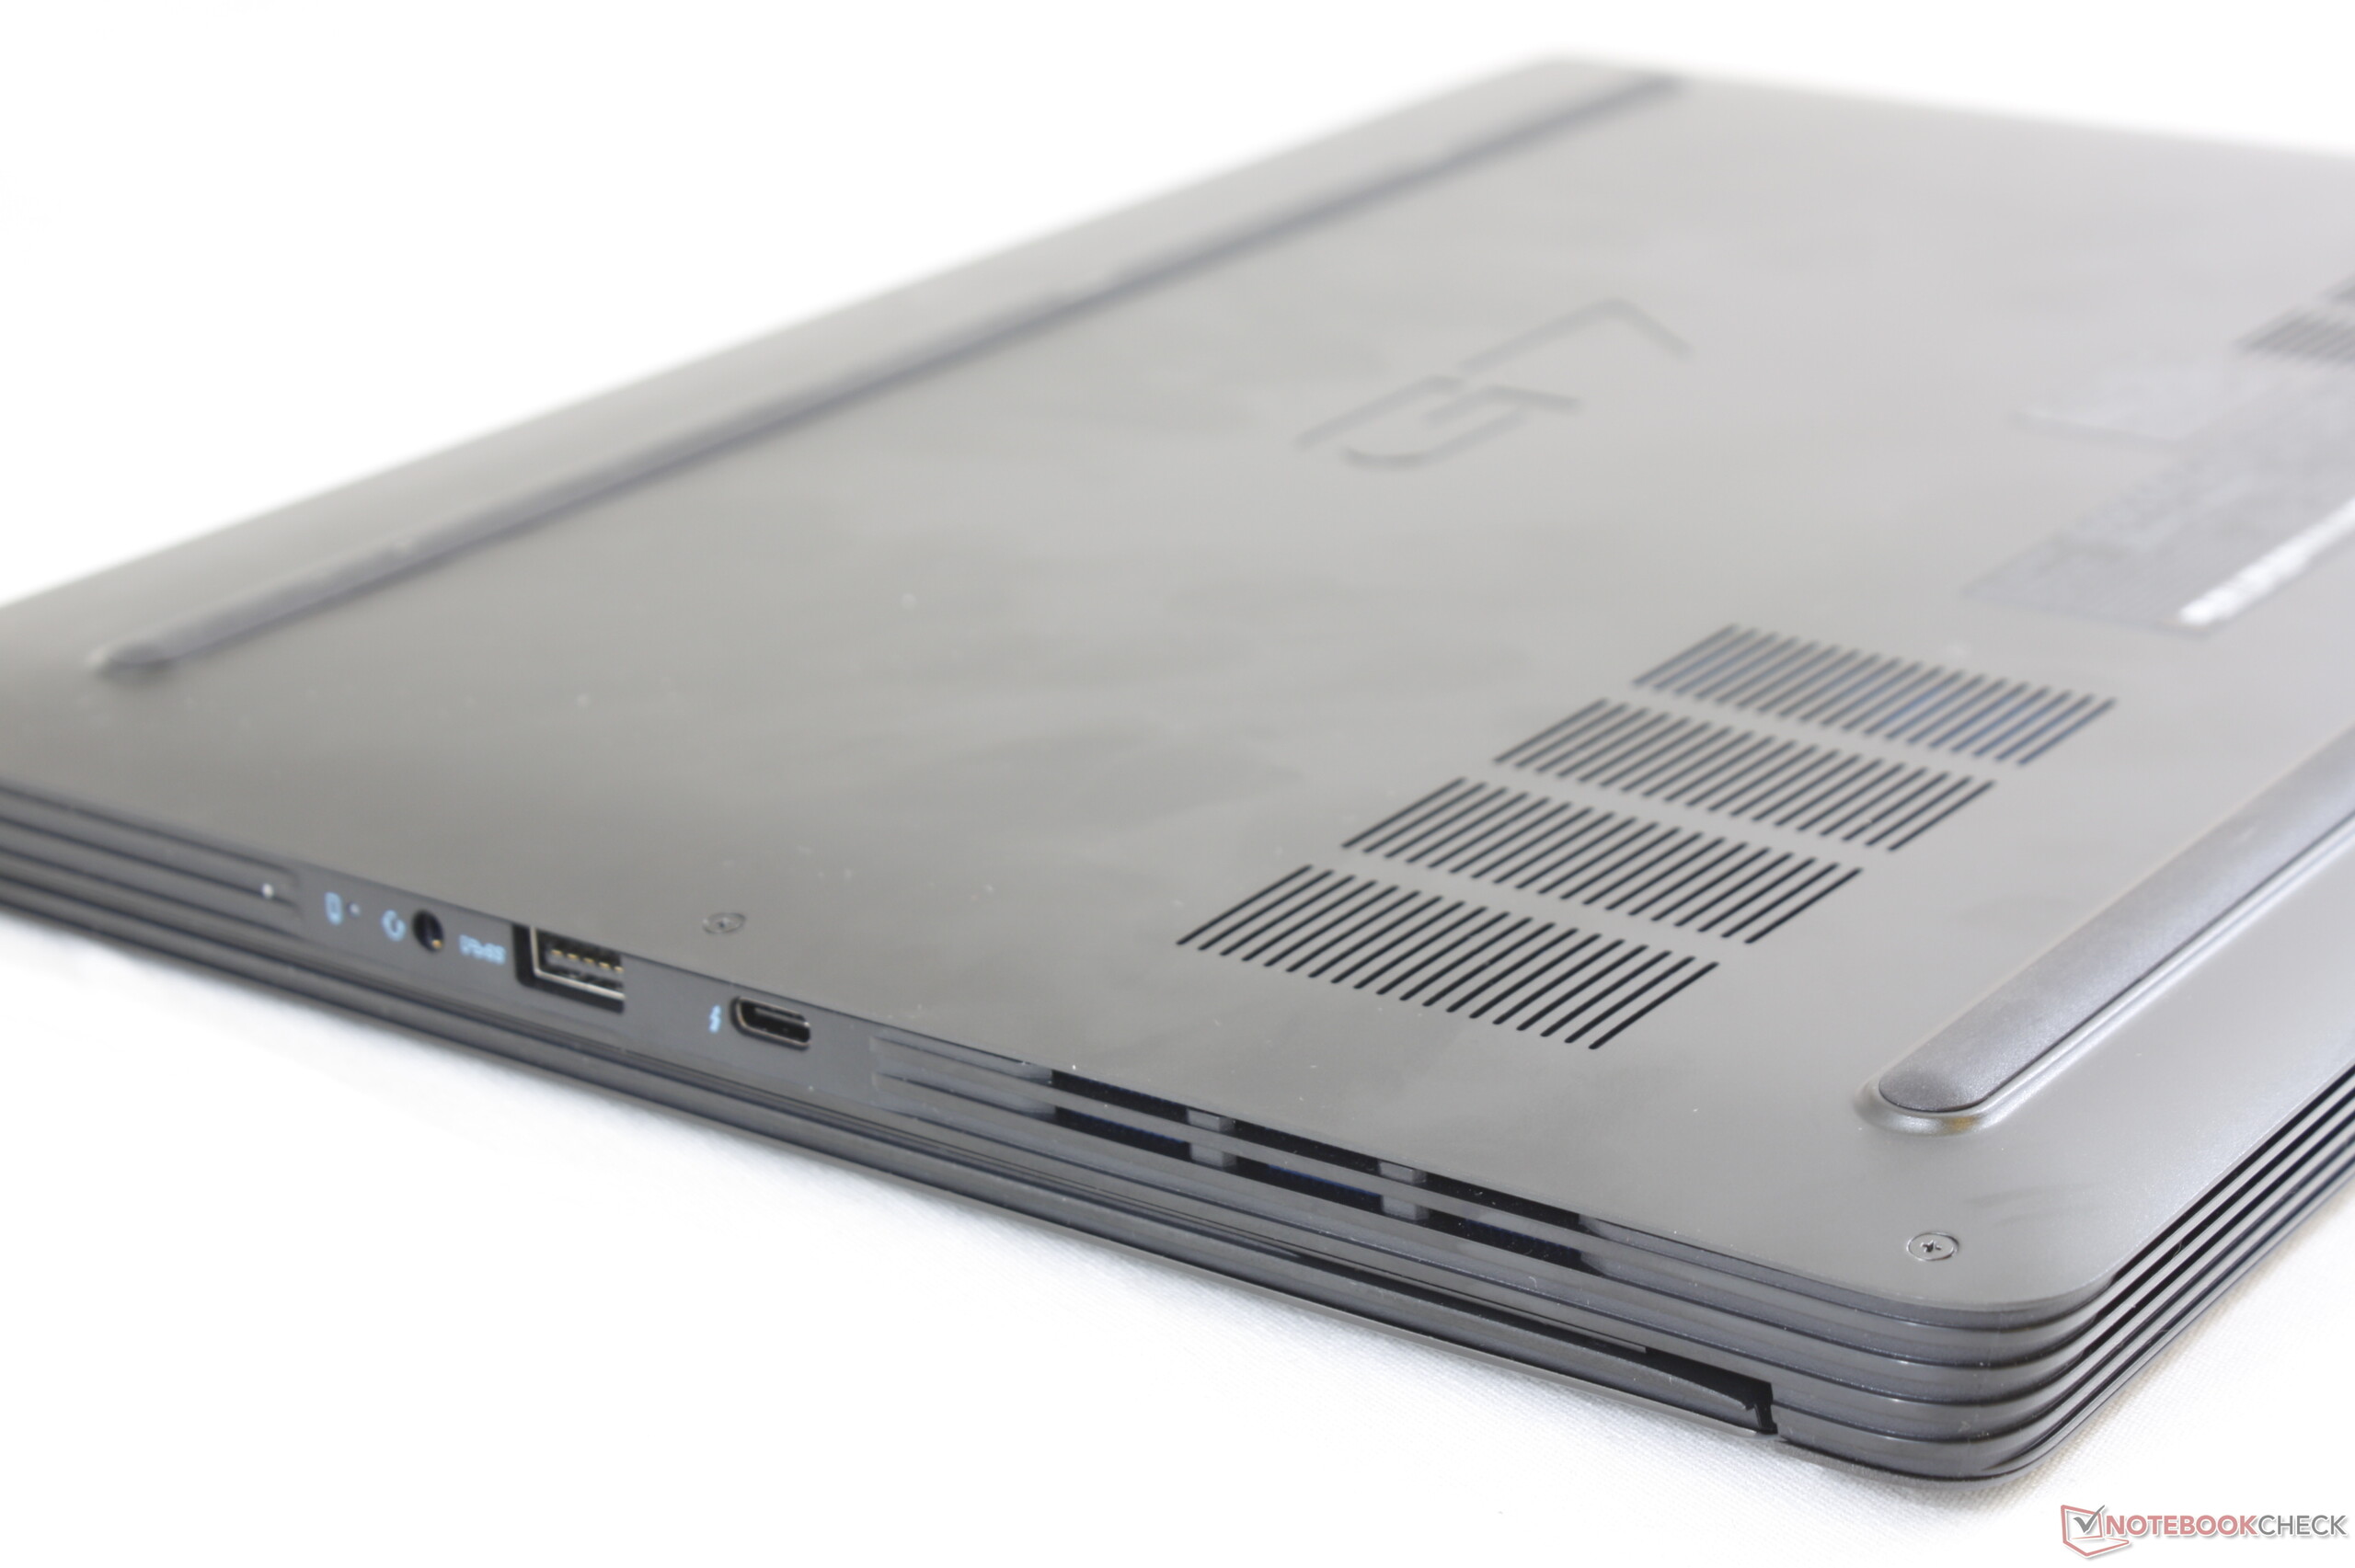
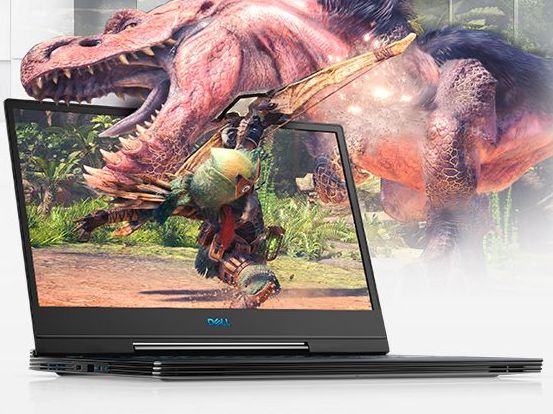
De G7 15 7590 wordt op een interessante manier in de markt gezet. Het notebook is verkrijgbaar met vergelijkbare Core i9, GeForce RTX en IPS/OLED-opties als de duurdere Alienware m15 R2, maar voor de lagere startprijs. Als je de rekenkracht van een Alienware zoekt, maar de Alienware designs te kitscherig vindt, dan kan de minder pretentieuze en visueel eenvoudiger G7 15 7590 je geld besparen zonder dat je moet inleveren op de kwaliteit van de behuizing of op de prestaties.
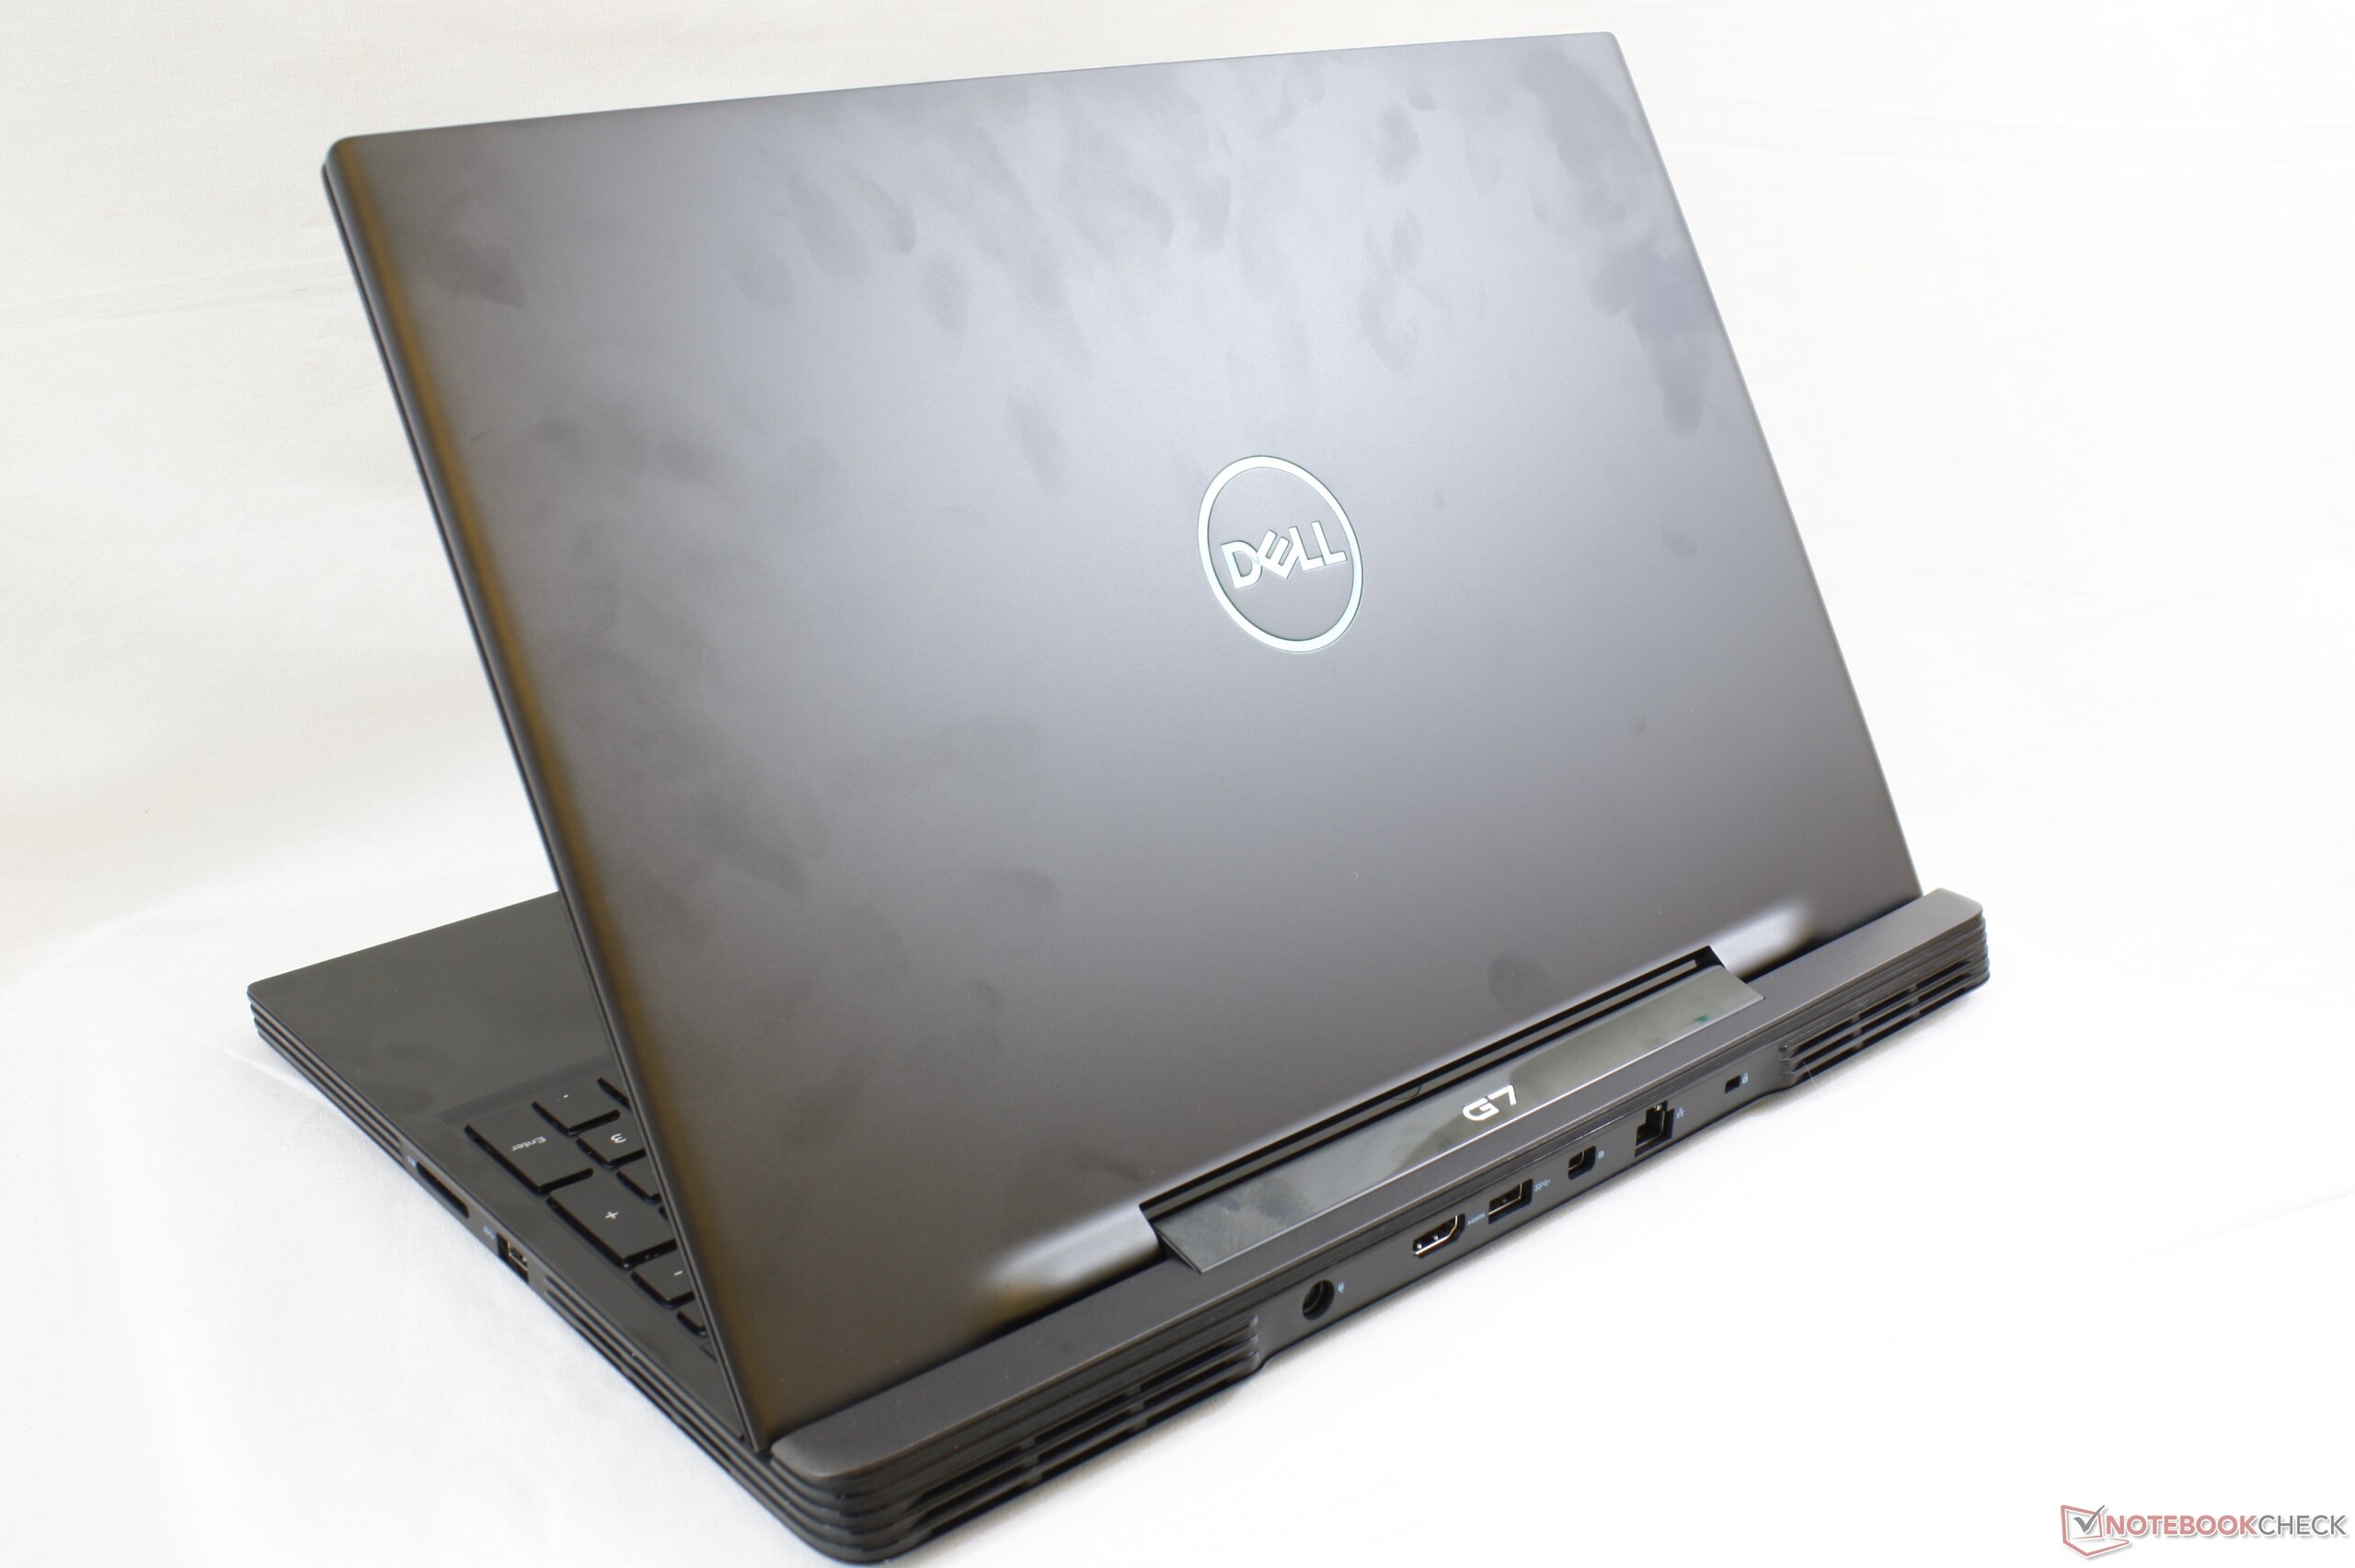
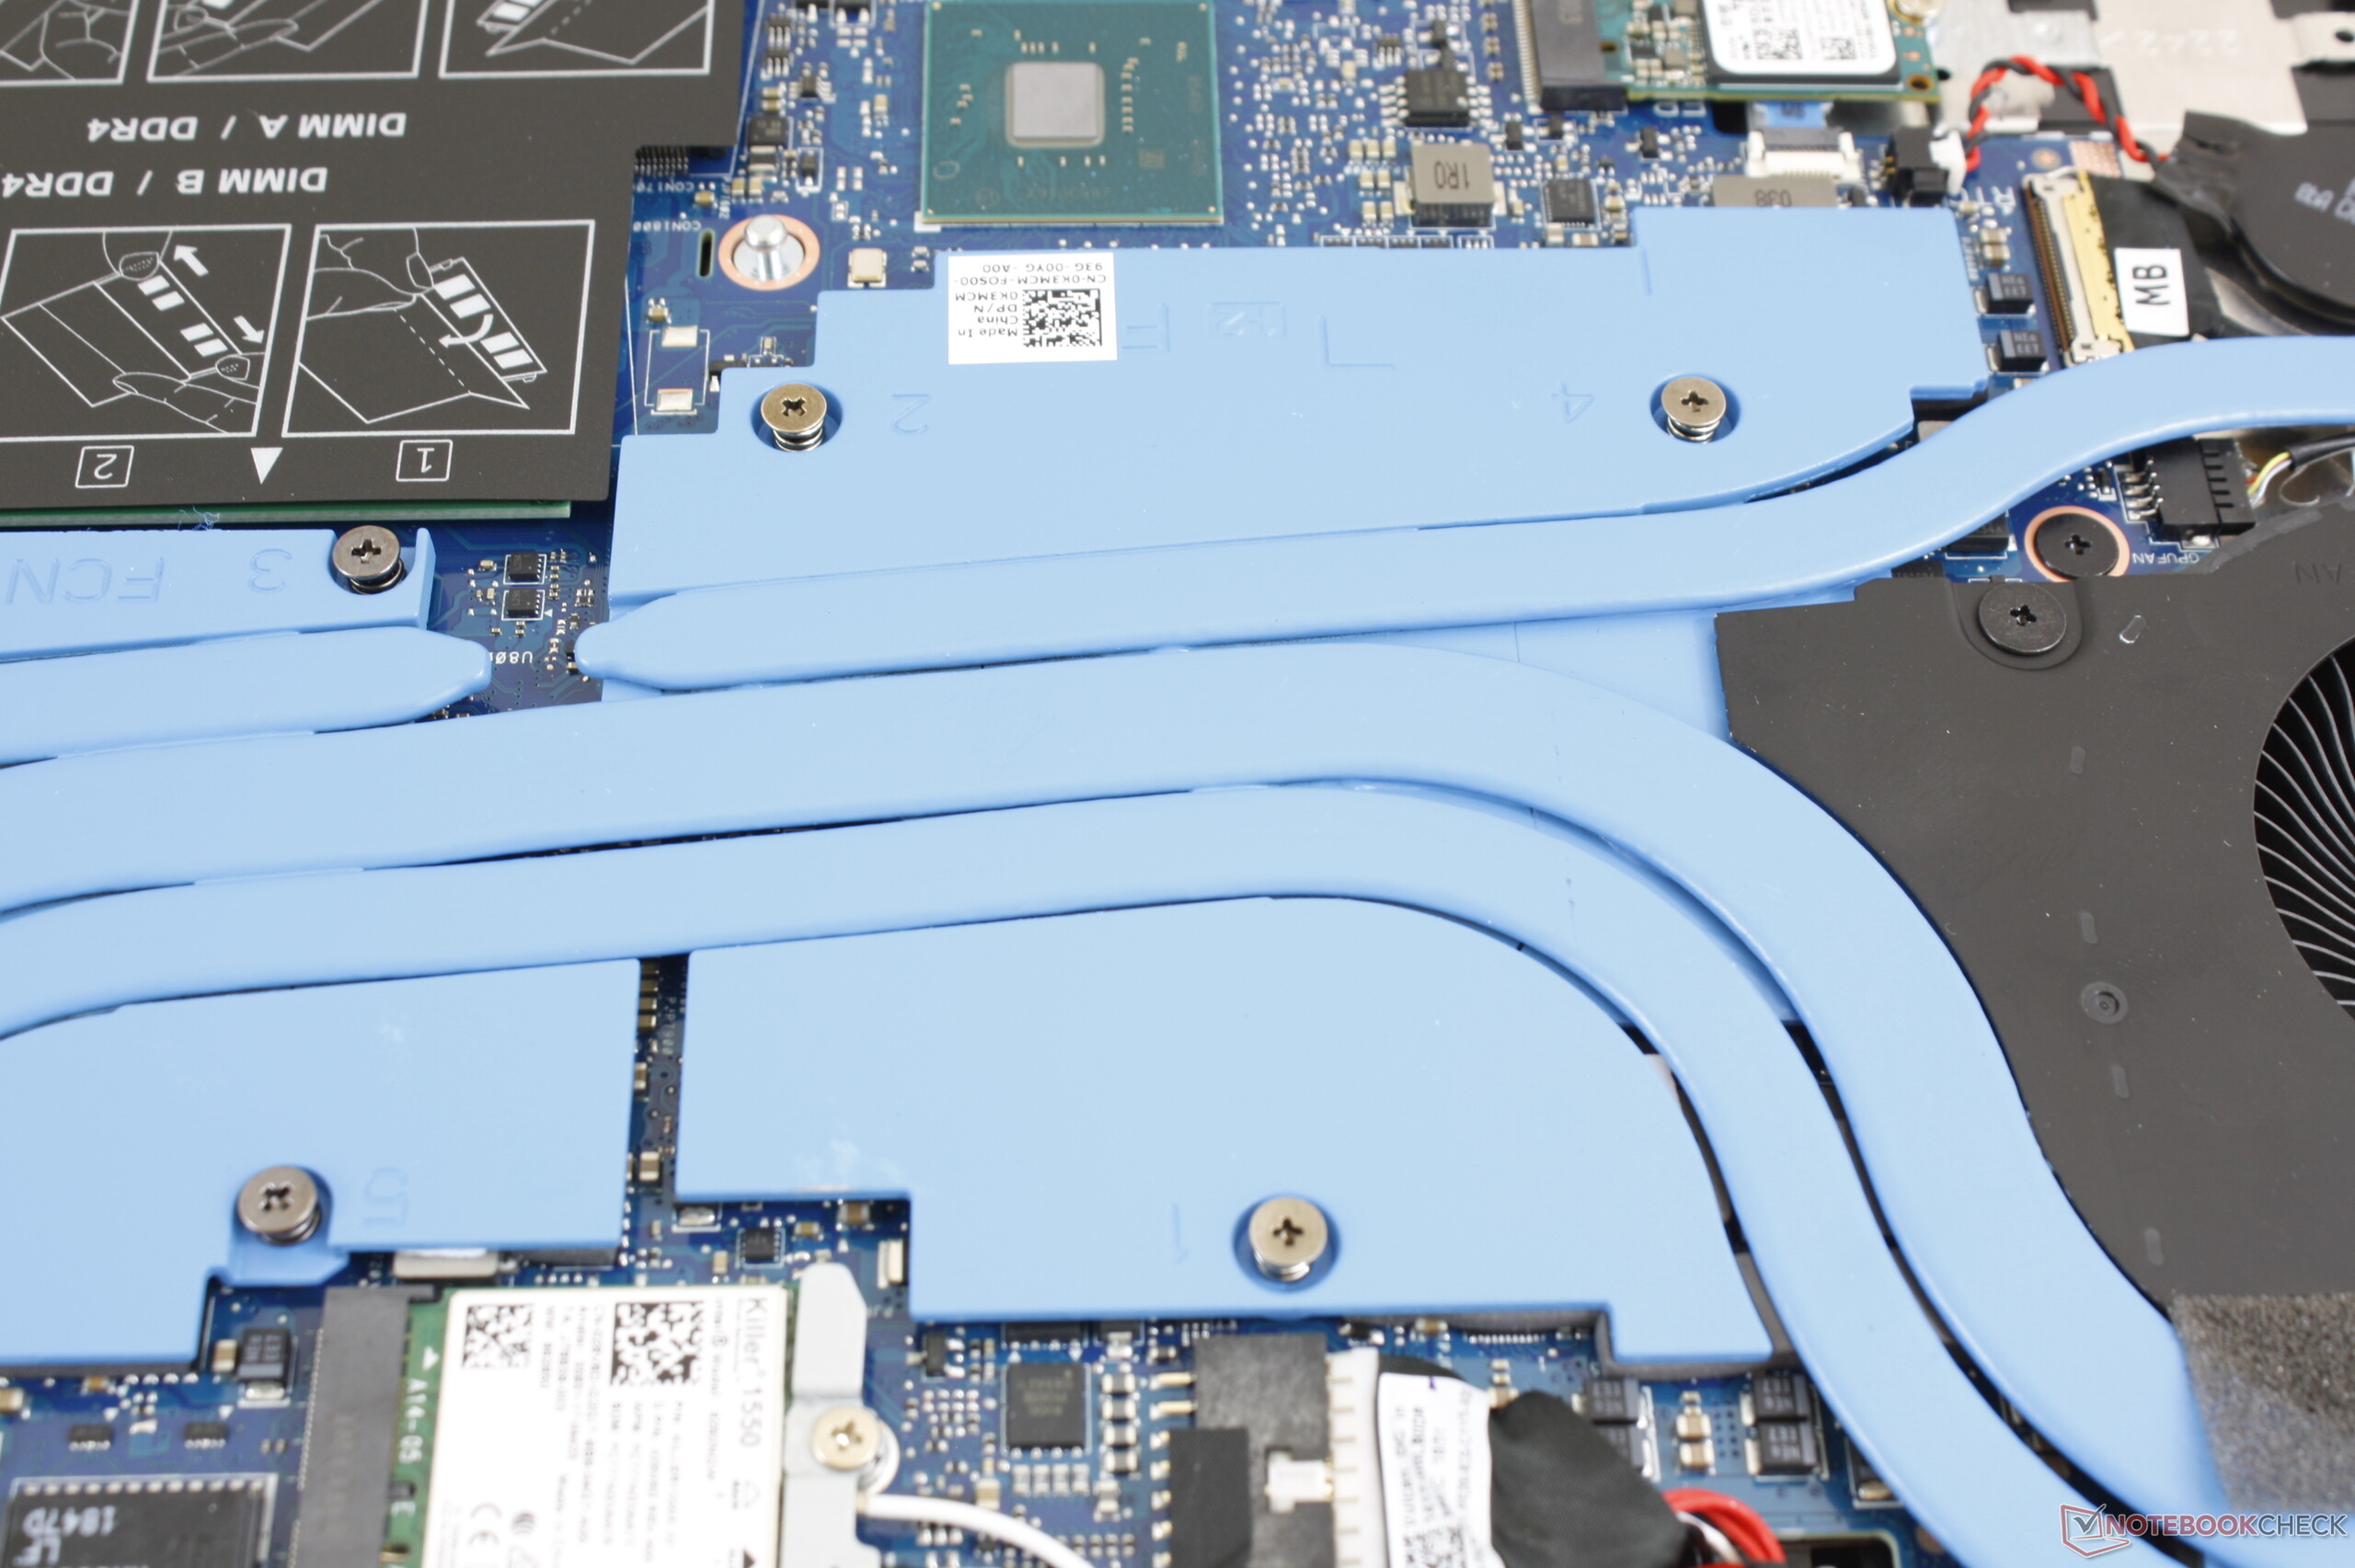
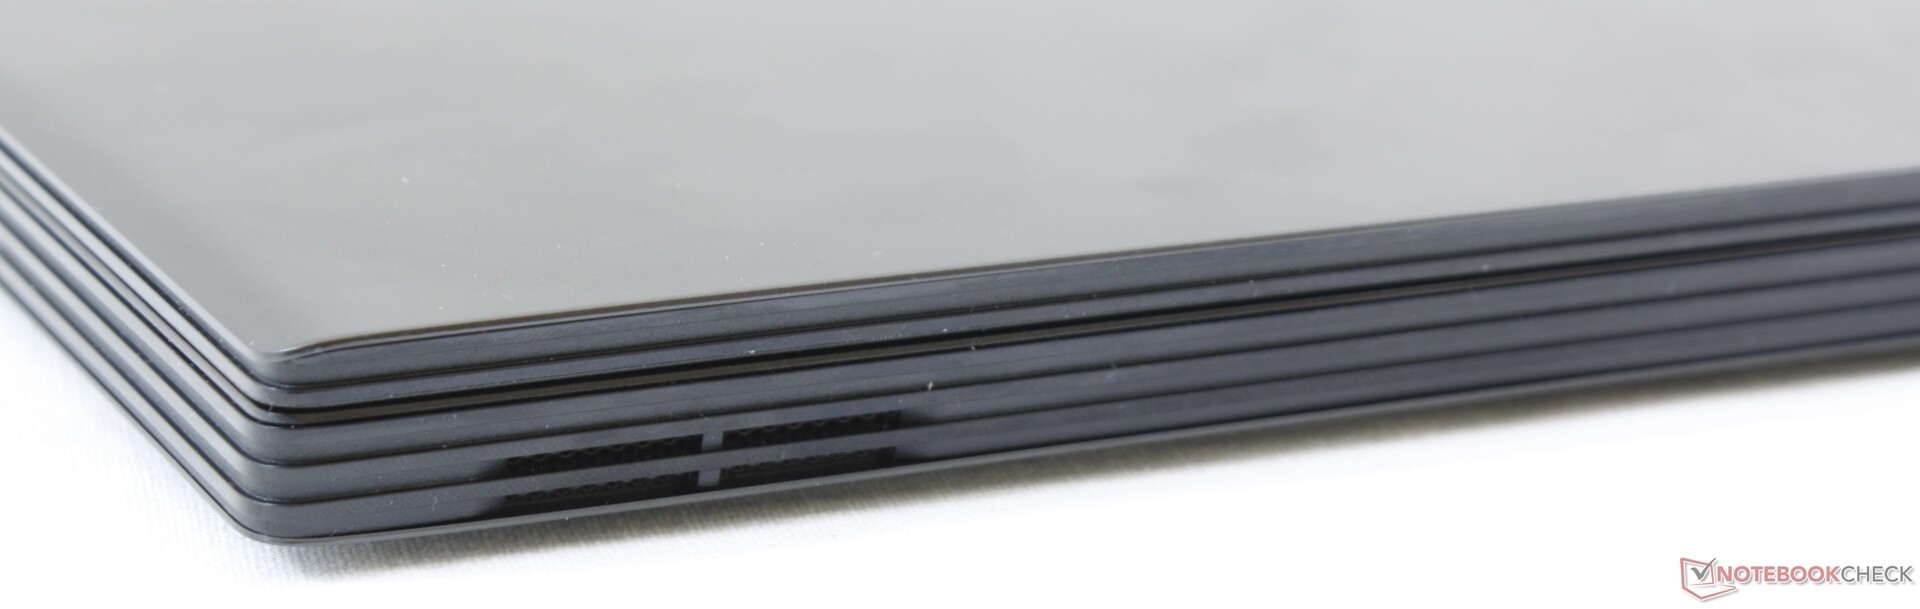
Er is veel ruimte voor verbetering. Hoewel de CPU Turbo Boost prestaties bovengemiddeld zijn en onderhoud makkelijk gaat, is de Toshiba SSD voor een NVMe SSD langzaam, is de basweergave middelmatig en is het beeldscherm fabriekaf slecht gekalibreerd. Deze minpunten zijn in een instapniveau notebook zoals de modellen in de Dell G3- en G5-series enigszins te vergeven, maar voor een middenklasse serie als de Dell G7 is dat niet acceptabel. De beeldschermdeksel had steviger gekund en het systeemgeluid tijdens gamen is ook behoorlijk luid, zelfs in deze categorie. Concurrenten als de Lenovo Legion Y740 of de HP Pavilion 15 Gaming zijn aanzienlijk stiller.
De Dell G7 15 7590 is een uitstekend alternatief voor de Alienware m15 R2, niet in het minst vanwege het vervangbare RAM en dezelfde CPU-, GPU- en beeldschermopties. Het volhouden van de CPU Turbo Boost is een van de beste die we ooit gezien hebben in een game notebook van dit formaat; je moet wel rekening houden met erg luide ventilatoren tijdens het gamen.
Dell G7 7590
- 15-05-2020 v7 (old)
Allen Ngo
Price comparison
