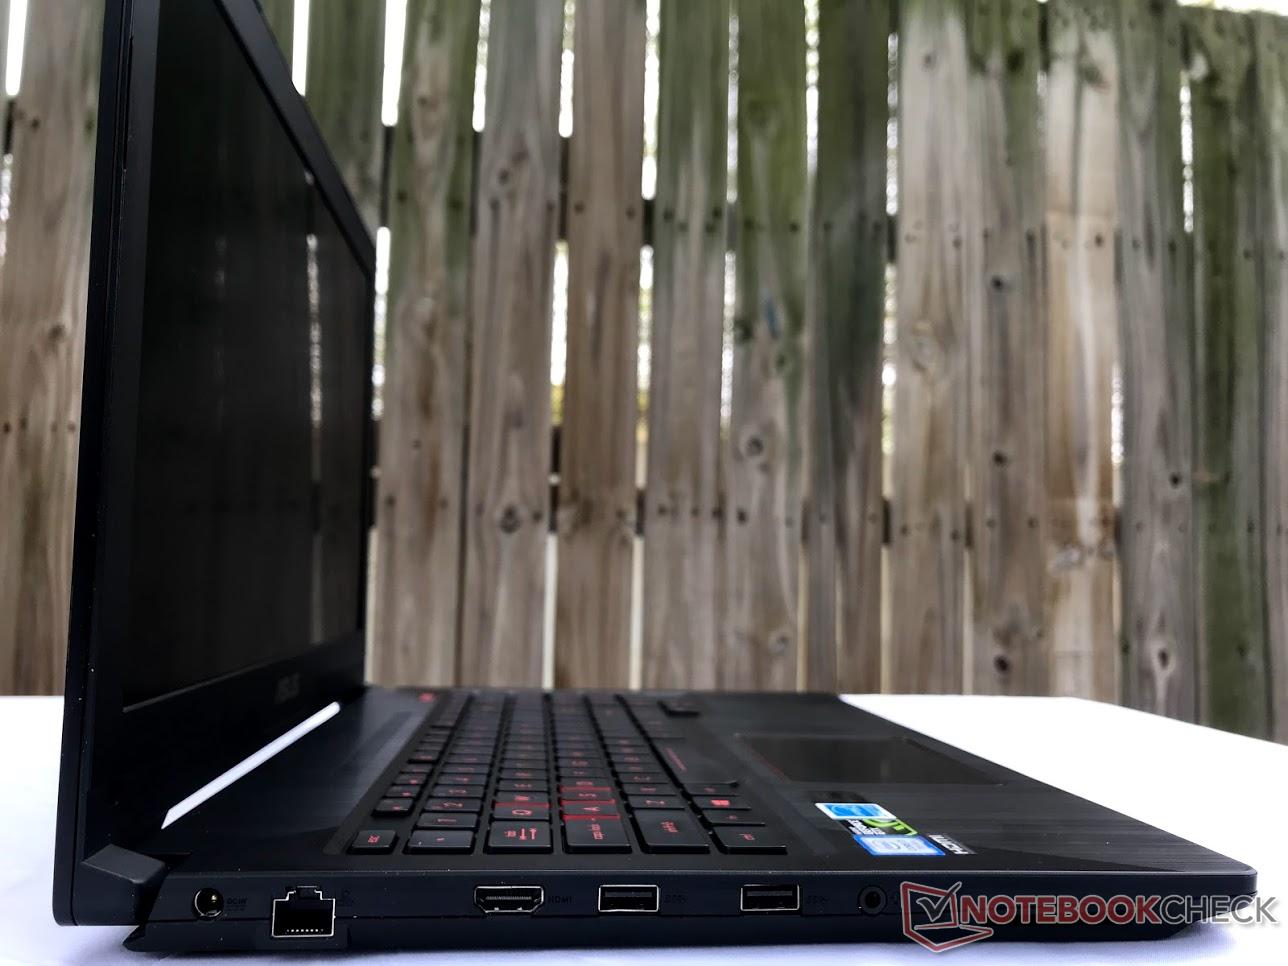
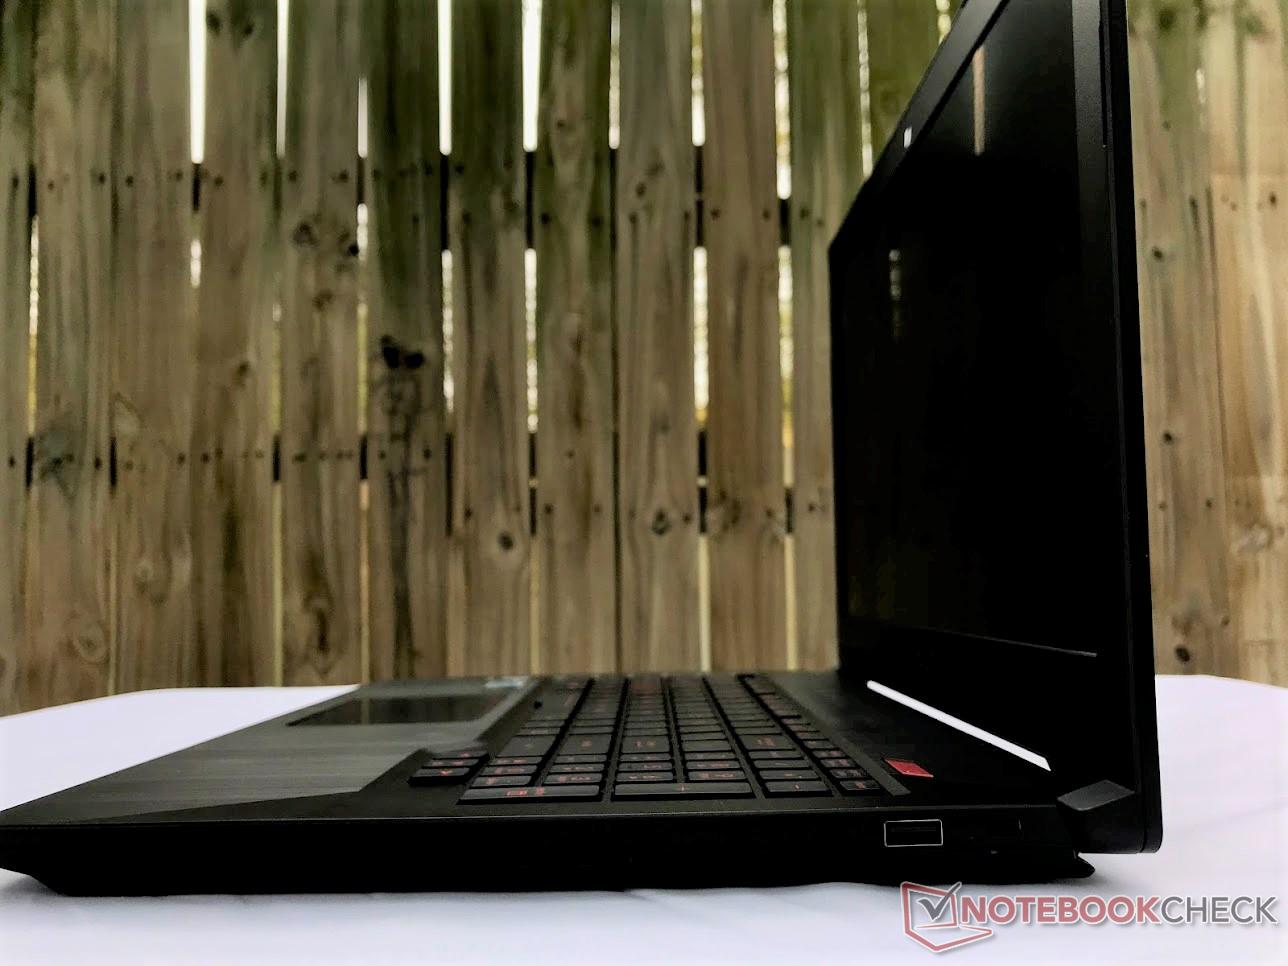
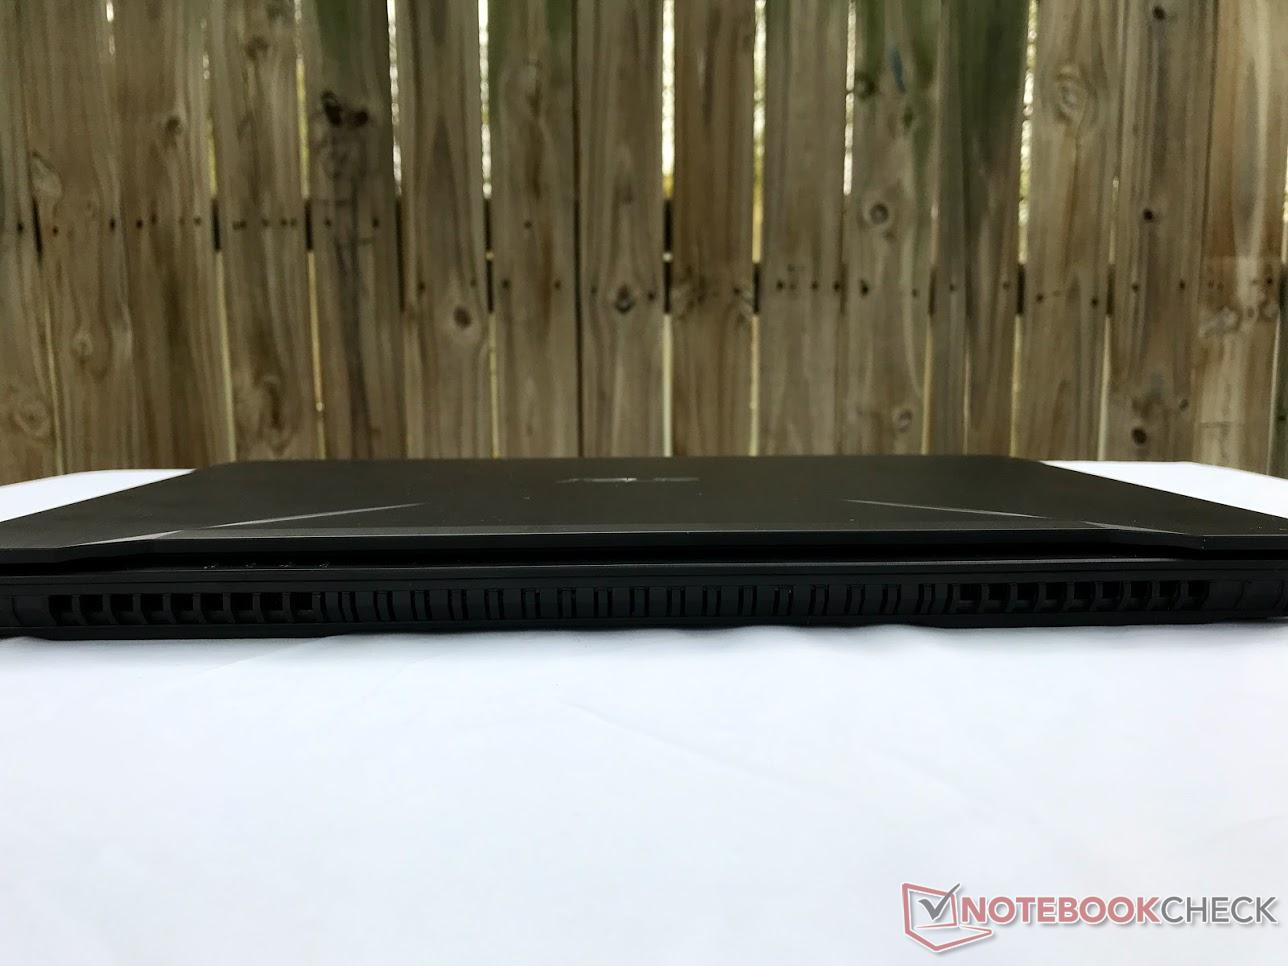
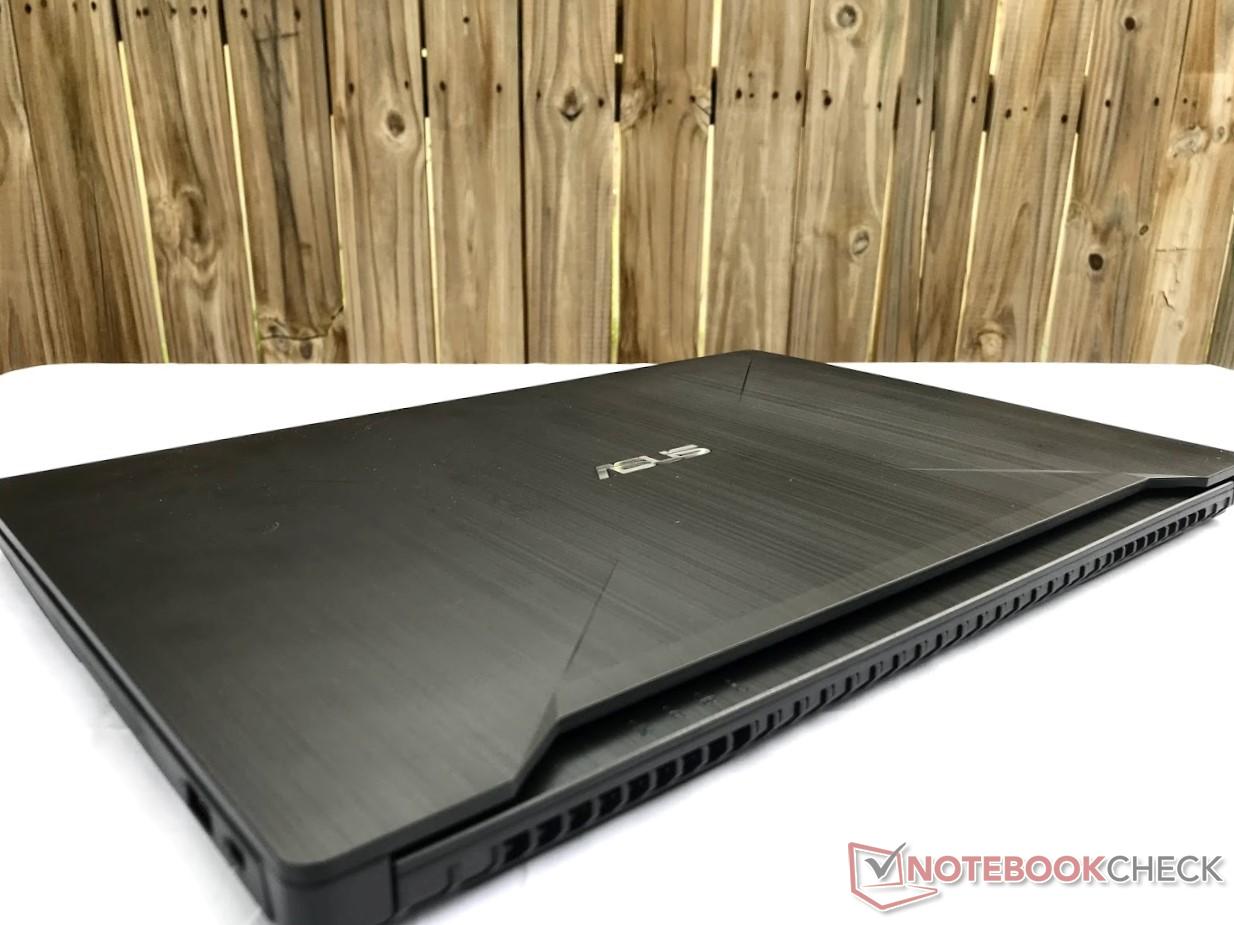
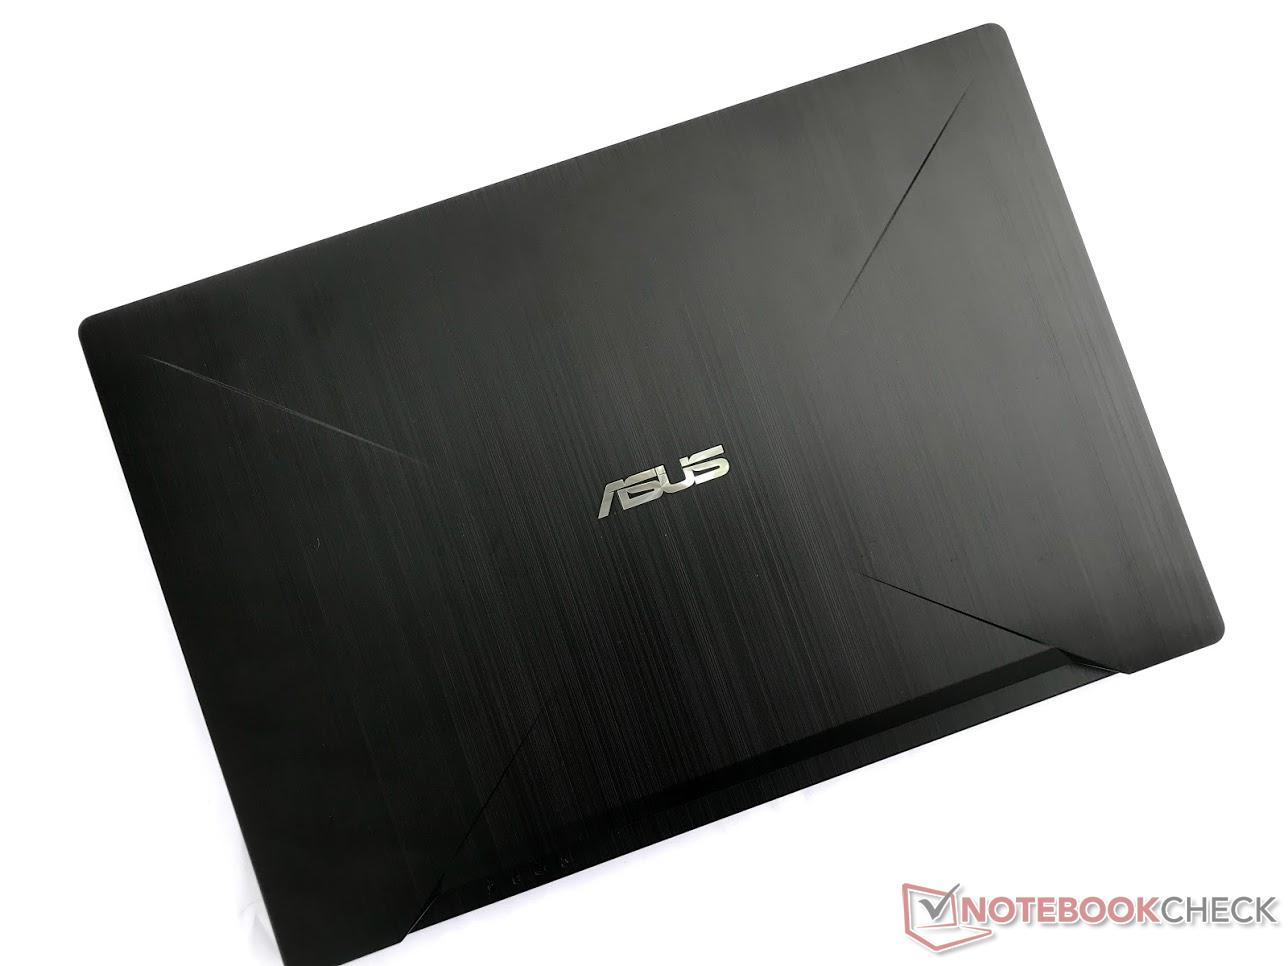
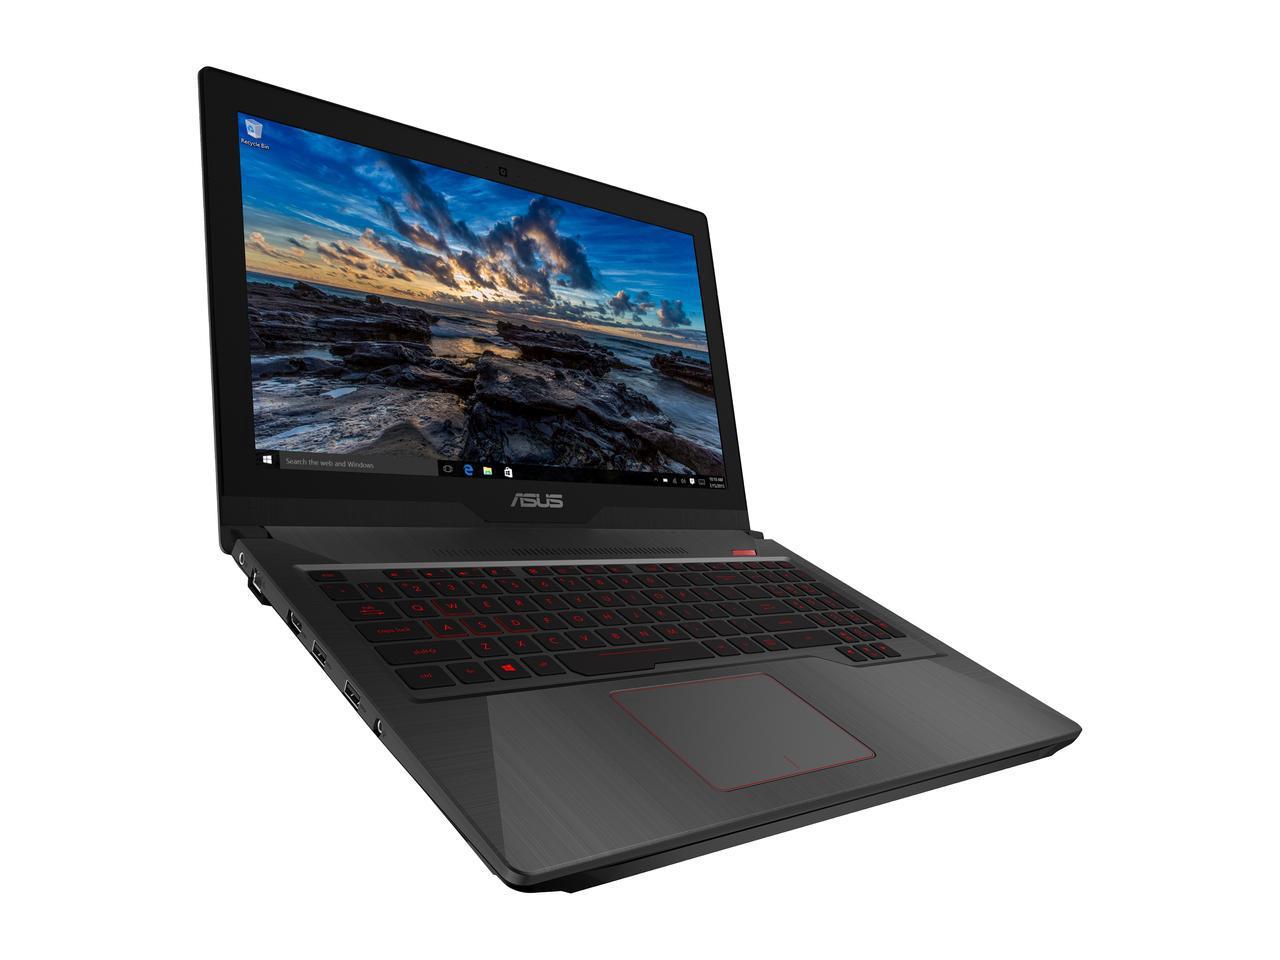
Kort testrapport Asus FX503VM (7700HQ, GTX 1060, FHD) Laptop
| SD Card Reader | |
| average JPG Copy Test (av. of 3 runs) | |
| Gemiddelde van klas Gaming (20.9 - 210, n=54, laatste 2 jaar) | |
| Asus FX502VM-AS73 (Toshiba Exceria Pro SDXC 64 GB UHS-II) | |
| HP Omen 15-ce002ng (Toshiba Exceria Pro SDXC 64 GB UHS-II) | |
| Asus FX503VM-EH73 (Toshiba Exceria Pro SDXC 64 GB UHS-II) | |
| Dell Inspiron 15 7000 7577 (Toshiba Exceria Pro SDXC 64 GB UHS-II) | |
| Acer Aspire VX5-591G-75C4 VX15 | |
| Acer Aspire VN7-593G-73HP V15 Nitro BE | |
| maximum AS SSD Seq Read Test (1GB) | |
| Gemiddelde van klas Gaming (25.5 - 261, n=51, laatste 2 jaar) | |
| HP Omen 15-ce002ng (Toshiba Exceria Pro SDXC 64 GB UHS-II) | |
| Asus FX502VM-AS73 (Toshiba Exceria Pro SDXC 64 GB UHS-II) | |
| Asus FX503VM-EH73 (Toshiba Exceria Pro SDXC 64 GB UHS-II) | |
| Dell Inspiron 15 7000 7577 (Toshiba Exceria Pro SDXC 64 GB UHS-II) | |
| Acer Aspire VX5-591G-75C4 VX15 | |
| Acer Aspire VN7-593G-73HP V15 Nitro BE | |
| |||||||||||||||||||||||||
Helderheidsverdeling: 91 %
Helderheid in Batterij-modus: 235.9 cd/m²
Contrast: 874:1 (Zwart: 0.27 cd/m²)
ΔE ColorChecker Calman: 4.81 | ∀{0.5-29.43 Ø4.73}
ΔE Greyscale Calman: 3.1 | ∀{0.09-98 Ø4.97}
56% sRGB (Argyll 1.6.3 3D)
36% AdobeRGB 1998 (Argyll 1.6.3 3D)
38.72% AdobeRGB 1998 (Argyll 3D)
56.3% sRGB (Argyll 3D)
37.48% Display P3 (Argyll 3D)
Gamma: 2.31
CCT: 6984 K
| Asus FX503VM-EH73 AU Optronics B156HAN06.1, IPS, 15.6", 1920x1080 | Asus FX502VM-AS73 TN LED, 15.6", 1920x1080 | Dell Inspiron 15 7000 7577 ID: LG Philips LGD053F, Name: 156WF6, Dell P/N: 4XK13, IPS, 15.6", 1920x1080 | HP Omen 15-ce002ng AUO42ED, IPS, 15.6", 1920x1080 | Acer Aspire VN7-593G-73HP V15 Nitro BE LG Display LP156WF6-SPP1, AH-IPS, Normally Black, Transmissive, 15.6", 1920x1080 | Acer Nitro 5 AN515-51-788E LG Philips LP156WF6-SPK6, IPS, 15.6", 1920x1080 | Acer Aspire VX5-591G-75C4 VX15 LG Philips LGD0550 / LP156WF6-SPK4, IPS, 15.6", 1920x1080 | |
|---|---|---|---|---|---|---|---|
| Display | 2% | -1% | 70% | 63% | 11% | 4% | |
| Display P3 Coverage (%) | 37.48 | 38.28 2% | 37.07 -1% | 65.8 76% | 65.8 76% | 41.7 11% | 38.88 4% |
| sRGB Coverage (%) | 56.3 | 56.9 1% | 55.6 -1% | 90.9 61% | 85.1 51% | 62.2 10% | 58.2 3% |
| AdobeRGB 1998 Coverage (%) | 38.72 | 39.47 2% | 38.32 -1% | 66.5 72% | 62.2 61% | 43.17 11% | 40.2 4% |
| Response Times | 26% | 8% | -8% | -10% | 18% | 34% | |
| Response Time Grey 50% / Grey 80% * (ms) | 36.8 ? | 28.4 ? 23% | 35.6 ? 3% | 43.2 ? -17% | 41 ? -11% | 35 ? 5% | 22 ? 40% |
| Response Time Black / White * (ms) | 31.6 ? | 22.4 ? 29% | 27.6 ? 13% | 31.2 ? 1% | 34 ? -8% | 22 ? 30% | 23 ? 27% |
| PWM Frequency (Hz) | |||||||
| Screen | -19% | -4% | 33% | 22% | 3% | 1% | |
| Brightness middle (cd/m²) | 235.9 | 209.5 -11% | 235.4 0% | 304 29% | 322 36% | 276 17% | 281 19% |
| Brightness (cd/m²) | 235 | 205 -13% | 223 -5% | 289 23% | 297 26% | 265 13% | 257 9% |
| Brightness Distribution (%) | 91 | 92 1% | 91 0% | 86 -5% | 86 -5% | 91 0% | 85 -7% |
| Black Level * (cd/m²) | 0.27 | 0.69 -156% | 0.28 -4% | 0.26 4% | 0.31 -15% | 0.25 7% | 0.32 -19% |
| Contrast (:1) | 874 | 304 -65% | 841 -4% | 1169 34% | 1039 19% | 1104 26% | 878 0% |
| Colorchecker dE 2000 * | 4.81 | 4.7 2% | 5.6 -16% | 3.46 28% | 4.73 2% | 5.06 -5% | 5.16 -7% |
| Colorchecker dE 2000 max. * | 21.55 | 19.7 9% | 20.3 6% | 7.72 64% | 12.37 43% | 10.13 53% | 9.09 58% |
| Greyscale dE 2000 * | 3.1 | 1.8 42% | 3.6 -16% | 2.46 21% | 2.99 4% | 6.25 -102% | 4.57 -47% |
| Gamma | 2.31 95% | 2.23 99% | 2.23 99% | 2.38 92% | 2.32 95% | 1.76 125% | 2.59 85% |
| CCT | 6984 93% | 6975 93% | 7214 90% | 6915 94% | 6905 94% | 6873 95% | 6931 94% |
| Color Space (Percent of AdobeRGB 1998) (%) | 36 | 36.2 1% | 35.2 -2% | 59 64% | 56 56% | 40 11% | 37 3% |
| Color Space (Percent of sRGB) (%) | 56 | 56.6 1% | 55.4 -1% | 91 63% | 85 52% | 62 11% | 58 4% |
| Totaal Gemiddelde (Programma / Instellingen) | 3% /
-9% | 1% /
-2% | 32% /
35% | 25% /
26% | 11% /
7% | 13% /
6% |
* ... kleiner is beter
Responstijd Scherm
| ↔ Responstijd Zwart naar Wit | ||
|---|---|---|
| 31.6 ms ... stijging ↗ en daling ↘ gecombineerd | ↗ 18.4 ms stijging | 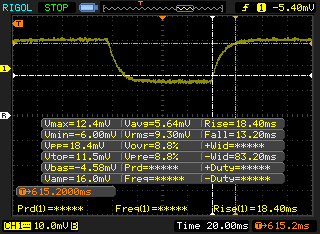 |
| ↘ 13.2 ms daling | ||
| Het scherm vertoonde trage responstijden in onze tests en is misschien te traag voor games. Ter vergelijking: alle testtoestellen variëren van 0.1 (minimum) tot 240 (maximum) ms. » 85 % van alle toestellen zijn beter. Dit betekent dat de gemeten responstijd slechter is dan het gemiddelde (19.9 ms) van alle geteste toestellen. | ||
| ↔ Responstijd 50% Grijs naar 80% Grijs | ||
| 36.8 ms ... stijging ↗ en daling ↘ gecombineerd | ↗ 19.6 ms stijging | 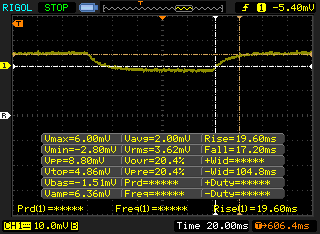 |
| ↘ 17.2 ms daling | ||
| Het scherm vertoonde trage responstijden in onze tests en is misschien te traag voor games. Ter vergelijking: alle testtoestellen variëren van 0.165 (minimum) tot 636 (maximum) ms. » 53 % van alle toestellen zijn beter. Dit betekent dat de gemeten responstijd slechter is dan het gemiddelde (31.1 ms) van alle geteste toestellen. | ||
Screen Flickering / PWM (Pulse-Width Modulation)
| Screen flickering / PWM niet waargenomen | 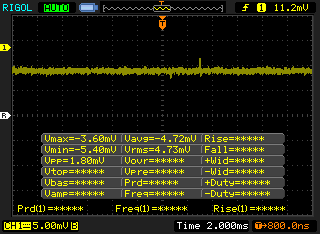 | ||
Ter vergelijking: 52 % van alle geteste toestellen maakten geen gebruik van PWM om de schermhelderheid te verlagen. Als het wel werd gebruikt, werd een gemiddelde van 7798 (minimum: 5 - maximum: 343500) Hz waargenomen. | |||

* ... kleiner is beter
| PCMark 8 Home Score Accelerated v2 | 4940 punten | |
| PCMark 8 Creative Score Accelerated v2 | 7238 punten | |
| PCMark 8 Work Score Accelerated v2 | 5174 punten | |
| PCMark 10 Score | 4856 punten | |
Help | ||
| Asus FX503VM-EH73 SanDisk SD8SN8U128G1002 | Asus FX502VM-AS73 SK Hynix HFS256G39TND-N210A | Dell Inspiron 15 7000 7577 Samsung PM961 MZVLW256HEHP | Lenovo Legion Y520-15IKBM 80YY001APB ADATA SX7000NP 256 GB | Acer Nitro 5 AN515-51-788E Intel SSD 600p SSDPEKKW256G7 | |
|---|---|---|---|---|---|
| AS SSD | -9% | 199% | 60% | 41% | |
| Copy Game MB/s (MB/s) | 155.3 | 382.5 | 708 | ||
| Copy Program MB/s (MB/s) | 120.7 | 274.8 | 225.8 | ||
| Copy ISO MB/s (MB/s) | 202.2 | 814 | 1076 | ||
| Score Total (Points) | 798 | 822 3% | 2405 201% | 898 13% | 984 23% |
| Score Write (Points) | 178 | 200 12% | 594 234% | 291 63% | 344 93% |
| Score Read (Points) | 411 | 418 2% | 1241 202% | 409 0% | 446 9% |
| Access Time Write * (ms) | 0.09 | 0.266 -196% | 0.037 59% | 0.033 63% | 0.231 -157% |
| Access Time Read * (ms) | 0.17 | 0.104 39% | 0.058 66% | 0.069 59% | 0.129 24% |
| 4K-64 Write (MB/s) | 95.5 | 123.8 30% | 375.8 294% | 100.7 5% | 217.1 127% |
| 4K-64 Read (MB/s) | 343.4 | 342.3 0% | 929 171% | 255.9 -25% | 278 -19% |
| 4K Write (MB/s) | 46.48 | 63.6 37% | 100.2 116% | 110.6 138% | 75 61% |
| 4K Read (MB/s) | 20.44 | 26.01 27% | 46.95 130% | 30.9 51% | 27.86 36% |
| Seq Write (MB/s) | 328.4 | 130 -60% | 1181 260% | 795 142% | 521 59% |
| Seq Read (MB/s) | 476.3 | 492.6 3% | 2652 457% | 1221 156% | 1404 195% |
* ... kleiner is beter

| 3DMark 11 Performance | 11823 punten | |
| 3DMark Ice Storm Standard Score | 132724 punten | |
| 3DMark Cloud Gate Standard Score | 25238 punten | |
| 3DMark Fire Strike Score | 9739 punten | |
| 3DMark Fire Strike Extreme Score | 5094 punten | |
| 3DMark Time Spy Score | 3621 punten | |
Help | ||
| The Witcher 3 - 1920x1080 Ultra Graphics & Postprocessing (HBAO+) (sorteer op waarde) | |
| Asus FX503VM-EH73 | |
| Dell Inspiron 15 7000 7577 | |
| Lenovo Legion Y520-15IKBM 80YY001APB | |
| HP Omen 15-ce002ng | |
| Acer Aspire VN7-593G-73HP V15 Nitro BE | |
| Acer Nitro 5 AN515-51-788E | |
| Acer Aspire VX5-591G-75C4 VX15 | |
| MSI GE63VR 7RF Raider | |
| Gigabyte Aero 15X | |
| Aorus X5 v7 | |
| Gemiddeld NVIDIA GeForce GTX 1060 Mobile (24 - 42.3, n=60) | |
| Gemiddelde van klas Gaming (95 - 240, n=8, laatste 2 jaar) | |
| Fallout 4 - 1920x1080 Ultra Preset AA:T AF:16x (sorteer op waarde) | |
| Asus FX503VM-EH73 | |
| Asus FX502VM-AS73 | |
| Dell Inspiron 15 7000 7577 | |
| Gemiddeld NVIDIA GeForce GTX 1060 Mobile (57.1 - 77, n=17) | |
| Rise of the Tomb Raider - 1920x1080 Very High Preset AA:FX AF:16x (sorteer op waarde) | |
| Asus FX503VM-EH73 | |
| Asus FX502VM-AS73 | |
| Dell Inspiron 15 7000 7577 | |
| HP Omen 15-ce002ng | |
| Acer Aspire VN7-593G-73HP V15 Nitro BE | |
| MSI GE63VR 7RF Raider | |
| Aorus X5 v7 | |
| Acer Nitro 5 Spin NP515-51-86CX | |
| Gemiddeld NVIDIA GeForce GTX 1060 Mobile (51 - 68.8, n=37) | |
| Hitman 2016 - 1920x1080 Ultra / On AA:SM AF:16x (sorteer op waarde) | |
| Asus FX503VM-EH73 | |
| Gemiddeld NVIDIA GeForce GTX 1060 Mobile (46 - 61, n=7) | |
| Doom - 1920x1080 Ultra Preset AA:SM (sorteer op waarde) | |
| Asus FX503VM-EH73 | |
| Asus FX502VM-AS73 | |
| HP Omen 15-ce002ng | |
| Aorus X5 v7 | |
| Gemiddeld NVIDIA GeForce GTX 1060 Mobile (66 - 103.3, n=17) | |
| Deus Ex Mankind Divided - 1920x1080 Ultra Preset AA:2xMS AF:8x (sorteer op waarde) | |
| Asus FX503VM-EH73 | |
| HP Omen 15-ce002ng | |
| Acer Aspire VN7-593G-73HP V15 Nitro BE | |
| MSI GE63VR 7RF Raider | |
| Gemiddeld NVIDIA GeForce GTX 1060 Mobile (26.9 - 39, n=11) | |
| Civilization 6 - 1920x1080 Ultra Preset AA:4xMS (sorteer op waarde) | |
| Asus FX503VM-EH73 | |
| Gemiddeld NVIDIA GeForce GTX 1060 Mobile (42.8 - 71, n=5) | |
| Prey - 1920x1080 Very High Preset AA:2TX SM AF:16x (sorteer op waarde) | |
| Asus FX503VM-EH73 | |
| Dell Inspiron 15 7000 7577 | |
| HP Omen 15-ce002ng | |
| Acer Nitro 5 AN515-51-788E | |
| Gemiddeld NVIDIA GeForce GTX 1060 Mobile (97 - 110.3, n=7) | |
| Rocket League - 1920x1080 High Quality AA:High FX (sorteer op waarde) | |
| Asus FX503VM-EH73 | |
| HP Omen 15-ce002ng | |
| Acer Nitro 5 AN515-51-788E | |
| Gemiddeld NVIDIA GeForce GTX 1060 Mobile (136 - 181, n=7) | |
| Playerunknown's Battlegrounds (PUBG) - 1920x1080 High Preset (sorteer op waarde) | |
| Asus FX503VM-EH73 | |
| Acer Nitro 5 AN515-51-788E | |
| Gemiddeld NVIDIA GeForce GTX 1060 Mobile (61 - 69.4, n=4) | |
| Middle-earth: Shadow of War - 1920x1080 Ultra Preset AA:T (sorteer op waarde) | |
| Asus FX503VM-EH73 | |
| Dell Inspiron 15 7000 7577 | |
| Gigabyte Aero 15X | |
| Gemiddeld NVIDIA GeForce GTX 1060 Mobile (52 - 54, n=5) | |
| Kingdom Come: Deliverance - 1920x1080 Ultra High Preset (sorteer op waarde) | |
| Asus FX503VM-EH73 | |
| Gemiddeld NVIDIA GeForce GTX 1060 Mobile (36 - 45.2, n=5) | |
| lage | gem. | hoge | ultra | |
|---|---|---|---|---|
| The Witcher 3 (2015) | 37 | |||
| Fallout 4 (2015) | 73 | |||
| Rise of the Tomb Raider (2016) | 57 | |||
| Hitman 2016 (2016) | 61 | |||
| Doom (2016) | 92 | |||
| Deus Ex Mankind Divided (2016) | 39 | |||
| Civilization 6 (2016) | 71 | |||
| Prey (2017) | 97 | |||
| Rocket League (2017) | 145 | |||
| Playerunknown's Battlegrounds (PUBG) (2017) | 61 | |||
| Middle-earth: Shadow of War (2017) | 52 | |||
| Kingdom Come: Deliverance (2018) | 38 |
Geluidsniveau
| Onbelast |
| 29.6 / 29.6 / 29.6 dB (A) |
| Belasting |
| 37.3 / 53.7 dB (A) |
 | ||
30 dB stil 40 dB(A) hoorbaar 50 dB(A) luid |
||
min: | ||
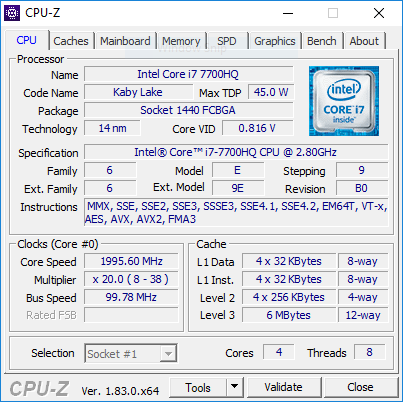
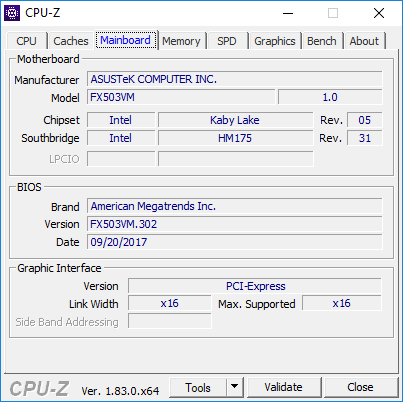
| Asus FX503VM-EH73 GeForce GTX 1060 Mobile, i7-7700HQ, SanDisk SD8SN8U128G1002 | Asus FX502VM-AS73 GeForce GTX 1060 Mobile, i7-7700HQ, SK Hynix HFS256G39TND-N210A | Dell Inspiron 15 7000 7577 GeForce GTX 1060 Max-Q, i5-7300HQ, Samsung PM961 MZVLW256HEHP | Lenovo Legion Y520-15IKBM 80YY001APB GeForce GTX 1060 Max-Q, i5-7300HQ, ADATA SX7000NP 256 GB | HP Omen 15-ce002ng GeForce GTX 1060 Max-Q, i7-7700HQ, Samsung PM961 MZVLW256HEHP | Acer Aspire VN7-593G-73HP V15 Nitro BE GeForce GTX 1060 Mobile, i7-7700HQ, Seagate Mobile HDD 1TB ST1000LM035 | Acer Nitro 5 AN515-51-788E GeForce GTX 1050 Ti Mobile, i7-7700HQ, Intel SSD 600p SSDPEKKW256G7 | Acer Aspire VX5-591G-75C4 VX15 GeForce GTX 1050 Ti Mobile, i7-7700HQ, Toshiba MQ01ABD100 | |
|---|---|---|---|---|---|---|---|---|
| Noise | -6% | 10% | -4% | -5% | -1% | -0% | -1% | |
| uit / omgeving * (dB) | 27.8 | 28.7 -3% | 28 -1% | 30 -8% | 30.4 -9% | 30.6 -10% | 30.4 -9% | |
| Idle Minimum * (dB) | 29.6 | 30.6 -3% | 28 5% | 30.5 -3% | 30 -1% | 30.9 -4% | 30.6 -3% | 31.4 -6% |
| Idle Average * (dB) | 29.6 | 30.6 -3% | 28 5% | 33 -11% | 33 -11% | 30.9 -4% | 30.7 -4% | 31.4 -6% |
| Idle Maximum * (dB) | 29.6 | 31 -5% | 28 5% | 36.1 -22% | 37 -25% | 31.5 -6% | 30.7 -4% | 31.4 -6% |
| Load Average * (dB) | 37.3 | 46.2 -24% | 30.3 19% | 39.4 -6% | 41 -10% | 40.7 -9% | 43 -15% | 36.8 1% |
| Witcher 3 ultra * (dB) | 49.8 | 39.5 21% | 42 16% | 45.5 9% | 39.7 20% | |||
| Load Maximum * (dB) | 53.7 | 52.3 3% | 46.5 13% | 41.5 23% | 50 7% | 43.9 18% | 45.8 15% | 41.3 23% |
* ... kleiner is beter
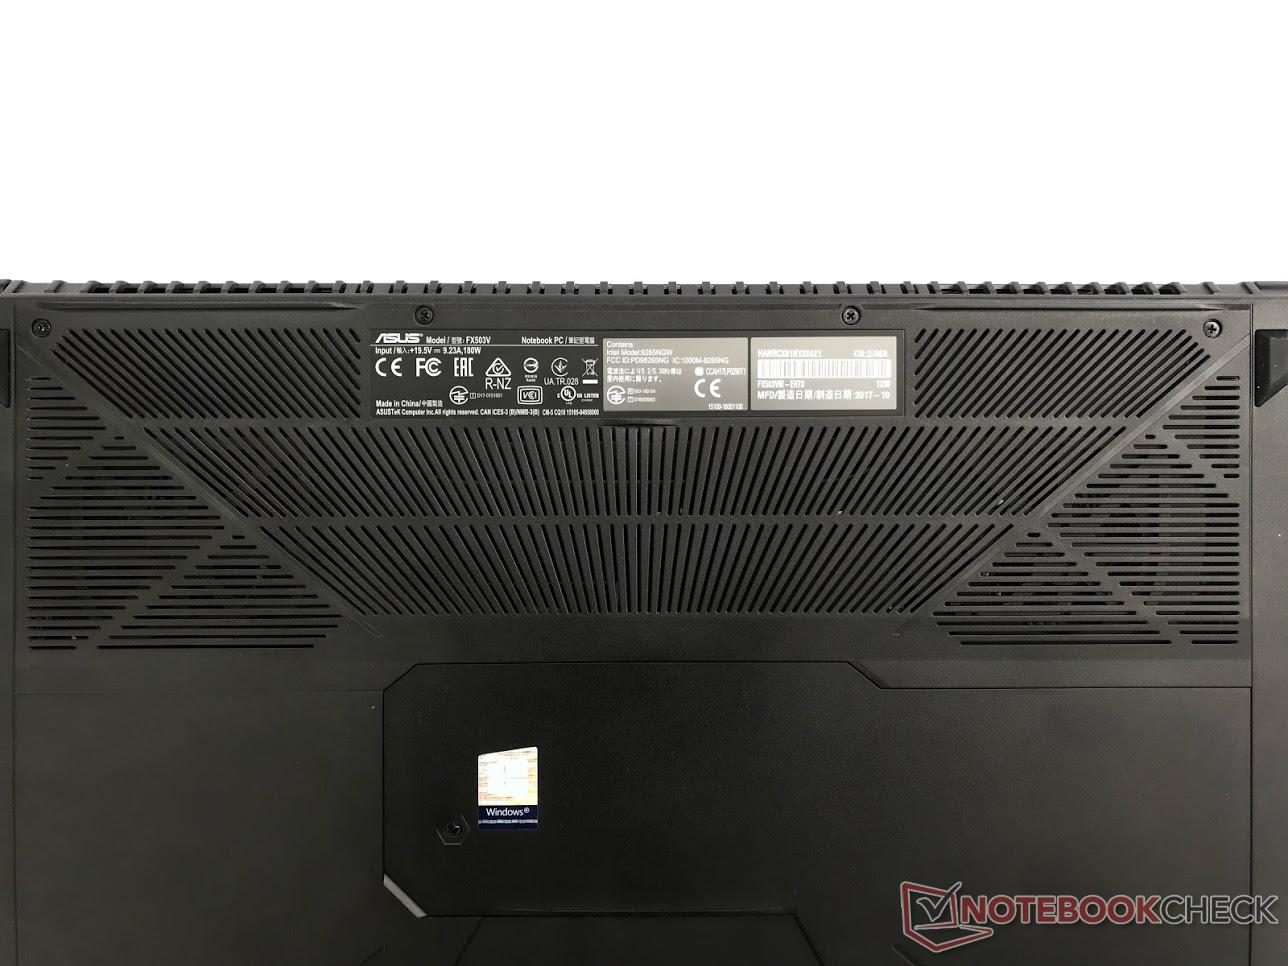
(-) De maximumtemperatuur aan de bovenzijde bedraagt 59.6 °C / 139 F, vergeleken met het gemiddelde van 40.4 °C / 105 F, variërend van 21.2 tot 68.8 °C voor de klasse Gaming.
(-) De bodem warmt op tot een maximum van 56 °C / 133 F, vergeleken met een gemiddelde van 43.2 °C / 110 F
(+) Bij onbelast gebruik bedraagt de gemiddelde temperatuur voor de bovenzijde 28.3 °C / 83 F, vergeleken met het apparaatgemiddelde van 33.9 °C / 93 F.
(±) Bij het spelen van The Witcher 3 is de gemiddelde temperatuur voor de bovenzijde 33.5 °C / 92 F, vergeleken met het apparaatgemiddelde van 33.9 °C / 93 F.
(+) De palmsteunen en het touchpad zijn met een maximum van ###max## °C / 77.4 F koeler dan de huidtemperatuur en voelen daarom koel aan.
(+) De gemiddelde temperatuur van de handpalmsteun van soortgelijke toestellen bedroeg 28.8 °C / 83.8 F (+3.6 °C / 6.4 F).
Asus FX503VM-EH73 audioanalyse
(-) | niet erg luide luidsprekers (68.2 dB)
Bas 100 - 315 Hz
(±) | verminderde zeebaars - gemiddeld 11.5% lager dan de mediaan
(±) | lineariteit van de lage tonen is gemiddeld (14.8% delta ten opzichte van de vorige frequentie)
Midden 400 - 2000 Hz
(+) | evenwichtige middens - slechts 1.9% verwijderd van de mediaan
(+) | de middentonen zijn lineair (6.7% delta ten opzichte van de vorige frequentie)
Hoog 2 - 16 kHz
(+) | evenwichtige hoogtepunten - slechts 4.2% verwijderd van de mediaan
(±) | lineariteit van de hoogtepunten is gemiddeld (7.6% delta ten opzichte van de vorige frequentie)
Algemeen 100 - 16.000 Hz
(±) | lineariteit van het totale geluid is gemiddeld (19.4% verschil met de mediaan)
Vergeleken met dezelfde klasse
» 67% van alle geteste apparaten in deze klasse waren beter, 7% vergelijkbaar, 26% slechter
» De beste had een delta van 6%, het gemiddelde was 18%, de slechtste was 132%
Vergeleken met alle geteste toestellen
» 48% van alle geteste apparaten waren beter, 7% gelijk, 45% slechter
» De beste had een delta van 4%, het gemiddelde was 24%, de slechtste was 134%
Asus FX502VM-AS73 audioanalyse
(-) | niet erg luide luidsprekers (67.7 dB)
Bas 100 - 315 Hz
(±) | verminderde zeebaars - gemiddeld 14% lager dan de mediaan
(±) | lineariteit van de lage tonen is gemiddeld (12.6% delta ten opzichte van de vorige frequentie)
Midden 400 - 2000 Hz
(+) | evenwichtige middens - slechts 2.7% verwijderd van de mediaan
(±) | lineariteit van de middentonen is gemiddeld (11.5% delta ten opzichte van de vorige frequentie)
Hoog 2 - 16 kHz
(+) | evenwichtige hoogtepunten - slechts 4.9% verwijderd van de mediaan
(±) | lineariteit van de hoogtepunten is gemiddeld (11.4% delta ten opzichte van de vorige frequentie)
Algemeen 100 - 16.000 Hz
(±) | lineariteit van het totale geluid is gemiddeld (29.9% verschil met de mediaan)
Vergeleken met dezelfde klasse
» 95% van alle geteste apparaten in deze klasse waren beter, 2% vergelijkbaar, 3% slechter
» De beste had een delta van 6%, het gemiddelde was 18%, de slechtste was 132%
Vergeleken met alle geteste toestellen
» 88% van alle geteste apparaten waren beter, 3% gelijk, 9% slechter
» De beste had een delta van 4%, het gemiddelde was 24%, de slechtste was 134%
Dell Inspiron 15 7000 7577 audioanalyse
(±) | luidspreker luidheid is gemiddeld maar goed (80.9 dB)
Bas 100 - 315 Hz
(±) | verminderde zeebaars - gemiddeld 13% lager dan de mediaan
(+) | de lage tonen zijn lineair (6.8% delta naar de vorige frequentie)
Midden 400 - 2000 Hz
(+) | evenwichtige middens - slechts 2.7% verwijderd van de mediaan
(+) | de middentonen zijn lineair (5.3% delta ten opzichte van de vorige frequentie)
Hoog 2 - 16 kHz
(±) | higher highs - on average 8% higher than median
(±) | lineariteit van de hoogtepunten is gemiddeld (10.6% delta ten opzichte van de vorige frequentie)
Algemeen 100 - 16.000 Hz
(±) | lineariteit van het totale geluid is gemiddeld (18.9% verschil met de mediaan)
Vergeleken met dezelfde klasse
» 63% van alle geteste apparaten in deze klasse waren beter, 8% vergelijkbaar, 29% slechter
» De beste had een delta van 6%, het gemiddelde was 18%, de slechtste was 132%
Vergeleken met alle geteste toestellen
» 44% van alle geteste apparaten waren beter, 8% gelijk, 48% slechter
» De beste had een delta van 4%, het gemiddelde was 24%, de slechtste was 134%
| Uit / Standby | |
| Inactief | |
| Belasting |
|
Key:
min: | |
| Asus FX503VM-EH73 i7-7700HQ, GeForce GTX 1060 Mobile, SanDisk SD8SN8U128G1002, IPS, 1920x1080, 15.6" | Asus FX502VM-AS73 i7-7700HQ, GeForce GTX 1060 Mobile, SK Hynix HFS256G39TND-N210A, TN LED, 1920x1080, 15.6" | Dell Inspiron 15 7000 7577 i5-7300HQ, GeForce GTX 1060 Max-Q, Samsung PM961 MZVLW256HEHP, IPS, 1920x1080, 15.6" | Lenovo Legion Y520-15IKBM 80YY001APB i5-7300HQ, GeForce GTX 1060 Max-Q, ADATA SX7000NP 256 GB, IPS, 1920x1080, 15.6" | HP Omen 15-ce002ng i7-7700HQ, GeForce GTX 1060 Max-Q, Samsung PM961 MZVLW256HEHP, IPS, 1920x1080, 15.6" | Acer Aspire VN7-593G-73HP V15 Nitro BE i7-7700HQ, GeForce GTX 1060 Mobile, Seagate Mobile HDD 1TB ST1000LM035, AH-IPS, Normally Black, Transmissive, 1920x1080, 15.6" | Acer Nitro 5 AN515-51-788E i7-7700HQ, GeForce GTX 1050 Ti Mobile, Intel SSD 600p SSDPEKKW256G7, IPS, 1920x1080, 15.6" | Acer Aspire VX5-591G-75C4 VX15 i7-7700HQ, GeForce GTX 1050 Ti Mobile, Toshiba MQ01ABD100, IPS, 1920x1080, 15.6" | |
|---|---|---|---|---|---|---|---|---|
| Power Consumption | -10% | 34% | 21% | -31% | 8% | 28% | 20% | |
| Idle Minimum * (Watt) | 12.8 | 14.9 -16% | 7.1 45% | 3.9 70% | 18 -41% | 7.2 44% | 4.1 68% | 7 45% |
| Idle Average * (Watt) | 15.4 | 15.1 2% | 7.6 51% | 10.7 31% | 23 -49% | 10.5 32% | 6.9 55% | 10.2 34% |
| Idle Maximum * (Watt) | 15.9 | 15.2 4% | 8.6 46% | 11.2 30% | 30 -89% | 16 -1% | 9.5 40% | 14 12% |
| Load Average * (Watt) | 78 | 105.8 -36% | 59.5 24% | 111.5 -43% | 85 -9% | 82 -5% | 83 -6% | 78 -0% |
| Witcher 3 ultra * (Watt) | 107.3 | 89 17% | 96 11% | 124 -16% | 108 -1% | |||
| Load Maximum * (Watt) | 143.4 | 148.8 -4% | 112.8 21% | 115.5 19% | 158 -10% | 155 -8% | 126 12% | 127 11% |
* ... kleiner is beter
| Asus FX503VM-EH73 i7-7700HQ, GeForce GTX 1060 Mobile, 64 Wh | Asus FX502VM-AS73 i7-7700HQ, GeForce GTX 1060 Mobile, 64 Wh | Dell Inspiron 15 7000 7577 i5-7300HQ, GeForce GTX 1060 Max-Q, 56 Wh | HP Omen 15-ce002ng i7-7700HQ, GeForce GTX 1060 Max-Q, 70 Wh | Acer Aspire VN7-593G-73HP V15 Nitro BE i7-7700HQ, GeForce GTX 1060 Mobile, 69 Wh | Acer Nitro 5 AN515-51-788E i7-7700HQ, GeForce GTX 1050 Ti Mobile, 48 Wh | Acer Aspire VX5-591G-75C4 VX15 i7-7700HQ, GeForce GTX 1050 Ti Mobile, 52.5 Wh | |
|---|---|---|---|---|---|---|---|
| Batterijduur | 2% | 63% | -12% | 65% | 69% | 10% | |
| Reader / Idle (h) | 5.7 | 6.1 7% | 11 93% | 4.3 -25% | 8.4 47% | 14.9 161% | 5.4 -5% |
| WiFi v1.3 (h) | 4.6 | 4.6 0% | 6.9 50% | 3.3 -28% | 6 30% | 6.7 46% | 5 9% |
| Load (h) | 1.1 | 1.1 0% | 1.6 45% | 1.3 18% | 2.4 118% | 1.1 0% | 1.4 27% |
Pro
Contra

Voor het volledige, Engelse testrapport, klik hier.
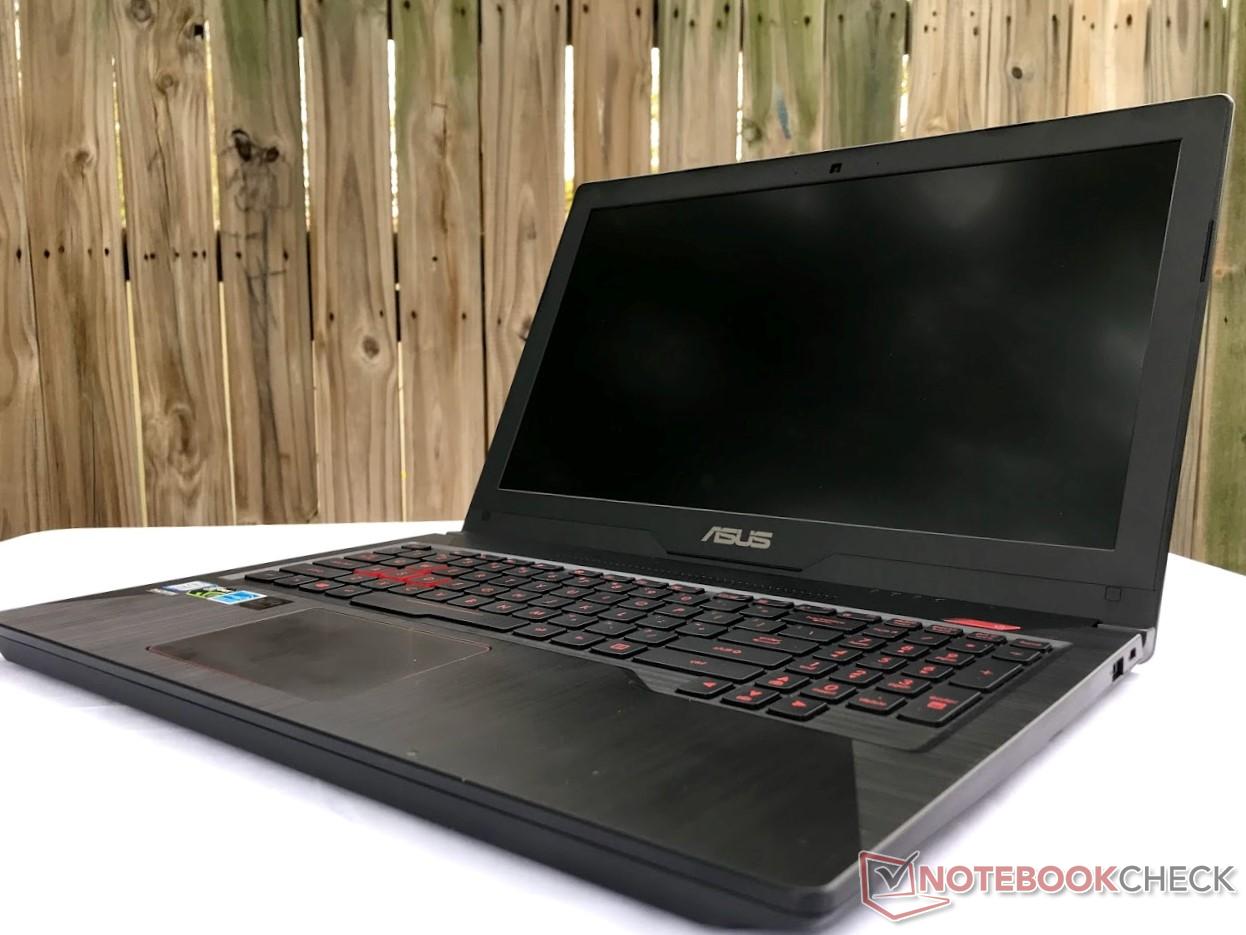
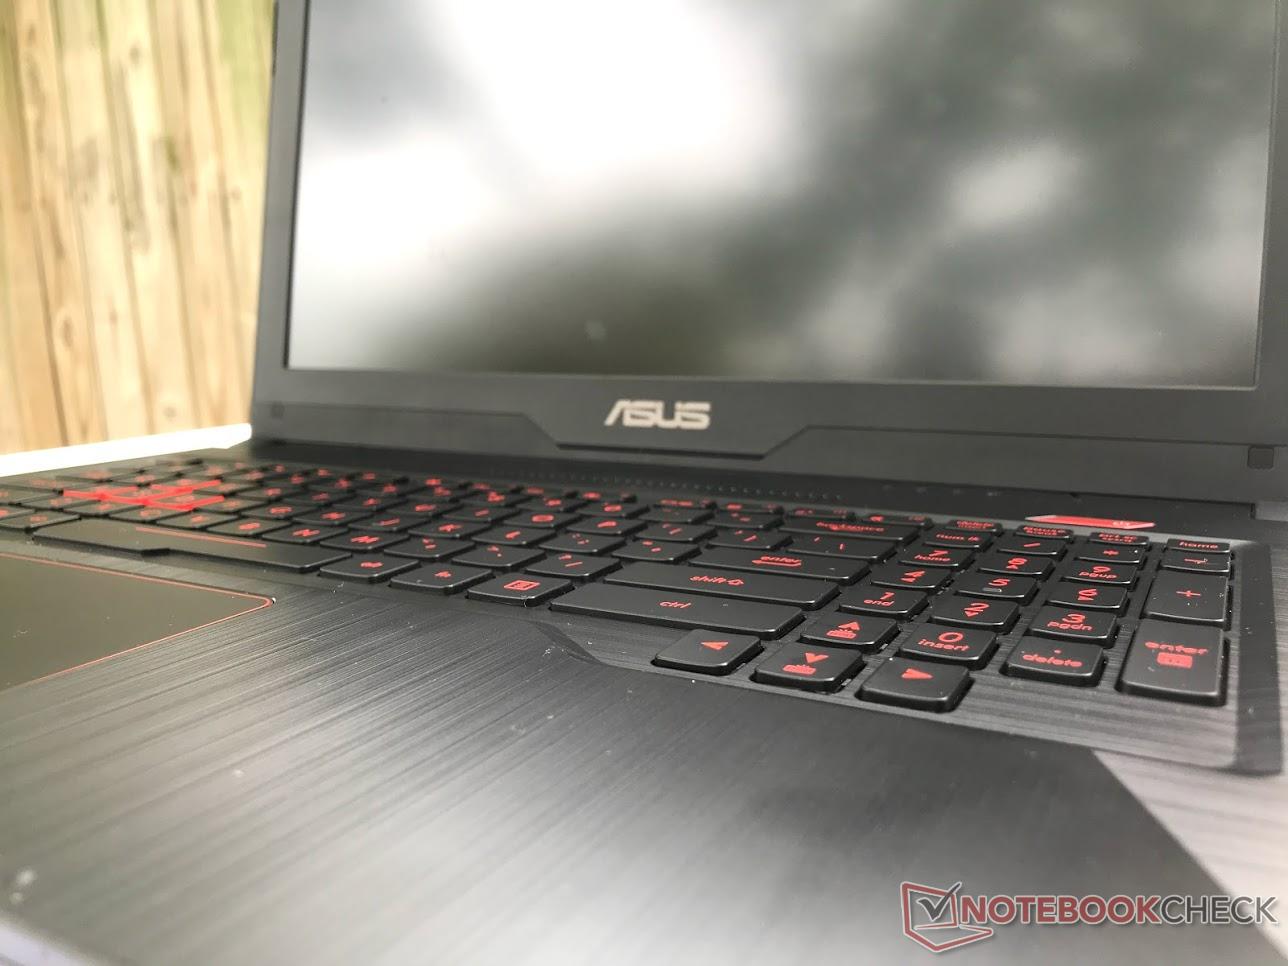
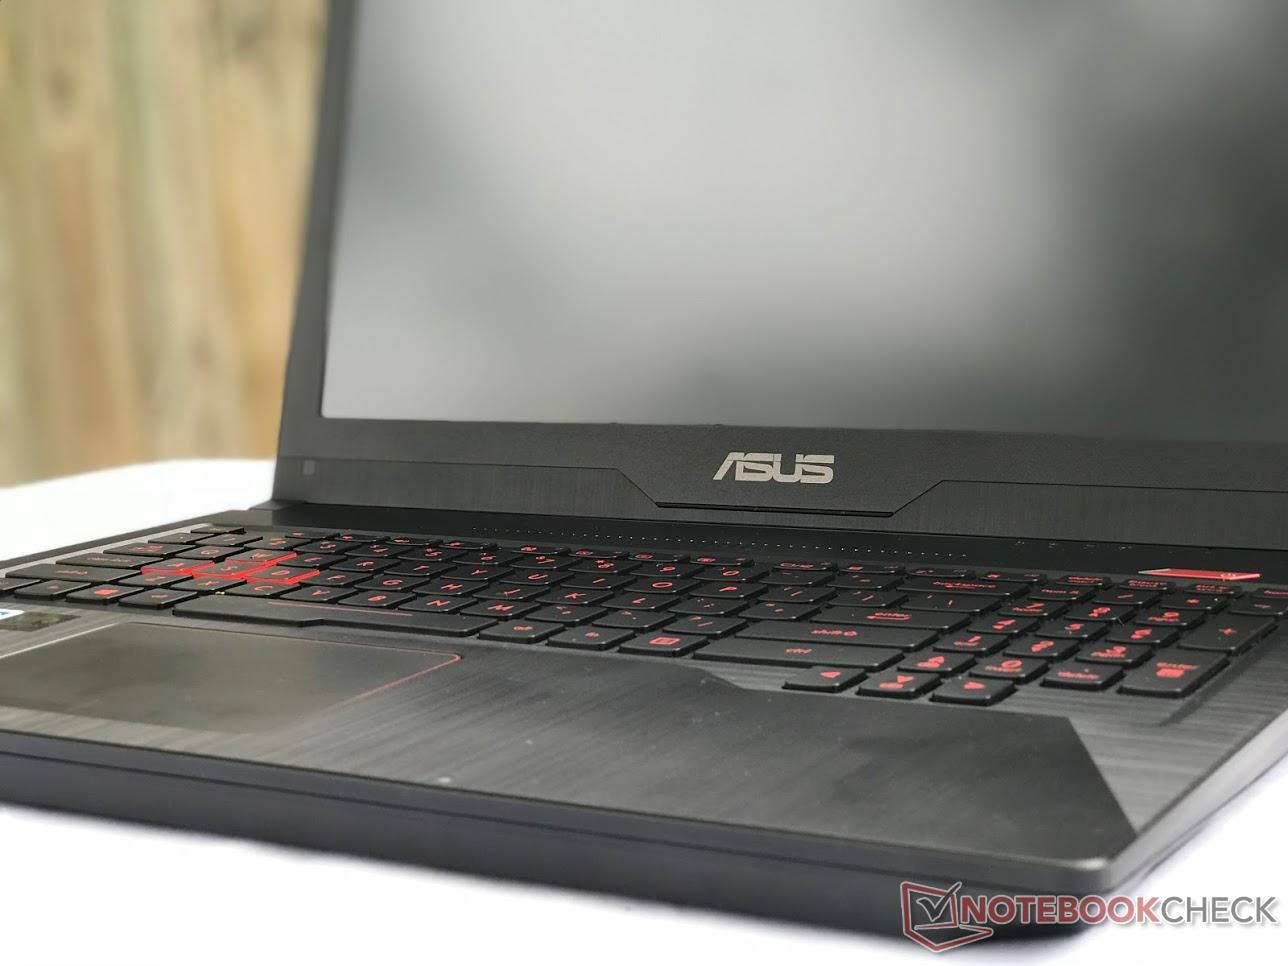
De FX503VM heeft geprobeerd om de stijl van een topmodel gaming notebook te combineren met de prijs van een budget laptop – en is hier grotendeels in geslaagd. Er zijn diverse aspecten waar we over te spreken zijn, waaronder het ergonomische toetsenbord, de uitstekende systeemprestaties en het stijlvolle maar subtiele ontwerp. Echter, er zijn ook overduidelijk compromissen gemaakt om de lage prijs te realiseren, zoals het touchpad en de kunststof behuizing. Het ontbreken van G-Sync ondersteuning (zelfs bij de duurste configuratie) is ook een tegenvaller.
Vergeleken met andere middenklasse gaming notebooks, doet de FX503VM het op bepaalde vlakken uitzonderlijk goed, en teleurstellend slecht op andere aspecten. Vergeleken met de GL503, waarop deze notebook is gebaseerd, biedt de FX503VM vergelijkbare prestaties en onderhoudsmogelijkheden voor een veel lagere prijs. Voor ongeveer $500 minder behoudt de FX503VM hetzelfde dunne profiel en de goede prestaties in ruil voor een stuk slechtere bouwkwaliteit. Het optionele 120 Hz beeldscherm is de kers op de taart. Gamers op zoek naar een aantrekkelijke maar pragmatische gaming notebook zullen de FX503VM kunnen waarderen. Het apparaat is niet bij alle verkopers continu leverbaar; indien het apparaat in de aanbieding is, is het een gouden koop.
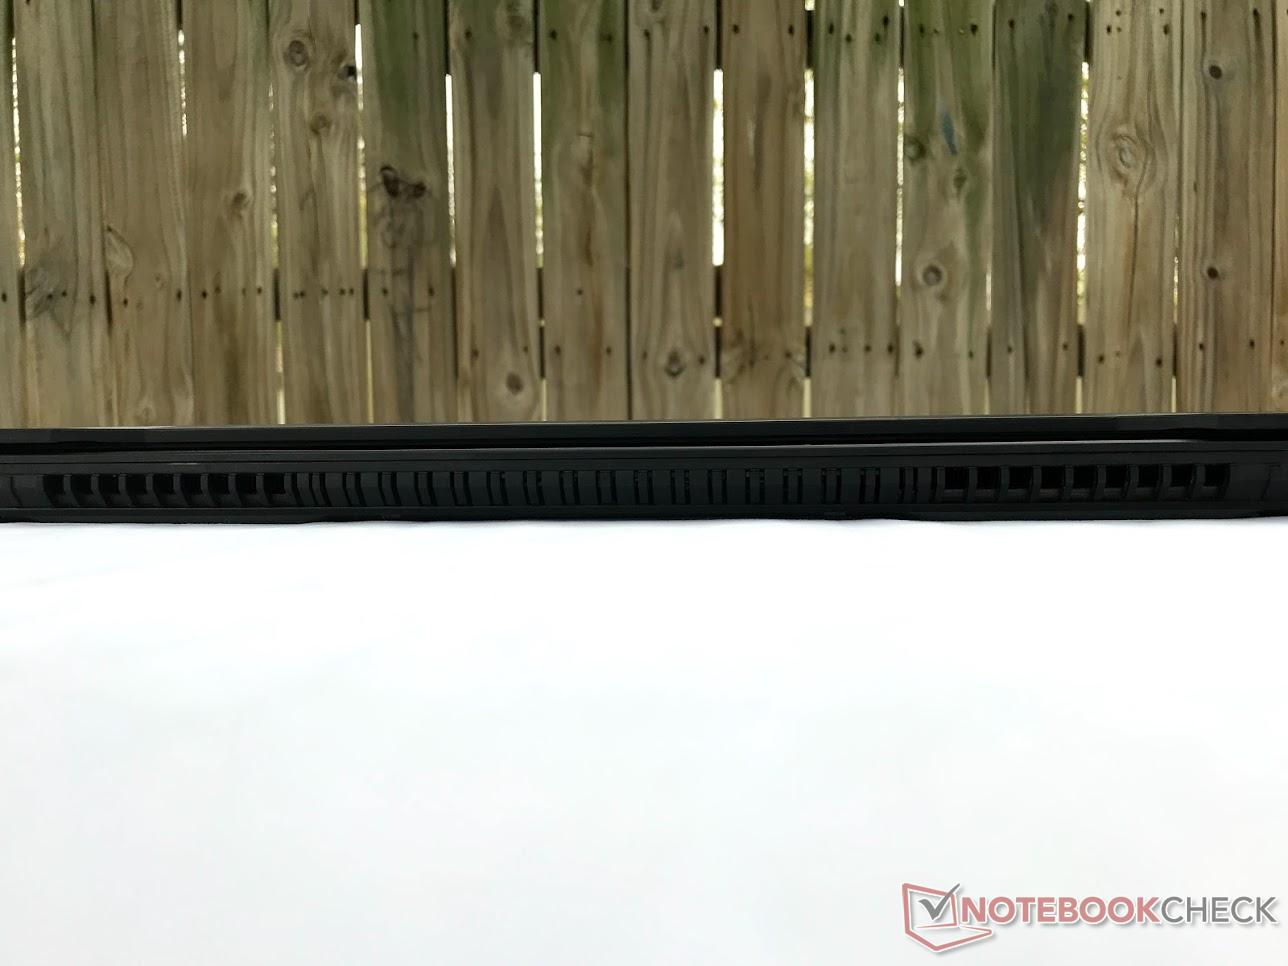
Alles bij elkaar combineert de FX503VM uitstekende gaming prestaties met een lage prijs tot een aantrekkelijk pakket. Het apparaat loopt wat betreft ontwerp subjectief mijlenver voor op soortgelijke gaming notebooks zonder daarbij veel rekenkracht op te offeren. De gemaakte compromissen moeten echter wel overwogen worden. Het beeldscherm verbuigt snel, 3 GB VRAM is voor bepaalde games een beperking en de kleurafwijkingen kunnen afleidend zijn. Ook het ventilatorgeluid is nogal hoog, zelfs voor een gaming notebook.
De meeste gaming notebooks in deze prijsklasse ogen goedkoop en plastic. De FX503VM is daarin uniek: het apparaat brengt een vleugje stijl naar het goedkopere gaming segment. Als je op zoek bent naar een dunne, lichte gaming notebook voor een lage prijs, is dit de machine die je zoekt.
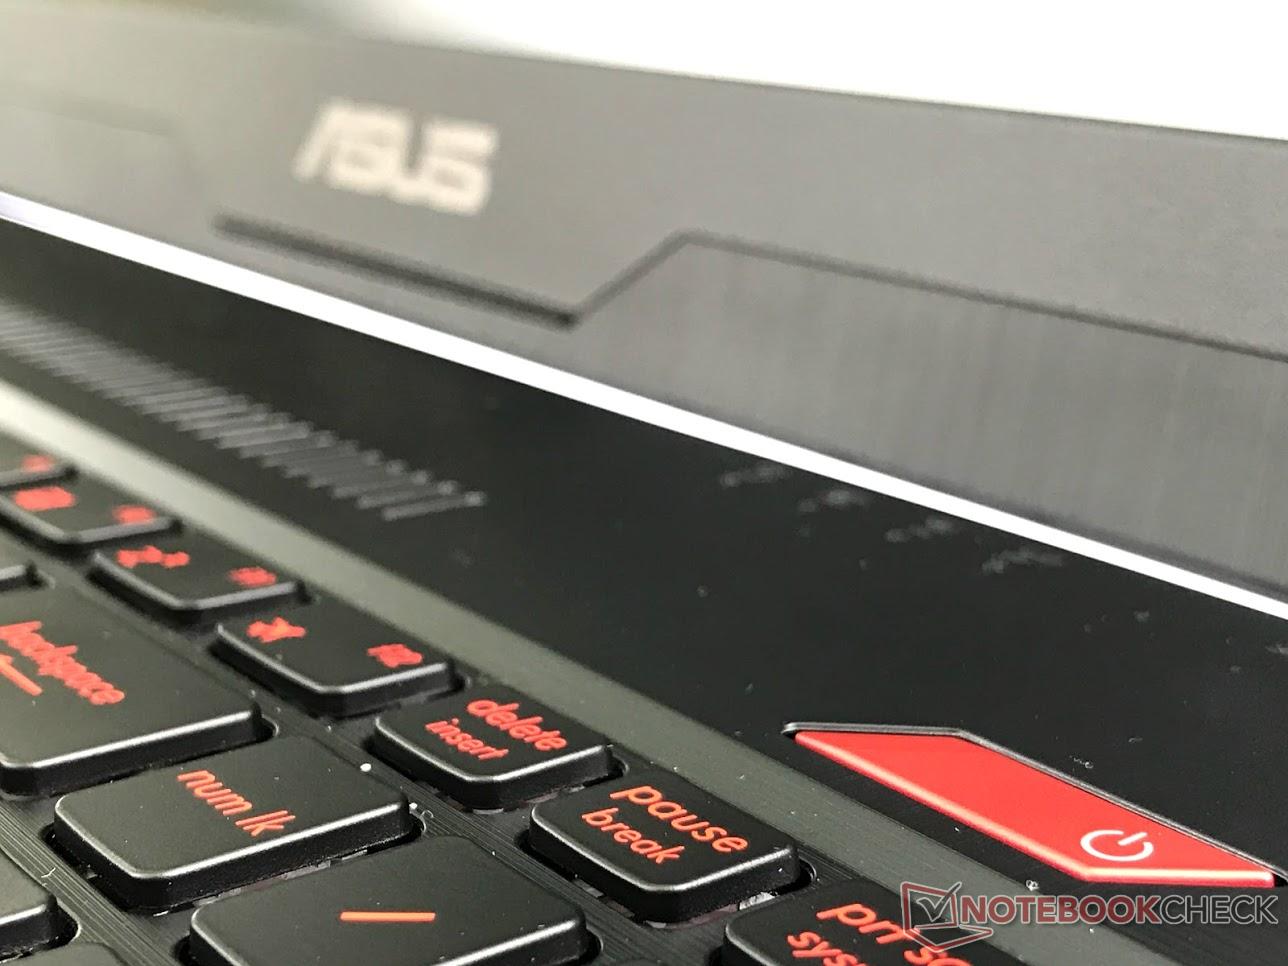
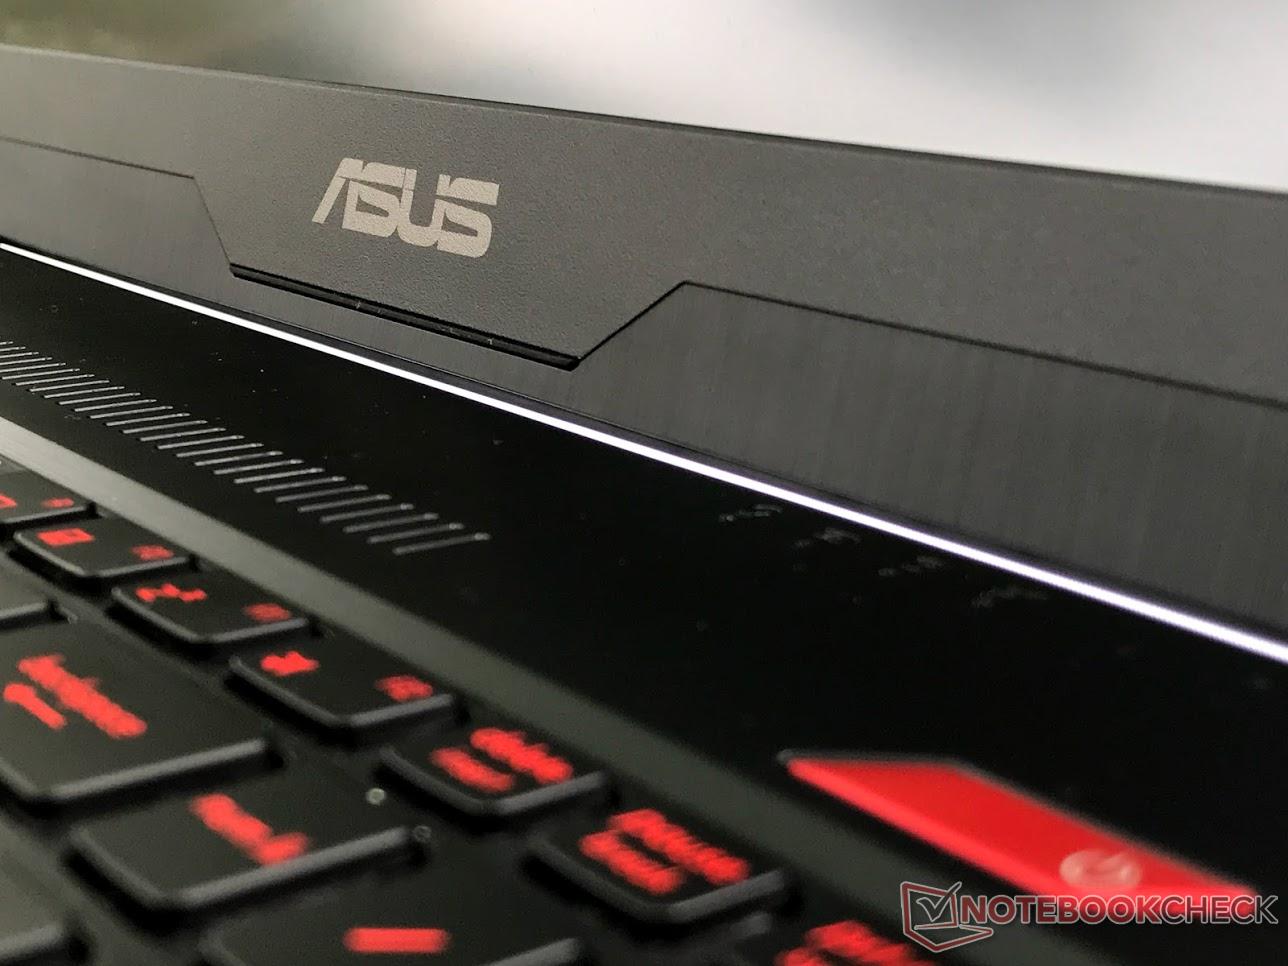
Asus FX503VM-EH73
- 24-03-2018 v6 (old)
Sam Medley
Price comparison
