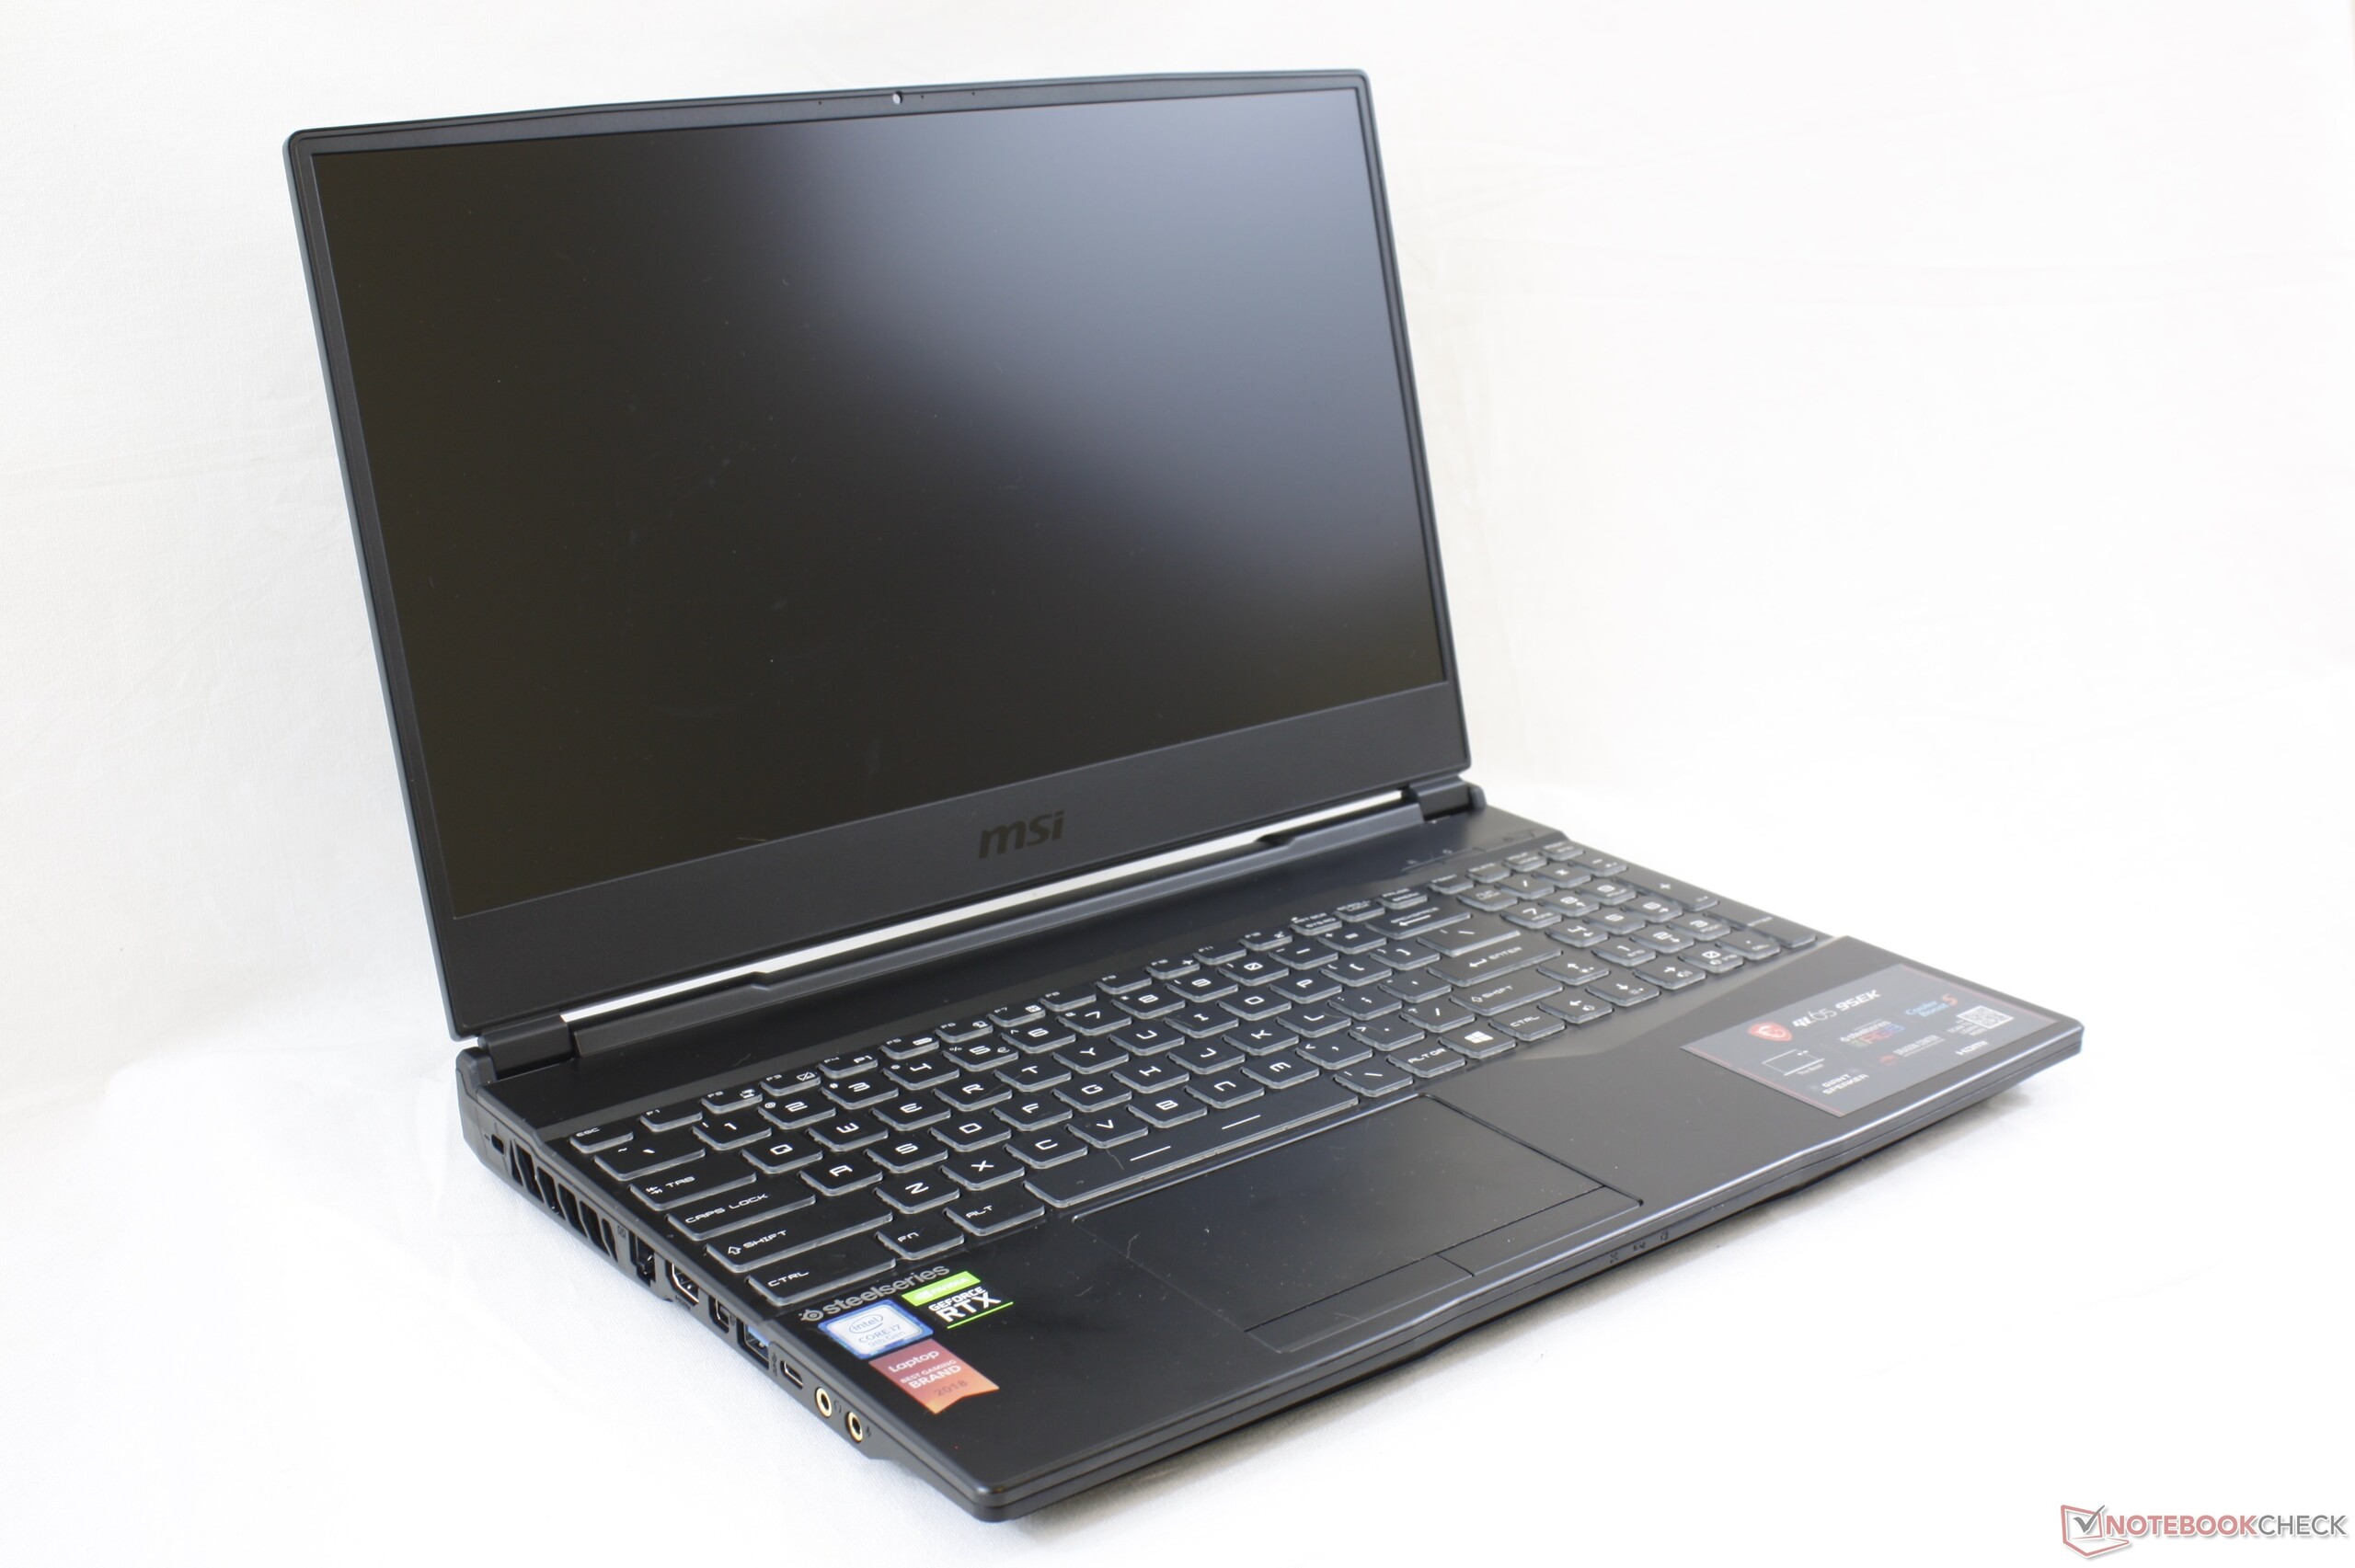
Kort testrapport MSI GL65 9SEK Laptop: veel draagbaarder dan de GL63
| SD Card Reader | |
| average JPG Copy Test (av. of 3 runs) | |
| Gigabyte Aero 15 Classic-XA (Toshiba Exceria Pro SDXC 64 GB UHS-II) | |
| Dell XPS 15 7590 9980HK GTX 1650 (Toshiba Exceria Pro SDXC 64 GB UHS-II) | |
| MSI GL65 9SEK (Toshiba Exceria Pro SDXC 64 GB UHS-II) | |
| MSI GL63 8RC-069US (Toshiba Exceria Pro SDXC 64 GB UHS-II) | |
| maximum AS SSD Seq Read Test (1GB) | |
| Gigabyte Aero 15 Classic-XA (Toshiba Exceria Pro SDXC 64 GB UHS-II) | |
| Dell XPS 15 7590 9980HK GTX 1650 (Toshiba Exceria Pro SDXC 64 GB UHS-II) | |
| MSI GL65 9SEK (Toshiba Exceria Pro SDXC 64 GB UHS-II) | |
| MSI GL63 8RC-069US (Toshiba Exceria Pro SDXC 64 GB UHS-II) | |
| Networking | |
| iperf3 transmit AX12 | |
| Gigabyte Aero 15 Classic-XA | |
| MSI GS65 Stealth 9SG | |
| MSI GL65 9SEK | |
| MSI GL63 8RC-069US | |
| iperf3 receive AX12 | |
| Gigabyte Aero 15 Classic-XA | |
| MSI GS65 Stealth 9SG | |
| MSI GL65 9SEK | |
| MSI GL63 8RC-069US | |
| |||||||||||||||||||||||||
Helderheidsverdeling: 86 %
Helderheid in Batterij-modus: 277.3 cd/m²
Contrast: 1387:1 (Zwart: 0.2 cd/m²)
ΔE ColorChecker Calman: 5.25 | ∀{0.5-29.43 Ø4.73}
calibrated: 4.39
ΔE Greyscale Calman: 3.5 | ∀{0.09-98 Ø4.97}
55% sRGB (Argyll 1.6.3 3D)
35% AdobeRGB 1998 (Argyll 1.6.3 3D)
37.85% AdobeRGB 1998 (Argyll 3D)
55% sRGB (Argyll 3D)
36.63% Display P3 (Argyll 3D)
Gamma: 2.1
CCT: 6895 K
| MSI GL65 9SEK AU Optronics B156HAN13.0, IPS, 15.6", 1920x1080 | MSI GL63 8RC-069US LG Philips LP156WF6-SPK6, IPS, 15.6", 1920x1080 | MSI GS65 Stealth 9SG Sharp LQ156M1JW03 (SHP14C5), IPS, 15.6", 1920x1080 | Gigabyte Aero 15 Classic-XA Sharp LQ156M1JW03 (SHP14C5), IGZO, 15.6", 1920x1080 | Asus Zephyrus S GX531GX AU Optronics B156HAN08.2, IPS, 15.6", 1920x1080 | Alienware m15 R2 P87F Sharp LQ156M1, IPS, 15.6", 1920x1080 | |
|---|---|---|---|---|---|---|
| Display | 8% | 81% | 76% | 75% | 75% | |
| Display P3 Coverage (%) | 36.63 | 39.4 8% | 67.6 85% | 65.3 78% | 65.6 79% | 65.3 78% |
| sRGB Coverage (%) | 55 | 59.2 8% | 97.5 77% | 95.5 74% | 92.2 68% | 95.1 73% |
| AdobeRGB 1998 Coverage (%) | 37.85 | 40.72 8% | 68.9 82% | 66.5 76% | 66.9 77% | 65.9 74% |
| Response Times | -4% | 54% | 53% | 71% | 55% | |
| Response Time Grey 50% / Grey 80% * (ms) | 26.4 ? | 33.6 ? -27% | 13.6 ? 48% | 15.2 ? 42% | 7 ? 73% | 16.4 ? 38% |
| Response Time Black / White * (ms) | 30 ? | 24 ? 20% | 12 ? 60% | 11.2 ? 63% | 9.6 ? 68% | 8.8 ? 71% |
| PWM Frequency (Hz) | 23260 ? | 23580 ? | 23810 ? | |||
| Screen | -10% | 34% | 23% | 26% | 3% | |
| Brightness middle (cd/m²) | 277.3 | 286.5 3% | 282.3 2% | 266 -4% | 323.6 17% | 324.2 17% |
| Brightness (cd/m²) | 256 | 258 1% | 269 5% | 248 -3% | 315 23% | 304 19% |
| Brightness Distribution (%) | 86 | 82 -5% | 90 5% | 89 3% | 91 6% | 90 5% |
| Black Level * (cd/m²) | 0.2 | 0.34 -70% | 0.32 -60% | 0.31 -55% | 0.29 -45% | 0.38 -90% |
| Contrast (:1) | 1387 | 843 -39% | 882 -36% | 858 -38% | 1116 -20% | 853 -39% |
| Colorchecker dE 2000 * | 5.25 | 5.57 -6% | 1.17 78% | 2.78 47% | 3.31 37% | 5.01 5% |
| Colorchecker dE 2000 max. * | 19.43 | 16.8 14% | 3.29 83% | 5.96 69% | 5.74 70% | 12.7 35% |
| Colorchecker dE 2000 calibrated * | 4.39 | 4.16 5% | 1.06 76% | 0.91 79% | 2.73 38% | 1.64 63% |
| Greyscale dE 2000 * | 3.5 | 4.6 -31% | 1.3 63% | 3.58 -2% | 2.9 17% | 7.9 -126% |
| Gamma | 2.1 105% | 2.15 102% | 2.2 100% | 2.46 89% | 2.29 96% | 2.35 94% |
| CCT | 6895 94% | 7564 86% | 6643 98% | 7186 90% | 6765 96% | 8455 77% |
| Color Space (Percent of AdobeRGB 1998) (%) | 35 | 37.4 7% | 63.8 82% | 62 77% | 59.7 71% | 60.8 74% |
| Color Space (Percent of sRGB) (%) | 55 | 58.9 7% | 97.5 77% | 96 75% | 91.8 67% | 95.5 74% |
| Totaal Gemiddelde (Programma / Instellingen) | -2% /
-6% | 56% /
45% | 51% /
36% | 57% /
40% | 44% /
23% |
* ... kleiner is beter
Responstijd Scherm
| ↔ Responstijd Zwart naar Wit | ||
|---|---|---|
| 30 ms ... stijging ↗ en daling ↘ gecombineerd | ↗ 17.6 ms stijging | 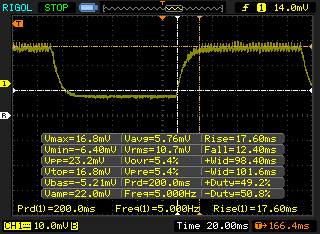 |
| ↘ 12.4 ms daling | ||
| Het scherm vertoonde trage responstijden in onze tests en is misschien te traag voor games. Ter vergelijking: alle testtoestellen variëren van 0.1 (minimum) tot 240 (maximum) ms. » 80 % van alle toestellen zijn beter. Dit betekent dat de gemeten responstijd slechter is dan het gemiddelde (19.9 ms) van alle geteste toestellen. | ||
| ↔ Responstijd 50% Grijs naar 80% Grijs | ||
| 26.4 ms ... stijging ↗ en daling ↘ gecombineerd | ↗ 13.2 ms stijging | 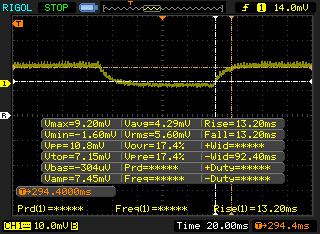 |
| ↘ 13.2 ms daling | ||
| Het scherm vertoonde relatief trage responstijden in onze tests en is misschien te traag voor games. Ter vergelijking: alle testtoestellen variëren van 0.165 (minimum) tot 636 (maximum) ms. » 36 % van alle toestellen zijn beter. Dit betekent dat de gemeten responstijd beter is dan het gemiddelde (31.1 ms) van alle geteste toestellen. | ||
Screen Flickering / PWM (Pulse-Width Modulation)
| Screen flickering / PWM niet waargenomen | 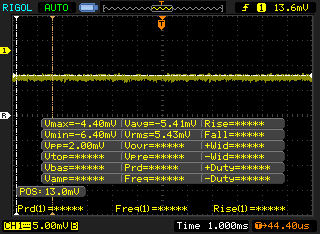 | ||
Ter vergelijking: 52 % van alle geteste toestellen maakten geen gebruik van PWM om de schermhelderheid te verlagen. Als het wel werd gebruikt, werd een gemiddelde van 7798 (minimum: 5 - maximum: 343500) Hz waargenomen. | |||
| PCMark 8 Home Score Accelerated v2 | 4136 punten | |
| PCMark 8 Work Score Accelerated v2 | 5287 punten | |
| PCMark 10 Score | 5761 punten | |
Help | ||
| MSI GL65 9SEK WDC PC SN520 SDAPNUW-512G | MSI GL63 8RC-069US Toshiba HG6 THNSNJ256G8NY | MSI GS65 Stealth 9SG Samsung SSD PM981 MZVLB512HAJQ | Gigabyte Aero 15 Classic-XA Intel SSD 760p SSDPEKKW512G8 | Asus Zephyrus S GX531GX Intel SSD 660p SSDPEKNW512G8 | Alienware m15 R2 P87F 2x Toshiba XG6 KXG60ZNV512G (RAID 0) | |
|---|---|---|---|---|---|---|
| AS SSD | -60% | 59% | 27% | -7% | 33% | |
| Seq Read (MB/s) | 1315 | 512 -61% | 2005 52% | 2517 91% | 1239 -6% | 1925 46% |
| Seq Write (MB/s) | 1378 | 456.4 -67% | 1580 15% | 924 -33% | 920 -33% | 2371 72% |
| 4K Read (MB/s) | 25.31 | 16.18 -36% | 49.33 95% | 59.1 134% | 45.74 81% | 37.2 47% |
| 4K Write (MB/s) | 118.2 | 57.1 -52% | 103.8 -12% | 126.5 7% | 95.7 -19% | 108.9 -8% |
| 4K-64 Read (MB/s) | 839 | 342.3 -59% | 1241 48% | 876 4% | 322 -62% | 1177 40% |
| 4K-64 Write (MB/s) | 720 | 127.3 -82% | 1730 140% | 922 28% | 722 0% | 1135 58% |
| Access Time Read * (ms) | 0.116 | 0.197 -70% | 0.054 53% | 0.042 64% | 0.073 37% | 0.065 44% |
| Access Time Write * (ms) | 0.091 | 0.061 33% | 0.036 60% | 0.065 29% | 0.047 48% | 0.108 -19% |
| Score Read (Points) | 996 | 410 -59% | 1490 50% | 1186 19% | 492 -51% | 1407 41% |
| Score Write (Points) | 976 | 230 -76% | 1991 104% | 1141 17% | 910 -7% | 1481 52% |
| Score Total (Points) | 2485 | 850 -66% | 4230 70% | 2870 15% | 1654 -33% | 3633 46% |
| Copy ISO MB/s (MB/s) | 1279 | 325.6 -75% | 3025 137% | 2086 63% | 1236 -3% | 2073 62% |
| Copy Program MB/s (MB/s) | 889 | 84.8 -90% | 713 -20% | 454.2 -49% | 703 -21% | 576 -35% |
| Copy Game MB/s (MB/s) | 1218 | 202.6 -83% | 1554 28% | 1141 -6% | 812 -33% | 1426 17% |
* ... kleiner is beter

| 3DMark 11 | |
| 1280x720 Performance GPU | |
| Acer Predator Helios 700 PH717-71-785M | |
| HP Omen X 17-ap0xx | |
| Eurocom Nightsky RX15 | |
| MSI RTX 2060 Gaming Z 6G | |
| MSI GS65 Stealth 9SG | |
| Alienware 17 R5 | |
| Gemiddeld NVIDIA GeForce RTX 2060 Mobile (19143 - 24662, n=40) | |
| MSI GL65 9SEK | |
| Eurocom Nightsky Ti15 | |
| Asus Strix GL703VM-DB74 | |
| Acer Aspire 7 A715-74G-50U5 | |
| Asus TUF FX705GE-EW096T | |
| 1280x720 Performance Combined | |
| Eurocom Nightsky RX15 | |
| MSI RTX 2060 Gaming Z 6G | |
| Acer Predator Helios 700 PH717-71-785M | |
| MSI GS65 Stealth 9SG | |
| MSI GL65 9SEK | |
| Eurocom Nightsky Ti15 | |
| Gemiddeld NVIDIA GeForce RTX 2060 Mobile (1107 - 14726, n=40) | |
| Alienware 17 R5 | |
| HP Omen X 17-ap0xx | |
| Acer Aspire 7 A715-74G-50U5 | |
| Asus TUF FX705GE-EW096T | |
| Asus Strix GL703VM-DB74 | |
| 3DMark 11 Performance | 18334 punten | |
| 3DMark Cloud Gate Standard Score | 34921 punten | |
| 3DMark Fire Strike Score | 14827 punten | |
| 3DMark Time Spy Score | 6197 punten | |
Help | ||
| Shadow of the Tomb Raider - 1920x1080 Highest Preset AA:T | |
| MSI GE75 9SG | |
| Eurocom Nightsky RX15 | |
| MSI RTX 2060 Gaming Z 6G | |
| MSI GS65 Stealth 9SG | |
| MSI GL65 9SEK | |
| Eurocom Nightsky Ti15 | |
| Asus ROG Zephyrus G15 GA502DU | |
| Dell XPS 15 7590 9980HK GTX 1650 | |
| Asus TUF FX705GE-EW096T | |
| The Witcher 3 - 1920x1080 Ultra Graphics & Postprocessing (HBAO+) | |
| Acer Predator Helios 700 PH717-71-785M | |
| MSI GE75 9SG | |
| Eurocom Nightsky RX15 | |
| Asus Zephyrus S GX531GX | |
| Schenker XMG Ultra 15 Turing | |
| MSI RTX 2060 Gaming Z 6G | |
| MSI GE75 8SF | |
| MSI GS65 Stealth 9SG | |
| HP Omen X 17-ap0xx | |
| Gigabyte Aero 15 Classic-XA | |
| Alienware 17 R5 | |
| Eurocom Nightsky Ti15 | |
| MSI GL65 9SEK | |
| Lenovo Legion Y540-17IRH | |
| Asus ROG Zephyrus G15 GA502DU | |
| Asus Strix GL703VM-DB74 | |
| Acer Aspire 7 A715-74G-50U5 | |
| Asus FX503VM-EH73 | |
| Dell XPS 15 7590 9980HK GTX 1650 | |
| Asus TUF FX705GE-EW096T | |
| MSI GL63 8RC-069US | |
| lage | gem. | hoge | ultra | |
|---|---|---|---|---|
| BioShock Infinite (2013) | 345.1 | 285.1 | 277.4 | 150.3 |
| The Witcher 3 (2015) | 286 | 204 | 117.5 | 58.7 |
| Rocket League (2017) | 244 | 249.3 | 246.9 | |
| Shadow of the Tomb Raider (2018) | 130 | 96 | 88 | 76 |
| MSI GL65 9SEK GeForce RTX 2060 Mobile, i7-9750H, WDC PC SN520 SDAPNUW-512G | MSI GL63 8RC-069US GeForce GTX 1050 Mobile, i5-8300H, Toshiba HG6 THNSNJ256G8NY | MSI GS65 Stealth 9SG GeForce RTX 2080 Max-Q, i7-9750H, Samsung SSD PM981 MZVLB512HAJQ | Gigabyte Aero 15 Classic-XA GeForce RTX 2070 Max-Q, i7-9750H, Intel SSD 760p SSDPEKKW512G8 | Asus Zephyrus S GX531GX GeForce RTX 2080 Max-Q, i7-8750H, Intel SSD 660p SSDPEKNW512G8 | Alienware m15 R2 P87F GeForce RTX 2080 Max-Q, i7-9750H, 2x Toshiba XG6 KXG60ZNV512G (RAID 0) | |
|---|---|---|---|---|---|---|
| Noise | 8% | 8% | -3% | 0% | -3% | |
| uit / omgeving * (dB) | 28.1 | 28.6 -2% | 28.3 -1% | 30 -7% | 28.7 -2% | 28.3 -1% |
| Idle Minimum * (dB) | 31.4 | 28.6 9% | 30.4 3% | 31 1% | 29.8 5% | 28.5 9% |
| Idle Average * (dB) | 31.5 | 31.6 -0% | 30.5 3% | 34 -8% | 32.4 -3% | 28.5 10% |
| Idle Maximum * (dB) | 33.5 | 31.6 6% | 30.6 9% | 39 -16% | 38 -13% | 49 -46% |
| Load Average * (dB) | 49.3 | 38.6 22% | 37.6 24% | 46 7% | 38.2 23% | 49 1% |
| Witcher 3 ultra * (dB) | 51.3 | 40.6 21% | 46 10% | 53 -3% | 56.6 -10% | 49 4% |
| Load Maximum * (dB) | 58 | 56.8 2% | 55.1 5% | 55 5% | 56.6 2% | 55 5% |
* ... kleiner is beter
Geluidsniveau
| Onbelast |
| 31.4 / 31.5 / 33.5 dB (A) |
| Belasting |
| 49.3 / 58 dB (A) |
 | ||
30 dB stil 40 dB(A) hoorbaar 50 dB(A) luid |
||
min: | ||
(-) De maximumtemperatuur aan de bovenzijde bedraagt 49 °C / 120 F, vergeleken met het gemiddelde van 40.4 °C / 105 F, variërend van 21.2 tot 68.8 °C voor de klasse Gaming.
(-) De bodem warmt op tot een maximum van 54.2 °C / 130 F, vergeleken met een gemiddelde van 43.2 °C / 110 F
(±) Bij onbelast gebruik bedraagt de gemiddelde temperatuur voor de bovenzijde 35.9 °C / 97 F, vergeleken met het apparaatgemiddelde van 33.9 °C / 93 F.
(-) Bij het spelen van The Witcher 3 is de gemiddelde temperatuur voor de bovenzijde 38.4 °C / 101 F, vergeleken met het apparaatgemiddelde van 33.9 °C / 93 F.
(±) De palmsteunen en het touchpad kunnen zeer heet aanvoelen met een maximum van ###max## °C / 96.8 F.
(-) De gemiddelde temperatuur van de handpalmsteun van soortgelijke toestellen bedroeg 28.8 °C / 83.8 F (-7.2 °C / -13 F).
MSI GL65 9SEK audioanalyse
(+) | luidsprekers kunnen relatief luid spelen (85.3 dB)
Bas 100 - 315 Hz
(-) | bijna geen lage tonen - gemiddeld 25.1% lager dan de mediaan
(±) | lineariteit van de lage tonen is gemiddeld (9.9% delta ten opzichte van de vorige frequentie)
Midden 400 - 2000 Hz
(±) | hogere middens - gemiddeld 5.8% hoger dan de mediaan
(±) | lineariteit van de middentonen is gemiddeld (9.8% delta ten opzichte van de vorige frequentie)
Hoog 2 - 16 kHz
(+) | evenwichtige hoogtepunten - slechts 4.1% verwijderd van de mediaan
(±) | lineariteit van de hoogtepunten is gemiddeld (11.7% delta ten opzichte van de vorige frequentie)
Algemeen 100 - 16.000 Hz
(±) | lineariteit van het totale geluid is gemiddeld (25.4% verschil met de mediaan)
Vergeleken met dezelfde klasse
» 91% van alle geteste apparaten in deze klasse waren beter, 2% vergelijkbaar, 7% slechter
» De beste had een delta van 6%, het gemiddelde was 18%, de slechtste was 132%
Vergeleken met alle geteste toestellen
» 78% van alle geteste apparaten waren beter, 5% gelijk, 17% slechter
» De beste had een delta van 4%, het gemiddelde was 24%, de slechtste was 134%
Apple MacBook 12 (Early 2016) 1.1 GHz audioanalyse
(+) | luidsprekers kunnen relatief luid spelen (83.6 dB)
Bas 100 - 315 Hz
(±) | verminderde zeebaars - gemiddeld 11.3% lager dan de mediaan
(±) | lineariteit van de lage tonen is gemiddeld (14.2% delta ten opzichte van de vorige frequentie)
Midden 400 - 2000 Hz
(+) | evenwichtige middens - slechts 2.4% verwijderd van de mediaan
(+) | de middentonen zijn lineair (5.5% delta ten opzichte van de vorige frequentie)
Hoog 2 - 16 kHz
(+) | evenwichtige hoogtepunten - slechts 2% verwijderd van de mediaan
(+) | de hoge tonen zijn lineair (4.5% delta naar de vorige frequentie)
Algemeen 100 - 16.000 Hz
(+) | het totale geluid is lineair (10.2% verschil met de mediaan)
Vergeleken met dezelfde klasse
» 7% van alle geteste apparaten in deze klasse waren beter, 2% vergelijkbaar, 91% slechter
» De beste had een delta van 5%, het gemiddelde was 18%, de slechtste was 53%
Vergeleken met alle geteste toestellen
» 5% van alle geteste apparaten waren beter, 1% gelijk, 94% slechter
» De beste had een delta van 4%, het gemiddelde was 24%, de slechtste was 134%
| Uit / Standby | |
| Inactief | |
| Belasting |
|
Key:
min: | |
| MSI GL65 9SEK i7-9750H, GeForce RTX 2060 Mobile, WDC PC SN520 SDAPNUW-512G, IPS, 1920x1080, 15.6" | MSI GL63 8RC-069US i5-8300H, GeForce GTX 1050 Mobile, Toshiba HG6 THNSNJ256G8NY, IPS, 1920x1080, 15.6" | MSI GS65 Stealth 9SG i7-9750H, GeForce RTX 2080 Max-Q, Samsung SSD PM981 MZVLB512HAJQ, IPS, 1920x1080, 15.6" | Gigabyte Aero 15 Classic-XA i7-9750H, GeForce RTX 2070 Max-Q, Intel SSD 760p SSDPEKKW512G8, IGZO, 1920x1080, 15.6" | MSI GP65 Leopard 9SE-225US i7-9750H, GeForce RTX 2060 Mobile, Toshiba KBG30ZMT512G, IPS, 1920x1080, 15.6" | MSI GS65 Stealth Thin 8RE-051US i7-8750H, GeForce GTX 1060 Mobile, Samsung SSD PM981 MZVLB256HAHQ, IPS, 1920x1080, 15.6" | |
|---|---|---|---|---|---|---|
| Power Consumption | 54% | 25% | 22% | 30% | 42% | |
| Idle Minimum * (Watt) | 41 | 7.1 83% | 18.3 55% | 21 49% | 13.6 67% | 8.7 79% |
| Idle Average * (Watt) | 45.3 | 9.8 78% | 22 51% | 23 49% | 17.9 60% | 13 71% |
| Idle Maximum * (Watt) | 47.1 | 10.4 78% | 28.8 39% | 32 32% | 20.6 56% | 14.3 70% |
| Load Average * (Watt) | 94.9 | 88.8 6% | 93 2% | 97 -2% | 96 -1% | 107.4 -13% |
| Witcher 3 ultra * (Watt) | 149.4 | 93.3 38% | 142.6 5% | 148 1% | 154.6 -3% | 129 14% |
| Load Maximum * (Watt) | 214.2 | 132.5 38% | 215.9 -1% | 213 1% | 218.6 -2% | 151.5 29% |
* ... kleiner is beter
| MSI GL65 9SEK i7-9750H, GeForce RTX 2060 Mobile, 51 Wh | MSI GL63 8RC-069US i5-8300H, GeForce GTX 1050 Mobile, 41 Wh | MSI GS65 Stealth 9SG i7-9750H, GeForce RTX 2080 Max-Q, 82 Wh | Gigabyte Aero 15 Classic-XA i7-9750H, GeForce RTX 2070 Max-Q, 94.24 Wh | Asus Zephyrus S GX531GX i7-8750H, GeForce RTX 2080 Max-Q, 50 Wh | Alienware m15 R2 P87F i7-9750H, GeForce RTX 2080 Max-Q, 76 Wh | |
|---|---|---|---|---|---|---|
| Batterijduur | 16% | 58% | 130% | -21% | 41% | |
| Reader / Idle (h) | 4.4 | 7.3 66% | 9.1 107% | 9.2 109% | ||
| WiFi v1.3 (h) | 3.8 | 4.3 13% | 6 58% | 7 84% | 3 -21% | 5.5 45% |
| Load (h) | 1 | 0.7 -30% | 3 200% | 0.7 -30% |
Pro
Contra

Voor het volledige, Engelse testrapport, klik hier.
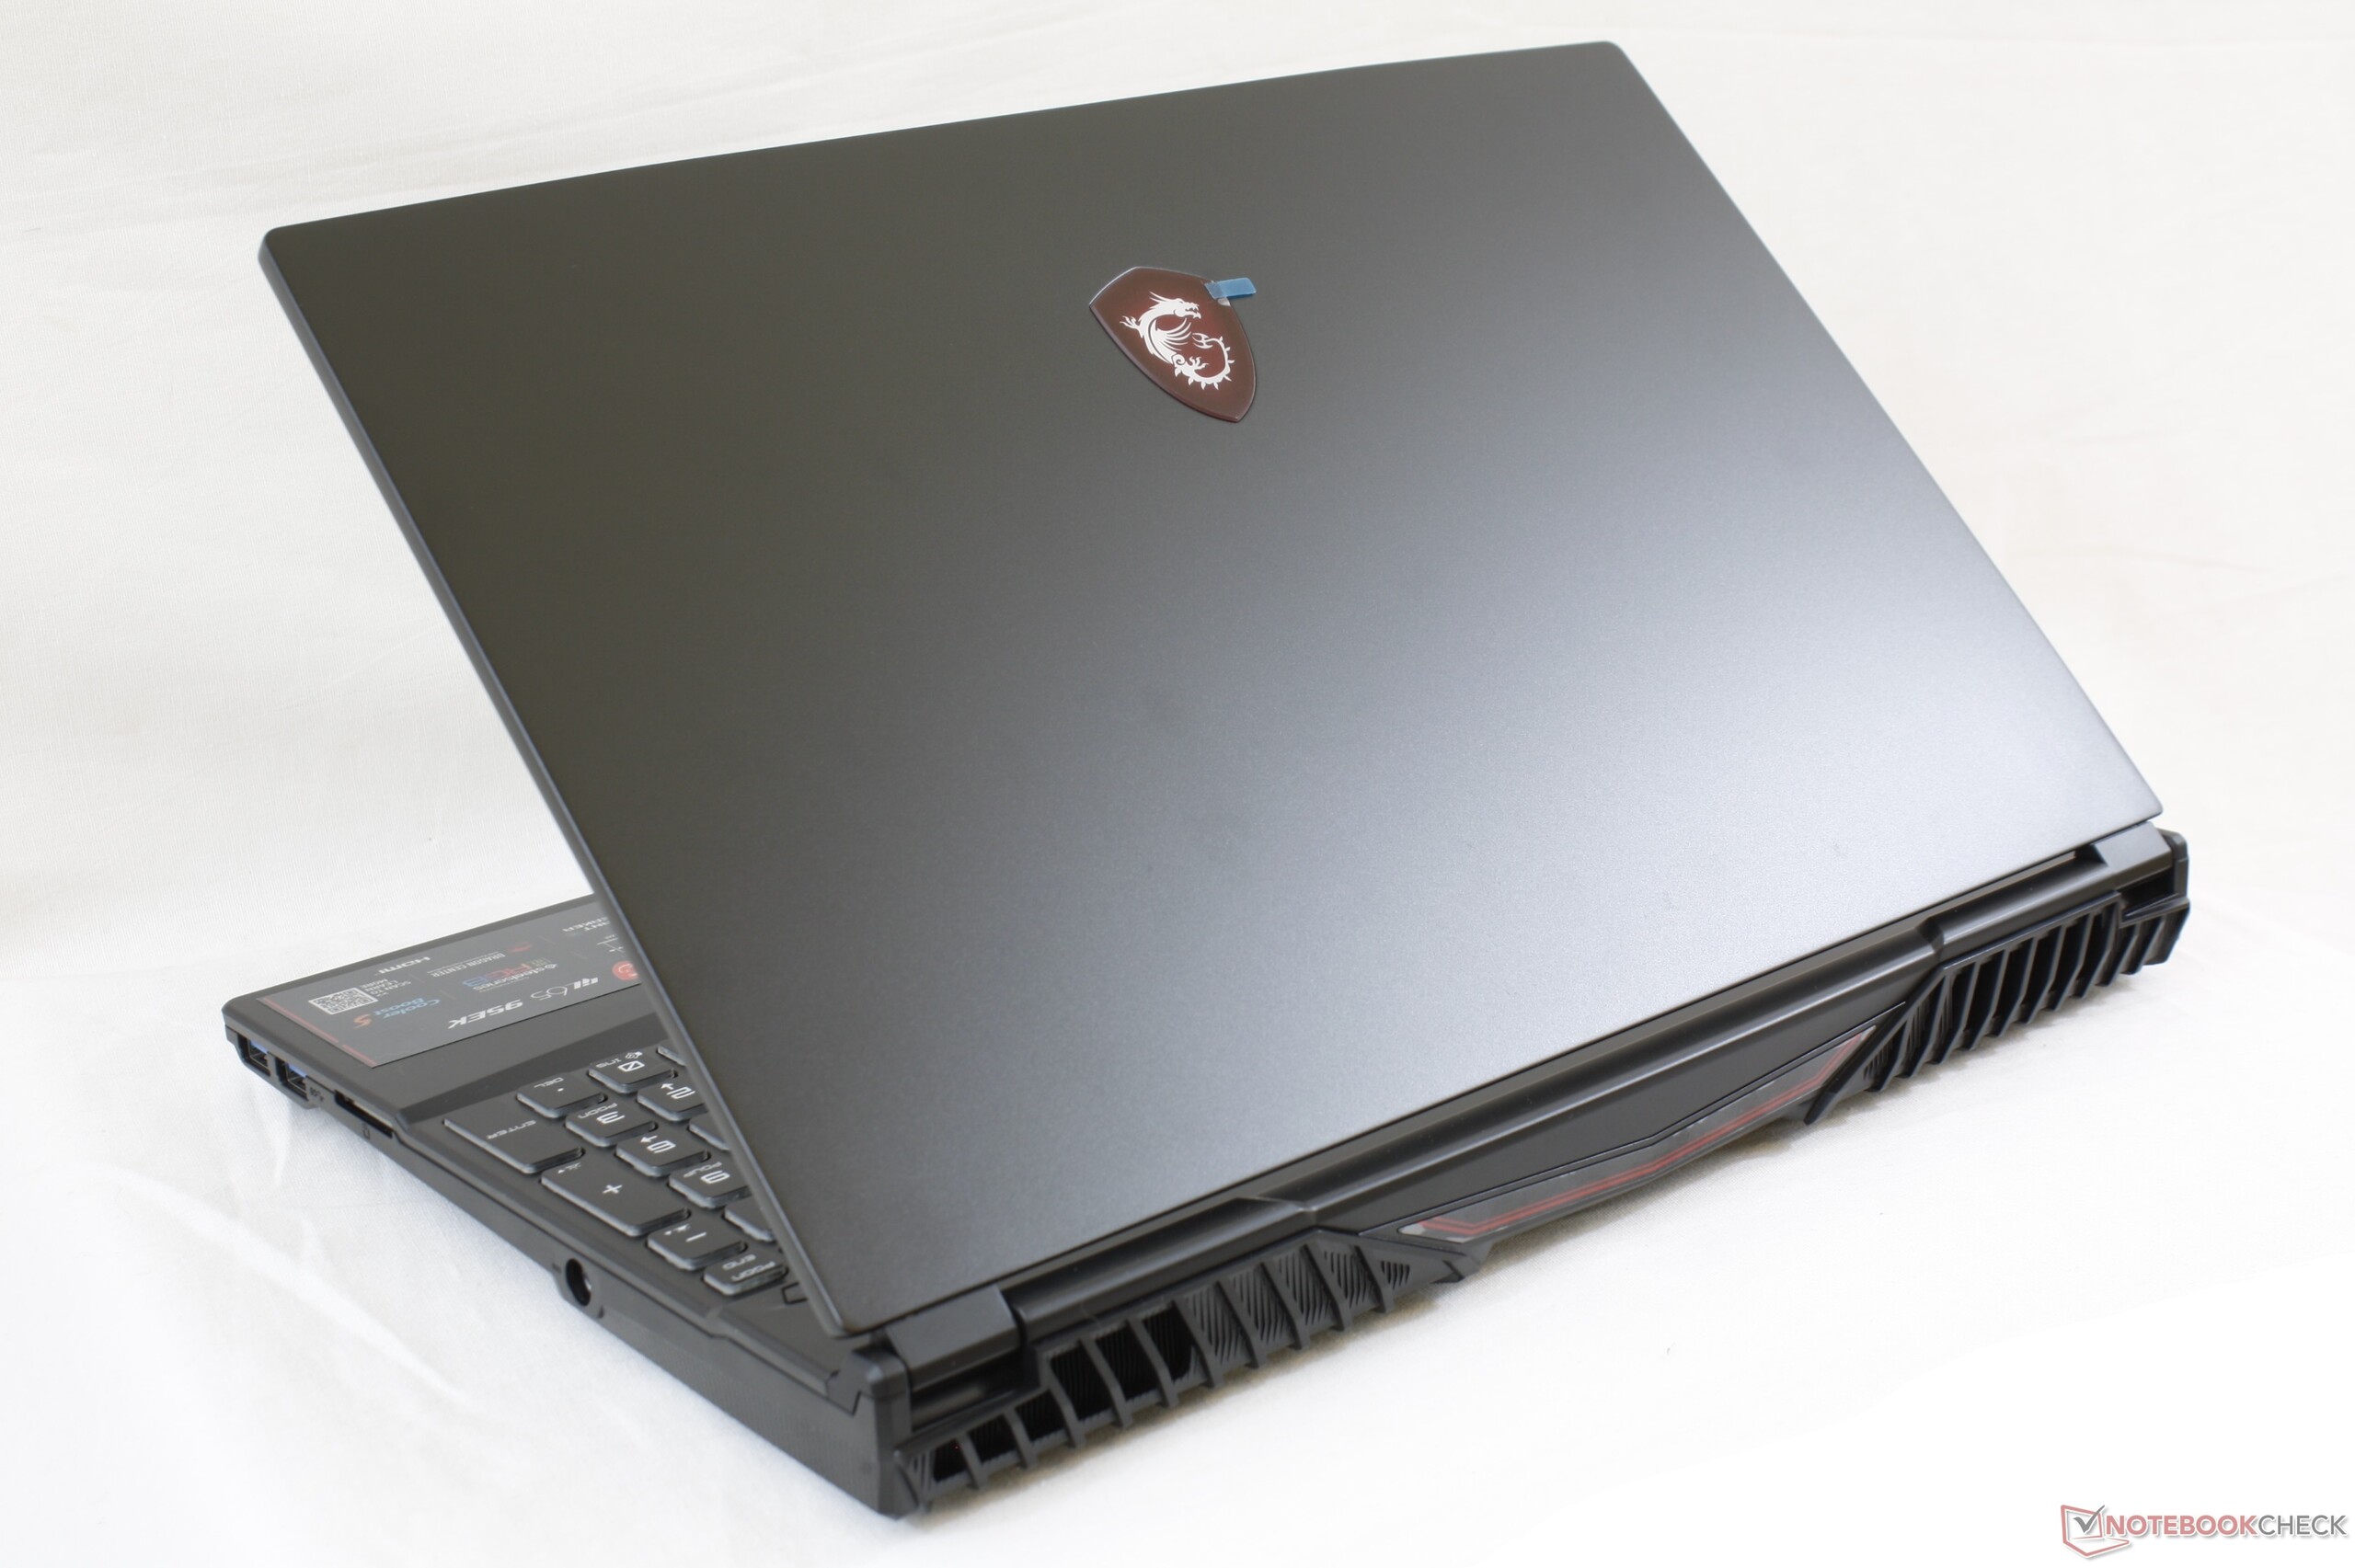
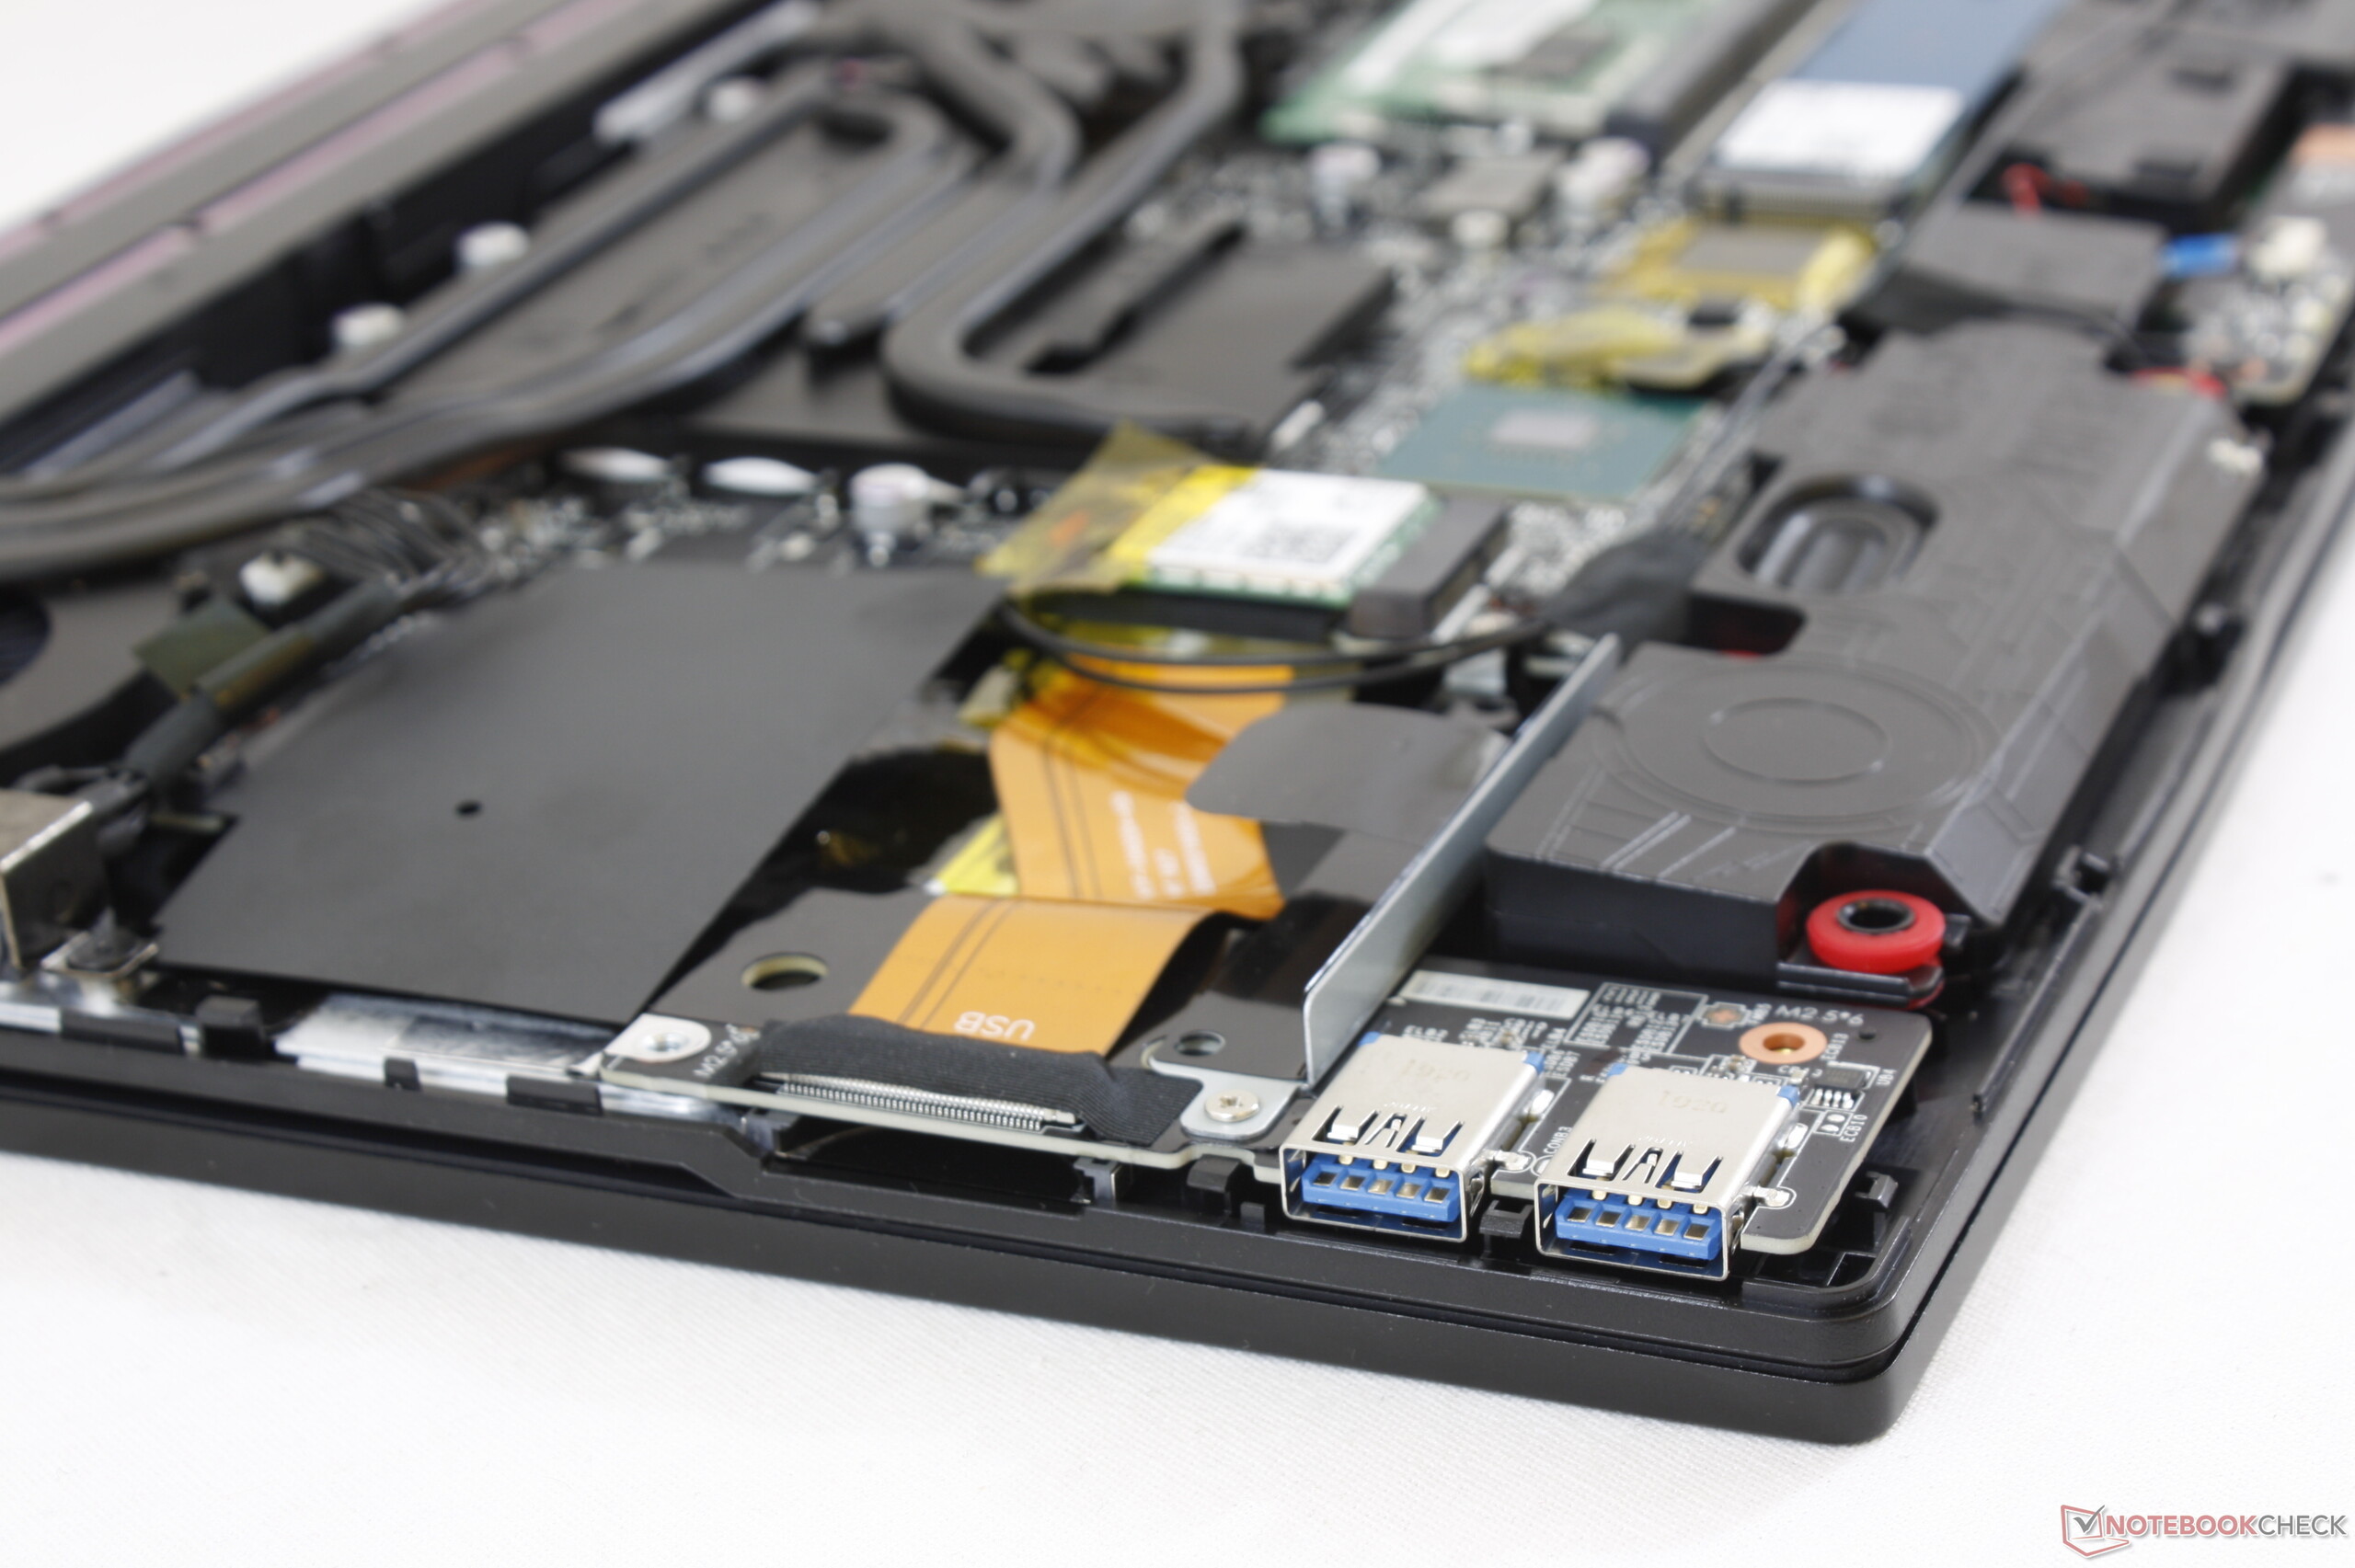
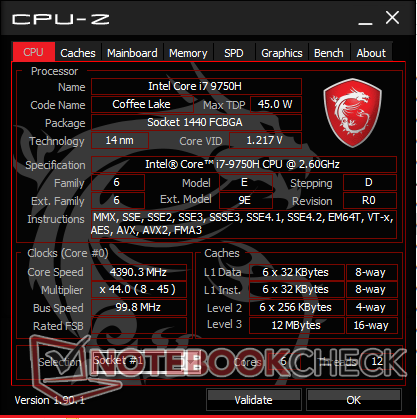
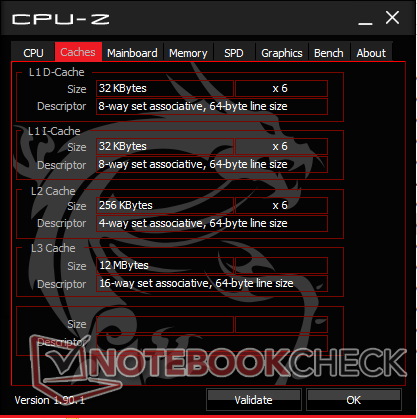
De grootste en meest opvallende verbetering die de GL65 biedt ten opzichte van de GL63 is de kleinere en meer draagbare behuizing. Het apparaat is ongeveer 16 procent kleiner dan zijn voorganger en biedt verbeterde processoropties voor een tastbare prestatieverbetering.
Al het andere over de GL65 blijft bijna hetzelfde als de GL63. MSI had de kans om het scherm of de slechte batterijlevensduur te verbeteren, stillere ventilatoren te integreren of een snellere SD-kaartlezer aan te bieden, maar ze zijn allemaal vrijwel onveranderd gebleven. Je zal moeten investeren in de betere GS65-serie als dergelijke functies belangrijk voor je zijn.
Middenklasse gaminglaptop met een geweldig uiterlijk en prestaties, maar met bezuinigingen op de batterijlevensduur en beeldscherm. Je zult lange looptijden en nauwkeurige kleuren moeten opofferen.
MSI GL65 9SEK
- 02-10-2019 v7 (old)
Allen Ngo
Price comparison
