Kort testrapport Dell Inspiron 7390 2-in-1 Black Edition Convertible
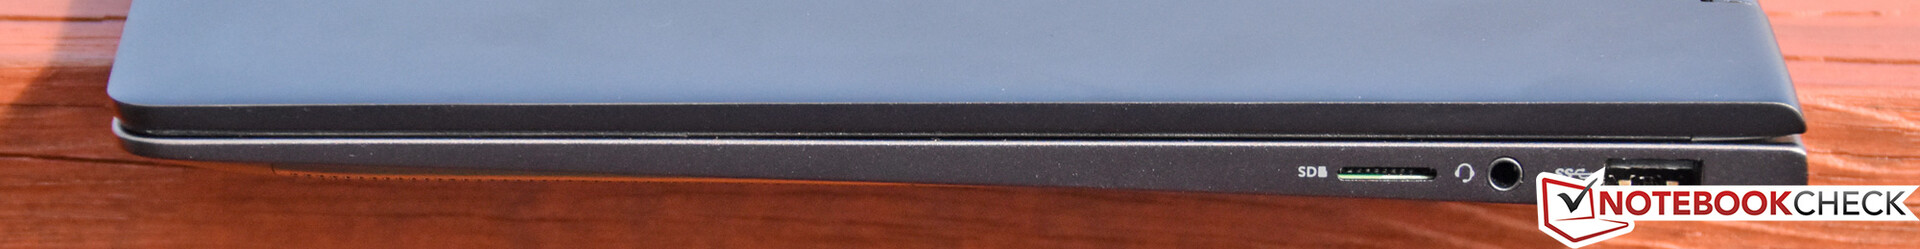
| SD Card Reader | |
| average JPG Copy Test (av. of 3 runs) | |
| Dell Latitude 7400 2-in-1 (Toshiba Exceria Pro M501 UHS-II) | |
| Lenovo ThinkPad X390 Yoga-20NQS05R00 (Toshiba Exceria Pro M501) | |
| HP Envy x360 13-ar0601ng (Toshiba Exceria Pro M501 microSDXC 64GB) | |
| Gemiddelde van klas Convertible (29.4 - 186, n=21, laatste 2 jaar) | |
| Dell Inspiron 7390 2-in-1 (Toshiba Exceria Pro M501 UHS-II) | |
| maximum AS SSD Seq Read Test (1GB) | |
| Dell Latitude 7400 2-in-1 (Toshiba Exceria Pro M501 UHS-II) | |
| Gemiddelde van klas Convertible (67.5 - 254, n=20, laatste 2 jaar) | |
| HP Envy x360 13-ar0601ng (Toshiba Exceria Pro M501 microSDXC 64GB) | |
| Lenovo ThinkPad X390 Yoga-20NQS05R00 (Toshiba Exceria Pro M501) | |
| Dell Inspiron 13 7386 (Toshiba Exceria Pro M501 microSDXC 64GB) | |
| Dell Inspiron 7390 2-in-1 (Toshiba Exceria Pro M501 UHS-II) | |
| |||||||||||||||||||||||||
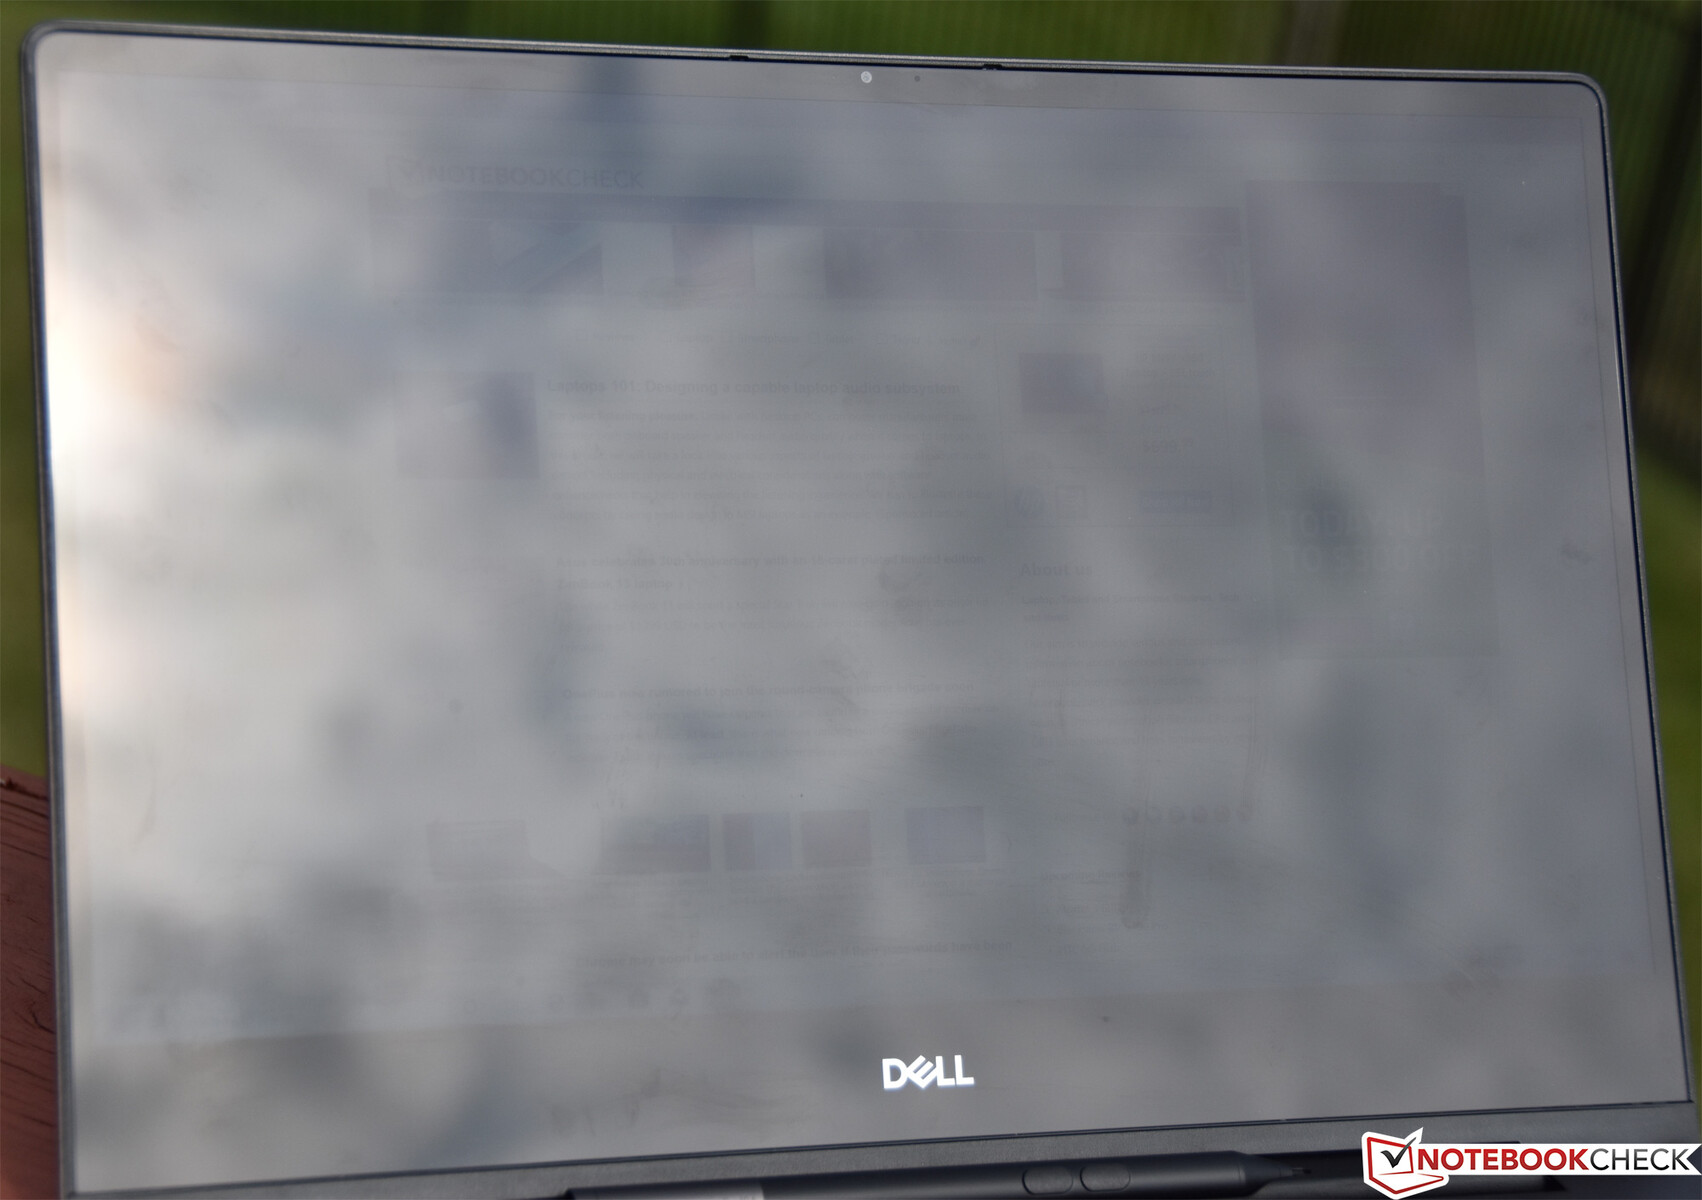
Helderheidsverdeling: 94 %
Helderheid in Batterij-modus: 329.8 cd/m²
Contrast: 1268:1 (Zwart: 0.26 cd/m²)
ΔE ColorChecker Calman: 3.05 | ∀{0.5-29.43 Ø4.71}
calibrated: 2.03
ΔE Greyscale Calman: 2.1 | ∀{0.09-98 Ø4.96}
94% sRGB (Argyll 1.6.3 3D)
61% AdobeRGB 1998 (Argyll 1.6.3 3D)
66.5% AdobeRGB 1998 (Argyll 3D)
94.2% sRGB (Argyll 3D)
65.6% Display P3 (Argyll 3D)
Gamma: 2.082
CCT: 6713 K
| Dell Inspiron 7390 2-in-1 AUO252B, IPS, 13.3", 3840x2160 | Lenovo ThinkPad X1 Yoga 2019-20QGS00A00 B140HAN05.8, IPS LED, 14", 1920x1080 | HP Envy x360 13-ar0601ng InfoVision, M133NVF3 R2, IPS, 120 Hz, 13.3", 1920x1080 | Lenovo ThinkPad X390 Yoga-20NQS05R00 LP133WF7-SPA1, IPS LED, 13.3", 1920x1080 | Dell Latitude 7400 2-in-1 SHP14A2, IPS, 14", 1920x1080 | Dell Inspiron 13 7386 Chi Mei CMN1385 / 133DCE / Dell 3GRT6, IPS, 13.3", 3840x2160 | |
|---|---|---|---|---|---|---|
| Display | 3% | -4% | 1% | 5% | 5% | |
| Display P3 Coverage (%) | 65.6 | 67.1 2% | 63 -4% | 65.2 -1% | 68.6 5% | 68.2 4% |
| sRGB Coverage (%) | 94.2 | 98.2 4% | 90.8 -4% | 97 3% | 99.6 6% | 99.8 6% |
| AdobeRGB 1998 Coverage (%) | 66.5 | 68.9 4% | 63.8 -4% | 67.3 1% | 70 5% | 70 5% |
| Response Times | -2% | 40% | 7% | 0% | 10% | |
| Response Time Grey 50% / Grey 80% * (ms) | 56.4 ? | 61.6 ? -9% | 35 ? 38% | 59.2 ? -5% | 56 ? 1% | 57 ? -1% |
| Response Time Black / White * (ms) | 37.6 ? | 35.2 ? 6% | 22 ? 41% | 30.8 ? 18% | 38 ? -1% | 30 ? 20% |
| PWM Frequency (Hz) | 4065 ? | 1667 ? | 26000 ? | |||
| Screen | -14% | -5% | -32% | -0% | -11% | |
| Brightness middle (cd/m²) | 329.8 | 372 13% | 633 92% | 319 -3% | 277.2 -16% | 318 -4% |
| Brightness (cd/m²) | 325 | 368 13% | 675 108% | 306 -6% | 263 -19% | 278 -14% |
| Brightness Distribution (%) | 94 | 88 -6% | 75 -20% | 90 -4% | 83 -12% | 81 -14% |
| Black Level * (cd/m²) | 0.26 | 0.22 15% | 0.55 -112% | 0.15 42% | 0.2 23% | 0.18 31% |
| Contrast (:1) | 1268 | 1691 33% | 1151 -9% | 2127 68% | 1386 9% | 1767 39% |
| Colorchecker dE 2000 * | 3.05 | 4.6 -51% | 3.12 -2% | 6.1 -100% | 2.1 31% | 2.91 5% |
| Colorchecker dE 2000 max. * | 5.01 | 7.8 -56% | 6.37 -27% | 9.7 -94% | 5.91 -18% | 6.11 -22% |
| Colorchecker dE 2000 calibrated * | 2.03 | 0.9 56% | 1.83 10% | 1 51% | 1.03 49% | 2.91 -43% |
| Greyscale dE 2000 * | 2.1 | 5.9 -181% | 3.89 -85% | 8.6 -310% | 3.4 -62% | 4.37 -108% |
| Gamma | 2.082 106% | 2.58 85% | 2.39 92% | 2.62 84% | 2.241 98% | 2.26 97% |
| CCT | 6713 97% | 6516 100% | 6476 100% | 6613 98% | 6030 108% | 6448 101% |
| Color Space (Percent of AdobeRGB 1998) (%) | 61 | 62.7 3% | 59 -3% | 61.9 1% | 64 5% | 70 15% |
| Color Space (Percent of sRGB) (%) | 94 | 97.8 4% | 91 -3% | 96.8 3% | 100 6% | 93 -1% |
| Totaal Gemiddelde (Programma / Instellingen) | -4% /
-9% | 10% /
1% | -8% /
-21% | 2% /
1% | 1% /
-5% |
* ... kleiner is beter
Responstijd Scherm
| ↔ Responstijd Zwart naar Wit | ||
|---|---|---|
| 37.6 ms ... stijging ↗ en daling ↘ gecombineerd | ↗ 20.4 ms stijging | 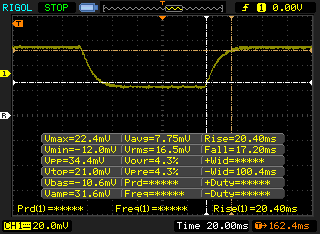 |
| ↘ 17.2 ms daling | ||
| Het scherm vertoonde trage responstijden in onze tests en is misschien te traag voor games. Ter vergelijking: alle testtoestellen variëren van 0.1 (minimum) tot 240 (maximum) ms. » 95 % van alle toestellen zijn beter. Dit betekent dat de gemeten responstijd slechter is dan het gemiddelde (19.8 ms) van alle geteste toestellen. | ||
| ↔ Responstijd 50% Grijs naar 80% Grijs | ||
| 56.4 ms ... stijging ↗ en daling ↘ gecombineerd | ↗ 27.6 ms stijging | 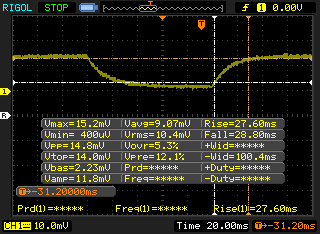 |
| ↘ 28.8 ms daling | ||
| Het scherm vertoonde trage responstijden in onze tests en is misschien te traag voor games. Ter vergelijking: alle testtoestellen variëren van 0.165 (minimum) tot 636 (maximum) ms. » 93 % van alle toestellen zijn beter. Dit betekent dat de gemeten responstijd slechter is dan het gemiddelde (30.9 ms) van alle geteste toestellen. | ||
Screen Flickering / PWM (Pulse-Width Modulation)
| Screen flickering / PWM niet waargenomen | 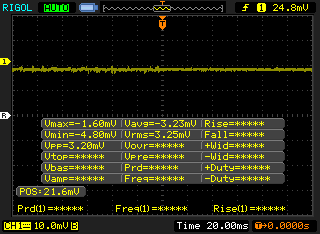 | ||
Ter vergelijking: 52 % van alle geteste toestellen maakten geen gebruik van PWM om de schermhelderheid te verlagen. Als het wel werd gebruikt, werd een gemiddelde van 7741 (minimum: 5 - maximum: 343500) Hz waargenomen. | |||
| PCMark 8 Home Score Accelerated v2 | 3178 punten | |
| PCMark 8 Work Score Accelerated v2 | 4333 punten | |
| PCMark 10 Score | 4038 punten | |
Help | ||
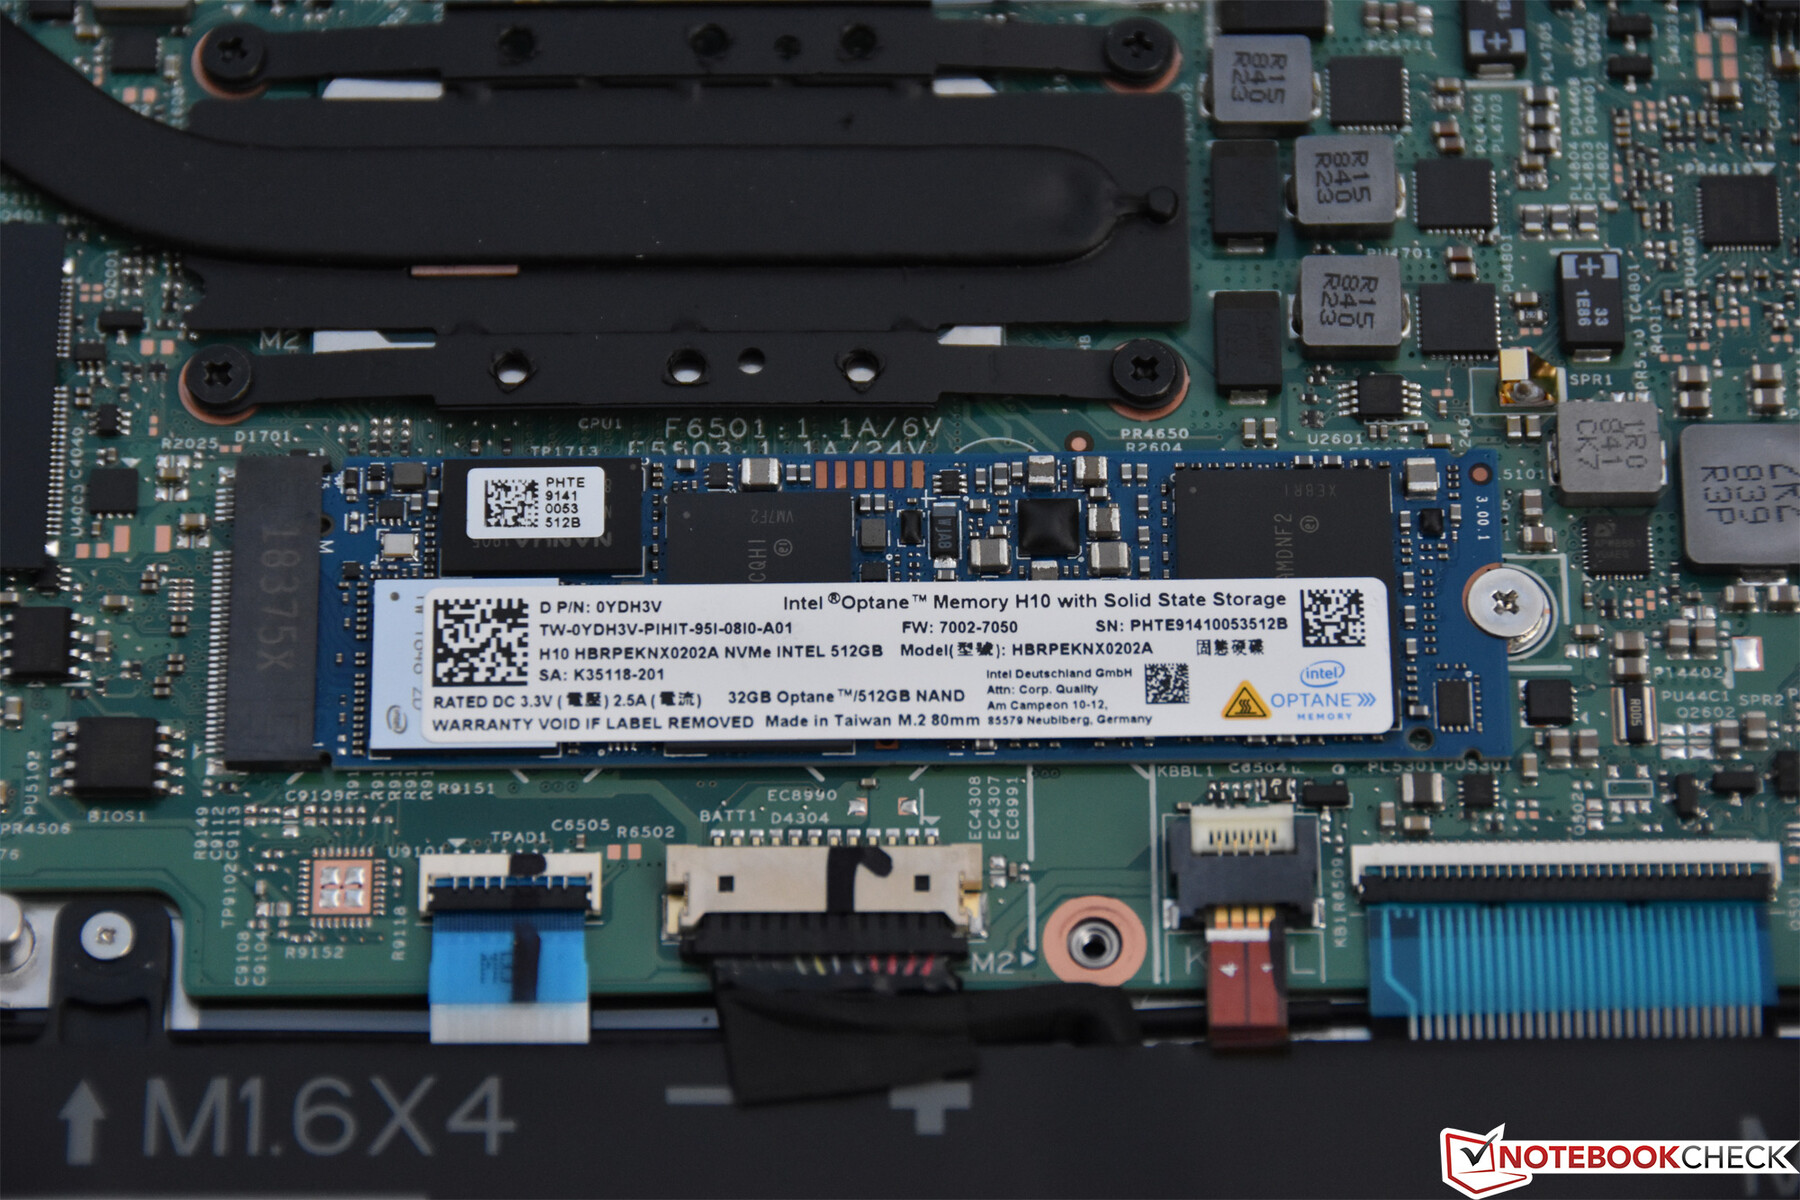
| Dell Inspiron 7390 2-in-1 Intel Optane Memory H10 with Solid State Storage 32GB + 512GB HBRPEKNX0202A(L/H) | Lenovo ThinkPad X1 Yoga 2019-20QGS00A00 WDC PC SN720 SDAPNTW-512G | HP Envy x360 13-ar0601ng SK Hynix BC501 HFM512GDJTNG | Dell Latitude 7400 2-in-1 Toshiba XG6 KXG60ZNV512G | Dell Inspiron 13 7386 SK Hynix BC501 HFM512GDJTNG | |
|---|---|---|---|---|---|
| AS SSD | 154% | 14% | -14% | 31% | |
| Seq Read (MB/s) | 984 | 2888 193% | 1412 43% | 2289 133% | 1122 14% |
| Seq Write (MB/s) | 320.1 | 2381 644% | 540 69% | 1163 263% | 619 93% |
| 4K Read (MB/s) | 66.2 | 45.66 -31% | 32.24 -51% | 22.29 -66% | 39.58 -40% |
| 4K Write (MB/s) | 128 | 162.4 27% | 74.7 -42% | 28.92 -77% | 108.5 -15% |
| 4K-64 Read (MB/s) | 365.9 | 1276 249% | 567 55% | 415.6 14% | 776 112% |
| 4K-64 Write (MB/s) | 673 | 1432 113% | 700 4% | 199.5 -70% | 671 0% |
| Access Time Read * (ms) | 0.065 | 0.088 -35% | 0.049 25% | 0.122 -88% | 0.045 31% |
| Access Time Write * (ms) | 0.046 | 0.023 50% | 0.048 -4% | 0.143 -211% | 0.033 28% |
| Score Read (Points) | 531 | 1610 203% | 741 40% | 667 26% | 928 75% |
| Score Write (Points) | 833 | 1832 120% | 829 0% | 345 -59% | 841 1% |
| Score Total (Points) | 1628 | 4245 161% | 1913 18% | 1300 -20% | 2228 37% |
| Copy ISO MB/s (MB/s) | 1810 | 521 | 1767 | ||
| Copy Program MB/s (MB/s) | 498.3 | 253.1 | 379.4 | ||
| Copy Game MB/s (MB/s) | 921 | 392.9 | 1055 | ||
| CrystalDiskMark 5.2 / 6 | 78% | -18% | -1% | -17% | |
| Write 4K (MB/s) | 99.7 | 194.3 95% | 88.3 -11% | 35.06 -65% | 97.4 -2% |
| Read 4K (MB/s) | 113.7 | 51.2 -55% | 34.84 -69% | 23.64 -79% | 38.05 -67% |
| Write Seq (MB/s) | 511 | 1773 247% | 740 45% | 1537 201% | 656 28% |
| Read Seq (MB/s) | 1431 | 2512 76% | 985 -31% | 1782 25% | 1043 -27% |
| Write 4K Q32T1 (MB/s) | 313.5 | 431.7 38% | 313.7 0% | 100.3 -68% | 331.5 6% |
| Read 4K Q32T1 (MB/s) | 289.1 | 539 86% | 243.1 -16% | 62.7 -78% | 253.8 -12% |
| Write Seq Q32T1 (MB/s) | 1274 | 2538 99% | 846 -34% | 2698 112% | 879 -31% |
| Read Seq Q32T1 (MB/s) | 2500 | 3489 40% | 1783 -29% | 1073 -57% | 1639 -34% |
| Write 4K Q8T8 (MB/s) | 867 | 305.7 | |||
| Read 4K Q8T8 (MB/s) | 1315 | 698 | |||
| Totaal Gemiddelde (Programma / Instellingen) | 116% /
122% | -2% /
1% | -8% /
-9% | 7% /
10% |
* ... kleiner is beter

| 3DMark 11 Performance | 2131 punten | |
| 3DMark Cloud Gate Standard Score | 8645 punten | |
| 3DMark Fire Strike Score | 1194 punten | |
Help | ||
| Metro: Last Light | |
| 1024x768 Low (DX10) AF:4x | |
| Dell Inspiron 7390 2-in-1 | |
| Gemiddeld Intel UHD Graphics 620 (23.3 - 41, n=5) | |
| 1366x768 Medium (DX10) AF:4x | |
| Dell Inspiron 7390 2-in-1 | |
| Gemiddeld Intel UHD Graphics 620 (16.4 - 28, n=4) | |
| 1366x768 High (DX11) AF:16x | |
| Dell Inspiron 7390 2-in-1 | |
| Gemiddeld Intel UHD Graphics 620 (13 - 16, n=3) | |
| 1920x1080 Very High (DX11) AF:16x | |
| Dell Inspiron 7390 2-in-1 | |
| Gemiddeld Intel UHD Graphics 620 (6 - 8, n=3) | |
| Rise of the Tomb Raider | |
| 1024x768 Lowest Preset | |
| HP Envy x360 13-ar0601ng | |
| Lenovo ThinkPad X390 Yoga-20NQS05R00 | |
| Gemiddeld Intel UHD Graphics 620 (10.4 - 110.7, n=82) | |
| Dell Inspiron 7390 2-in-1 | |
| Lenovo ThinkPad X1 Yoga 2019-20QGS00A00 | |
| 1366x768 Medium Preset AF:2x | |
| Lenovo ThinkPad X390 Yoga-20NQS05R00 | |
| Dell Inspiron 7390 2-in-1 | |
| Gemiddeld Intel UHD Graphics 620 (6.5 - 49.3, n=62) | |
| 1920x1080 High Preset AA:FX AF:4x | |
| HP Envy x360 13-ar0601ng | |
| Gemiddeld Intel UHD Graphics 620 (4.9 - 32, n=42) | |
| Dell Inspiron 7390 2-in-1 | |
| 1920x1080 Very High Preset AA:FX AF:16x | |
| Dell Inspiron 7390 2-in-1 | |
| Gemiddeld Intel UHD Graphics 620 (3 - 14.5, n=11) | |
| lage | gem. | hoge | ultra | |
|---|---|---|---|---|
| BioShock Infinite (2013) | 64 | 33 | 29 | 10 |
| Metro: Last Light (2013) | 35 | 28 | 16 | 8 |
| Rise of the Tomb Raider (2016) | 21 | 13 | 7 | 6 |
| Dell Inspiron 7390 2-in-1 UHD Graphics 620, i7-8565U, Intel Optane Memory H10 with Solid State Storage 32GB + 512GB HBRPEKNX0202A(L/H) | Lenovo ThinkPad X1 Yoga 2019-20QGS00A00 UHD Graphics 620, i7-8565U, WDC PC SN720 SDAPNTW-512G | HP Envy x360 13-ar0601ng Vega 10, R7 3700U, SK Hynix BC501 HFM512GDJTNG | Lenovo ThinkPad X390 Yoga-20NQS05R00 UHD Graphics 620, i7-8565U, Intel SSD Pro 7600p SSDPEKKF512G8L | Dell Latitude 7400 2-in-1 UHD Graphics 620, i7-8665U, Toshiba XG6 KXG60ZNV512G | Dell Inspiron 13 7386 UHD Graphics 620, i7-8565U, SK Hynix BC501 HFM512GDJTNG | |
|---|---|---|---|---|---|---|
| Noise | 3% | -9% | 2% | 10% | 0% | |
| uit / omgeving * (dB) | 28.2 | 29.3 -4% | 30.5 -8% | 29.2 -4% | 28.2 -0% | 30.3 -7% |
| Idle Minimum * (dB) | 28.2 | 29.3 -4% | 32.2 -14% | 29.2 -4% | 28.2 -0% | 30.4 -8% |
| Idle Average * (dB) | 28.2 | 29.3 -4% | 32.2 -14% | 29.2 -4% | 28.2 -0% | 30.4 -8% |
| Idle Maximum * (dB) | 28.2 | 31.1 -10% | 32.2 -14% | 29.2 -4% | 28.3 -0% | 30.4 -8% |
| Load Average * (dB) | 37.3 | 32.7 12% | 40.8 -9% | 35 6% | 28.2 24% | 34.3 8% |
| Load Maximum * (dB) | 44.4 | 32.7 26% | 41.9 6% | 35 21% | 28.8 35% | 34.2 23% |
* ... kleiner is beter
Geluidsniveau
| Onbelast |
| 28.2 / 28.2 / 28.2 dB (A) |
| Belasting |
| 37.3 / 44.4 dB (A) |
 | ||
30 dB stil 40 dB(A) hoorbaar 50 dB(A) luid |
||
min: | ||
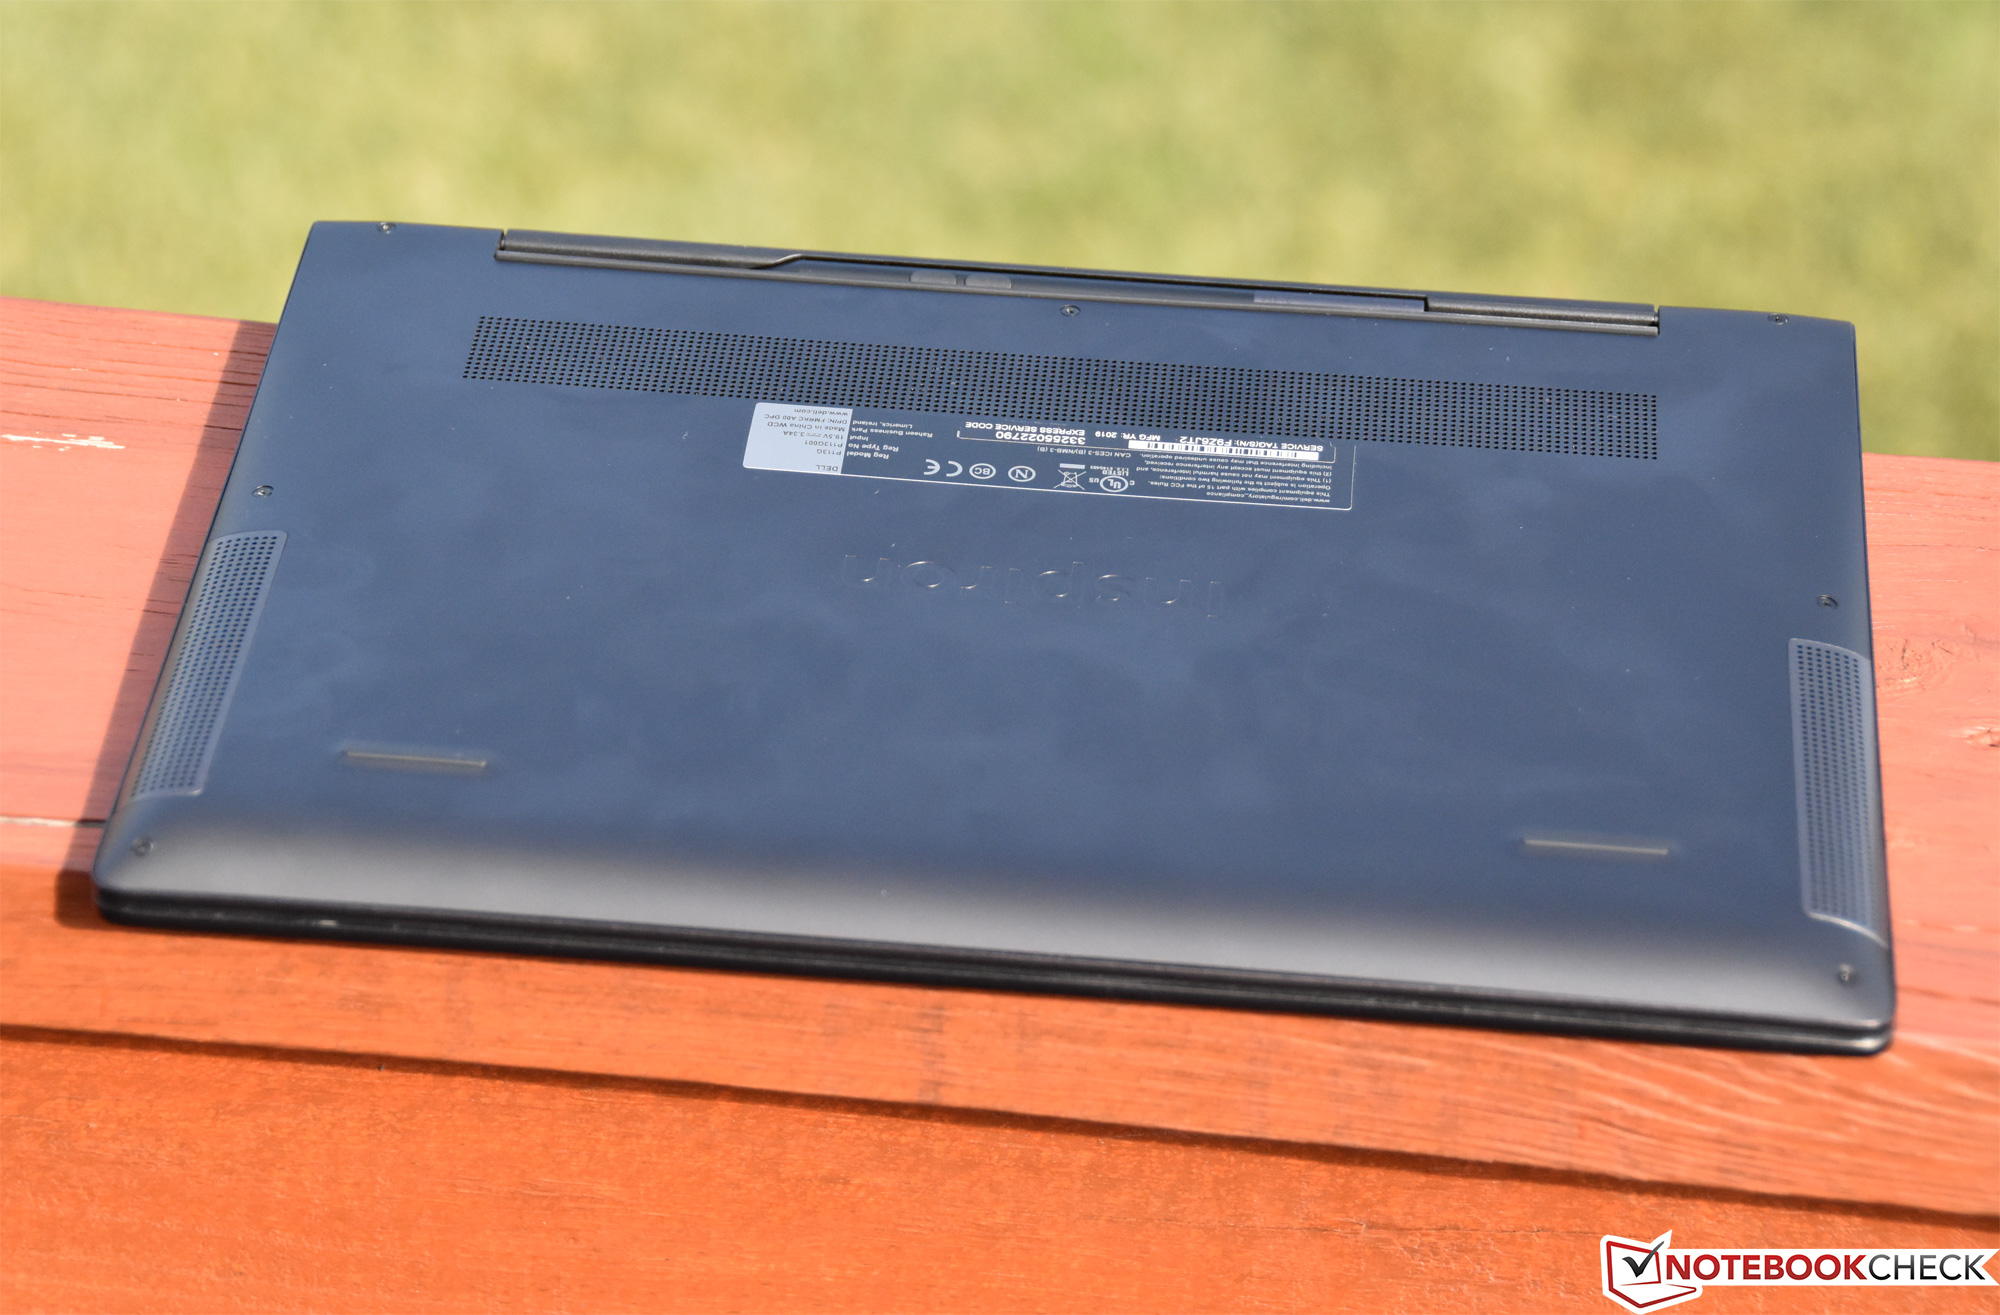
(±) De maximumtemperatuur aan de bovenzijde bedraagt 42 °C / 108 F, vergeleken met het gemiddelde van 35.4 °C / 96 F, variërend van 19.6 tot 60 °C voor de klasse Convertible.
(-) De bodem warmt op tot een maximum van 46.6 °C / 116 F, vergeleken met een gemiddelde van 36.9 °C / 98 F
(+) Bij onbelast gebruik bedraagt de gemiddelde temperatuur voor de bovenzijde 28.1 °C / 83 F, vergeleken met het apparaatgemiddelde van 30.3 °C / 87 F.
(+) De handpalmsteunen en het touchpad bereiken maximaal de huidtemperatuur (32.8 °C / 91 F) en zijn dus niet heet.
(-) De gemiddelde temperatuur van de handpalmsteun van soortgelijke toestellen bedroeg 28 °C / 82.4 F (-4.8 °C / -8.6 F).
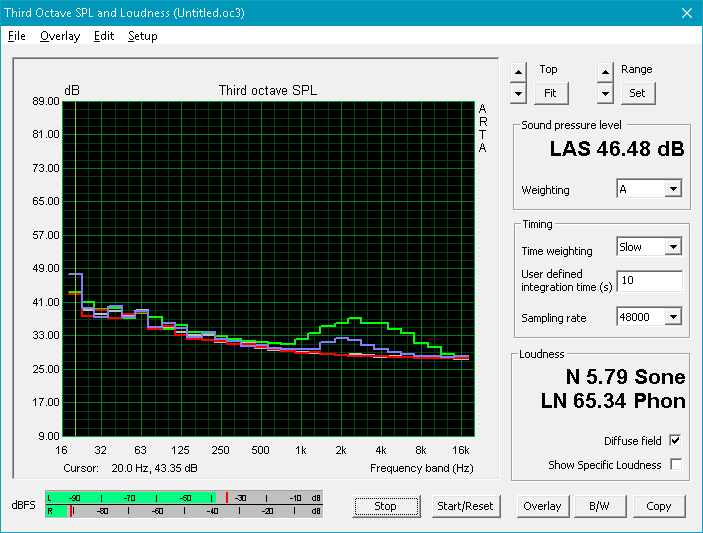
Dell Inspiron 7390 2-in-1 audioanalyse
(+) | luidsprekers kunnen relatief luid spelen (87.2 dB)
Bas 100 - 315 Hz
(-) | bijna geen lage tonen - gemiddeld 20.3% lager dan de mediaan
(±) | lineariteit van de lage tonen is gemiddeld (9.5% delta ten opzichte van de vorige frequentie)
Midden 400 - 2000 Hz
(±) | hogere middens - gemiddeld 5.1% hoger dan de mediaan
(±) | lineariteit van de middentonen is gemiddeld (7.6% delta ten opzichte van de vorige frequentie)
Hoog 2 - 16 kHz
(+) | evenwichtige hoogtepunten - slechts 3.6% verwijderd van de mediaan
(±) | lineariteit van de hoogtepunten is gemiddeld (8.2% delta ten opzichte van de vorige frequentie)
Algemeen 100 - 16.000 Hz
(±) | lineariteit van het totale geluid is gemiddeld (21% verschil met de mediaan)
Vergeleken met dezelfde klasse
» 56% van alle geteste apparaten in deze klasse waren beter, 10% vergelijkbaar, 34% slechter
» De beste had een delta van 6%, het gemiddelde was 20%, de slechtste was 57%
Vergeleken met alle geteste toestellen
» 58% van alle geteste apparaten waren beter, 7% gelijk, 35% slechter
» De beste had een delta van 4%, het gemiddelde was 23%, de slechtste was 134%
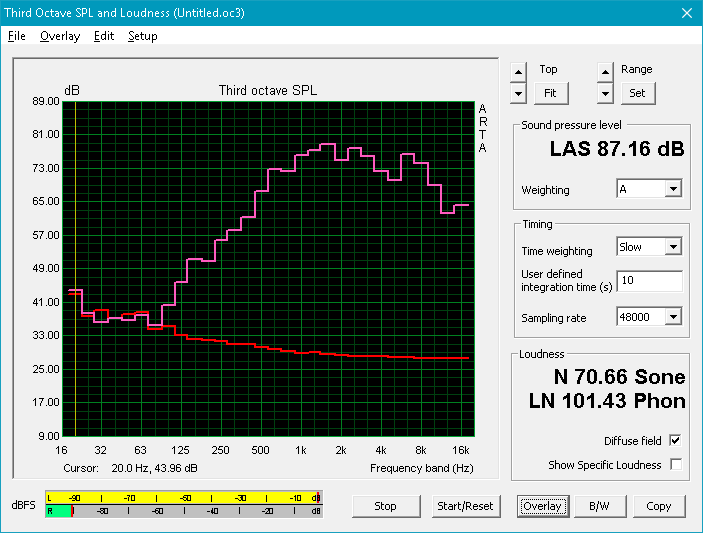
Dell Latitude 7400 2-in-1 audioanalyse
(+) | luidsprekers kunnen relatief luid spelen (82.9 dB)
Bas 100 - 315 Hz
(-) | bijna geen lage tonen - gemiddeld 17.3% lager dan de mediaan
(±) | lineariteit van de lage tonen is gemiddeld (11.7% delta ten opzichte van de vorige frequentie)
Midden 400 - 2000 Hz
(+) | evenwichtige middens - slechts 2% verwijderd van de mediaan
(+) | de middentonen zijn lineair (5.3% delta ten opzichte van de vorige frequentie)
Hoog 2 - 16 kHz
(+) | evenwichtige hoogtepunten - slechts 2.9% verwijderd van de mediaan
(±) | lineariteit van de hoogtepunten is gemiddeld (7.3% delta ten opzichte van de vorige frequentie)
Algemeen 100 - 16.000 Hz
(±) | lineariteit van het totale geluid is gemiddeld (17.3% verschil met de mediaan)
Vergeleken met dezelfde klasse
» 33% van alle geteste apparaten in deze klasse waren beter, 8% vergelijkbaar, 59% slechter
» De beste had een delta van 6%, het gemiddelde was 20%, de slechtste was 57%
Vergeleken met alle geteste toestellen
» 33% van alle geteste apparaten waren beter, 8% gelijk, 59% slechter
» De beste had een delta van 4%, het gemiddelde was 23%, de slechtste was 134%
| Uit / Standby | |
| Inactief | |
| Belasting |
|
Key:
min: | |
| Dell Inspiron 7390 2-in-1 i7-8565U, UHD Graphics 620, Intel Optane Memory H10 with Solid State Storage 32GB + 512GB HBRPEKNX0202A(L/H), IPS, 3840x2160, 13.3" | Lenovo ThinkPad X1 Yoga 2019-20QGS00A00 i7-8565U, UHD Graphics 620, WDC PC SN720 SDAPNTW-512G, IPS LED, 1920x1080, 14" | HP Envy x360 13-ar0601ng R7 3700U, Vega 10, SK Hynix BC501 HFM512GDJTNG, IPS, 120 Hz, 1920x1080, 13.3" | Lenovo ThinkPad X390 Yoga-20NQS05R00 i7-8565U, UHD Graphics 620, Intel SSD Pro 7600p SSDPEKKF512G8L, IPS LED, 1920x1080, 13.3" | Dell Latitude 7400 2-in-1 i7-8665U, UHD Graphics 620, Toshiba XG6 KXG60ZNV512G, IPS, 1920x1080, 14" | Dell Inspiron 13 7386 i7-8565U, UHD Graphics 620, SK Hynix BC501 HFM512GDJTNG, IPS, 3840x2160, 13.3" | |
|---|---|---|---|---|---|---|
| Power Consumption | 3% | 19% | 2% | 22% | -26% | |
| Idle Minimum * (Watt) | 4.6 | 3.8 17% | 3.2 30% | 3.46 25% | 2.6 43% | 6.5 -41% |
| Idle Average * (Watt) | 7.5 | 6.1 19% | 2.8 63% | 5.88 22% | 4.3 43% | 12.2 -63% |
| Idle Maximum * (Watt) | 7.8 | 9.1 -17% | 12.4 -59% | 9.12 -17% | 5.5 29% | 12.7 -63% |
| Load Average * (Watt) | 37.6 | 38.6 -3% | 24.2 36% | 45.6 -21% | 32 15% | 39 -4% |
| Load Maximum * (Watt) | 65.3 | 64.5 1% | 50 23% | 65.9 -1% | 78.8 -21% | 39 40% |
* ... kleiner is beter
| Dell Inspiron 7390 2-in-1 i7-8565U, UHD Graphics 620, 52 Wh | Lenovo ThinkPad X1 Yoga 2019-20QGS00A00 i7-8565U, UHD Graphics 620, 51 Wh | HP Envy x360 13-ar0601ng R7 3700U, Vega 10, 53 Wh | Lenovo ThinkPad X390 Yoga-20NQS05R00 i7-8565U, UHD Graphics 620, 50 Wh | Dell Latitude 7400 2-in-1 i7-8665U, UHD Graphics 620, 78 Wh | Dell Inspiron 13 7386 i7-8565U, UHD Graphics 620, 38 Wh | |
|---|---|---|---|---|---|---|
| Batterijduur | 2% | -0% | -3% | 85% | -39% | |
| Reader / Idle (h) | 12.7 | 10.5 -17% | 6.7 -47% | |||
| WiFi v1.3 (h) | 6.6 | 9 36% | 7.3 11% | 8.2 24% | 12.2 85% | 3.9 -41% |
| Load (h) | 2.1 | 1.4 -33% | 2.2 5% | 1.5 -29% | 1.5 -29% |
Pro
Contra
Dit is de verkorte versie van het originele artikel. Het volledige, Engelse testrapport vind je hier.
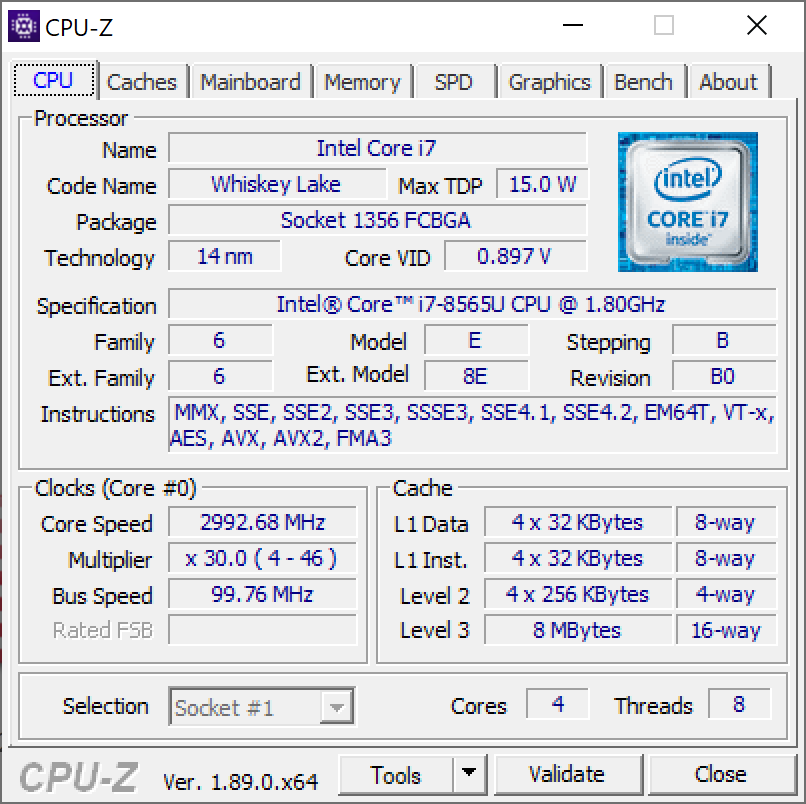
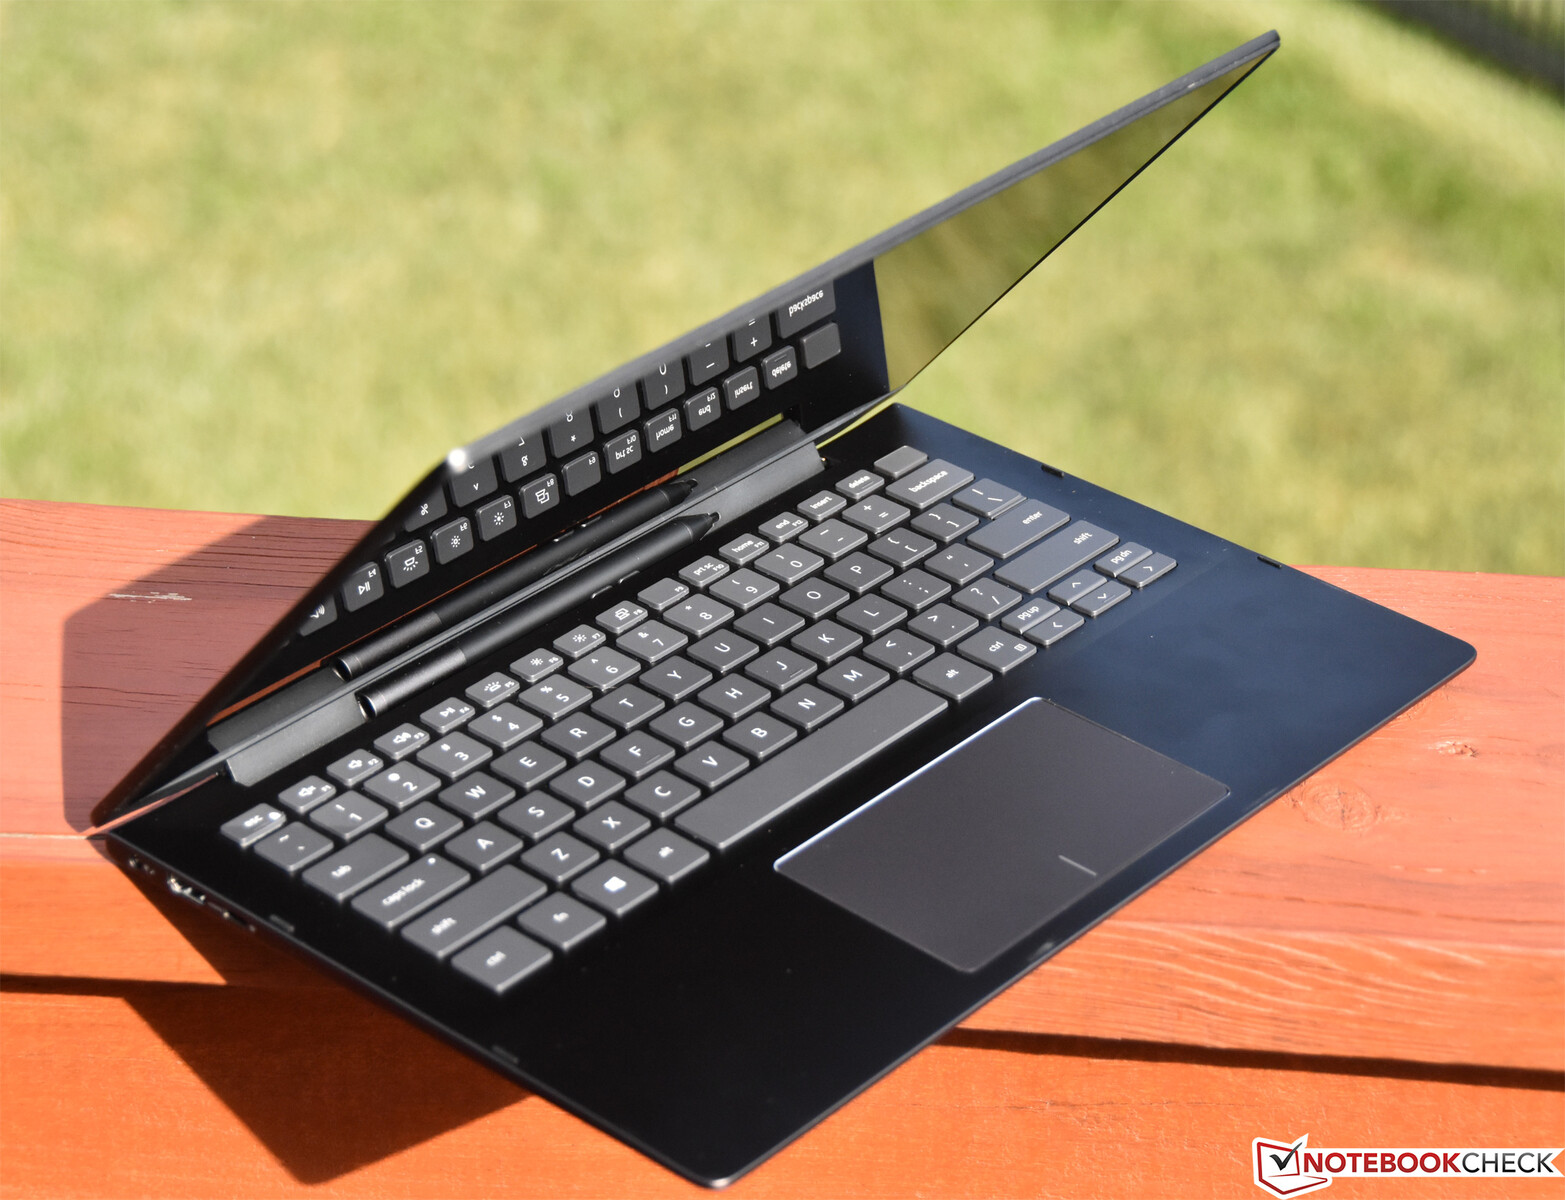
De € 1249 Dell Inspiron 7390 2-in-1 Black Edition lijkt qua uiterlijk misschien niet zo heel erg op zijn voorloper. Echter zijn de grootste klachten van de Inspiron 7386 2-in-1 geadresseerd. Belangrijkste daarvan is het bijna gehalveerde stroomverbruik in idle-modus. De batterijduur is ook met 40% verhoogd. Ook vonden we geen fluitende spoelen in ons specifieke test model, en is het scherm iets helderder dan in zijn voorloper. Zelfs de CPU prestaties zijn verbeterd, ondanks het feit dat beide toestellen dezelfde processor gebruiken.
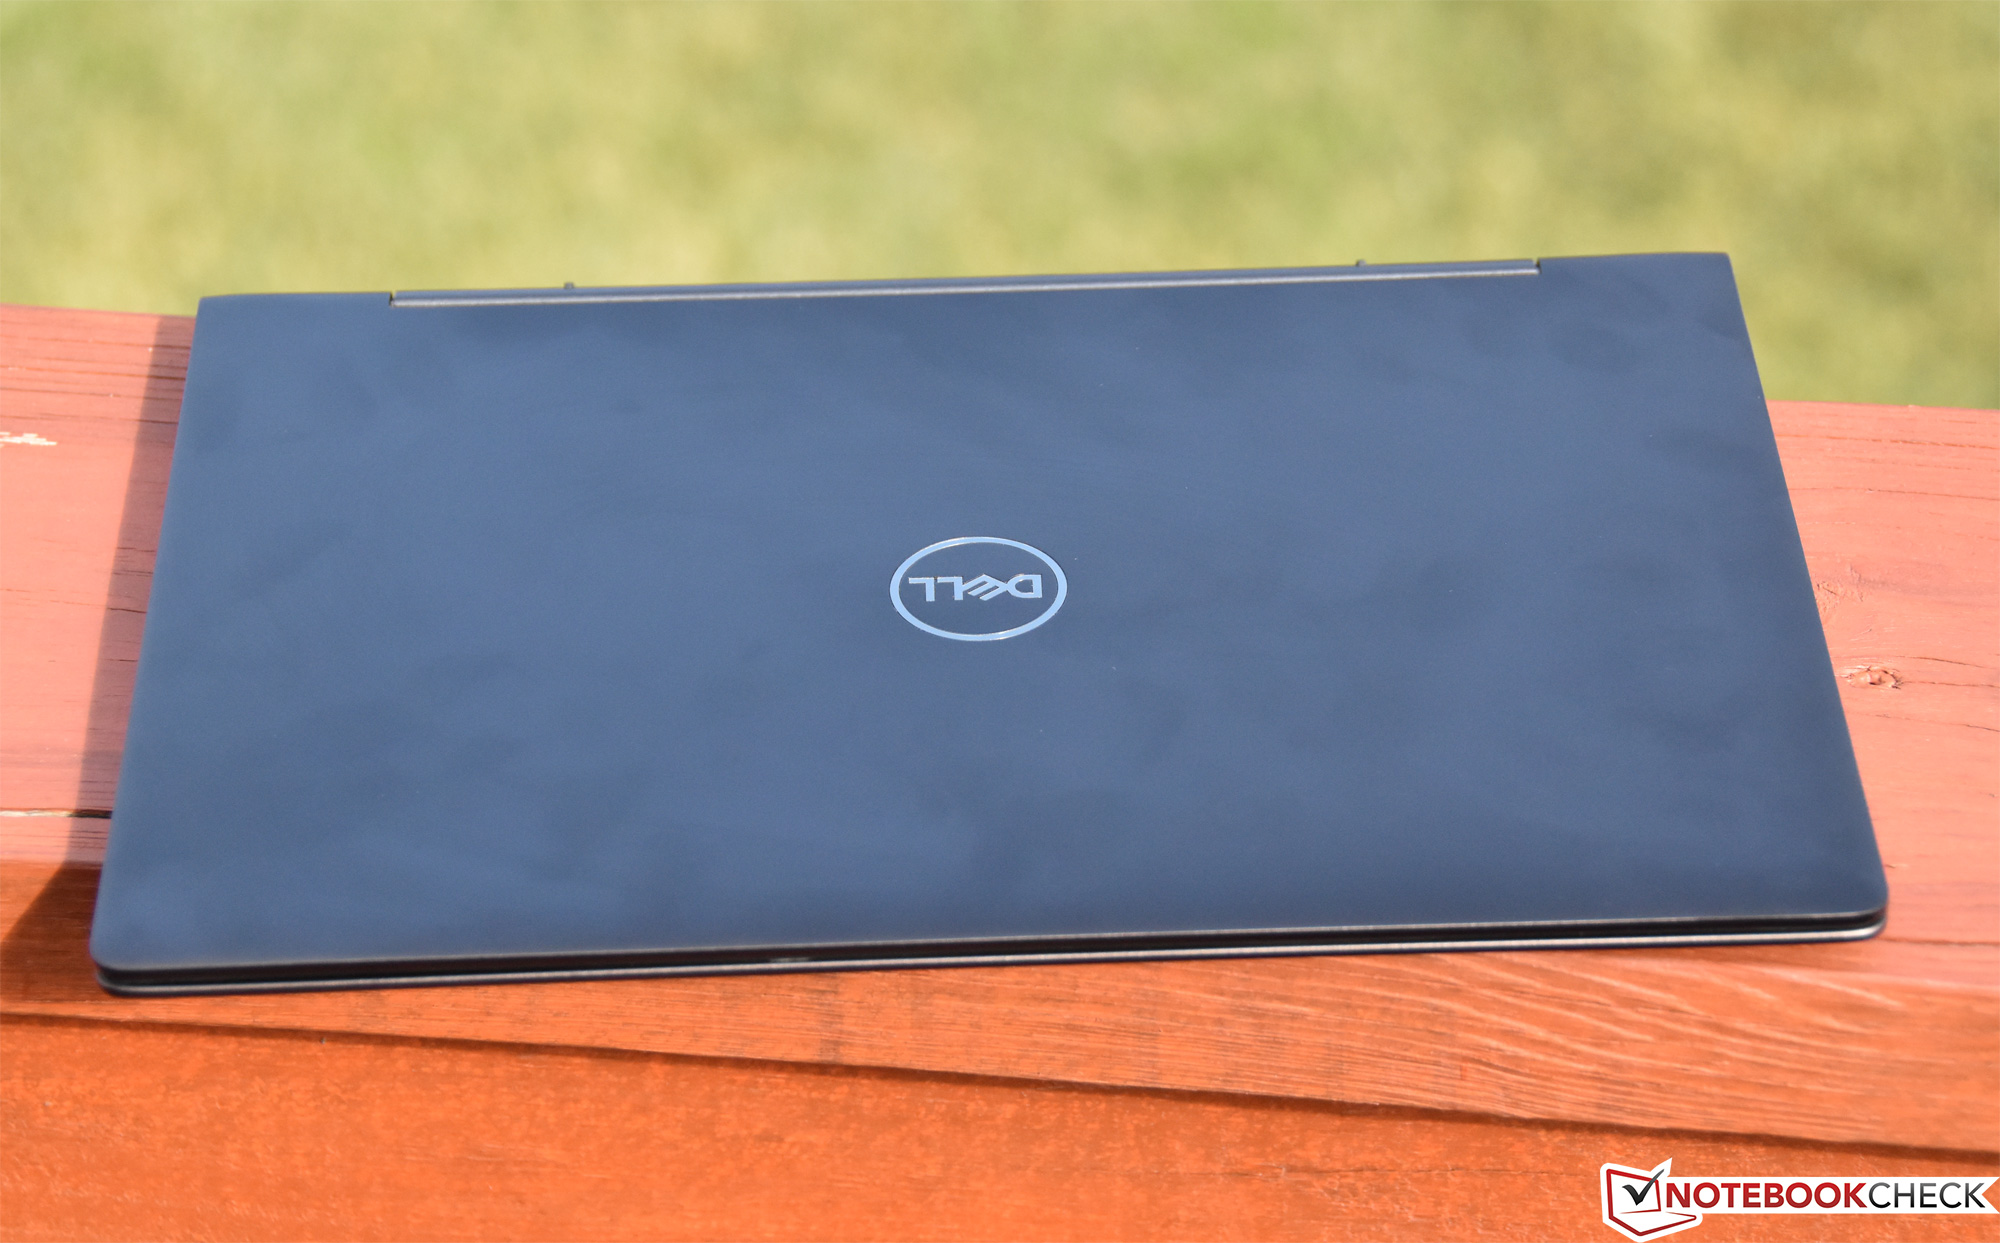
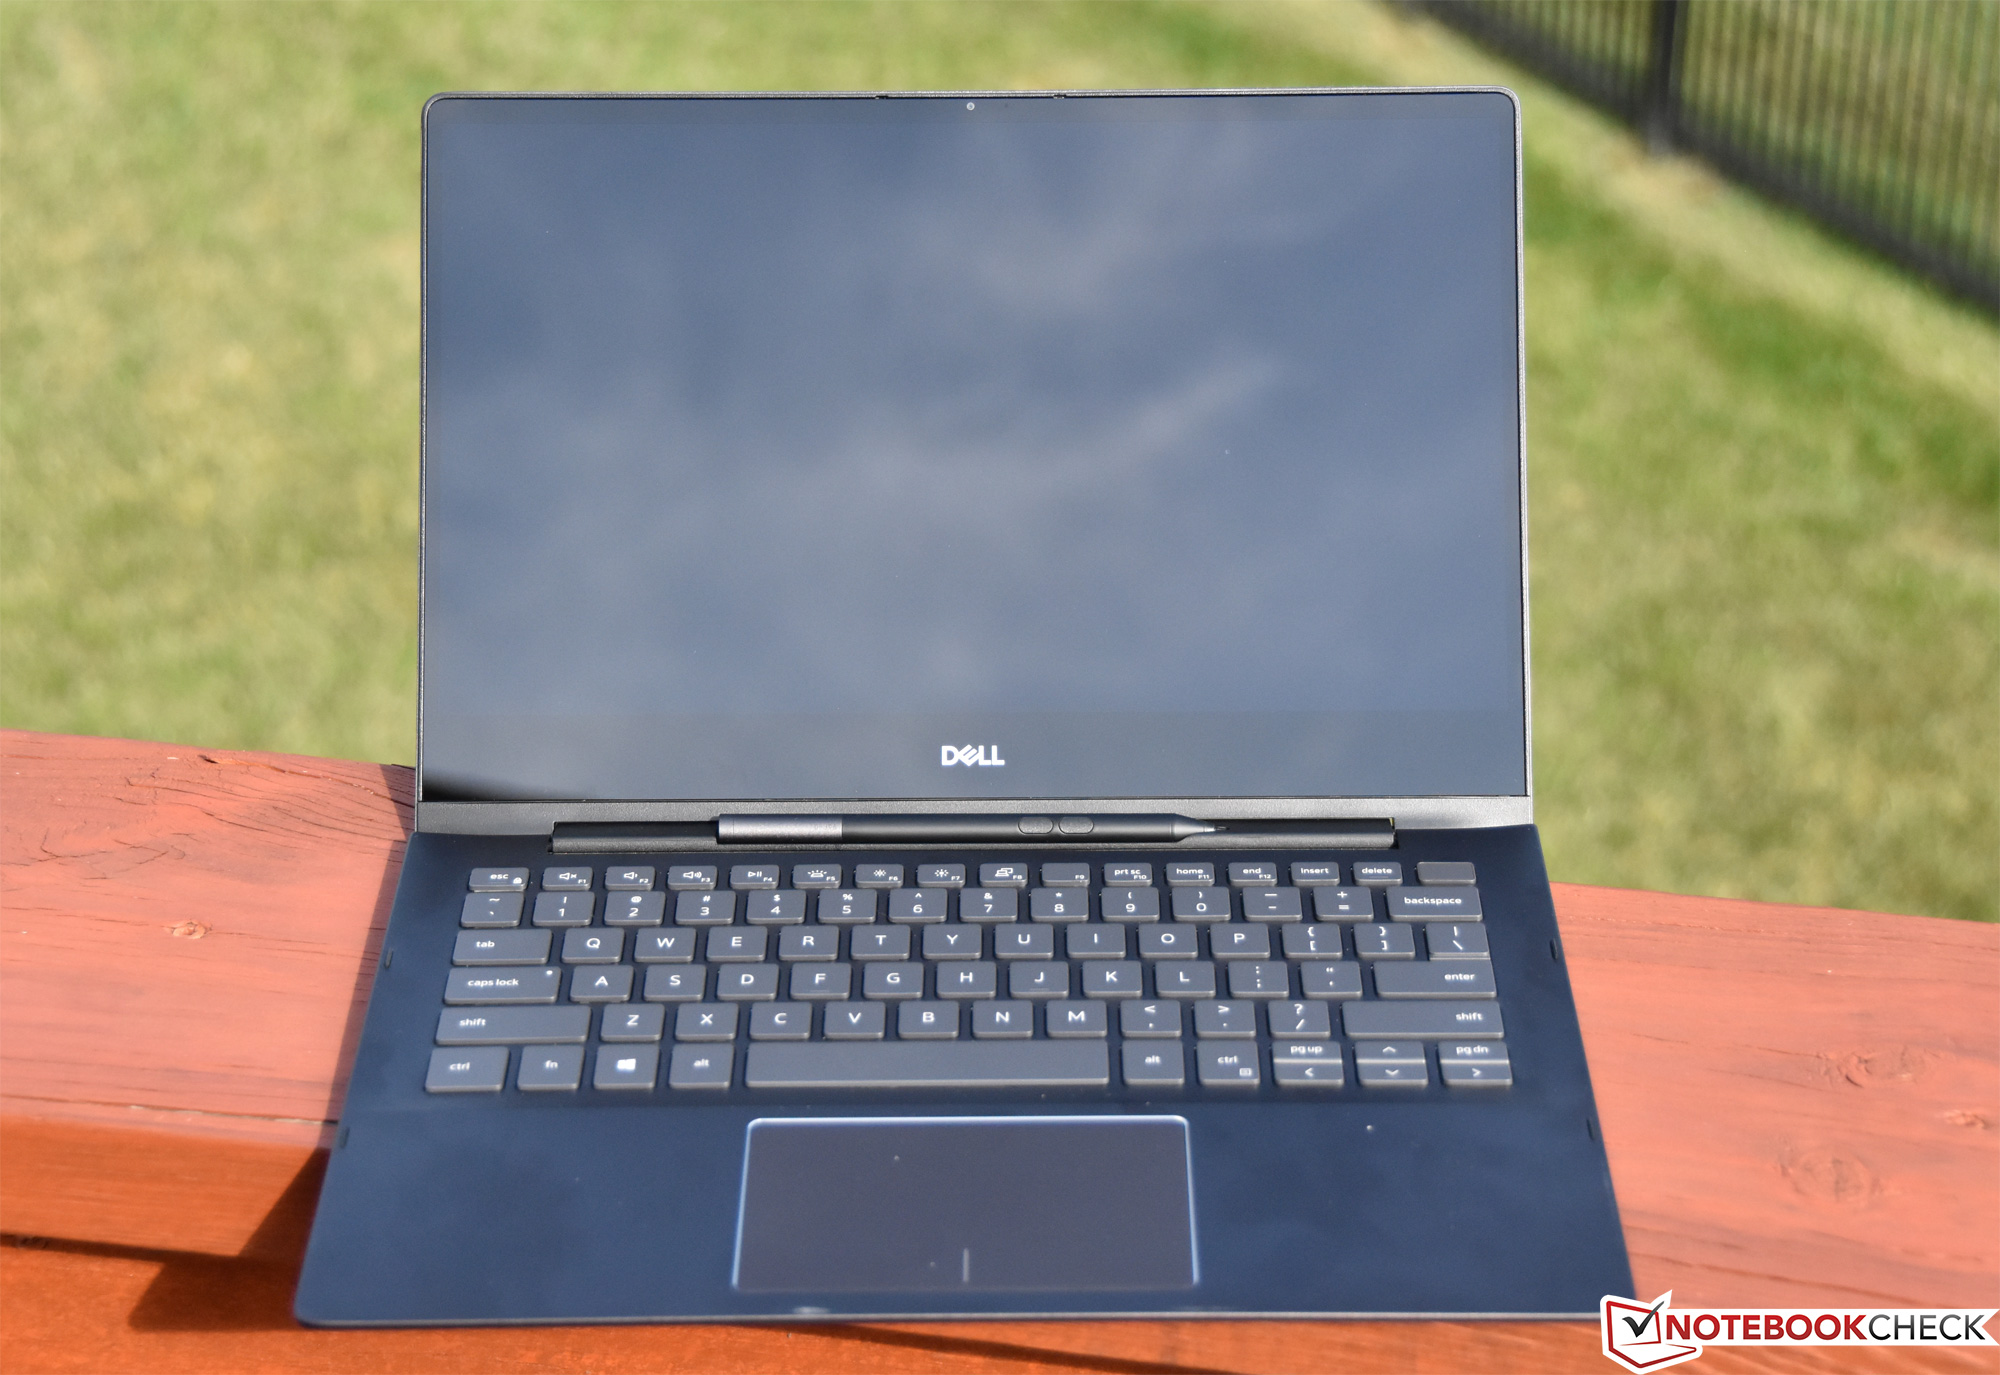
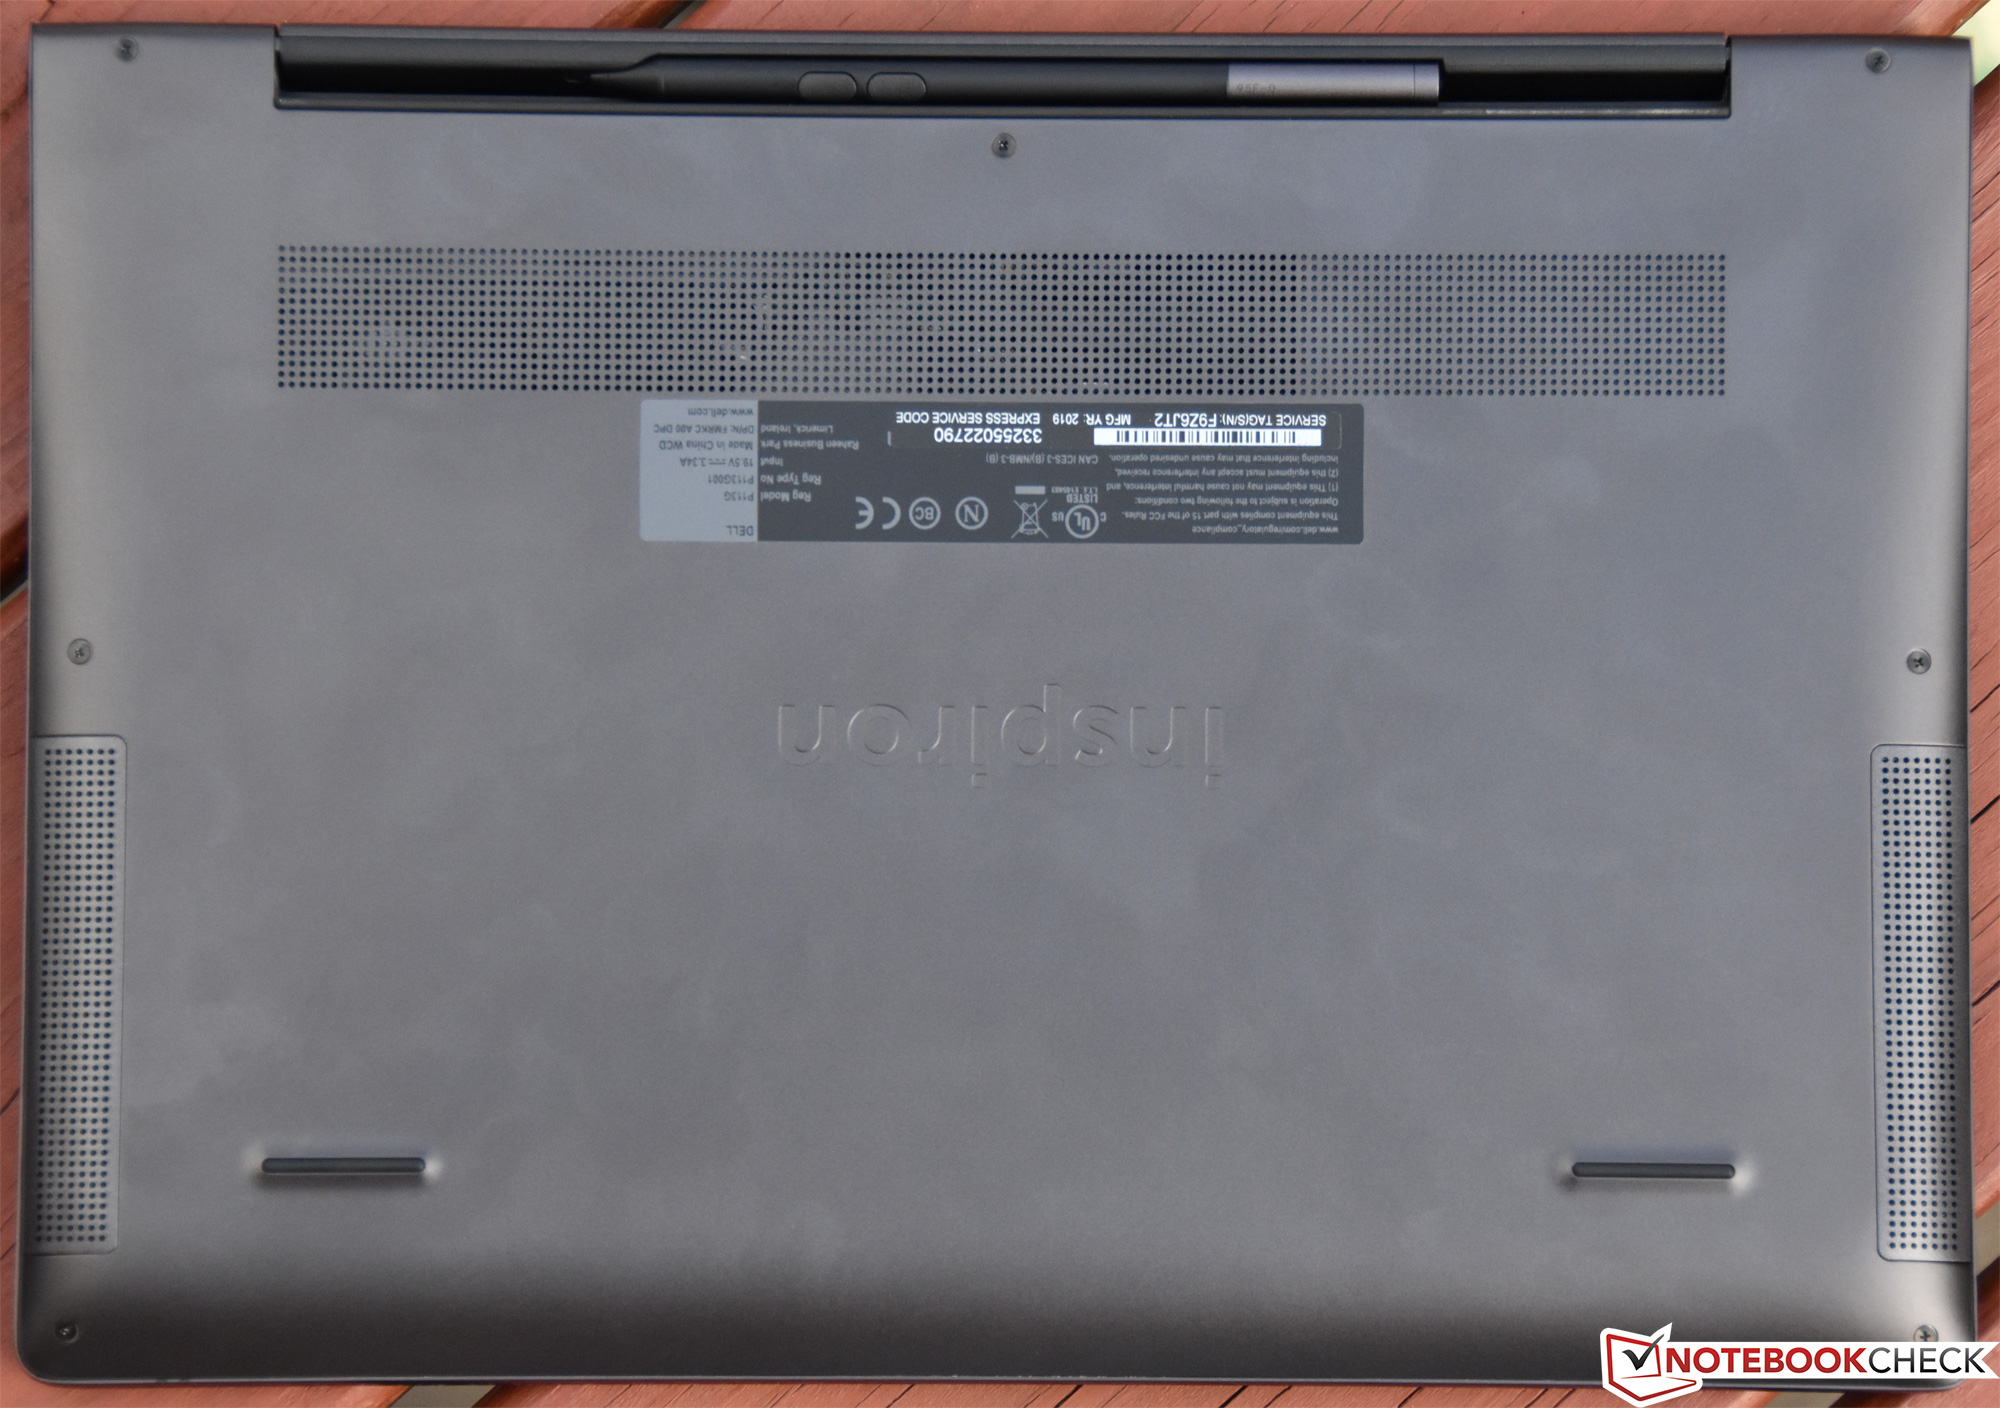
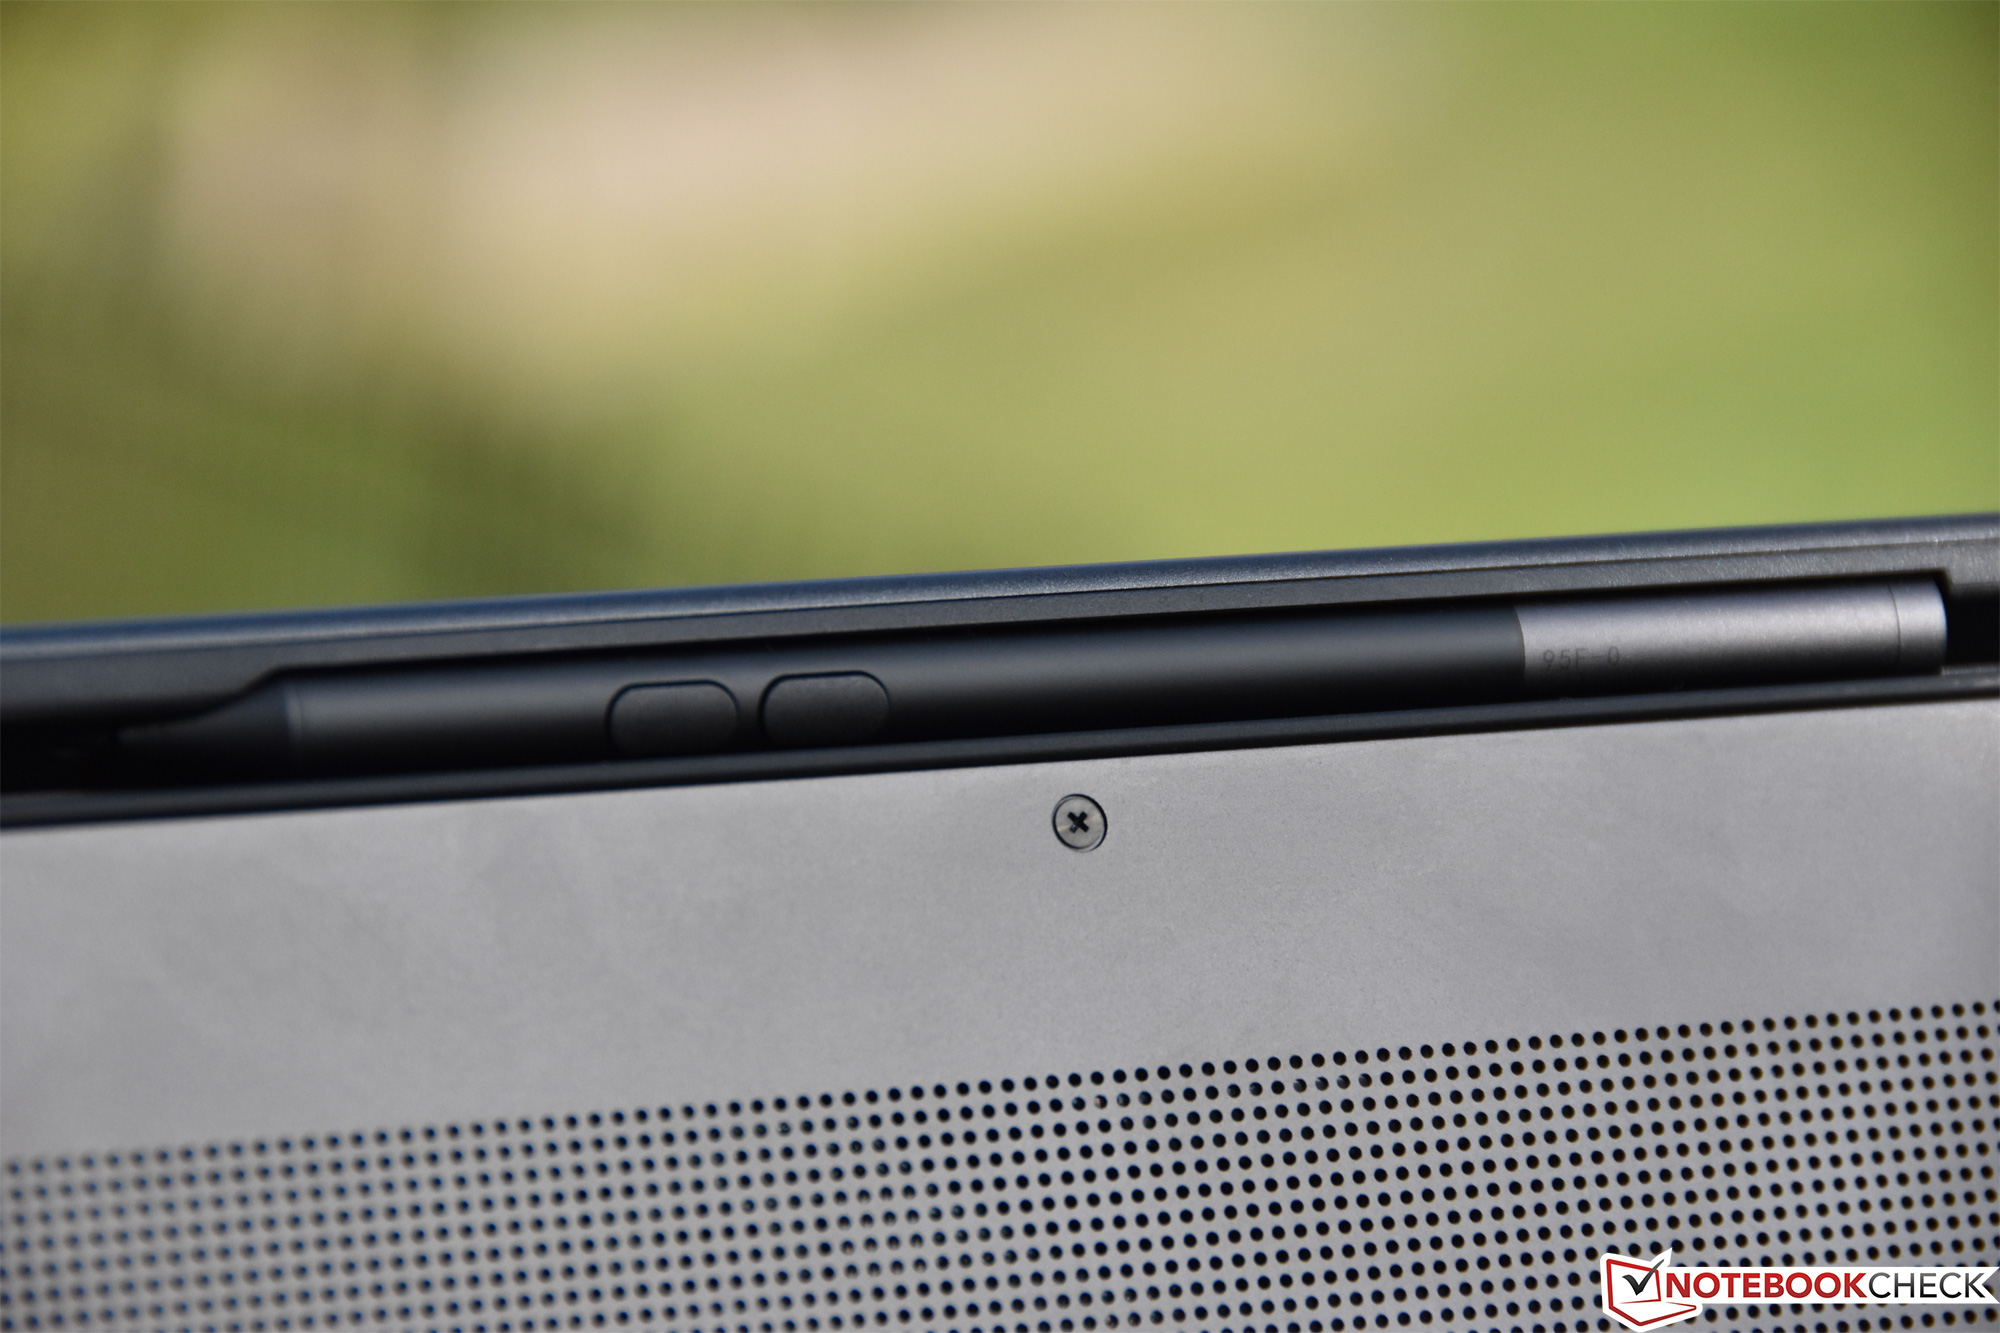
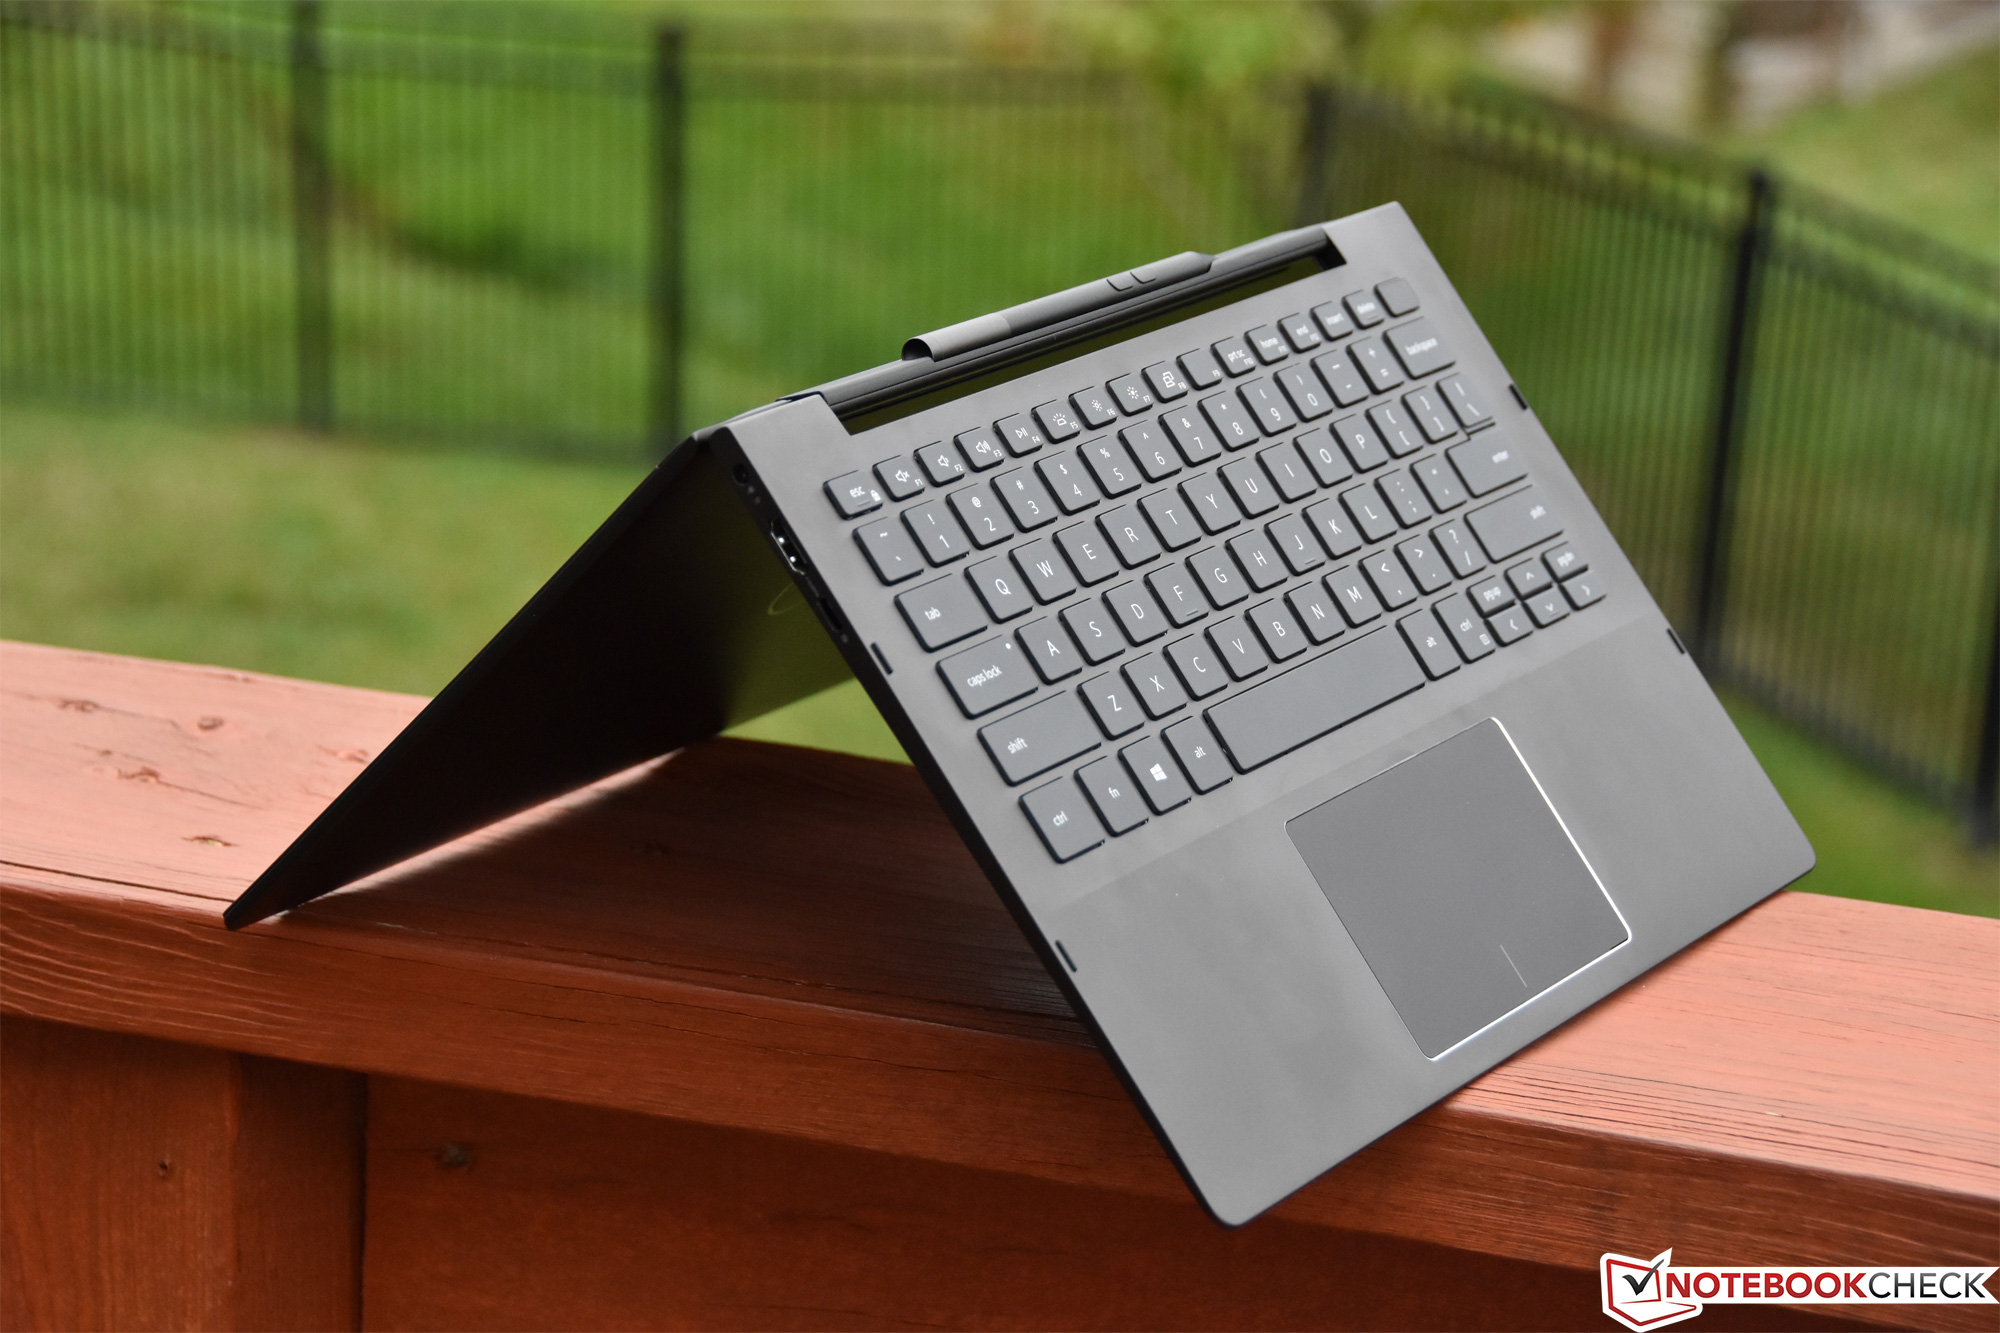
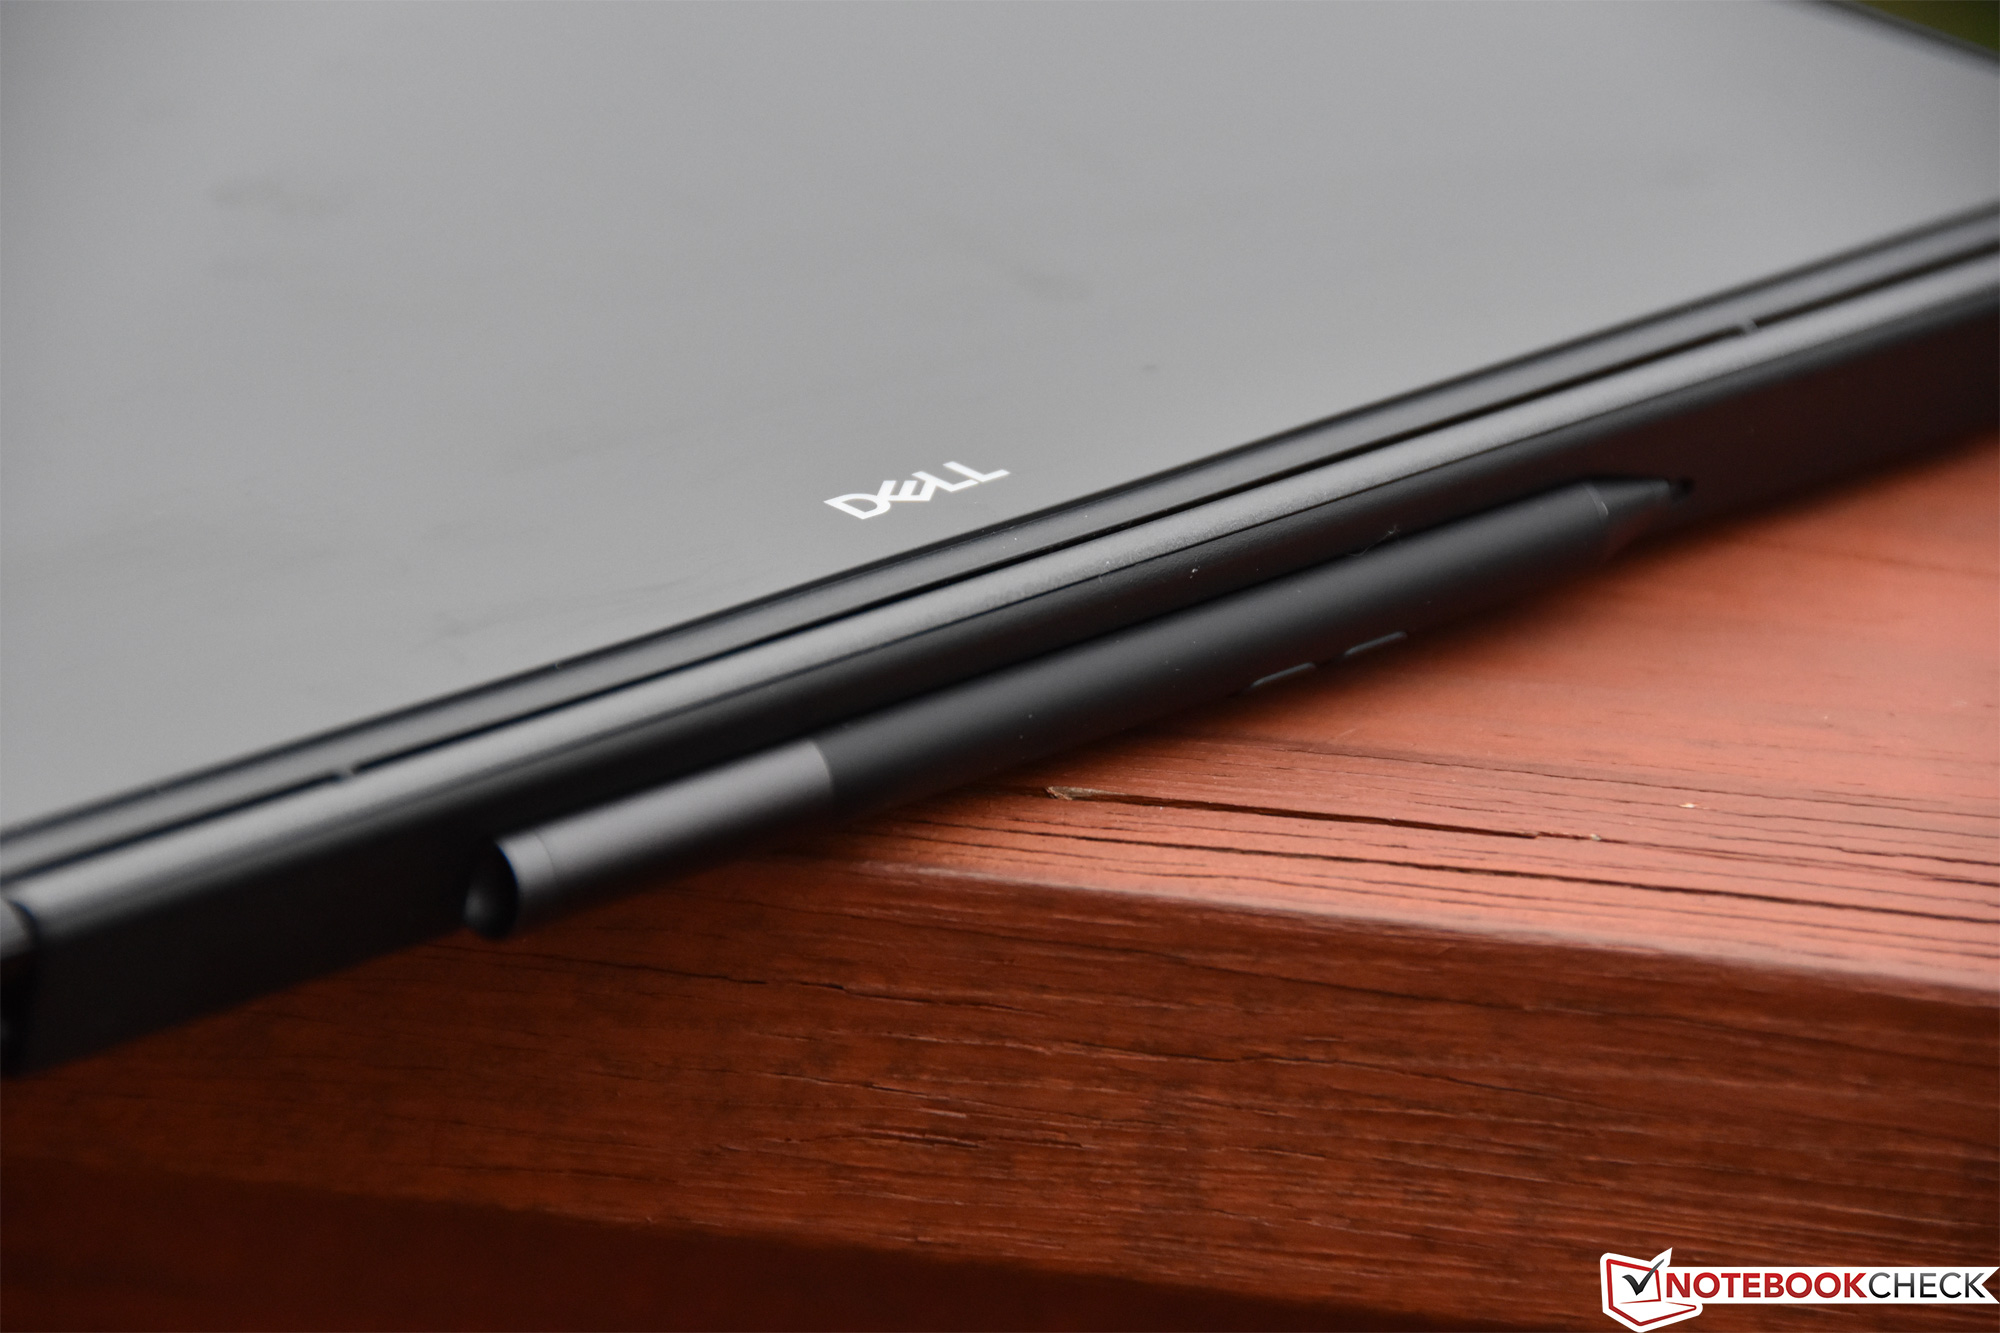
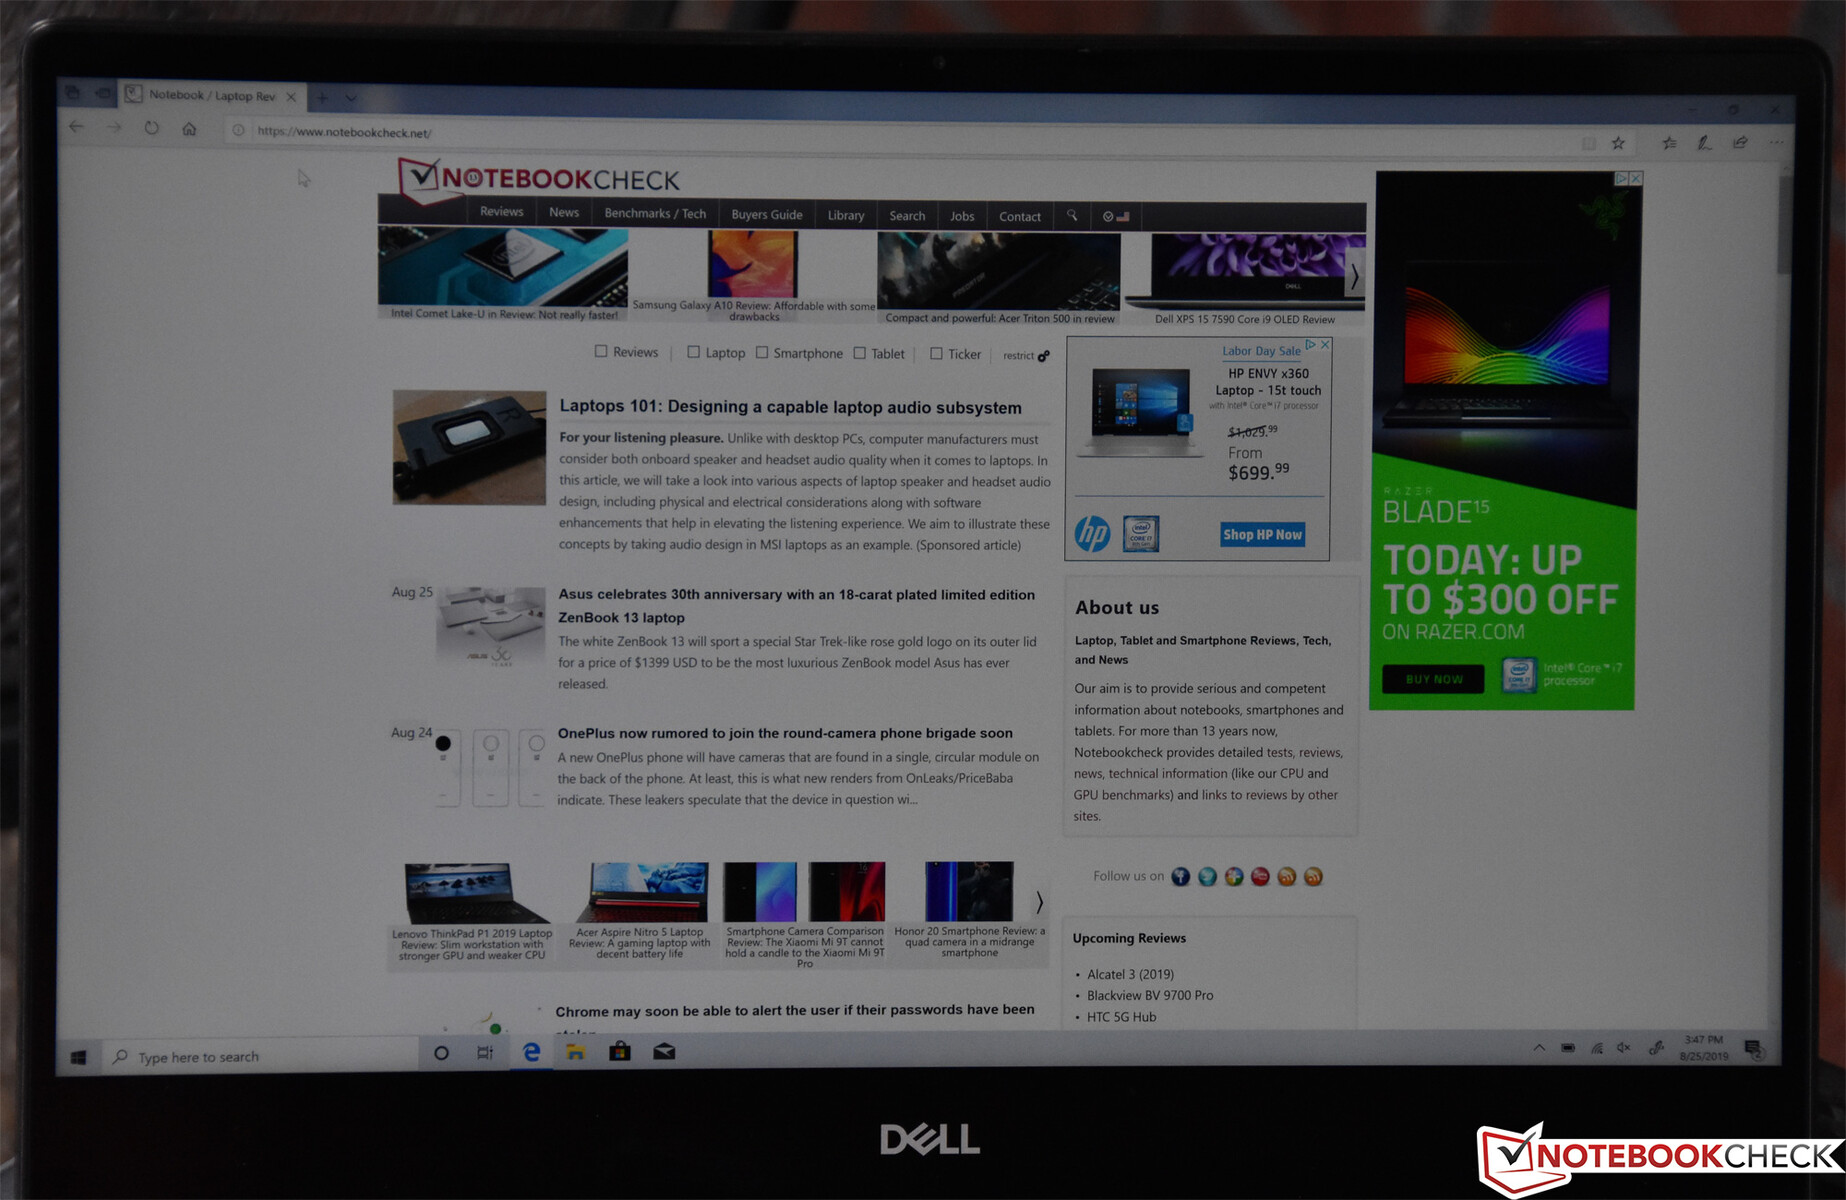
Daarnaast is het UHD display aantrekkelijk, met behoorlijk goede kleurreproductie en kalibratie. De opnieuw ontworpen aan/uit-knop (met geïntegreerde vingerafdrukscanner) en toetsenbord lay-out werkt goed naar onze mening. De constructie en ontwerp van de behuizing zijn goed voor zijn klasse, het notebook lijkt robuuster dan zijn slankere concurrenten. Tot slot, Dell’s nieuwe, slimme scharnier ontwerp heeft een magnetische inkeping voor de inbegrepen Dell Active Pen. Dit is een van de betere oplossingen om een stylus op te bergen.
De Inspiron 7390 2-in-1 is in vergelijking met zijn voorganger op een paar punten verbeterd, met name de accuduur en prestaties zijn verbeterd. Ondanks enkele klachten met betrekking tot invoerapparaten en het twijfelachtige nut van de Core i7 CPU, vertegenwoordigd de Inspiron 7390 2-in-1 een serieus alternatief voor fabrikanten als Lenovo en HP.
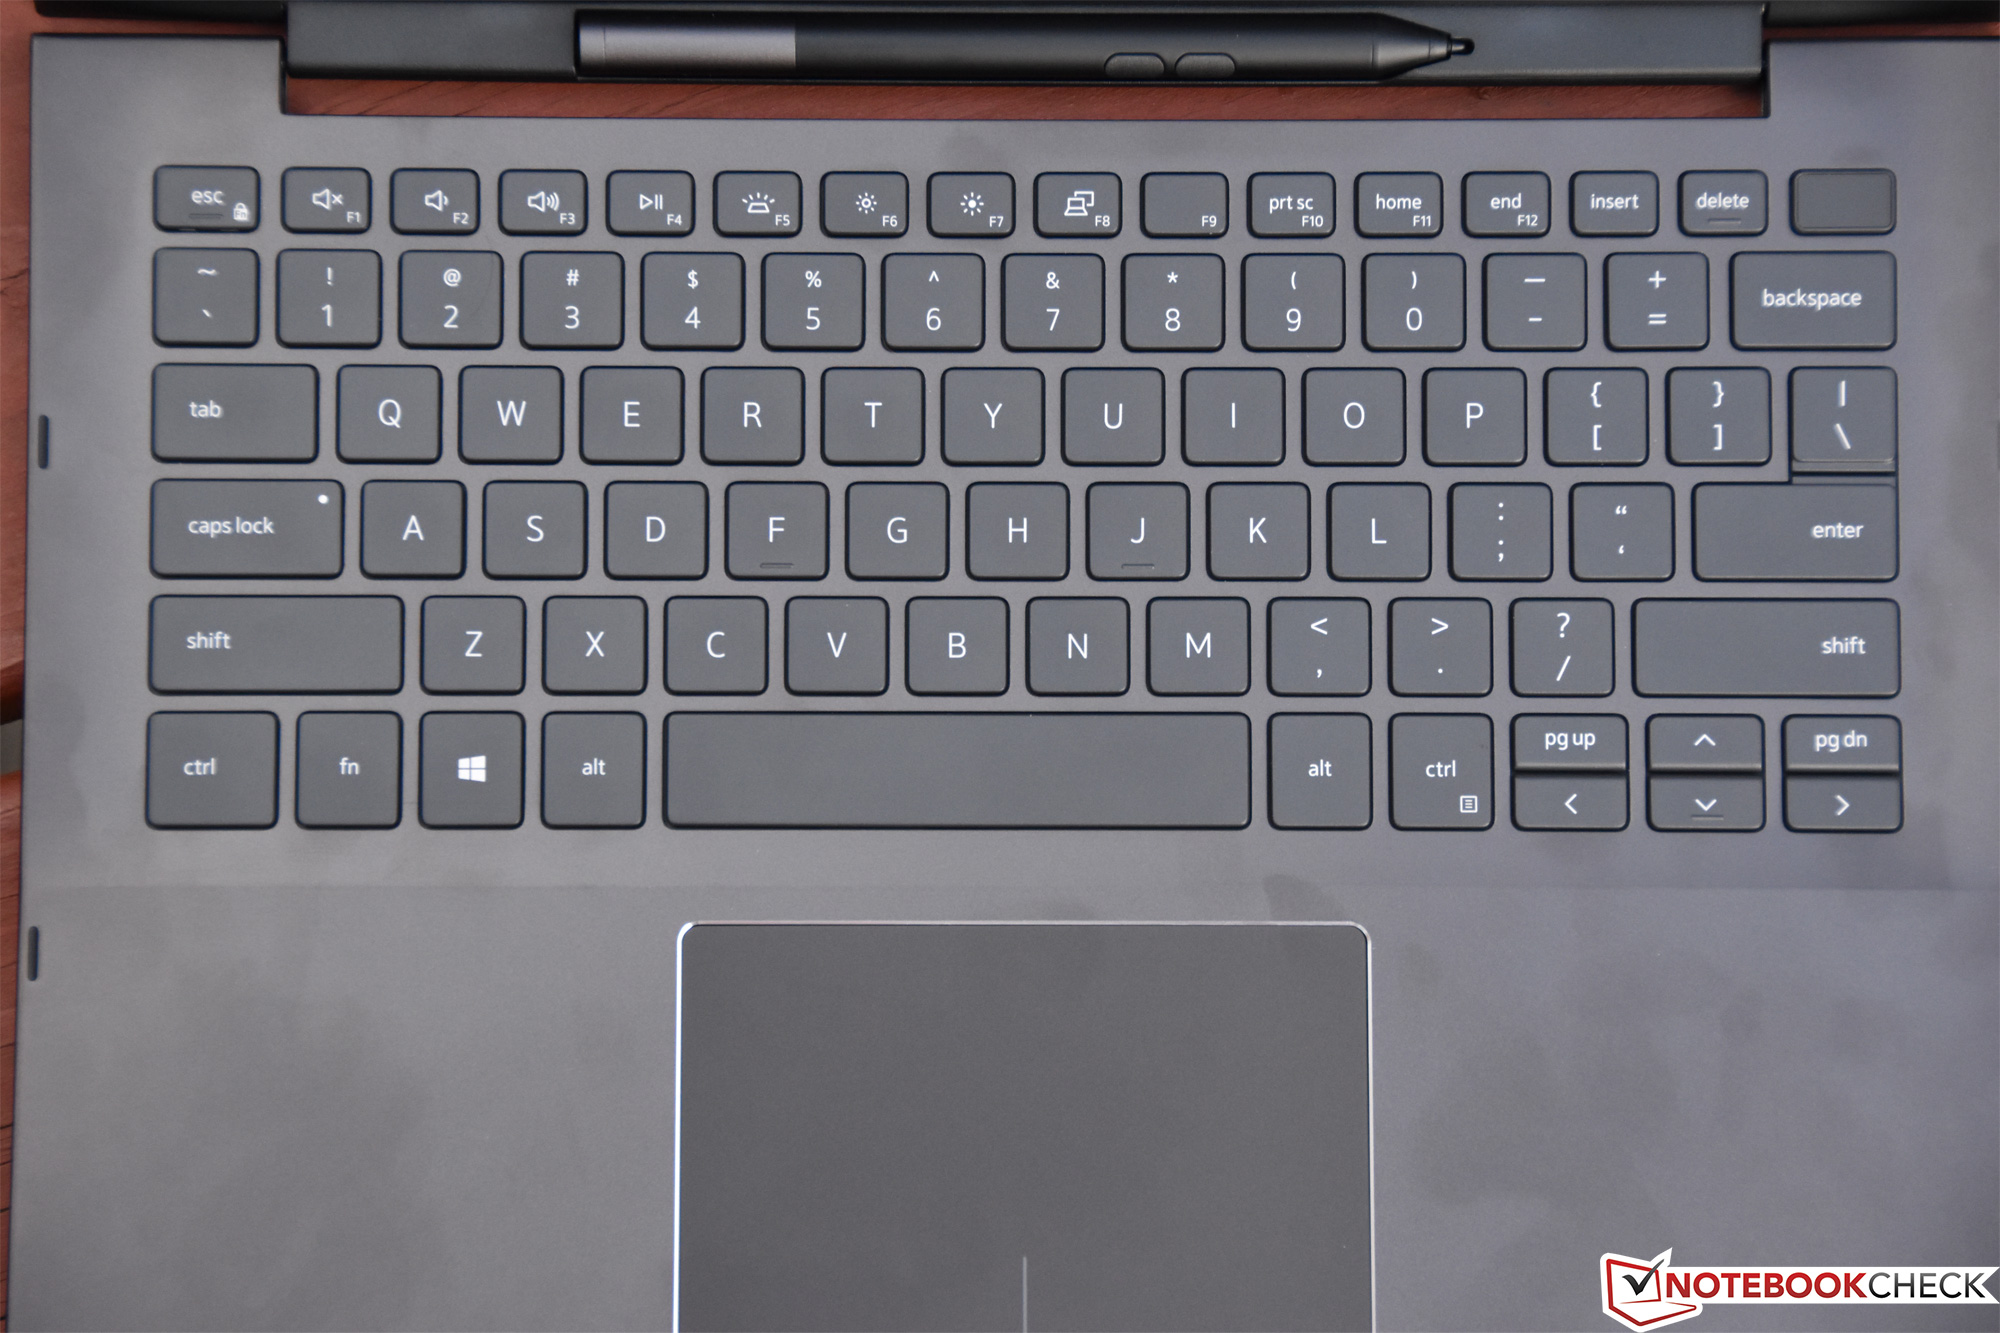
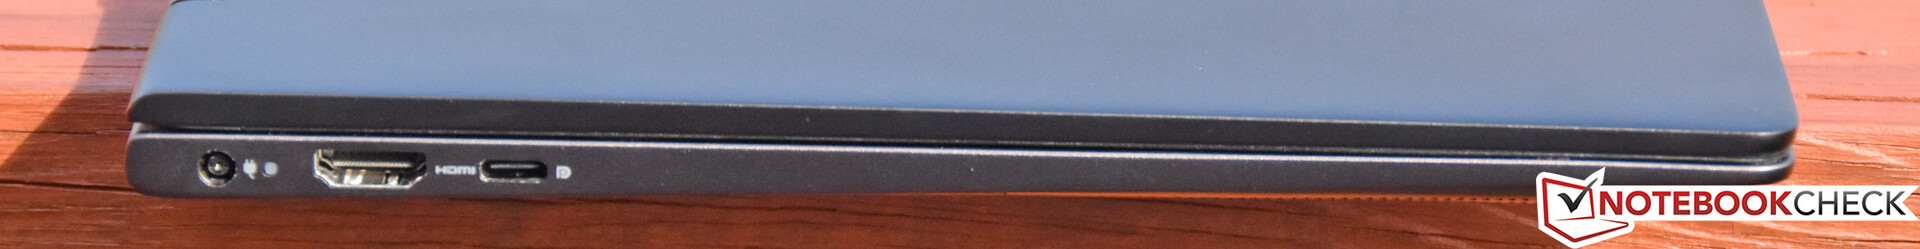
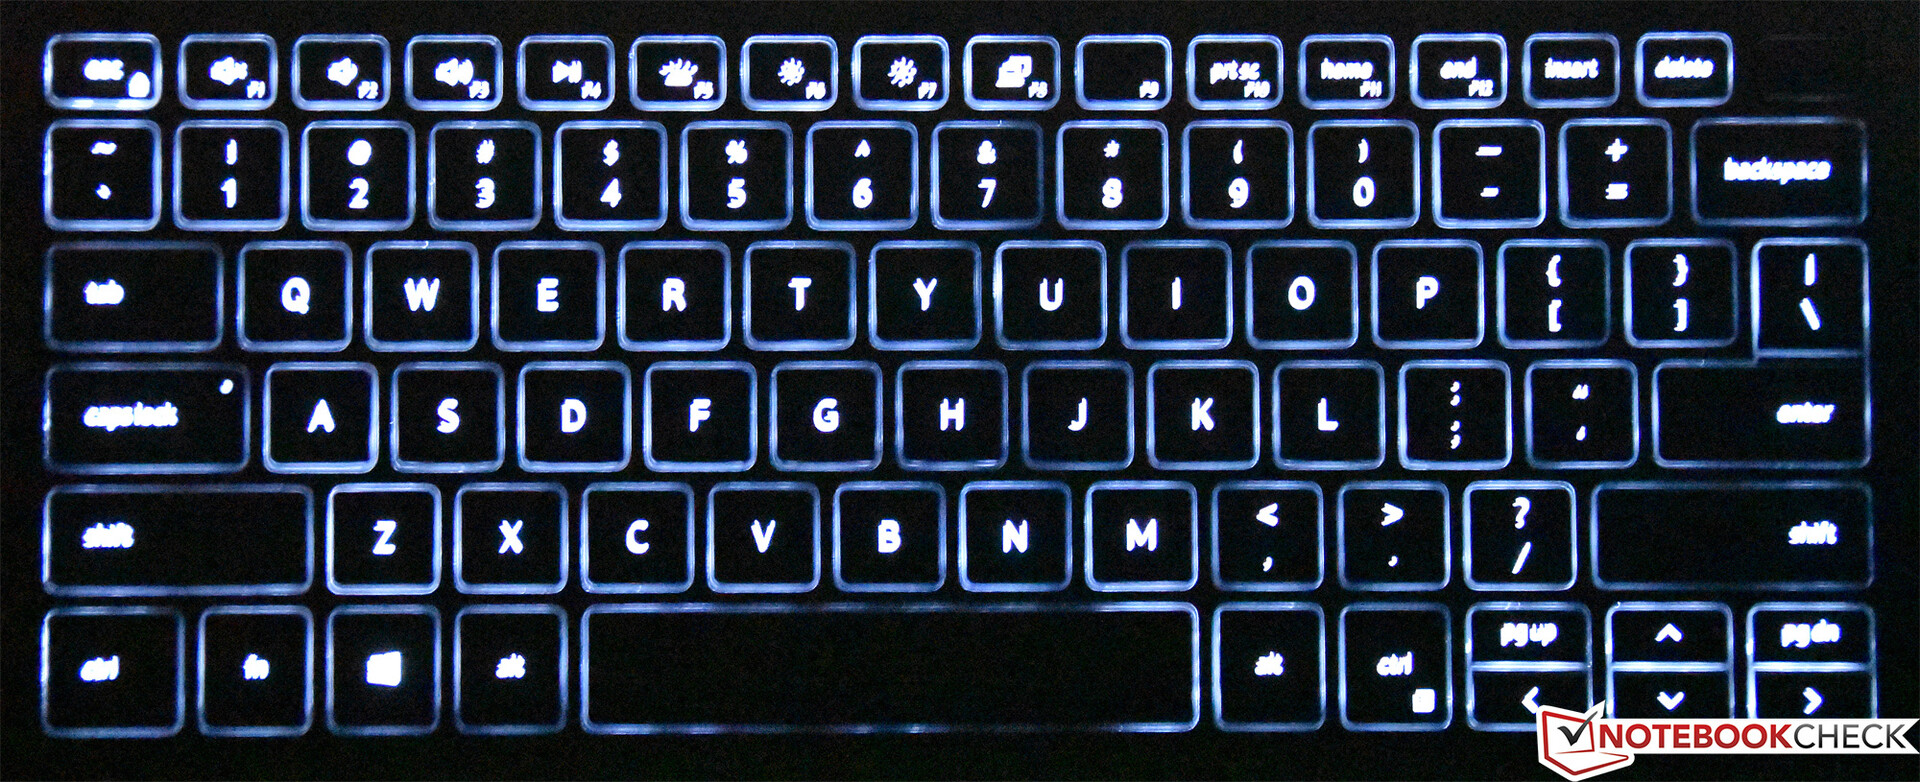
Er zijn nog wel steeds punten van kritiek. De prestaties zijn ondermaats in vergelijking met de resultaten die gepost zijn door cTDP Up concurrenten zoals Lenovo's ThinkBook 13s, die eigenlijk beter zijn. De poortselectie is matig, en de afwezigheid van Thunderbolt 3 en een Kensington Lock poort zullen sommige gebruikers irriteren. Het toetsenbord is redelijk goed, maar feedback en bedieningskracht hadden beter gekund. Evenzo vereisen de geïntegreerde touchpad knoppen veel te veel kracht om in te drukken en worden na een tijdje nogal vermoeiend om te bedienen. Terwijl het scherm zeker mooi is, zou het fijn zijn om een FHD optie te bieden. Deze zou de batterijduur erg verhogen - en bovendien zou de extra schermruimte door de meeste gebruikers toch niet gemist worden.
Een paar concurrenten die overwegen waard zijn zijn de ThinkPad X1 Yoga, HP Envy x360 13, ThinkPad X390 Yoga, en - als je budget wat hoger is - de Latitude 7400 2-in-1. Op de klachten over de invoerapparaten en duurdere processoren die nauwelijks prestatievoordeel bieden na, lijkt de Inspiron 7390 2-in-1 een redelijk alternatief voor de populaire Yoga- en x360-series convertibles en die bovendien zijn voorloper voorbijstreeft.
Dell Inspiron 7390 2-in-1
- 23-08-2019 v6 (old)
Steve Schardein
Price comparison
