Kort testrapport Dell Latitude 7400 2-in-1 (i7-8665U) Convertible
| SD Card Reader | |
| average JPG Copy Test (av. of 3 runs) | |
| Lenovo ThinkPad X1 Yoga 2018-20LES01W00 (Toshiba Exceria Pro M501) | |
| Dell Latitude 7400 2-in-1 (Toshiba Exceria Pro M501 UHS-II) | |
| HP Pavilion x360 14-cd0002ng (Toshiba Exceria Pro SDXC 64 GB UHS-II) | |
| Gemiddelde van klas Convertible (28.1 - 197, n=23, laatste 2 jaar) | |
| Asus ZenBook Flip 14 UX461UA (Toshiba Exceria Pro M501 microSDXC 64GB) | |
| maximum AS SSD Seq Read Test (1GB) | |
| Lenovo ThinkPad X1 Yoga 2018-20LES01W00 (Toshiba Exceria Pro M501) | |
| Dell Latitude 7400 2-in-1 (Toshiba Exceria Pro M501 UHS-II) | |
| Gemiddelde van klas Convertible (28.9 - 254, n=22, laatste 2 jaar) | |
| HP Pavilion x360 14-cd0002ng (Toshiba Exceria Pro SDXC 64 GB UHS-II) | |
| Asus ZenBook Flip 14 UX461UA (Toshiba Exceria Pro M501 microSDXC 64GB) | |
| |||||||||||||||||||||||||
Helderheidsverdeling: 83 %
Helderheid in Batterij-modus: 277.2 cd/m²
Contrast: 1386:1 (Zwart: 0.2 cd/m²)
ΔE ColorChecker Calman: 2.1 | ∀{0.5-29.43 Ø4.73}
calibrated: 1.03
ΔE Greyscale Calman: 3.4 | ∀{0.09-98 Ø4.97}
100% sRGB (Argyll 1.6.3 3D)
64% AdobeRGB 1998 (Argyll 1.6.3 3D)
70% AdobeRGB 1998 (Argyll 3D)
99.6% sRGB (Argyll 3D)
68.6% Display P3 (Argyll 3D)
Gamma: 2.241
CCT: 6030 K
| Dell Latitude 7400 2-in-1 SHP14A2, IPS, 14", 1920x1080 | HP Pavilion x360 14-cd0002ng Chi Mei CMN14D9, IPS, 14", 1920x1080 | Lenovo ThinkPad X1 Yoga 2018-20LES01W00 Lenovo 40AE / B140QAN02.0, IPS Dolby Vision HDR, 14", 2560x1440 | Asus ZenBook Flip 14 UX461UA BOE NV140FHM-N62, IPS, 14", 1920x1080 | HP Elitebook x360 1040 G5 AU Optronics AUO533D, IPS, 14", 1920x1080 | Lenovo ThinkPad X1 Carbon G6-20KG0025UK Lenovo LEN40A9 / AUO B140HAK02.3, IPS, 14", 1920x1080 | |
|---|---|---|---|---|---|---|
| Display | -39% | 23% | -11% | -6% | -2% | |
| Display P3 Coverage (%) | 68.6 | 41.32 -40% | 86.5 26% | 64.4 -6% | 64.3 -6% | 68.3 0% |
| sRGB Coverage (%) | 99.6 | 61.8 -38% | 100 0% | 84.6 -15% | 94.1 -6% | 94.9 -5% |
| AdobeRGB 1998 Coverage (%) | 70 | 42.74 -39% | 99.4 42% | 61.8 -12% | 65.5 -6% | 69.3 -1% |
| Response Times | 21% | 18% | 17% | -9% | 32% | |
| Response Time Grey 50% / Grey 80% * (ms) | 56 ? | 44 ? 21% | 56.8 ? -1% | 44 ? 21% | 70.8 ? -26% | 40 ? 29% |
| Response Time Black / White * (ms) | 38 ? | 30 ? 21% | 24 ? 37% | 33 ? 13% | 34.4 ? 9% | 25 ? 34% |
| PWM Frequency (Hz) | 1667 ? | 2439 ? | 200 ? | 735 ? | ||
| Screen | -51% | 17% | -42% | -4% | 3% | |
| Brightness middle (cd/m²) | 277.2 | 225 -19% | 562 103% | 302 9% | 416.3 50% | 298 8% |
| Brightness (cd/m²) | 263 | 195 -26% | 522 98% | 288 10% | 400 52% | 287 9% |
| Brightness Distribution (%) | 83 | 72 -13% | 86 4% | 90 8% | 89 7% | 91 10% |
| Black Level * (cd/m²) | 0.2 | 0.14 30% | 0.3 -50% | 0.57 -185% | 0.29 -45% | 0.2 -0% |
| Contrast (:1) | 1386 | 1607 16% | 1873 35% | 530 -62% | 1436 4% | 1490 8% |
| Colorchecker dE 2000 * | 2.1 | 5.44 -159% | 2.8 -33% | 5.17 -146% | 2.69 -28% | 2.19 -4% |
| Colorchecker dE 2000 max. * | 5.91 | 20.38 -245% | 5.8 2% | 7.68 -30% | 4.95 16% | 4.39 26% |
| Colorchecker dE 2000 calibrated * | 1.03 | 2.13 -107% | 1.67 -62% | |||
| Greyscale dE 2000 * | 3.4 | 3.98 -17% | 4.5 -32% | 3.26 4% | 2.9 15% | 1.97 42% |
| Gamma | 2.241 98% | 2.32 95% | 2.16 102% | 2.45 90% | 2.4 92% | 2.43 91% |
| CCT | 6030 108% | 6163 105% | 7205 90% | 7142 91% | 6623 98% | 6571 99% |
| Color Space (Percent of AdobeRGB 1998) (%) | 64 | 39 -39% | 88.9 39% | 55 -14% | 60.1 -6% | 62 -3% |
| Color Space (Percent of sRGB) (%) | 100 | 62 -38% | 100 0% | 85 -15% | 94.5 -5% | 95 -5% |
| Totaal Gemiddelde (Programma / Instellingen) | -23% /
-39% | 19% /
18% | -12% /
-28% | -6% /
-5% | 11% /
5% |
* ... kleiner is beter
Responstijd Scherm
| ↔ Responstijd Zwart naar Wit | ||
|---|---|---|
| 38 ms ... stijging ↗ en daling ↘ gecombineerd | ↗ 22.8 ms stijging | 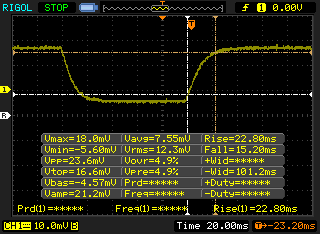 |
| ↘ 15.2 ms daling | ||
| Het scherm vertoonde trage responstijden in onze tests en is misschien te traag voor games. Ter vergelijking: alle testtoestellen variëren van 0.1 (minimum) tot 240 (maximum) ms. » 96 % van alle toestellen zijn beter. Dit betekent dat de gemeten responstijd slechter is dan het gemiddelde (19.9 ms) van alle geteste toestellen. | ||
| ↔ Responstijd 50% Grijs naar 80% Grijs | ||
| 56 ms ... stijging ↗ en daling ↘ gecombineerd | ↗ 31.6 ms stijging | 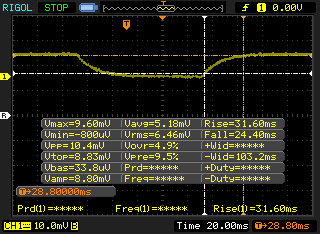 |
| ↘ 24.4 ms daling | ||
| Het scherm vertoonde trage responstijden in onze tests en is misschien te traag voor games. Ter vergelijking: alle testtoestellen variëren van 0.165 (minimum) tot 636 (maximum) ms. » 93 % van alle toestellen zijn beter. Dit betekent dat de gemeten responstijd slechter is dan het gemiddelde (31.1 ms) van alle geteste toestellen. | ||
Screen Flickering / PWM (Pulse-Width Modulation)
| Screen flickering / PWM waargenomen | 1667 Hz | ≤ 24 % helderheid instelling | 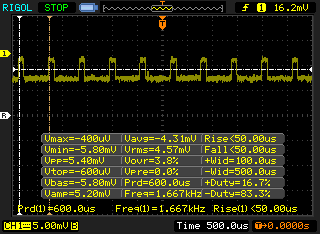 |
De achtergrondverlichting van het scherm flikkert op 1667 Hz (in het slechtste geval, bijvoorbeeld bij gebruik van PWM) aan een helderheid van 24 % en lager. Boven deze helderheid zou er geen flickering / PWM mogen optreden. De frequentie van 1667 Hz is redelijk hoog en de meeste mensen die gevoelig zijn aan flickering zouden dit dus niet mogen waarnemen of geïrriteerde ogen krijgen. Ter vergelijking: 52 % van alle geteste toestellen maakten geen gebruik van PWM om de schermhelderheid te verlagen. Als het wel werd gebruikt, werd een gemiddelde van 7798 (minimum: 5 - maximum: 343500) Hz waargenomen. | |||
* ... kleiner is beter
| PCMark 8 Home Score Accelerated v2 | 3550 punten | |
| PCMark 8 Work Score Accelerated v2 | 4743 punten | |
| PCMark 10 Score | 4060 punten | |
Help | ||
| Dell Latitude 7400 2-in-1 Toshiba XG6 KXG60ZNV512G | Asus ZenBook Flip 14 UX461UA SanDisk SD8SN8U256G1002 | HP Elitebook x360 1040 G5 Samsung SSD PM981 MZVLB512HAJQ | Lenovo ThinkPad X1 Carbon G6-20KG0025UK Lenovo LENSE20256GMSP34MEAT2TA | |
|---|---|---|---|---|
| AS SSD | -27% | 136% | 29% | |
| Seq Read (MB/s) | 2289 | 459.9 -80% | 1816 -21% | 2365 3% |
| Seq Write (MB/s) | 1163 | 388.2 -67% | 1270 9% | 1220 5% |
| 4K Read (MB/s) | 22.29 | 26.93 21% | 46.25 107% | 35.67 60% |
| 4K Write (MB/s) | 28.92 | 50.7 75% | 104.1 260% | 87.6 203% |
| 4K-64 Read (MB/s) | 415.6 | 368.3 -11% | 1342 223% | 446.1 7% |
| 4K-64 Write (MB/s) | 199.5 | 146.4 -27% | 1209 506% | 195.8 -2% |
| Access Time Read * (ms) | 0.122 | 0.123 -1% | 0.043 65% | 0.108 11% |
| Access Time Write * (ms) | 0.143 | 0.086 40% | 0.035 76% | 0.144 -1% |
| Score Read (Points) | 667 | 441 -34% | 1569 135% | 718 8% |
| Score Write (Points) | 345 | 236 -32% | 1440 317% | 405 17% |
| Score Total (Points) | 1300 | 908 -30% | 3790 192% | 1443 11% |
| Copy ISO MB/s (MB/s) | 1767 | 324.1 -82% | 2034 15% | |
| Copy Program MB/s (MB/s) | 379.4 | 118.6 -69% | 450.3 19% | |
| Copy Game MB/s (MB/s) | 1055 | 186.1 -82% | 1024 -3% | |
| CrystalDiskMark 5.2 / 6 | 30% | 168% | 122% | |
| Write 4K (MB/s) | 35.06 | 52.4 49% | 122.7 250% | 116.4 232% |
| Read 4K (MB/s) | 23.64 | 27.91 18% | 46.57 97% | 45.75 94% |
| Write Seq (MB/s) | 1537 | 428.2 -72% | 1725 12% | 455.1 -70% |
| Read Seq (MB/s) | 1782 | 435.9 -76% | 2392 34% | 1818 2% |
| Write 4K Q32T1 (MB/s) | 100.3 | 246 145% | 470.6 369% | 248.9 148% |
| Read 4K Q32T1 (MB/s) | 62.7 | 255.6 308% | 313.2 400% | 358 471% |
| Write Seq Q32T1 (MB/s) | 2698 | 455.6 -83% | 1869 -31% | 1191 -56% |
| Read Seq Q32T1 (MB/s) | 1073 | 554 -48% | 3380 215% | 2755 157% |
| Totaal Gemiddelde (Programma / Instellingen) | 2% /
-6% | 152% /
148% | 76% /
68% |
* ... kleiner is beter

| 3DMark 06 Standard Score | 10985 punten | |
| 3DMark 11 Performance | 1964 punten | |
| 3DMark Cloud Gate Standard Score | 8781 punten | |
| 3DMark Fire Strike Score | 1133 punten | |
Help | ||
| lage | gem. | hoge | ultra | |
|---|---|---|---|---|
| BioShock Infinite (2013) | 56 | 34 | 28 | 17 |
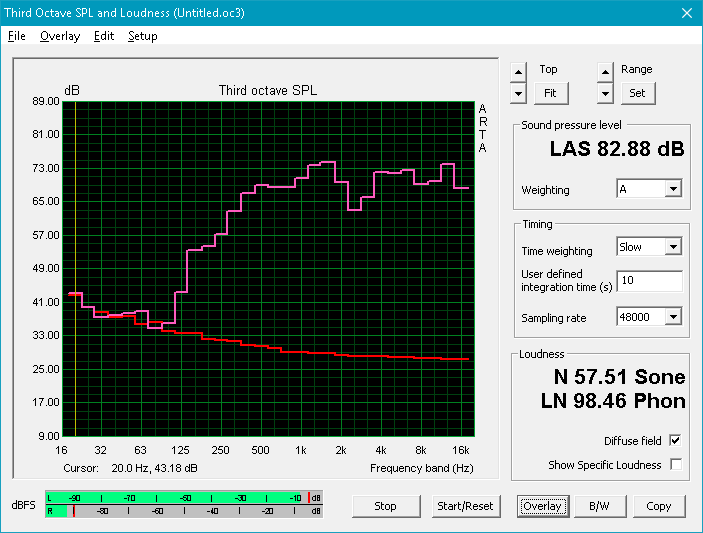
Geluidsniveau
| Onbelast |
| 28.2 / 28.2 / 28.3 dB (A) |
| Belasting |
| 28.2 / 28.8 dB (A) |
 | ||
30 dB stil 40 dB(A) hoorbaar 50 dB(A) luid |
||
min: | ||
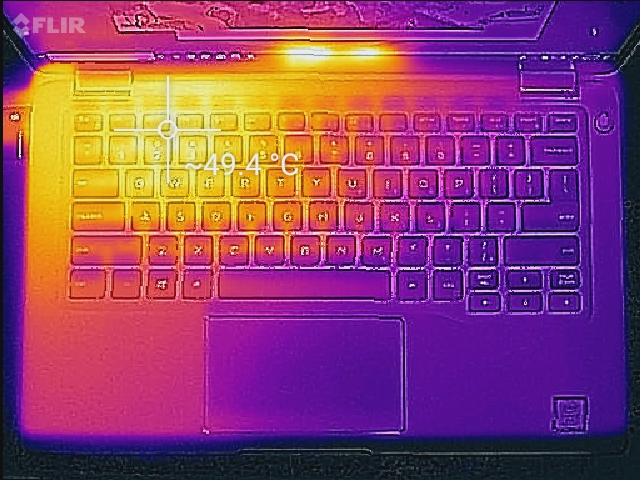
(-) De maximumtemperatuur aan de bovenzijde bedraagt 49.6 °C / 121 F, vergeleken met het gemiddelde van 35.4 °C / 96 F, variërend van 19.6 tot 60 °C voor de klasse Convertible.
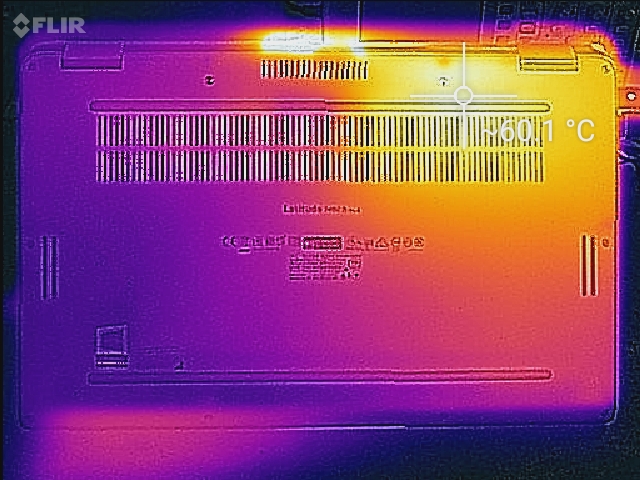
(-) De bodem warmt op tot een maximum van 60.2 °C / 140 F, vergeleken met een gemiddelde van 36.9 °C / 98 F
(+) Bij onbelast gebruik bedraagt de gemiddelde temperatuur voor de bovenzijde 21.5 °C / 71 F, vergeleken met het apparaatgemiddelde van 30.3 °C / 87 F.
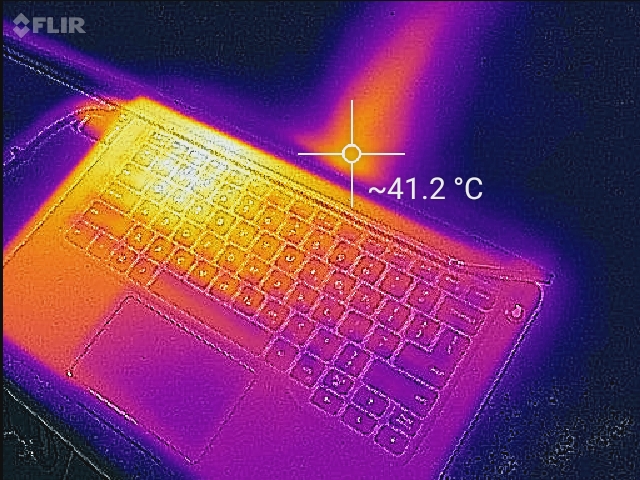
(+) De handpalmsteunen en het touchpad bereiken maximaal de huidtemperatuur (33.8 °C / 92.8 F) en zijn dus niet heet.
(-) De gemiddelde temperatuur van de handpalmsteun van soortgelijke toestellen bedroeg 28 °C / 82.4 F (-5.8 °C / -10.4 F).
Dell Latitude 7400 2-in-1 audioanalyse
(+) | luidsprekers kunnen relatief luid spelen (82.9 dB)
Bas 100 - 315 Hz
(-) | bijna geen lage tonen - gemiddeld 17.3% lager dan de mediaan
(±) | lineariteit van de lage tonen is gemiddeld (11.7% delta ten opzichte van de vorige frequentie)
Midden 400 - 2000 Hz
(+) | evenwichtige middens - slechts 2% verwijderd van de mediaan
(+) | de middentonen zijn lineair (5.3% delta ten opzichte van de vorige frequentie)
Hoog 2 - 16 kHz
(+) | evenwichtige hoogtepunten - slechts 2.9% verwijderd van de mediaan
(±) | lineariteit van de hoogtepunten is gemiddeld (7.3% delta ten opzichte van de vorige frequentie)
Algemeen 100 - 16.000 Hz
(±) | lineariteit van het totale geluid is gemiddeld (17.3% verschil met de mediaan)
Vergeleken met dezelfde klasse
» 33% van alle geteste apparaten in deze klasse waren beter, 8% vergelijkbaar, 59% slechter
» De beste had een delta van 6%, het gemiddelde was 20%, de slechtste was 57%
Vergeleken met alle geteste toestellen
» 32% van alle geteste apparaten waren beter, 8% gelijk, 59% slechter
» De beste had een delta van 4%, het gemiddelde was 24%, de slechtste was 134%
HP Elitebook x360 1040 G5 audioanalyse
(±) | luidspreker luidheid is gemiddeld maar goed (80.9 dB)
Bas 100 - 315 Hz
(±) | verminderde zeebaars - gemiddeld 11.3% lager dan de mediaan
(±) | lineariteit van de lage tonen is gemiddeld (13.7% delta ten opzichte van de vorige frequentie)
Midden 400 - 2000 Hz
(+) | evenwichtige middens - slechts 3.2% verwijderd van de mediaan
(+) | de middentonen zijn lineair (4.8% delta ten opzichte van de vorige frequentie)
Hoog 2 - 16 kHz
(+) | evenwichtige hoogtepunten - slechts 3.6% verwijderd van de mediaan
(±) | lineariteit van de hoogtepunten is gemiddeld (7.2% delta ten opzichte van de vorige frequentie)
Algemeen 100 - 16.000 Hz
(+) | het totale geluid is lineair (13.1% verschil met de mediaan)
Vergeleken met dezelfde klasse
» 7% van alle geteste apparaten in deze klasse waren beter, 2% vergelijkbaar, 92% slechter
» De beste had een delta van 7%, het gemiddelde was 21%, de slechtste was 53%
Vergeleken met alle geteste toestellen
» 13% van alle geteste apparaten waren beter, 3% gelijk, 84% slechter
» De beste had een delta van 4%, het gemiddelde was 24%, de slechtste was 134%
| Uit / Standby | |
| Inactief | |
| Belasting |
|
Key:
min: | |
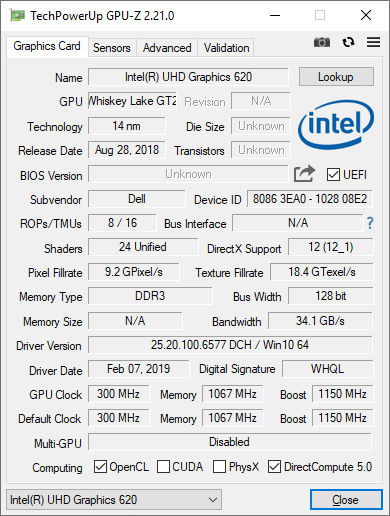
| Dell Latitude 7400 2-in-1 i7-8665U, UHD Graphics 620, Toshiba XG6 KXG60ZNV512G, IPS, 1920x1080, 14" | Lenovo ThinkPad X1 Yoga 2018-20LES01W00 i5-8550U, UHD Graphics 620, Samsung SSD PM981 MZVLB512HAJQ, IPS Dolby Vision HDR, 2560x1440, 14" | Asus ZenBook Flip 14 UX461UA i5-8250U, UHD Graphics 620, SanDisk SD8SN8U256G1002, IPS, 1920x1080, 14" | HP Elitebook x360 1040 G5 i7-8650U, UHD Graphics 620, Samsung SSD PM981 MZVLB512HAJQ, IPS, 1920x1080, 14" | Lenovo ThinkPad X1 Carbon G6-20KG0025UK i5-8350U, UHD Graphics 620, Lenovo LENSE20256GMSP34MEAT2TA, IPS, 1920x1080, 14" | |
|---|---|---|---|---|---|
| Power Consumption | -60% | -23% | -30% | -29% | |
| Idle Minimum * (Watt) | 2.6 | 3.4 -31% | 3.3 -27% | 2.7 -4% | 4.7 -81% |
| Idle Average * (Watt) | 4.3 | 8.8 -105% | 6.3 -47% | 6.5 -51% | 7.3 -70% |
| Idle Maximum * (Watt) | 5.5 | 11.9 -116% | 11 -100% | 11.5 -109% | 9.4 -71% |
| Load Average * (Watt) | 32 | 50.4 -58% | 30 6% | 38.7 -21% | 28 12% |
| Load Maximum * (Watt) | 78.8 | 71.2 10% | 35.4 55% | 50.5 36% | 28.2 64% |
* ... kleiner is beter
| Dell Latitude 7400 2-in-1 i7-8665U, UHD Graphics 620, 78 Wh | HP Pavilion x360 14-cd0002ng i3-8130U, UHD Graphics 620, 41 Wh | Lenovo ThinkPad X1 Yoga 2018-20LES01W00 i5-8550U, UHD Graphics 620, 54 Wh | Asus ZenBook Flip 14 UX461UA i5-8250U, UHD Graphics 620, 57 Wh | HP Elitebook x360 1040 G5 i7-8650U, UHD Graphics 620, 56 Wh | Lenovo ThinkPad X1 Carbon G6-20KG0025UK i5-8350U, UHD Graphics 620, 57 Wh | |
|---|---|---|---|---|---|---|
| Batterijduur | -39% | -30% | -23% | -15% | -15% | |
| WiFi v1.3 (h) | 12.2 | 7.4 -39% | 8.6 -30% | 9.4 -23% | 10.4 -15% | 10.4 -15% |
| Reader / Idle (h) | 12.7 | 20.1 | 18.9 | 27.9 | 24.5 | |
| Load (h) | 2.1 | 1.5 | 2.1 | 3.1 | 1.9 |
Pro
Contra
Dit is de verkorte versie van het originele artikel. Het volledige, Engelse testrapport vind je hier.
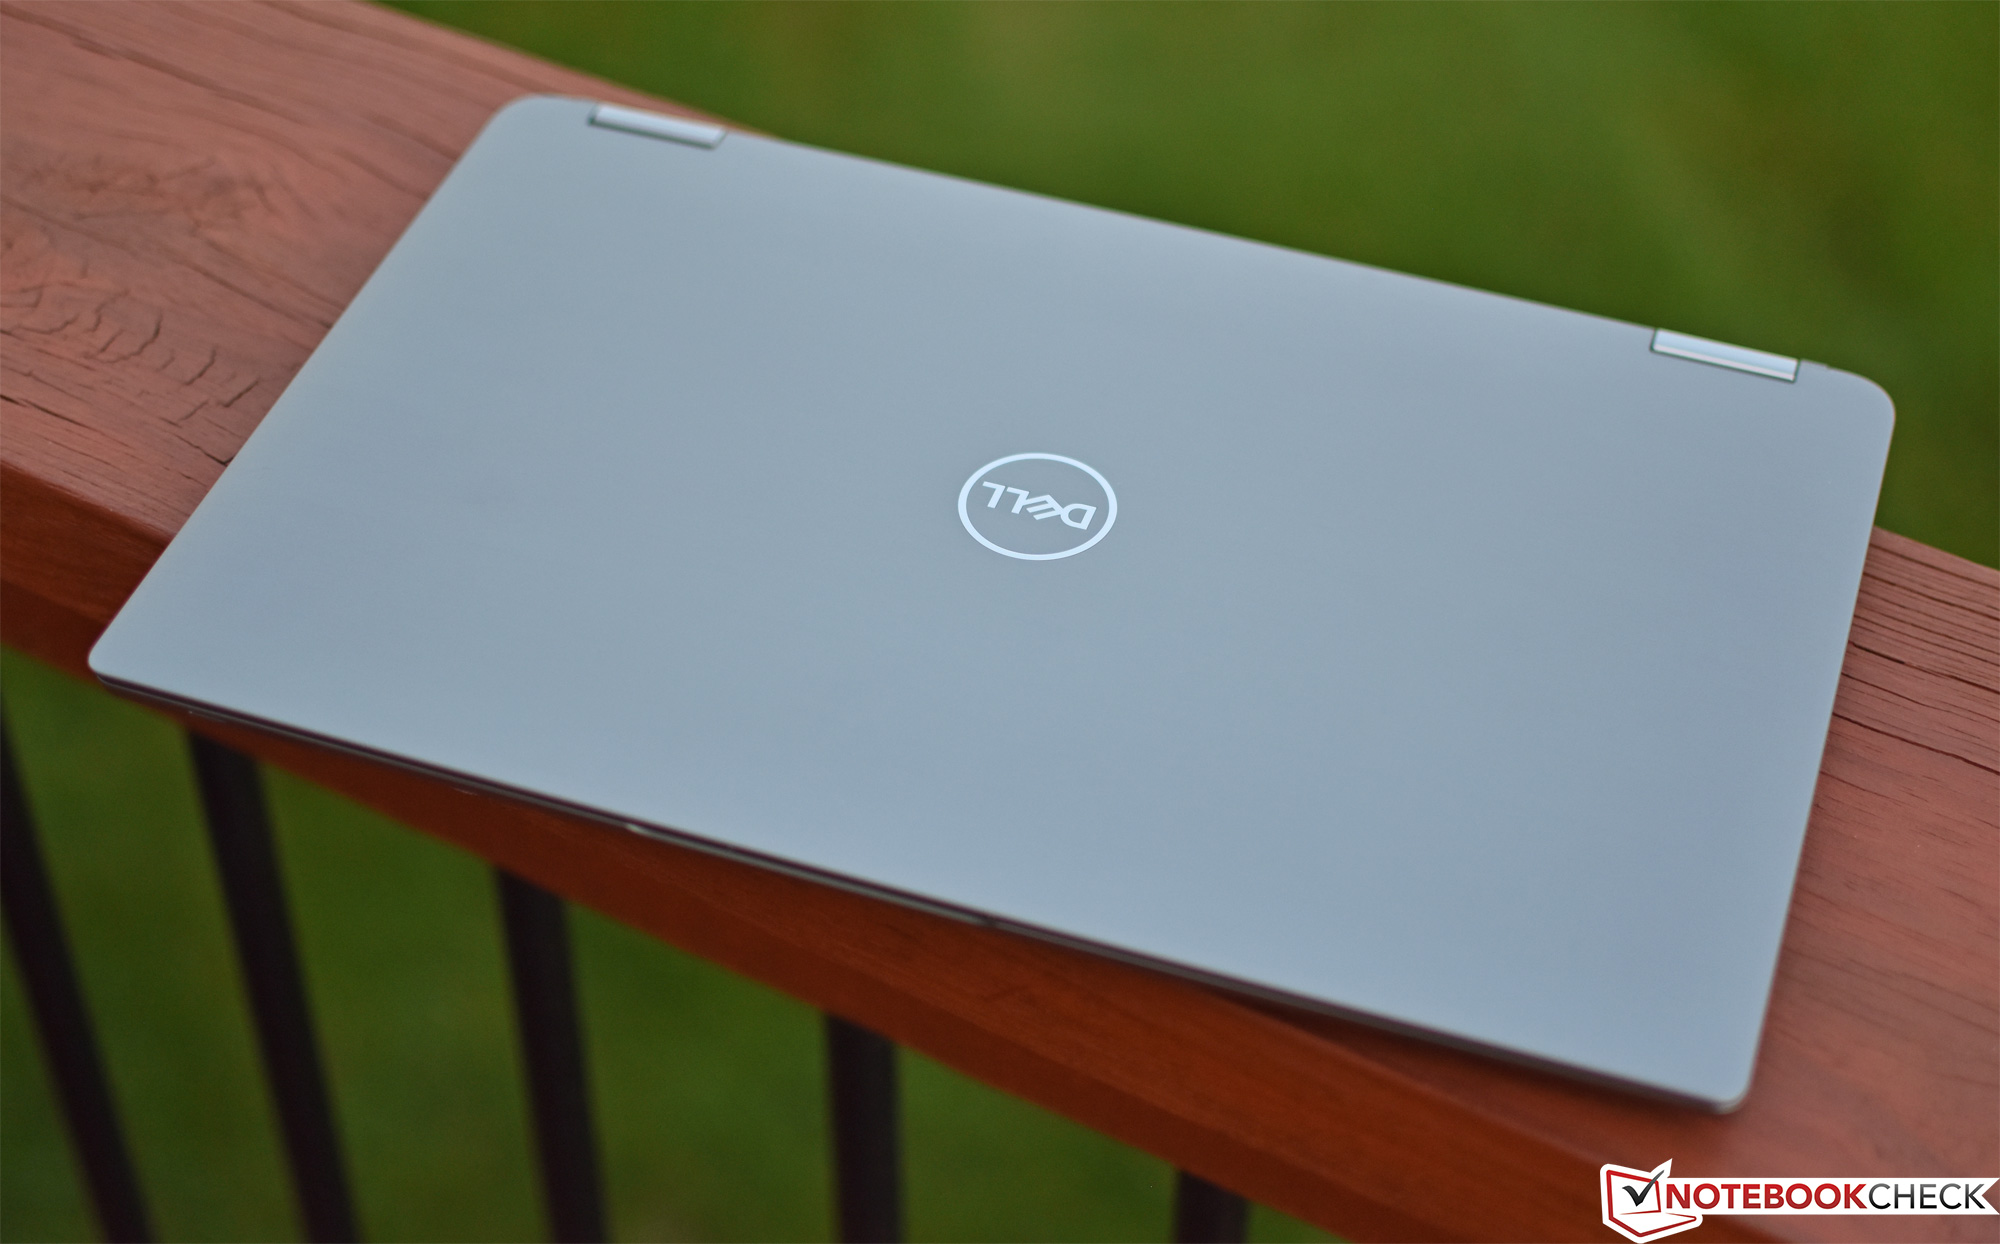
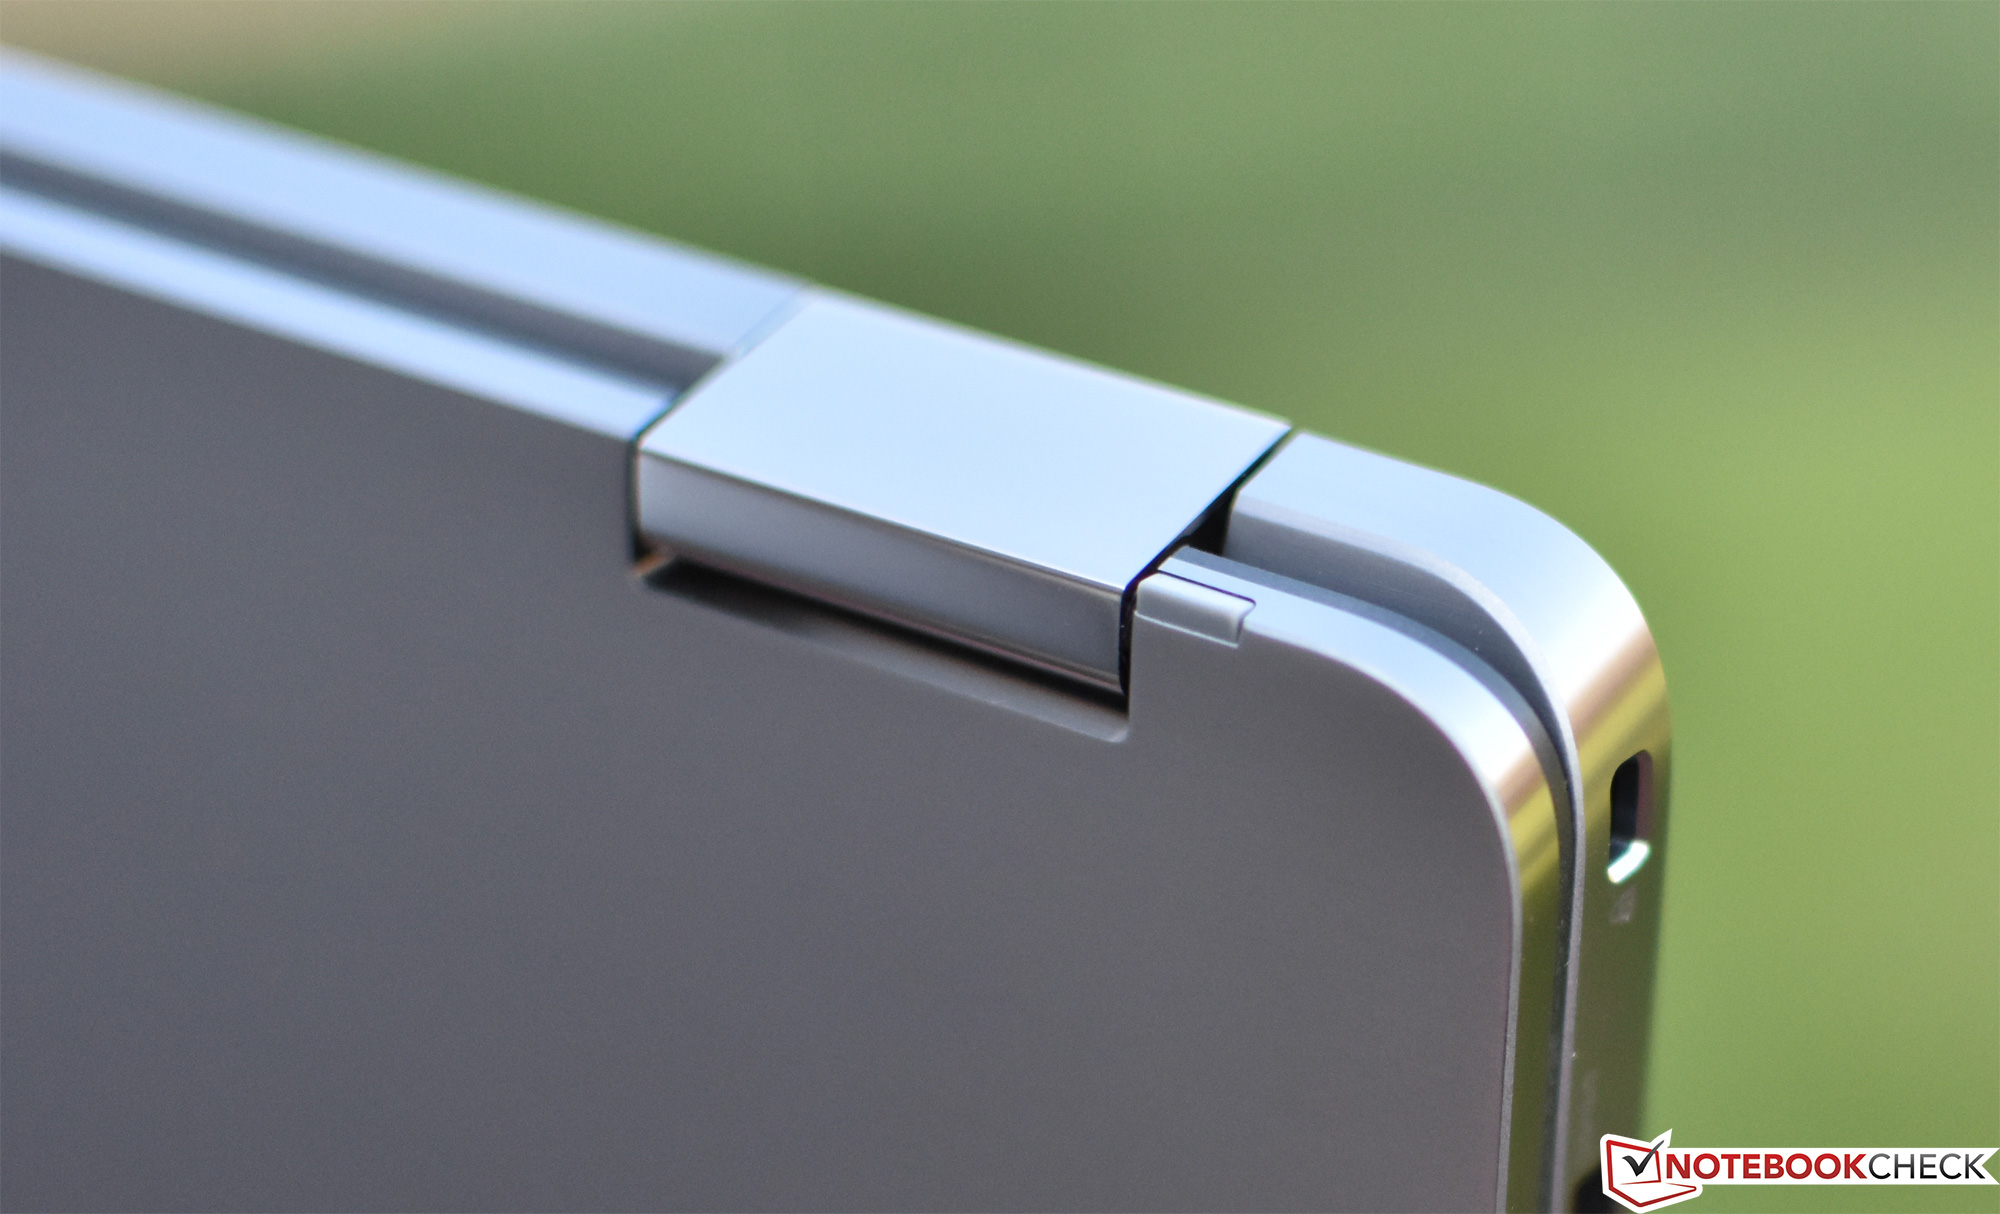
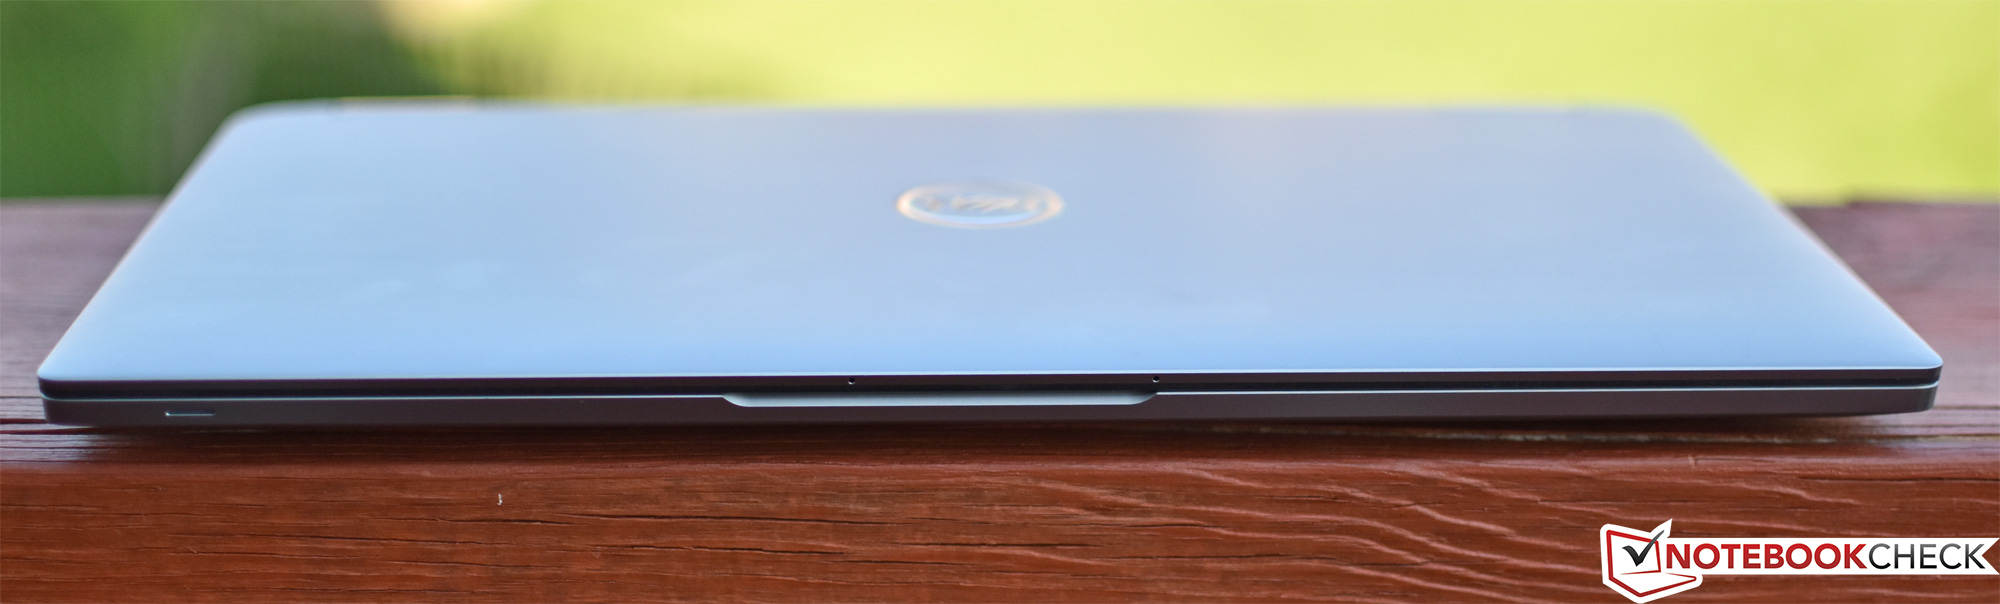
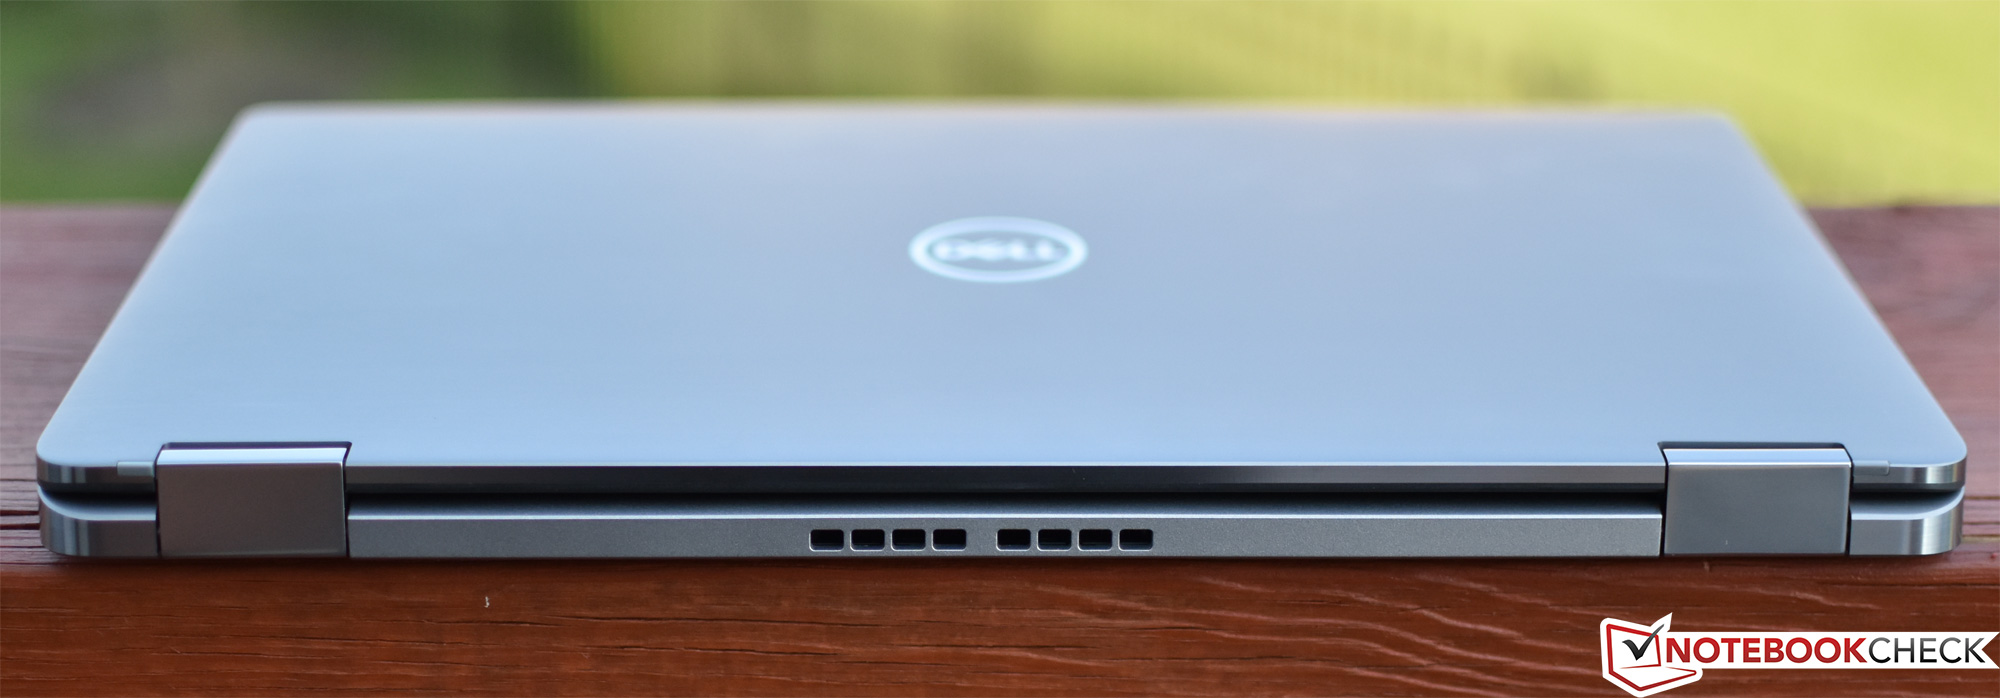
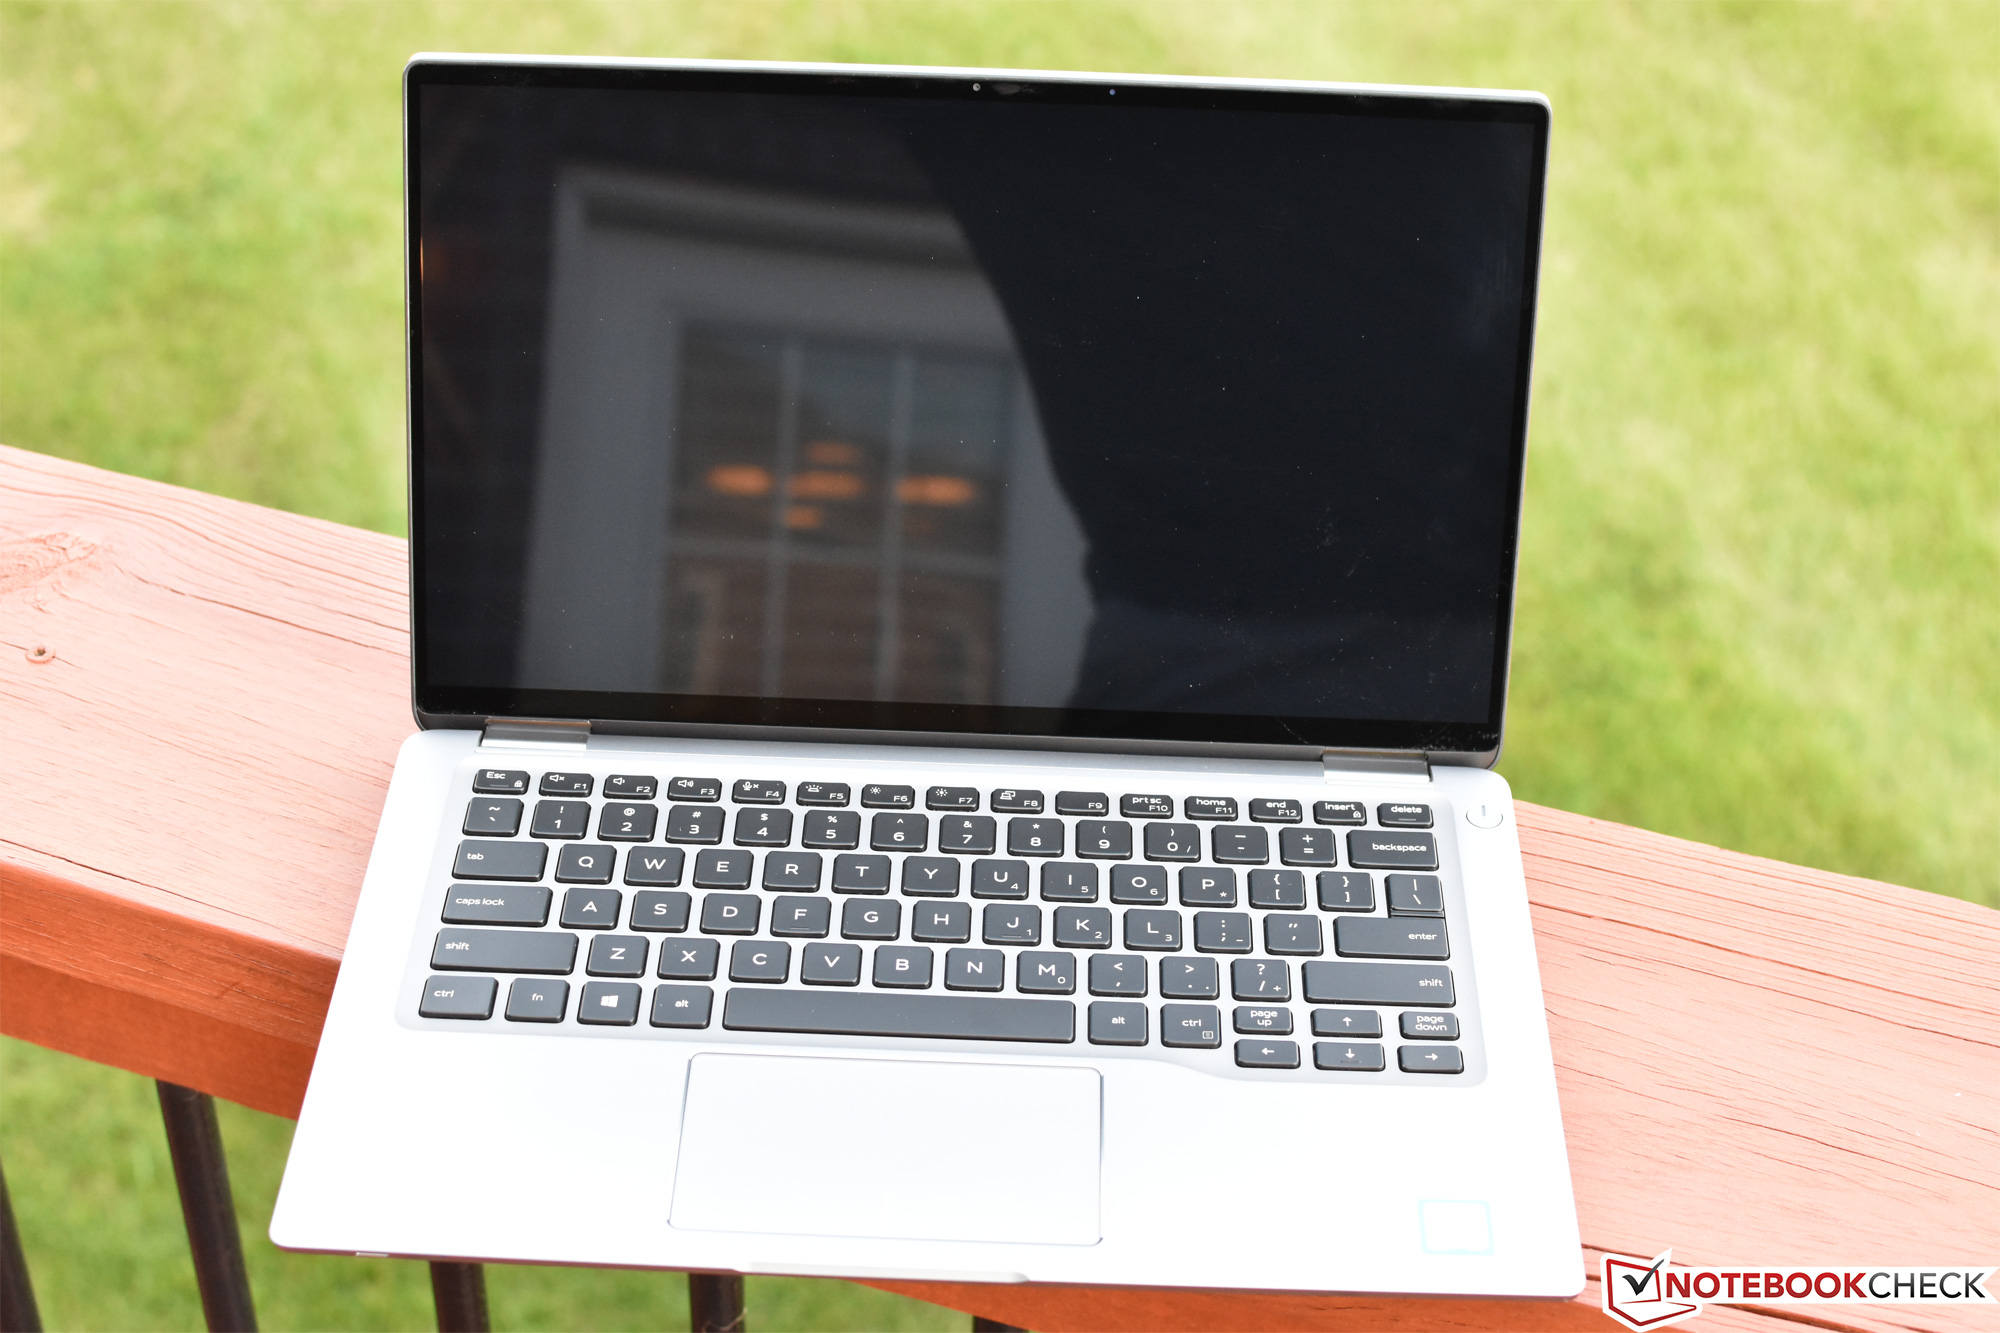
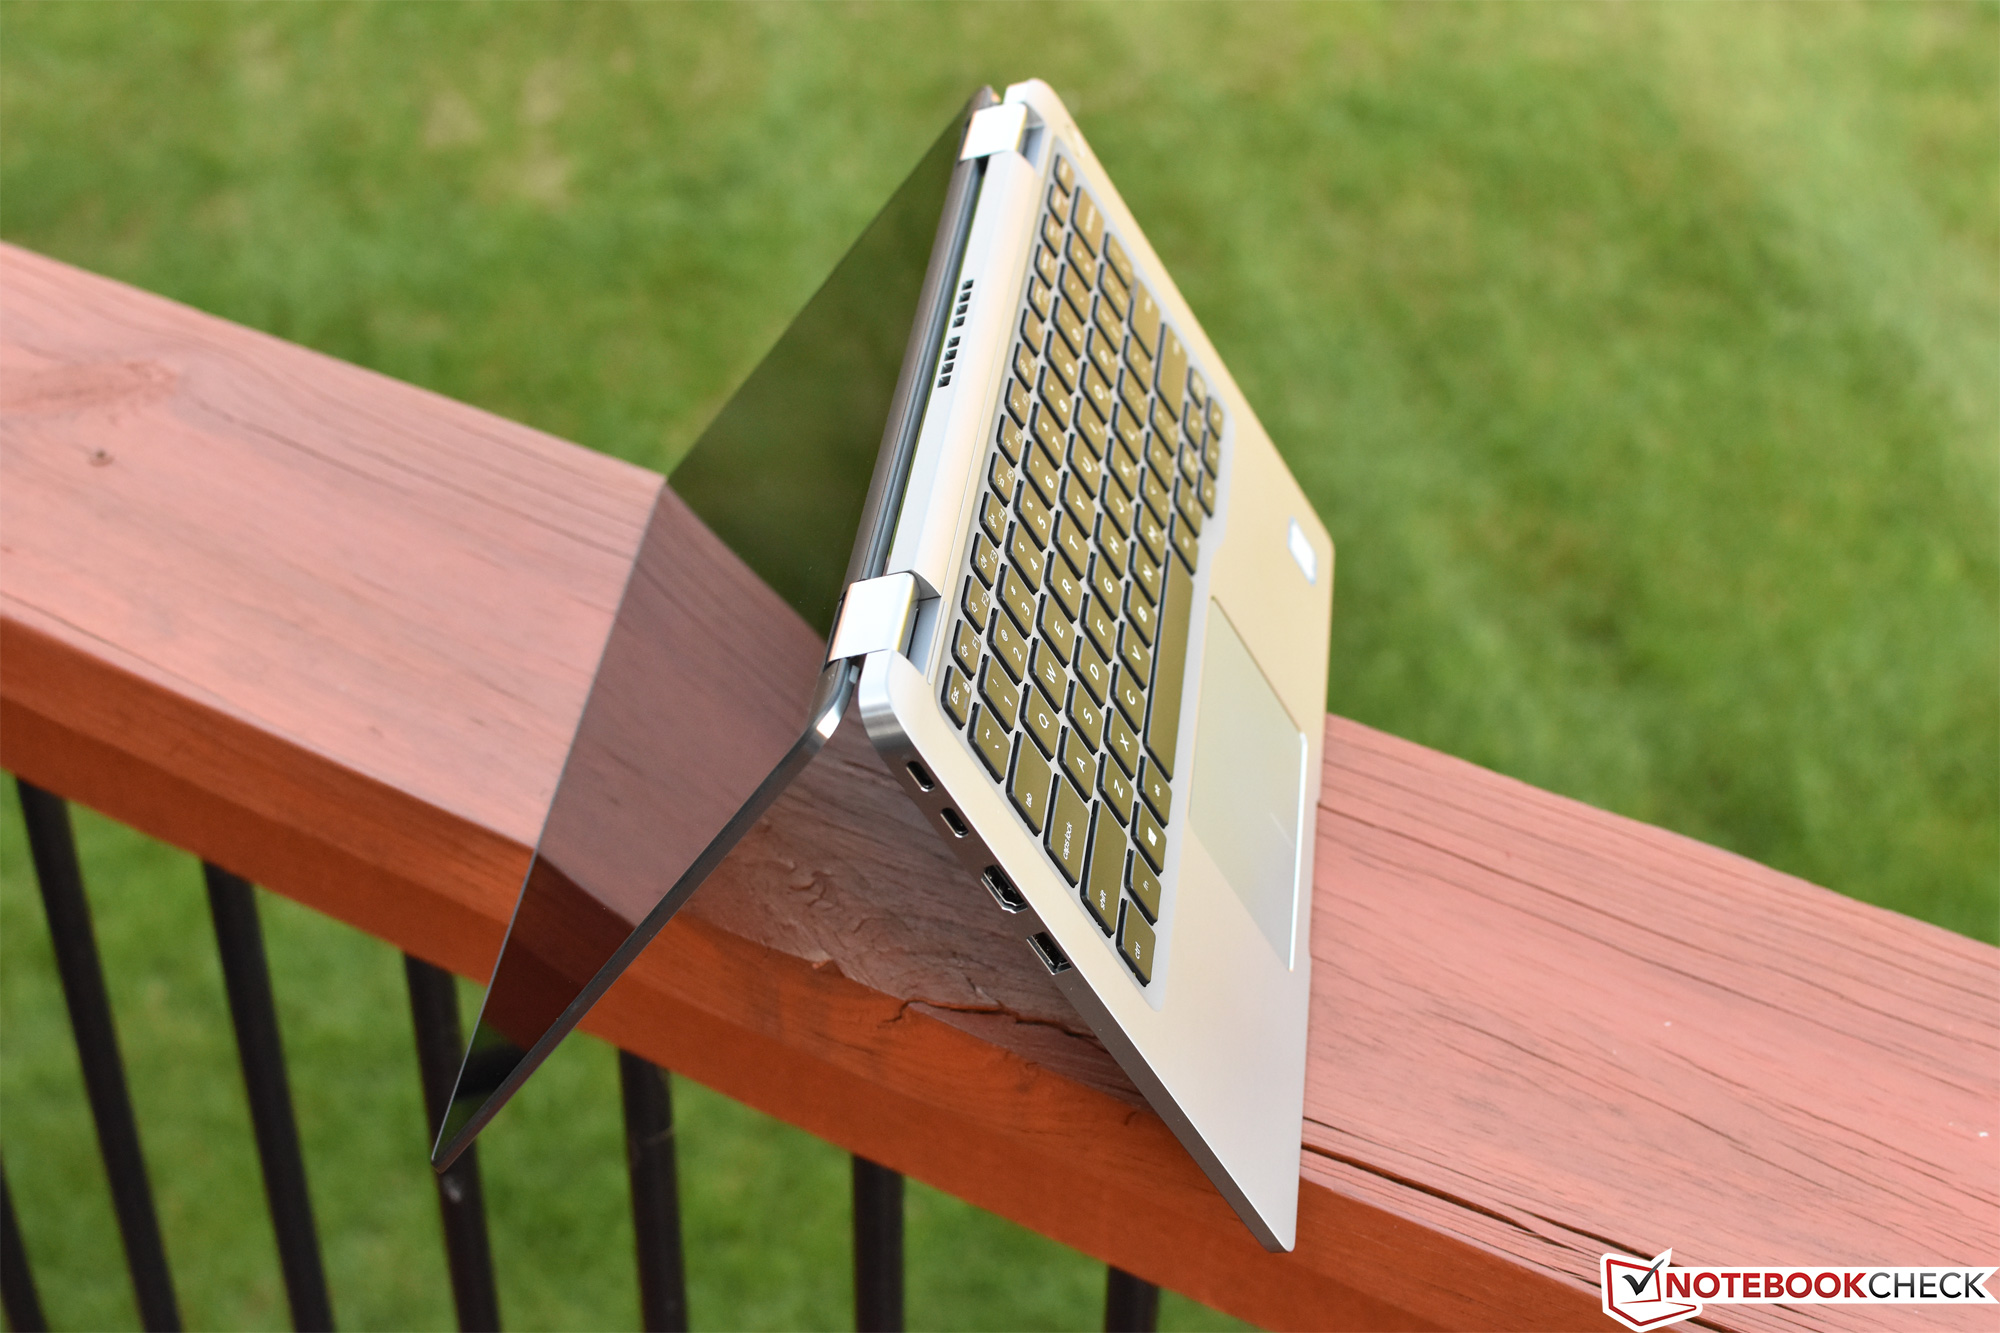
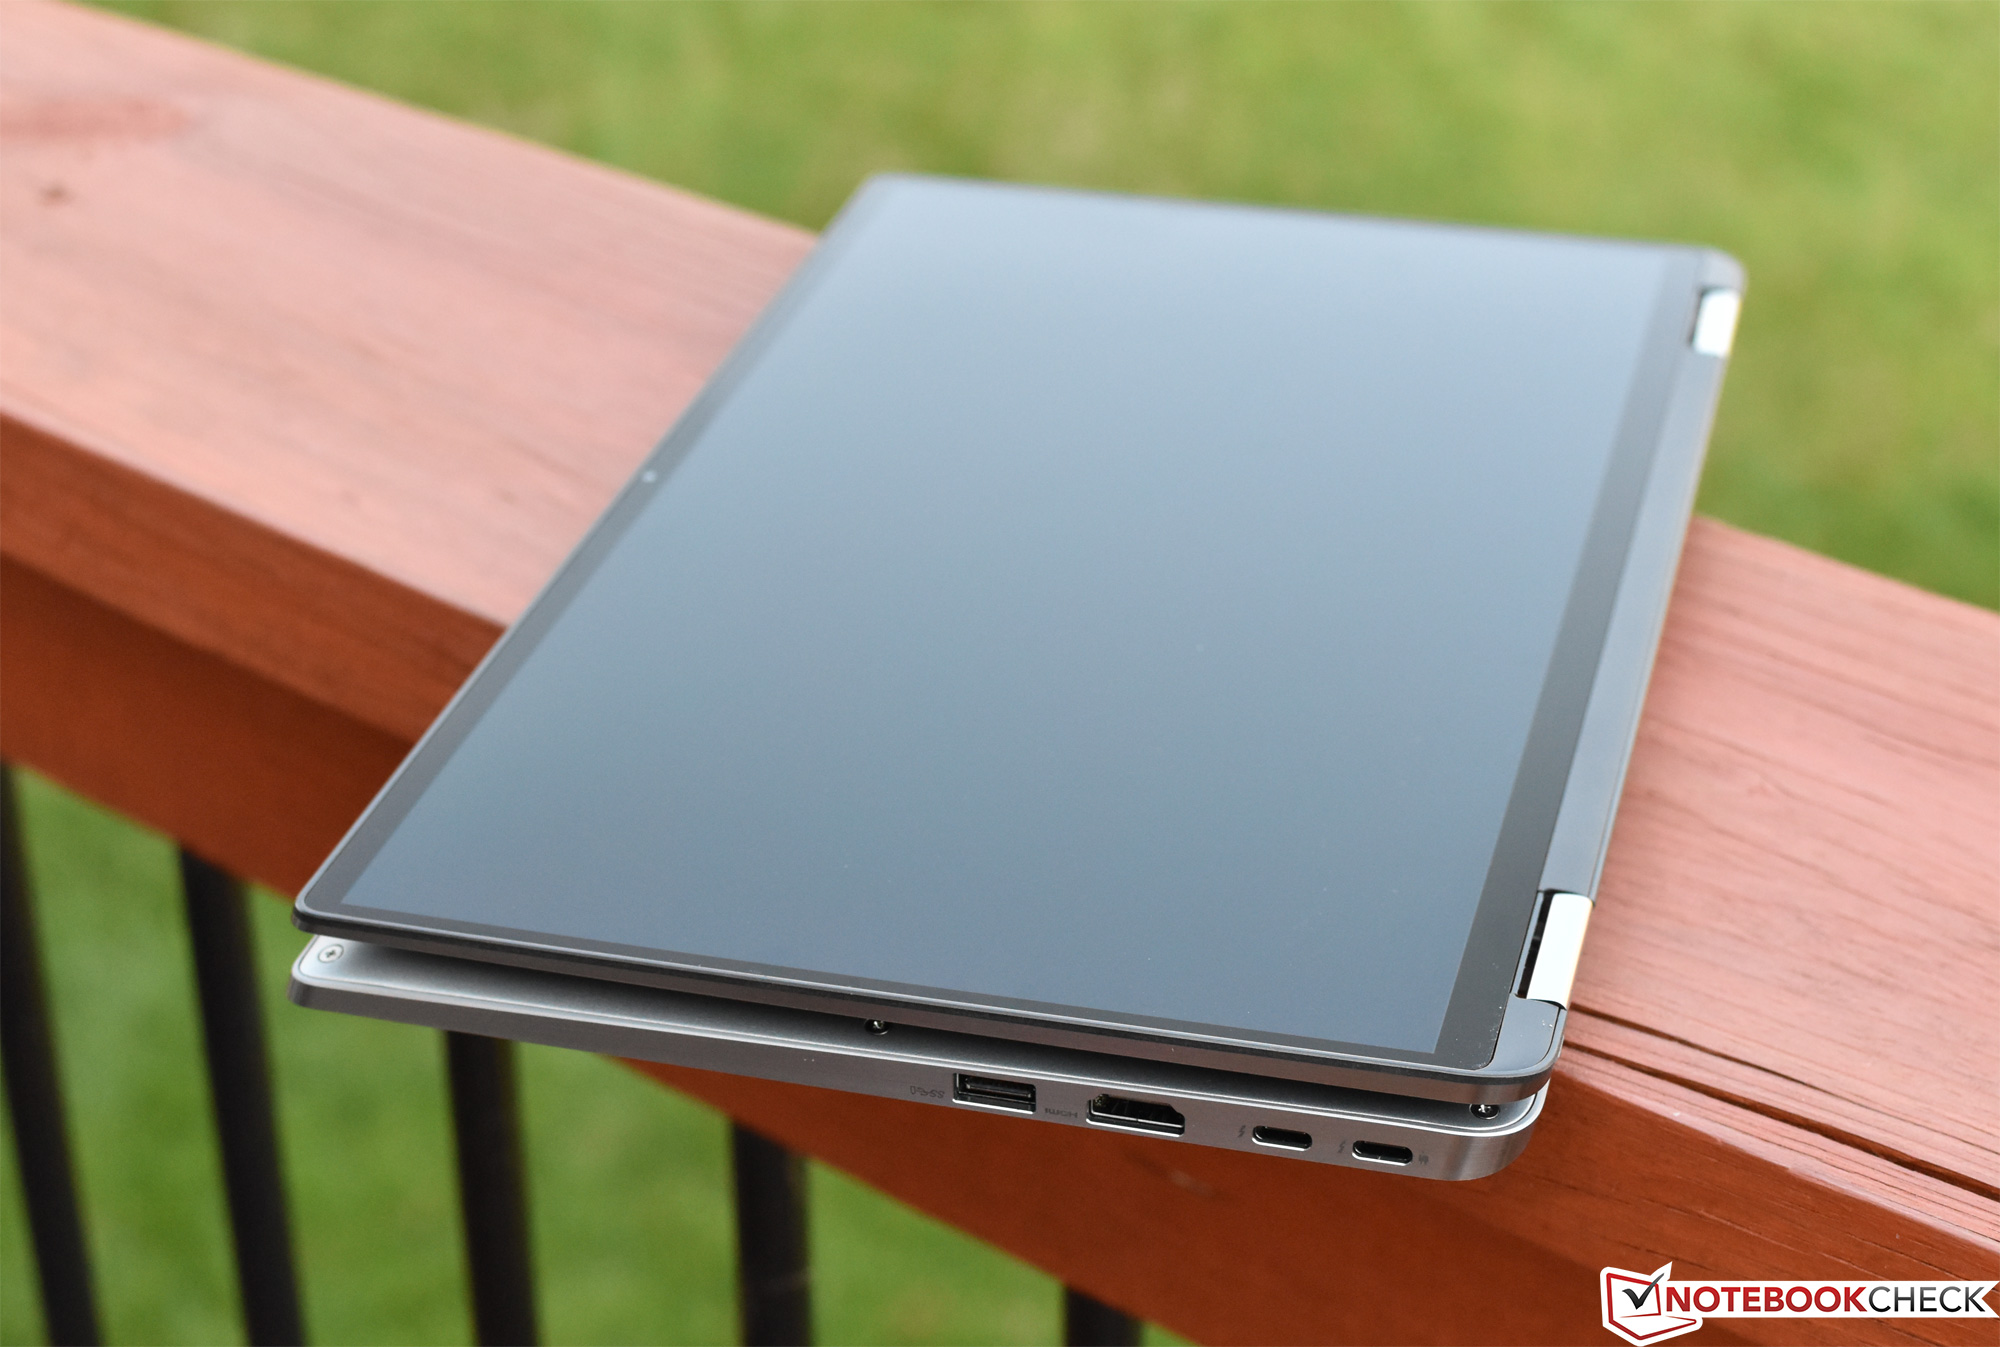
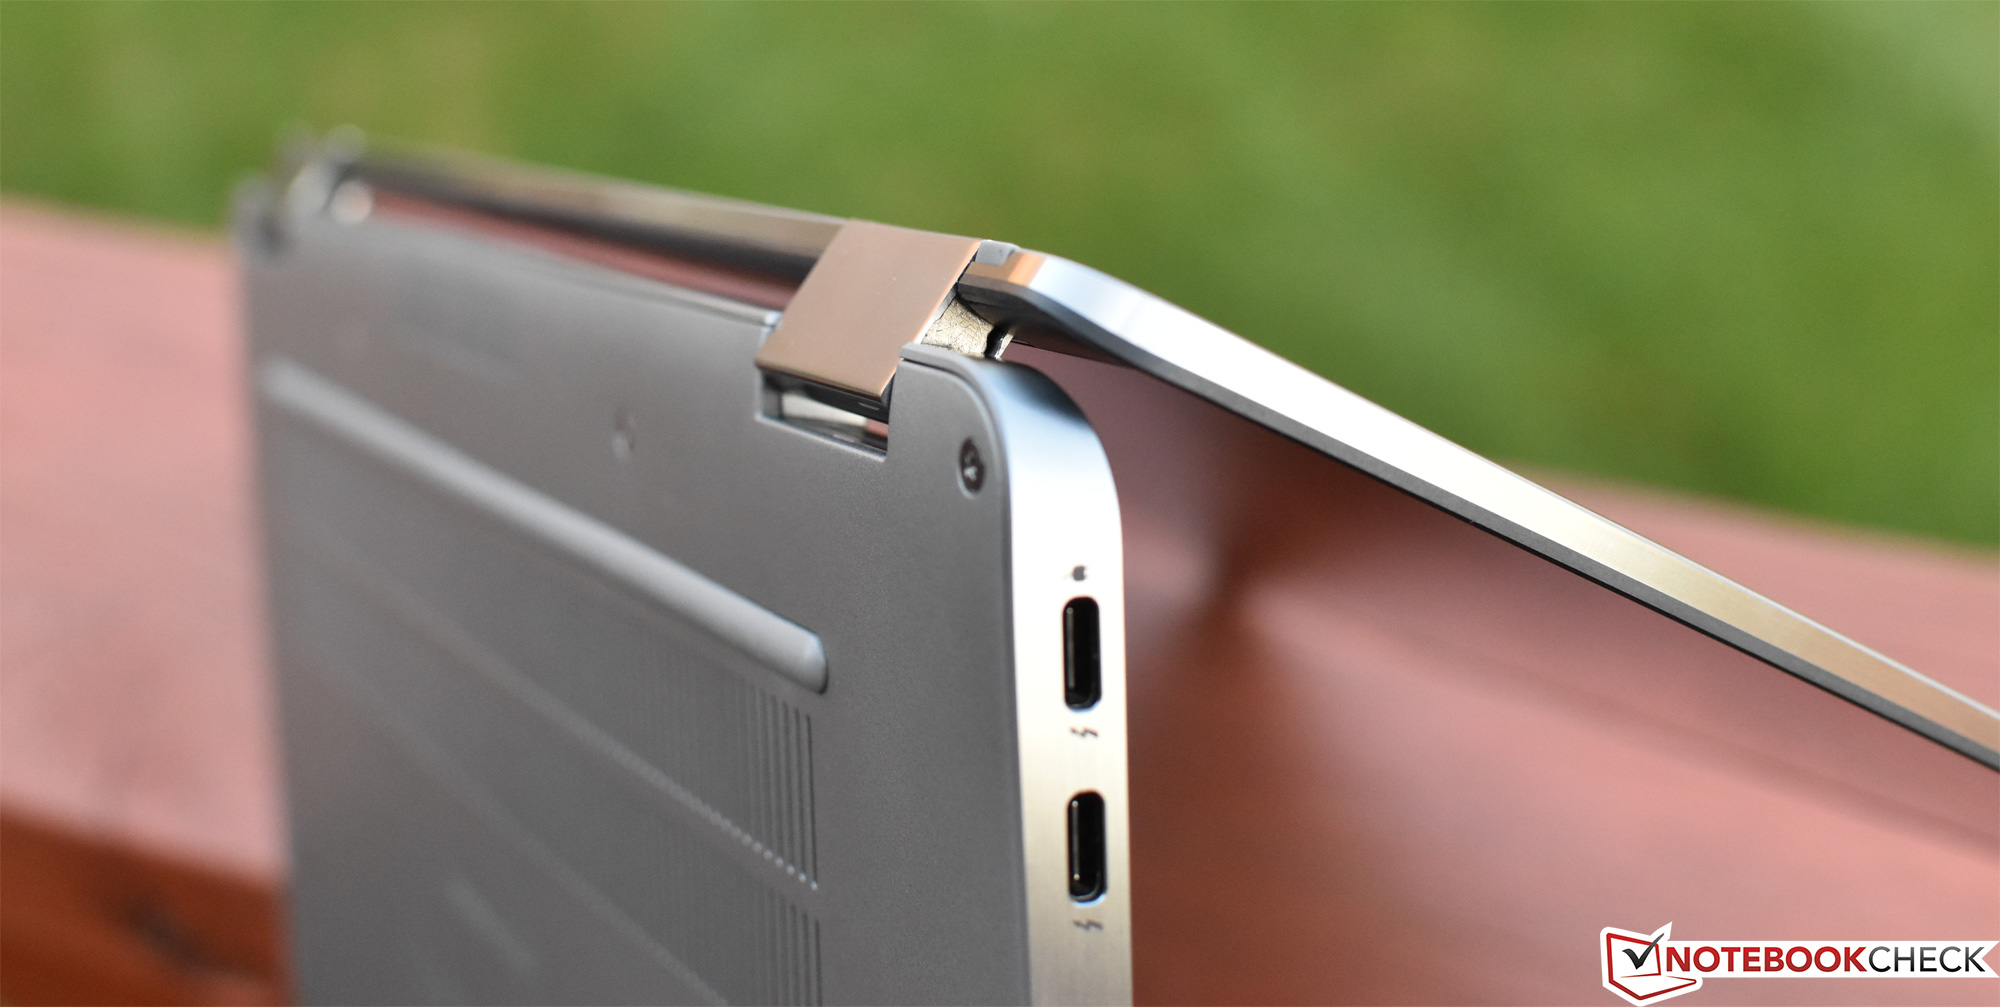
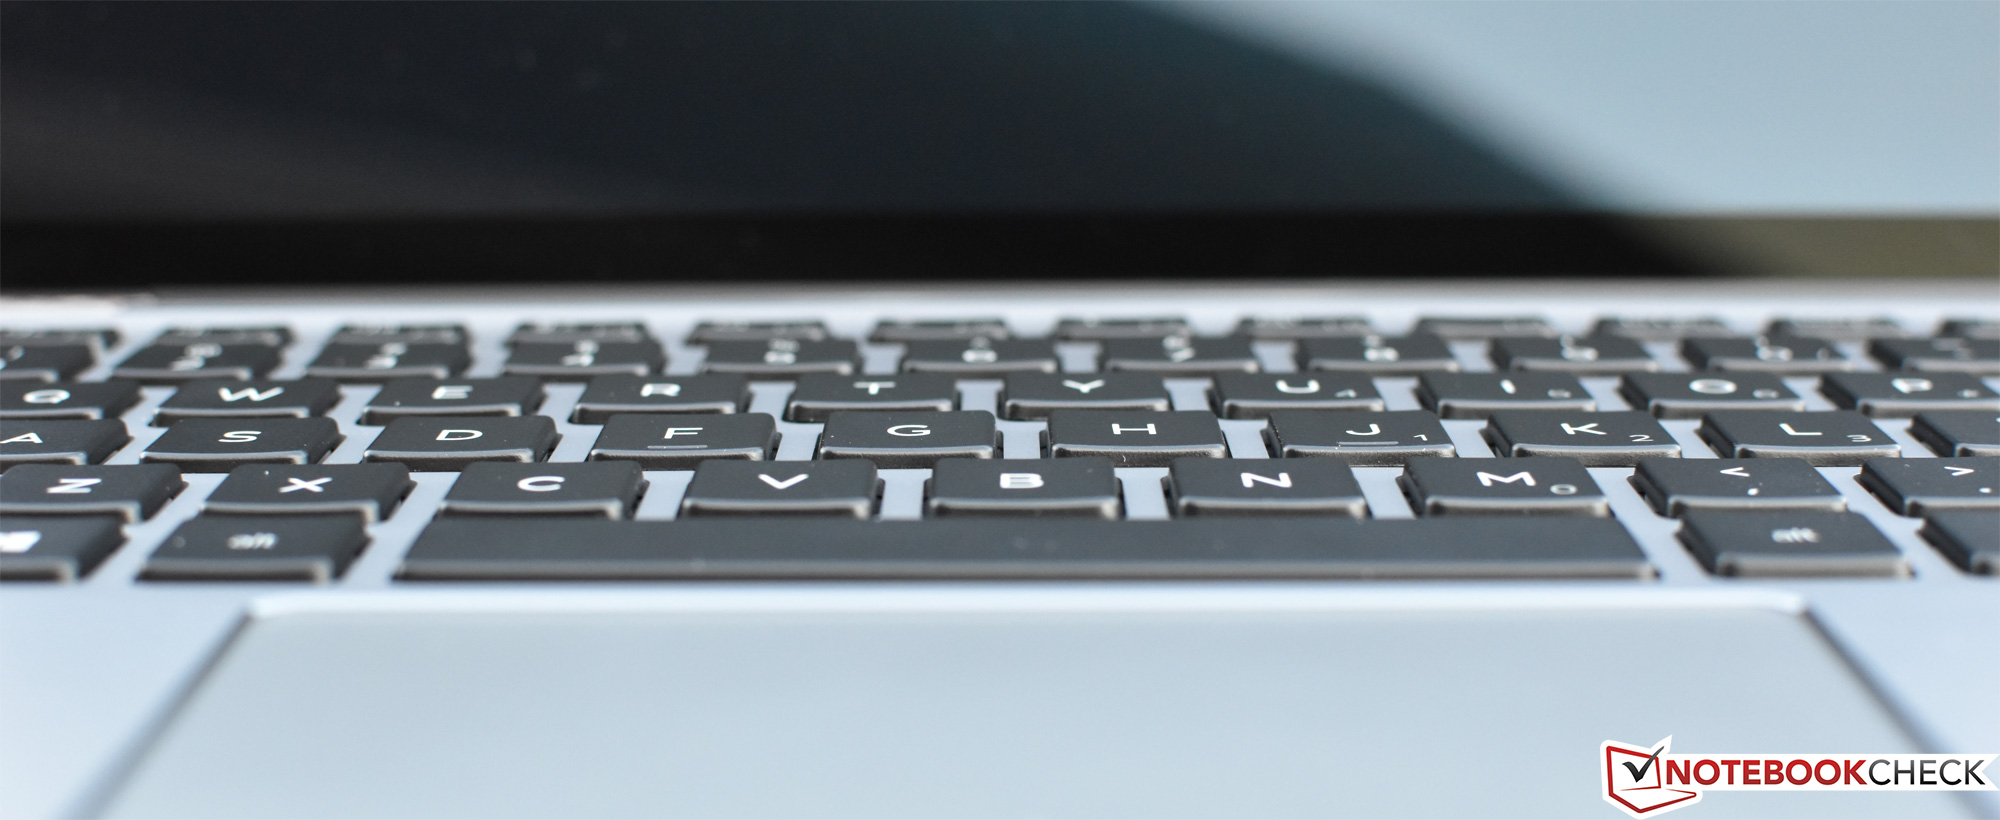
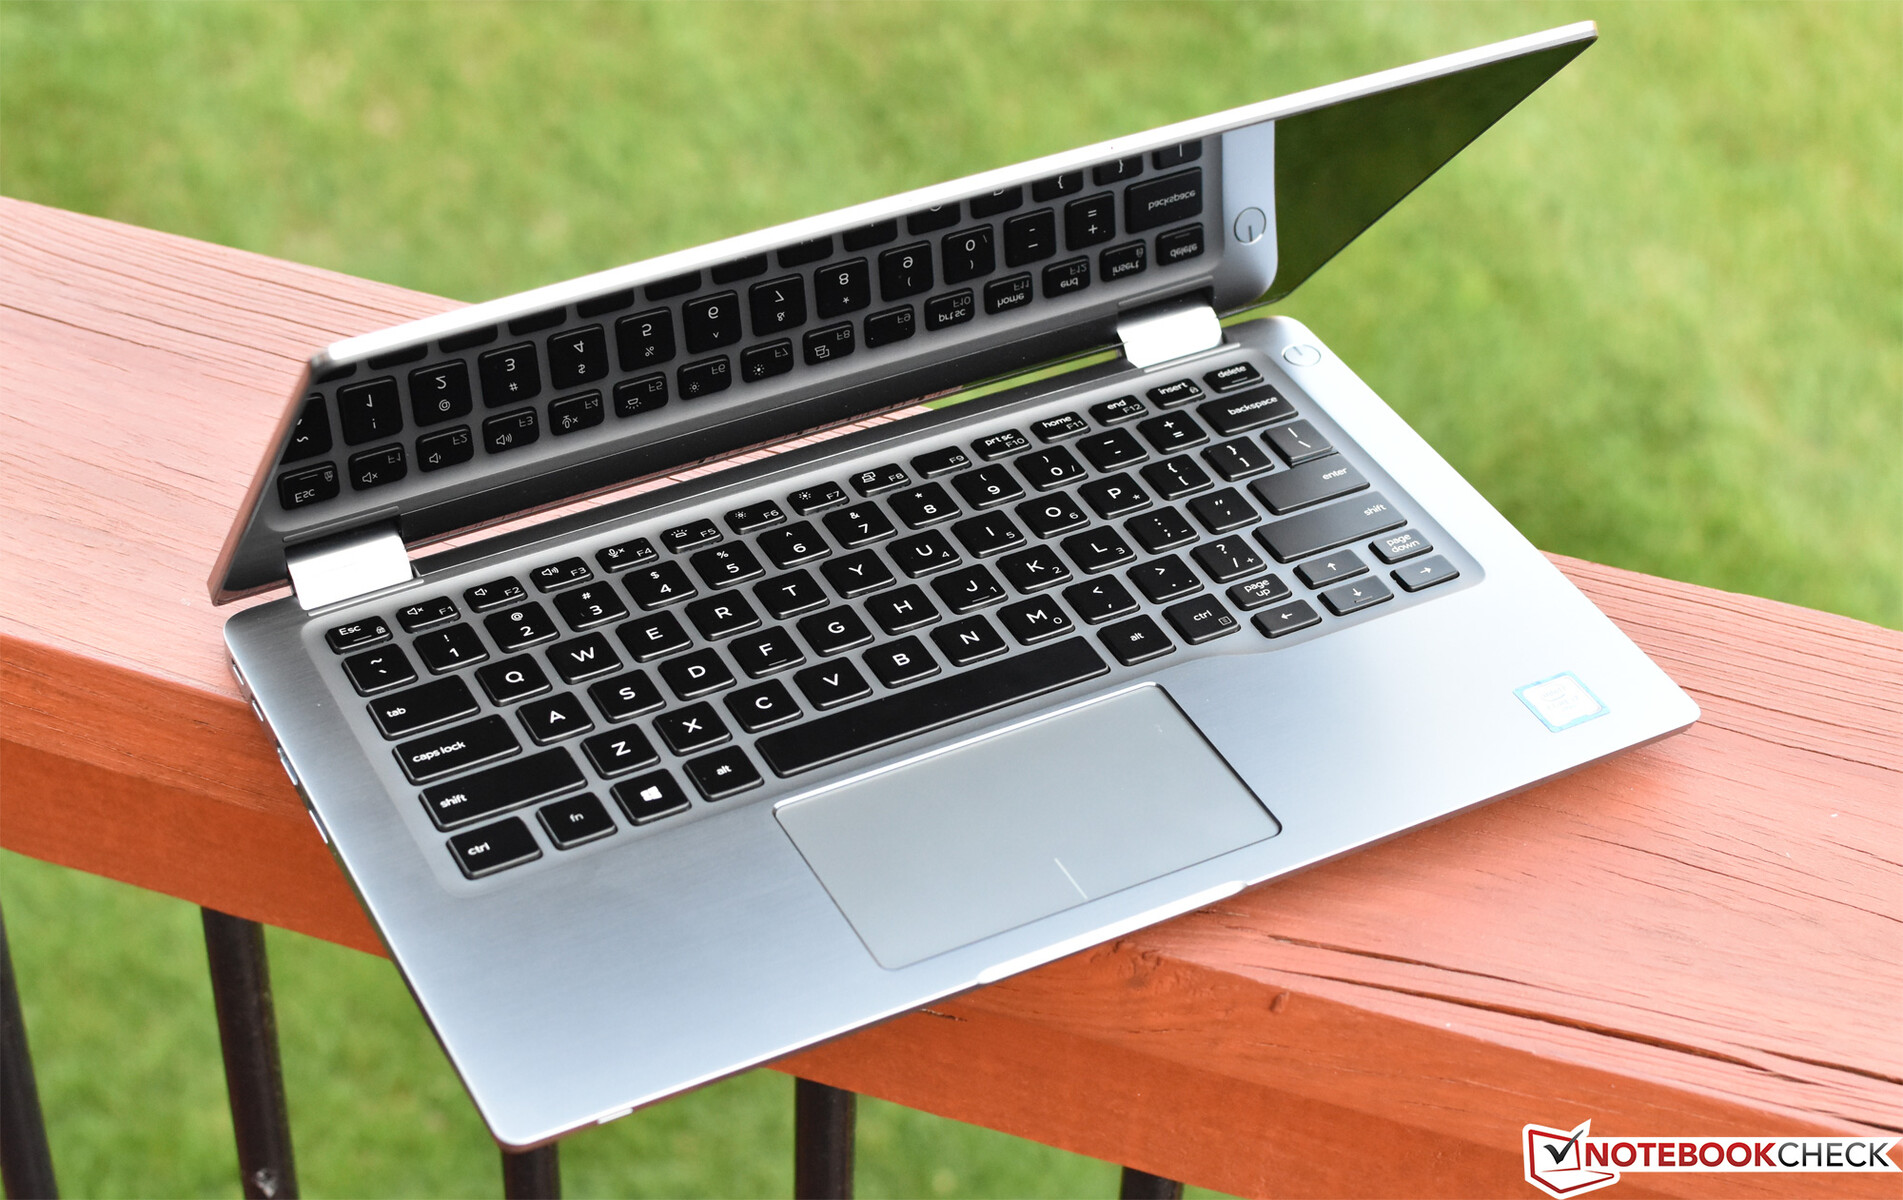
De Dell Latitude 7400 2-in-1 (€ 2800 in de geteste configuratie) vertegenwoordigd een substantieel andere design-filosofie voor de zakelijke convertibles van de fabrikant. Laten we beginnen met de algemene voordelen: dit is mogelijk de meest aantrekkelijke Latitude tot nu toe, met zijn prachtige geborstelde aluminium behuizing, precieze CNC-gefreezde randen en hoeken en de superslanke beeldschermranden. Het notebook kan makkelijk verward worden met de XPS-familie notebooks.
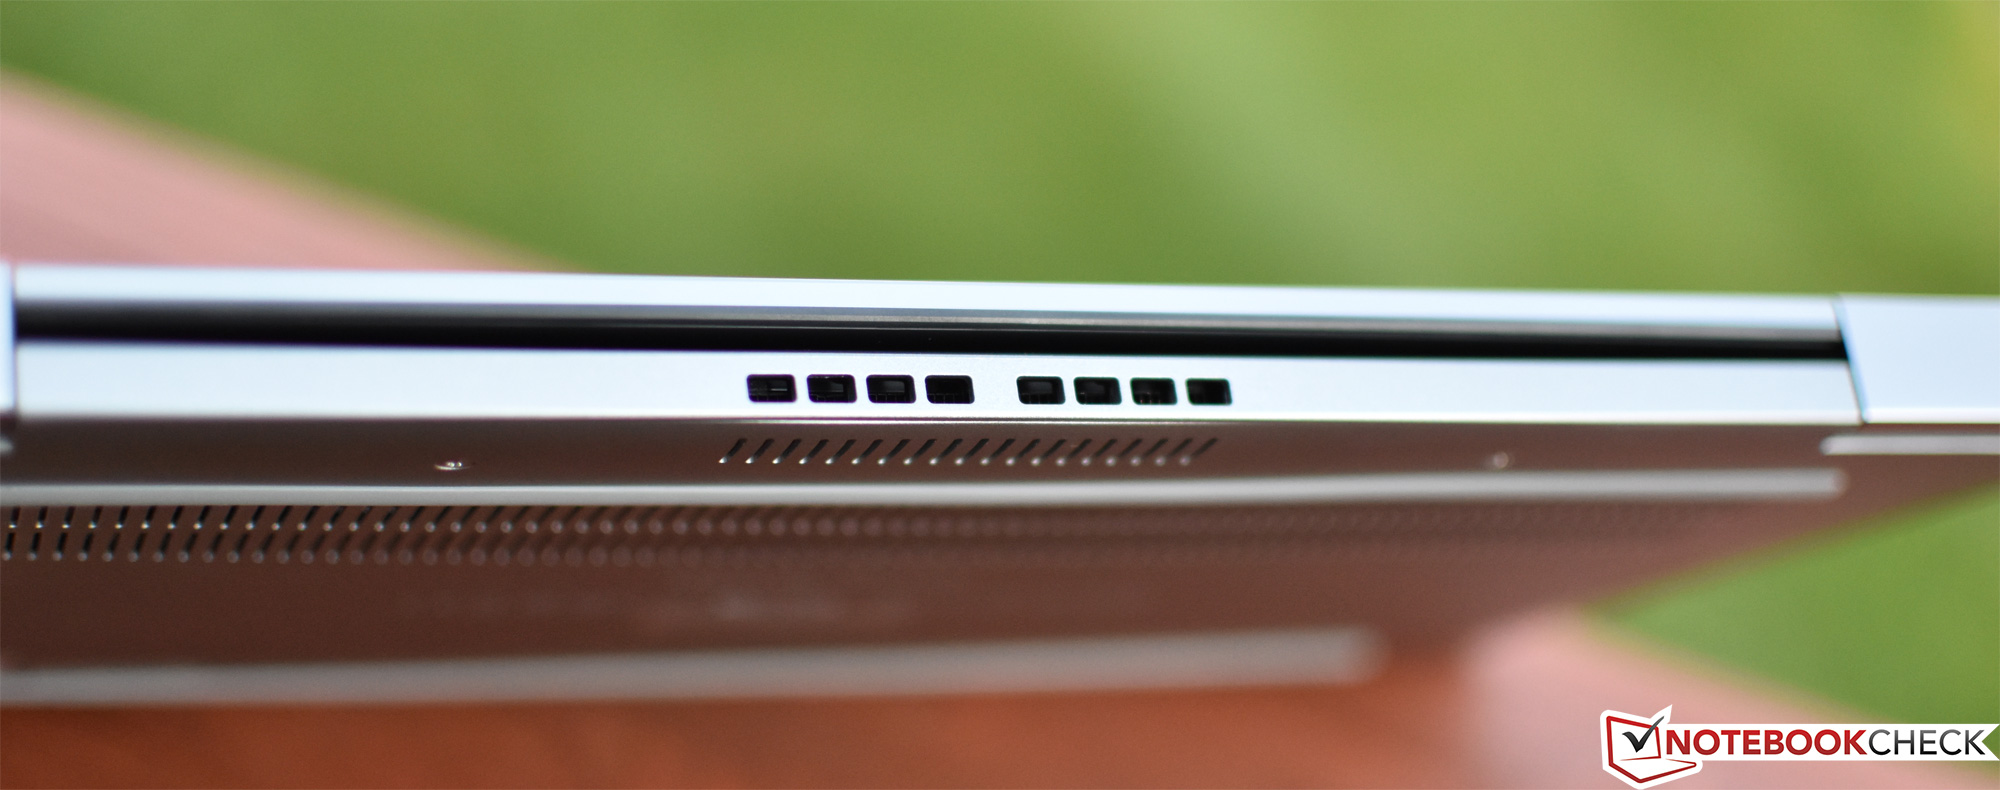
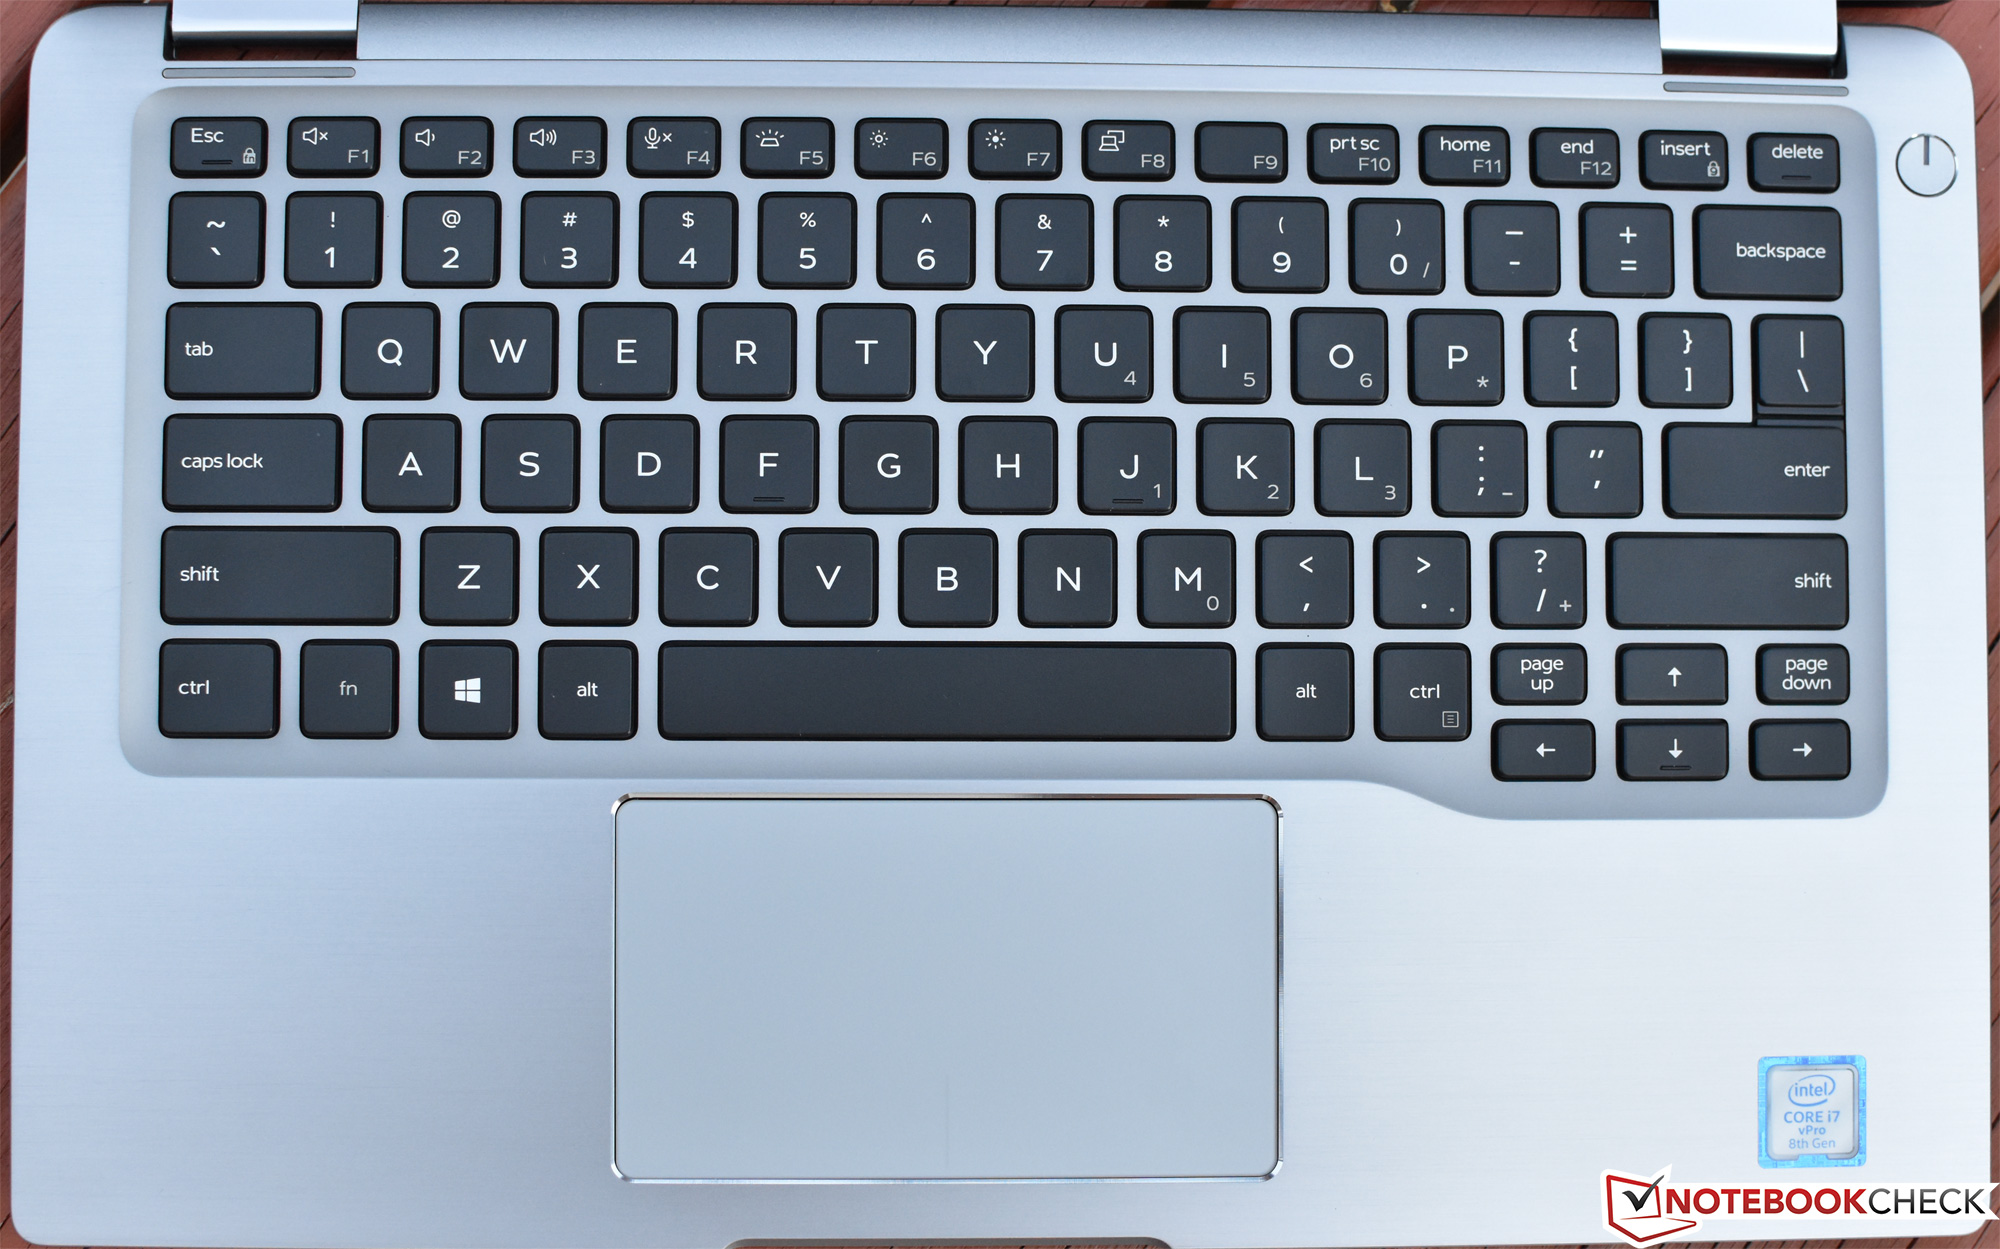
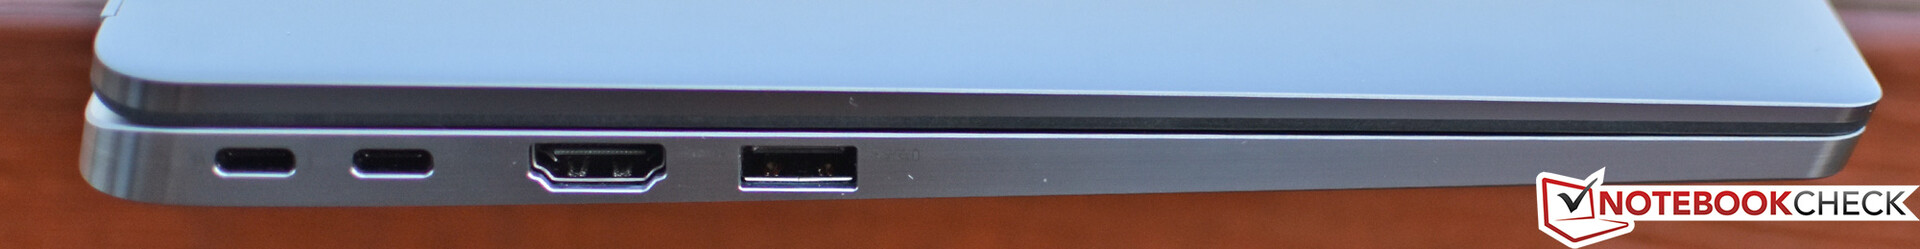
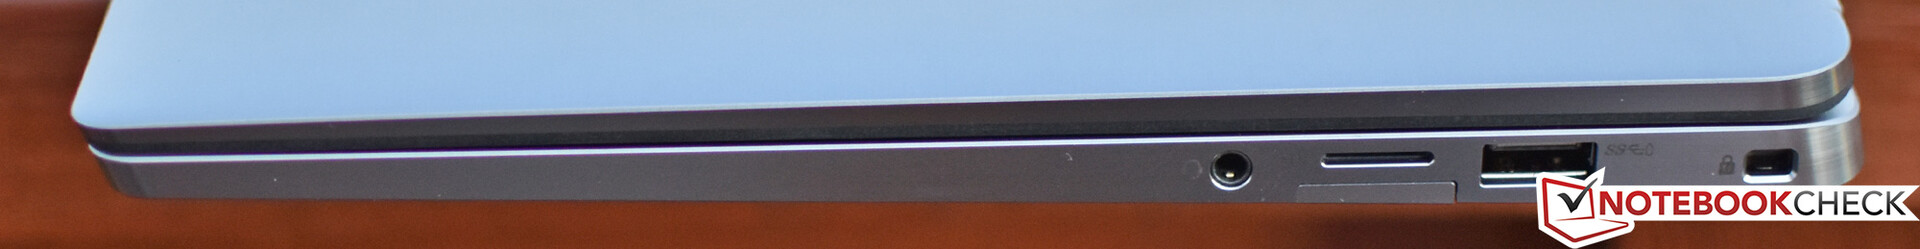
Maar met deze transitie poogt de Latitude de vele praktische zaken voor zakelijke notebooks te behouden die reeds lang de fundering van het succes van dit merk zijn: makkelijk onderhoudt, duurzame behuizing, lange batterijduur, stille werking en premium invoerapparaten. Het aanbod van poorten is wel wat aangetast, USB Type-C/Thunderbolt 3 oplaadpoorten zijn aanwezig, maar de Ethernetpoort is verdwenen. De gemiddelde zakelijke gebruiker zal meer dan voldoende hebben om hun werk te kunnen doen. De audio is aanzienlijk verbeterd ten opzichte van de vorige Latitude machines. En tot slot is de batterijduur van ons testmodel, dat uitgerust is met een 78 Wh-batterij, makkelijk genoeg voor een volle werkdag zonder oplader.
De Latitude 7400 2-in-1 is een ambitieuze revisie in een markt die typisch erg conservatief is en vooruitgang in kleine stappen de standaard is. In sommige opzichten is het notebook een verfrissende stap, maar het is niet zonder problemen.
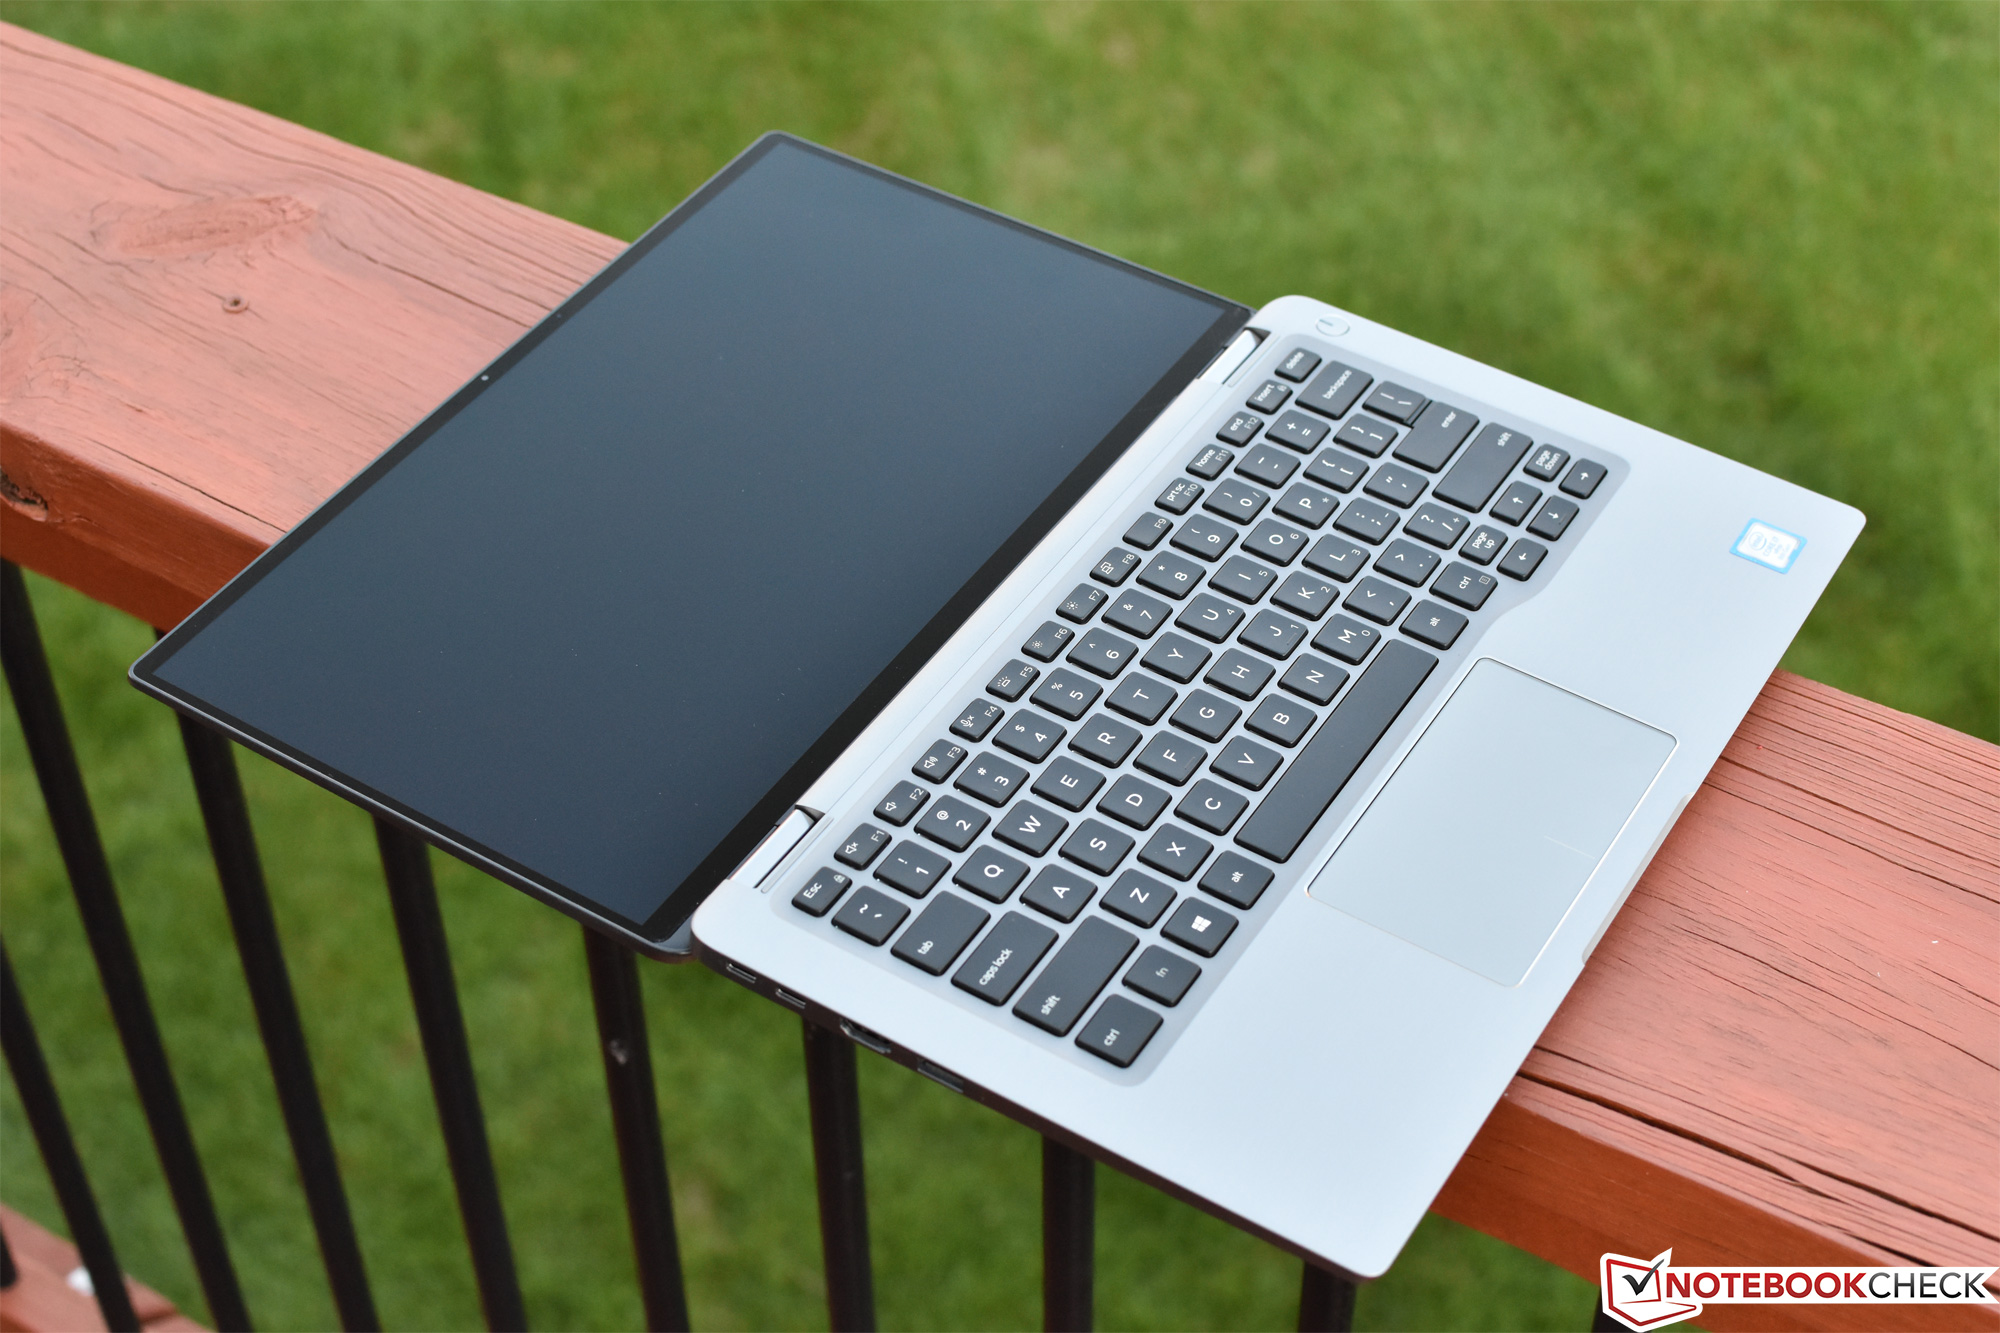
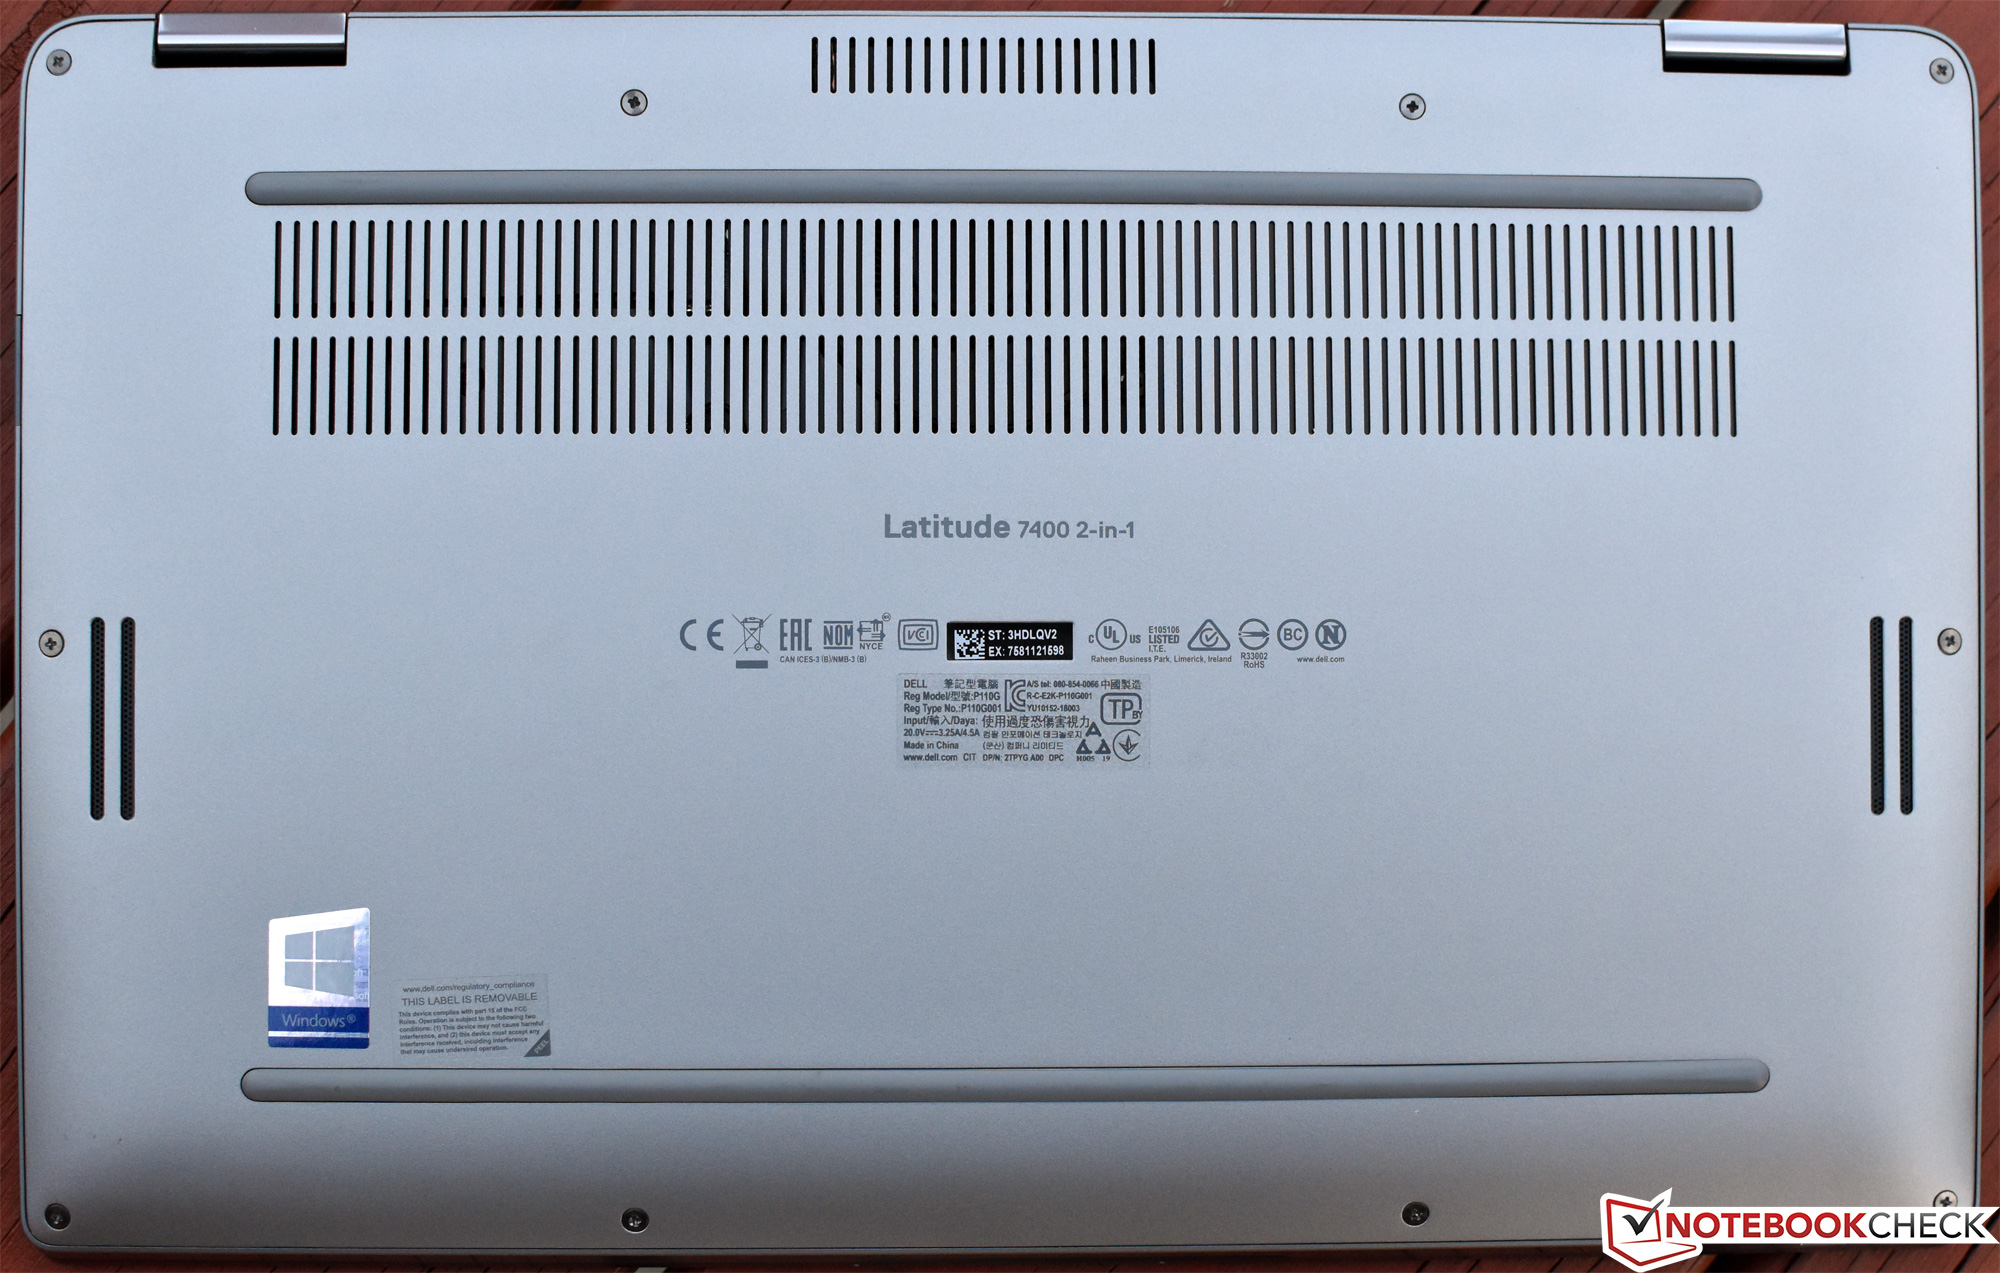
Hoewel de behuizing op het oog en haptisch erg fraai is, zijn niet alle beoordelingen van de behuizing zonder meer positief. Het beeldscherm, hoewel binnenshuis aantrekkelijk, heeft last van een zwakke helderheid en is uiterst reflecterend. Gebruik buiten is daarmee oncomfortabel en in vele gevallen simpelweg onmogelijk. De stap naar een glazen touchpad is leuk, maar sommige zakelijke gebruikers zullen de stap van fysieke touchpad knoppen naar een geintegreerd "clickpad" minder plezant vinden. Het RAM is nu compleet gesoldeerd op het toetsenbord en upgraden of vervangen is dus onmogelijk. De M.2 NVMe SSD kan nog wel steeds vervangen worden.
Maar de grootste tekortkoming van ons testmodel is de neiging tot hoge interne temperaturen, die al snel teveel wordt voor het ondermaatse koelsysteem en resulteert in gloeiendhete oppervlakte temperaturen en potentieel de CPU prestaties verminderd. Het doet je overvragen waarom er een hongerige en hete Core i7 Whiskey Lake SoC gebruikt wordt in een dergelijke compacte behuizing met zijn kleine, conservatief afgestelde koelsysteem.
We zouden graag genoegen nemen met een hoger systeemgeluid als dat betekend dat de prestaties beter volgehouden kunnen worden en de behuizing temperaturen lager blijven. Dit kan tot op zekere hoogte bereikt worden door het Ultra Performance profiel te selecteren in de Dell Power Manager software - dit geeft in elk geval iets hogere resultaten in Cinebench R15. Hopelijk zal een toekomstige firmware update dit standaard maken, want de gemiddelde gebruiker zal niet snel bekend zijn met deze optie. Toch denken we dat het logischer zou zijn om de kosten omlaag te brengen en een minder dure Core i5 CPU configuratie te kiezen, waarvan ook de temperaturen lager zijn en je niet een premium betaald voor marginaal hogere prestaties.
De voornaamste concurrentie bestaat uit de HP EliteBook x360 1040 G5 en Lenovo ThinkPad X1 Yoga. De Asus Zenbook Flip 14 is ook een optie, maar die doet het minder goed dan de twee voorgenoemde notebooks in onze tests. En het is het wellicht waard om nog even af te wachten of Dell een firmware update gaat uitbrengen voor de 7400 2-in-1 die de genoemde issues met de koeling oplost. Het is in vele opzichten een fantastisch notebook - maar qua koelsysteem waren de ambities misschien net wat te hoog.
Dell Latitude 7400 2-in-1
- 17-10-2019 v7 (old)
Steve Schardein
Price comparison
