Kort testrapport Dell Latitude 7400 Laptop: zelfs high-end heeft zijn zwaktes
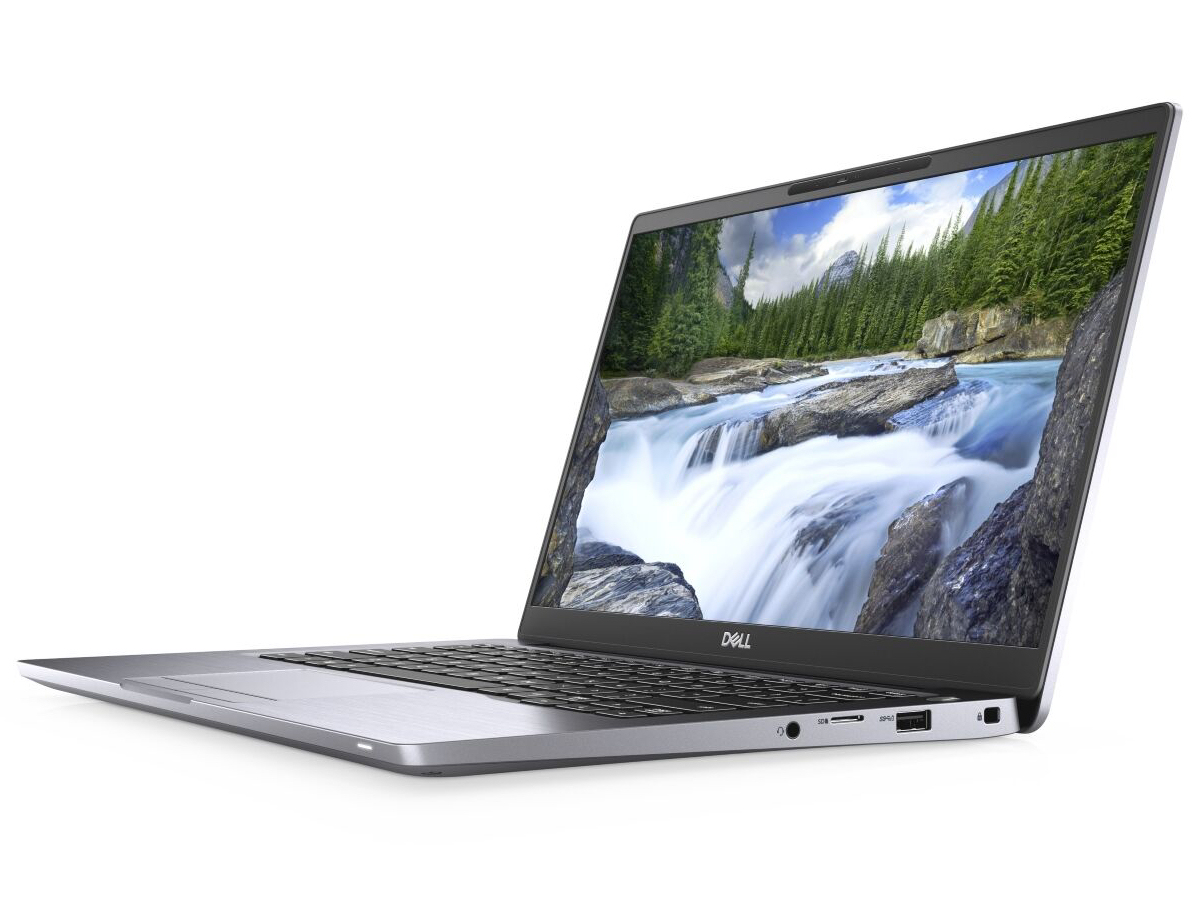
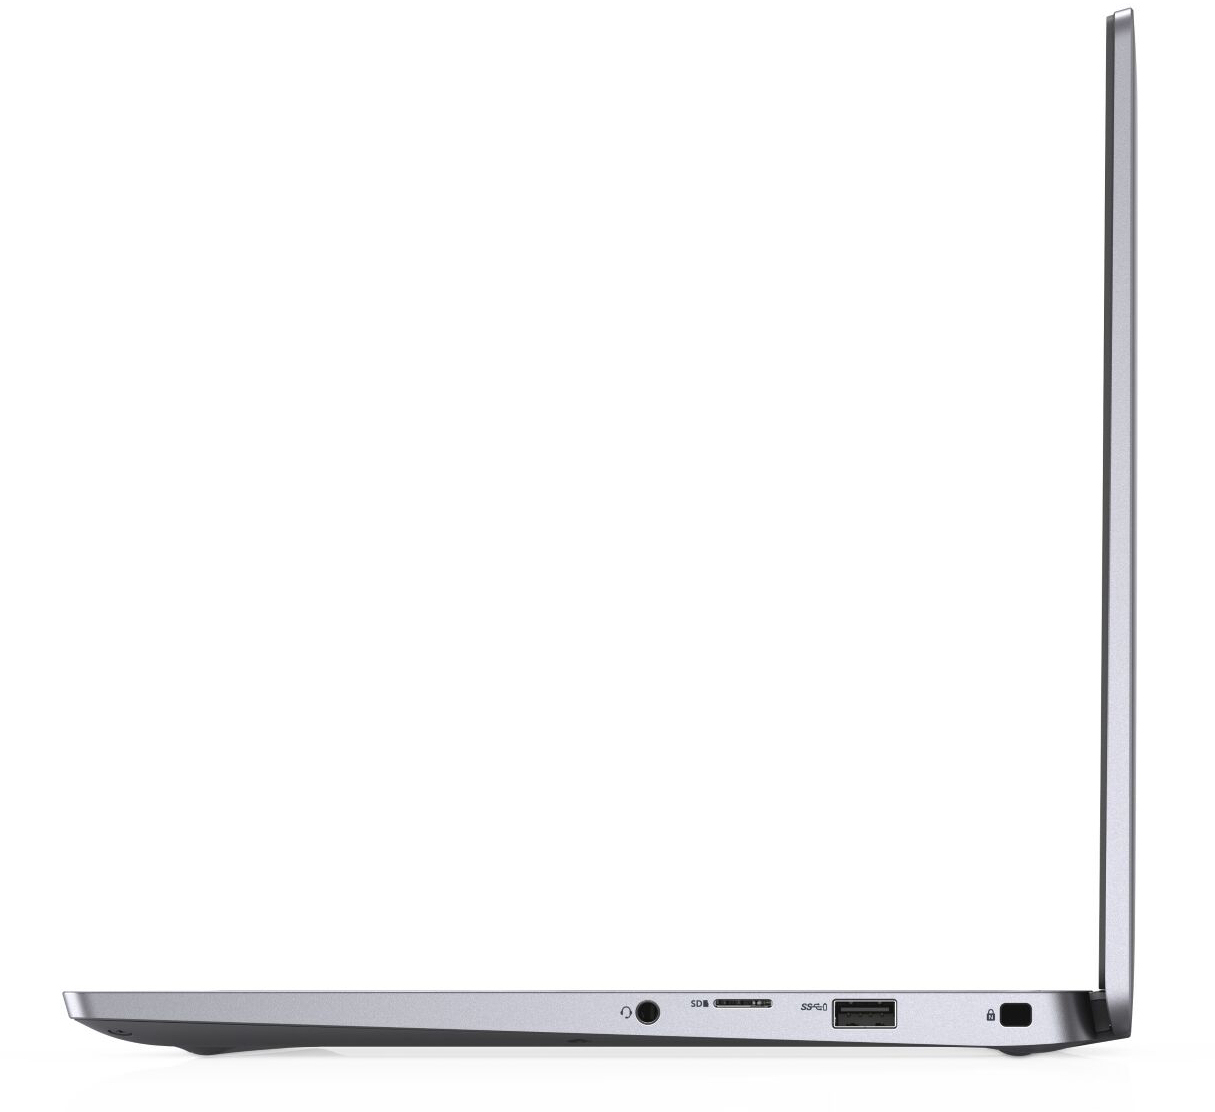
| SD Card Reader | |
| average JPG Copy Test (av. of 3 runs) | |
| Dell Latitude 7400-8N6DH (Toshiba Exceria Pro M501 64 GB UHS-II) | |
| Dell Latitude 7400 2-in-1 (Toshiba Exceria Pro M501 UHS-II) | |
| Dell Latitude 7490 (Toshiba Exceria Pro M501 UHS-II) | |
| Lenovo ThinkPad T495s-20QKS01E00 (Toshiba Exceria Pro M501 64 GB UHS-II) | |
| Lenovo ThinkPad T490s-20NYS02A00 (Toshiba Exceria Pro M501) | |
| Toshiba Tecra X40-E-10W (Toshiba Exceria Pro M501 microSDXC 64GB) | |
| Gemiddelde van klas Office (22.4 - 198.5, n=22, laatste 2 jaar) | |
| maximum AS SSD Seq Read Test (1GB) | |
| Dell Latitude 7400 2-in-1 (Toshiba Exceria Pro M501 UHS-II) | |
| Dell Latitude 7400-8N6DH (Toshiba Exceria Pro M501 64 GB UHS-II) | |
| Dell Latitude 7490 (Toshiba Exceria Pro M501 UHS-II) | |
| Lenovo ThinkPad T495s-20QKS01E00 (Toshiba Exceria Pro M501 64 GB UHS-II) | |
| Lenovo ThinkPad T490s-20NYS02A00 (Toshiba Exceria Pro M501) | |
| Toshiba Tecra X40-E-10W (Toshiba Exceria Pro M501 microSDXC 64GB) | |
| Gemiddelde van klas Office (27.4 - 249, n=20, laatste 2 jaar) | |
| |||||||||||||||||||||||||
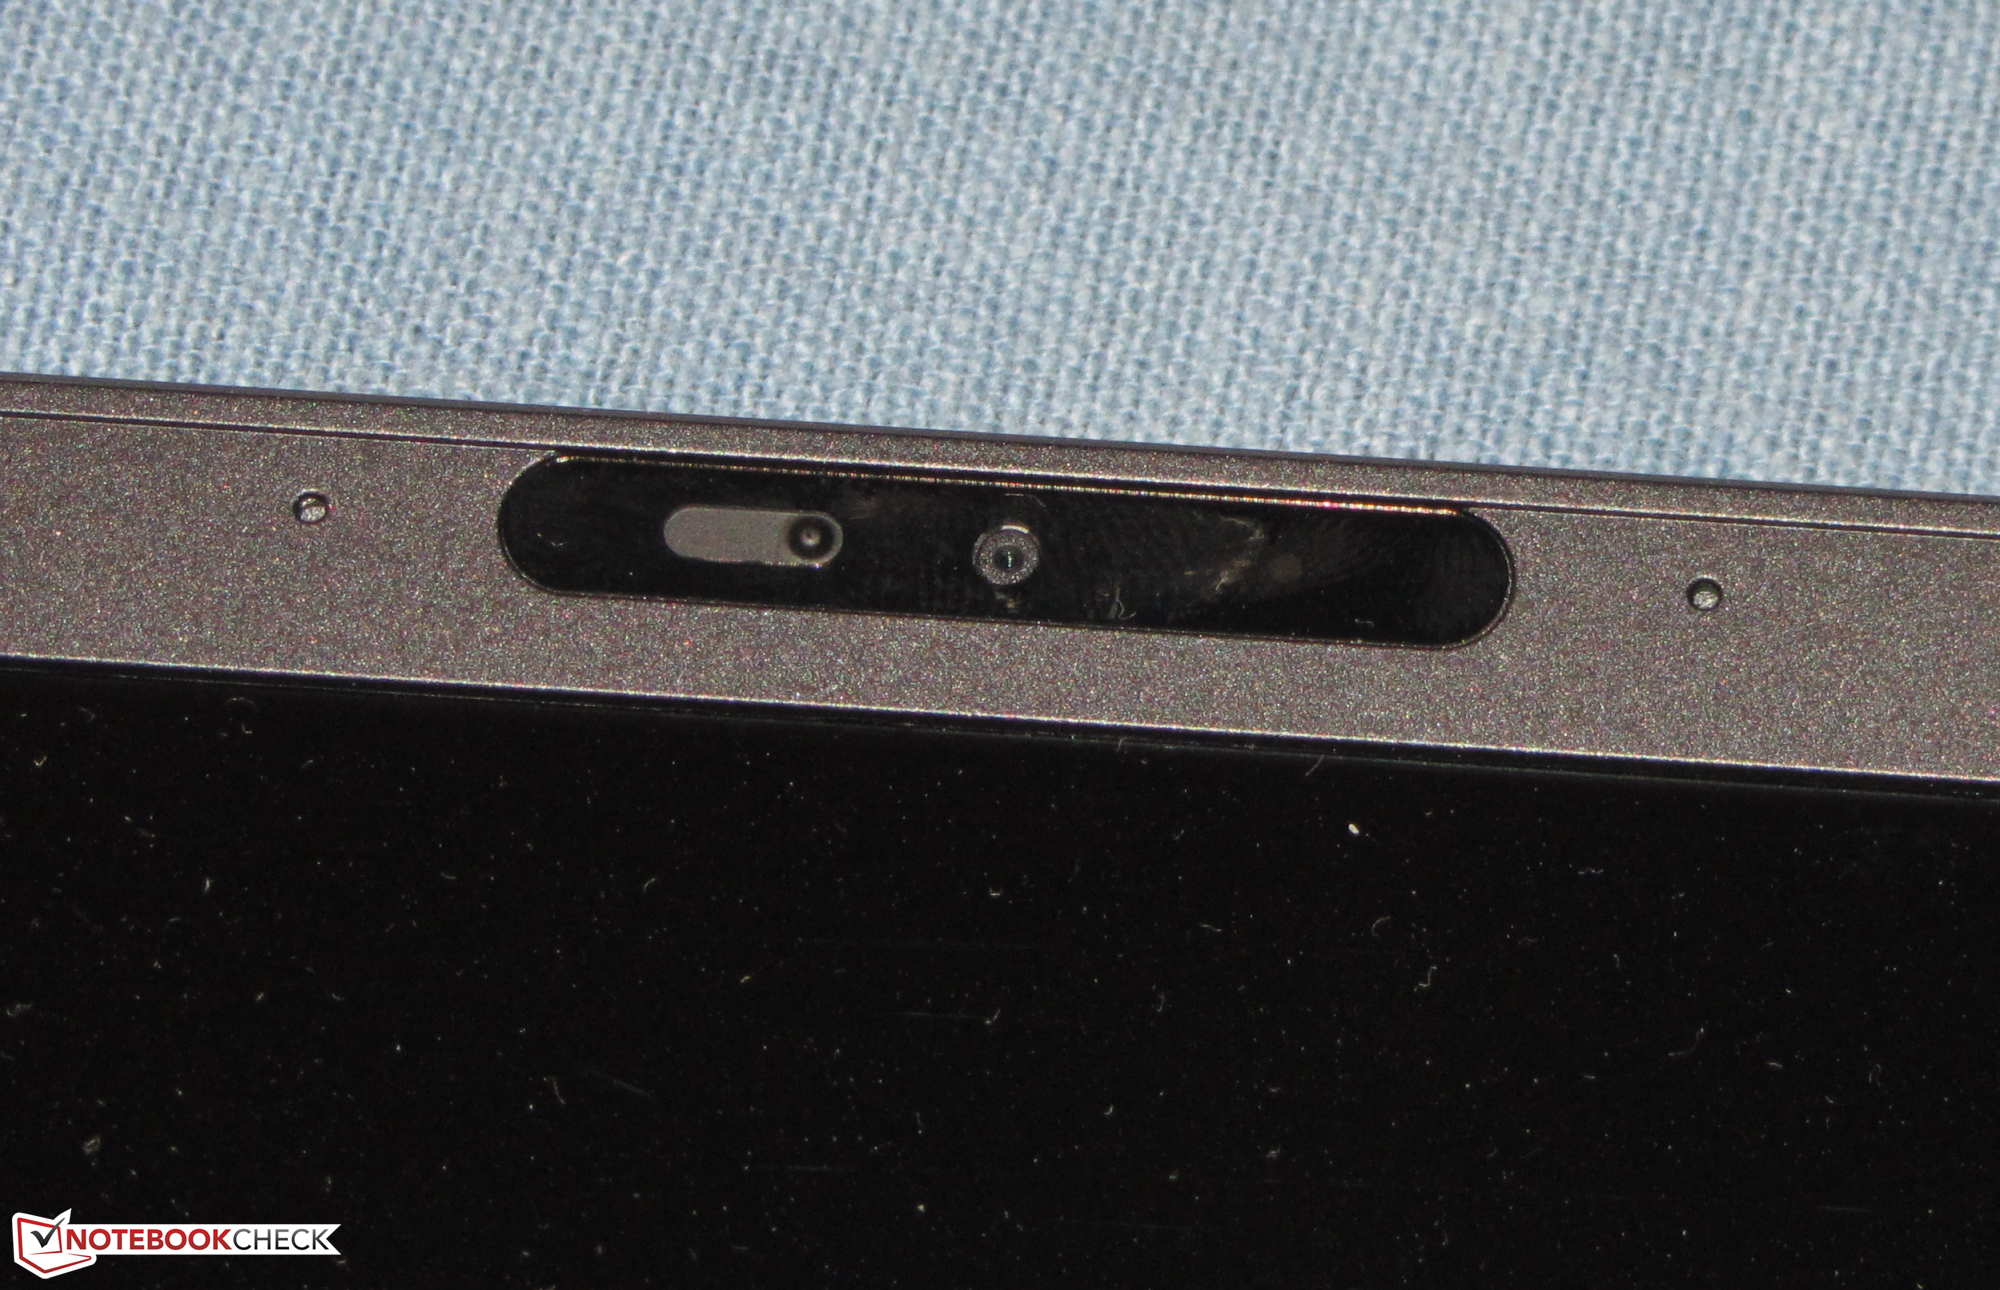
Helderheidsverdeling: 91 %
Helderheid in Batterij-modus: 290 cd/m²
Contrast: 1806:1 (Zwart: 0.16 cd/m²)
ΔE ColorChecker Calman: 4.7 | ∀{0.5-29.43 Ø4.73}
calibrated: 1.3
ΔE Greyscale Calman: 6.4 | ∀{0.09-98 Ø4.97}
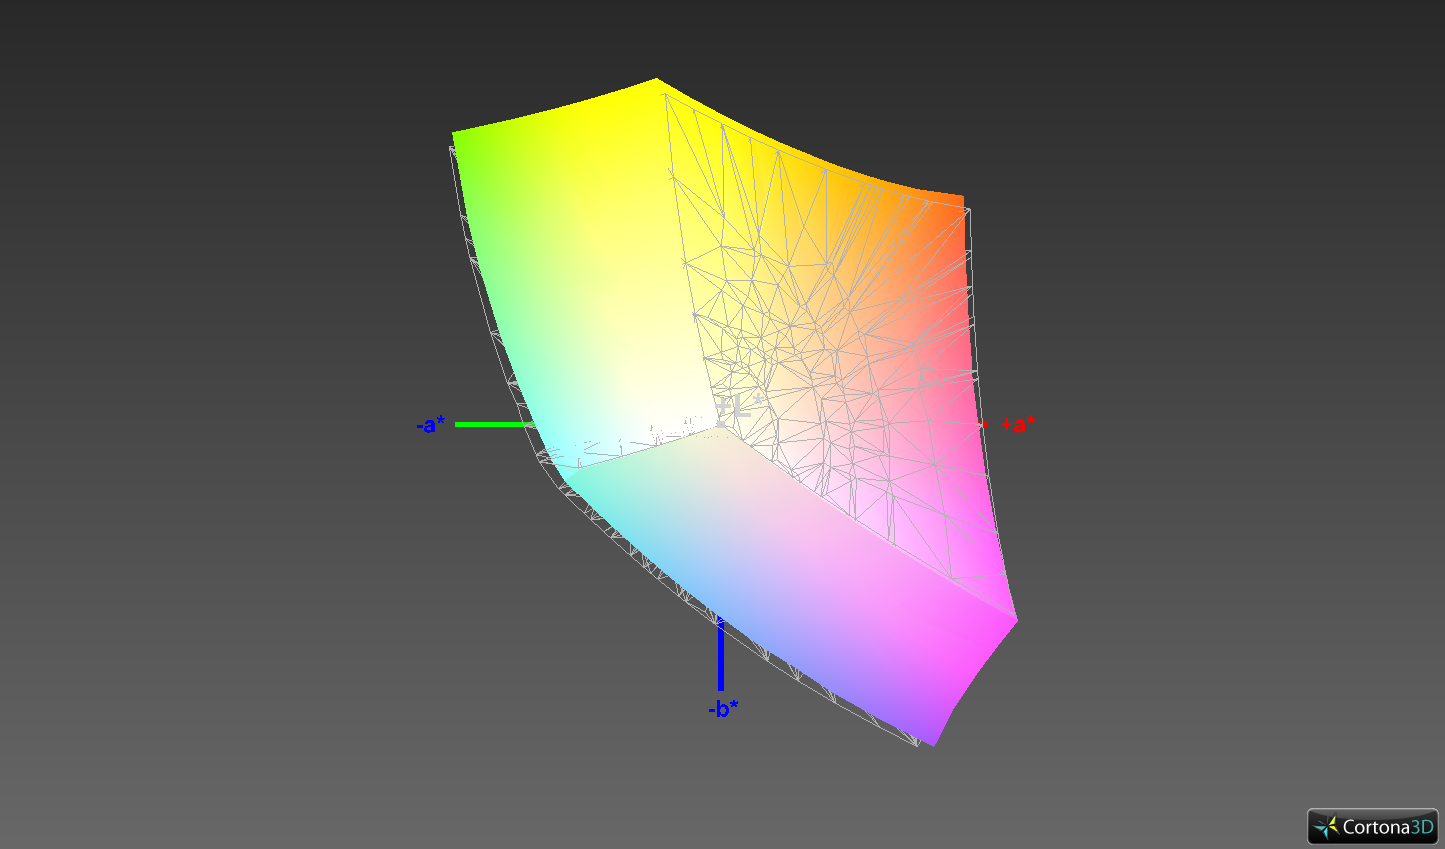
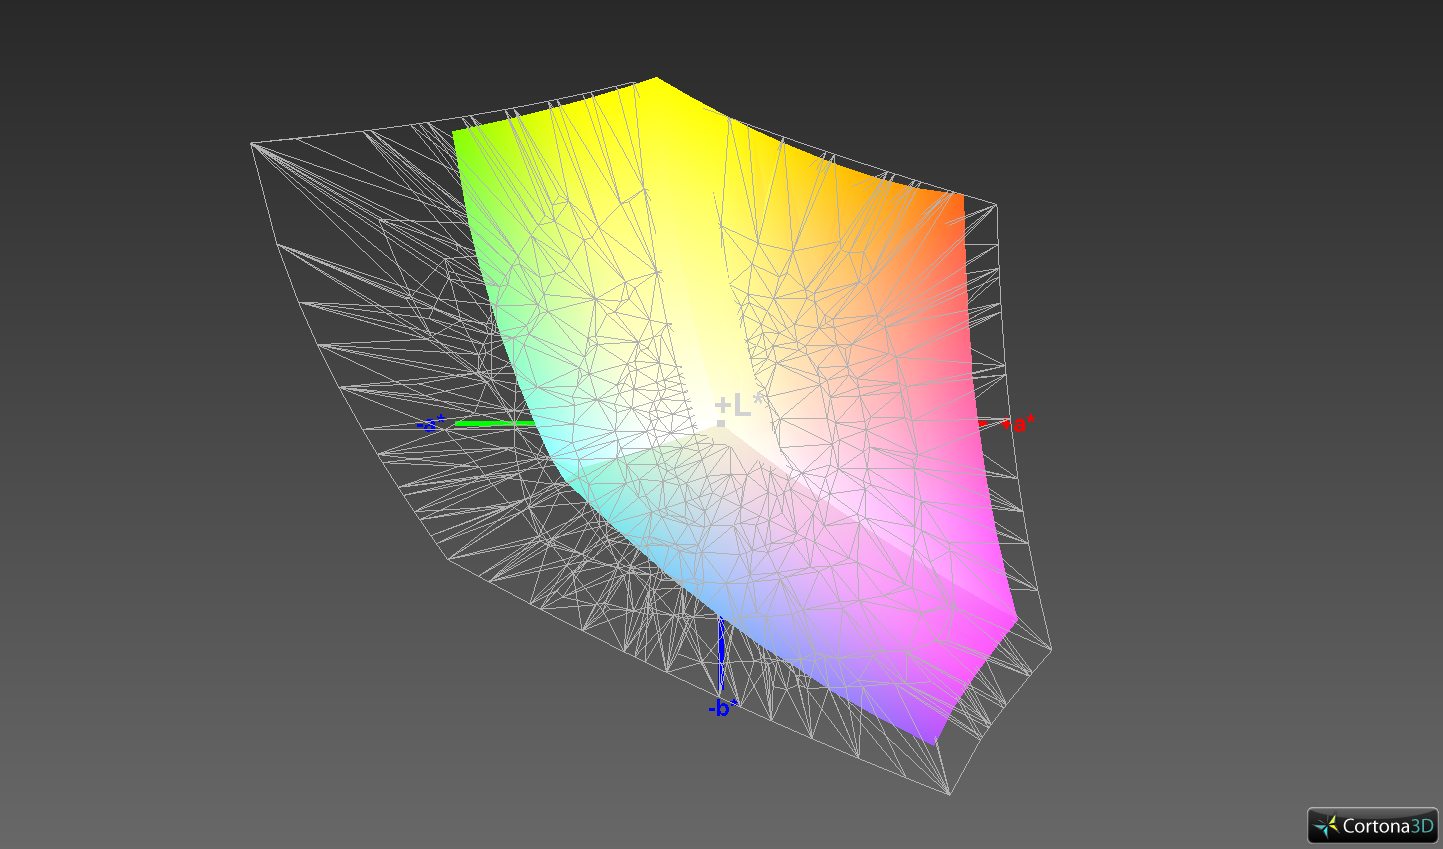
95.1% sRGB (Argyll 1.6.3 3D)
61.2% AdobeRGB 1998 (Argyll 1.6.3 3D)
67.5% AdobeRGB 1998 (Argyll 3D)
95.3% sRGB (Argyll 3D)
66.1% Display P3 (Argyll 3D)
Gamma: 2.54
CCT: 5977 K
| Dell Latitude 7400-8N6DH IPS, 1920x1080, 14" | Dell Latitude 7490 IPS, 1920x1080, 14" | Lenovo ThinkPad X1 Carbon 2019-20QES01L00 IPS, 1920x1080, 14" | HP EliteBook 745 G5 3UN74EA IPS LED, 1920x1080, 14" | HP EliteBook 840 G5-3JX61EA IPS, 1920x1080, 14" | Lenovo ThinkPad T490s-20NYS02A00 IPS, 1920x1080, 14" | Toshiba Tecra X40-E-10W IPS, 1920x1080, 14" | Lenovo ThinkPad X1 Carbon 2019-20QE000VGE IPS, 2560x1440, 14" | |
|---|---|---|---|---|---|---|---|---|
| Display | 1% | -1% | -8% | -8% | 2% | -38% | 7% | |
| Display P3 Coverage (%) | 66.1 | 66.6 1% | 64.5 -2% | 61.3 -7% | 61 -8% | 67.1 2% | 40.55 -39% | 72.5 10% |
| sRGB Coverage (%) | 95.3 | 96.8 2% | 95.8 1% | 87.6 -8% | 87.7 -8% | 97.6 2% | 61 -36% | 97.8 3% |
| AdobeRGB 1998 Coverage (%) | 67.5 | 67.9 1% | 65.7 -3% | 62.3 -8% | 62.1 -8% | 68.5 1% | 41.9 -38% | 73.8 9% |
| Response Times | 24% | 28% | 39% | 39% | -1% | 53% | 41% | |
| Response Time Grey 50% / Grey 80% * (ms) | 62 ? | 41.6 ? 33% | 44.8 ? 28% | 35 ? 44% | 33 ? 47% | 61.6 ? 1% | 22 ? 65% | 33.6 ? 46% |
| Response Time Black / White * (ms) | 37.6 ? | 32 ? 15% | 27.6 ? 27% | 25 ? 34% | 26 ? 31% | 38.8 ? -3% | 22 ? 41% | 24 ? 36% |
| PWM Frequency (Hz) | 3125 ? | 21000 ? | ||||||
| Screen | -14% | 3% | 6% | -7% | 13% | -10% | -17% | |
| Brightness middle (cd/m²) | 289 | 308.6 7% | 381 32% | 421 46% | 655 127% | 391 35% | 266 -8% | 338 17% |
| Brightness (cd/m²) | 286 | 294 3% | 375 31% | 398 39% | 630 120% | 389 36% | 244 -15% | 315 10% |
| Brightness Distribution (%) | 91 | 89 -2% | 94 3% | 86 -5% | 93 2% | 87 -4% | 86 -5% | 88 -3% |
| Black Level * (cd/m²) | 0.16 | 0.23 -44% | 0.24 -50% | 0.27 -69% | 0.56 -250% | 0.23 -44% | 0.2 -25% | 0.43 -169% |
| Contrast (:1) | 1806 | 1342 -26% | 1588 -12% | 1559 -14% | 1170 -35% | 1700 -6% | 1330 -26% | 786 -56% |
| Colorchecker dE 2000 * | 4.7 | 6.07 -29% | 4.6 2% | 4.08 13% | 3.27 30% | 3.4 28% | 4.61 2% | 4 15% |
| Colorchecker dE 2000 max. * | 8.7 | 10.58 -22% | 8.5 2% | 7.48 14% | 5.92 32% | 4.7 46% | 7.46 14% | 7.9 9% |
| Colorchecker dE 2000 calibrated * | 1.3 | 1.67 -28% | 1.2 8% | 3.22 -148% | 1.1 15% | 1.7 -31% | ||
| Greyscale dE 2000 * | 6.4 | 7.3 -14% | 5.1 20% | 2.92 54% | 2.85 55% | 4 37% | 4.31 33% | 6.2 3% |
| Gamma | 2.54 87% | 2.061 107% | 2.52 87% | 2.32 95% | 2.45 90% | 2.49 88% | 2.54 87% | 2.13 103% |
| CCT | 5977 109% | 7269 89% | 7052 92% | 7043 92% | 6065 107% | 6809 95% | 6848 95% | 6787 96% |
| Color Space (Percent of AdobeRGB 1998) (%) | 61.2 | 62 1% | 60.7 -1% | 57 -7% | 57 -7% | 62.4 2% | 39 -36% | 68.1 11% |
| Color Space (Percent of sRGB) (%) | 95.1 | 97 2% | 95.7 1% | 87 -9% | 88 -7% | 97.4 2% | 61 -36% | 97.8 3% |
| Totaal Gemiddelde (Programma / Instellingen) | 4% /
-6% | 10% /
5% | 12% /
8% | 8% /
-2% | 5% /
9% | 2% /
-7% | 10% /
-5% |
* ... kleiner is beter
Responstijd Scherm
| ↔ Responstijd Zwart naar Wit | ||
|---|---|---|
| 37.6 ms ... stijging ↗ en daling ↘ gecombineerd | ↗ 21.2 ms stijging | 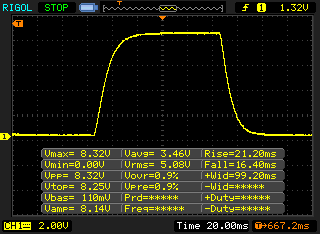 |
| ↘ 16.4 ms daling | ||
| Het scherm vertoonde trage responstijden in onze tests en is misschien te traag voor games. Ter vergelijking: alle testtoestellen variëren van 0.1 (minimum) tot 240 (maximum) ms. » 95 % van alle toestellen zijn beter. Dit betekent dat de gemeten responstijd slechter is dan het gemiddelde (19.9 ms) van alle geteste toestellen. | ||
| ↔ Responstijd 50% Grijs naar 80% Grijs | ||
| 62 ms ... stijging ↗ en daling ↘ gecombineerd | ↗ 29.6 ms stijging | 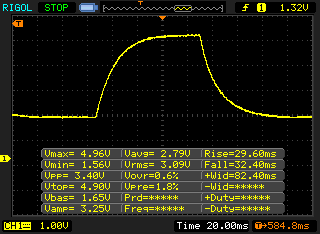 |
| ↘ 32.4 ms daling | ||
| Het scherm vertoonde trage responstijden in onze tests en is misschien te traag voor games. Ter vergelijking: alle testtoestellen variëren van 0.165 (minimum) tot 636 (maximum) ms. » 97 % van alle toestellen zijn beter. Dit betekent dat de gemeten responstijd slechter is dan het gemiddelde (31.1 ms) van alle geteste toestellen. | ||
Screen Flickering / PWM (Pulse-Width Modulation)
| Screen flickering / PWM niet waargenomen | 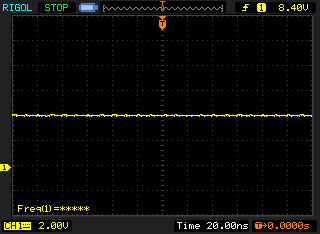 | ||
Ter vergelijking: 52 % van alle geteste toestellen maakten geen gebruik van PWM om de schermhelderheid te verlagen. Als het wel werd gebruikt, werd een gemiddelde van 7798 (minimum: 5 - maximum: 343500) Hz waargenomen. | |||
| Geekbench 3 | |
| 32 Bit Multi-Core Score | |
| Dell Latitude 7400-8N6DH | |
| Gemiddeld Intel Core i7-8665U (n=1) | |
| HP EliteBook 840 G5-3JX61EA | |
| Toshiba Tecra X40-E-10W | |
| 32 Bit Single-Core Score | |
| HP EliteBook 840 G5-3JX61EA | |
| Dell Latitude 7400-8N6DH | |
| Gemiddeld Intel Core i7-8665U (n=1) | |
| Toshiba Tecra X40-E-10W | |
| Mozilla Kraken 1.1 - Total | |
| HP EliteBook 745 G5 3UN74EA (Edge) | |
| Lenovo ThinkPad T495s-20QKS01E00 (Edge 44.18362.1.0) | |
| Dell Latitude 7490 (Microsoft Edge 42.17134.1.0) | |
| Lenovo ThinkPad T490s-20NYS02A00 (Edge 44) | |
| Dell Latitude 7400 2-in-1 (Microsoft Edge 44.18362.1.0) | |
| Lenovo ThinkPad X1 Carbon 2019-20QE000VGE (Edge 44.18362.1.0) | |
| Gemiddeld Intel Core i7-8665U (1016 - 1136, n=4) | |
| Dell Latitude 7400-8N6DH (Edge 44) | |
| Gemiddelde van klas Office (391 - 1297, n=76, laatste 2 jaar) | |
| Octane V2 - Total Score | |
| Gemiddelde van klas Office (49011 - 122119, n=19, laatste 2 jaar) | |
| Dell Latitude 7400-8N6DH (Edge 44) | |
| Gemiddeld Intel Core i7-8665U (30142 - 36667, n=4) | |
| Lenovo ThinkPad X1 Carbon 2019-20QE000VGE (Edge 44.18362.1.0) | |
| Lenovo ThinkPad T490s-20NYS02A00 (Edge 44) | |
| Dell Latitude 7400 2-in-1 (Microsoft Edge 44.18362.1.0) | |
| Dell Latitude 7490 (Microsoft Edge 42.17134.1.0) | |
| Lenovo ThinkPad T495s-20QKS01E00 (Edge 44.18362.1.0) | |
| HP EliteBook 745 G5 3UN74EA (Edge) | |
| JetStream 1.1 - 1.1 Total | |
| Lenovo ThinkPad X1 Carbon 2019-20QE000VGE (Edge 44.18362.1.0) | |
| Gemiddeld Intel Core i7-8665U (242 - 290, n=4) | |
| HP EliteBook 840 G5-3JX61EA (Edge 42) | |
| Dell Latitude 7400-8N6DH (Edge 44) | |
| Toshiba Tecra X40-E-10W (Edge 42) | |
| Dell Latitude 7490 (Microsoft Edge 42.17134.1.0) | |
| Lenovo ThinkPad T495s-20QKS01E00 (Edge 44.18362.1.0) | |
| HP EliteBook 745 G5 3UN74EA (Edge) | |
* ... kleiner is beter
| PCMark 8 Home Score Accelerated v2 | 3547 punten | |
| PCMark 8 Creative Score Accelerated v2 | 3715 punten | |
| PCMark 8 Work Score Accelerated v2 | 5195 punten | |
| PCMark 10 Score | 4094 punten | |
Help | ||

| Dell Latitude 7400-8N6DH Samsung SSD PM981 MZVLB512HAJQ | Lenovo ThinkPad X1 Carbon 2019-20QE000VGE WDC PC SN720 SDAQNTW-512G | HP EliteBook 745 G5 3UN74EA Toshiba XG5 KXG50ZNV256G | HP EliteBook 840 G5-3JX61EA Toshiba KXG50ZNV1T02 | Toshiba Tecra X40-E-10W Samsung PM961 MZVLW256HEHP | Dell Latitude 7490 Toshiba KSG60ZMV256G | Lenovo ThinkPad T490s-20NYS02A00 Intel SSD Pro 7600p SSDPEKKF512G8L | Gemiddeld Samsung SSD PM981 MZVLB512HAJQ | |
|---|---|---|---|---|---|---|---|---|
| CrystalDiskMark 5.2 / 6 | 26% | -32% | -20% | -23% | -60% | -9% | 2% | |
| Write 4K (MB/s) | 118.6 | 196.9 66% | 119.5 1% | 96.1 -19% | 100.1 -16% | 79.4 -33% | 122 3% | 126.7 ? 7% |
| Read 4K (MB/s) | 44.68 | 51.3 15% | 31.9 -29% | 31.12 -30% | 40.03 -10% | 27.37 -39% | 45.56 2% | 44 ? -2% |
| Write Seq (MB/s) | 1866 | 1715 -8% | 351.1 -81% | 919 -51% | 1259 -33% | 343.9 -82% | 1497 -20% | 1617 ? -13% |
| Read Seq (MB/s) | 2173 | 2464 13% | 1665 -23% | 2089 -4% | 1296 -40% | 472.7 -78% | 2385 10% | 1716 ? -21% |
| Write 4K Q32T1 (MB/s) | 330.9 | 429.1 30% | 268.4 -19% | 425.6 29% | 228.1 -31% | 206 -38% | 240.9 -27% | 413 ? 25% |
| Read 4K Q32T1 (MB/s) | 343.1 | 542 58% | 333.1 -3% | 275.3 -20% | 292.9 -15% | 188.3 -45% | 338 -1% | 420 ? 22% |
| Write Seq Q32T1 (MB/s) | 1927 | 2521 31% | 351.8 -82% | 958 -50% | 1286 -33% | 343.3 -82% | 1528 -21% | 2076 ? 8% |
| Read Seq Q32T1 (MB/s) | 3528 | 3481 -1% | 2705 -23% | 3118 -12% | 3411 -3% | 533 -85% | 2915 -17% | 3130 ? -11% |
| 3DMark 06 Standard Score | 11053 punten | |
| 3DMark 11 Performance | 1979 punten | |
| 3DMark Ice Storm Standard Score | 61551 punten | |
| 3DMark Cloud Gate Standard Score | 8736 punten | |
| 3DMark Fire Strike Score | 1075 punten | |
| 3DMark Time Spy Score | 448 punten | |
Help | ||
| lage | gem. | hoge | ultra | |
|---|---|---|---|---|
| Tomb Raider (2013) | 87.8 | 44.3 | 27 | 12.5 |
| BioShock Infinite (2013) | 60.9 | 34.3 | 26.7 | 8.5 |
| The Witcher 3 (2015) | 15.8 | 9.3 | 5.4 | 3 |
| Dota 2 Reborn (2015) | 73 | 42.9 | 19.5 | 17.3 |
| X-Plane 11.11 (2018) | 23.1 | 15 | 13.4 |
| BioShock Infinite - 1280x720 Very Low Preset | |
| Lenovo ThinkPad T495s-20QKS01E00 | |
| HP EliteBook 745 G5 3UN74EA | |
| Dell Latitude 7400-8N6DH (Dual-Channel) | |
| HP EliteBook 840 G5-3JX61EA | |
| Dell Latitude 7400-8N6DH | |
| Gemiddeld Intel UHD Graphics 620 (18.3 - 90.2, n=187) | |
| Lenovo ThinkPad T490s-20NYS02A00 | |
| Lenovo ThinkPad X1 Carbon 2019-20QE000VGE | |
| Dell Latitude 7400 2-in-1 | |
| Dell Latitude 7490 | |
| Toshiba Tecra X40-E-10W | |
| Tomb Raider - 1024x768 Low Preset | |
| Dell Latitude 7400-8N6DH | |
| Gemiddeld Intel UHD Graphics 620 (24.3 - 114.4, n=18) | |
Geluidsniveau
| Onbelast |
| 28.6 / 28.6 / 29.1 dB (A) |
| Belasting |
| 31.5 / 36.9 dB (A) |
 | ||
30 dB stil 40 dB(A) hoorbaar 50 dB(A) luid |
||
min: | ||
| Dell Latitude 7400-8N6DH i7-8665U, UHD Graphics 620 | Dell Latitude 7490 i5-8350U, UHD Graphics 620 | Lenovo ThinkPad X1 Carbon 2019-20QE000VGE i7-8665U, UHD Graphics 620 | HP EliteBook 745 G5 3UN74EA R7 2700U, Vega 10 | HP EliteBook 840 G5-3JX61EA i5-8550U, UHD Graphics 620 | Toshiba Tecra X40-E-10W i5-8250U, UHD Graphics 620 | Lenovo ThinkPad T490s-20NYS02A00 i5-8265U, UHD Graphics 620 | |
|---|---|---|---|---|---|---|---|
| Noise | 0% | 3% | -6% | -4% | -13% | -2% | |
| uit / omgeving * (dB) | 28.6 | 28.2 1% | 28.4 1% | 30.5 -7% | 30.3 -6% | 30.5 -7% | 29.4 -3% |
| Idle Minimum * (dB) | 28.6 | 28.2 1% | 28.4 1% | 30.5 -7% | 30.3 -6% | 30.5 -7% | 29.4 -3% |
| Idle Average * (dB) | 28.6 | 28.2 1% | 28.4 1% | 30.5 -7% | 30.3 -6% | 30.5 -7% | 29.4 -3% |
| Idle Maximum * (dB) | 29.1 | 28.7 1% | 28.6 2% | 30.5 -5% | 30.3 -4% | 31.2 -7% | 30.9 -6% |
| Load Average * (dB) | 31.5 | 29.9 5% | 31.5 -0% | 36 -14% | 33.8 -7% | 43.9 -39% | 33.3 -6% |
| Load Maximum * (dB) | 36.9 | 40.2 -9% | 33.1 10% | 36 2% | 33.8 8% | 40.1 -9% | 33.3 10% |
* ... kleiner is beter
(±) De maximumtemperatuur aan de bovenzijde bedraagt 42.4 °C / 108 F, vergeleken met het gemiddelde van 34.3 °C / 94 F, variërend van 21.2 tot 62.5 °C voor de klasse Office.
(-) De bodem warmt op tot een maximum van 47.1 °C / 117 F, vergeleken met een gemiddelde van 36.8 °C / 98 F
(+) Bij onbelast gebruik bedraagt de gemiddelde temperatuur voor de bovenzijde 23.9 °C / 75 F, vergeleken met het apparaatgemiddelde van 29.5 °C / 85 F.
(+) De palmsteunen en het touchpad zijn met een maximum van ###max## °C / 87.3 F koeler dan de huidtemperatuur en voelen daarom koel aan.
(-) De gemiddelde temperatuur van de handpalmsteun van soortgelijke toestellen bedroeg 27.5 °C / 81.5 F (-3.2 °C / -5.8 F).
| Dell Latitude 7400-8N6DH i7-8665U, UHD Graphics 620 | Dell Latitude 7490 i5-8350U, UHD Graphics 620 | Lenovo ThinkPad X1 Carbon 2019-20QE000VGE i7-8665U, UHD Graphics 620 | HP EliteBook 745 G5 3UN74EA R7 2700U, Vega 10 | HP EliteBook 840 G5-3JX61EA i5-8550U, UHD Graphics 620 | Toshiba Tecra X40-E-10W i5-8250U, UHD Graphics 620 | Lenovo ThinkPad T490s-20NYS02A00 i5-8265U, UHD Graphics 620 | |
|---|---|---|---|---|---|---|---|
| Heat | -23% | -2% | -2% | 18% | -6% | 0% | |
| Maximum Upper Side * (°C) | 42.4 | 45.2 -7% | 47.9 -13% | 38.4 9% | 33.4 21% | 44 -4% | 43.3 -2% |
| Maximum Bottom * (°C) | 47.1 | 51.6 -10% | 45.9 3% | 35.8 24% | 32.7 31% | 47.2 -0% | 45.1 4% |
| Idle Upper Side * (°C) | 24.5 | 31.8 -30% | 24.6 -0% | 29.8 -22% | 22.2 9% | 27.3 -11% | 25 -2% |
| Idle Bottom * (°C) | 25.2 | 36 -43% | 24.4 3% | 29.7 -18% | 22.3 12% | 27.8 -10% | 25 1% |
* ... kleiner is beter
Dell Latitude 7400-8N6DH audioanalyse
(±) | luidspreker luidheid is gemiddeld maar goed (78.3 dB)
Bas 100 - 315 Hz
(-) | bijna geen lage tonen - gemiddeld 16.5% lager dan de mediaan
(±) | lineariteit van de lage tonen is gemiddeld (8% delta ten opzichte van de vorige frequentie)
Midden 400 - 2000 Hz
(+) | evenwichtige middens - slechts 2.5% verwijderd van de mediaan
(±) | lineariteit van de middentonen is gemiddeld (7% delta ten opzichte van de vorige frequentie)
Hoog 2 - 16 kHz
(±) | higher highs - on average 5.2% higher than median
(±) | lineariteit van de hoogtepunten is gemiddeld (7.2% delta ten opzichte van de vorige frequentie)
Algemeen 100 - 16.000 Hz
(±) | lineariteit van het totale geluid is gemiddeld (17.7% verschil met de mediaan)
Vergeleken met dezelfde klasse
» 28% van alle geteste apparaten in deze klasse waren beter, 6% vergelijkbaar, 66% slechter
» De beste had een delta van 7%, het gemiddelde was 21%, de slechtste was 53%
Vergeleken met alle geteste toestellen
» 35% van alle geteste apparaten waren beter, 8% gelijk, 57% slechter
» De beste had een delta van 4%, het gemiddelde was 24%, de slechtste was 134%
Lenovo ThinkPad X1 Carbon 2019-20QE000VGE audioanalyse
(±) | luidspreker luidheid is gemiddeld maar goed (76.8 dB)
Bas 100 - 315 Hz
(±) | verminderde zeebaars - gemiddeld 11.2% lager dan de mediaan
(±) | lineariteit van de lage tonen is gemiddeld (7.1% delta ten opzichte van de vorige frequentie)
Midden 400 - 2000 Hz
(±) | hogere middens - gemiddeld 5.1% hoger dan de mediaan
(+) | de middentonen zijn lineair (5.4% delta ten opzichte van de vorige frequentie)
Hoog 2 - 16 kHz
(+) | evenwichtige hoogtepunten - slechts 2.9% verwijderd van de mediaan
(±) | lineariteit van de hoogtepunten is gemiddeld (9.1% delta ten opzichte van de vorige frequentie)
Algemeen 100 - 16.000 Hz
(±) | lineariteit van het totale geluid is gemiddeld (16.7% verschil met de mediaan)
Vergeleken met dezelfde klasse
» 21% van alle geteste apparaten in deze klasse waren beter, 8% vergelijkbaar, 71% slechter
» De beste had een delta van 7%, het gemiddelde was 21%, de slechtste was 53%
Vergeleken met alle geteste toestellen
» 29% van alle geteste apparaten waren beter, 7% gelijk, 64% slechter
» De beste had een delta van 4%, het gemiddelde was 24%, de slechtste was 134%
| Uit / Standby | |
| Inactief | |
| Belasting |
|
Key:
min: | |
| Dell Latitude 7400-8N6DH i7-8665U, UHD Graphics 620 | Dell Latitude 7490 i5-8350U, UHD Graphics 620 | Lenovo ThinkPad X1 Carbon 2019-20QE000VGE i7-8665U, UHD Graphics 620 | HP EliteBook 745 G5 3UN74EA R7 2700U, Vega 10 | HP EliteBook 840 G5-3JX61EA i5-8550U, UHD Graphics 620 | Toshiba Tecra X40-E-10W i5-8250U, UHD Graphics 620 | Lenovo ThinkPad T490s-20NYS02A00 i5-8265U, UHD Graphics 620 | |
|---|---|---|---|---|---|---|---|
| Power Consumption | 30% | 3% | -6% | -1% | 4% | 10% | |
| Idle Minimum * (Watt) | 3.9 | 2 49% | 3 23% | 4.9 -26% | 3.8 3% | 4.5 -15% | 2.62 33% |
| Idle Average * (Watt) | 6.1 | 4.7 23% | 6.3 -3% | 8.1 -33% | 8.3 -36% | 8.2 -34% | 5.16 15% |
| Idle Maximum * (Watt) | 8.2 | 5.7 30% | 8.9 -9% | 10.6 -29% | 10.7 -30% | 9.3 -13% | 8.7 -6% |
| Load Average * (Watt) | 41 | 38.4 6% | 40.8 -0% | 32.2 21% | 35.5 13% | 30.4 26% | 40 2% |
| Load Maximum * (Watt) | 69.7 | 38.9 44% | 67.5 3% | 42.3 39% | 37 47% | 30.4 56% | 64 8% |
* ... kleiner is beter
| Dell Latitude 7400-8N6DH i7-8665U, UHD Graphics 620, 60 Wh | Lenovo ThinkPad X1 Carbon 2019-20QE000VGE i7-8665U, UHD Graphics 620, 51 Wh | HP EliteBook 745 G5 3UN74EA R7 2700U, Vega 10, 50 Wh | HP EliteBook 840 G5-3JX61EA i5-8550U, UHD Graphics 620, 50 Wh | Toshiba Tecra X40-E-10W i5-8250U, UHD Graphics 620, 48 Wh | Dell Latitude 7490 i5-8350U, UHD Graphics 620, 60 Wh | Dell Latitude 7400 2-in-1 i7-8665U, UHD Graphics 620, 78 Wh | Lenovo ThinkPad X1 Carbon 2019-20QES01L00 i7-8565U, UHD Graphics 620, 51 Wh | Lenovo ThinkPad T490s-20NYS02A00 i5-8265U, UHD Graphics 620, 57 Wh | Lenovo ThinkPad T495s-20QKS01E00 R7 PRO 3700U, Vega 10, 57 Wh | Gemiddelde van klas Office | |
|---|---|---|---|---|---|---|---|---|---|---|---|
| Batterijduur | -34% | -42% | -36% | -28% | -22% | 5% | -28% | -15% | -8% | -3% | |
| H.264 (h) | 14.4 | 9.8 -32% | 7.1 -51% | 11.5 -20% | 13.9 -3% | 12.5 -13% | 15 ? 4% | ||||
| WiFi v1.3 (h) | 11.6 | 8.2 -29% | 6.6 -43% | 7.4 -36% | 8.3 -28% | 9.1 -22% | 12.2 5% | 9.4 -19% | 10.1 -13% | 11.3 -3% | 12.9 ? 11% |
| Load (h) | 2.4 | 1.4 -42% | 1.6 -33% | 1.3 -46% | 1.7 -29% | 1.807 ? -25% | |||||
| Reader / Idle (h) | 10.7 | 23.7 ? |
Pro
Contra
Dit is de verkorte versie van het originele artikel. Het volledige, Engelse testrapport vind je hier.
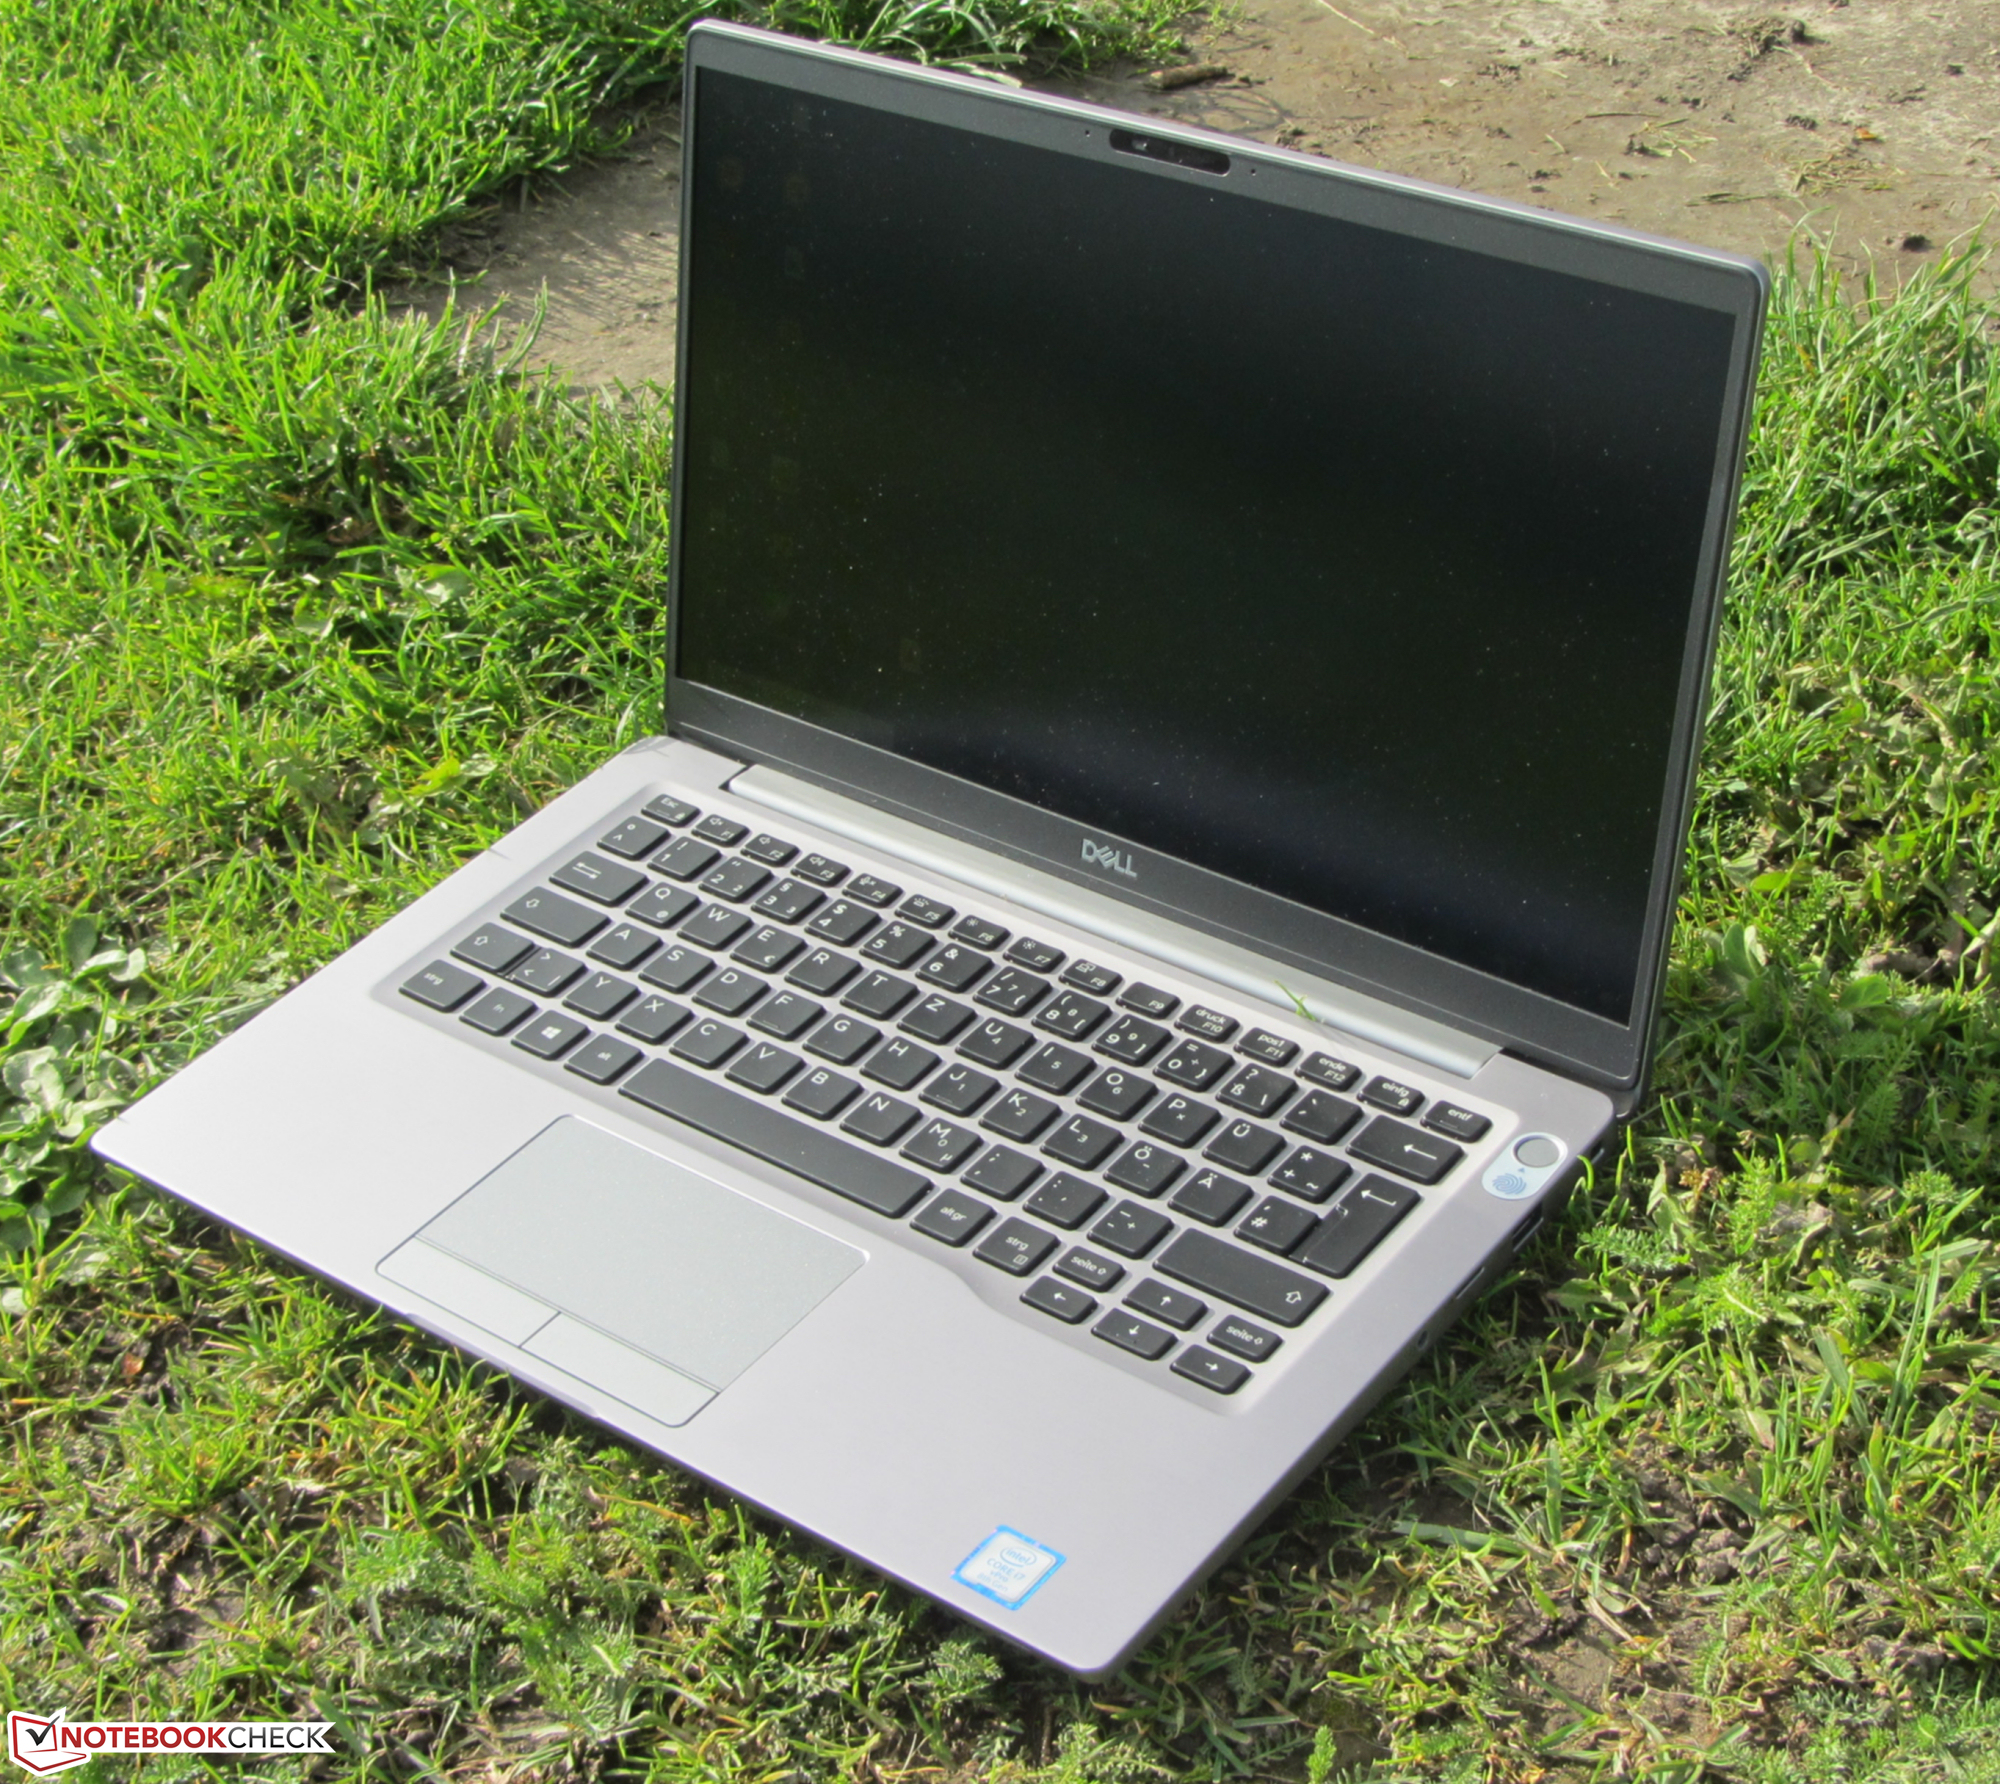
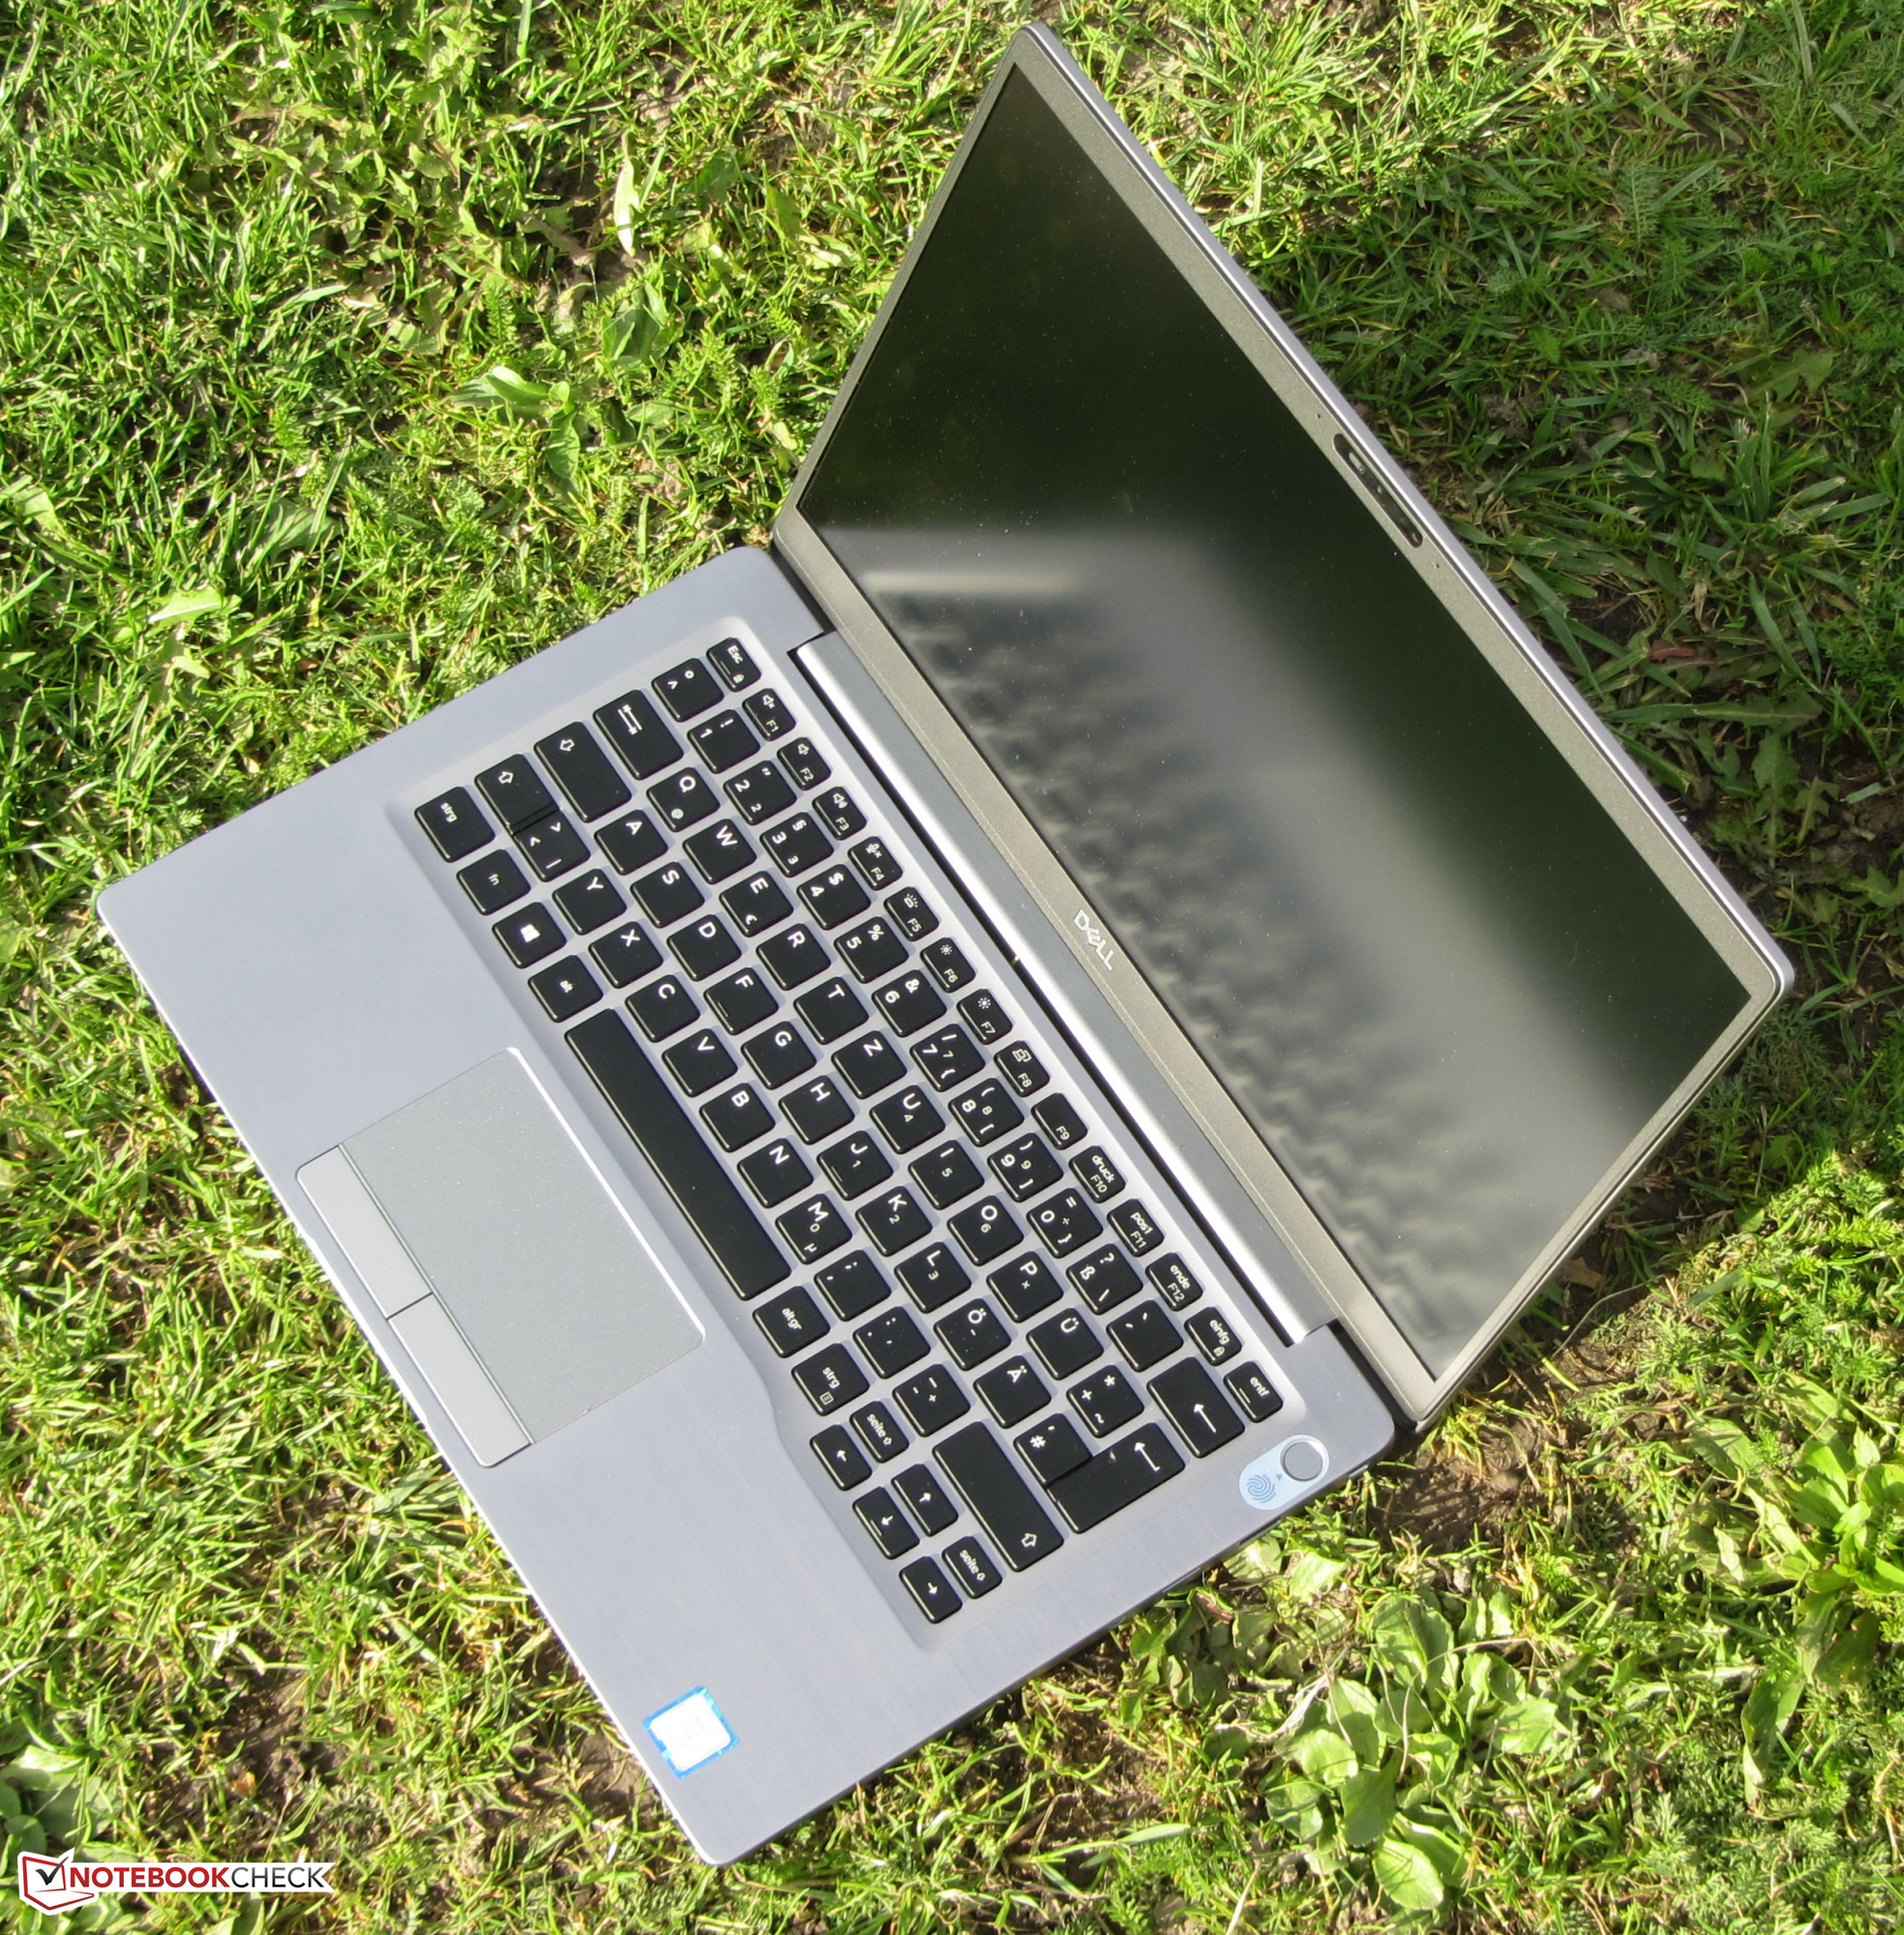
De Dell Latitude 7400 is wat compacter en lichter dan zijn voorganger. Het toestel is er met zijn dunne schermranden een stuk aantrekkelijker op geworden. De interne componenten zijn in overeenstemming met de laatste trends in de industrie. Een Whiskey Lake quad-core-processor zorgt voor meer dan genoeg rekenkracht voor kantoor- en Internet-applicaties. Het volle potentieel kan echter alleen met netstroom benut worden. In batterijmodus kan de CPU zijn Turbo nauwelijks gebruiken. Dat is de prijs die je betaalt voor goede batterijduur.
Met de Latitude 7400 biedt Dell een high-end zakelijke laptop die niet zonder zwaktes is.
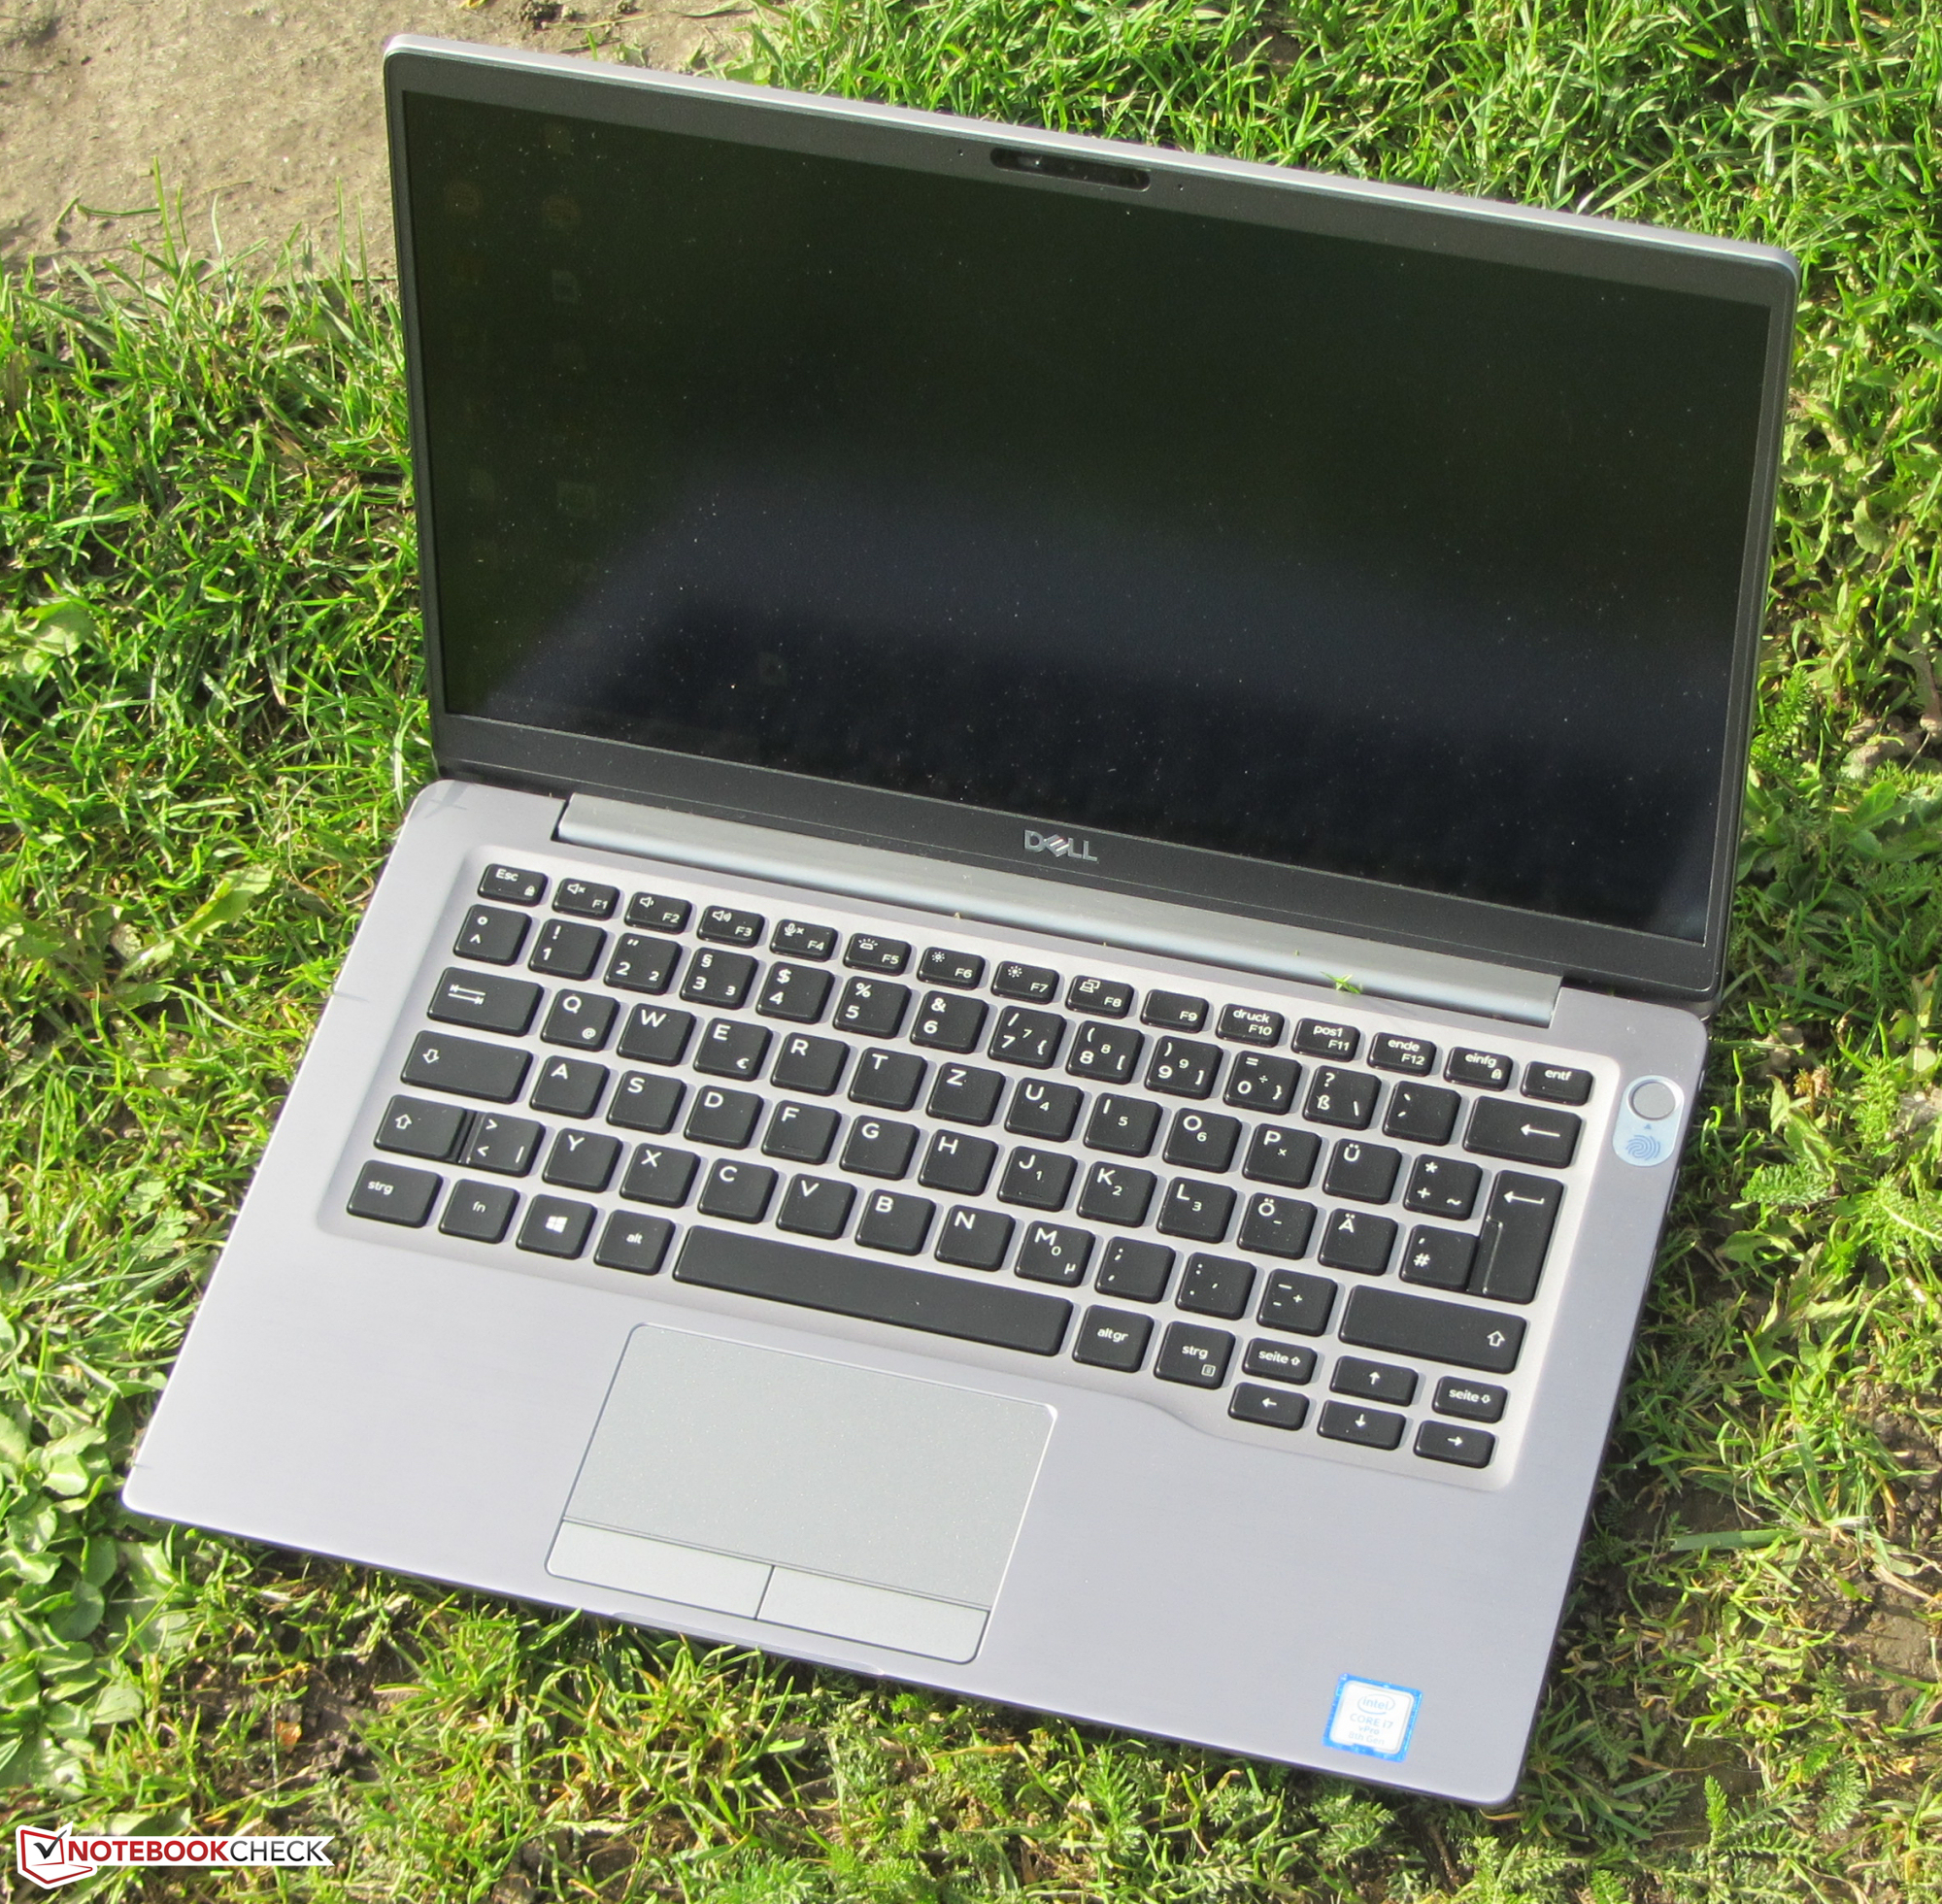
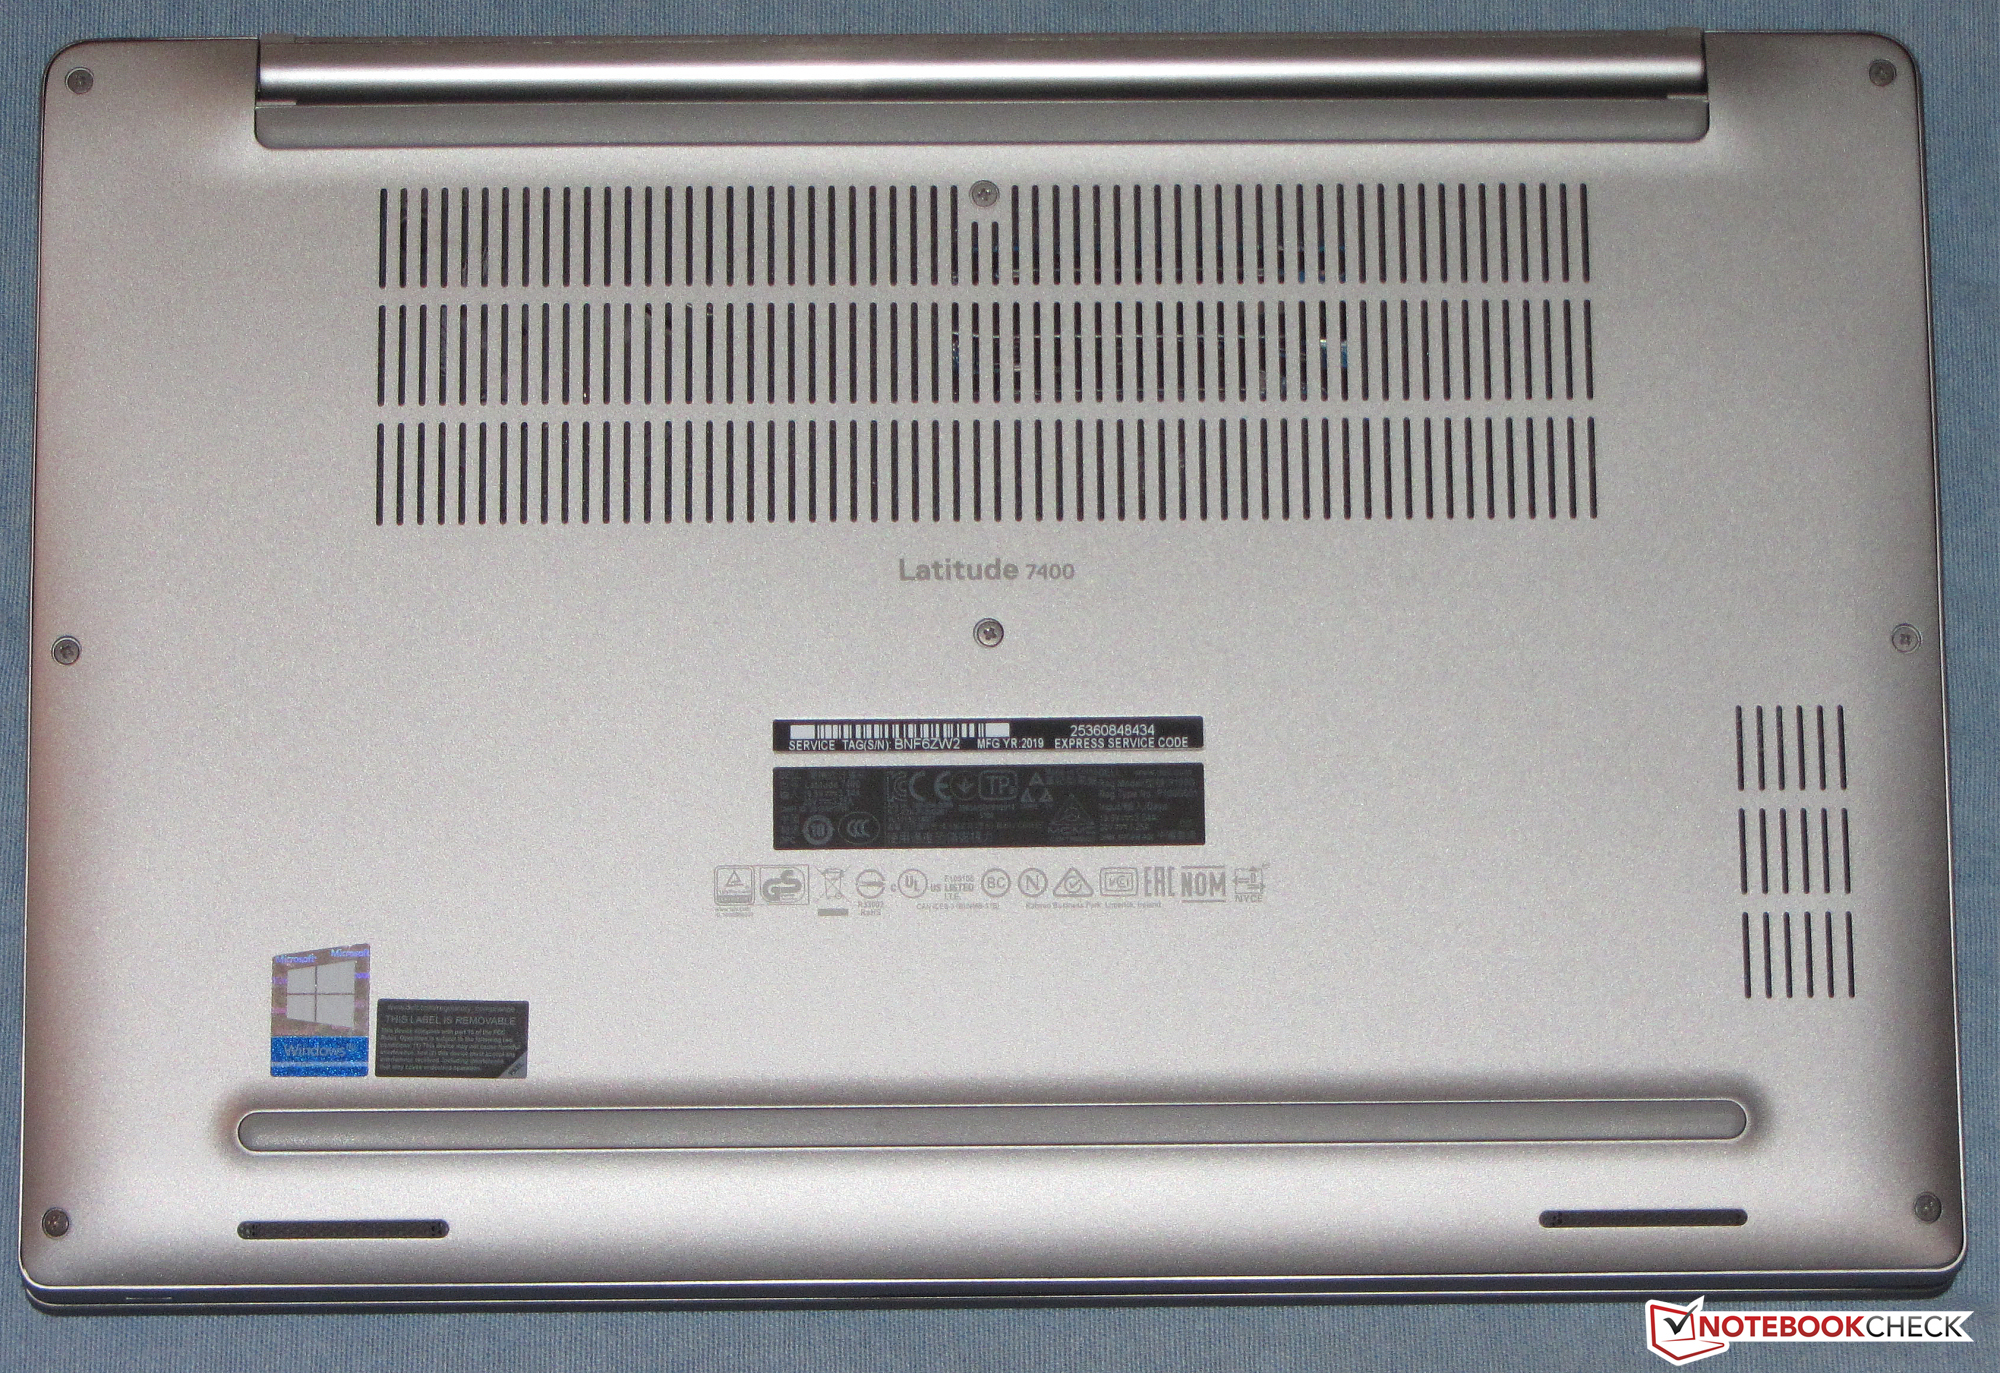
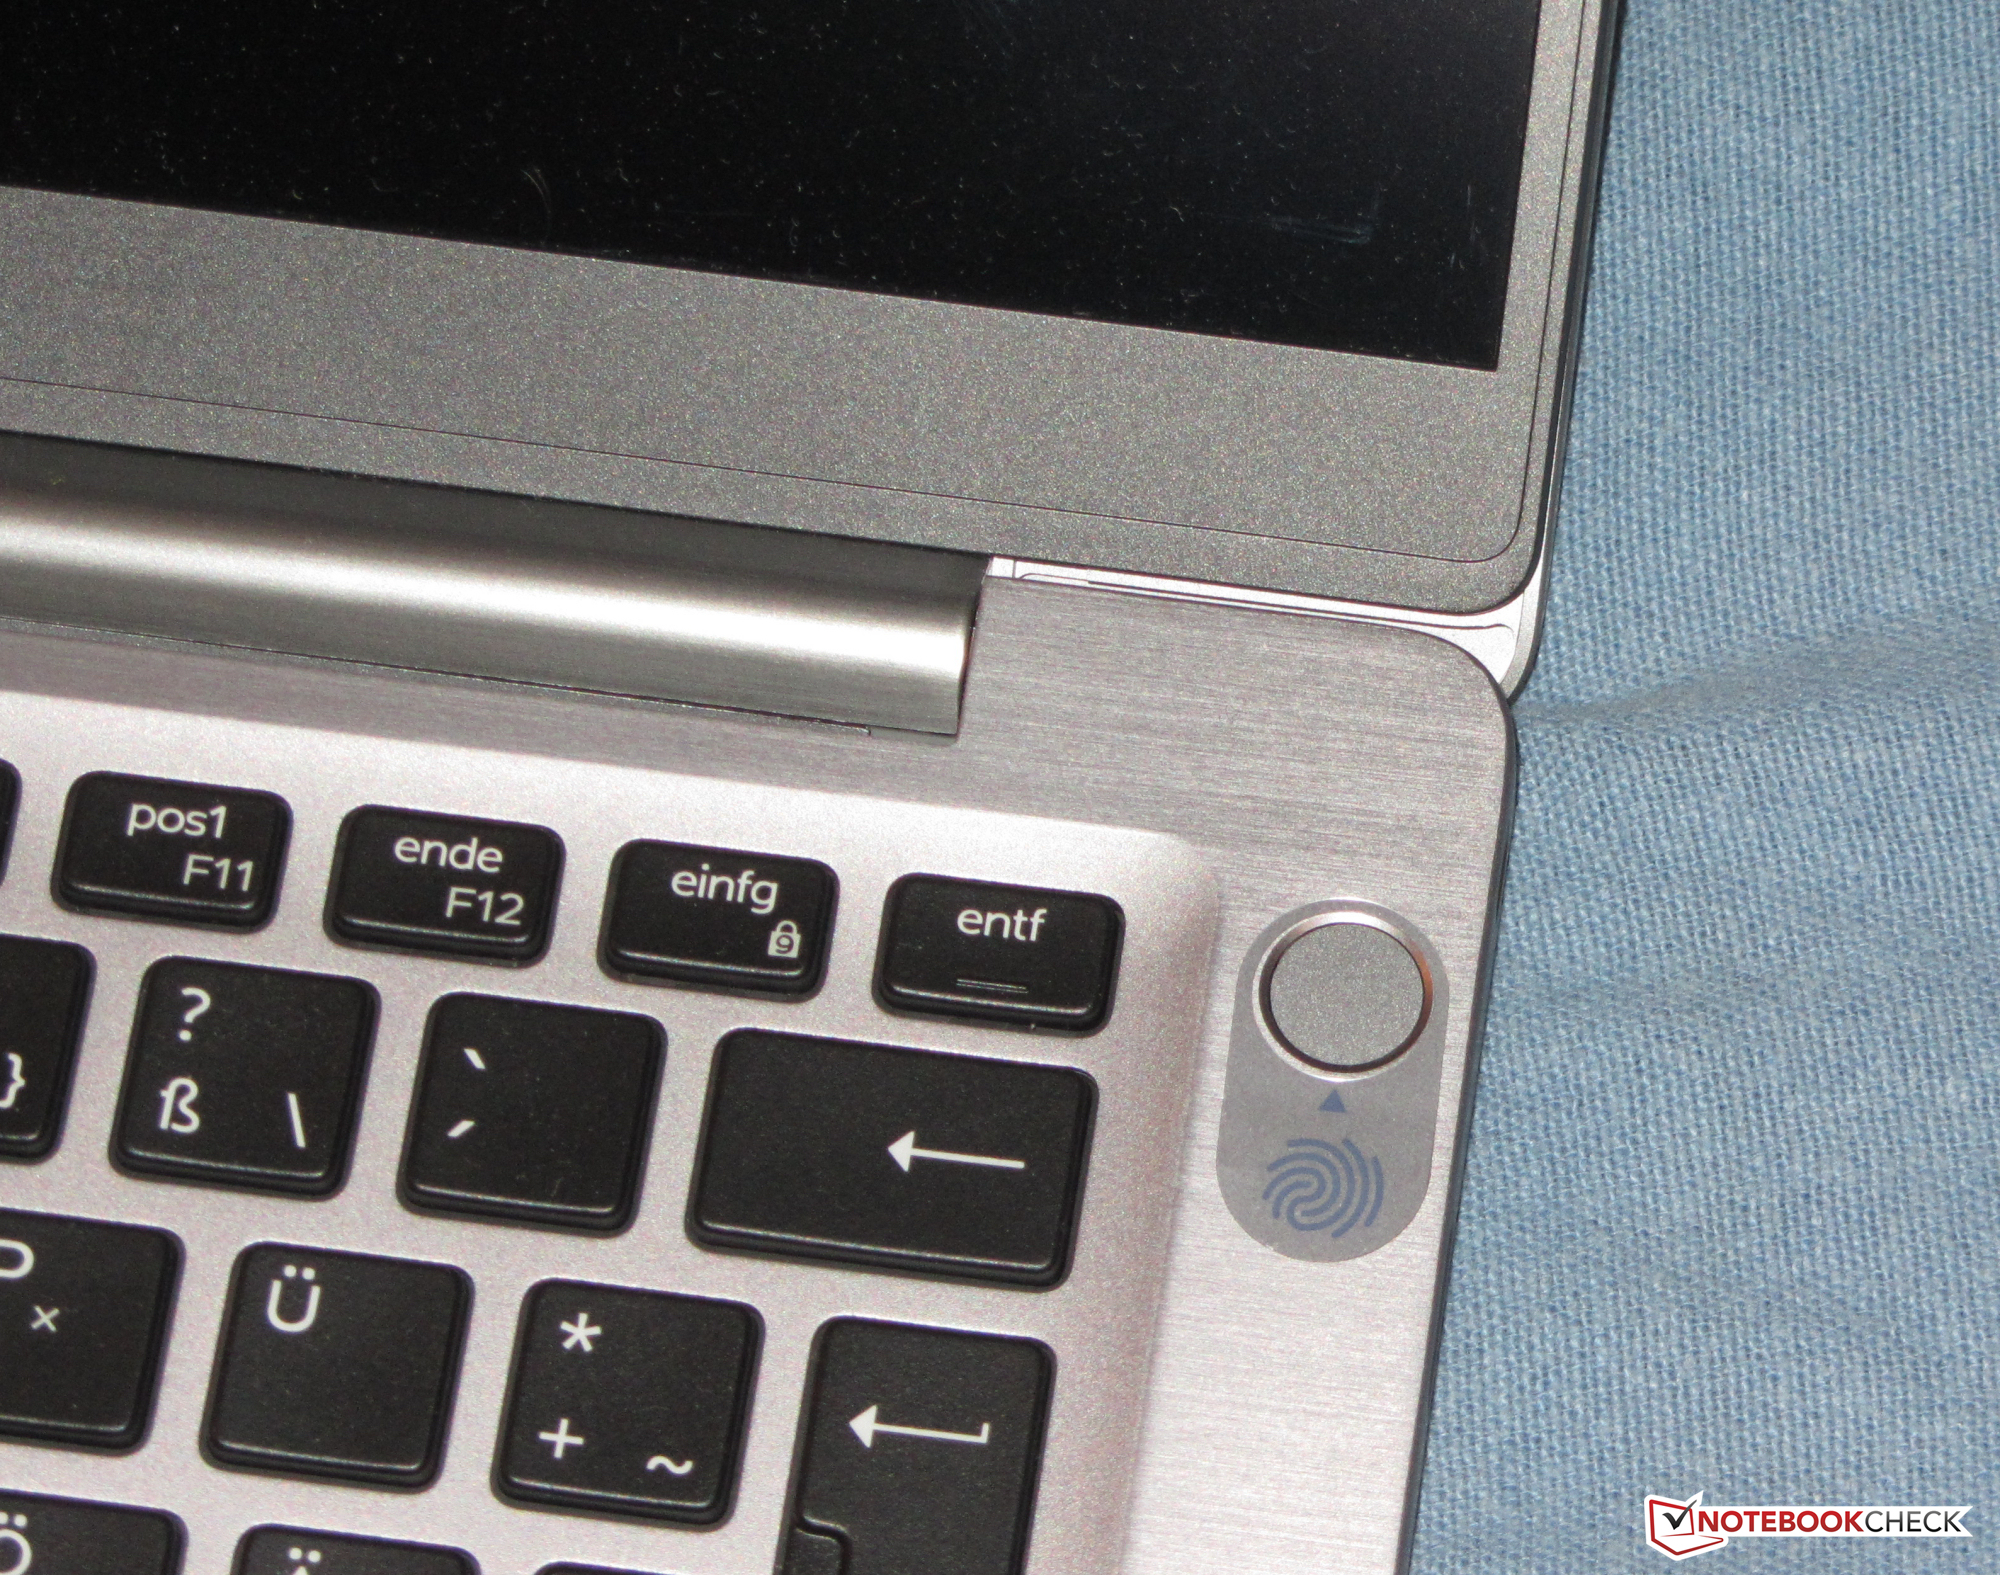
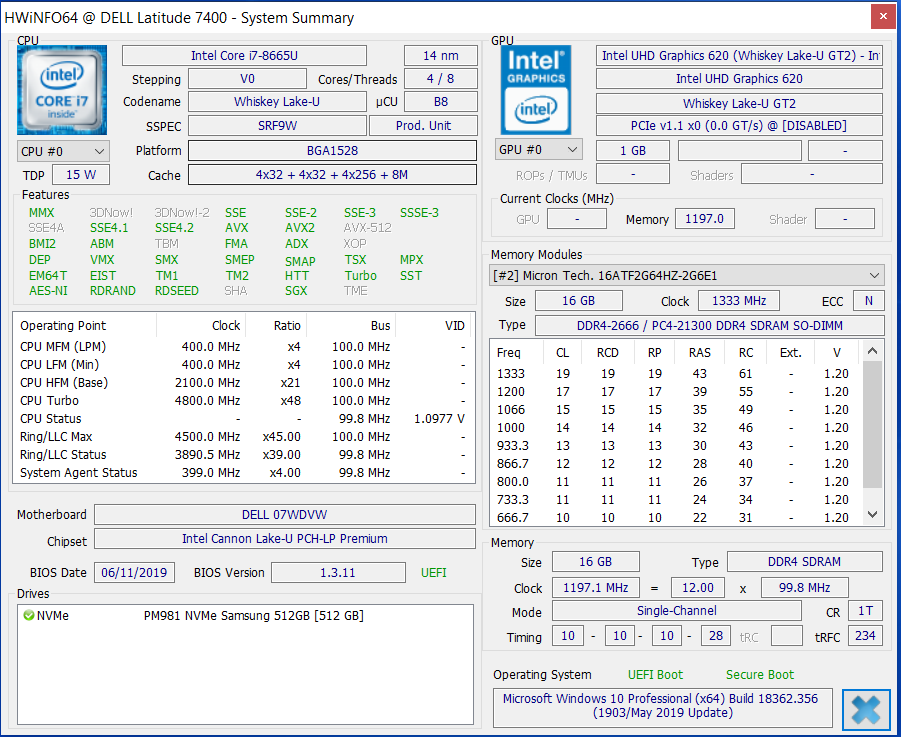
Een snelle NVMe-SSD zorgt voor een vlotte werking van het systeem. De SSD is verwisselbaar, maar hiervoor dien je wel de behuizing te openen. Een hoogtepunt van de laptop is volgens ons het toetsenbord, dat tot de beste toetsenborden behoort die we ooit hebben getest. Toetsenbordverlichting (twee niveaus) is eveneens aanwezig.
Het ontspiegelde IPS-scherm scoort punten met zijn stabiele kijkhoeken, prima contrast, degelijke kleurweergave en een goede dekking van de kleurruimtes. De helderheid van het scherm is prima, maar had nog beter gemogen voor deze prijsklasse. De laptop is dus moeilijk te gebruiken buitenshuis.
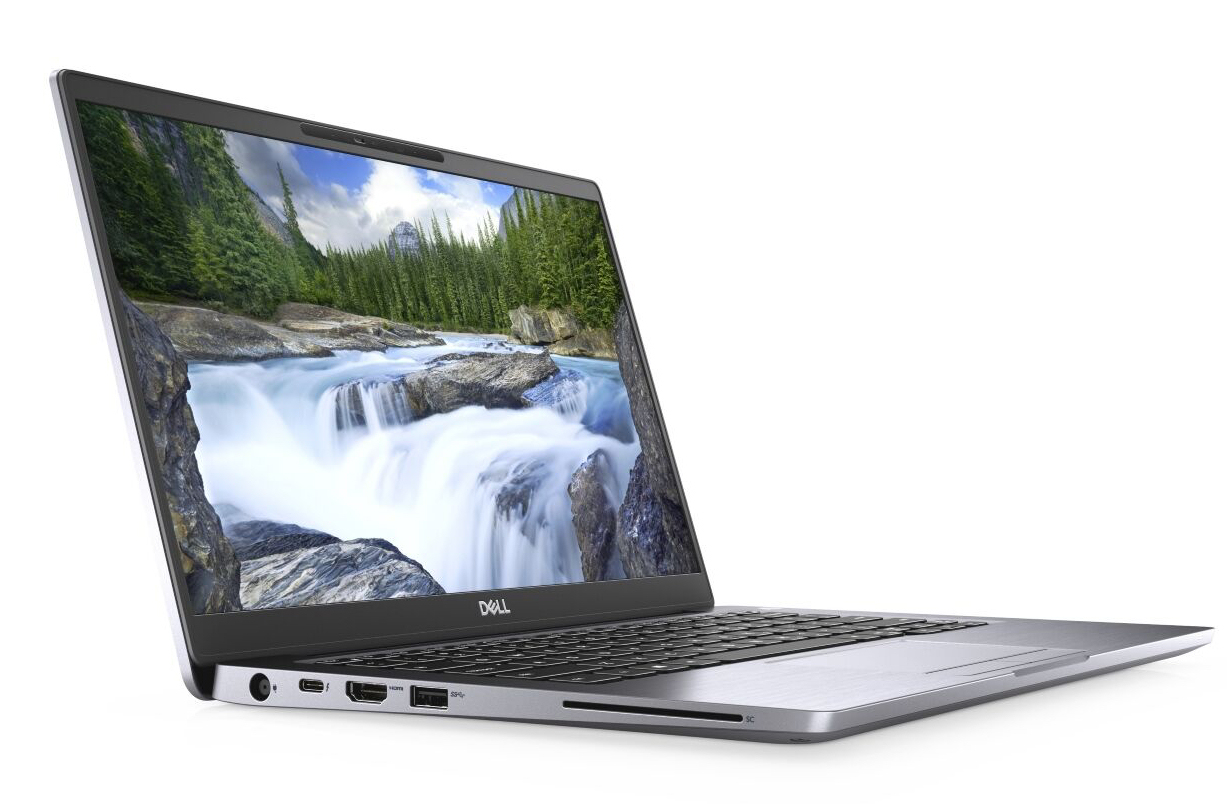
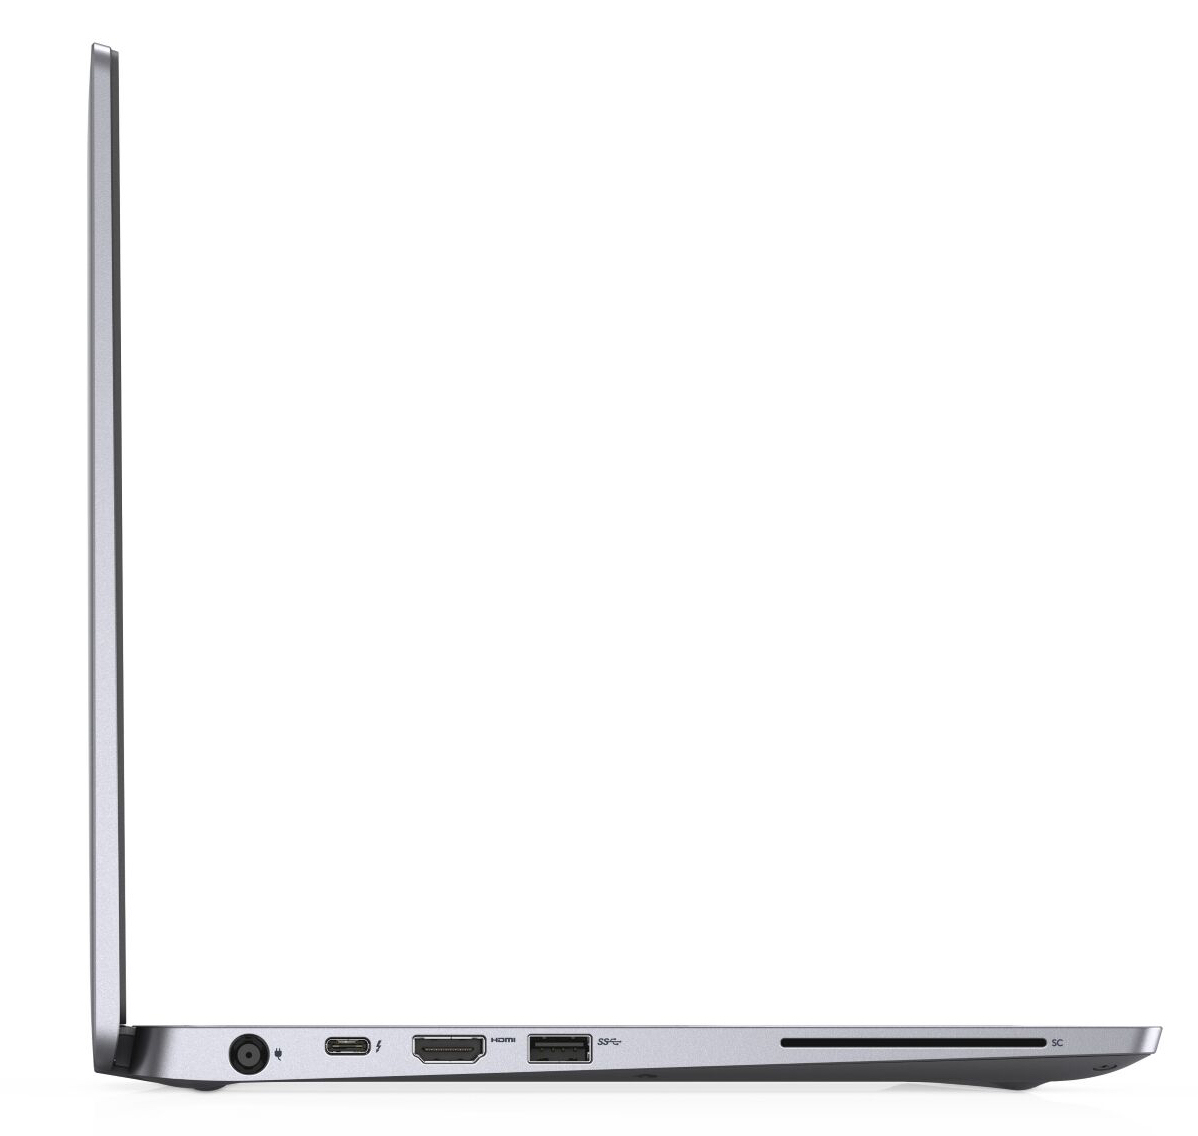
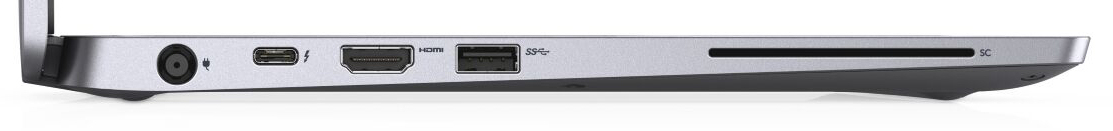
De Thunderbolt 3-poort laat toe om een docking-station of externe GPU aan te sluiten. Deze poort ondersteunt uiteraard zowel Power Delivery 3.0 en DisplayPort-over-USB-C (die vereist een aparte adapter). Helaas maakt de ventilator een fluitend geluid.
Dell Latitude 7400-8N6DH
- 19-09-2019 v7 (old)
Sascha Mölck