Kort testrapport Dell Latitude 7490 (i7-8650U, FHD Touchscreen) Laptop

| SD Card Reader | |
| average JPG Copy Test (av. of 3 runs) | |
| Lenovo ThinkPad X1 Carbon 2018-20KGS03900 (Toshiba Exceria Pro M501) | |
| Dell Latitude 7490 (Toshiba Exceria Pro M501 UHS-II) | |
| Lenovo ThinkPad T480-20L6S01V00 (Toshiba Exceria Pro SDXC 64 GB UHS-II) | |
| Dell Latitude 7480 (Toshiba (Exceria Pro SDXC UHS-II 64 GB) | |
| Toshiba Tecra X40-D | |
| Lenovo ThinkPad T480s-20L8S02E00 (Toshiba Exceria Pro SDXC 64 GB UHS-II) | |
| Gemiddelde van klas Office (19.8 - 198.5, n=22, laatste 2 jaar) | |
| maximum AS SSD Seq Read Test (1GB) | |
| Lenovo ThinkPad X1 Carbon 2018-20KGS03900 (Toshiba Exceria Pro M501) | |
| Dell Latitude 7490 (Toshiba Exceria Pro M501 UHS-II) | |
| Dell Latitude 7480 (Toshiba (Exceria Pro SDXC UHS-II 64 GB) | |
| Lenovo ThinkPad T480s-20L8S02E00 (Toshiba Exceria Pro SDXC 64 GB UHS-II) | |
| Toshiba Tecra X40-D | |
| Lenovo ThinkPad T480-20L6S01V00 (Toshiba Exceria Pro SDXC 64 GB UHS-II) | |
| Gemiddelde van klas Office (27.4 - 249, n=21, laatste 2 jaar) | |
| |||||||||||||||||||||||||
Helderheidsverdeling: 87 %
Helderheid in Batterij-modus: 328.2 cd/m²
Contrast: 887:1 (Zwart: 0.37 cd/m²)
ΔE ColorChecker Calman: 3.82 | ∀{0.5-29.43 Ø4.71}
calibrated: 3.5
ΔE Greyscale Calman: 3 | ∀{0.09-98 Ø4.96}
88% sRGB (Argyll 1.6.3 3D)
58% AdobeRGB 1998 (Argyll 1.6.3 3D)
64.8% AdobeRGB 1998 (Argyll 3D)
88.8% sRGB (Argyll 3D)
63.6% Display P3 (Argyll 3D)
Gamma: 2.36
CCT: 6962 K
| Dell Latitude 7490 AU Optronics AU0223D, IPS, 14", 1920x1080 | Dell Latitude 7480 LG Philips LGD0557, IPS, 14", 1920x1080 | Lenovo ThinkPad T480-20L6S01V00 Lenovo LP140WF6-SPB7, IPS, 14", 1920x1080 | Lenovo ThinkPad T480s-20L8S02E00 LP140QH2-SPB1, IPS LED, 14", 2560x1440 | Lenovo ThinkPad X1 Carbon 2018-20KGS03900 B140QAN02.0, IPS, 14", 2560x1440 | Toshiba Tecra X40-D Toshiba TOS508F, IPS, 14", 1920x1080 | Asus ASUSPRO B9440UA-GV0100T AU Optronics AUO353D / B140HAN03.5, IPS, 14", 1920x1080 | HP Elitebook 1040 G4-2XU40UT Chi Mei CMN14D7, IPS, 14", 1920x1080 | |
|---|---|---|---|---|---|---|---|---|
| Display | 3% | -36% | 11% | 35% | -34% | 1% | 7% | |
| Display P3 Coverage (%) | 63.6 | 65.4 3% | 39.24 -38% | 71.4 12% | 87.7 38% | 40.55 -36% | 64 1% | 66.8 5% |
| sRGB Coverage (%) | 88.8 | 92.3 4% | 58.8 -34% | 96.6 9% | 100 13% | 61 -31% | 89.1 0% | 97.1 9% |
| AdobeRGB 1998 Coverage (%) | 64.8 | 65.8 2% | 40.56 -37% | 72.1 11% | 99.9 54% | 41.89 -35% | 65.2 1% | 69 6% |
| Response Times | 10% | 25% | 20% | -14% | 19% | 2% | 18% | |
| Response Time Grey 50% / Grey 80% * (ms) | 48.4 ? | 40.8 ? 16% | 35.6 ? 26% | 36 ? 26% | 59.2 ? -22% | 38 ? 21% | 48.8 ? -1% | 34.4 ? 29% |
| Response Time Black / White * (ms) | 32.4 ? | 31.2 ? 4% | 24.8 ? 23% | 28 ? 14% | 34.4 ? -6% | 26.8 ? 17% | 30.8 ? 5% | 30 ? 7% |
| PWM Frequency (Hz) | 20410 ? | 26040 ? | ||||||
| Screen | 7% | -36% | 5% | 40% | -45% | -40% | 1% | |
| Brightness middle (cd/m²) | 328.2 | 344 5% | 307 -6% | 311 -5% | 578 76% | 283.9 -13% | 319 -3% | 295.9 -10% |
| Brightness (cd/m²) | 305 | 321 5% | 295 -3% | 302 -1% | 533 75% | 261 -14% | 294 -4% | 287 -6% |
| Brightness Distribution (%) | 87 | 85 -2% | 90 3% | 91 5% | 84 -3% | 85 -2% | 87 0% | 87 0% |
| Black Level * (cd/m²) | 0.37 | 0.32 14% | 0.25 32% | 0.36 3% | 0.38 -3% | 0.25 32% | 0.26 30% | 0.23 38% |
| Contrast (:1) | 887 | 1075 21% | 1228 38% | 864 -3% | 1521 71% | 1136 28% | 1227 38% | 1287 45% |
| Colorchecker dE 2000 * | 3.82 | 2.6 32% | 5.7 -49% | 3 21% | 1.9 50% | 6.4 -68% | 7.1 -86% | 2.83 26% |
| Colorchecker dE 2000 max. * | 5.58 | 7.8 -40% | 21.3 -282% | 6.1 -9% | 3.8 32% | 18.7 -235% | 13.7 -146% | 7.34 -32% |
| Colorchecker dE 2000 calibrated * | 3.5 | 4.7 -34% | 1.7 51% | 0.8 77% | ||||
| Greyscale dE 2000 * | 3 | 2.6 13% | 3.7 -23% | 4 -33% | 3 -0% | 6.3 -110% | 9.61 -220% | 5.2 -73% |
| Gamma | 2.36 93% | 2.28 96% | 2.11 104% | 2.17 101% | 2.14 103% | 2.39 92% | 2.33 94% | 2.28 96% |
| CCT | 6962 93% | 7050 92% | 7353 88% | 6961 93% | 6377 102% | 6511 100% | 6021 108% | 7056 92% |
| Color Space (Percent of AdobeRGB 1998) (%) | 58 | 65.82 13% | 37.4 -36% | 66.7 15% | 88.8 53% | 38 -34% | 54.01 -7% | 63 9% |
| Color Space (Percent of sRGB) (%) | 88 | 92.27 5% | 58.7 -33% | 96.7 10% | 100 14% | 60 -32% | 83.02 -6% | 97 10% |
| Totaal Gemiddelde (Programma / Instellingen) | 7% /
6% | -16% /
-28% | 12% /
8% | 20% /
32% | -20% /
-34% | -12% /
-27% | 9% /
4% |
* ... kleiner is beter
Responstijd Scherm
| ↔ Responstijd Zwart naar Wit | ||
|---|---|---|
| 32.4 ms ... stijging ↗ en daling ↘ gecombineerd | ↗ 18.8 ms stijging | 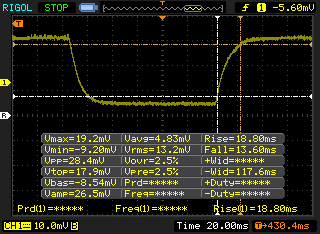 |
| ↘ 13.6 ms daling | ||
| Het scherm vertoonde trage responstijden in onze tests en is misschien te traag voor games. Ter vergelijking: alle testtoestellen variëren van 0.1 (minimum) tot 240 (maximum) ms. » 88 % van alle toestellen zijn beter. Dit betekent dat de gemeten responstijd slechter is dan het gemiddelde (19.8 ms) van alle geteste toestellen. | ||
| ↔ Responstijd 50% Grijs naar 80% Grijs | ||
| 48.4 ms ... stijging ↗ en daling ↘ gecombineerd | ↗ 27.6 ms stijging | 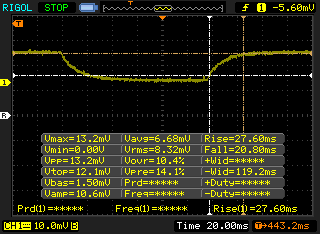 |
| ↘ 20.8 ms daling | ||
| Het scherm vertoonde trage responstijden in onze tests en is misschien te traag voor games. Ter vergelijking: alle testtoestellen variëren van 0.165 (minimum) tot 636 (maximum) ms. » 84 % van alle toestellen zijn beter. Dit betekent dat de gemeten responstijd slechter is dan het gemiddelde (31 ms) van alle geteste toestellen. | ||
Screen Flickering / PWM (Pulse-Width Modulation)
| Screen flickering / PWM niet waargenomen | 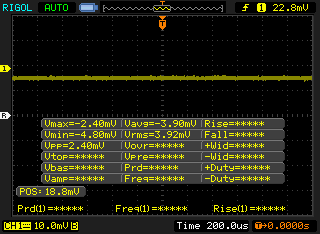 | ||
Ter vergelijking: 52 % van alle geteste toestellen maakten geen gebruik van PWM om de schermhelderheid te verlagen. Als het wel werd gebruikt, werd een gemiddelde van 7754 (minimum: 5 - maximum: 343500) Hz waargenomen. | |||
* ... kleiner is beter
| PCMark 8 Home Score Accelerated v2 | 4029 punten | |
| PCMark 8 Creative Score Accelerated v2 | 5165 punten | |
| PCMark 8 Work Score Accelerated v2 | 5155 punten | |
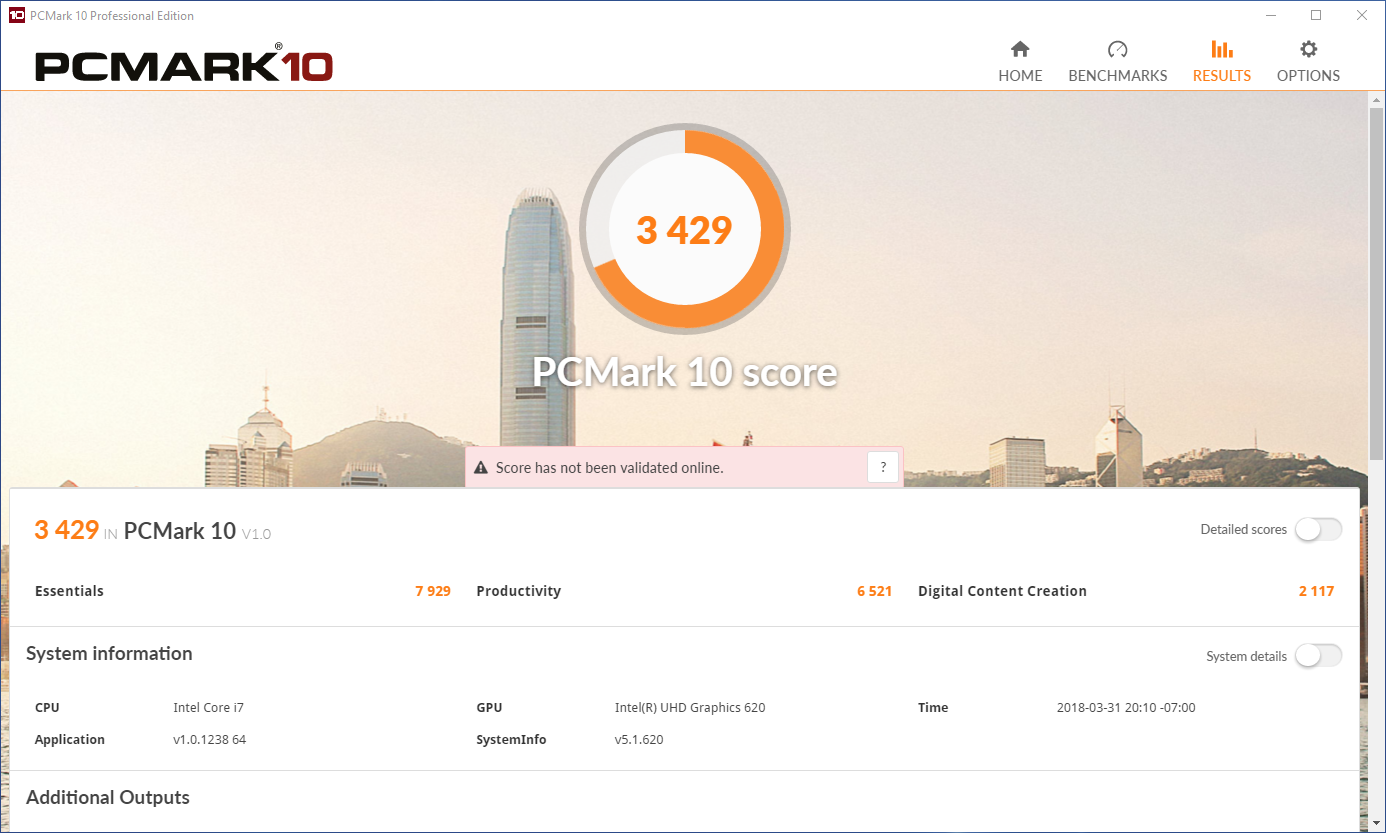
| PCMark 10 Score | 3429 punten | |
Help | ||
| Dell Latitude 7490 Samsung PM961 MZVLW256HEHP | Dell Latitude 7480 Intel SSDSCKKF256H6 | Lenovo ThinkPad T480-20L6S01V00 Samsung SSD PM981 MZVLB512HAJQ | Lenovo ThinkPad T480s-20L8S02E00 Samsung SSD PM981 MZVLB512HAJQ | Lenovo ThinkPad X1 Carbon 2018-20KGS03900 Samsung SSD PM981 MZVLB512HAJQ | Toshiba Tecra X40-D Samsung PM961 MZVLW256HEHP | Asus ASUSPRO B9440UA-GV0100T Micron SSD 1100 (MTFDDAV256TBN) | HP Elitebook 1040 G4-2XU40UT Toshiba XG4 NVMe (THNSN5512GPUK) | Gemiddeld Samsung PM961 MZVLW256HEHP | |
|---|---|---|---|---|---|---|---|---|---|
| AS SSD | -59% | -603% | 76% | 78% | 22% | -62% | -16% | -98% | |
| Copy Game MB/s (MB/s) | 382.3 | 228.1 -40% | 676 77% | 1110 190% | 1107 190% | 394.2 3% | 537 ? 40% | ||
| Copy Program MB/s (MB/s) | 227.1 | 148.2 -35% | 254.8 12% | 387.5 71% | 460.2 103% | 133.7 -41% | 343 ? 51% | ||
| Copy ISO MB/s (MB/s) | 872 | 262.3 -70% | 921 6% | 1412 62% | 1247 43% | 534 -39% | 1004 ? 15% | ||
| Score Total (Points) | 2350 | 764 -67% | 2348 0% | 4115 75% | 3529 50% | 3576 52% | 842 -64% | 2299 -2% | 2565 ? 9% |
| Score Write (Points) | 536 | 249 -54% | 147 -73% | 1708 219% | 1801 236% | 675 26% | 372 -31% | 848 58% | 587 ? 10% |
| Score Read (Points) | 1242 | 338 -73% | 1480 19% | 1623 31% | 1168 -6% | 1963 58% | 307 -75% | 979 -21% | 1378 ? 11% |
| Access Time Write * (ms) | 0.03 | 0.042 -40% | 2.515 -8283% | 0.033 -10% | 0.027 10% | 0.028 7% | 0.054 -80% | 0.038 -27% | 0.4637 ? -1446% |
| Access Time Read * (ms) | 0.04 | 0.082 -105% | 0.041 -2% | 0.045 -13% | 0.029 27% | 0.061 -53% | 0.088 -120% | 0.105 -163% | 0.06777 ? -69% |
| 4K-64 Write (MB/s) | 329.6 | 125.4 -62% | 96.2 -71% | 1456 342% | 1529 364% | 438.4 33% | 252.9 -23% | 662 101% | 419 ? 27% |
| 4K-64 Read (MB/s) | 955 | 260 -73% | 1278 34% | 1329 39% | 876 -8% | 1663 74% | 234 -75% | 782 -18% | 1112 ? 16% |
| 4K Write (MB/s) | 114.9 | 86.6 -25% | 1.76 -98% | 114.4 0% | 134.3 17% | 124.8 9% | 77.5 -33% | 100.1 -13% | 91.6 ? -20% |
| 4K Read (MB/s) | 48.13 | 28.89 -40% | 58 21% | 49.81 3% | 52.4 9% | 51.6 7% | 24.21 -50% | 38.49 -20% | 45.1 ? -6% |
| Seq Write (MB/s) | 919 | 367.5 -60% | 487.1 -47% | 1382 50% | 1376 50% | 1117 22% | 419.6 -54% | 863 -6% | 960 ? 4% |
| Seq Read (MB/s) | 2385 | 492.8 -79% | 1441 -40% | 2440 2% | 2396 0% | 2479 4% | 490.2 -79% | 1585 -34% | 2019 ? -15% |
* ... kleiner is beter

| 3DMark Cloud Gate Standard Score | 8591 punten | |
| 3DMark Fire Strike Score | 1077 punten | |
Help | ||
| Rocket League | |
| 1280x720 Performance (sorteer op waarde) | |
| Dell Latitude 7490 | |
| Gemiddeld Intel UHD Graphics 620 (20.1 - 95, n=26) | |
| 1920x1080 Performance (sorteer op waarde) | |
| Dell Latitude 7490 | |
| Gemiddeld Intel UHD Graphics 620 (17.1 - 78.4, n=13) | |
| 1920x1080 Quality AA:Medium FX (sorteer op waarde) | |
| Dell Latitude 7490 | |
| Gemiddeld Intel UHD Graphics 620 (13.1 - 43, n=24) | |
| 1920x1080 High Quality AA:High FX (sorteer op waarde) | |
| Dell Latitude 7490 | |
| Asus Zephyrus M GM501 | |
| Gemiddeld Intel UHD Graphics 620 (13.2 - 24.7, n=21) | |
| lage | gem. | hoge | ultra | |
|---|---|---|---|---|
| BioShock Infinite (2013) | 53 | 35 | 30 | 10 |
| Civilization 6 (2016) | 33 | 15 | 6 | 5 |
| Rocket League (2017) | 50 | 32 | 20 |
Geluidsniveau
| Onbelast |
| 28.2 / 28.2 / 31.4 dB (A) |
| Belasting |
| 31.7 / 41.2 dB (A) |
 | ||
30 dB stil 40 dB(A) hoorbaar 50 dB(A) luid |
||
min: | ||
| Dell Latitude 7490 UHD Graphics 620, i7-8650U, Samsung PM961 MZVLW256HEHP | Dell Latitude 7480 HD Graphics 620, i7-7600U, Intel SSDSCKKF256H6 | Lenovo ThinkPad T480-20L6S01V00 GeForce MX150, i5-8550U, Samsung SSD PM981 MZVLB512HAJQ | Lenovo ThinkPad T480s-20L8S02E00 GeForce MX150, i5-8550U, Samsung SSD PM981 MZVLB512HAJQ | Lenovo ThinkPad X1 Carbon 2018-20KGS03900 UHD Graphics 620, i5-8550U, Samsung SSD PM981 MZVLB512HAJQ | Toshiba Tecra X40-D HD Graphics 620, i7-7600U, Samsung PM961 MZVLW256HEHP | Asus ASUSPRO B9440UA-GV0100T HD Graphics 620, i5-7200U, Micron SSD 1100 (MTFDDAV256TBN) | HP Elitebook 1040 G4-2XU40UT HD Graphics 630, i7-7820HQ, Toshiba XG4 NVMe (THNSN5512GPUK) | |
|---|---|---|---|---|---|---|---|---|
| Noise | 7% | 0% | -2% | -1% | 2% | -3% | 3% | |
| uit / omgeving * (dB) | 28.2 | 29 -3% | 29 -3% | 28.9 -2% | 28 1% | 29 -3% | 28.2 -0% | |
| Idle Minimum * (dB) | 28.2 | 28.6 -1% | 29 -3% | 29 -3% | 28.9 -2% | 28 1% | 29 -3% | 28.2 -0% |
| Idle Average * (dB) | 28.2 | 28.6 -1% | 29 -3% | 29 -3% | 28.9 -2% | 28 1% | 29 -3% | 28.2 -0% |
| Idle Maximum * (dB) | 31.4 | 28.6 9% | 29 8% | 29 8% | 32.5 -4% | 28.2 10% | 29 8% | 28.2 10% |
| Load Average * (dB) | 31.7 | 30.2 5% | 35.6 -12% | 36.5 -15% | 35.1 -11% | 33.2 -5% | 36.7 -16% | 33.3 -5% |
| Load Maximum * (dB) | 41.2 | 31.2 24% | 35.6 14% | 38.2 7% | 35.1 15% | 39.9 3% | 40.2 2% | 35.3 14% |
| Witcher 3 ultra * (dB) | 32.5 | 32.8 |
* ... kleiner is beter
(±) De maximumtemperatuur aan de bovenzijde bedraagt 45 °C / 113 F, vergeleken met het gemiddelde van 34.3 °C / 94 F, variërend van 21.2 tot 62.5 °C voor de klasse Office.
(-) De bodem warmt op tot een maximum van 56 °C / 133 F, vergeleken met een gemiddelde van 36.8 °C / 98 F
(+) Bij onbelast gebruik bedraagt de gemiddelde temperatuur voor de bovenzijde 25.2 °C / 77 F, vergeleken met het apparaatgemiddelde van 29.5 °C / 85 F.
(+) De palmsteunen en het touchpad zijn met een maximum van ###max## °C / 82.4 F koeler dan de huidtemperatuur en voelen daarom koel aan.
(±) De gemiddelde temperatuur van de handpalmsteun van soortgelijke toestellen bedroeg 27.5 °C / 81.5 F (-0.5 °C / -0.9 F).
Dell Latitude 7490 audioanalyse
(±) | luidspreker luidheid is gemiddeld maar goed (73.8 dB)
Bas 100 - 315 Hz
(±) | verminderde zeebaars - gemiddeld 14.8% lager dan de mediaan
(±) | lineariteit van de lage tonen is gemiddeld (9.4% delta ten opzichte van de vorige frequentie)
Midden 400 - 2000 Hz
(+) | evenwichtige middens - slechts 4.4% verwijderd van de mediaan
(±) | lineariteit van de middentonen is gemiddeld (8% delta ten opzichte van de vorige frequentie)
Hoog 2 - 16 kHz
(+) | evenwichtige hoogtepunten - slechts 4.4% verwijderd van de mediaan
(±) | lineariteit van de hoogtepunten is gemiddeld (8.2% delta ten opzichte van de vorige frequentie)
Algemeen 100 - 16.000 Hz
(±) | lineariteit van het totale geluid is gemiddeld (19.9% verschil met de mediaan)
Vergeleken met dezelfde klasse
» 42% van alle geteste apparaten in deze klasse waren beter, 9% vergelijkbaar, 49% slechter
» De beste had een delta van 7%, het gemiddelde was 21%, de slechtste was 53%
Vergeleken met alle geteste toestellen
» 51% van alle geteste apparaten waren beter, 7% gelijk, 42% slechter
» De beste had een delta van 4%, het gemiddelde was 23%, de slechtste was 134%
Lenovo ThinkPad T480s-20L8S02E00 audioanalyse
(±) | luidspreker luidheid is gemiddeld maar goed (78.9 dB)
Bas 100 - 315 Hz
(-) | bijna geen lage tonen - gemiddeld 19.4% lager dan de mediaan
(±) | lineariteit van de lage tonen is gemiddeld (12.1% delta ten opzichte van de vorige frequentie)
Midden 400 - 2000 Hz
(±) | hogere middens - gemiddeld 6.5% hoger dan de mediaan
(±) | lineariteit van de middentonen is gemiddeld (9.6% delta ten opzichte van de vorige frequentie)
Hoog 2 - 16 kHz
(+) | evenwichtige hoogtepunten - slechts 3.5% verwijderd van de mediaan
(±) | lineariteit van de hoogtepunten is gemiddeld (7.6% delta ten opzichte van de vorige frequentie)
Algemeen 100 - 16.000 Hz
(±) | lineariteit van het totale geluid is gemiddeld (22.1% verschil met de mediaan)
Vergeleken met dezelfde klasse
» 58% van alle geteste apparaten in deze klasse waren beter, 8% vergelijkbaar, 34% slechter
» De beste had een delta van 7%, het gemiddelde was 21%, de slechtste was 53%
Vergeleken met alle geteste toestellen
» 64% van alle geteste apparaten waren beter, 6% gelijk, 30% slechter
» De beste had een delta van 4%, het gemiddelde was 23%, de slechtste was 134%
| Uit / Standby | |
| Inactief | |
| Belasting |
|
Key:
min: | |
| Dell Latitude 7490 i7-8650U, UHD Graphics 620, Samsung PM961 MZVLW256HEHP, IPS, 1920x1080, 14" | Dell Latitude 7480 i7-7600U, HD Graphics 620, Intel SSDSCKKF256H6, IPS, 1920x1080, 14" | Lenovo ThinkPad T480-20L6S01V00 i5-8550U, GeForce MX150, Samsung SSD PM981 MZVLB512HAJQ, IPS, 1920x1080, 14" | Lenovo ThinkPad T480s-20L8S02E00 i5-8550U, GeForce MX150, Samsung SSD PM981 MZVLB512HAJQ, IPS LED, 2560x1440, 14" | Lenovo ThinkPad X1 Carbon 2018-20KGS03900 i5-8550U, UHD Graphics 620, Samsung SSD PM981 MZVLB512HAJQ, IPS, 2560x1440, 14" | Toshiba Tecra X40-D i7-7600U, HD Graphics 620, Samsung PM961 MZVLW256HEHP, IPS, 1920x1080, 14" | Asus ASUSPRO B9440UA-GV0100T i5-7200U, HD Graphics 620, Micron SSD 1100 (MTFDDAV256TBN), IPS, 1920x1080, 14" | HP Elitebook 1040 G4-2XU40UT i7-7820HQ, HD Graphics 630, Toshiba XG4 NVMe (THNSN5512GPUK), IPS, 1920x1080, 14" | |
|---|---|---|---|---|---|---|---|---|
| Power Consumption | 8% | -31% | -31% | -29% | 2% | 11% | -31% | |
| Idle Minimum * (Watt) | 3.1 | 4.32 -39% | 3.6 -16% | 3.4 -10% | 3.8 -23% | 5.2 -68% | 3.1 -0% | 5.1 -65% |
| Idle Average * (Watt) | 6.5 | 6.27 4% | 7.1 -9% | 7.5 -15% | 8.9 -37% | 6.9 -6% | 6.1 6% | 7 -8% |
| Idle Maximum * (Watt) | 7.6 | 6.35 16% | 9.5 -25% | 10.8 -42% | 11.9 -57% | 7 8% | 6.8 11% | 11.7 -54% |
| Load Average * (Watt) | 43 | 29.82 31% | 63.9 -49% | 55.4 -29% | 47.5 -10% | 24.6 43% | 27.4 36% | 41.2 4% |
| Load Maximum * (Watt) | 43.8 | 30.64 30% | 67.3 -54% | 70.3 -61% | 52.5 -20% | 30.1 31% | 43.7 -0% | 56.9 -30% |
| Witcher 3 ultra * (Watt) | 53.9 | 34 |
* ... kleiner is beter
| Dell Latitude 7490 i7-8650U, UHD Graphics 620, 60 Wh | Dell Latitude 7480 i7-7600U, HD Graphics 620, 60 Wh | Lenovo ThinkPad T480-20L6S01V00 i5-8550U, GeForce MX150, 72 Wh | Lenovo ThinkPad T480s-20L8S02E00 i5-8550U, GeForce MX150, 57 Wh | Lenovo ThinkPad X1 Carbon 2018-20KGS03900 i5-8550U, UHD Graphics 620, 57 Wh | Toshiba Tecra X40-D i7-7600U, HD Graphics 620, 48 Wh | Asus ASUSPRO B9440UA-GV0100T i5-7200U, HD Graphics 620, 48 Wh | HP Elitebook 1040 G4-2XU40UT i7-7820HQ, HD Graphics 630, 67 Wh | |
|---|---|---|---|---|---|---|---|---|
| Batterijduur | 57% | 57% | 1% | 11% | -6% | 12% | 15% | |
| Reader / Idle (h) | 18.6 | 27.7 49% | 27.9 50% | 22.8 23% | 22.1 19% | 14.6 -22% | 19 2% | 22.5 21% |
| WiFi v1.3 (h) | 9.4 | 12 28% | 13.2 40% | 8.8 -6% | 8.7 -7% | 6 -36% | 8.9 -5% | 11.1 18% |
| Load (h) | 1.5 | 2.9 93% | 2.7 80% | 1.3 -13% | 1.8 20% | 2.1 40% | 2.1 40% | 1.6 7% |
Pro
Contra
Dit is de verkorte versie van het originele artikel. Het volledige, Engelse testrapport vind je hier.
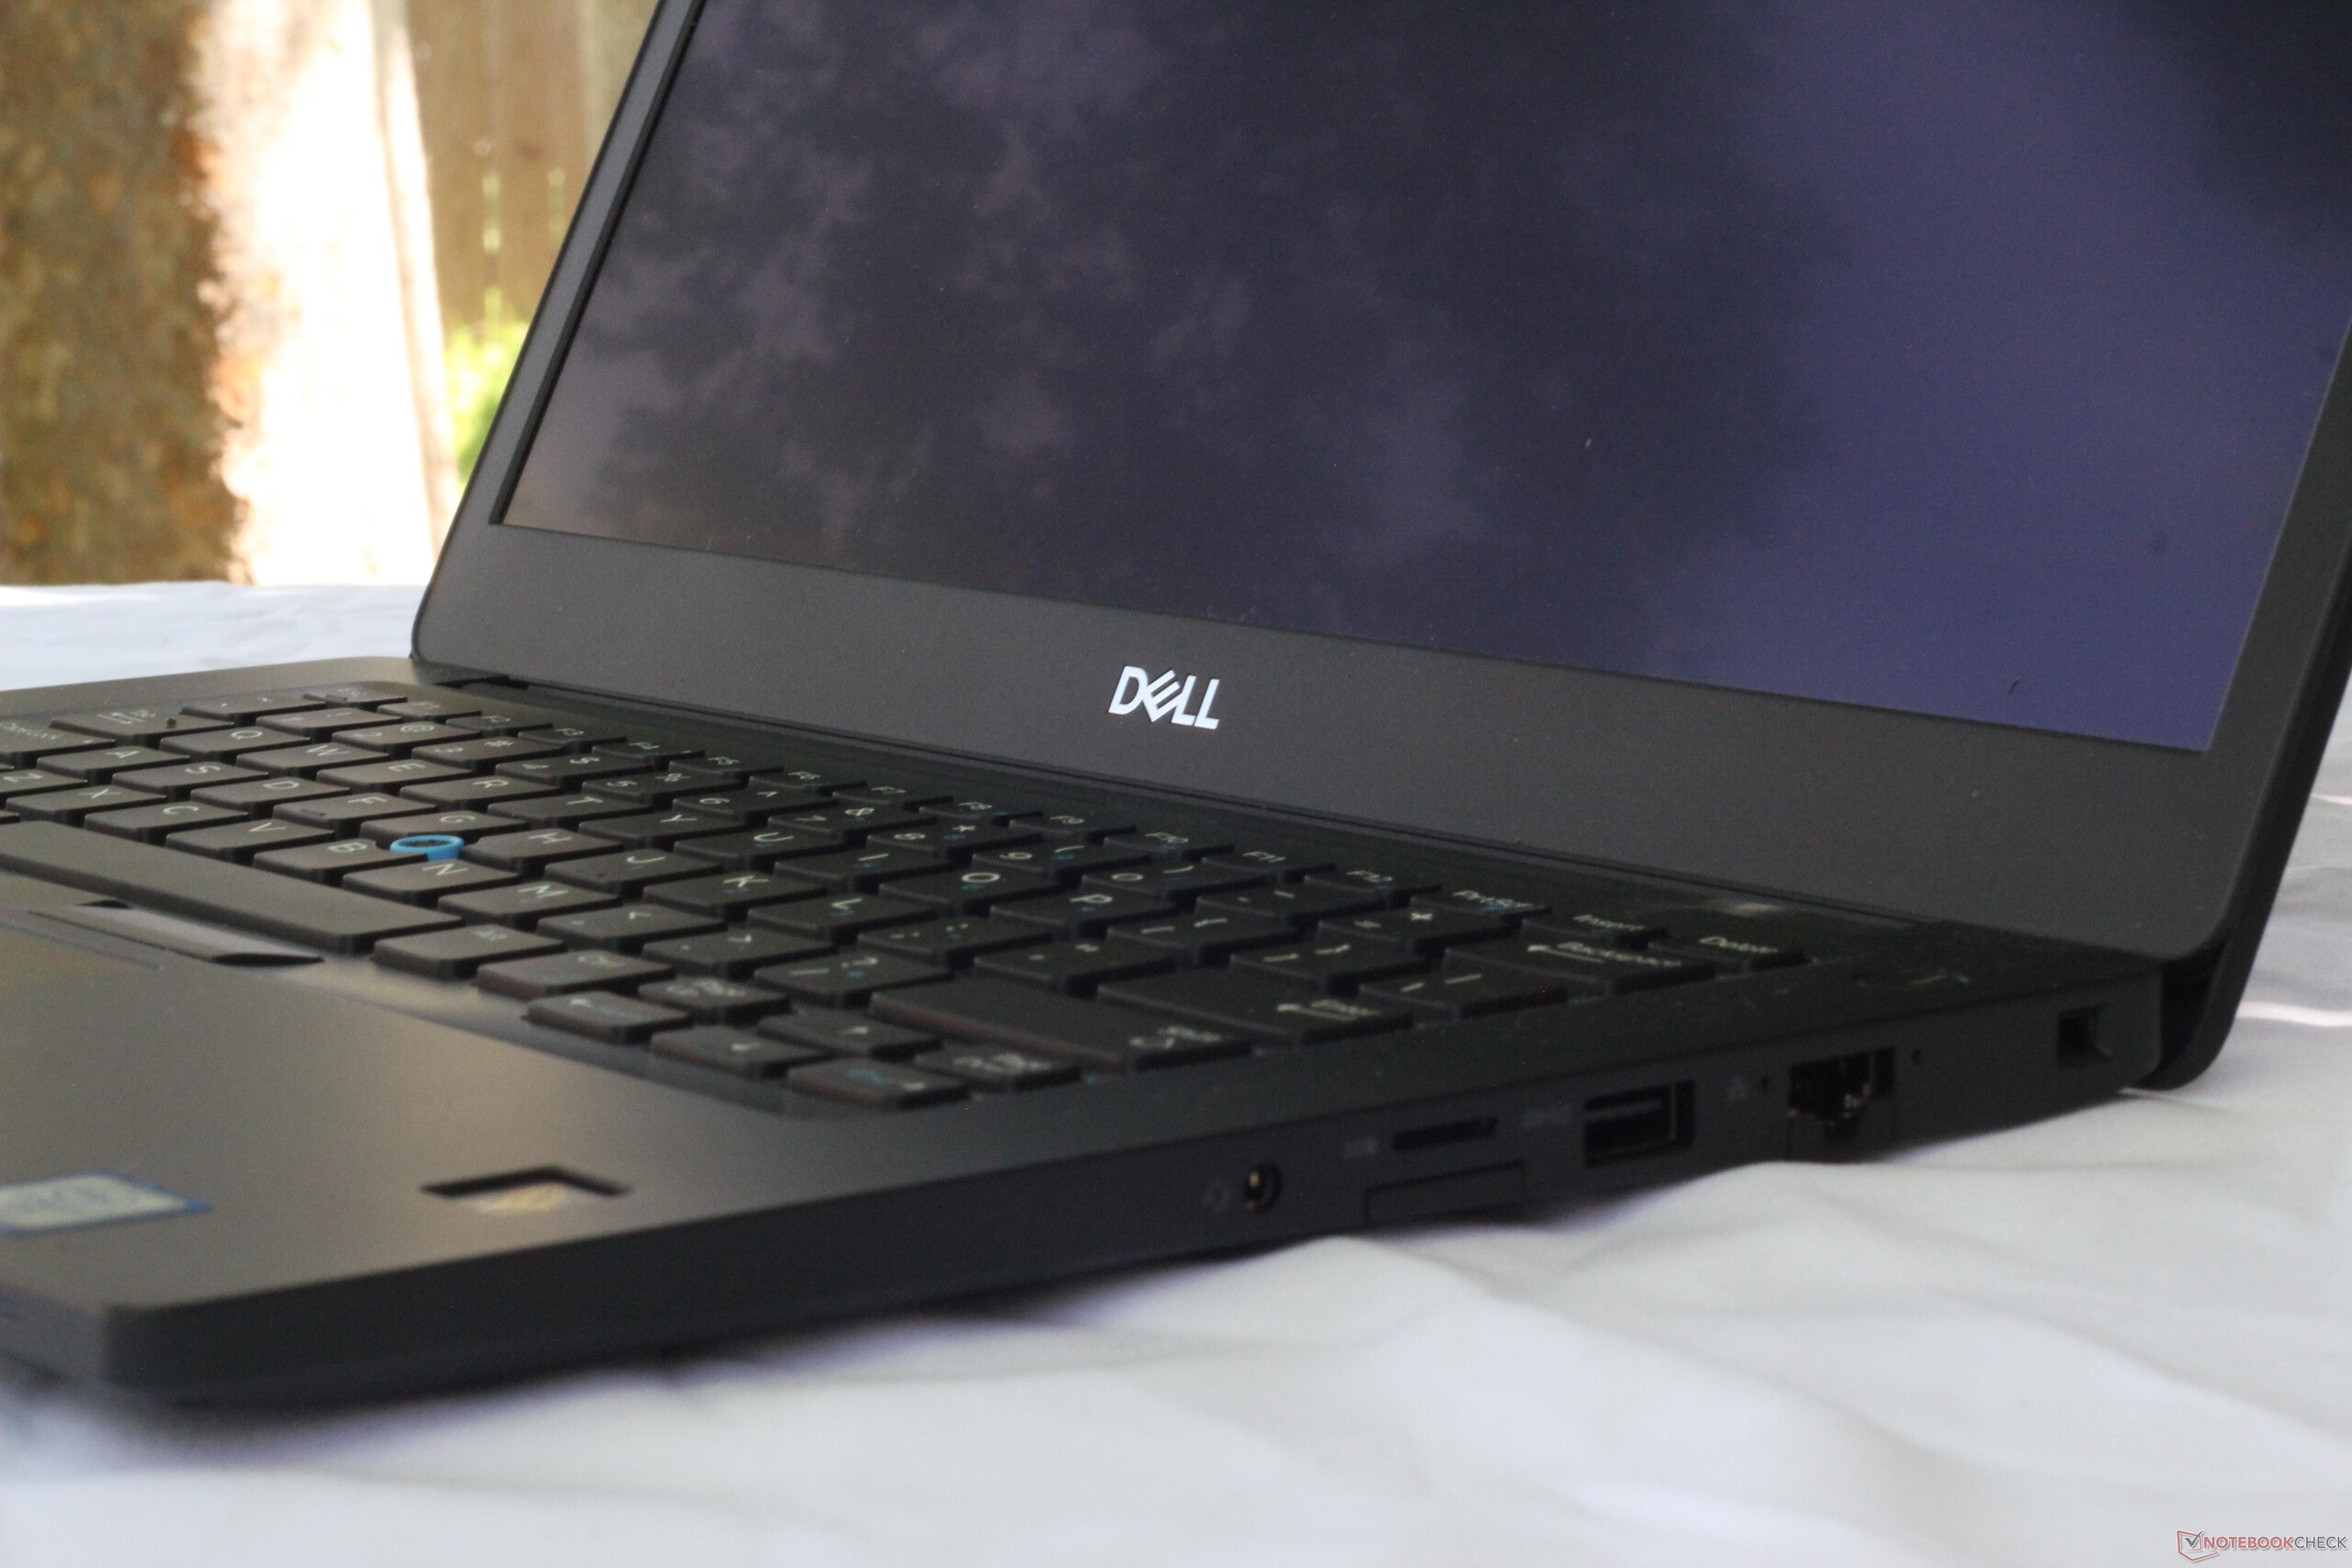
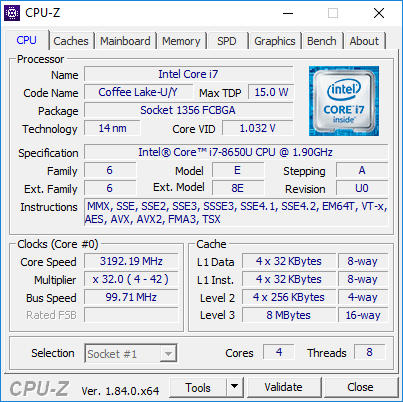
Dell heeft uitstekend werk geleverd met de Latitude 7490, maar met name omdat ze al uitstekend werk leverden met de 7480. Bijna alles is simpelweg overgenomen van het model van vorig jaar. Het grootste pluspunt van de Latitude 7490 tegenover de 7480 is het gebruik van Intel's quad-core 8e generatie CPU's. Ondanks eenzelfde 15 watt TDP als de voorgaande U-serie processoren, verdubbelen de Kaby Lake-R CPU's bijna hun prestaties tegenover hun 7e generatie tegenhangers. De Latitude 7490 is een goed voorbeeld van de sprongen in systeemprestaties die gemaakt zijn door het gebruik van Kaby Lake-R, maar het geeft ook een voorbeeld van de offers die de nieuwe chips maken. Throttlen is een behoorlijk probleem. Bij zware belasting kan de CPU zijn volledige potentieel bereiken, maar slechts voor een korte periode.
We zullen eerlijk zijn: als je al een Latitude 7480 bezit, dan kun je de 7490 overslaan. De extra CPU prestaties zullen alleen in rekenintensieve taken te merken zijn; tenzij je werk ook zware spreadsheets of andere CPU-intensieve taken omvat, is de processor upgrade de kosten van een nieuwe machine niet waard. Als je echter op zoek bent naar een nieuwe zakelijke notebook of een reeds enkele jaren oude machine wilt vervangen, dan moet je de Latitude 7490 zeker overwegen. Dell heeft een uitstekende machine gemaakt die de vlaggenschepen van de concurrentie zeker evenaart.
Dell Latitude 7490
- 08-04-2018 v6 (old)
Sam Medley
Price comparison
