Kort testrapport Toshiba Tecra X40-D (i7-7600U, FHD) Laptop

| SD Card Reader | |
| average JPG Copy Test (av. of 3 runs) | |
| Dell XPS 13 9360 FHD i7 Iris | |
| Toshiba Tecra X40-D | |
| Lenovo ThinkPad T470s-20HF0012US | |
| Lenovo ThinkPad X1 Carbon 2017-20HR0021GE | |
| Toshiba Portege X30-D (PT274U-01N001) | |
| maximum AS SSD Seq Read Test (1GB) | |
| Dell XPS 13 9360 FHD i7 Iris | |
| Lenovo ThinkPad T470s-20HF0012US | |
| Toshiba Portege X30-D (PT274U-01N001) | |
| Lenovo ThinkPad X1 Carbon 2017-20HR0021GE | |
| Toshiba Tecra X40-D | |
| |||||||||||||||||||||||||
Helderheidsverdeling: 85 %
Helderheid in Batterij-modus: 283.9 cd/m²
Contrast: 1136:1 (Zwart: 0.25 cd/m²)
ΔE ColorChecker Calman: 6.4 | ∀{0.5-29.43 Ø4.71}
ΔE Greyscale Calman: 6.3 | ∀{0.09-98 Ø4.96}
60% sRGB (Argyll 1.6.3 3D)
38% AdobeRGB 1998 (Argyll 1.6.3 3D)
41.89% AdobeRGB 1998 (Argyll 3D)
61% sRGB (Argyll 3D)
40.55% Display P3 (Argyll 3D)
Gamma: 2.39
CCT: 6511 K
| Toshiba Tecra X40-D Toshiba TOS508F, IPS, 14", 1920x1080 | Toshiba Portege X30-D (PT274U-01N001) Toshiba TOS508F, IPS, 13.3", 1920x1080 | Lenovo ThinkPad X1 Carbon 2017-20HR0021GE B140HAN03_1, IPS, 14", 1920x1080 | Lenovo ThinkPad T470s-20HF0012US LEN40A9 (R140NWF5 R1), IPS, 14", 1920x1080 | HP Spectre 13-v131ng CMN1374, IPS UWVA, 13.3", 1920x1080 | |
|---|---|---|---|---|---|
| Display | 59% | 48% | -0% | 53% | |
| Display P3 Coverage (%) | 40.55 | 66.4 64% | 61.6 52% | 40.35 0% | 64.6 59% |
| sRGB Coverage (%) | 61 | 93.5 53% | 87.6 44% | 60.3 -1% | 88.8 46% |
| AdobeRGB 1998 Coverage (%) | 41.89 | 66.6 59% | 62.6 49% | 41.72 0% | 64.8 55% |
| Response Times | -4% | -20% | -7% | -22% | |
| Response Time Grey 50% / Grey 80% * (ms) | 38 ? | 36.8 ? 3% | 48 ? -26% | 40.8 ? -7% | 46 ? -21% |
| Response Time Black / White * (ms) | 26.8 ? | 29.6 ? -10% | 30.4 ? -13% | 28.8 ? -7% | 33 ? -23% |
| PWM Frequency (Hz) | 20410 ? | 219.3 ? | |||
| Screen | 34% | 33% | 0% | 22% | |
| Brightness middle (cd/m²) | 283.9 | 332.6 17% | 278 -2% | 271.6 -4% | 404 42% |
| Brightness (cd/m²) | 261 | 323 24% | 271 4% | 264 1% | 382 46% |
| Brightness Distribution (%) | 85 | 86 1% | 91 7% | 88 4% | 91 7% |
| Black Level * (cd/m²) | 0.25 | 0.28 -12% | 0.16 36% | 0.24 4% | 0.35 -40% |
| Contrast (:1) | 1136 | 1188 5% | 1738 53% | 1132 0% | 1154 2% |
| Colorchecker dE 2000 * | 6.4 | 2.6 59% | 4.5 30% | 6.1 5% | 5.37 16% |
| Colorchecker dE 2000 max. * | 18.7 | 6.7 64% | 8.4 55% | 28.6 -53% | 9.46 49% |
| Greyscale dE 2000 * | 6.3 | 2.5 60% | 3.2 49% | 3.4 46% | 6.44 -2% |
| Gamma | 2.39 92% | 2.12 104% | 2.02 109% | 2.12 104% | 2.52 87% |
| CCT | 6511 100% | 6720 97% | 7042 92% | 6077 107% | 6738 96% |
| Color Space (Percent of AdobeRGB 1998) (%) | 38 | 62 63% | 57 50% | 38 0% | 58 53% |
| Color Space (Percent of sRGB) (%) | 60 | 94 57% | 87.5 46% | 60 0% | 89 48% |
| Totaal Gemiddelde (Programma / Instellingen) | 30% /
34% | 20% /
29% | -2% /
-1% | 18% /
22% |
* ... kleiner is beter
Responstijd Scherm
| ↔ Responstijd Zwart naar Wit | ||
|---|---|---|
| 26.8 ms ... stijging ↗ en daling ↘ gecombineerd | ↗ 16.4 ms stijging | 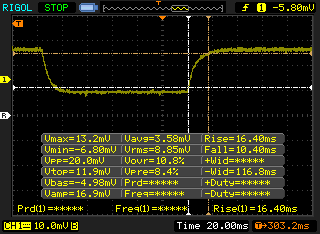 |
| ↘ 10.4 ms daling | ||
| Het scherm vertoonde relatief trage responstijden in onze tests en is misschien te traag voor games. Ter vergelijking: alle testtoestellen variëren van 0.1 (minimum) tot 240 (maximum) ms. » 67 % van alle toestellen zijn beter. Dit betekent dat de gemeten responstijd slechter is dan het gemiddelde (19.8 ms) van alle geteste toestellen. | ||
| ↔ Responstijd 50% Grijs naar 80% Grijs | ||
| 38 ms ... stijging ↗ en daling ↘ gecombineerd | ↗ 19.6 ms stijging | 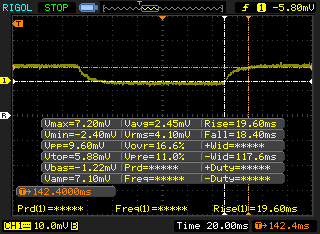 |
| ↘ 18.4 ms daling | ||
| Het scherm vertoonde trage responstijden in onze tests en is misschien te traag voor games. Ter vergelijking: alle testtoestellen variëren van 0.165 (minimum) tot 636 (maximum) ms. » 55 % van alle toestellen zijn beter. Dit betekent dat de gemeten responstijd slechter is dan het gemiddelde (31 ms) van alle geteste toestellen. | ||
Screen Flickering / PWM (Pulse-Width Modulation)
| Screen flickering / PWM waargenomen | 20410 Hz | ≤ 99 % helderheid instelling | 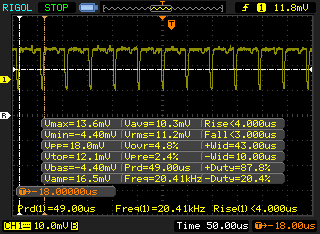 |
De achtergrondverlichting van het scherm flikkert op 20410 Hz (in het slechtste geval, bijvoorbeeld bij gebruik van PWM) aan een helderheid van 99 % en lager. Boven deze helderheid zou er geen flickering / PWM mogen optreden. De frequentie van 20410 Hz is redelijk hoog en de meeste mensen die gevoelig zijn aan flickering zouden dit dus niet mogen waarnemen of geïrriteerde ogen krijgen. Ter vergelijking: 52 % van alle geteste toestellen maakten geen gebruik van PWM om de schermhelderheid te verlagen. Als het wel werd gebruikt, werd een gemiddelde van 7754 (minimum: 5 - maximum: 343500) Hz waargenomen. | |||
| Cinebench R15 | |
| CPU Single 64Bit | |
| Dell XPS 13 9360 FHD i7 Iris | |
| Lenovo ThinkPad X270 20HN0012PB | |
| Toshiba Tecra X40-D | |
| Lenovo ThinkPad T470s-20HF0012US | |
| HP Spectre 13-v131ng | |
| Lenovo ThinkPad X1 Carbon 2017-20HR0021GE | |
| Toshiba Portege X30-D (PT274U-01N001) | |
| CPU Multi 64Bit | |
| Lenovo ThinkPad T470s-20HF0012US | |
| Toshiba Tecra X40-D | |
| Toshiba Portege X30-D (PT274U-01N001) | |
| Dell XPS 13 9360 FHD i7 Iris | |
| Lenovo ThinkPad X270 20HN0012PB | |
| Lenovo ThinkPad X1 Carbon 2017-20HR0021GE | |
| HP Spectre 13-v131ng | |
| Cinebench R10 | |
| Rendering Multiple CPUs 32Bit | |
| Toshiba Tecra X40-D | |
| Toshiba Portege X30-D (PT274U-01N001) | |
| HP Spectre 13-v131ng | |
| Lenovo ThinkPad X1 Carbon 2017-20HR0021GE | |
| Rendering Single 32Bit | |
| Toshiba Portege X30-D (PT274U-01N001) | |
| HP Spectre 13-v131ng | |
| Lenovo ThinkPad X1 Carbon 2017-20HR0021GE | |
| wPrime 2.10 - 1024m | |
| Lenovo ThinkPad X270 20HN0012PB | |
| Toshiba Portege X30-D (PT274U-01N001) | |
| Toshiba Tecra X40-D | |
| Lenovo ThinkPad T470s-20HF0012US | |
* ... kleiner is beter
| PCMark 7 Score | 5979 punten | |
| PCMark 8 Home Score Accelerated v2 | 3738 punten | |
| PCMark 8 Creative Score Accelerated v2 | 4784 punten | |
| PCMark 8 Work Score Accelerated v2 | 4963 punten | |
| PCMark 10 Score | 2464 punten | |
Help | ||
| Toshiba Tecra X40-D Samsung PM961 MZVLW256HEHP | Toshiba Portege X30-D (PT274U-01N001) Samsung PM961 MZVLW256HEHP | Lenovo ThinkPad X1 Carbon 2017-20HR0021GE Toshiba THNSF5256GPUK | Lenovo ThinkPad X270 20HN0012PB Toshiba THNSF5256GPUK | Lenovo ThinkPad T470s-20HF0012US Samsung PM961 MZVLW256HEHP | HP Spectre 13-v131ng Samsung PM961 NVMe MZVLW512HMJP | |
|---|---|---|---|---|---|---|
| AS SSD | -678% | -46% | -43% | 9% | 14% | |
| Copy Game MB/s (MB/s) | 229 | 309.9 | 397.9 | |||
| Copy Program MB/s (MB/s) | 172.4 | 291 | 426 | |||
| Copy ISO MB/s (MB/s) | 623 | 797 | 720 | |||
| Score Total (Points) | 3576 | 2687 -25% | 1398 -61% | 1638 -54% | 3875 8% | 3617 1% |
| Score Write (Points) | 675 | 162 -76% | 337 -50% | 442 -35% | 803 19% | 1115 65% |
| Score Read (Points) | 1963 | 1723 -12% | 726 -63% | 802 -59% | 2083 6% | 1654 -16% |
| Access Time Write * (ms) | 0.028 | 2.01 -7079% | 0.034 -21% | 0.033 -18% | 0.025 11% | 0.026 7% |
| Access Time Read * (ms) | 0.061 | 0.05 18% | 0.102 -67% | 0.113 -85% | 0.06 2% | 0.042 31% |
| 4K-64 Write (MB/s) | 438.4 | 125.8 -71% | 149.6 -66% | 264 -40% | 538 23% | 862 97% |
| 4K-64 Read (MB/s) | 1663 | 1483 -11% | 526 -68% | 633 -62% | 1765 6% | 1465 -12% |
| 4K Write (MB/s) | 124.8 | 1.2 -99% | 109.4 -12% | 100 -20% | 147.9 19% | 134.4 8% |
| 4K Read (MB/s) | 51.6 | 42.8 -17% | 34.34 -33% | 38.8 -25% | 48.84 -5% | 56.4 9% |
| Seq Write (MB/s) | 1117 | 352.7 -68% | 775 -31% | 777 -30% | 1170 5% | 1190 7% |
| Seq Read (MB/s) | 2479 | 1972 -20% | 1649 -33% | 1294 -48% | 2691 9% | 1325 -47% |
* ... kleiner is beter

| 3DMark 11 | |
| 1280x720 Performance GPU | |
| Acer Aspire 5 A515-51G-51RL | |
| Asus Zenbook UX3430UQ-GV012T | |
| Dell XPS 13 9360 FHD i7 Iris | |
| Toshiba Tecra X40-D | |
| Lenovo ThinkPad T470s-20HF0012US | |
| HP Spectre 13-v131ng | |
| Lenovo ThinkPad X1 Carbon 2017-20HR0021GE | |
| Lenovo ThinkPad X270 20HN0012PB | |
| Toshiba Portege X30-D (PT274U-01N001) | |
| 1280x720 Performance Combined | |
| Acer Aspire 5 A515-51G-51RL | |
| Dell XPS 13 9360 FHD i7 Iris | |
| Asus Zenbook UX3430UQ-GV012T | |
| Lenovo ThinkPad T470s-20HF0012US | |
| Toshiba Tecra X40-D | |
| Lenovo ThinkPad X1 Carbon 2017-20HR0021GE | |
| HP Spectre 13-v131ng | |
| Toshiba Portege X30-D (PT274U-01N001) | |
| Lenovo ThinkPad X270 20HN0012PB | |
| 3DMark | |
| 1280x720 Cloud Gate Standard Graphics | |
| Acer Aspire 5 A515-51G-51RL | |
| Dell XPS 13 9360 FHD i7 Iris | |
| Lenovo ThinkPad T470s-20HF0012US | |
| Toshiba Tecra X40-D | |
| Asus Zenbook UX3430UQ-GV012T | |
| HP Spectre 13-v131ng | |
| Lenovo ThinkPad X1 Carbon 2017-20HR0021GE | |
| Lenovo ThinkPad X270 20HN0012PB | |
| Toshiba Portege X30-D (PT274U-01N001) | |
| 1920x1080 Fire Strike Graphics | |
| Acer Aspire 5 A515-51G-51RL | |
| Asus Zenbook UX3430UQ-GV012T | |
| Dell XPS 13 9360 FHD i7 Iris | |
| Toshiba Tecra X40-D | |
| Lenovo ThinkPad T470s-20HF0012US | |
| Lenovo ThinkPad X1 Carbon 2017-20HR0021GE | |
| HP Spectre 13-v131ng | |
| Lenovo ThinkPad X270 20HN0012PB | |
| Toshiba Portege X30-D (PT274U-01N001) | |
| 1920x1080 Ice Storm Extreme Graphics | |
| Lenovo ThinkPad X1 Carbon 2017-20HR0021GE | |
| HP Spectre 13-v131ng | |
| Acer Aspire 5 A515-51G-51RL | |
| Lenovo ThinkPad X270 20HN0012PB | |
| Toshiba Portege X30-D (PT274U-01N001) | |
| 3DMark 11 Performance | 1789 punten | |
| 3DMark Cloud Gate Standard Score | 6655 punten | |
| 3DMark Fire Strike Score | 980 punten | |
Help | ||
| BioShock Infinite - 1920x1080 Ultra Preset, DX11 (DDOF) (sorteer op waarde) | |
| Toshiba Tecra X40-D | |
| Lenovo ThinkPad X1 Carbon 2017-20HR0021GE | |
| Lenovo ThinkPad X270 20HN0012PB | |
| Lenovo ThinkPad T470s-20HF0012US | |
| Dell XPS 13 9360 FHD i7 Iris | |
| Acer Aspire 5 A515-51G-51RL | |
| Asus Zenbook UX3410UQ-GV077T | |
| HP Spectre 13-v131ng | |
| Ashes of the Singularity - 1920x1080 high (sorteer op waarde) | |
| Toshiba Tecra X40-D | |
| Acer Aspire 5 A515-51G-51RL | |
| Rise of the Tomb Raider - 1920x1080 Very High Preset AA:FX AF:16x (sorteer op waarde) | |
| Toshiba Tecra X40-D | |
| Acer Aspire 5 A515-51G-51RL | |
| lage | gem. | hoge | ultra | |
|---|---|---|---|---|
| BioShock Infinite (2013) | 27 | 17 | ||
| Rise of the Tomb Raider (2016) | 5 | 2 | ||
| Ashes of the Singularity (2016) | 7 | 6 |
Geluidsniveau
| Onbelast |
| 28 / 28 / 28.2 dB (A) |
| Belasting |
| 33.2 / 39.9 dB (A) |
 | ||
30 dB stil 40 dB(A) hoorbaar 50 dB(A) luid |
||
min: | ||
| Toshiba Tecra X40-D HD Graphics 620, i7-7600U, Samsung PM961 MZVLW256HEHP | Toshiba Portege X30-D (PT274U-01N001) HD Graphics 620, i7-7600U, Samsung PM961 MZVLW256HEHP | Lenovo ThinkPad X1 Carbon 2017-20HR0021GE HD Graphics 620, i5-7200U, Toshiba THNSF5256GPUK | Lenovo ThinkPad X270 20HN0012PB HD Graphics 620, i7-7500U, Toshiba THNSF5256GPUK | Lenovo ThinkPad T470s-20HF0012US HD Graphics 620, i5-7300U, Samsung PM961 MZVLW256HEHP | Dell XPS 13 9360 FHD i7 Iris Iris Plus Graphics 640, i7-7560U, Toshiba XG4 NVMe (THNSN5512GPUK) | HP Spectre 13-v131ng HD Graphics 620, i7-7500U, Samsung PM961 NVMe MZVLW512HMJP | |
|---|---|---|---|---|---|---|---|
| Noise | 0% | -4% | -8% | -1% | -3% | -9% | |
| uit / omgeving * (dB) | 28 | 28.4 -1% | 29.6 -6% | 27.8 1% | 29.9 -7% | 30.4 -9% | |
| Idle Minimum * (dB) | 28 | 28.4 -1% | 29.6 -6% | 30 -7% | 27.8 1% | 29.9 -7% | 30.4 -9% |
| Idle Average * (dB) | 28 | 28.4 -1% | 29.6 -6% | 30 -7% | 27.8 1% | 29.9 -7% | 30.4 -9% |
| Idle Maximum * (dB) | 28.2 | 28.4 -1% | 32.2 -14% | 33.2 -18% | 27.8 1% | 30.3 -7% | 30.4 -8% |
| Load Average * (dB) | 33.2 | 33.2 -0% | 34.2 -3% | 37.2 -12% | 34.8 -5% | 33.9 -2% | 40 -20% |
| Load Maximum * (dB) | 39.9 | 37.9 5% | 36.1 10% | 37.9 5% | 42 -5% | 34.9 13% | 40 -0% |
| Witcher 3 ultra * (dB) | 42 |
* ... kleiner is beter
(±) De maximumtemperatuur aan de bovenzijde bedraagt 43 °C / 109 F, vergeleken met het gemiddelde van 34.3 °C / 94 F, variërend van 21.2 tot 62.5 °C voor de klasse Office.
(±) De bodem warmt op tot een maximum van 42 °C / 108 F, vergeleken met een gemiddelde van 36.8 °C / 98 F
(+) Bij onbelast gebruik bedraagt de gemiddelde temperatuur voor de bovenzijde 26 °C / 79 F, vergeleken met het apparaatgemiddelde van 29.5 °C / 85 F.
(+) De palmsteunen en het touchpad zijn met een maximum van ###max## °C / 81.7 F koeler dan de huidtemperatuur en voelen daarom koel aan.
(±) De gemiddelde temperatuur van de handpalmsteun van soortgelijke toestellen bedroeg 27.5 °C / 81.5 F (-0.1 °C / -0.2 F).
Toshiba Tecra X40-D audioanalyse
(±) | luidspreker luidheid is gemiddeld maar goed (77.3 dB)
Bas 100 - 315 Hz
(-) | bijna geen lage tonen - gemiddeld 15.2% lager dan de mediaan
(±) | lineariteit van de lage tonen is gemiddeld (7.2% delta ten opzichte van de vorige frequentie)
Midden 400 - 2000 Hz
(+) | evenwichtige middens - slechts 3.6% verwijderd van de mediaan
(+) | de middentonen zijn lineair (5.7% delta ten opzichte van de vorige frequentie)
Hoog 2 - 16 kHz
(±) | higher highs - on average 5.6% higher than median
(+) | de hoge tonen zijn lineair (5.2% delta naar de vorige frequentie)
Algemeen 100 - 16.000 Hz
(±) | lineariteit van het totale geluid is gemiddeld (22% verschil met de mediaan)
Vergeleken met dezelfde klasse
» 58% van alle geteste apparaten in deze klasse waren beter, 8% vergelijkbaar, 34% slechter
» De beste had een delta van 7%, het gemiddelde was 21%, de slechtste was 53%
Vergeleken met alle geteste toestellen
» 64% van alle geteste apparaten waren beter, 6% gelijk, 30% slechter
» De beste had een delta van 4%, het gemiddelde was 23%, de slechtste was 134%
Lenovo ThinkPad T470s-20HF0012US audioanalyse
(±) | luidspreker luidheid is gemiddeld maar goed (72 dB)
Bas 100 - 315 Hz
(-) | bijna geen lage tonen - gemiddeld 15.3% lager dan de mediaan
(±) | lineariteit van de lage tonen is gemiddeld (14.1% delta ten opzichte van de vorige frequentie)
Midden 400 - 2000 Hz
(+) | evenwichtige middens - slechts 3.2% verwijderd van de mediaan
(±) | lineariteit van de middentonen is gemiddeld (11% delta ten opzichte van de vorige frequentie)
Hoog 2 - 16 kHz
(+) | evenwichtige hoogtepunten - slechts 4.4% verwijderd van de mediaan
(±) | lineariteit van de hoogtepunten is gemiddeld (12.5% delta ten opzichte van de vorige frequentie)
Algemeen 100 - 16.000 Hz
(±) | lineariteit van het totale geluid is gemiddeld (24.8% verschil met de mediaan)
Vergeleken met dezelfde klasse
» 74% van alle geteste apparaten in deze klasse waren beter, 7% vergelijkbaar, 19% slechter
» De beste had een delta van 7%, het gemiddelde was 21%, de slechtste was 53%
Vergeleken met alle geteste toestellen
» 76% van alle geteste apparaten waren beter, 5% gelijk, 19% slechter
» De beste had een delta van 4%, het gemiddelde was 23%, de slechtste was 134%
| Uit / Standby | |
| Inactief | |
| Belasting |
|
Key:
min: | |
| Toshiba Tecra X40-D i7-7600U, HD Graphics 620, Samsung PM961 MZVLW256HEHP, IPS, 1920x1080, 14" | Toshiba Portege X30-D (PT274U-01N001) i7-7600U, HD Graphics 620, Samsung PM961 MZVLW256HEHP, IPS, 1920x1080, 13.3" | Lenovo ThinkPad X1 Carbon 2017-20HR0021GE i5-7200U, HD Graphics 620, Toshiba THNSF5256GPUK, IPS, 1920x1080, 14" | Lenovo ThinkPad X270 20HN0012PB i7-7500U, HD Graphics 620, Toshiba THNSF5256GPUK, , 1920x1080, 12.5" | Lenovo ThinkPad T470s-20HF0012US i5-7300U, HD Graphics 620, Samsung PM961 MZVLW256HEHP, IPS, 1920x1080, 14" | HP Spectre 13-v131ng i7-7500U, HD Graphics 620, Samsung PM961 NVMe MZVLW512HMJP, IPS UWVA, 1920x1080, 13.3" | |
|---|---|---|---|---|---|---|
| Power Consumption | -1% | -16% | -6% | -19% | -9% | |
| Idle Minimum * (Watt) | 5.2 | 4.6 12% | 3.8 27% | 3.8 27% | 4.8 8% | 3.6 31% |
| Idle Average * (Watt) | 6.9 | 7.6 -10% | 7.1 -3% | 7.3 -6% | 6.6 4% | 6.4 7% |
| Idle Maximum * (Watt) | 7 | 8.2 -17% | 8.3 -19% | 10 -43% | 7 -0% | 9.2 -31% |
| Load Average * (Watt) | 24.6 | 23.8 3% | 34.2 -39% | 28.1 -14% | 39.2 -59% | 34 -38% |
| Load Maximum * (Watt) | 30.1 | 28 7% | 43.3 -44% | 29 4% | 44.8 -49% | 34.4 -14% |
* ... kleiner is beter
| Toshiba Tecra X40-D i7-7600U, HD Graphics 620, 48 Wh | Toshiba Portege X30-D (PT274U-01N001) i7-7600U, HD Graphics 620, 48 Wh | Lenovo ThinkPad X1 Carbon 2017-20HR0021GE i5-7200U, HD Graphics 620, 57 Wh | Lenovo ThinkPad T470s-20HF0012US i5-7300U, HD Graphics 620, 51 Wh | HP Spectre 13-v131ng i7-7500U, HD Graphics 620, 38 Wh | |
|---|---|---|---|---|---|
| Batterijduur | 6% | 14% | 31% | -15% | |
| Reader / Idle (h) | 14.6 | 15 3% | 13.7 -6% | 17.7 21% | 12 -18% |
| WiFi v1.3 (h) | 6 | 7.2 20% | 9.1 52% | 8.1 35% | 6.6 10% |
| Load (h) | 2.1 | 2 -5% | 2 -5% | 2.9 38% | 1.3 -38% |
Pro
Contra
Voor het volledige, Engelse testrapport, klik hier.
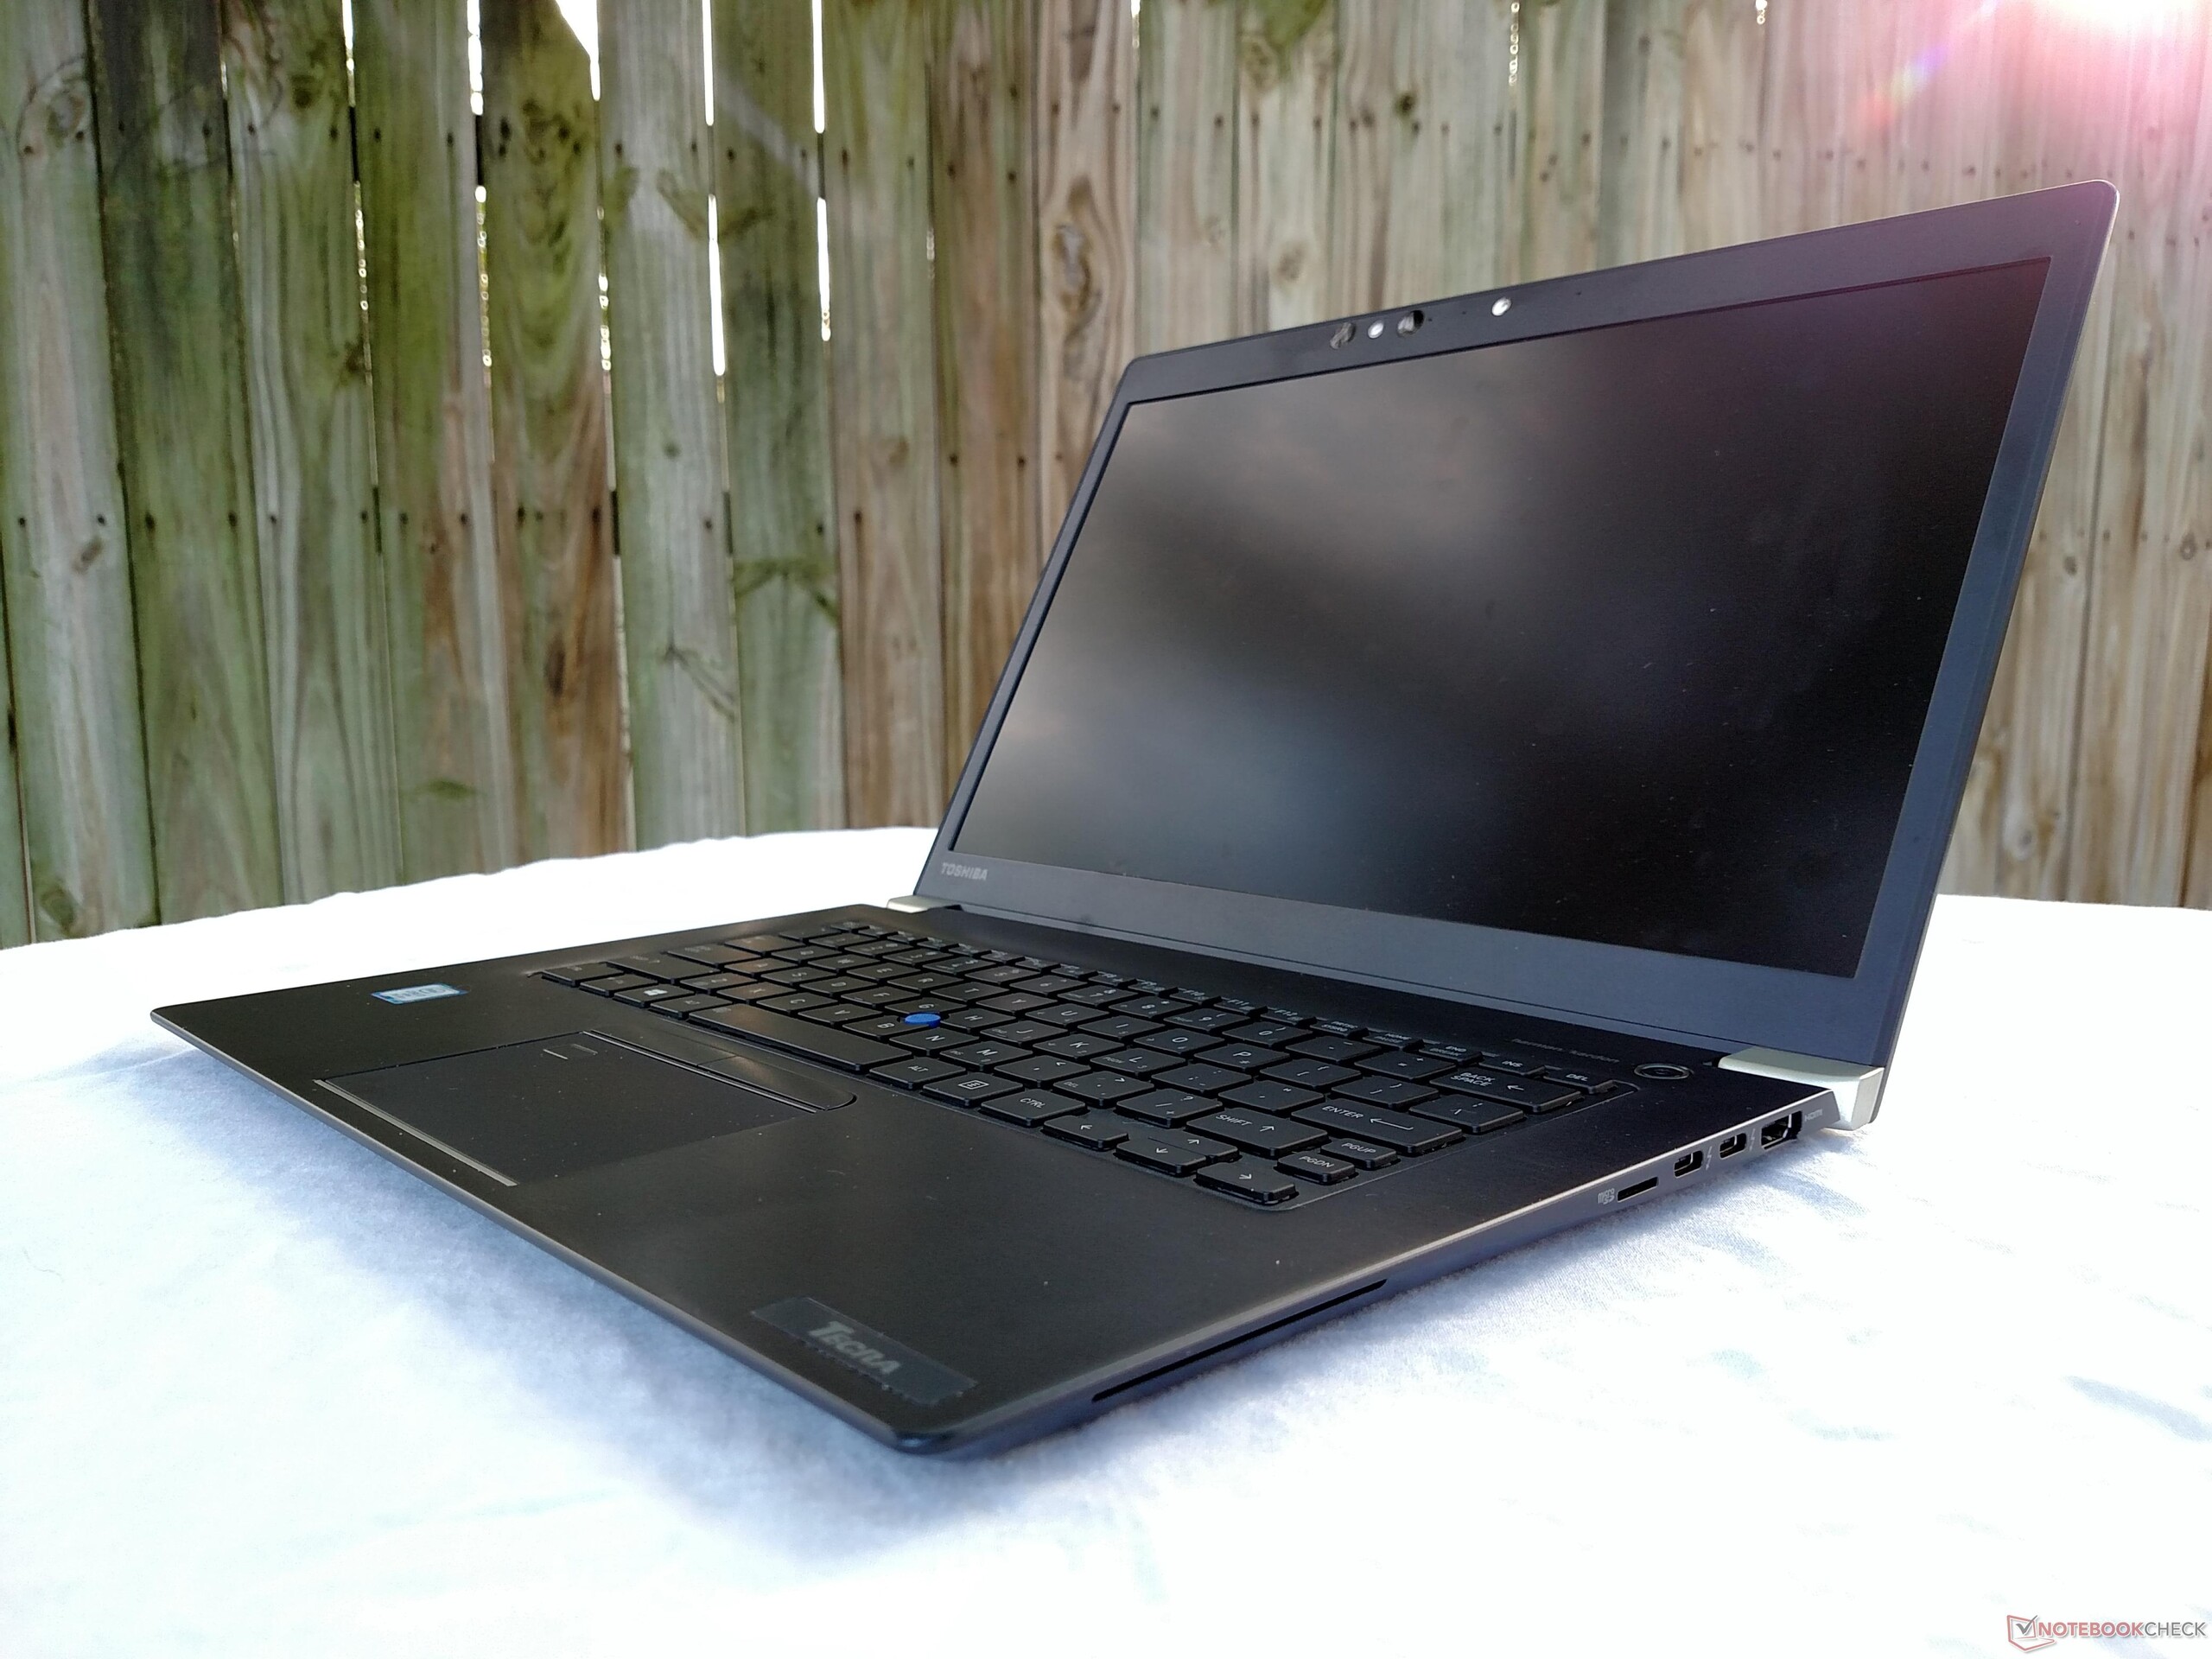
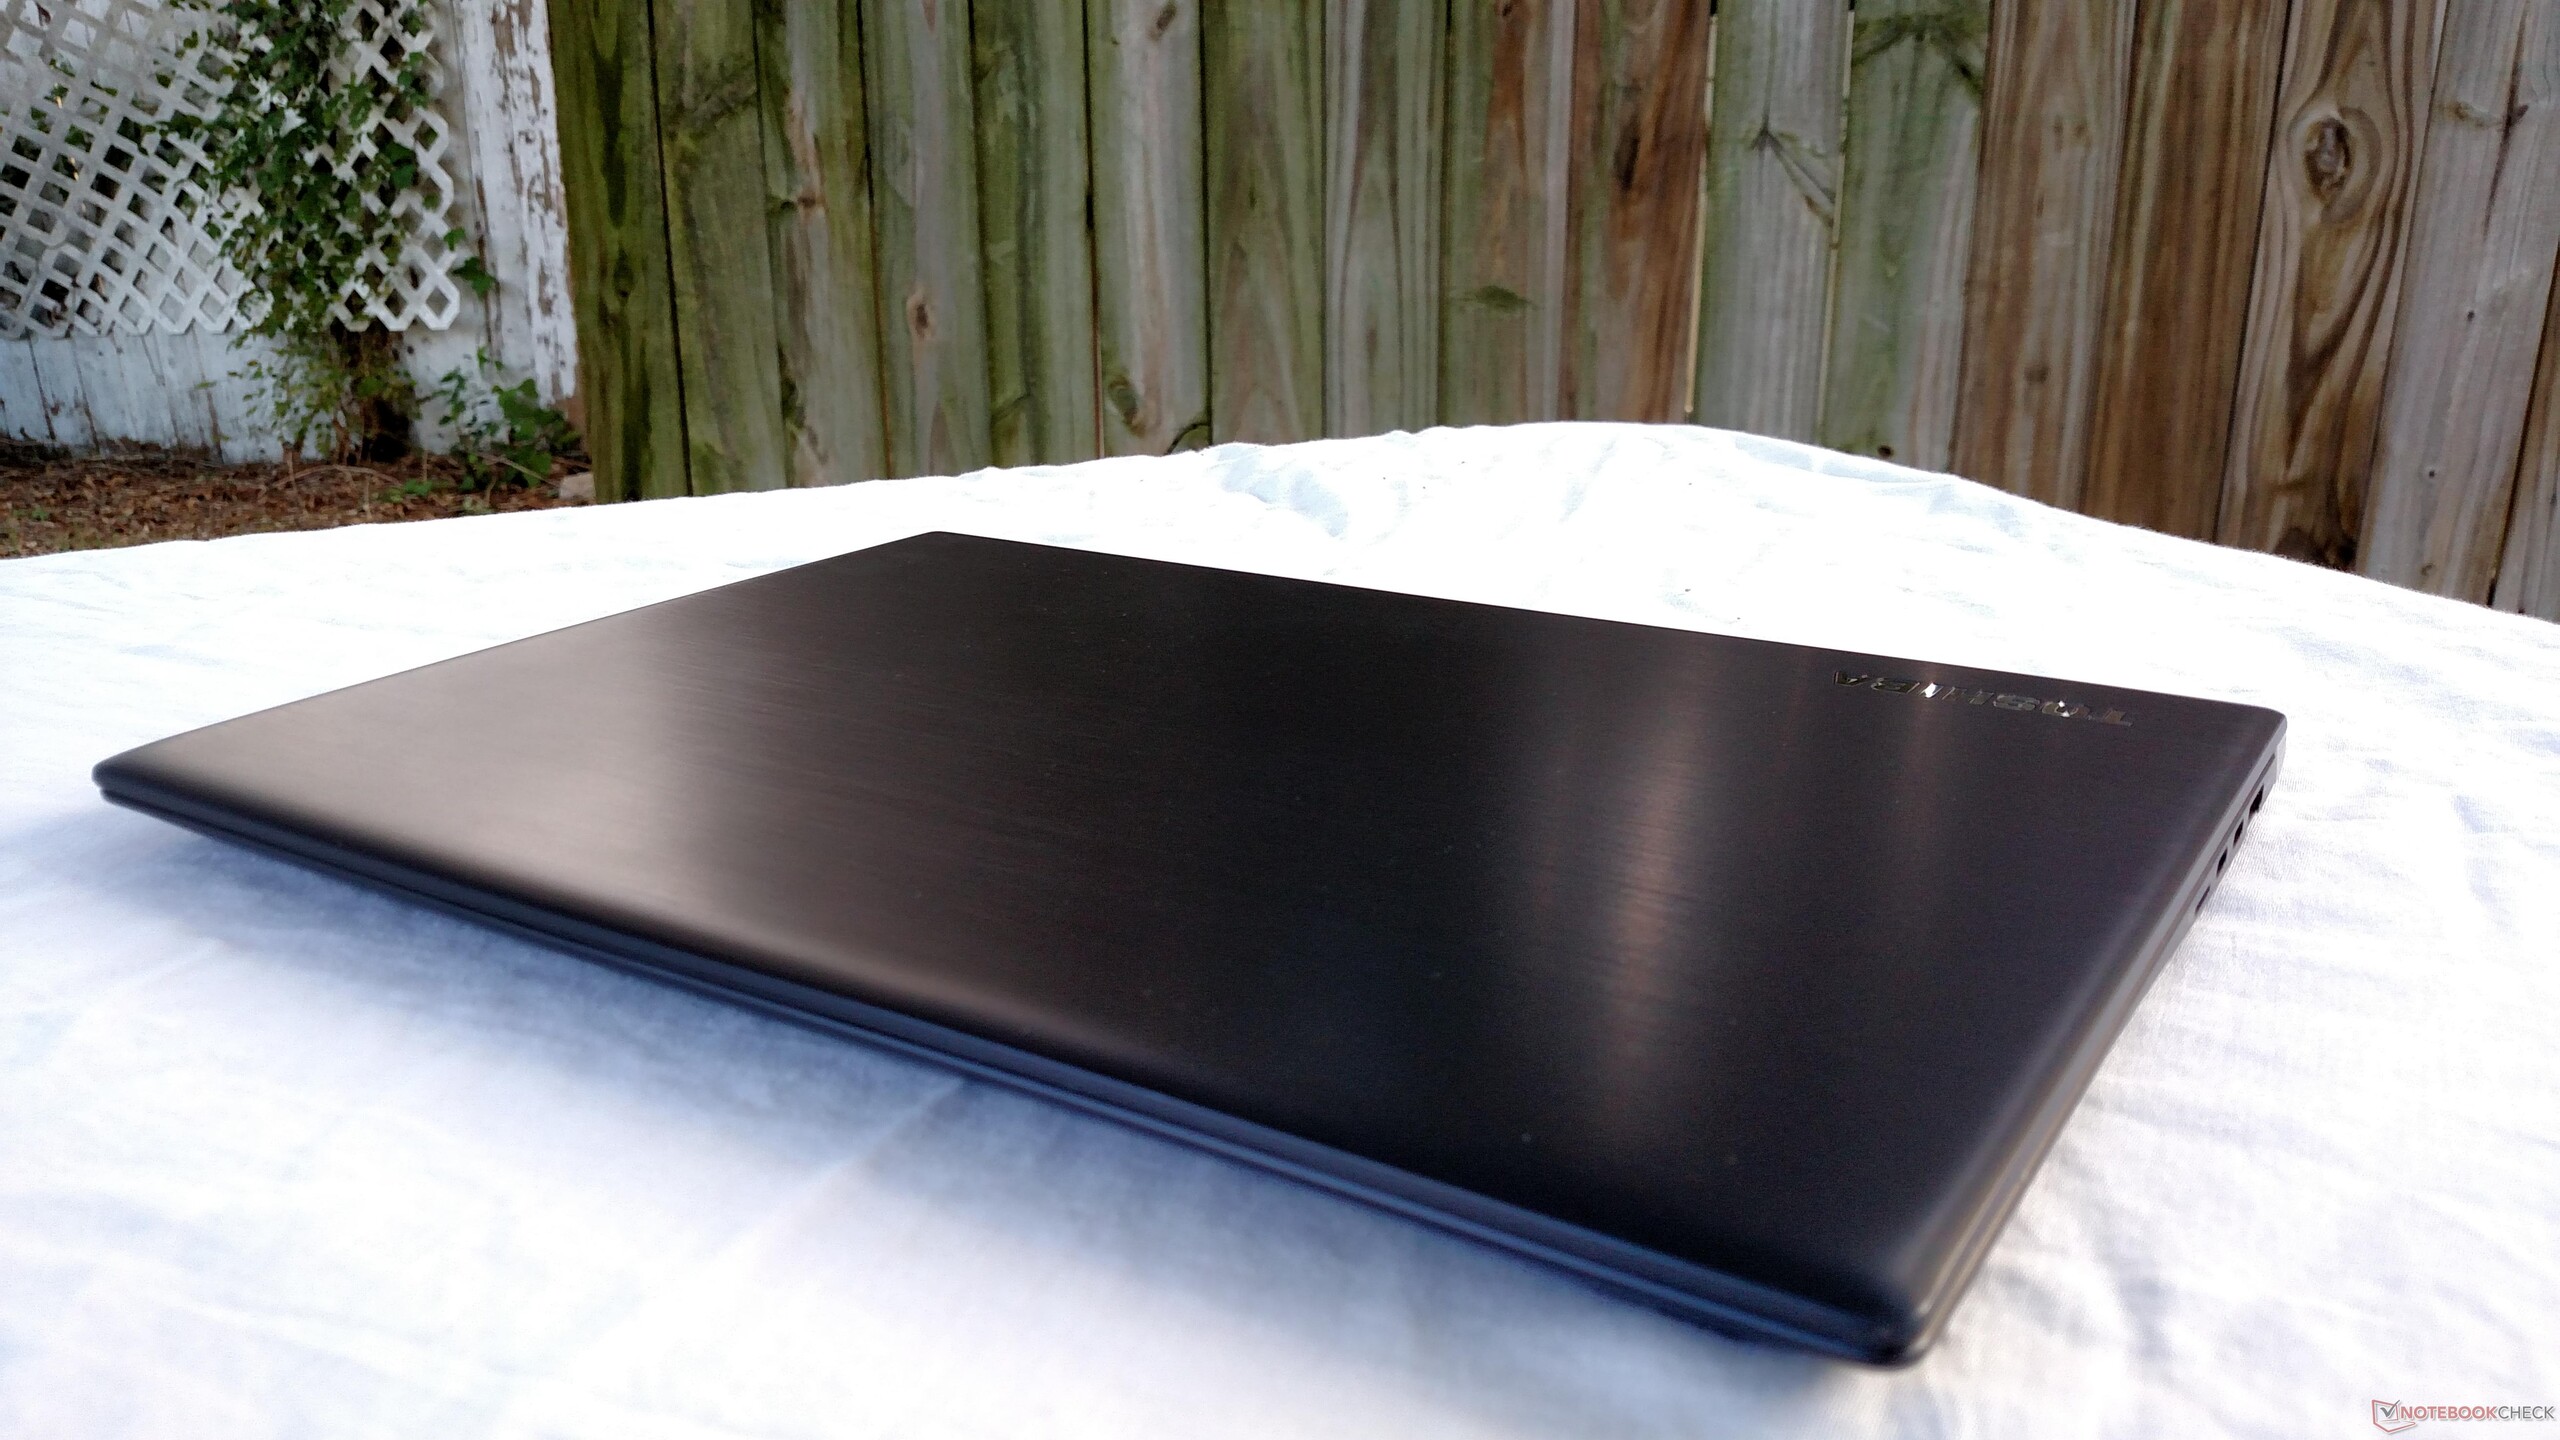
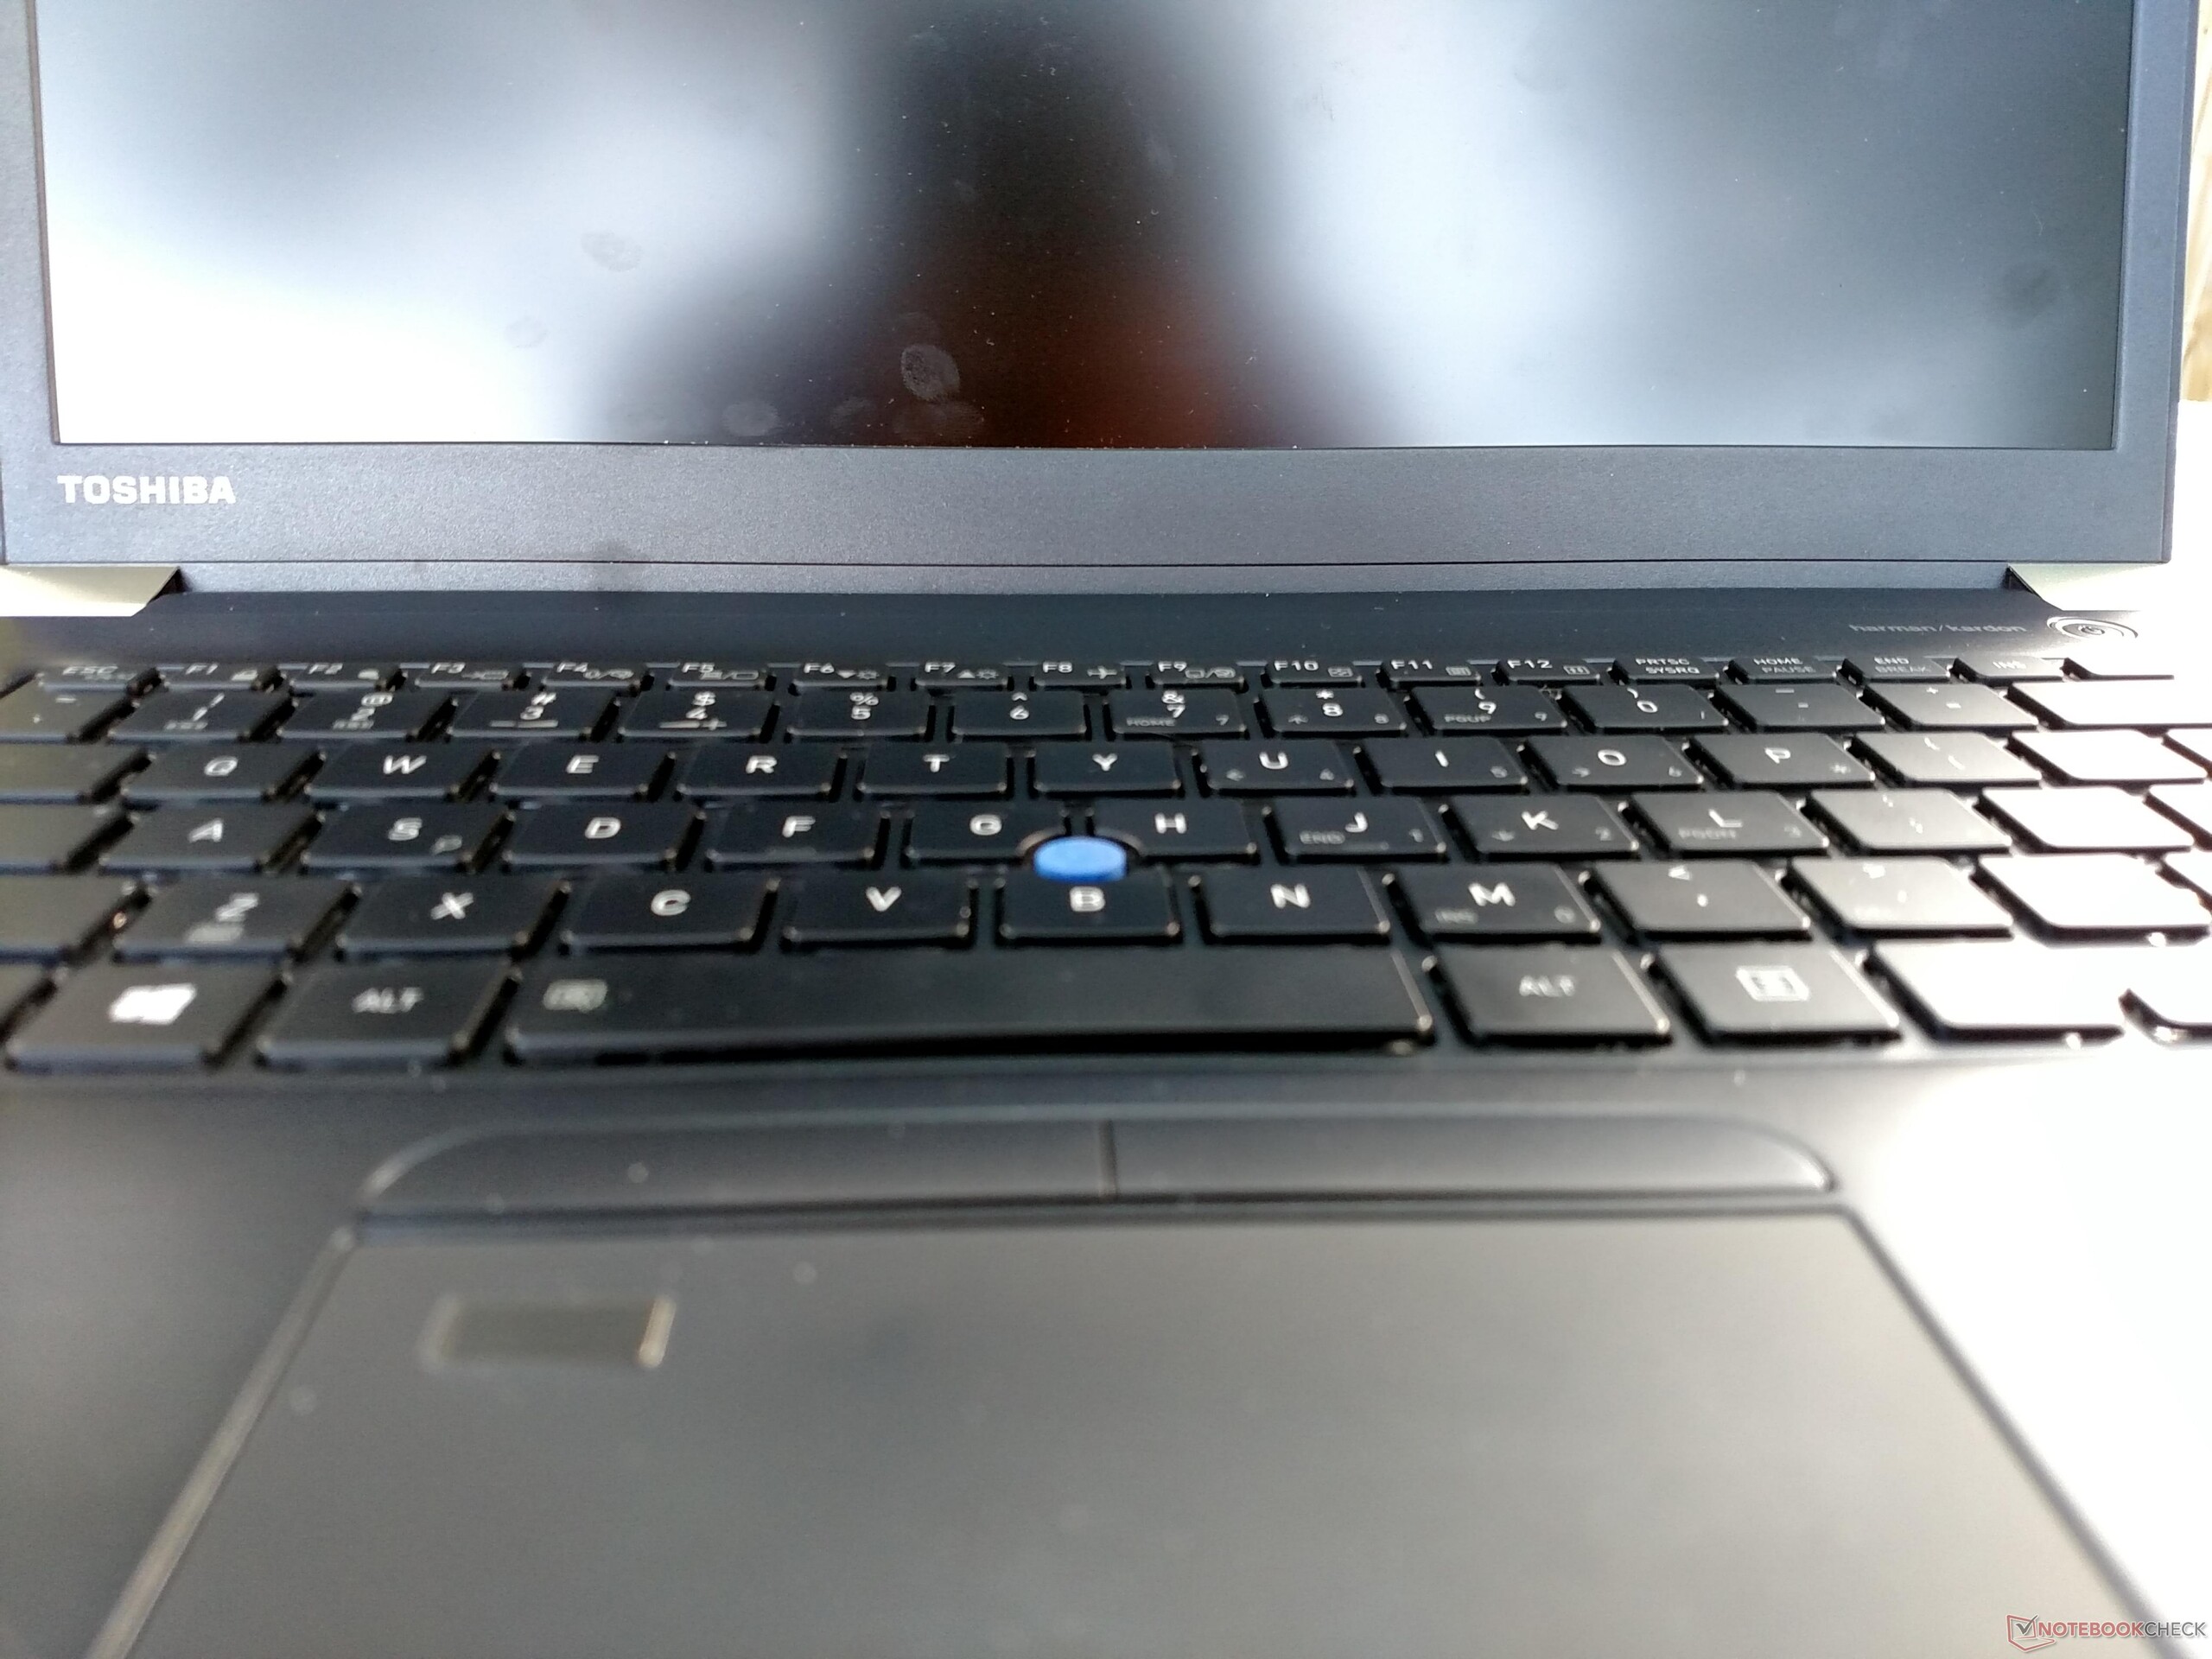
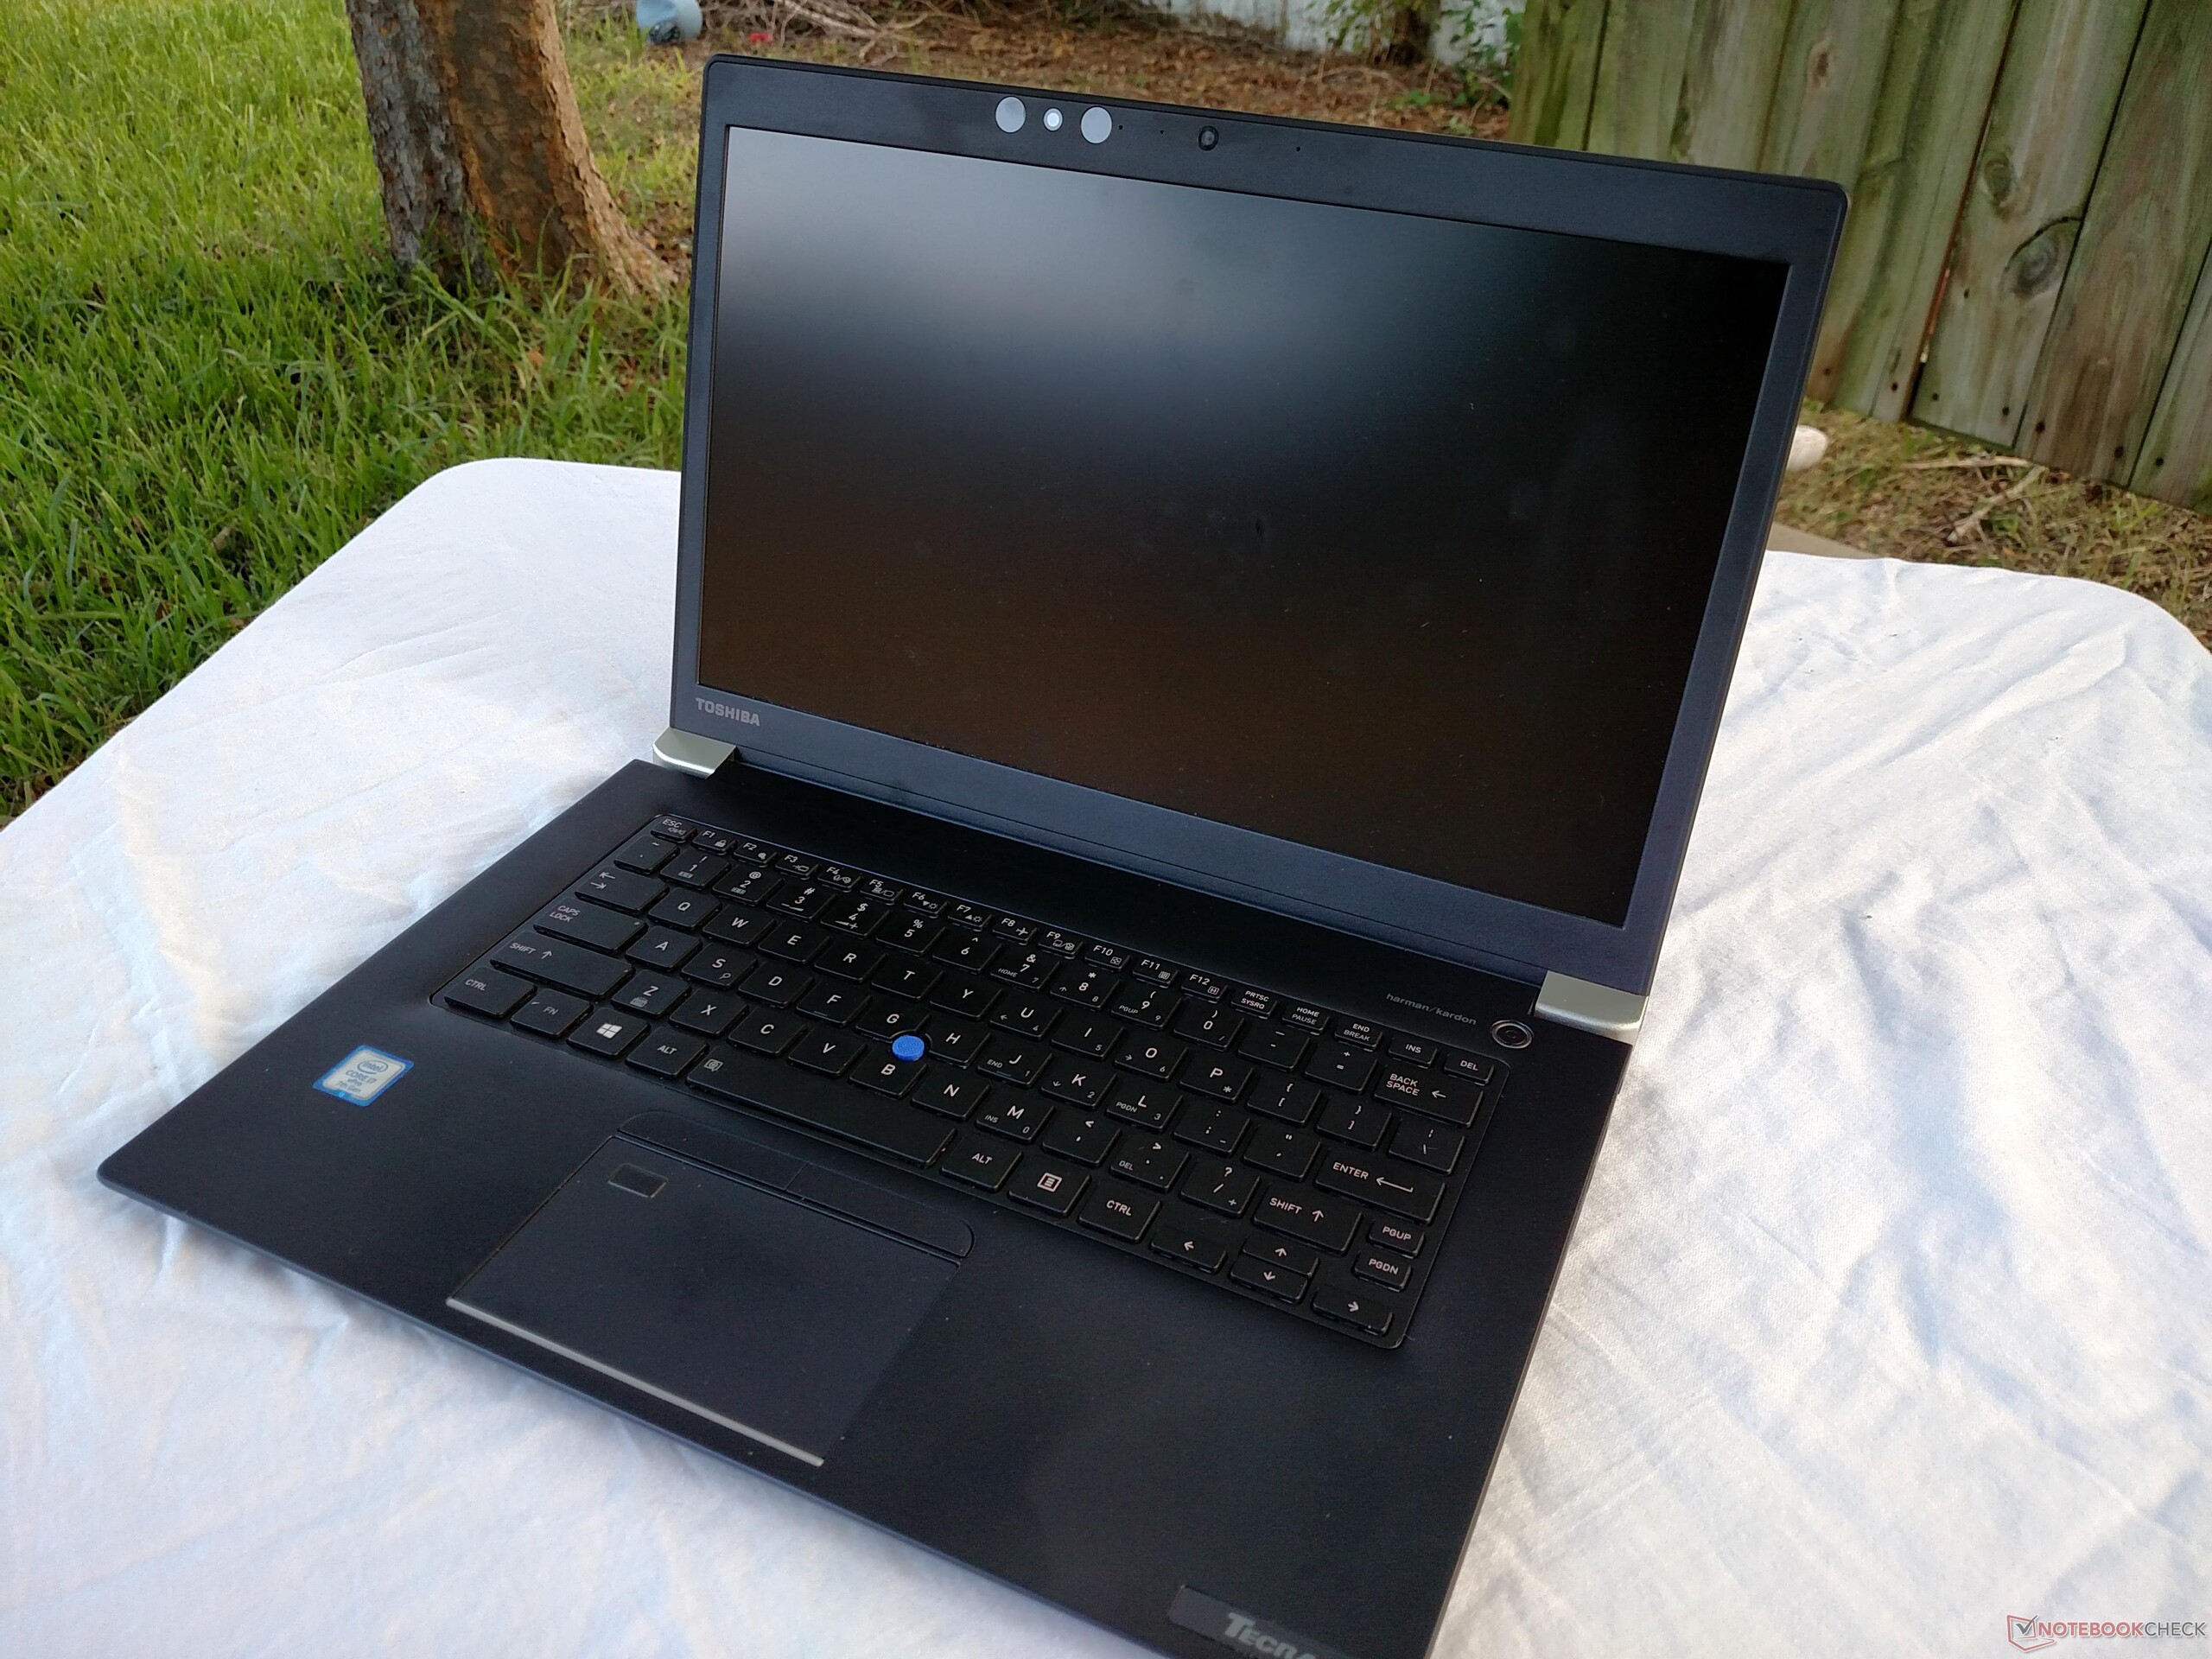
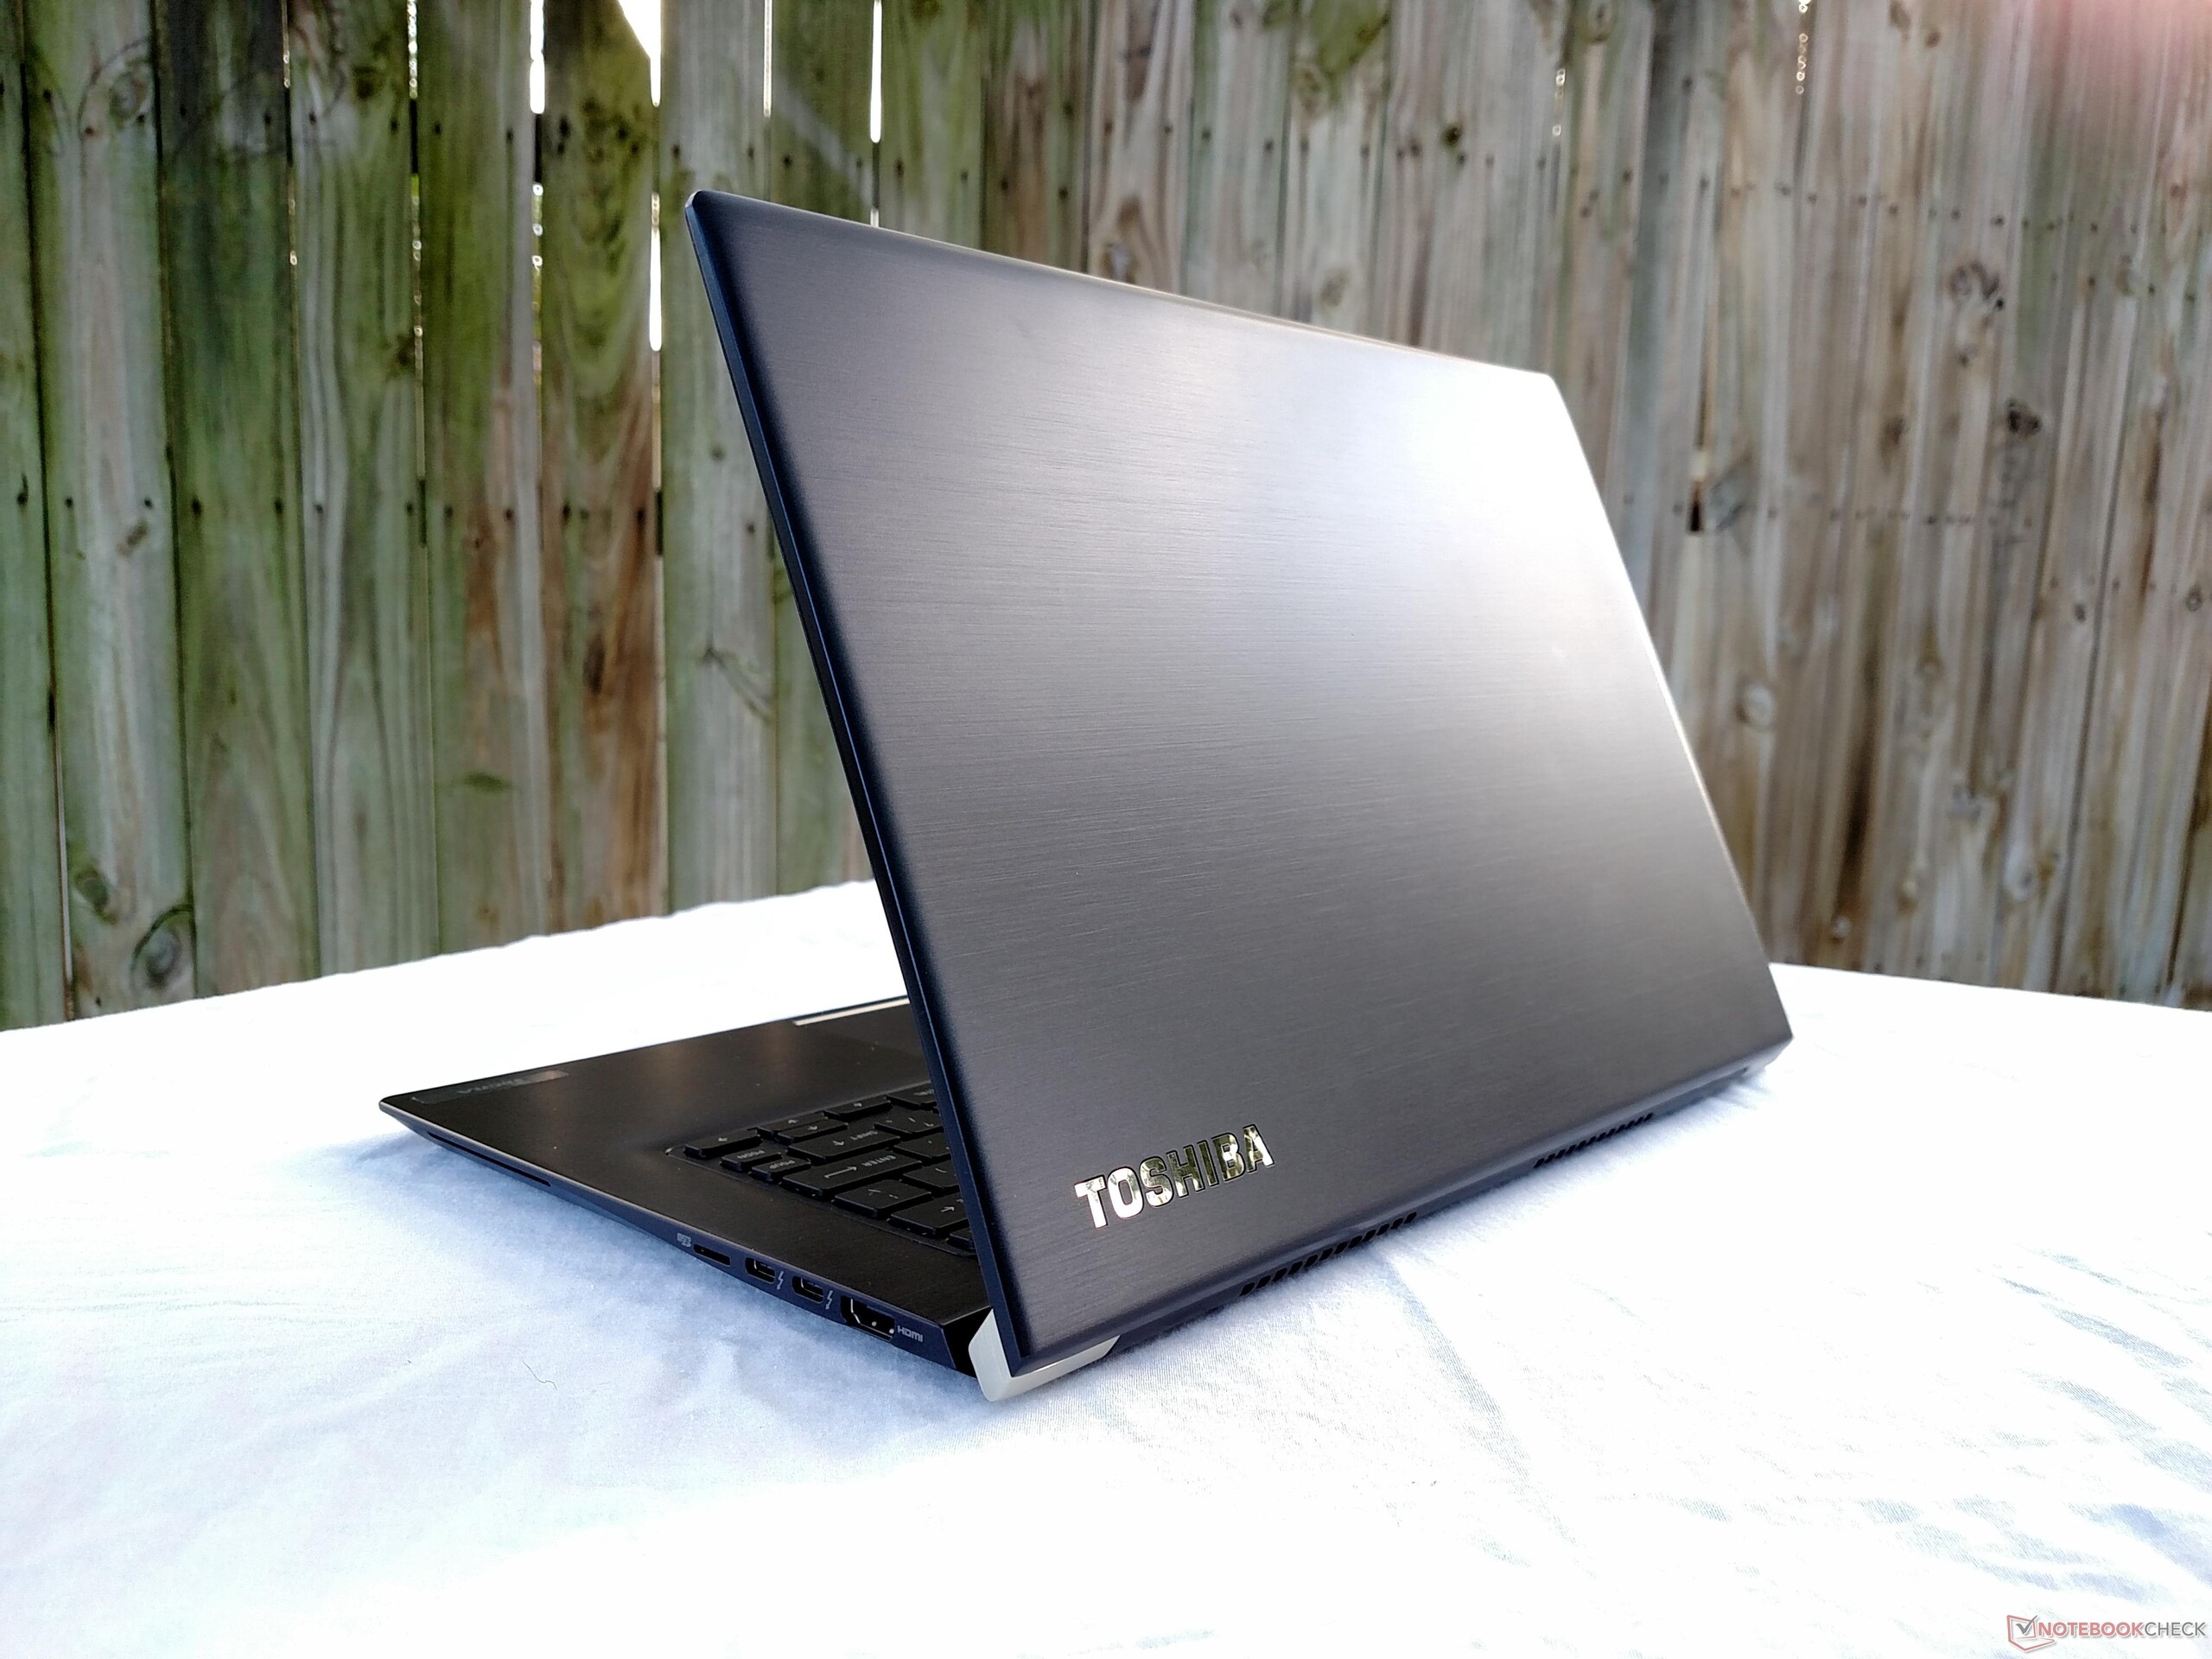
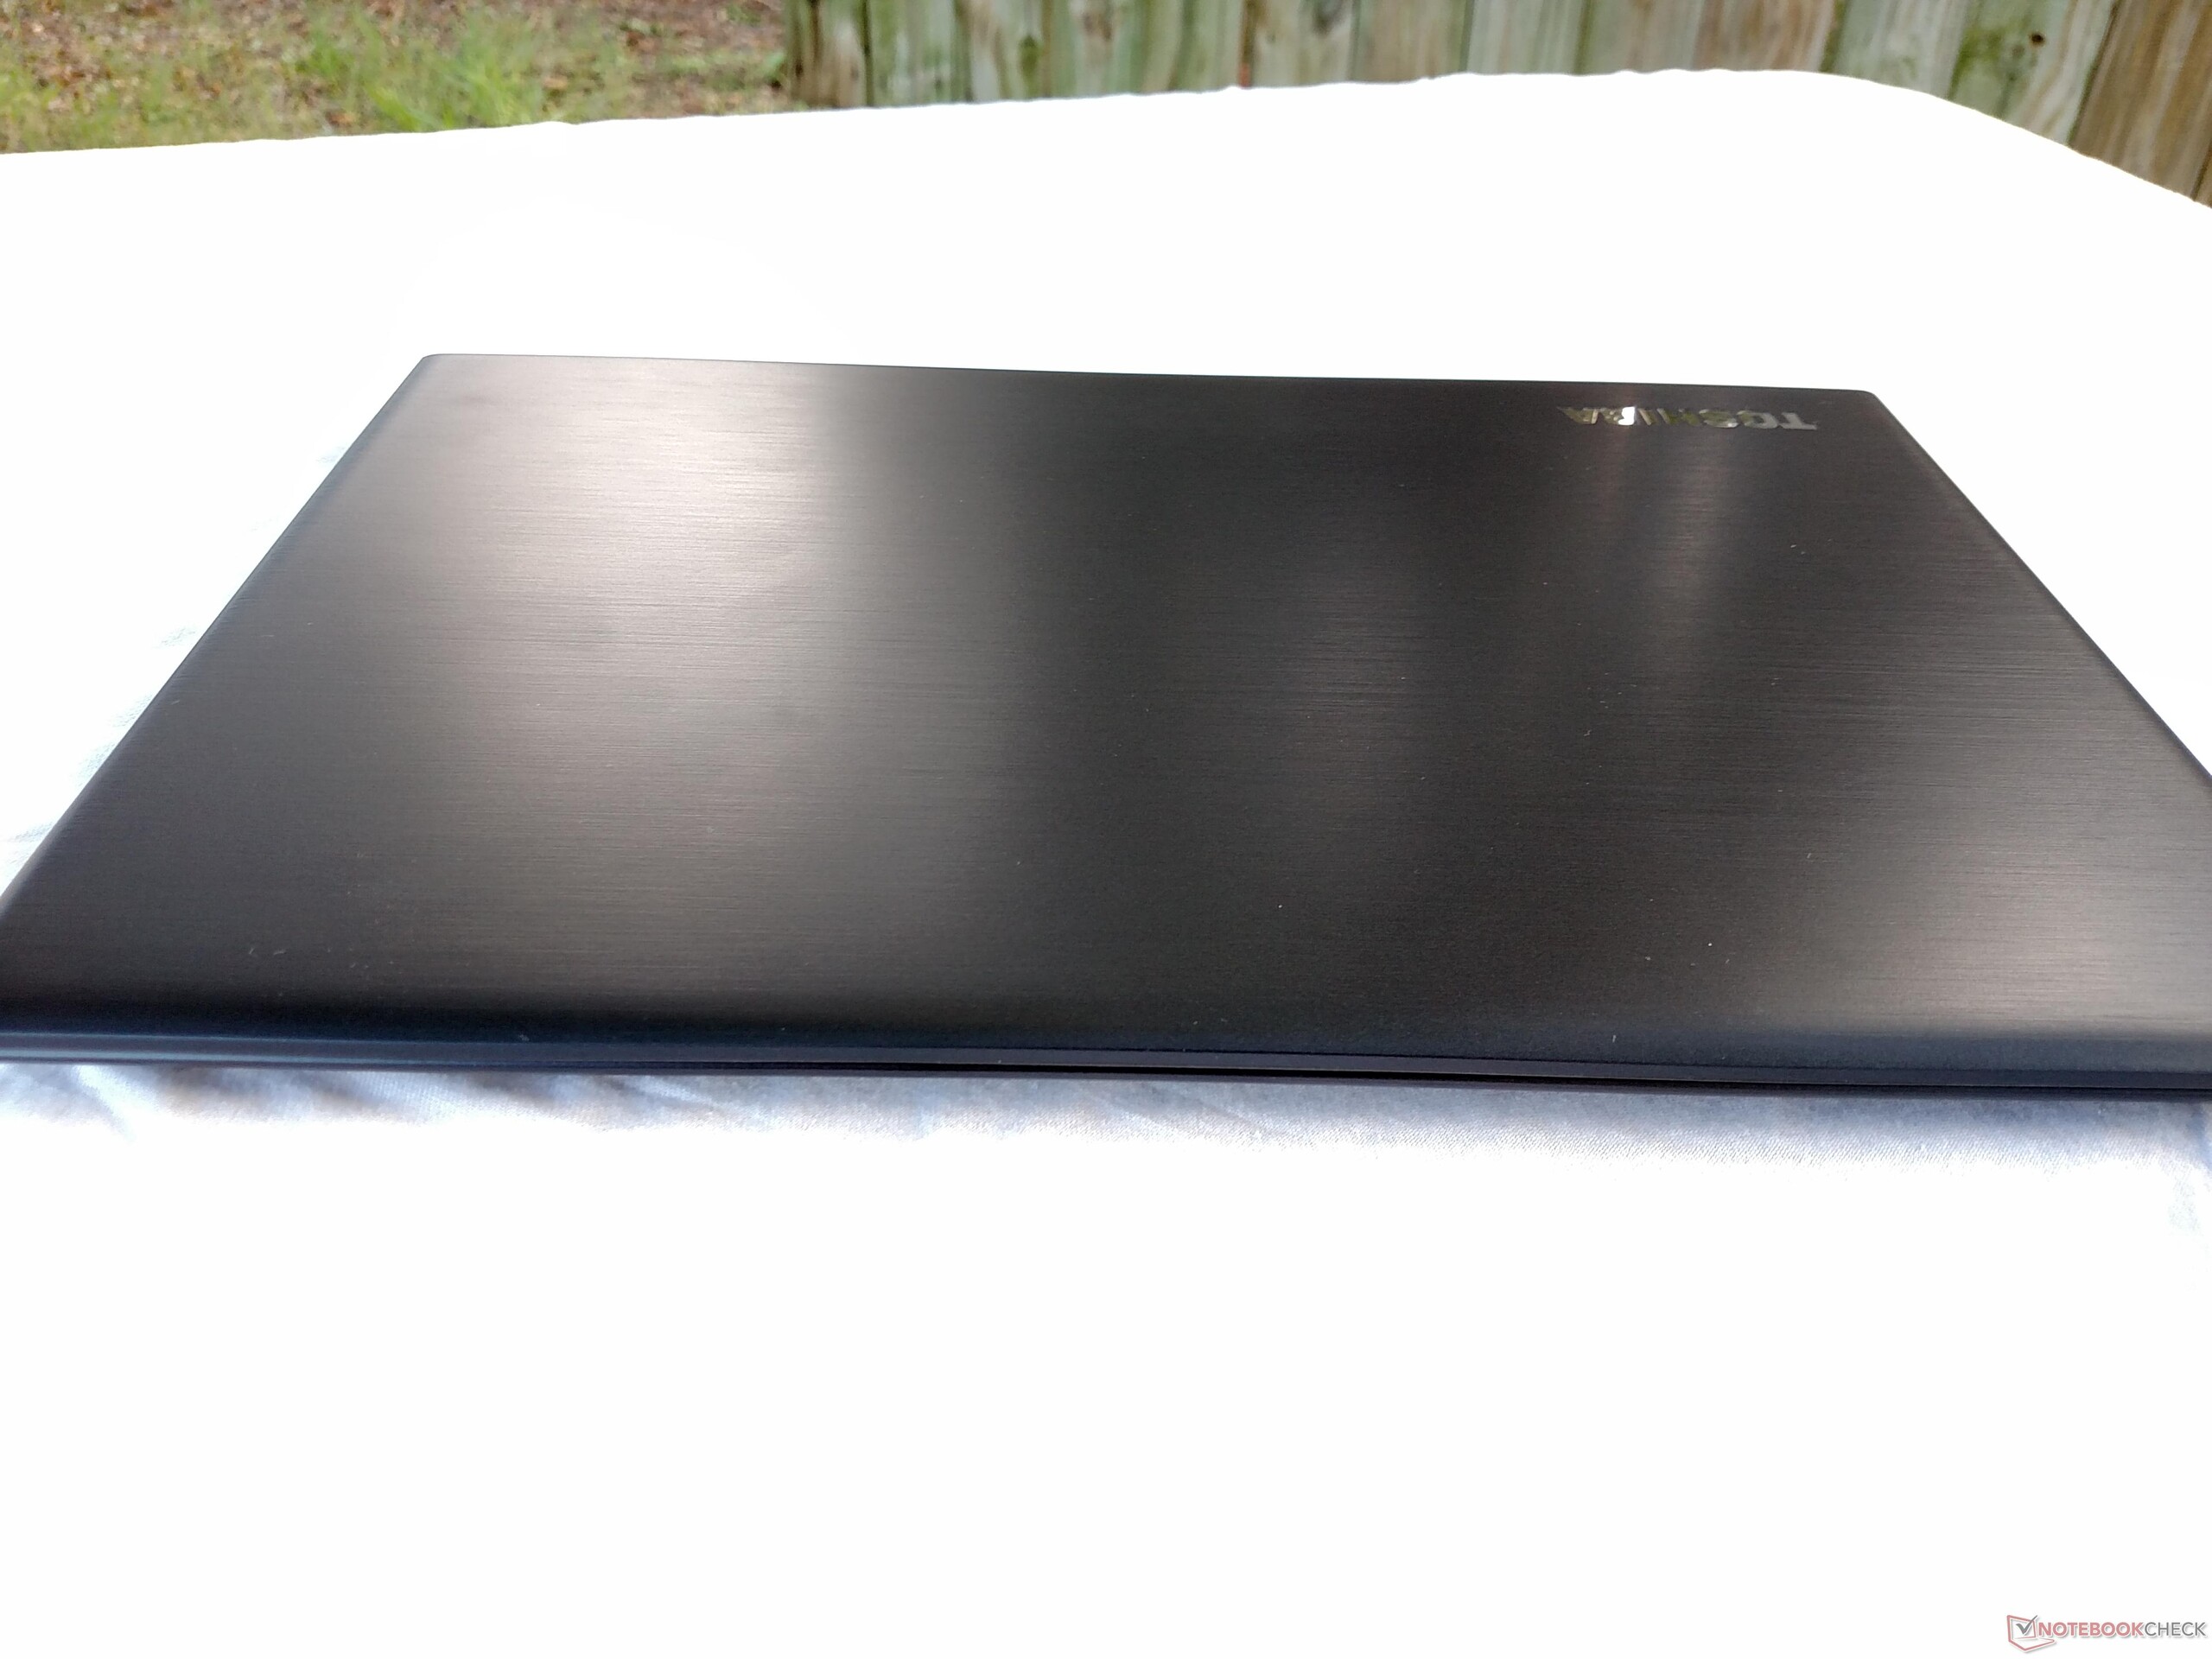
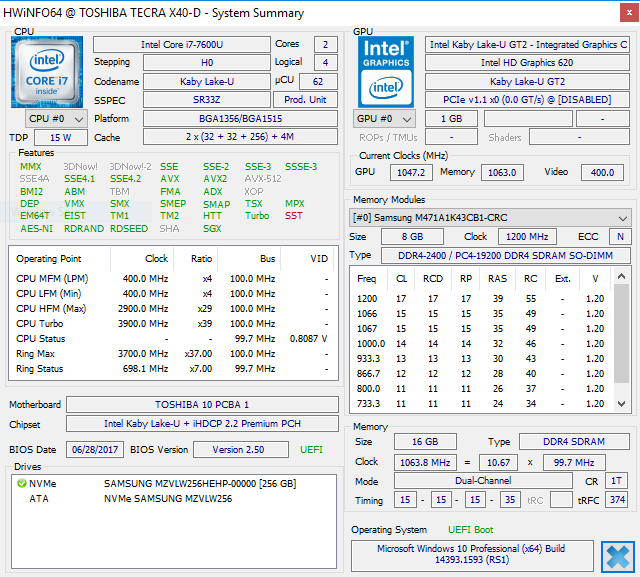
De Toshiba Tecra X40 is eigenlijk een Portègè X30 met een 14 inch beeldscherm. Daardoor heeft het apparaat veel sterke, maar ook zwakke punten overgenomen van z'n kleinere broer. De prachtige behuizing zit goed in elkaar en is stevig voor een 14 inch notebook. De biometrische sensoren zijn snel, betrouwbaar en eenvoudig te gebruiken. De NVMe SSD is ontzettend snel en laat het gehele systeem sneller aanvoelen. Samen met de Core i7-7600U is de Tecra X40 een snelle zakelijke notebook in een krap jasje.
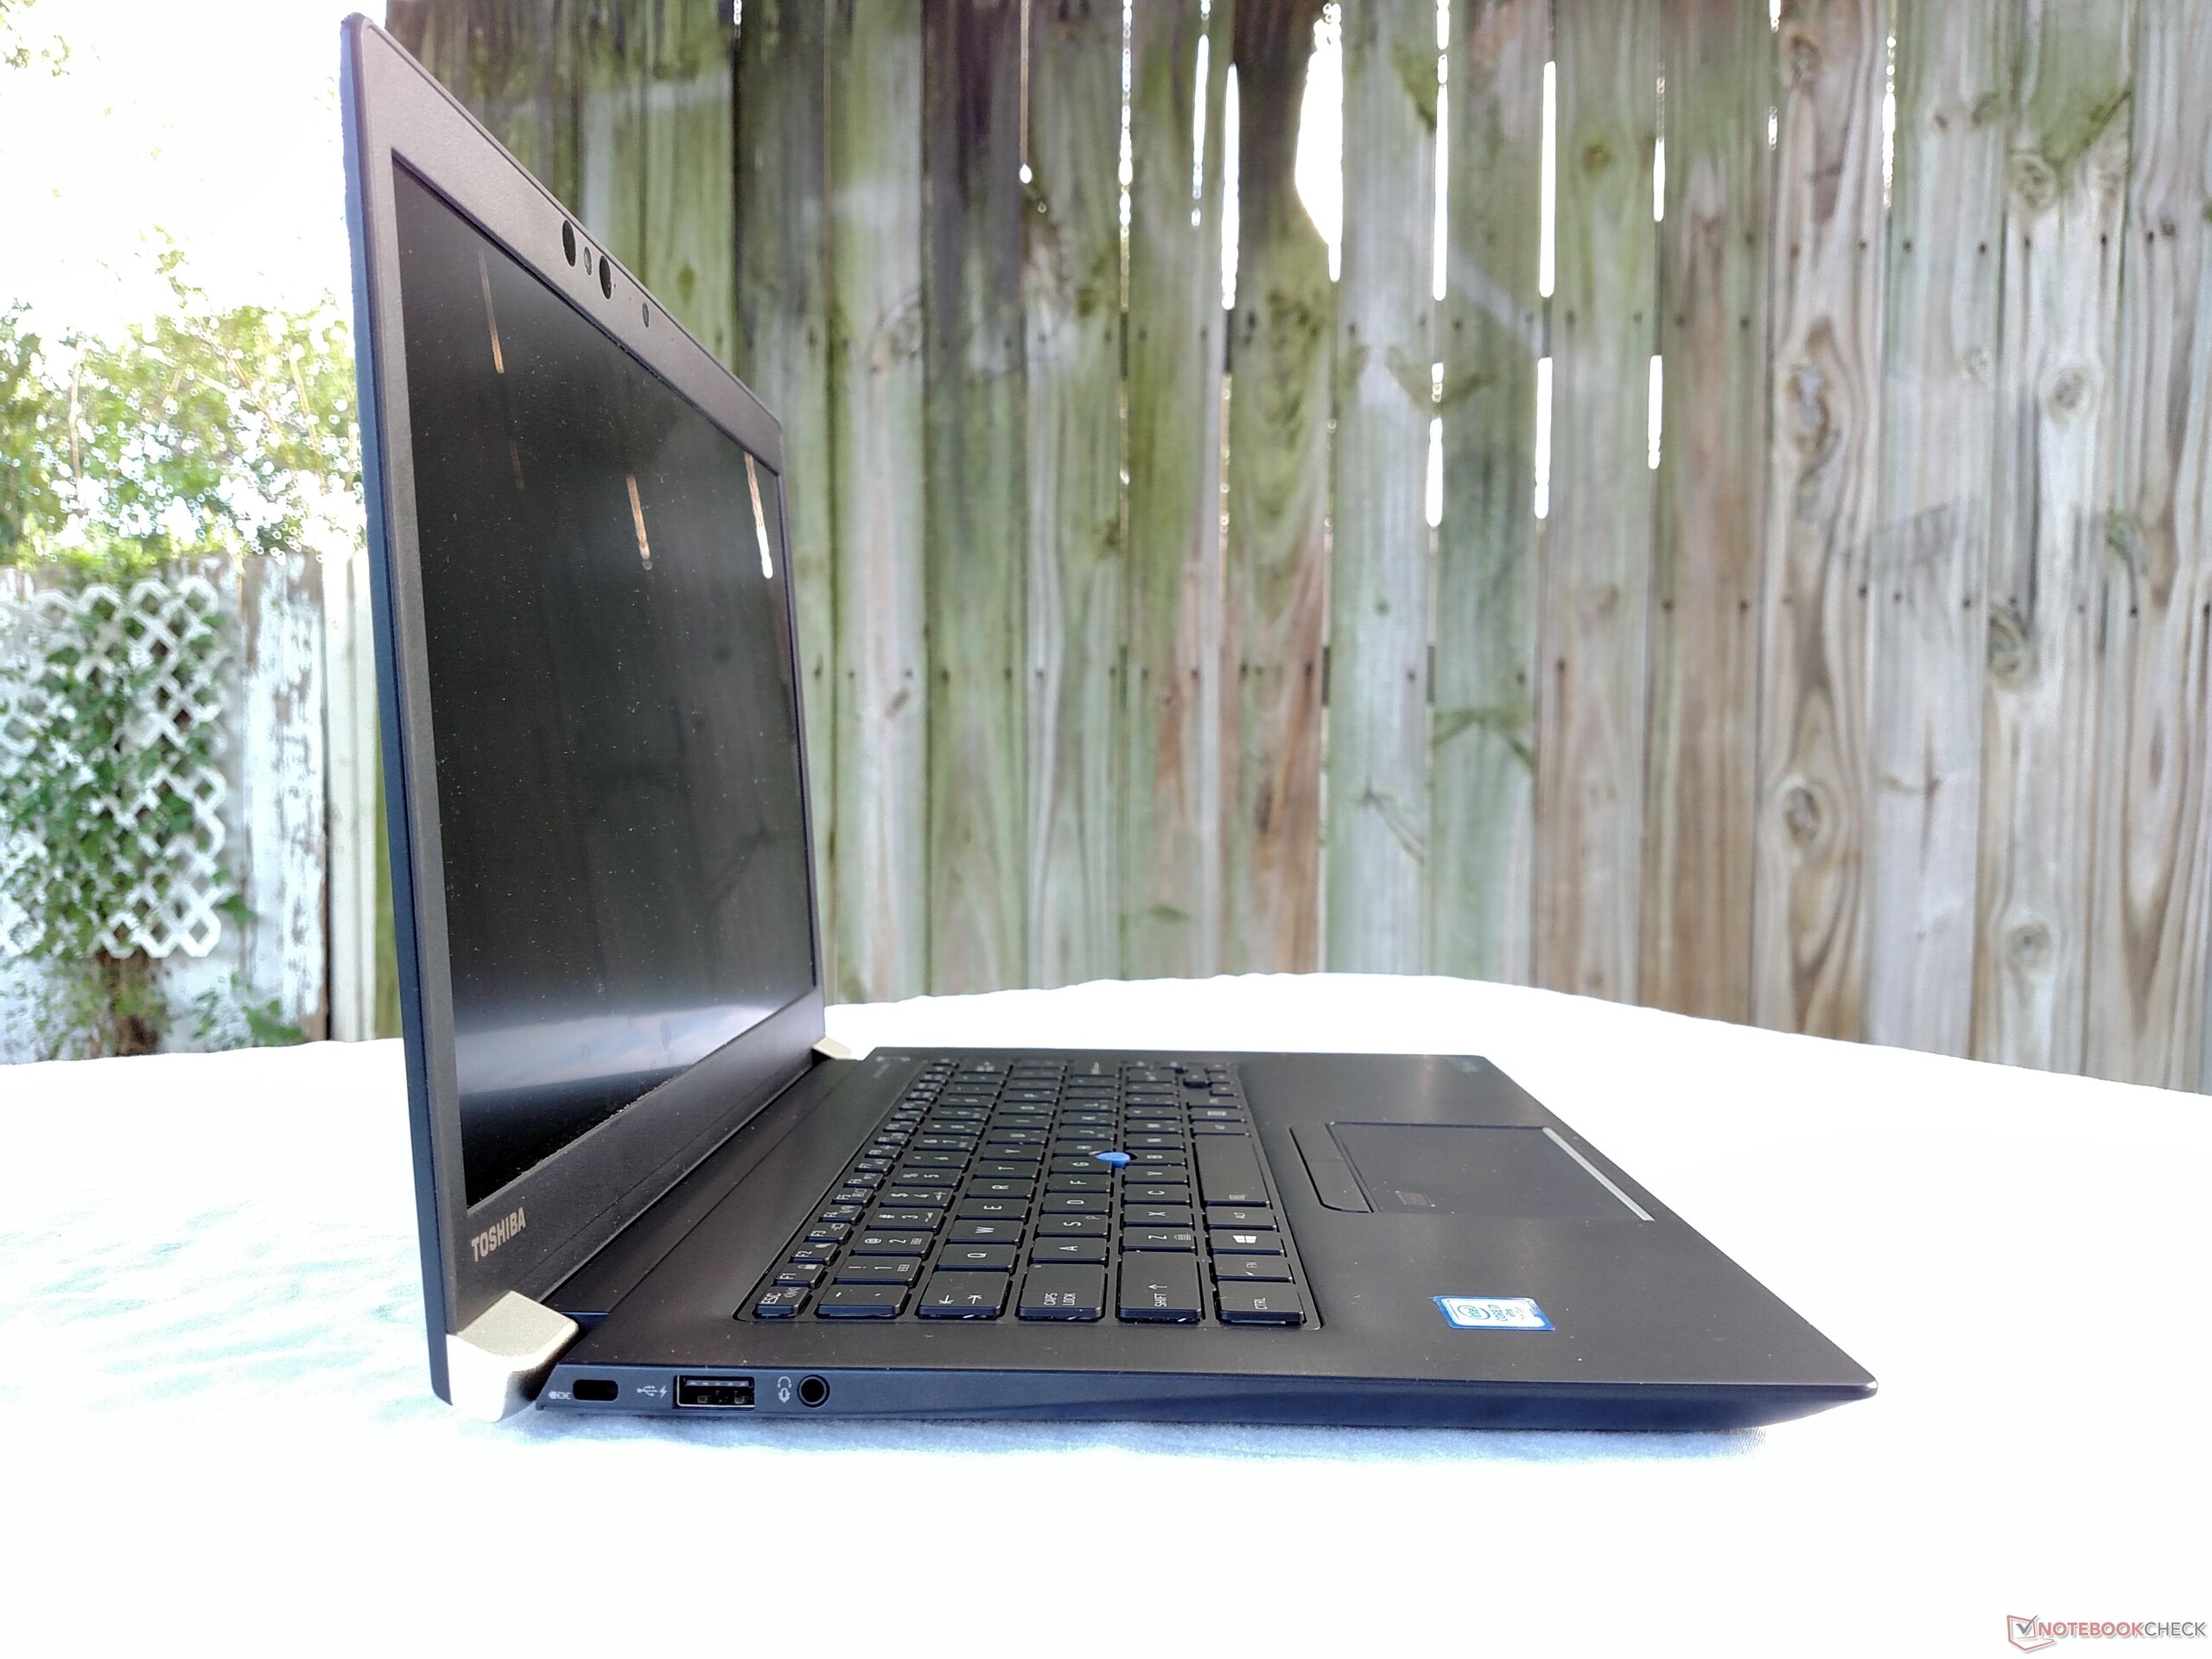
Echter, het beeldschermdeksel buigt eenvoudig en het toetsenbord is zeker niet de meest ergonomische die we ooit getest hebben. De luide toetsen zijn afleidend en de spatiebalk kraakt wanneer hij wordt ingedrukt. Ook is het beeldscherm niet zo levendig of kleurrijk als die van andere zakelijke notebooks, maar voldoet het paneel voor alledaags gebruik.
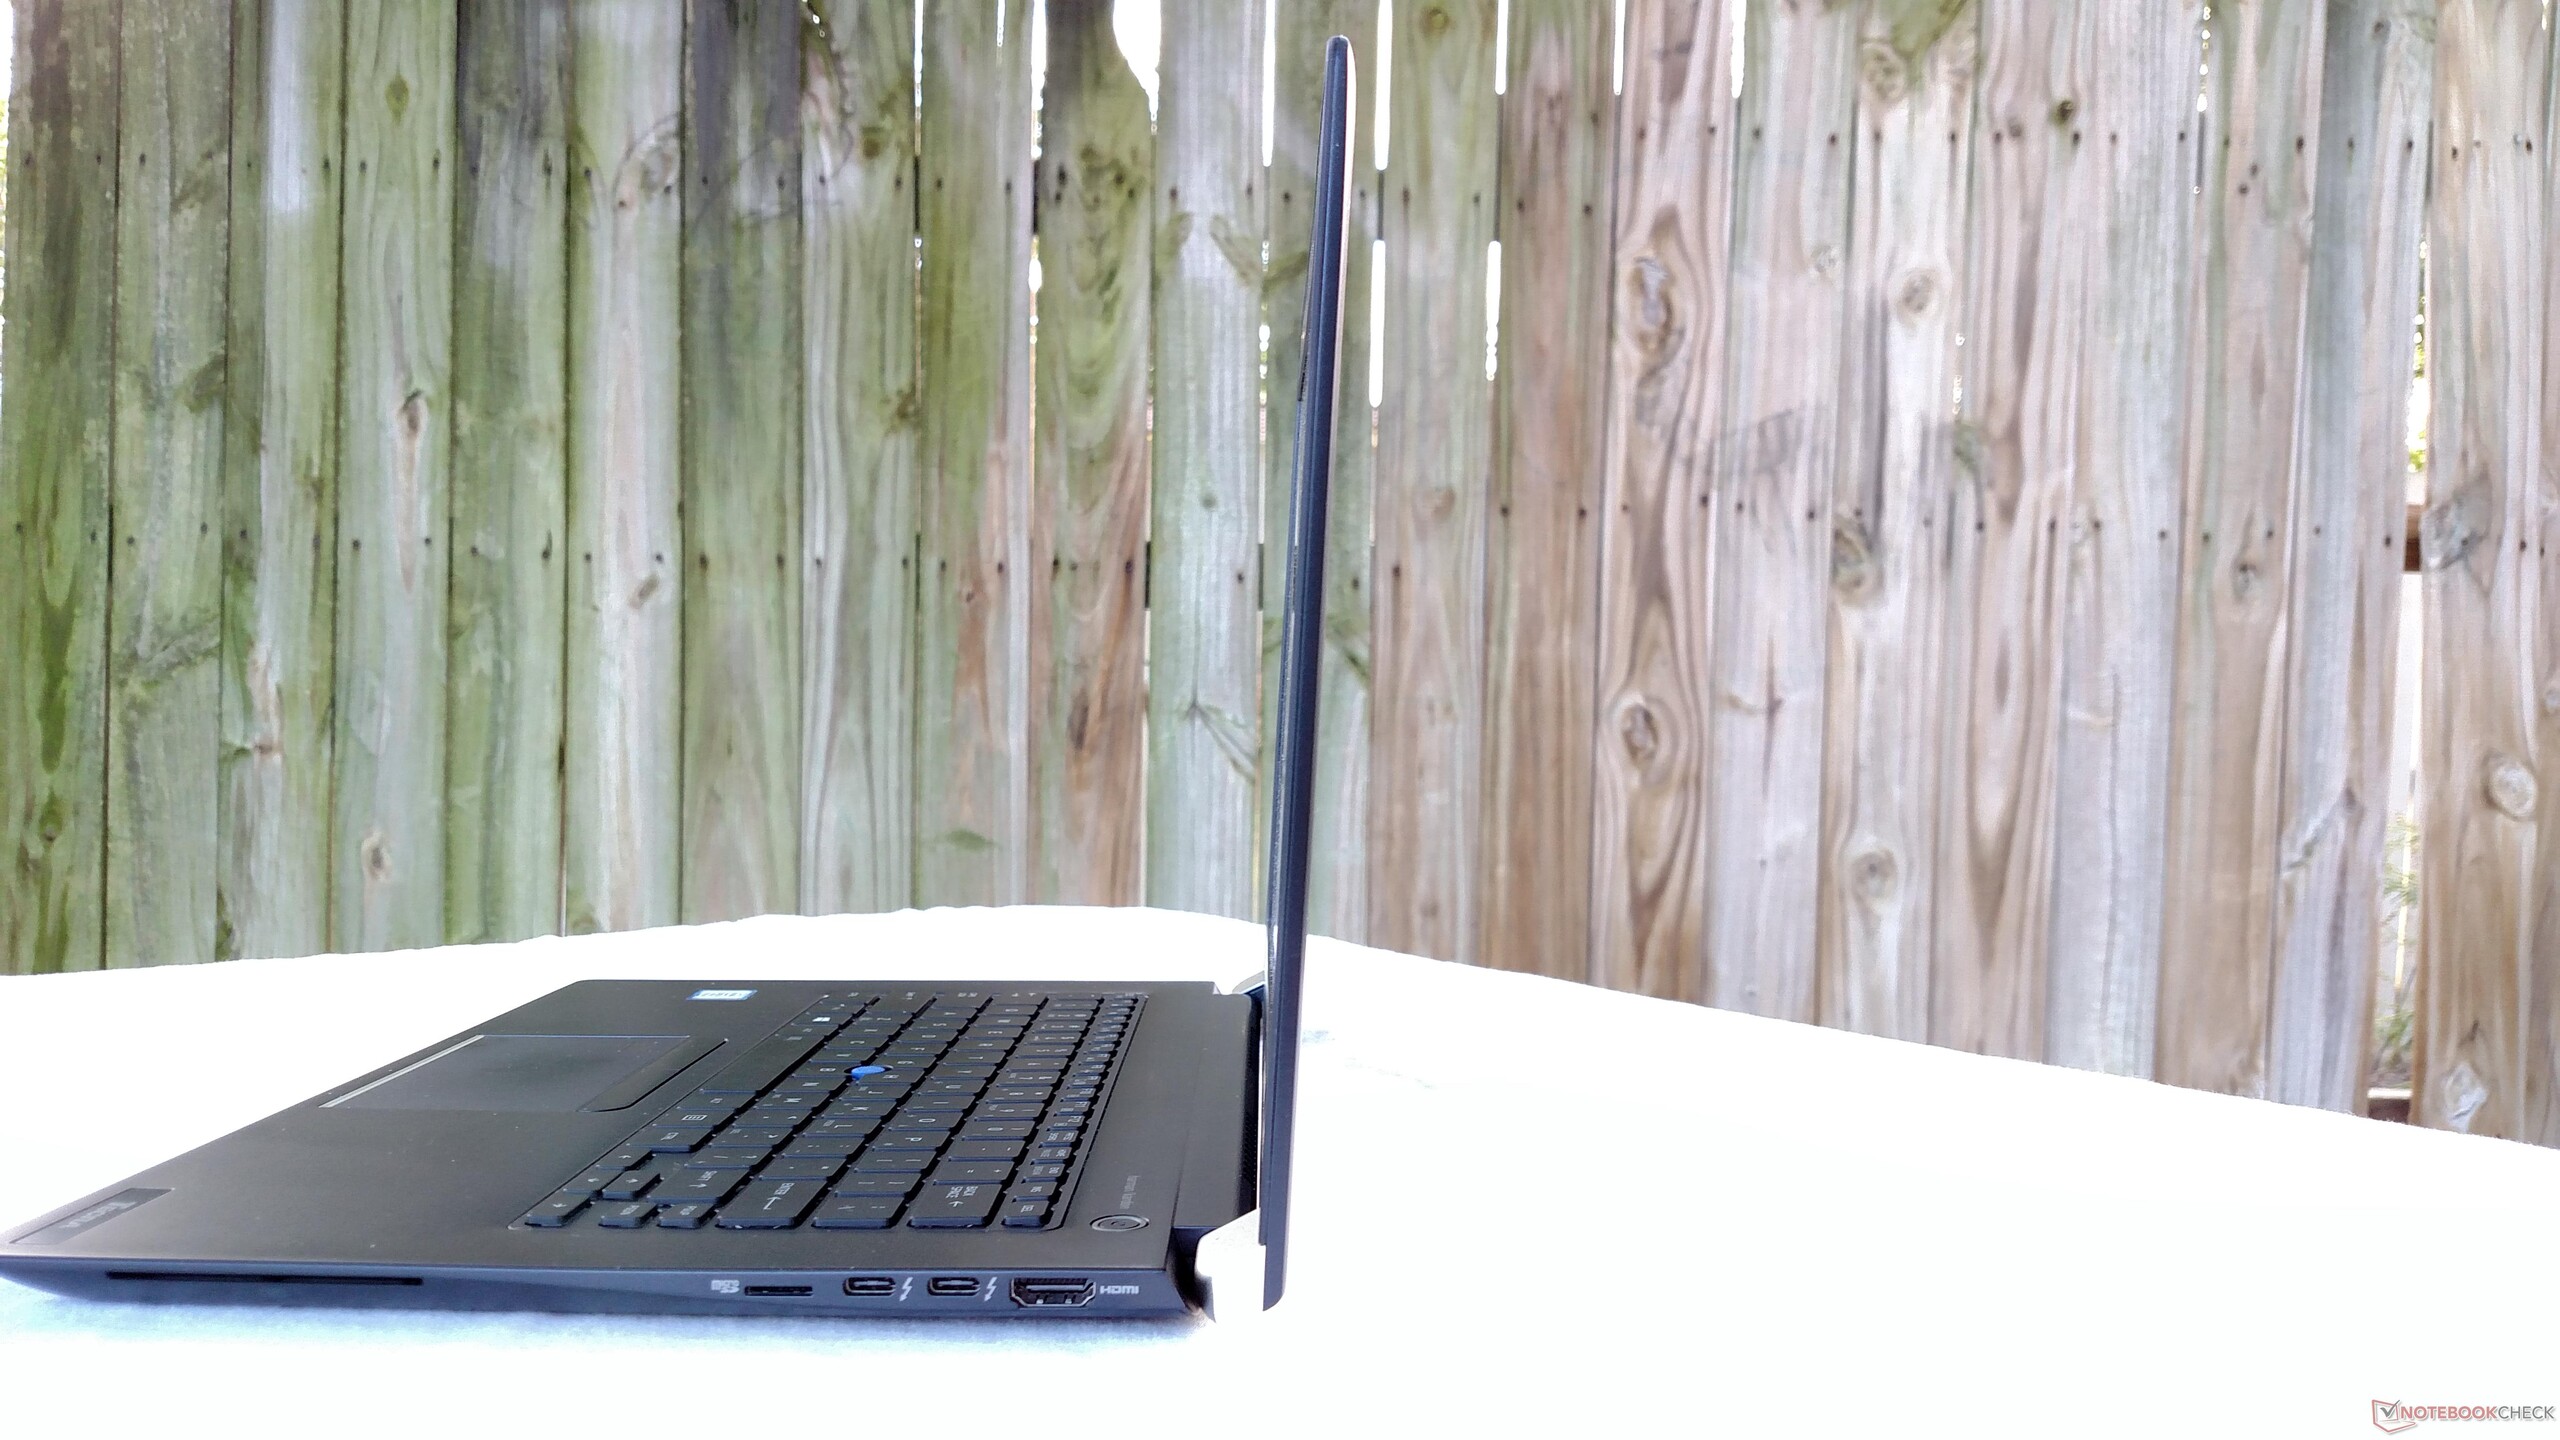
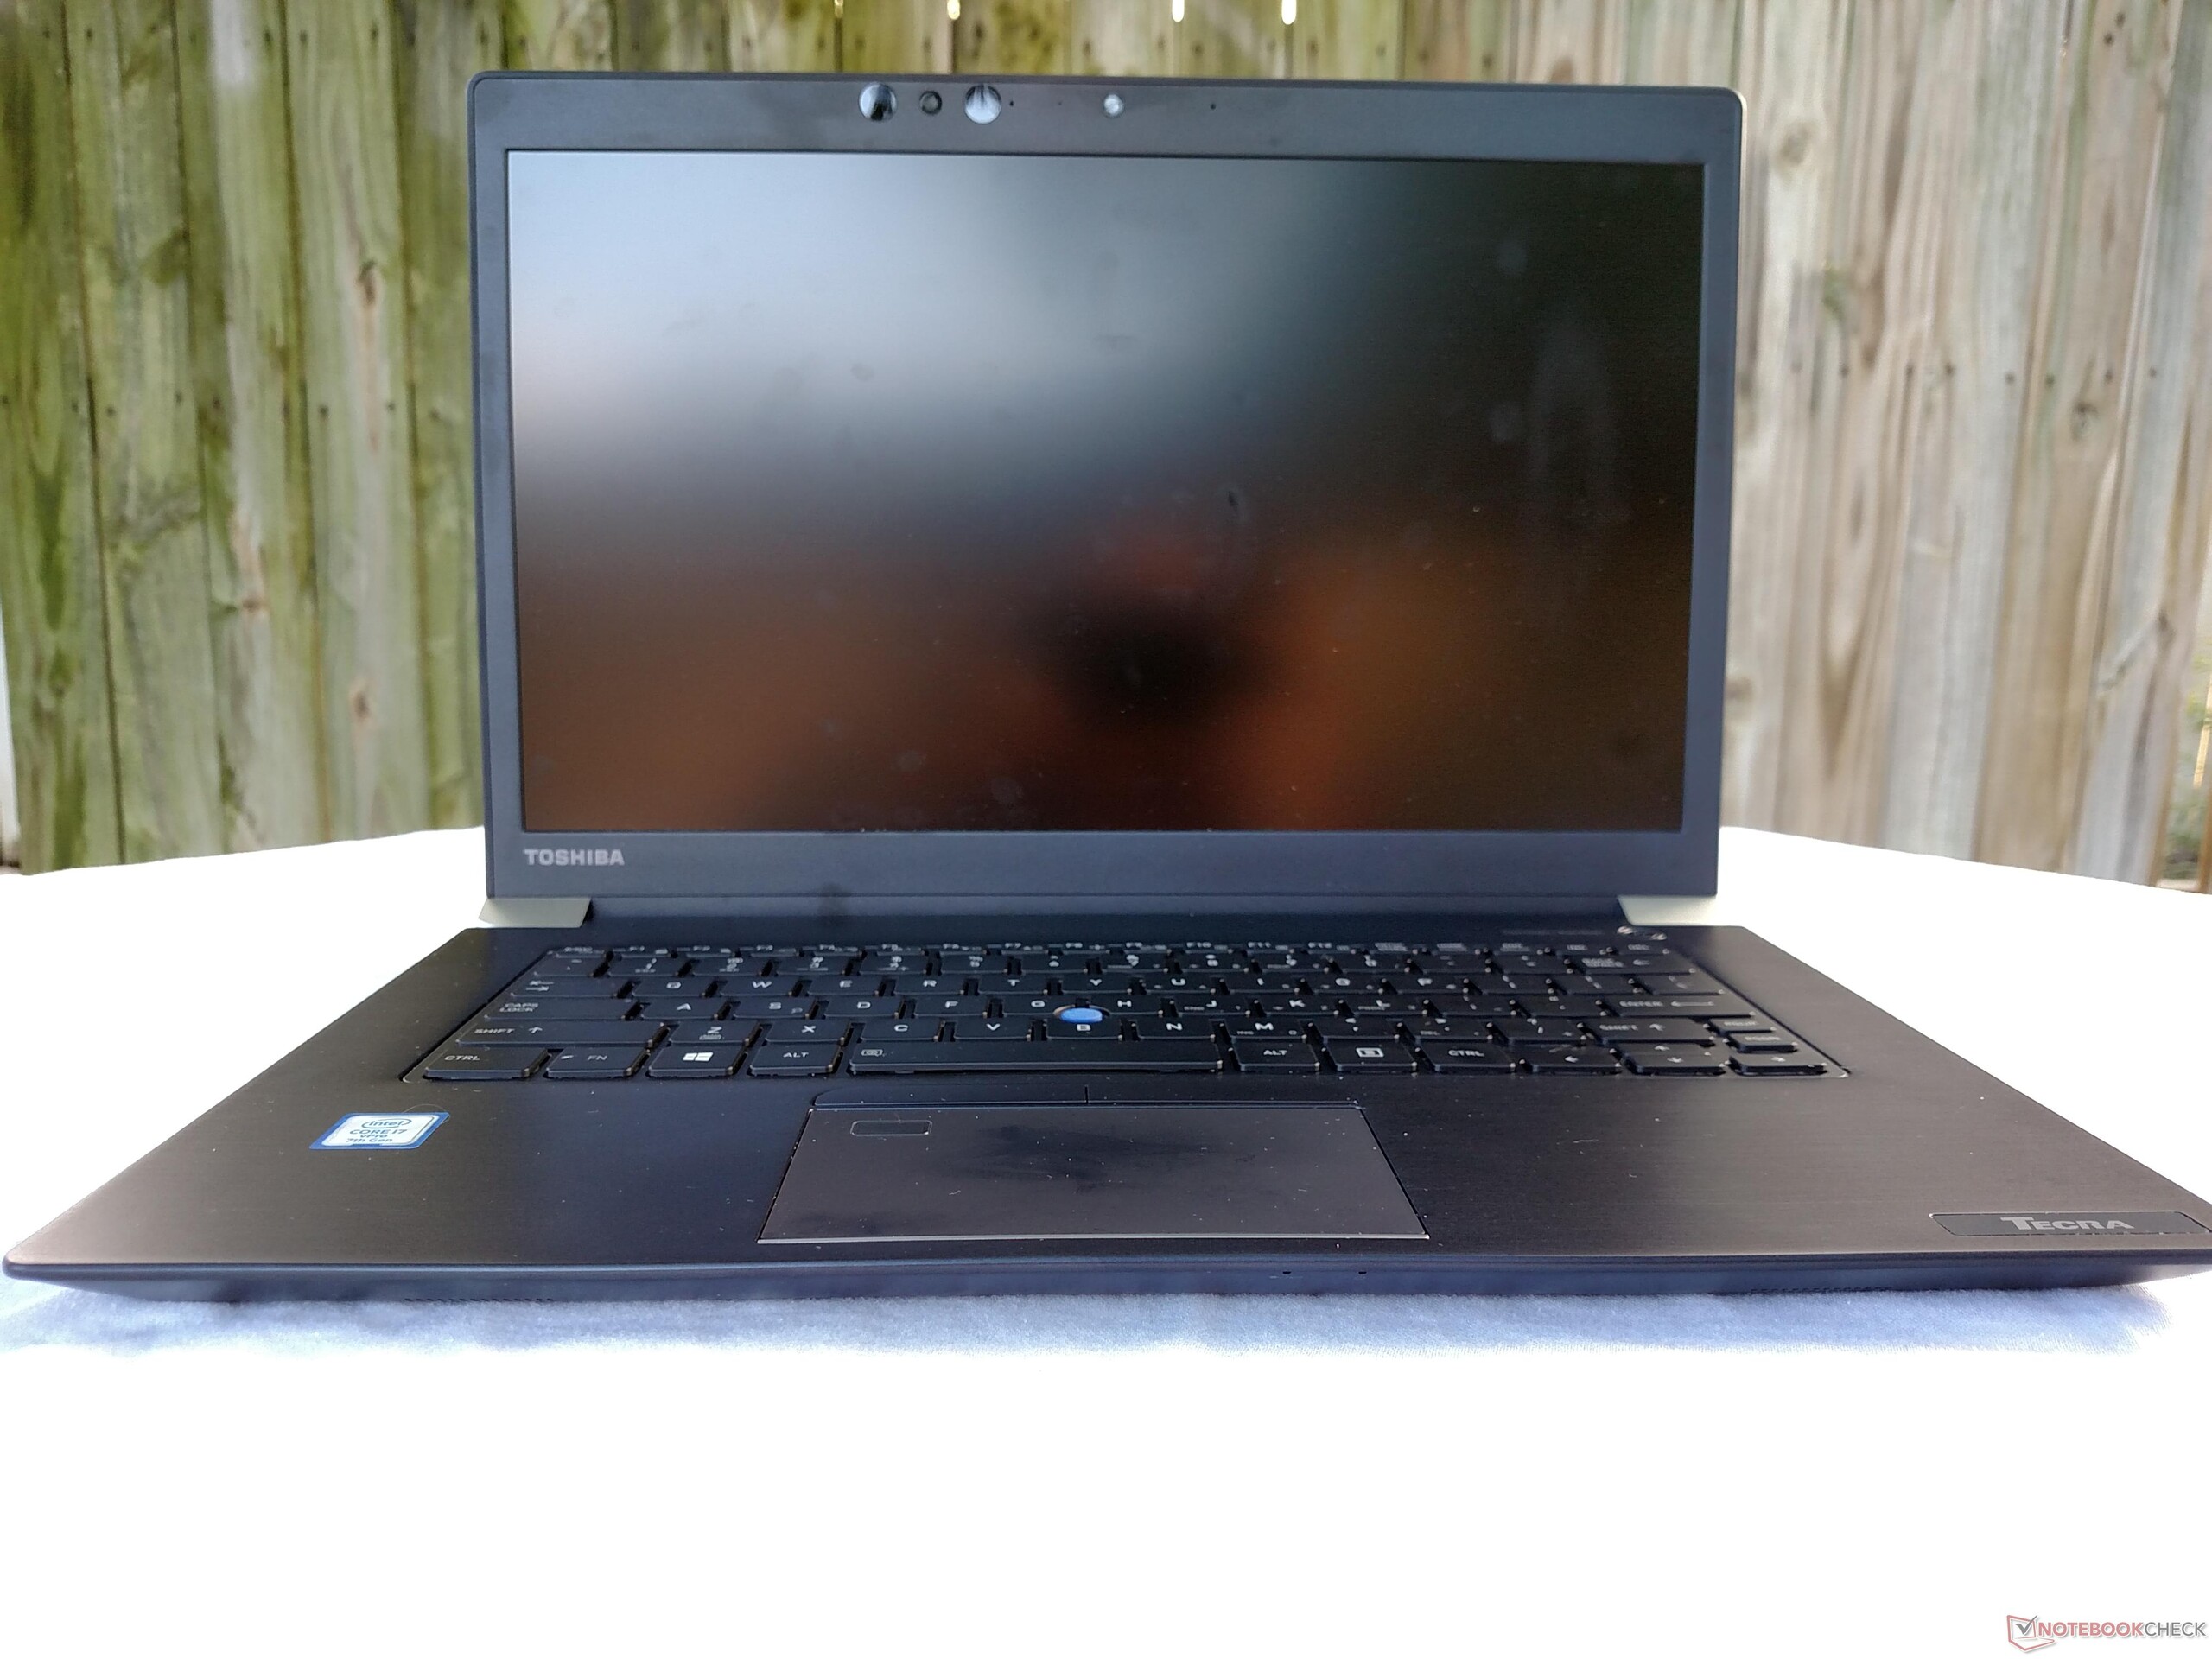
De Toshiba Tecra X40 is een degelijke, middenklasse notebook. Het apparaat kan helaas de uitstekende Lenovo X1 Carbon niet evenaren, maar komt wel in de buurt zodat de gebreken gerechtvaardigd worden door een lagere prijs. Indien gebruikers graag een aantal poorten opofferen en kunnen leven met een lagere kwaliteit toetsenbord, is de Tecra X40 zeker het overwegen waard. Het feit dat het apparaat enkele honderden euro's minder kost dan de X1 Carbon maakt het pakket nog aantrekkelijker.
Toshiba Tecra X40-D
- 28-08-2017 v6 (old)
Sam Medley
Price comparison
