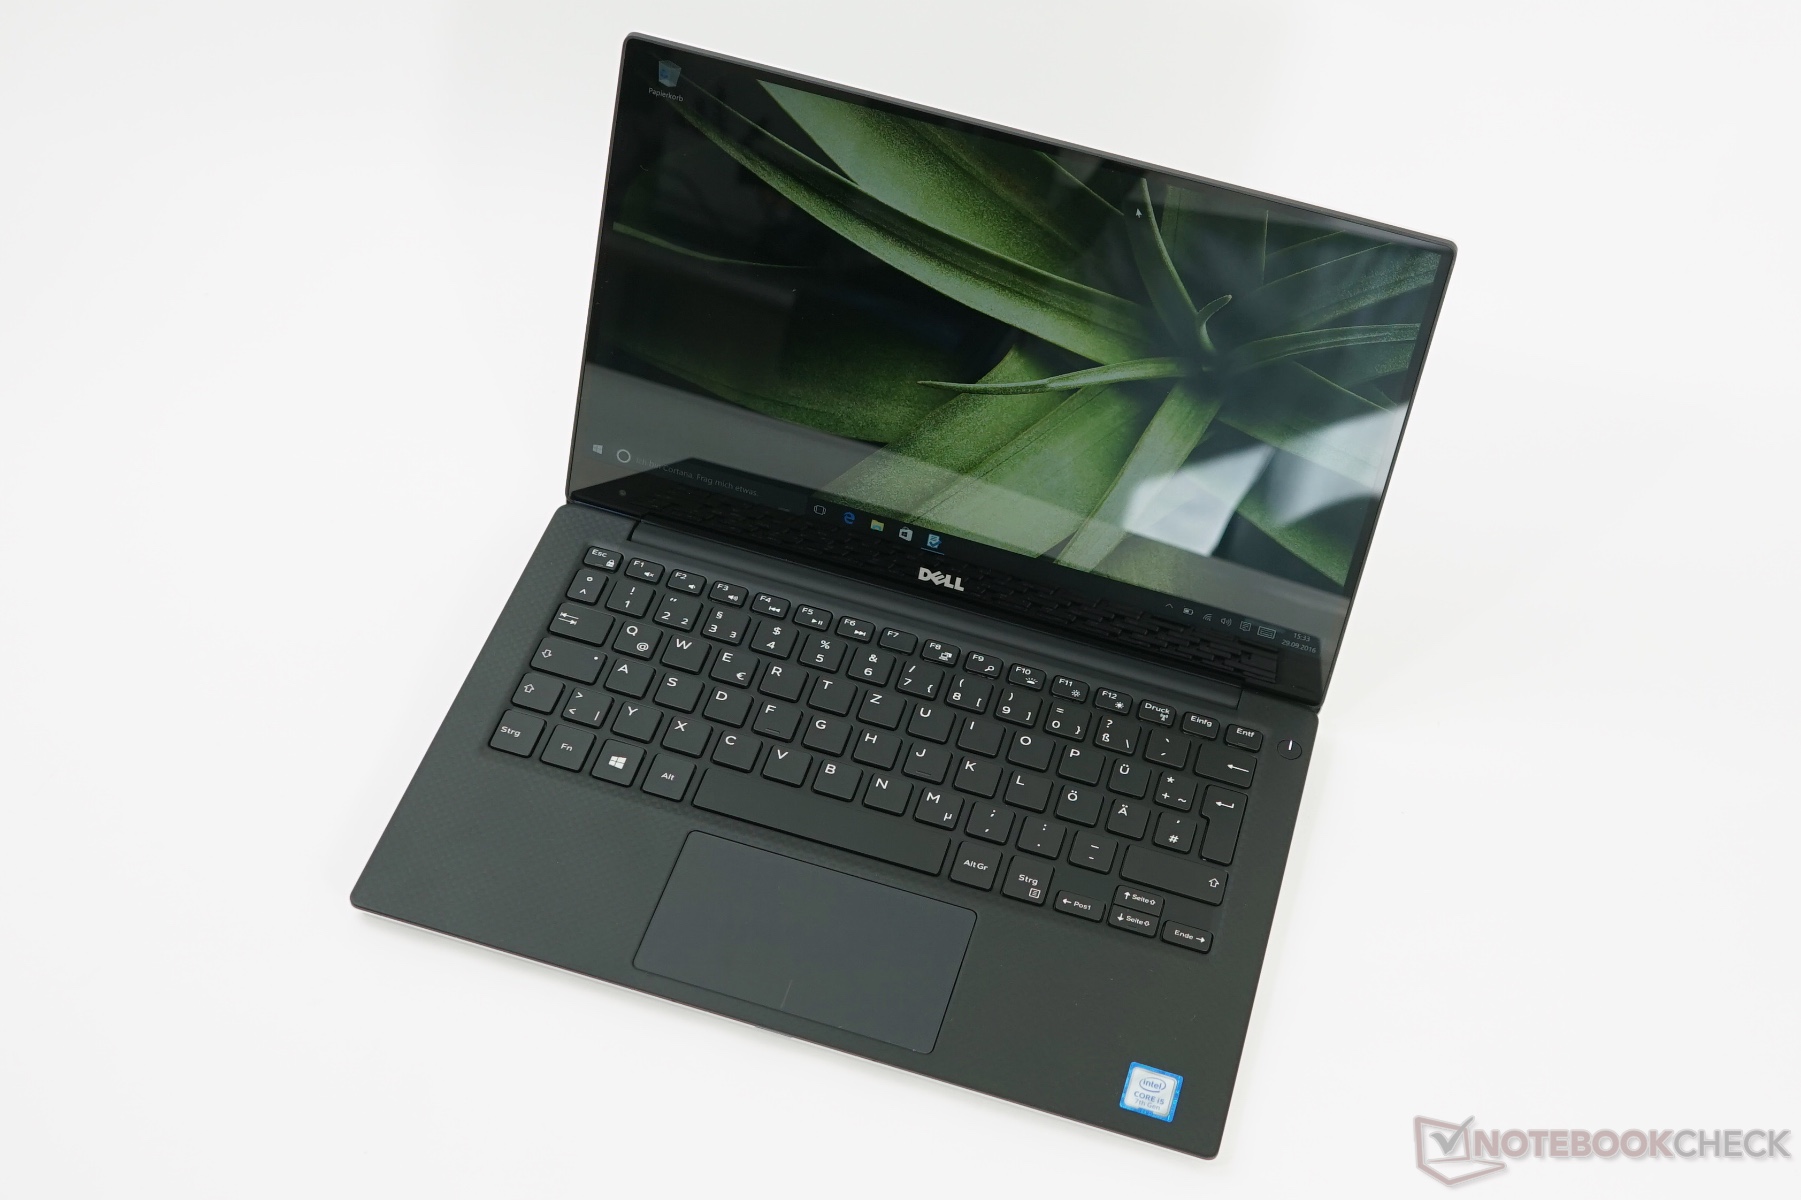
Kort testrapport Dell XPS 13 9360 (FHD, i7, Iris) Laptop
| SD Card Reader | |
| average JPG Copy Test (av. of 3 runs) | |
| Dell XPS 13 9360 FHD i7 Iris | |
| Dell XPS 15 9560 (i7-7700HQ, UHD) | |
| HP Envy 13-ad065nr | |
| maximum AS SSD Seq Read Test (1GB) | |
| Dell XPS 15 9560 (i7-7700HQ, UHD) | |
| Dell XPS 13 9360 FHD i7 Iris | |
| HP Envy 13-ad065nr | |
| Networking | |
| iperf3 transmit AX12 | |
| Huawei MateBook X | |
| Dell XPS 13 9360 FHD i7 Iris | |
| Apple MacBook Pro 13 2017 | |
| HP Envy 13-ad065nr | |
| iperf3 receive AX12 | |
| Apple MacBook Pro 13 2017 | |
| HP Envy 13-ad065nr | |
| Dell XPS 13 9360 FHD i7 Iris | |
| Huawei MateBook X | |
Screen Flickering / PWM (Pulse-Width Modulation)
| Screen flickering / PWM waargenomen | 19530 Hz | ≤ 80 % helderheid instelling | 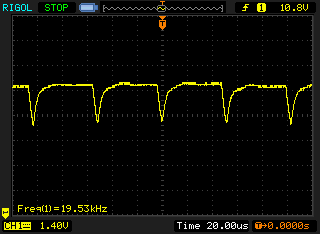 |
De achtergrondverlichting van het scherm flikkert op 19530 Hz (in het slechtste geval, bijvoorbeeld bij gebruik van PWM) aan een helderheid van 80 % en lager. Boven deze helderheid zou er geen flickering / PWM mogen optreden. De frequentie van 19530 Hz is redelijk hoog en de meeste mensen die gevoelig zijn aan flickering zouden dit dus niet mogen waarnemen of geïrriteerde ogen krijgen. Ter vergelijking: 52 % van alle geteste toestellen maakten geen gebruik van PWM om de schermhelderheid te verlagen. Als het wel werd gebruikt, werd een gemiddelde van 7757 (minimum: 5 - maximum: 343500) Hz waargenomen. | |||
| |||||||||||||||||||||||||
Helderheidsverdeling: 85 %
Helderheid in Batterij-modus: 461 cd/m²
Contrast: 2305:1 (Zwart: 0.2 cd/m²)
ΔE ColorChecker Calman: 5.4 | ∀{0.5-29.43 Ø4.71}
ΔE Greyscale Calman: 5.4 | ∀{0.09-98 Ø4.96}
76.9% sRGB (Argyll 1.6.3 3D)
48.6% AdobeRGB 1998 (Argyll 1.6.3 3D)
53.3% AdobeRGB 1998 (Argyll 3D)
77.4% sRGB (Argyll 3D)
51.6% Display P3 (Argyll 3D)
Gamma: 2.15
CCT: 7258 K
| Dell XPS 13 9360 FHD i7 Iris SHP1449, , 1920x1080, 13.3" | Dell XPS 13 i7-8550U ID: Sharp SHP144A, Name: LQ133Z1, , 3200x1800, 13.3" | Apple MacBook Pro 13 2017 APPA033, , 2560x1600, 13.3" | Razer Blade Stealth QHD i7-7500U Sharp SHP1493 (LQ133Z1JW26), , 3200x1800, 13.3" | Huawei MateBook X Chi Mei CMN8201 / P130ZDZ-EF1, , 2160x1440, 13.3" | HP Envy 13-ad065nr LG Philips LGD0576, , 1920x1080, 13.3" | |
|---|---|---|---|---|---|---|
| Display | 22% | 61% | 26% | 26% | 17% | |
| Display P3 Coverage (%) | 51.6 | 63.6 23% | 99.2 92% | 65.6 27% | 65.8 28% | 65.5 27% |
| sRGB Coverage (%) | 77.4 | 93 20% | 99.9 29% | 95.5 23% | 96.2 24% | 83.8 8% |
| AdobeRGB 1998 Coverage (%) | 53.3 | 65.4 23% | 87.1 63% | 67.6 27% | 66.8 25% | 61.3 15% |
| Response Times | 12% | 0% | -8% | 20% | 29% | |
| Response Time Grey 50% / Grey 80% * (ms) | 41.2 ? | 35.6 ? 14% | 42.8 ? -4% | 46 ? -12% | 33 ? 20% | 28 ? 32% |
| Response Time Black / White * (ms) | 30 ? | 27.2 ? 9% | 28.8 ? 4% | 31.2 ? -4% | 24 ? 20% | 22.4 ? 25% |
| PWM Frequency (Hz) | 19530 ? | 19690 ? | 19380 ? | 10200 ? | ||
| Screen | -5% | 20% | 3% | 7% | -11% | |
| Brightness middle (cd/m²) | 461 | 386.1 -16% | 588 28% | 406 -12% | 408 -11% | 290 -37% |
| Brightness (cd/m²) | 418 | 357 -15% | 561 34% | 373 -11% | 395 -6% | 270 -35% |
| Brightness Distribution (%) | 85 | 83 -2% | 92 8% | 84 -1% | 88 4% | 78 -8% |
| Black Level * (cd/m²) | 0.2 | 0.33 -65% | 0.45 -125% | 0.25 -25% | 0.45 -125% | 0.32 -60% |
| Contrast (:1) | 2305 | 1170 -49% | 1307 -43% | 1624 -30% | 907 -61% | 906 -61% |
| Colorchecker dE 2000 * | 5.4 | 4.2 22% | 1.7 69% | 4.5 17% | 1.55 71% | 4.8 11% |
| Colorchecker dE 2000 max. * | 12.2 | 7.6 38% | 3.5 71% | 8.2 33% | 2.19 82% | 11.2 8% |
| Greyscale dE 2000 * | 5.4 | 5.7 -6% | 1.9 65% | 5.2 4% | 1.91 65% | 2.8 48% |
| Gamma | 2.15 102% | 2.28 96% | 2.33 94% | 2.11 104% | 2.34 94% | 2.19 100% |
| CCT | 7258 90% | 7336 89% | 6738 96% | 7709 84% | 6491 100% | 6382 102% |
| Color Space (Percent of AdobeRGB 1998) (%) | 48.6 | 59 21% | 77.92 60% | 61.3 26% | 61 26% | 54.9 13% |
| Color Space (Percent of sRGB) (%) | 76.9 | 92.2 20% | 99.94 30% | 95.4 24% | 96 25% | 83.5 9% |
| Totaal Gemiddelde (Programma / Instellingen) | 10% /
2% | 27% /
25% | 7% /
6% | 18% /
12% | 12% /
-0% |
* ... kleiner is beter
Responstijd Scherm
| ↔ Responstijd Zwart naar Wit | ||
|---|---|---|
| 30 ms ... stijging ↗ en daling ↘ gecombineerd | ↗ 17.6 ms stijging | 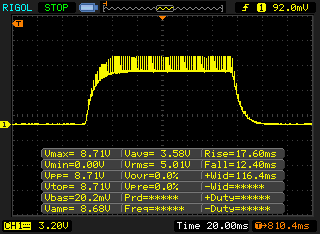 |
| ↘ 12.4 ms daling | ||
| Het scherm vertoonde trage responstijden in onze tests en is misschien te traag voor games. Ter vergelijking: alle testtoestellen variëren van 0.1 (minimum) tot 240 (maximum) ms. » 80 % van alle toestellen zijn beter. Dit betekent dat de gemeten responstijd slechter is dan het gemiddelde (19.8 ms) van alle geteste toestellen. | ||
| ↔ Responstijd 50% Grijs naar 80% Grijs | ||
| 41.2 ms ... stijging ↗ en daling ↘ gecombineerd | ↗ 22.8 ms stijging | 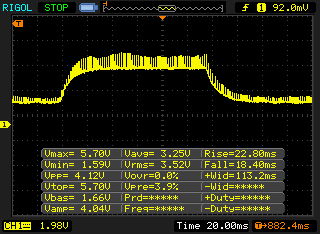 |
| ↘ 18.4 ms daling | ||
| Het scherm vertoonde trage responstijden in onze tests en is misschien te traag voor games. Ter vergelijking: alle testtoestellen variëren van 0.165 (minimum) tot 636 (maximum) ms. » 66 % van alle toestellen zijn beter. Dit betekent dat de gemeten responstijd slechter is dan het gemiddelde (31 ms) van alle geteste toestellen. | ||

| PCMark 8 Home Score Accelerated v2 | 3902 punten | |
| PCMark 8 Creative Score Accelerated v2 | 5083 punten | |
| PCMark 8 Work Score Accelerated v2 | 4890 punten | |
Help | ||
| Dell XPS 13 9360 FHD i7 Iris Toshiba XG4 NVMe (THNSN5512GPUK) | Dell XPS 13 i7-8550U Toshiba XG5 KXG50ZNV256G | Huawei MateBook X LITEON CB1-SD256 | Lenovo Yoga 920-13IKB-80Y7 Samsung PM961 MZVLW256HEHP | |
|---|---|---|---|---|
| CrystalDiskMark 5.2 / 6 | -28% | -35% | 28% | |
| Write 4K (MB/s) | 131.9 | 121.5 -8% | 68.1 -48% | 142.1 8% |
| Read 4K (MB/s) | 46.72 | 24.92 -47% | 28.95 -38% | 44.19 -5% |
| Write Seq (MB/s) | 1036 | 345 -67% | 529 -49% | 1112 7% |
| Read Seq (MB/s) | 1352 | 1313 -3% | 711 -47% | 1884 39% |
| Write 4K Q32T1 (MB/s) | 487.7 | 346.1 -29% | 306.4 -37% | 747 53% |
| Read 4K Q32T1 (MB/s) | 443.9 | 389.4 -12% | 501 13% | 446.8 1% |
| Write Seq Q32T1 (MB/s) | 1048 | 334.7 -68% | 496.9 -53% | 1255 20% |
| Read Seq Q32T1 (MB/s) | 1699 | 1840 8% | 1297 -24% | 3400 100% |

| 3DMark 11 Performance | 2275 punten | |
| 3DMark Cloud Gate Standard Score | 7685 punten | |
| 3DMark Fire Strike Score | 1265 punten | |
| 3DMark Fire Strike Extreme Score | 577 punten | |
| 3DMark Time Spy Score | 467 punten | |
Help | ||
| Tomb Raider | |
| 1920x1080 Ultra Preset AA:FX AF:16x | |
| Apple MacBook Pro 13 2017 | |
| Dell XPS 13 9360 FHD i7 Iris | |
| Dell XPS 13 9360 FHD i5 | |
| 1366x768 High Preset AA:FX AF:8x | |
| Apple MacBook Pro 13 2017 | |
| Dell XPS 13 9360 FHD i7 Iris | |
| Dell XPS 13 9360 FHD i5 | |
| 1366x768 Normal Preset AA:FX AF:4x | |
| Apple MacBook Pro 13 2017 | |
| Dell XPS 13 9360 FHD i7 Iris | |
| Dell XPS 13 9360 FHD i5 | |
| 1024x768 Low Preset | |
| Apple MacBook Pro 13 2017 | |
| Dell XPS 13 9360 FHD i7 Iris | |
| Dell XPS 13 9360 FHD i5 | |
| Overwatch | |
| 1920x1080 Epic (Render Scale 100 %) AA:SM AF:16x | |
| Apple MacBook Pro 13 2017 | |
| 1920x1080 High (Render Scale 100 %) AA:SM AF:4x | |
| Apple MacBook Pro 13 2017 | |
| Dell XPS 13 9360 FHD i7 Iris | |
| Dell XPS 13 9360 QHD+ i7 | |
| Dell XPS 13 i7-8550U | |
| Acer Spin 5 SP513-52N-566U | |
| 1366x768 Medium (Render Scale 100 %) AA:FX AF:2x | |
| Apple MacBook Pro 13 2017 | |
| Dell XPS 13 9360 FHD i7 Iris | |
| Dell XPS 13 9360 QHD+ i7 | |
| Dell XPS 13 i7-8550U | |
| Acer Spin 5 SP513-52N-566U | |
| HP Envy 13-ad065nr | |
| 1280x720 Low (Render Scale 100 %) AA:FX AF:1x | |
| Apple MacBook Pro 13 2017 | |
| Dell XPS 13 9360 FHD i7 Iris | |
| Dell XPS 13 9360 QHD+ i7 | |
| Dell XPS 13 i7-8550U | |
| Acer Spin 5 SP513-52N-566U | |
| HP Envy 13-ad065nr | |
| Rocket League | |
| 1920x1080 High Quality AA:High FX | |
| Apple MacBook Pro 13 2017 | |
| Dell XPS 13 9360 FHD i7 Iris | |
| 1920x1080 Quality AA:Medium FX | |
| Apple MacBook Pro 13 2017 | |
| Dell XPS 13 9360 FHD i7 Iris | |
| Acer Spin 5 SP513-52N-566U | |
| 1280x720 Performance | |
| Apple MacBook Pro 13 2017 | |
| Acer Spin 5 SP513-52N-566U | |
| Dell XPS 13 9360 FHD i7 Iris | |
| lage | gem. | hoge | ultra | |
|---|---|---|---|---|
| Tomb Raider (2013) | 103 | 54.1 | 37 | 17.2 |
| BioShock Infinite (2013) | 61 | 40.2 | 33.5 | 10.7 |
| Battlefield 4 (2013) | 43.1 | 29.7 | 23.2 | 8.2 |
| The Witcher 3 (2015) | 17.5 | |||
| Rainbow Six Siege (2015) | 50.5 | 29 | 16.4 | |
| Overwatch (2016) | 56.1 | 36.5 | 29.9 | |
| Rocket League (2017) | 69.3 | 35.8 | 25.3 | |
| F1 2017 (2017) | 33 | 15 |
Geluidsniveau
| Onbelast |
| 29.9 / 29.9 / 30.3 dB (A) |
| Belasting |
| 33.9 / 34.9 dB (A) |
 | ||
30 dB stil 40 dB(A) hoorbaar 50 dB(A) luid |
||
min: | ||
(-) De maximumtemperatuur aan de bovenzijde bedraagt 46.2 °C / 115 F, vergeleken met het gemiddelde van 35.9 °C / 97 F, variërend van 21.4 tot 59 °C voor de klasse Subnotebook.
(-) De bodem warmt op tot een maximum van 48.8 °C / 120 F, vergeleken met een gemiddelde van 39.2 °C / 103 F
(+) Bij onbelast gebruik bedraagt de gemiddelde temperatuur voor de bovenzijde 26.7 °C / 80 F, vergeleken met het apparaatgemiddelde van 30.8 °C / 87 F.
(+) De handpalmsteunen en het touchpad bereiken maximaal de huidtemperatuur (33.6 °C / 92.5 F) en zijn dus niet heet.
(-) De gemiddelde temperatuur van de handpalmsteun van soortgelijke toestellen bedroeg 28.2 °C / 82.8 F (-5.4 °C / -9.7 F).
| Uit / Standby | |
| Inactief | |
| Belasting |
|
Key:
min: | |
| Dell XPS 13 9360 FHD i7 Iris i7-7560U, Iris Plus Graphics 640, IPS, 1920x1080, 13.3" | Dell XPS 13 i7-8550U i5-8550U, UHD Graphics 620, IGZO IPS, 3200x1800, 13.3" | Dell XPS 13 9360 FHD i5 i5-7200U, HD Graphics 620, IPS, 1920x1080, 13.3" | Dell XPS 13 9360 QHD+ i7 i7-7500U, HD Graphics 620, IPS, 3200x1800, 13.3" | Huawei MateBook X i5-7200U, HD Graphics 620, , 2160x1440, 13.3" | HP Envy 13-ad065nr i5-7200U, HD Graphics 620, IPS, 1920x1080, 13.3" | Apple MacBook Pro 13 2017 i5-7360U, Iris Plus Graphics 640, IPS, 2560x1600, 13.3" | |
|---|---|---|---|---|---|---|---|
| Power Consumption | -10% | 17% | -17% | -47% | 8% | -14% | |
| Idle Minimum * (Watt) | 3.32 | 4.1 -23% | 4.1 -23% | 6.4 -93% | 4.6 -39% | 2.8 16% | 3.7 -11% |
| Idle Average * (Watt) | 5.27 | 5.8 -10% | 4.2 20% | 6.6 -25% | 11 -109% | 5.8 -10% | 5.2 1% |
| Idle Maximum * (Watt) | 6.32 | 6 5% | 5.1 19% | 6.8 -8% | 12 -90% | 6.4 -1% | 7.6 -20% |
| Load Average * (Watt) | 32 | 42.5 -33% | 22.1 31% | 27.5 14% | 39.5 -23% | 31.3 2% | 41.6 -30% |
| Load Maximum * (Watt) | 45.9 | 41.4 10% | 29.4 36% | 32.4 29% | 34.6 25% | 31.7 31% | 50.5 -10% |
* ... kleiner is beter
| Dell XPS 13 9360 FHD i7 Iris i7-7560U, Iris Plus Graphics 640, 60 Wh | Dell XPS 13 i7-8550U i5-8550U, UHD Graphics 620, 60 Wh | Razer Blade Stealth QHD i7-7500U i7-7500U, HD Graphics 620, 53.6 Wh | Huawei MateBook X i5-7200U, HD Graphics 620, 40 Wh | HP Envy 13-ad065nr i5-7200U, HD Graphics 620, 53.6 Wh | Dell XPS 13 9360 FHD i5 i5-7200U, HD Graphics 620, 60 Wh | Dell XPS 13 9360 QHD+ i7 i7-7500U, HD Graphics 620, 60 Wh | Apple MacBook Pro 13 2017 i5-7360U, Iris Plus Graphics 640, 54.5 Wh | |
|---|---|---|---|---|---|---|---|---|
| Batterijduur | -15% | -41% | -37% | -11% | -4% | -22% | -23% | |
| Reader / Idle (h) | 25.4 | 18.5 -27% | 8.5 -67% | 24.8 -2% | 21.6 -15% | 17.6 -31% | ||
| H.264 (h) | 15 | 11.4 -24% | ||||||
| WiFi v1.3 (h) | 10.9 | 9.8 -10% | 6.4 -41% | 5.6 -49% | 9.5 -13% | 11.3 4% | 8.6 -21% | 11.4 5% |
| Load (h) | 2.6 | 2.4 -8% | 2.7 4% | 2.1 -19% | 2.6 0% | 2.2 -15% | 1.3 -50% |
Pro
Contra
Dit is de verkorte versie van het originele artikel. Het volledige, Engelse testrapport vind je hier.
Potentiële kopers van de Dell XPS 13 staan voor een interessante keuze. De nieuwe Kaby Lake-R-processors bieden een stuk betere CPU-prestaties, terwijl de Iris-GPU in combinatie met de 'oude' Kaby Lake-CPU's hogere GPU-performance beloven. In theorie tenminste, aangezien de keuze na onze tests best eenvoudig bleek.
De nieuwe ULV quad-core is superieur aan de oude dual-cores als je de extra cores/threads kan gebruiken. De GPU-prestaties liggen ook wat hoger. Een andere, doorslaggevende factor is de slechte benutting van de i7-7560U in de XPS 13. Door de beperking van 15 Watt blijft er immers maar weinig over van de hogere prestaties. Onze aanbeveling is daarom eenvoudig: als je van plan bent om de XPS 13 te kopen, ga dan voor de nieuwe Kaby Lake-R-chips.
De Kaby Lake in combinatie met de krachtigere Iris-GPU houdt weinig steek voor de XPS 13 aangezien je zijn volle potentieel nauwelijks kan benutten. De nieuwe 8th-Gen-processoren (Kaby Lake-refresh) zijn superieur op het vlak van CPU-prestaties, terwijl de GPU nauwelijks moet onderdoen.
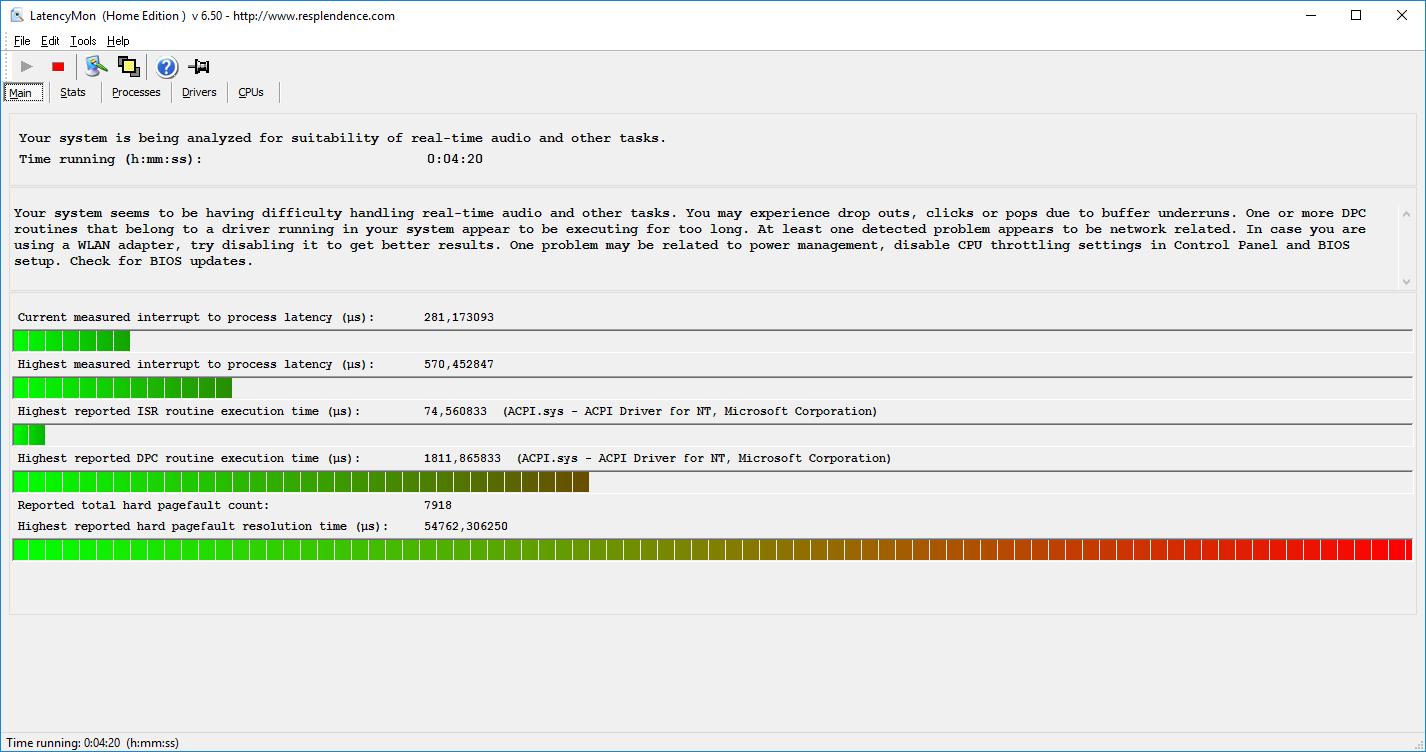
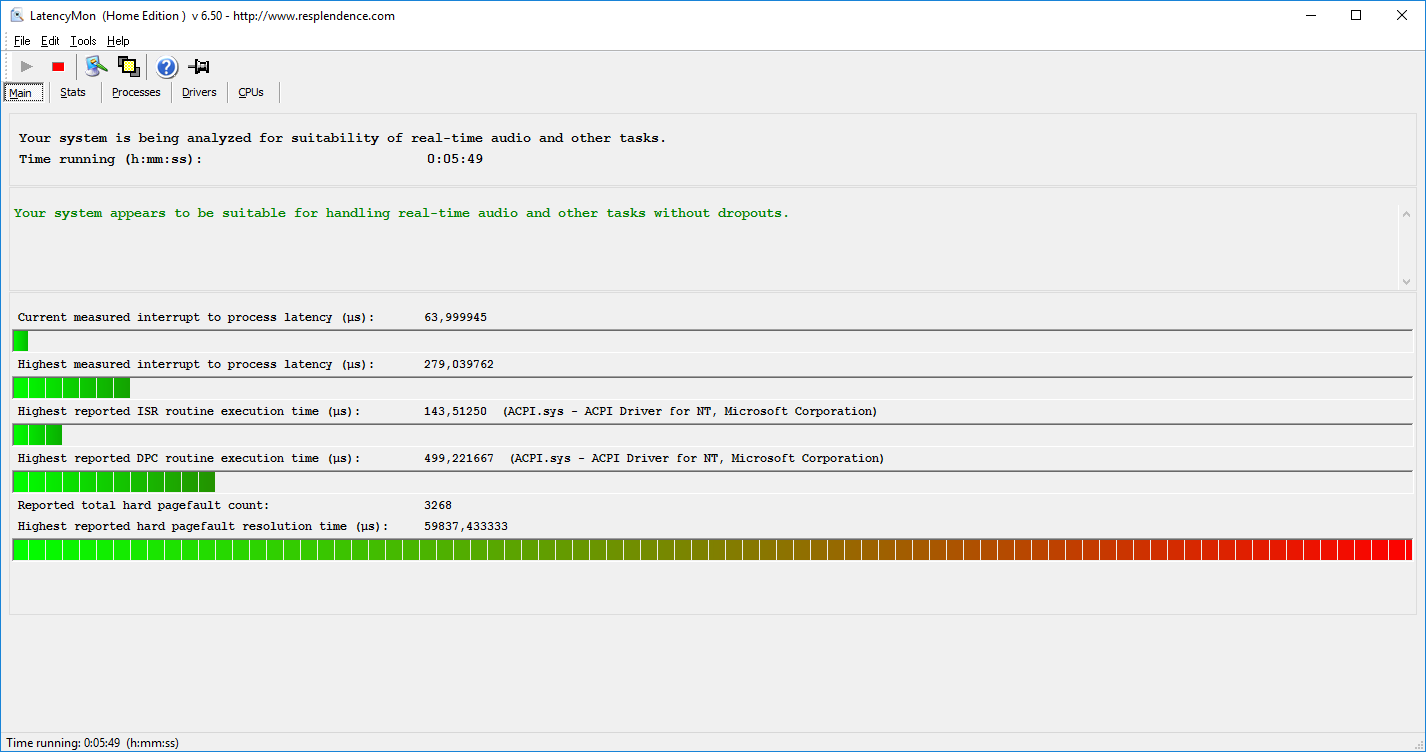
Voor de rest valt er nog weinig te zeggen over de XPS. Helaas heeft Dell de problemen met 'coil whine' nog niet opgelost, wat helaas duidelijk te merken is bij ons specifieke toestel.
Dell XPS 13 9360 FHD i7 Iris
- 06-11-2017 v6 (old)
Andreas Osthoff
Price comparison
