Kort testrapport Lenovo Yoga 920-13IKB (i7-8550U, FHD) Convertible
| SD Card Reader | |
| maximum SDCardreader Maximum Transfer Rate | |
| average SDCardreader Average Transfer Rate |
| Networking | |
| iperf3 transmit AX12 | |
| Asus ZenBook Flip S UX370 | |
| Lenovo Yoga 920-13IKB-80Y7 | |
| Dell Latitude 5289 | |
| Dell XPS 13-9365 2-in-1 | |
| iperf3 receive AX12 | |
| Lenovo Yoga 920-13IKB-80Y7 | |
| Dell Latitude 5289 | |
| Asus ZenBook Flip S UX370 | |
| Dell XPS 13-9365 2-in-1 | |
| |||||||||||||||||||||||||
Helderheidsverdeling: 81 %
Helderheid in Batterij-modus: 297.9 cd/m²
Contrast: 677:1 (Zwart: 0.44 cd/m²)
ΔE ColorChecker Calman: 5.1 | ∀{0.5-29.43 Ø4.71}
ΔE Greyscale Calman: 6.7 | ∀{0.09-98 Ø4.96}
91.7% sRGB (Argyll 1.6.3 3D)
64.1% AdobeRGB 1998 (Argyll 1.6.3 3D)
64.1% AdobeRGB 1998 (Argyll 3D)
91.7% sRGB (Argyll 3D)
62.5% Display P3 (Argyll 3D)
Gamma: 2.9
CCT: 6839 K
| Lenovo Yoga 920-13IKB-80Y7 AU Optronics B139HAN03.0, IPS, 13.9", 1920x1080 | Dell XPS 13-9365 2-in-1 IPS, 13.3", 1920x1080 | HP Spectre x360 13-w023dx Chi Mei CMN1367, IPS, 13.3", 1920x1080 | Asus ZenBook Flip S UX370 AUO B133HAN04.2, a-Si TFT-LCD, WLED, 13.3", 1920x1080 | Dell Latitude 5289 BOE NV12N51, IPS LED, 12.5", 1920x1080 | HP Spectre x360 13-ac033dx LG Philips LGD054D, IPS, 13.3", 3840x2160 | |
|---|---|---|---|---|---|---|
| Display | -23% | 2% | 0% | -31% | 9% | |
| Display P3 Coverage (%) | 62.5 | 47.32 -24% | 65.4 5% | 64 2% | 42.79 -32% | 69.4 11% |
| sRGB Coverage (%) | 91.7 | 71.1 -22% | 90.4 -1% | 90 -2% | 64.3 -30% | 96.8 6% |
| AdobeRGB 1998 Coverage (%) | 64.1 | 48.83 -24% | 65.8 3% | 64.9 1% | 44.21 -31% | 71.1 11% |
| Response Times | -4% | 20% | 6% | 6% | 4% | |
| Response Time Grey 50% / Grey 80% * (ms) | 46 ? | 48 ? -4% | 33.2 ? 28% | 44 ? 4% | 42 ? 9% | 42 ? 9% |
| Response Time Black / White * (ms) | 31.6 ? | 32.8 ? -4% | 28 ? 11% | 29 ? 8% | 31 ? 2% | 32 ? -1% |
| PWM Frequency (Hz) | 1042 ? | 531 ? | ||||
| Screen | 11% | 5% | 26% | 18% | 30% | |
| Brightness middle (cd/m²) | 297.9 | 322.6 8% | 334.6 12% | 334 12% | 336 13% | 302.6 2% |
| Brightness (cd/m²) | 278 | 306 10% | 319 15% | 321 15% | 320 15% | 282 1% |
| Brightness Distribution (%) | 81 | 91 12% | 90 11% | 86 6% | 90 11% | 83 2% |
| Black Level * (cd/m²) | 0.44 | 0.19 57% | 0.336 24% | 0.25 43% | 0.34 23% | 0.25 43% |
| Contrast (:1) | 677 | 1698 151% | 996 47% | 1336 97% | 988 46% | 1210 79% |
| Colorchecker dE 2000 * | 5.1 | 7.7 -51% | 6.21 -22% | 4.24 17% | 3.45 32% | 2.4 53% |
| Colorchecker dE 2000 max. * | 11 | 11.1 -1% | 12 -9% | 6.03 45% | 7.95 28% | 4.9 55% |
| Greyscale dE 2000 * | 6.7 | 7.9 -18% | 7.71 -15% | 3.92 41% | 1.68 75% | 2.8 58% |
| Gamma | 2.9 76% | 2.88 76% | 2.36 93% | 2.68 82% | 2.49 88% | 2.2 100% |
| CCT | 6839 95% | 7044 92% | 6458 101% | 6758 96% | 6782 96% | 6333 103% |
| Color Space (Percent of AdobeRGB 1998) (%) | 64.1 | 44.1 -31% | 58.6 -9% | 58 -10% | 41 -36% | 65.5 2% |
| Color Space (Percent of sRGB) (%) | 91.7 | 69.9 -24% | 90 -2% | 90 -2% | 64 -30% | 97.1 6% |
| Totaal Gemiddelde (Programma / Instellingen) | -5% /
2% | 9% /
7% | 11% /
18% | -2% /
6% | 14% /
22% |
* ... kleiner is beter
Responstijd Scherm
| ↔ Responstijd Zwart naar Wit | ||
|---|---|---|
| 31.6 ms ... stijging ↗ en daling ↘ gecombineerd | ↗ 18.4 ms stijging | 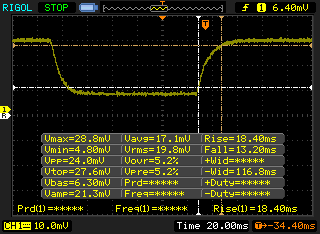 |
| ↘ 13.2 ms daling | ||
| Het scherm vertoonde trage responstijden in onze tests en is misschien te traag voor games. Ter vergelijking: alle testtoestellen variëren van 0.1 (minimum) tot 240 (maximum) ms. » 85 % van alle toestellen zijn beter. Dit betekent dat de gemeten responstijd slechter is dan het gemiddelde (19.8 ms) van alle geteste toestellen. | ||
| ↔ Responstijd 50% Grijs naar 80% Grijs | ||
| 46 ms ... stijging ↗ en daling ↘ gecombineerd | ↗ 20.8 ms stijging | 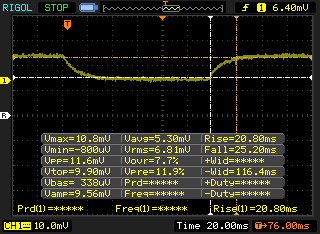 |
| ↘ 25.2 ms daling | ||
| Het scherm vertoonde trage responstijden in onze tests en is misschien te traag voor games. Ter vergelijking: alle testtoestellen variëren van 0.165 (minimum) tot 636 (maximum) ms. » 79 % van alle toestellen zijn beter. Dit betekent dat de gemeten responstijd slechter is dan het gemiddelde (31 ms) van alle geteste toestellen. | ||
Screen Flickering / PWM (Pulse-Width Modulation)
| Screen flickering / PWM niet waargenomen | 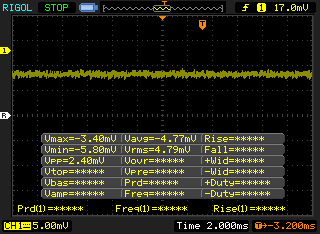 | ||
Ter vergelijking: 52 % van alle geteste toestellen maakten geen gebruik van PWM om de schermhelderheid te verlagen. Als het wel werd gebruikt, werd een gemiddelde van 7754 (minimum: 5 - maximum: 343500) Hz waargenomen. | |||
| Cinebench R10 | |
| Rendering Multiple CPUs 32Bit | |
| Dell XPS 13 i7-8550U | |
| Lenovo Yoga 920-13IKB-80Y7 | |
| HP Spectre x360 13-w023dx | |
| Asus ZenBook Flip S UX370 | |
| Dell XPS 13-9365 2-in-1 | |
| Rendering Single 32Bit | |
| Lenovo Yoga 920-13IKB-80Y7 | |
| HP Spectre x360 13-w023dx | |
| Dell XPS 13 i7-8550U | |
| Dell XPS 13-9365 2-in-1 | |
| Asus ZenBook Flip S UX370 | |
| wPrime 2.10 - 1024m | |
| Dell XPS 13-9365 2-in-1 | |
| HP Spectre x360 13-w023dx | |
| Lenovo Yoga 920-13IKB-80Y7 | |
* ... kleiner is beter
| PCMark 8 Home Score Accelerated v2 | 3999 punten | |
| PCMark 8 Creative Score Accelerated v2 | 5342 punten | |
| PCMark 8 Work Score Accelerated v2 | 5154 punten | |
| PCMark 10 Score | 4012 punten | |
Help | ||
| Lenovo Yoga 920-13IKB-80Y7 Samsung PM961 MZVLW256HEHP | Dell XPS 13-9365 2-in-1 Toshiba NVMe THNSN5256GPUK | HP Spectre x360 13-w023dx Samsung PM951 NVMe MZVLV512 | Asus ZenBook Flip S UX370 SanDisk SD8SN8U256G1002 | Dell Latitude 5289 SanDisk X400 256GB, SATA (SD8SB8U-256G) | HP Spectre x360 13-ac033dx Samsung PM961 NVMe MZVLW512HMJP | |
|---|---|---|---|---|---|---|
| CrystalDiskMark 3.0 | -35% | -25% | -59% | -67% | 1% | |
| Write 4k QD32 (MB/s) | 573 | 250.2 -56% | 361.2 -37% | 170.8 -70% | 158.8 -72% | 225.6 -61% |
| Read 4k QD32 (MB/s) | 432.9 | 411 -5% | 535 24% | 385.4 -11% | 306.2 -29% | 518 20% |
| Write 4k (MB/s) | 142.4 | 121.2 -15% | 137.9 -3% | 57 -60% | 27.92 -80% | 139.4 -2% |
| Read 4k (MB/s) | 56.2 | 32.93 -41% | 42.66 -24% | 29.7 -47% | 22.73 -60% | 54.7 -3% |
| Write 512 (MB/s) | 832 | 410.7 -51% | 571 -31% | 291.5 -65% | 255.6 -69% | 1229 48% |
| Read 512 (MB/s) | 1252 | 966 -23% | 679 -46% | 315.7 -75% | 260.8 -79% | 865 -31% |
| Write Seq (MB/s) | 1125 | 629 -44% | 571 -49% | 432.5 -62% | 406.4 -64% | 1550 38% |
| Read Seq (MB/s) | 2070 | 1206 -42% | 1376 -34% | 455.9 -78% | 423.7 -80% | 2065 0% |

| 3DMark 11 Performance | 1915 punten | |
| 3DMark Ice Storm Standard Score | 74895 punten | |
| 3DMark Cloud Gate Standard Score | 8519 punten | |
| 3DMark Fire Strike Score | 1052 punten | |
| 3DMark Fire Strike Extreme Score | 489 punten | |
Help | ||
| BioShock Infinite | |
| 1920x1080 Ultra Preset, DX11 (DDOF) (sorteer op waarde) | |
| Lenovo Yoga 920-13IKB-80Y7 | |
| Asus ZenBook Flip S UX370 | |
| Dell XPS 13 i7-8550U | |
| HP Envy 13-ad006ng | |
| Dell XPS 13 9360 FHD i7 Iris | |
| 1366x768 High Preset (sorteer op waarde) | |
| Lenovo Yoga 920-13IKB-80Y7 | |
| Asus ZenBook Flip S UX370 | |
| Dell XPS 13 i7-8550U | |
| HP Envy 13-ad006ng | |
| Dell XPS 13 9360 FHD i7 Iris | |
| Rise of the Tomb Raider | |
| 1920x1080 High Preset AA:FX AF:4x (sorteer op waarde) | |
| Lenovo Yoga 920-13IKB-80Y7 | |
| Asus ZenBook Flip S UX370 | |
| Dell XPS 13 i7-8550U | |
| HP Envy 13-ad006ng | |
| 1366x768 Medium Preset AF:2x (sorteer op waarde) | |
| Lenovo Yoga 920-13IKB-80Y7 | |
| Asus ZenBook Flip S UX370 | |
| Dell XPS 13 i7-8550U | |
| HP Envy 13-ad006ng | |
| lage | gem. | hoge | ultra | |
|---|---|---|---|---|
| BioShock Infinite (2013) | 67.1 | 36.2 | 30.5 | 10.1 |
| Rise of the Tomb Raider (2016) | 22.9 | 12.7 | 6.8 |
Geluidsniveau
| Onbelast |
| 28 / 28.8 / 30.3 dB (A) |
| Belasting |
| 34.5 / 34.3 dB (A) |
 | ||
30 dB stil 40 dB(A) hoorbaar 50 dB(A) luid |
||
min: | ||
| Lenovo Yoga 920-13IKB-80Y7 UHD Graphics 620, i5-8550U, Samsung PM961 MZVLW256HEHP | HP Spectre x360 13-w023dx HD Graphics 620, i7-7500U, Samsung PM951 NVMe MZVLV512 | Asus ZenBook Flip S UX370 HD Graphics 620, i5-7200U, SanDisk SD8SN8U256G1002 | Dell Latitude 5289 HD Graphics 620, i5-7300U, SanDisk X400 256GB, SATA (SD8SB8U-256G) | HP Spectre x360 13-ac033dx HD Graphics 620, i7-7500U, Samsung PM961 NVMe MZVLW512HMJP | Lenovo Yoga 910-13IKB-80VF004CGE HD Graphics 620, i7-7500U, Samsung PM951 NVMe MZVLV512 | |
|---|---|---|---|---|---|---|
| Noise | -6% | -3% | -5% | -10% | -9% | |
| uit / omgeving * (dB) | 28 | 29.1 -4% | 30.5 -9% | 30.5 -9% | 28.7 -2% | 31.7 -13% |
| Idle Minimum * (dB) | 28 | 29.1 -4% | 30.5 -9% | 30.5 -9% | 28.7 -2% | 31.7 -13% |
| Idle Average * (dB) | 28.8 | 29.1 -1% | 30.5 -6% | 30.5 -6% | 34.2 -19% | 31.7 -10% |
| Idle Maximum * (dB) | 30.3 | 31.2 -3% | 30.5 -1% | 30.5 -1% | 35.8 -18% | 31.7 -5% |
| Load Average * (dB) | 34.5 | 37.3 -8% | 34.2 1% | 36 -4% | 35.8 -4% | 38.4 -11% |
| Load Maximum * (dB) | 34.3 | 39.6 -15% | 32.5 5% | 34.6 -1% | 39.6 -15% | 34.7 -1% |
* ... kleiner is beter
(±) De maximumtemperatuur aan de bovenzijde bedraagt 44.4 °C / 112 F, vergeleken met het gemiddelde van 35.4 °C / 96 F, variërend van 19.6 tot 60 °C voor de klasse Convertible.
(±) De bodem warmt op tot een maximum van 42.8 °C / 109 F, vergeleken met een gemiddelde van 36.9 °C / 98 F
(+) Bij onbelast gebruik bedraagt de gemiddelde temperatuur voor de bovenzijde 20.8 °C / 69 F, vergeleken met het apparaatgemiddelde van 30.3 °C / 87 F.
(+) De palmsteunen en het touchpad zijn met een maximum van ###max## °C / 89.2 F koeler dan de huidtemperatuur en voelen daarom koel aan.
(-) De gemiddelde temperatuur van de handpalmsteun van soortgelijke toestellen bedroeg 28 °C / 82.4 F (-3.8 °C / -6.8 F).
Lenovo Yoga 920-13IKB-80Y7 audioanalyse
(-) | niet erg luide luidsprekers (65.7 dB)
Bas 100 - 315 Hz
(±) | verminderde zeebaars - gemiddeld 14.7% lager dan de mediaan
(-) | de lage tonen zijn niet lineair (15.7% delta naar de vorige frequentie)
Midden 400 - 2000 Hz
(+) | evenwichtige middens - slechts 2.3% verwijderd van de mediaan
(+) | de middentonen zijn lineair (5.5% delta ten opzichte van de vorige frequentie)
Hoog 2 - 16 kHz
(+) | evenwichtige hoogtepunten - slechts 2.9% verwijderd van de mediaan
(+) | de hoge tonen zijn lineair (6.8% delta naar de vorige frequentie)
Algemeen 100 - 16.000 Hz
(±) | lineariteit van het totale geluid is gemiddeld (18.5% verschil met de mediaan)
Vergeleken met dezelfde klasse
» 41% van alle geteste apparaten in deze klasse waren beter, 8% vergelijkbaar, 51% slechter
» De beste had een delta van 6%, het gemiddelde was 20%, de slechtste was 57%
Vergeleken met alle geteste toestellen
» 42% van alle geteste apparaten waren beter, 8% gelijk, 51% slechter
» De beste had een delta van 4%, het gemiddelde was 23%, de slechtste was 134%
Apple MacBook 12 (Early 2016) 1.1 GHz audioanalyse
(+) | luidsprekers kunnen relatief luid spelen (83.6 dB)
Bas 100 - 315 Hz
(±) | verminderde zeebaars - gemiddeld 11.3% lager dan de mediaan
(±) | lineariteit van de lage tonen is gemiddeld (14.2% delta ten opzichte van de vorige frequentie)
Midden 400 - 2000 Hz
(+) | evenwichtige middens - slechts 2.4% verwijderd van de mediaan
(+) | de middentonen zijn lineair (5.5% delta ten opzichte van de vorige frequentie)
Hoog 2 - 16 kHz
(+) | evenwichtige hoogtepunten - slechts 2% verwijderd van de mediaan
(+) | de hoge tonen zijn lineair (4.5% delta naar de vorige frequentie)
Algemeen 100 - 16.000 Hz
(+) | het totale geluid is lineair (10.2% verschil met de mediaan)
Vergeleken met dezelfde klasse
» 7% van alle geteste apparaten in deze klasse waren beter, 2% vergelijkbaar, 90% slechter
» De beste had een delta van 5%, het gemiddelde was 18%, de slechtste was 53%
Vergeleken met alle geteste toestellen
» 5% van alle geteste apparaten waren beter, 1% gelijk, 94% slechter
» De beste had een delta van 4%, het gemiddelde was 23%, de slechtste was 134%
| Uit / Standby | |
| Inactief | |
| Belasting |
|
Key:
min: | |
| Lenovo Yoga 920-13IKB-80Y7 i5-8550U, UHD Graphics 620, Samsung PM961 MZVLW256HEHP, IPS, 1920x1080, 13.9" | HP Spectre x360 13-w023dx i7-7500U, HD Graphics 620, Samsung PM951 NVMe MZVLV512, IPS, 1920x1080, 13.3" | Asus ZenBook Flip S UX370 i5-7200U, HD Graphics 620, SanDisk SD8SN8U256G1002, a-Si TFT-LCD, WLED, 1920x1080, 13.3" | HP Spectre x360 13-ac033dx i7-7500U, HD Graphics 620, Samsung PM961 NVMe MZVLW512HMJP, IPS, 3840x2160, 13.3" | Lenovo Yoga 910-13IKB-80VF004CGE i7-7500U, HD Graphics 620, Samsung PM951 NVMe MZVLV512, IPS, 3840x2160, 13.9" | Dell XPS 13-9365 2-in-1 i7-7Y75, HD Graphics 615, Toshiba NVMe THNSN5256GPUK, IPS, 1920x1080, 13.3" | Dell XPS 13 i7-8550U i5-8550U, UHD Graphics 620, Toshiba XG5 KXG50ZNV256G, IGZO IPS, 3200x1800, 13.3" | |
|---|---|---|---|---|---|---|---|
| Power Consumption | -15% | 11% | -32% | -8% | 26% | -9% | |
| Idle Minimum * (Watt) | 3.1 | 5.5 -77% | 2.6 16% | 5.3 -71% | 4.3 -39% | 3.1 -0% | 4.1 -32% |
| Idle Average * (Watt) | 6.6 | 6.7 -2% | 5.3 20% | 9.6 -45% | 6.3 5% | 4.3 35% | 5.8 12% |
| Idle Maximum * (Watt) | 7 | 7.1 -1% | 8.5 -21% | 10.1 -44% | 9 -29% | 4.9 30% | 6 14% |
| Load Average * (Watt) | 35.2 | 33.1 6% | 29 18% | 34.4 2% | 32.7 7% | 24.3 31% | 42.5 -21% |
| Load Maximum * (Watt) | 34.6 | 35.2 -2% | 27 22% | 34.8 -1% | 28.8 17% | 22.8 34% | 41.4 -20% |
* ... kleiner is beter
| Lenovo Yoga 920-13IKB-80Y7 i5-8550U, UHD Graphics 620, 70 Wh | HP Spectre x360 13-w023dx i7-7500U, HD Graphics 620, 57.8 Wh | Asus ZenBook Flip S UX370 i5-7200U, HD Graphics 620, 39 Wh | Dell Latitude 5289 i5-7300U, HD Graphics 620, 60 Wh | HP Spectre x360 13-ac033dx i7-7500U, HD Graphics 620, 57.8 Wh | Lenovo Yoga 910-13IKB-80VF004CGE i7-7500U, HD Graphics 620, 78 Wh | Dell XPS 13-9365 2-in-1 i7-7Y75, HD Graphics 615, 46 Wh | |
|---|---|---|---|---|---|---|---|
| Batterijduur | -19% | -21% | 3% | -30% | -5% | -5% | |
| Reader / Idle (h) | 27.6 | 20.6 -25% | 15.6 -43% | 28.8 4% | 13.2 -52% | 17.8 -36% | 16.2 -41% |
| WiFi v1.3 (h) | 11.4 | 9.3 -18% | 8.1 -29% | 11.8 4% | 9 -21% | 10.7 -6% | 11.4 0% |
| Load (h) | 2.3 | 2 -13% | 2.5 9% | 2.3 0% | 1.9 -17% | 2.9 26% | 2.9 26% |
Pro
Contra
Dit is de verkorte versie van het originele artikel. Het volledige, Engelse testrapport vind je hier.
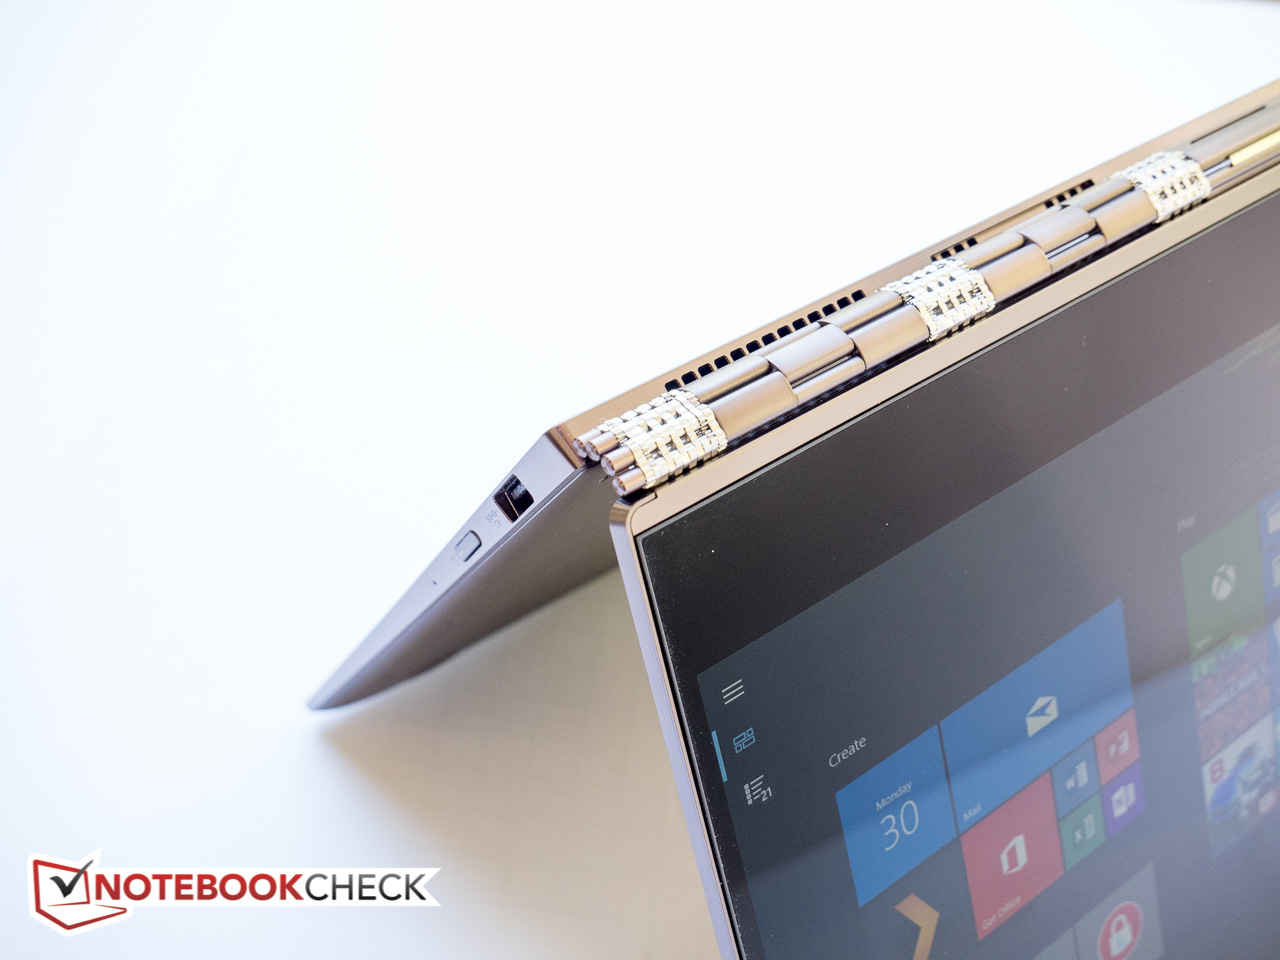
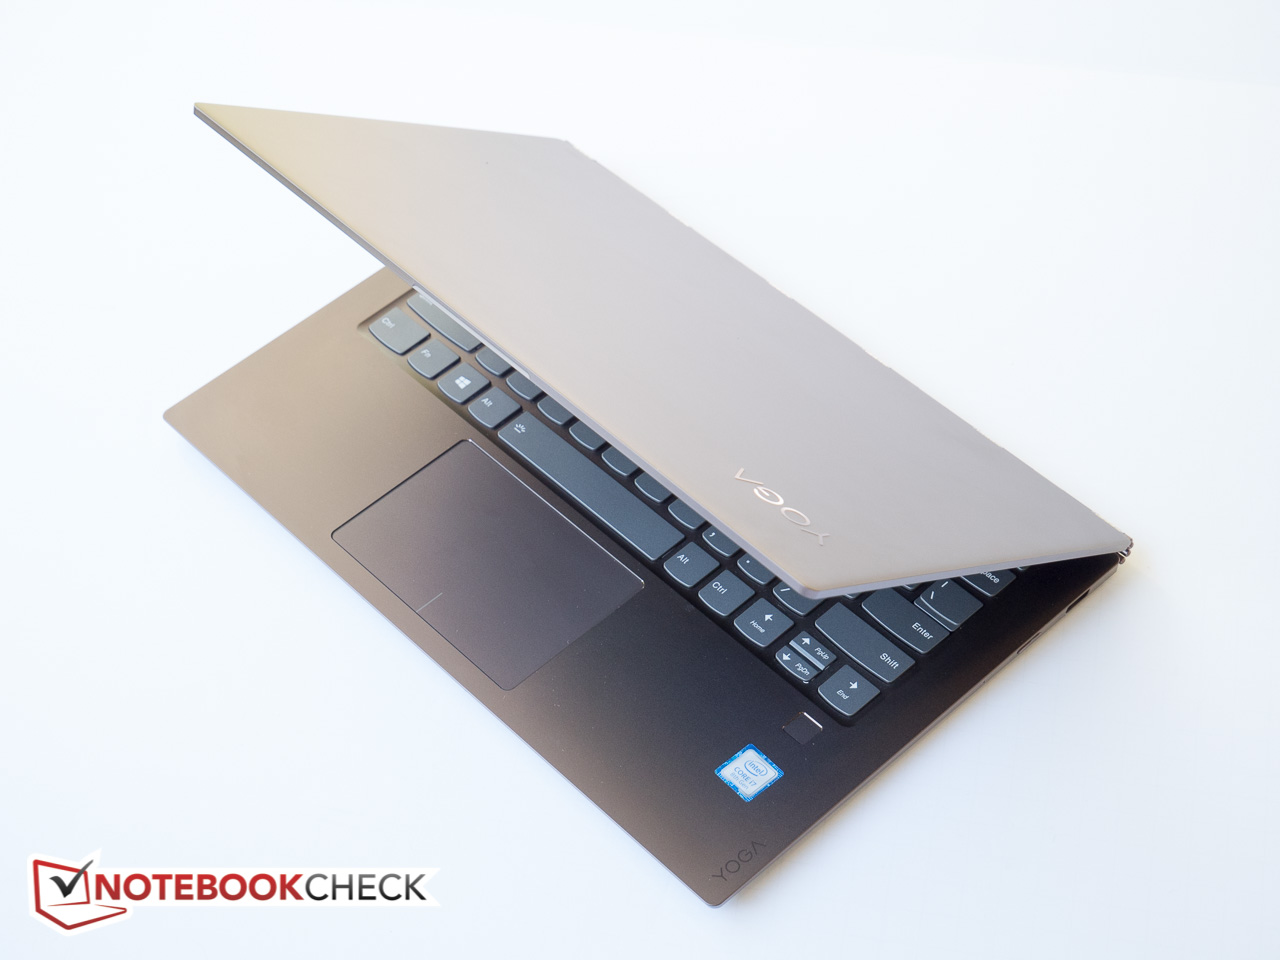
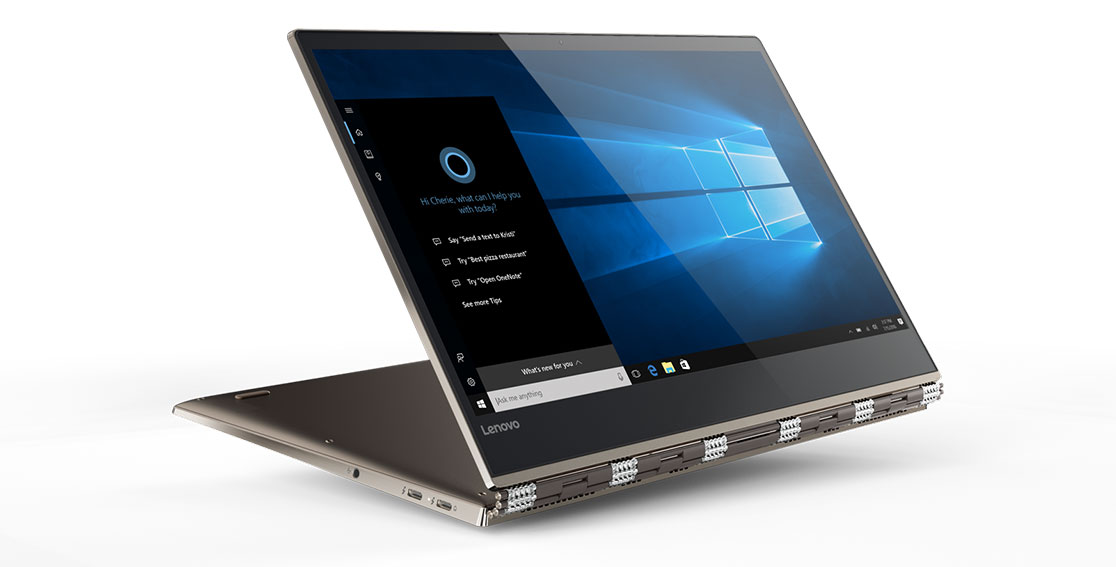
De nieuwe en herontworpen Yoga 920 is de beste 900-serie Yoga tot nu toe en is meer dan een simpele hardware update. Prestaties zijn zeker beter met de nieuwe quad-core CPU en razendsnelle NVMe SSD, maar Lenovo heeft ook verbeteringen op andere vlakken: de nieuwe convertible ondersteund nu 2x Thunderbolt 3 poorten, een verbeterde webcam locatie, een aangepast toetsenbord, voor het eerst ondersteuning voor een actieve stylus en gaat langer mee op de batterij. Lenovo heeft duidelijk de feedback van klanten ter harte genomen, wat verfrissend is om te zien.
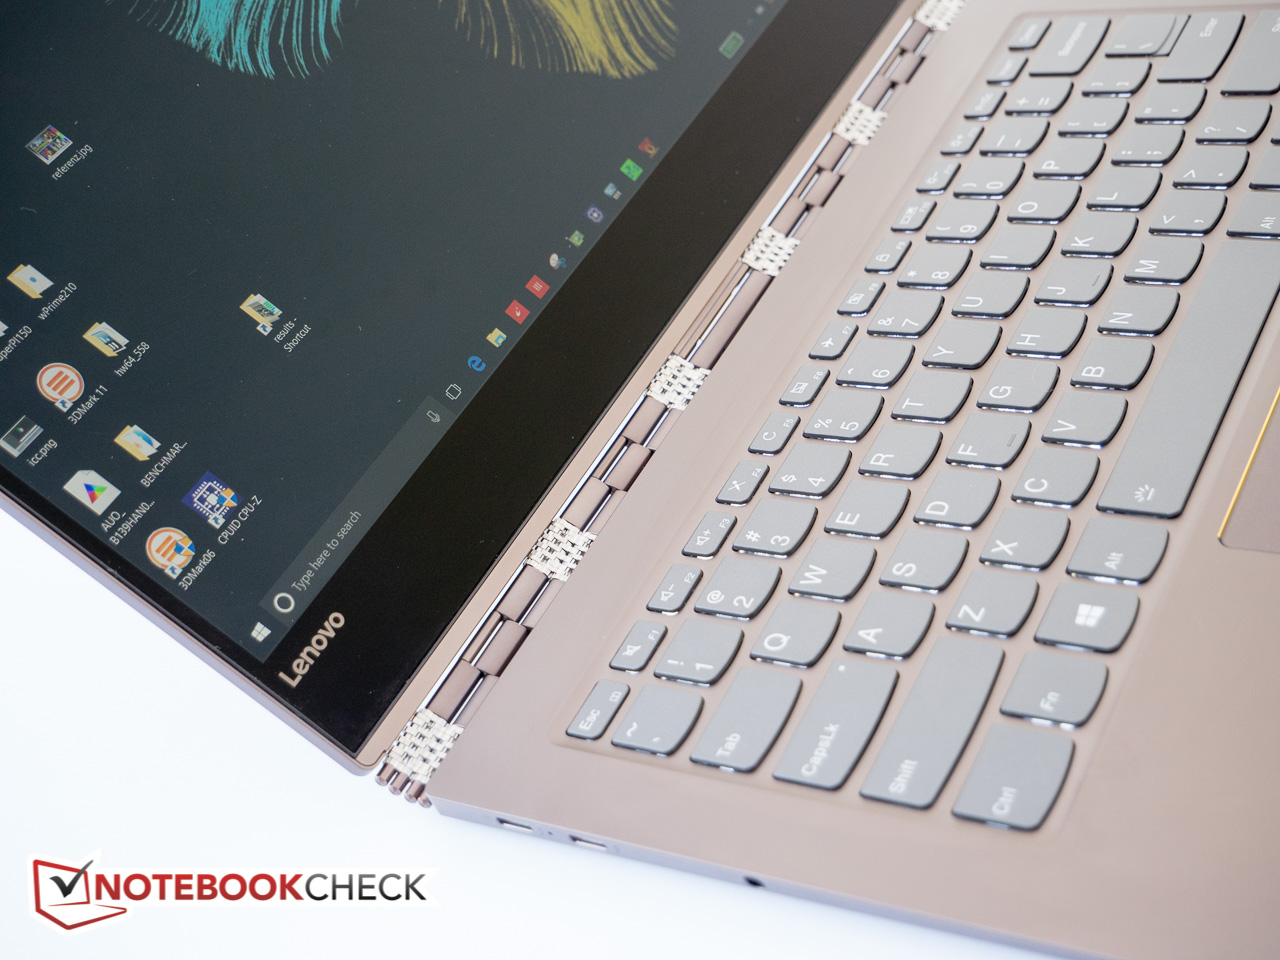
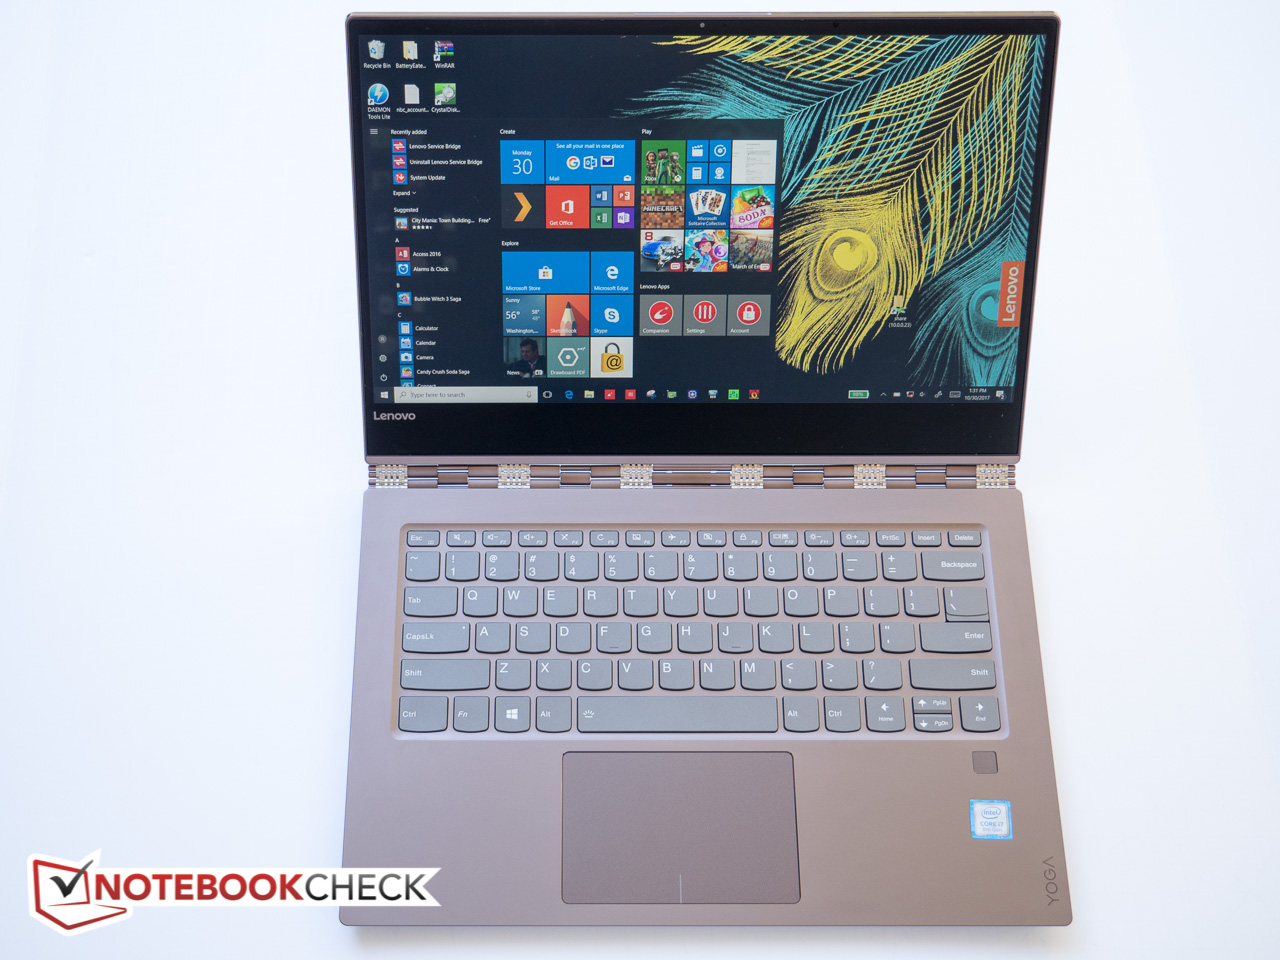
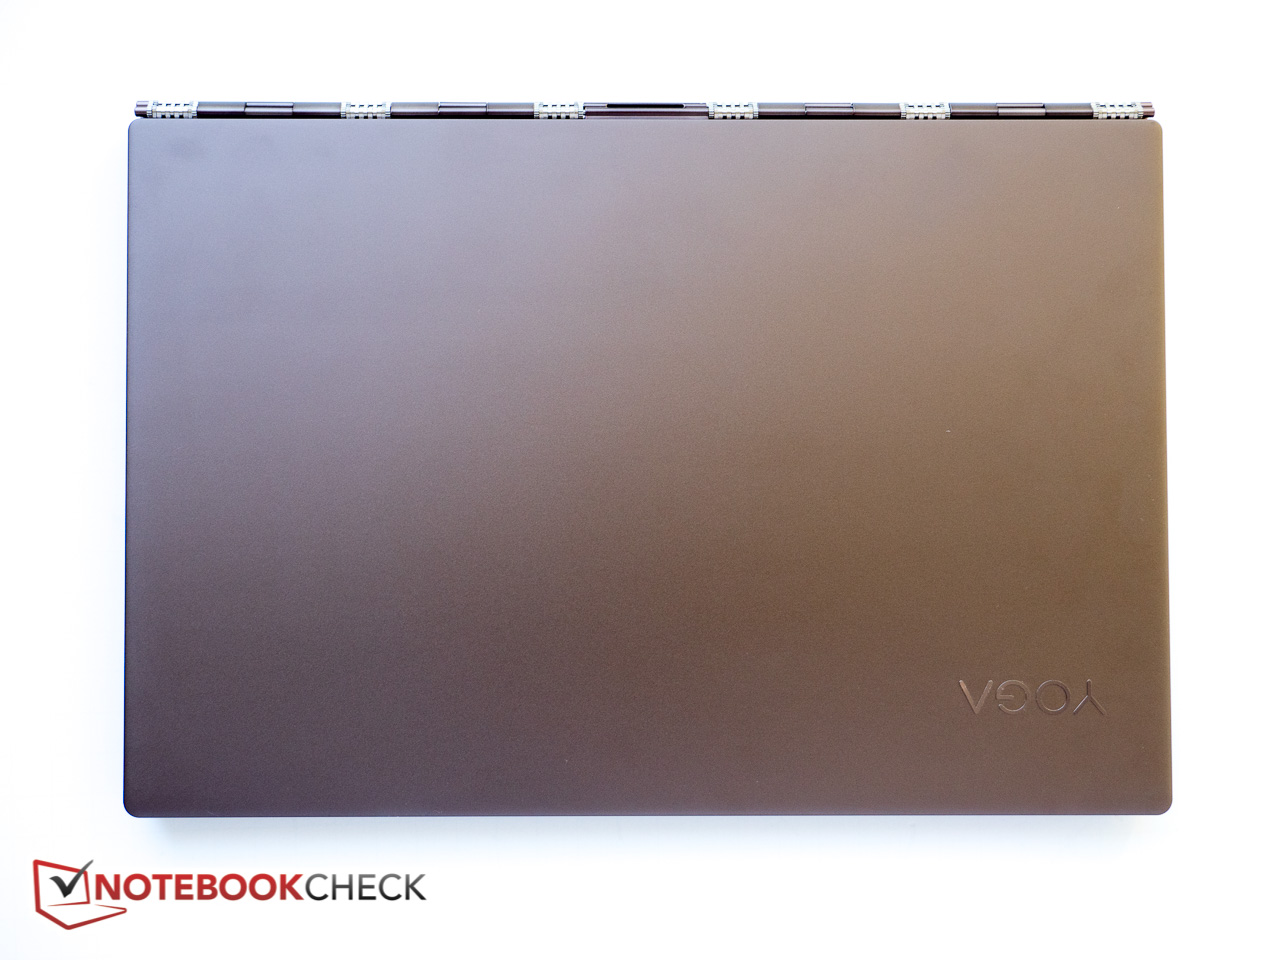
De aluminium behuizing is prachtig en ook behoorlijk stevig. Het polsband scharnier ontwerp trekt nog steeds aandacht. Het beeldscherm had iets helderder gekund en het contrastratio en grijswaarden hadden ook wat beter kunnen zijn. En dan is er nog het formaat: de Yoga is nog steeds een van de grotere convertibles op de markt, en niet erg handzaam in tablet modus. Toch zullen er gebruikers zijn die de extra schermoppervlakte zullen waarderen. Het ontbreken van een "Lift 'n Lock" feature zoals de ThinkPad Yoga heeft laat ook de toetsen kwetsbaar, zodat er extra opgelet moet worden om schade te voorkomen. Throttling bij zware belasting beperkt ook het grote prestatie potentieel van de extra CPU cores wat, maar over het algemeen zijn de prestaties beter dan de voorganger, en we zien dit dan ook niet als groot nadeel. Een extra voordeel: het hinderlijke fluitende geluid dat we in de voorganger Yoga 910 opmerkten is niet langer aanwezig.
De Yoga 920 is een erg goed ontworpen en aantrekkelijke 2-in-1. Gebruikers die kijken naar een 13.3-inch convertible zoals de HP Spectre x360 of Dell XPS 13 moeten ook zeker de iets grotere Yoga overwegen.
Lenovo Yoga 920-13IKB-80Y7
- 02-11-2017 v6 (old)
Bernhard Pechlaner
Price comparison
