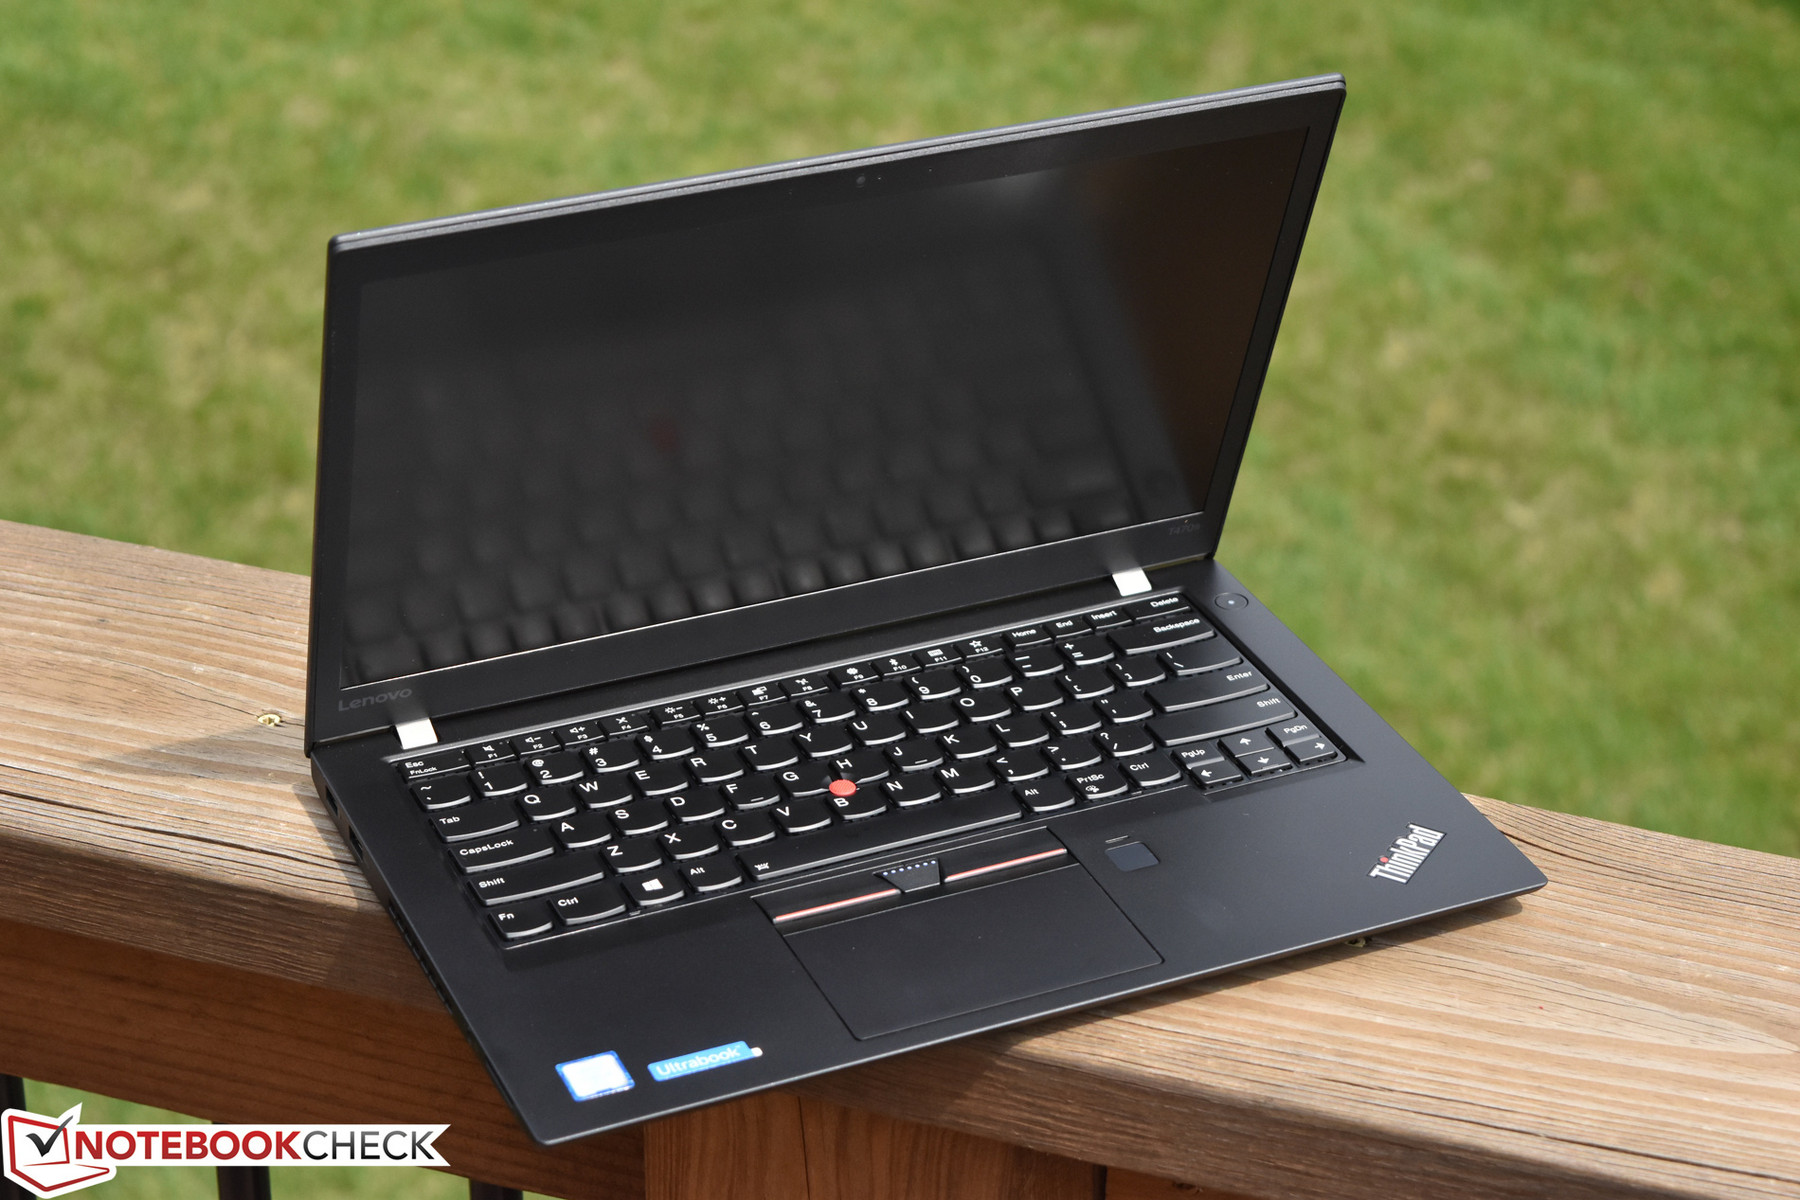
Kort testrapport Lenovo ThinkPad T470s (7300U, FHD) Laptop
| SD Card Reader | |
| average JPG Copy Test (av. of 3 runs) | |
| Lenovo ThinkPad T470s-20HGS00V00 | |
| Lenovo ThinkPad T470-20HD002HGE | |
| Dell Latitude 7480 | |
| Lenovo ThinkPad T470s-20HF0012US | |
| Lenovo ThinkPad X1 Carbon 2017-20HQS03P00 | |
| maximum AS SSD Seq Read Test (1GB) | |
| Dell Latitude 7480 | |
| Lenovo ThinkPad T470s-20HF0012US | |
| Lenovo ThinkPad T470s-20HGS00V00 | |
| Lenovo ThinkPad T470-20HD002HGE | |
| Lenovo ThinkPad X1 Carbon 2017-20HQS03P00 | |
| |||||||||||||||||||||||||
Helderheidsverdeling: 88 %
Helderheid in Batterij-modus: 271.6 cd/m²
Contrast: 1132:1 (Zwart: 0.24 cd/m²)
ΔE ColorChecker Calman: 6.1 | ∀{0.5-29.43 Ø4.71}
ΔE Greyscale Calman: 3.4 | ∀{0.09-98 Ø4.96}
60% sRGB (Argyll 1.6.3 3D)
38% AdobeRGB 1998 (Argyll 1.6.3 3D)
41.72% AdobeRGB 1998 (Argyll 3D)
60.3% sRGB (Argyll 3D)
40.35% Display P3 (Argyll 3D)
Gamma: 2.12
CCT: 6077 K
| Lenovo ThinkPad T470s-20HF0012US LEN40A9 (R140NWF5 R1), IPS, 14", 1920x1080 | Lenovo ThinkPad T470s-20HGS00V00 B140QAN01.5, IPS, 14", 2560x1440 | Dell Latitude 7480 LG Philips LGD0557, IPS, 14", 1920x1080 | Lenovo ThinkPad T470-20HD002HGE N140HCA-EAB, IPS, 14", 1920x1080 | Lenovo ThinkPad X1 Carbon 2017-20HQS03P00 B140HAN03_1, IPS, 14", 1920x1080 | |
|---|---|---|---|---|---|
| Display | 65% | 58% | 3% | 48% | |
| Display P3 Coverage (%) | 40.35 | 69 71% | 65.4 62% | 41.6 3% | 61.4 52% |
| sRGB Coverage (%) | 60.3 | 95.1 58% | 92.3 53% | 61.9 3% | 85.9 42% |
| AdobeRGB 1998 Coverage (%) | 41.72 | 69.6 67% | 65.8 58% | 43.06 3% | 62.4 50% |
| Response Times | -7% | -4% | -10% | -6% | |
| Response Time Grey 50% / Grey 80% * (ms) | 40.8 ? | 46.4 ? -14% | 40.8 ? -0% | 41.6 ? -2% | 41.6 ? -2% |
| Response Time Black / White * (ms) | 28.8 ? | 28.8 ? -0% | 31.2 ? -8% | 34 ? -18% | 31.6 ? -10% |
| PWM Frequency (Hz) | 219.3 ? | ||||
| Screen | 7% | 29% | -3% | 12% | |
| Brightness middle (cd/m²) | 271.6 | 327 20% | 344 27% | 306 13% | 311 15% |
| Brightness (cd/m²) | 264 | 311 18% | 321 22% | 287 9% | 288 9% |
| Brightness Distribution (%) | 88 | 88 0% | 85 -3% | 88 0% | 85 -3% |
| Black Level * (cd/m²) | 0.24 | 0.25 -4% | 0.32 -33% | 0.3 -25% | 0.24 -0% |
| Contrast (:1) | 1132 | 1308 16% | 1075 -5% | 1020 -10% | 1296 14% |
| Colorchecker dE 2000 * | 6.1 | 6.1 -0% | 2.6 57% | 6.2 -2% | 5.5 10% |
| Colorchecker dE 2000 max. * | 28.6 | 12.2 57% | 7.8 73% | 13.6 52% | 9 69% |
| Greyscale dE 2000 * | 3.4 | 8.8 -159% | 2.6 24% | 5.8 -71% | 6.2 -82% |
| Gamma | 2.12 104% | 2.18 101% | 2.28 96% | 2.04 108% | 2.02 109% |
| CCT | 6077 107% | 6172 105% | 7050 92% | 6277 104% | 5950 109% |
| Color Space (Percent of AdobeRGB 1998) (%) | 38 | 61.56 62% | 65.82 73% | 39.62 4% | 55.96 47% |
| Color Space (Percent of sRGB) (%) | 60 | 94.88 58% | 92.27 54% | 61.44 2% | 85.77 43% |
| Totaal Gemiddelde (Programma / Instellingen) | 22% /
17% | 28% /
30% | -3% /
-3% | 18% /
17% |
* ... kleiner is beter
Responstijd Scherm
| ↔ Responstijd Zwart naar Wit | ||
|---|---|---|
| 28.8 ms ... stijging ↗ en daling ↘ gecombineerd | ↗ 14.8 ms stijging | 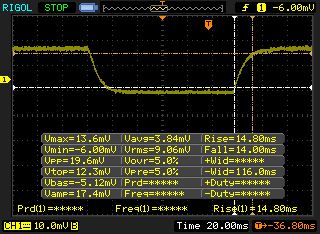 |
| ↘ 14 ms daling | ||
| Het scherm vertoonde relatief trage responstijden in onze tests en is misschien te traag voor games. Ter vergelijking: alle testtoestellen variëren van 0.1 (minimum) tot 240 (maximum) ms. » 76 % van alle toestellen zijn beter. Dit betekent dat de gemeten responstijd slechter is dan het gemiddelde (19.8 ms) van alle geteste toestellen. | ||
| ↔ Responstijd 50% Grijs naar 80% Grijs | ||
| 40.8 ms ... stijging ↗ en daling ↘ gecombineerd | ↗ 22.8 ms stijging | 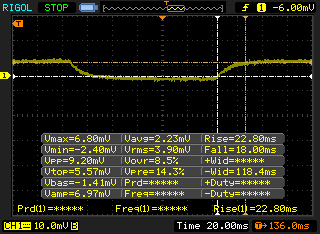 |
| ↘ 18 ms daling | ||
| Het scherm vertoonde trage responstijden in onze tests en is misschien te traag voor games. Ter vergelijking: alle testtoestellen variëren van 0.165 (minimum) tot 636 (maximum) ms. » 64 % van alle toestellen zijn beter. Dit betekent dat de gemeten responstijd slechter is dan het gemiddelde (31 ms) van alle geteste toestellen. | ||
Screen Flickering / PWM (Pulse-Width Modulation)
| Screen flickering / PWM waargenomen | 219.3 Hz | ≤ 99 % helderheid instelling | 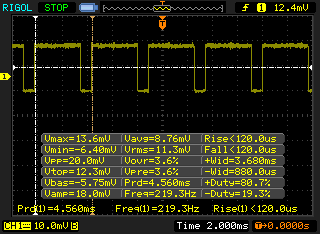 |
De achtergrondverlichting van het scherm flikkert op 219.3 Hz (in het slechtste geval, bijvoorbeeld bij gebruik van PWM) aan een helderheid van 99 % en lager. Boven deze helderheid zou er geen flickering / PWM mogen optreden. De frequentie van 219.3 Hz is redelijk laag en de meeste mensen die gevoelig zijn aan flickering kunnen dit dus waarnemen of geïrriteerde ogen krijgen (gebruikmakend van de vermelde helderheid en lager). Ter vergelijking: 52 % van alle geteste toestellen maakten geen gebruik van PWM om de schermhelderheid te verlagen. Als het wel werd gebruikt, werd een gemiddelde van 7754 (minimum: 5 - maximum: 343500) Hz waargenomen. | |||
| wPrime 2.10 - 1024m | |
| Dell Latitude 7480 | |
| Lenovo ThinkPad T470s-20HF0012US | |
| Lenovo ThinkPad T470s-20HGS00V00 | |
* ... kleiner is beter
| PCMark 8 Home Score Accelerated v2 | 3987 punten | |
| PCMark 8 Creative Score Accelerated v2 | 4910 punten | |
| PCMark 8 Work Score Accelerated v2 | 4999 punten | |
Help | ||
| Lenovo ThinkPad T470s-20HF0012US Samsung PM961 MZVLW256HEHP | Lenovo ThinkPad T470s-20HGS00V00 Samsung SSD PM961 1TB M.2 PCIe 3.0 x4 NVMe (MZVLW1T0) | Dell Latitude 7480 Intel SSDSCKKF256H6 | Lenovo ThinkPad T470-20HD002HGE Samsung PM961 NVMe MZVLW512HMJP | Lenovo ThinkPad X1 Carbon 2017-20HQS03P00 Samsung PM961 NVMe MZVLW512HMJP | |
|---|---|---|---|---|---|
| CrystalDiskMark 3.0 | 12% | -56% | -10% | 10% | |
| Read Seq (MB/s) | 1399 | 1760 26% | 486.5 -65% | 1155 -17% | 1827 31% |
| Write Seq (MB/s) | 1213 | 1666 37% | 418.6 -65% | 1076 -11% | 1383 14% |
| Read 512 (MB/s) | 831 | 832 0% | 354.3 -57% | 811 -2% | 814 -2% |
| Write 512 (MB/s) | 856 | 1064 24% | 306.8 -64% | 862 1% | 1098 28% |
| Read 4k (MB/s) | 60.7 | 53.2 -12% | 29.25 -52% | 55.5 -9% | 61 0% |
| Write 4k (MB/s) | 159.2 | 167.4 5% | 90.5 -43% | 134.6 -15% | 172.2 8% |
| Read 4k QD32 (MB/s) | 580 | 630 9% | 280.2 -52% | 496.2 -14% | 601 4% |
| Write 4k QD32 (MB/s) | 499.4 | 533 7% | 252.8 -49% | 425.4 -15% | 495.6 -1% |

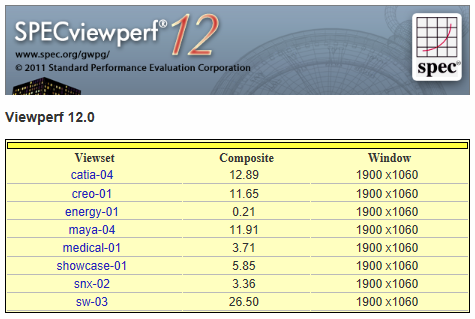
| 3DMark | |
| 1280x720 Cloud Gate Standard Graphics | |
| Lenovo ThinkPad T470s-20HGS00V00 | |
| Lenovo ThinkPad X1 Carbon 2017-20HQS03P00 | |
| Lenovo ThinkPad T470s-20HF0012US | |
| Dell Latitude 7480 | |
| Lenovo ThinkPad T470-20HD002HGE | |
| 1920x1080 Fire Strike Graphics | |
| Lenovo ThinkPad T470s-20HGS00V00 | |
| Lenovo ThinkPad X1 Carbon 2017-20HQS03P00 | |
| Lenovo ThinkPad T470s-20HF0012US | |
| Dell Latitude 7480 | |
| Lenovo ThinkPad T470-20HD002HGE | |
| 1920x1080 Ice Storm Extreme Graphics | |
| Dell Latitude 7480 | |
| 3DMark 06 Standard Score | 9671 punten | |
| 3DMark 11 Performance | 1741 punten | |
| 3DMark Ice Storm Standard Score | 67756 punten | |
| 3DMark Cloud Gate Standard Score | 6945 punten | |
| 3DMark Fire Strike Score | 971 punten | |
Help | ||
| lage | gem. | hoge | ultra | |
|---|---|---|---|---|
| BioShock Infinite (2013) | 54.6 | 31.7 | 26 | 8.2 |
Geluidsniveau
| Onbelast |
| 27.8 / 27.8 / 27.8 dB (A) |
| Belasting |
| 34.8 / 42 dB (A) |
 | ||
30 dB stil 40 dB(A) hoorbaar 50 dB(A) luid |
||
min: | ||
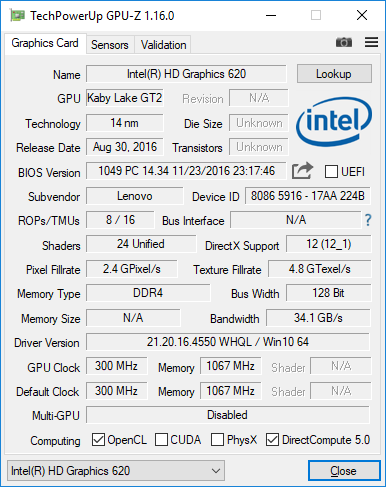
| Lenovo ThinkPad T470s-20HF0012US HD Graphics 620, i5-7300U, Samsung PM961 MZVLW256HEHP | Lenovo ThinkPad T470s-20HGS00V00 HD Graphics 620, i7-7600U, Samsung SSD PM961 1TB M.2 PCIe 3.0 x4 NVMe (MZVLW1T0) | Dell Latitude 7480 HD Graphics 620, i7-7600U, Intel SSDSCKKF256H6 | Lenovo ThinkPad T470-20HD002HGE HD Graphics 620, i5-7200U, Samsung PM961 NVMe MZVLW512HMJP | Lenovo ThinkPad X1 Carbon 2017-20HQS03P00 HD Graphics 620, i7-7500U, Samsung PM961 NVMe MZVLW512HMJP | |
|---|---|---|---|---|---|
| Noise | -4% | 6% | 3% | -4% | |
| uit / omgeving * (dB) | 27.8 | 28.9 -4% | 28 -1% | 29.3 -5% | |
| Idle Minimum * (dB) | 27.8 | 28.9 -4% | 28.6 -3% | 28 -1% | 29.3 -5% |
| Idle Average * (dB) | 27.8 | 28.9 -4% | 28.6 -3% | 28 -1% | 29.3 -5% |
| Idle Maximum * (dB) | 27.8 | 30.1 -8% | 28.6 -3% | 29.4 -6% | 32.2 -16% |
| Load Average * (dB) | 34.8 | 39.2 -13% | 30.2 13% | 31.4 10% | 34.3 1% |
| Witcher 3 ultra * (dB) | 42 | ||||
| Load Maximum * (dB) | 42 | 39.2 7% | 31.2 26% | 34.6 18% | 39.3 6% |
* ... kleiner is beter
(-) De maximumtemperatuur aan de bovenzijde bedraagt 45.4 °C / 114 F, vergeleken met het gemiddelde van 34.3 °C / 94 F, variërend van 21.2 tot 62.5 °C voor de klasse Office.
(-) De bodem warmt op tot een maximum van 51.2 °C / 124 F, vergeleken met een gemiddelde van 36.8 °C / 98 F
(+) Bij onbelast gebruik bedraagt de gemiddelde temperatuur voor de bovenzijde 24 °C / 75 F, vergeleken met het apparaatgemiddelde van 29.5 °C / 85 F.
(+) De handpalmsteunen en het touchpad bereiken maximaal de huidtemperatuur (33.8 °C / 92.8 F) en zijn dus niet heet.
(-) De gemiddelde temperatuur van de handpalmsteun van soortgelijke toestellen bedroeg 27.5 °C / 81.5 F (-6.3 °C / -11.3 F).
Lenovo ThinkPad T470s-20HF0012US audioanalyse
(±) | luidspreker luidheid is gemiddeld maar goed (72 dB)
Bas 100 - 315 Hz
(-) | bijna geen lage tonen - gemiddeld 15.3% lager dan de mediaan
(±) | lineariteit van de lage tonen is gemiddeld (14.1% delta ten opzichte van de vorige frequentie)
Midden 400 - 2000 Hz
(+) | evenwichtige middens - slechts 3.2% verwijderd van de mediaan
(±) | lineariteit van de middentonen is gemiddeld (11% delta ten opzichte van de vorige frequentie)
Hoog 2 - 16 kHz
(+) | evenwichtige hoogtepunten - slechts 4.4% verwijderd van de mediaan
(±) | lineariteit van de hoogtepunten is gemiddeld (12.5% delta ten opzichte van de vorige frequentie)
Algemeen 100 - 16.000 Hz
(±) | lineariteit van het totale geluid is gemiddeld (24.8% verschil met de mediaan)
Vergeleken met dezelfde klasse
» 74% van alle geteste apparaten in deze klasse waren beter, 7% vergelijkbaar, 19% slechter
» De beste had een delta van 7%, het gemiddelde was 21%, de slechtste was 53%
Vergeleken met alle geteste toestellen
» 76% van alle geteste apparaten waren beter, 5% gelijk, 19% slechter
» De beste had een delta van 4%, het gemiddelde was 23%, de slechtste was 134%
Dell Latitude 7480 audioanalyse
(±) | luidspreker luidheid is gemiddeld maar goed (75 dB)
Bas 100 - 315 Hz
(±) | verminderde zeebaars - gemiddeld 11.9% lager dan de mediaan
(±) | lineariteit van de lage tonen is gemiddeld (10.6% delta ten opzichte van de vorige frequentie)
Midden 400 - 2000 Hz
(+) | evenwichtige middens - slechts 3.8% verwijderd van de mediaan
(±) | lineariteit van de middentonen is gemiddeld (7.8% delta ten opzichte van de vorige frequentie)
Hoog 2 - 16 kHz
(±) | higher highs - on average 6.6% higher than median
(+) | de hoge tonen zijn lineair (6.3% delta naar de vorige frequentie)
Algemeen 100 - 16.000 Hz
(±) | lineariteit van het totale geluid is gemiddeld (23.2% verschil met de mediaan)
Vergeleken met dezelfde klasse
» 65% van alle geteste apparaten in deze klasse waren beter, 8% vergelijkbaar, 27% slechter
» De beste had een delta van 7%, het gemiddelde was 21%, de slechtste was 53%
Vergeleken met alle geteste toestellen
» 70% van alle geteste apparaten waren beter, 5% gelijk, 25% slechter
» De beste had een delta van 4%, het gemiddelde was 23%, de slechtste was 134%
| Uit / Standby | |
| Inactief | |
| Belasting |
|
Key:
min: | |
| Lenovo ThinkPad T470s-20HF0012US i5-7300U, HD Graphics 620, Samsung PM961 MZVLW256HEHP, IPS, 1920x1080, 14" | Lenovo ThinkPad T470s-20HGS00V00 i7-7600U, HD Graphics 620, Samsung SSD PM961 1TB M.2 PCIe 3.0 x4 NVMe (MZVLW1T0), IPS, 2560x1440, 14" | Dell Latitude 7480 i7-7600U, HD Graphics 620, Intel SSDSCKKF256H6, IPS, 1920x1080, 14" | Lenovo ThinkPad T470-20HD002HGE i5-7200U, HD Graphics 620, Samsung PM961 NVMe MZVLW512HMJP, IPS, 1920x1080, 14" | Lenovo ThinkPad X1 Carbon 2017-20HQS03P00 i7-7500U, HD Graphics 620, Samsung PM961 NVMe MZVLW512HMJP, IPS, 1920x1080, 14" | |
|---|---|---|---|---|---|
| Power Consumption | -15% | 16% | 19% | -3% | |
| Idle Minimum * (Watt) | 4.8 | 4.64 3% | 4.32 10% | 3.21 33% | 3.84 20% |
| Idle Average * (Watt) | 6.6 | 8.93 -35% | 6.27 5% | 6.15 7% | 6.3 5% |
| Idle Maximum * (Watt) | 7 | 9.12 -30% | 6.35 9% | 6.82 3% | 8.6 -23% |
| Load Average * (Watt) | 39.2 | 42.2 -8% | 29.82 24% | 28.5 27% | 41.9 -7% |
| Load Maximum * (Watt) | 44.8 | 47.3 -6% | 30.64 32% | 34.5 23% | 48.7 -9% |
* ... kleiner is beter
| Lenovo ThinkPad T470s-20HF0012US i5-7300U, HD Graphics 620, 51 Wh | Lenovo ThinkPad T470s-20HGS00V00 i7-7600U, HD Graphics 620, 51 Wh | Dell Latitude 7480 i7-7600U, HD Graphics 620, 60 Wh | Lenovo ThinkPad T470-20HD002HGE i5-7200U, HD Graphics 620, 48 Wh | Lenovo ThinkPad X1 Carbon 2017-20HQS03P00 i7-7500U, HD Graphics 620, 57 Wh | |
|---|---|---|---|---|---|
| Batterijduur | -28% | 35% | -24% | -6% | |
| Reader / Idle (h) | 17.7 | 13.1 -26% | 27.7 56% | 20.9 18% | |
| WiFi v1.3 (h) | 8.1 | 7 -14% | 12 48% | 7.3 -10% | 8.3 2% |
| Load (h) | 2.9 | 1.6 -45% | 2.9 0% | 1.8 -38% | 1.8 -38% |
Pro
Contra
Dit is de verkorte versie van het originele artikel. Het volledige, Engelse testrapport vind je hier.
Met een vederlichte constructie die zowel draagbaar als stevig is (dankzij het gebruik van een hybride oplossing van high-end magnesium en koolstofvezel), uitstekende batterijlevensduur en de fantastische invoerapparaten waar de ThinkPad-serie al zo lang bekend om staat, moet de Lenovo ThinkPad T470s FHD al de aandacht gekregen hebben van zakelijke gebruikers. Maar voeg daar nog de hoge applicatieprestaties (mogelijk gemaakt door een erg snelle Samsung NVMe SSD), solide CPU prestaties van de Core i5 en makkelijk onderhoud aan toe en het wordt moeilijk om dit model af te wijzen.
Kritiekpunten? Ja, er zijn een paar. Om te beginnen is het beeldscherm bij lange na niet zo indrukwekkend als veel van de concurrenten en een aanzienlijke stap terug van het WQHD model, niet enkel qua resolutie maar ook helderheid, contrast en kleurweergave. We detecteerden PWM op alle helderheidsniveaus behalve de maximale, wat teleurstellend is voor een ThinkPad. En tot slot wordt het apparaat erg snel warm, al snel tot hinderlijk hoge temperaturen (bij belasting), zeker bij gebruik op schoot.
Behalve de onfortuinlijke PWM-flikkering, beeldschermkwaliteit die gewoontjes is en wat onwelkome warmte bij belasting, is de Lenovo ThinkPad T470s FHD een uitstekende keuze.
Als de gebruiker de iets lagere (maar nog steeds erg goede) batterijlevensduur en hogere prijs niet erg vindt, dan raden we met klem aan om ook de recent geteste T470s WQHD versie in overweging te nemen. Die versie beschikt niet enkel over een betere helderheid en kleurweergave maar gebruikt ook geen PWM om de helderheid te reduceren. De Core i5 CPU die we in de in deze configuratie zien lijkt een wat rationelere keuze versus de i7 uit de WQHD configuratie gezien de uitstekende prestaties en relatieve stabiliteit van de eerste. De Dell Latitude 7480 is ook een erg goede keuze - of, als het budget het toelaat, de ThinkPad X1 Carbon. Maar behalve de minpunten van het beeldscherm, en in acht genomen dat de gebruiker de warmteontwikkeling niet hinderlijk vindt, is de T470s FHD op dit moment één van de kandidaten voor de beste 14-inch zakelijke notebook van dit moment.
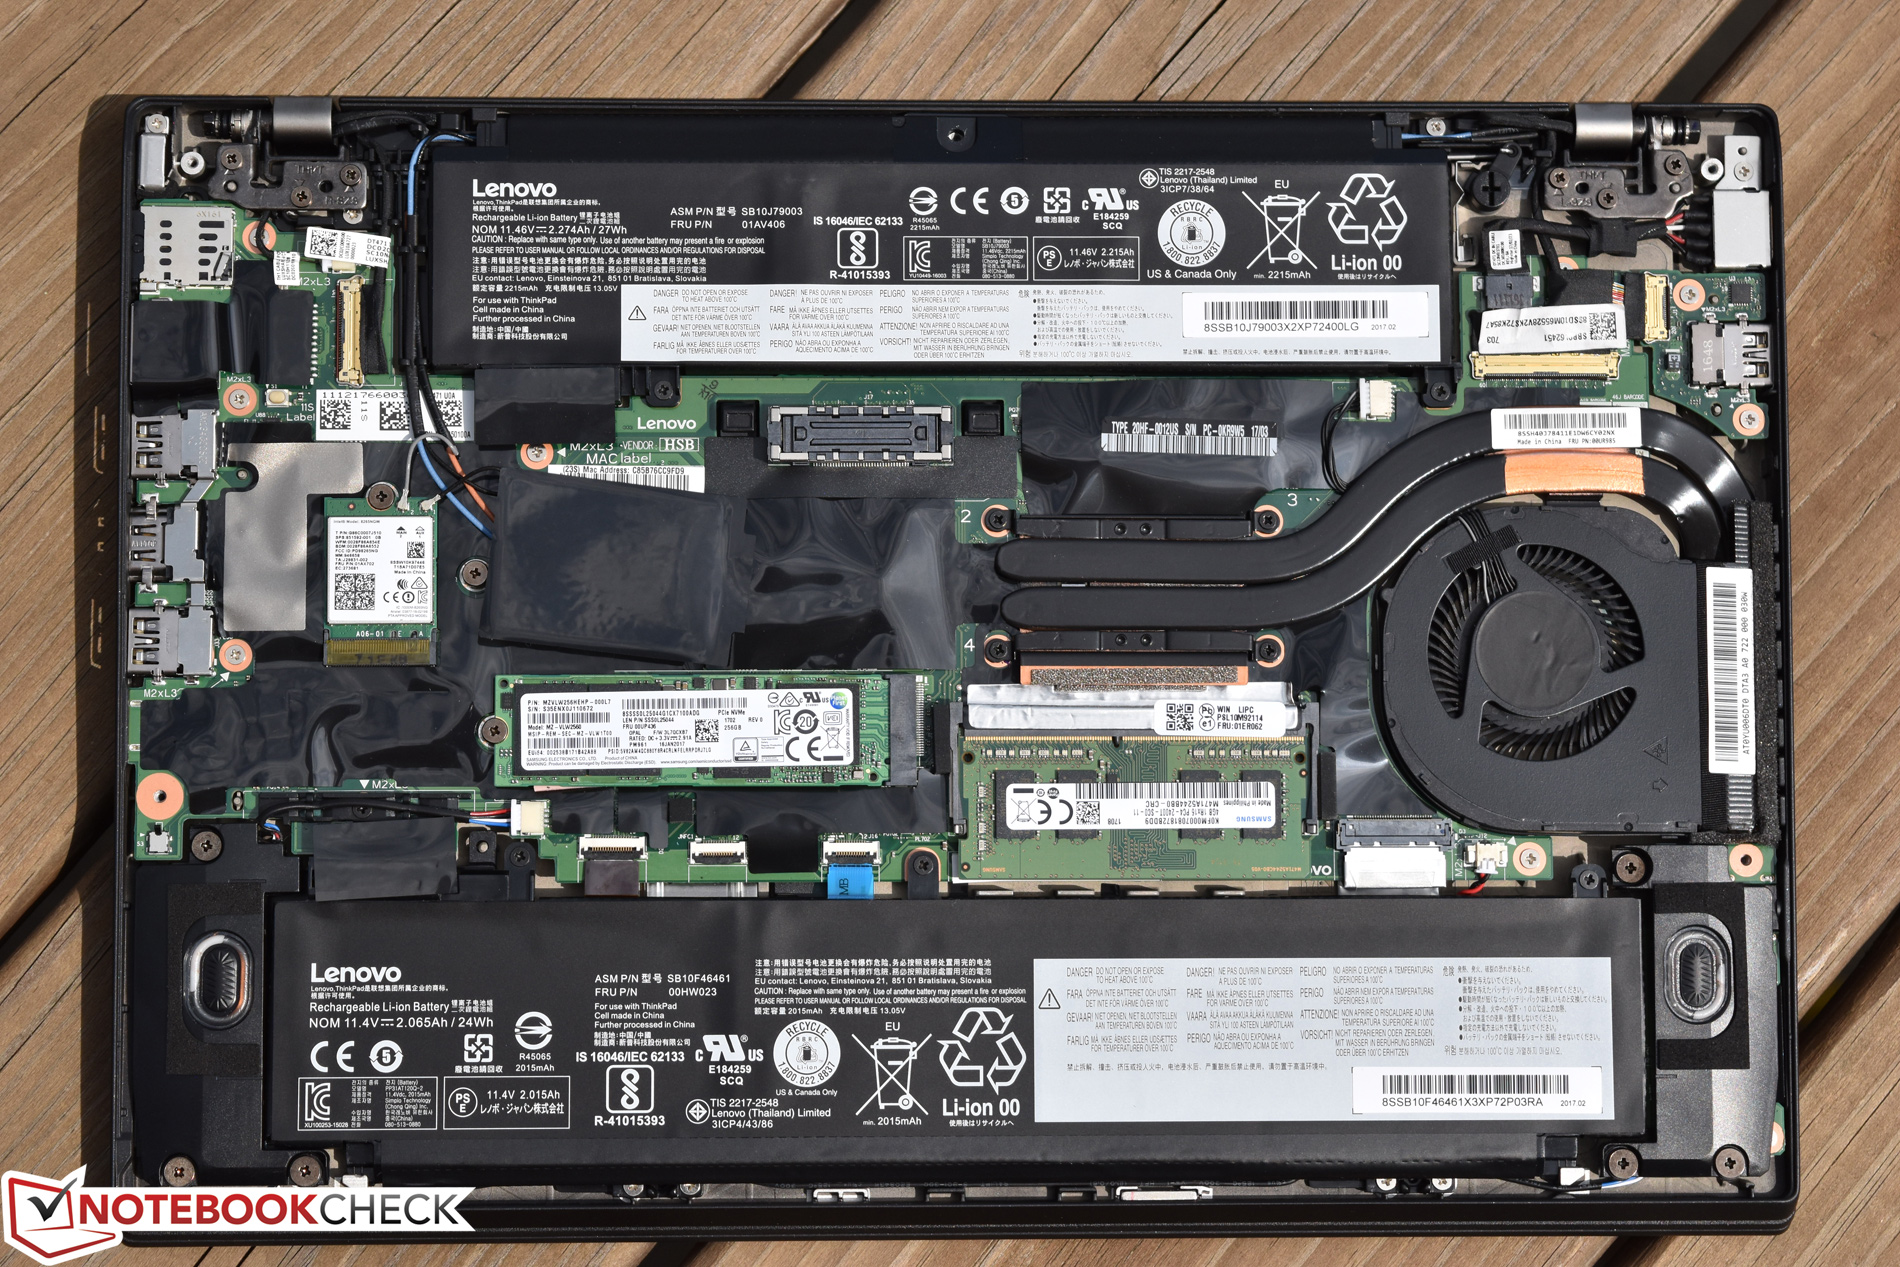
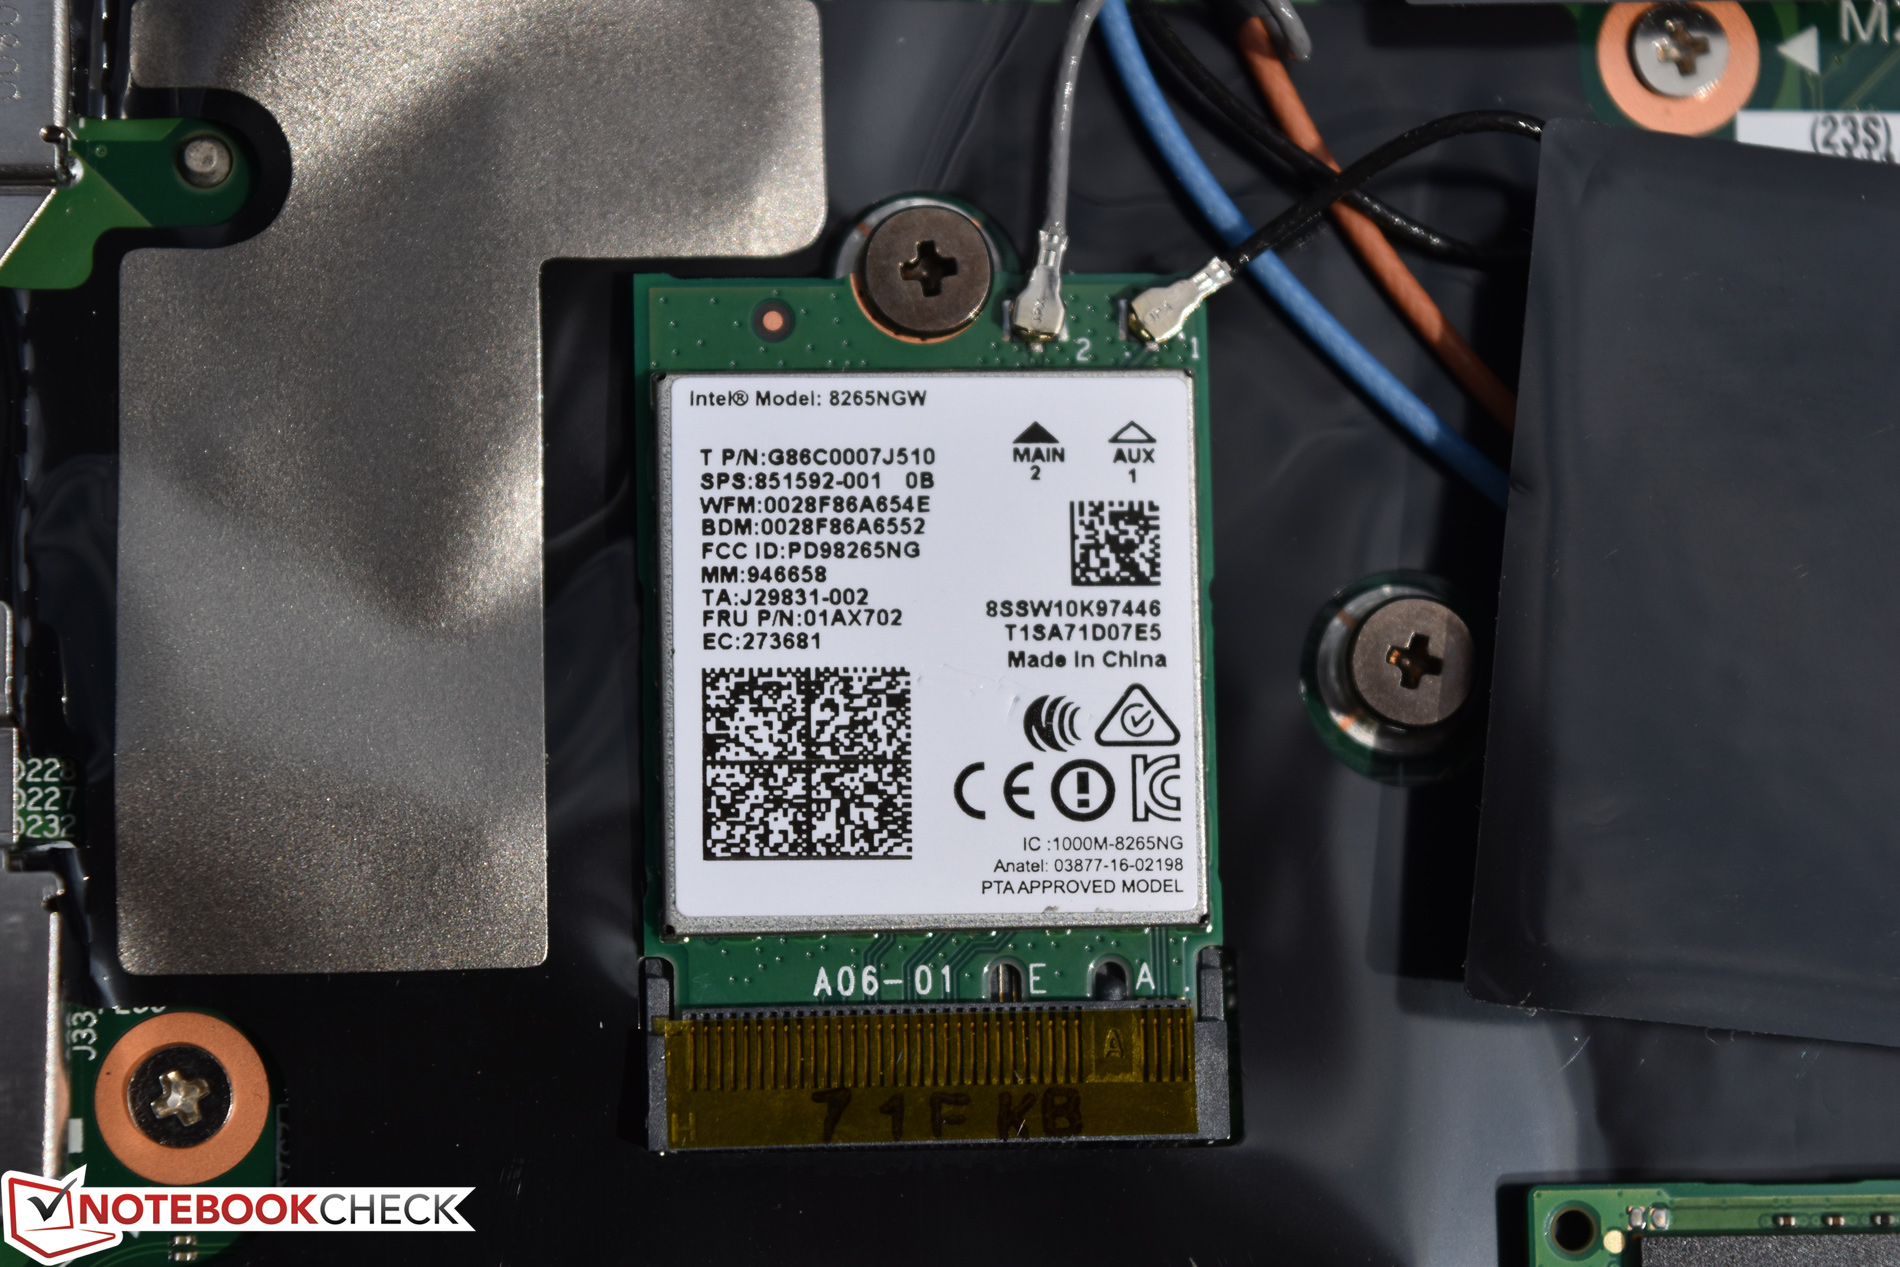
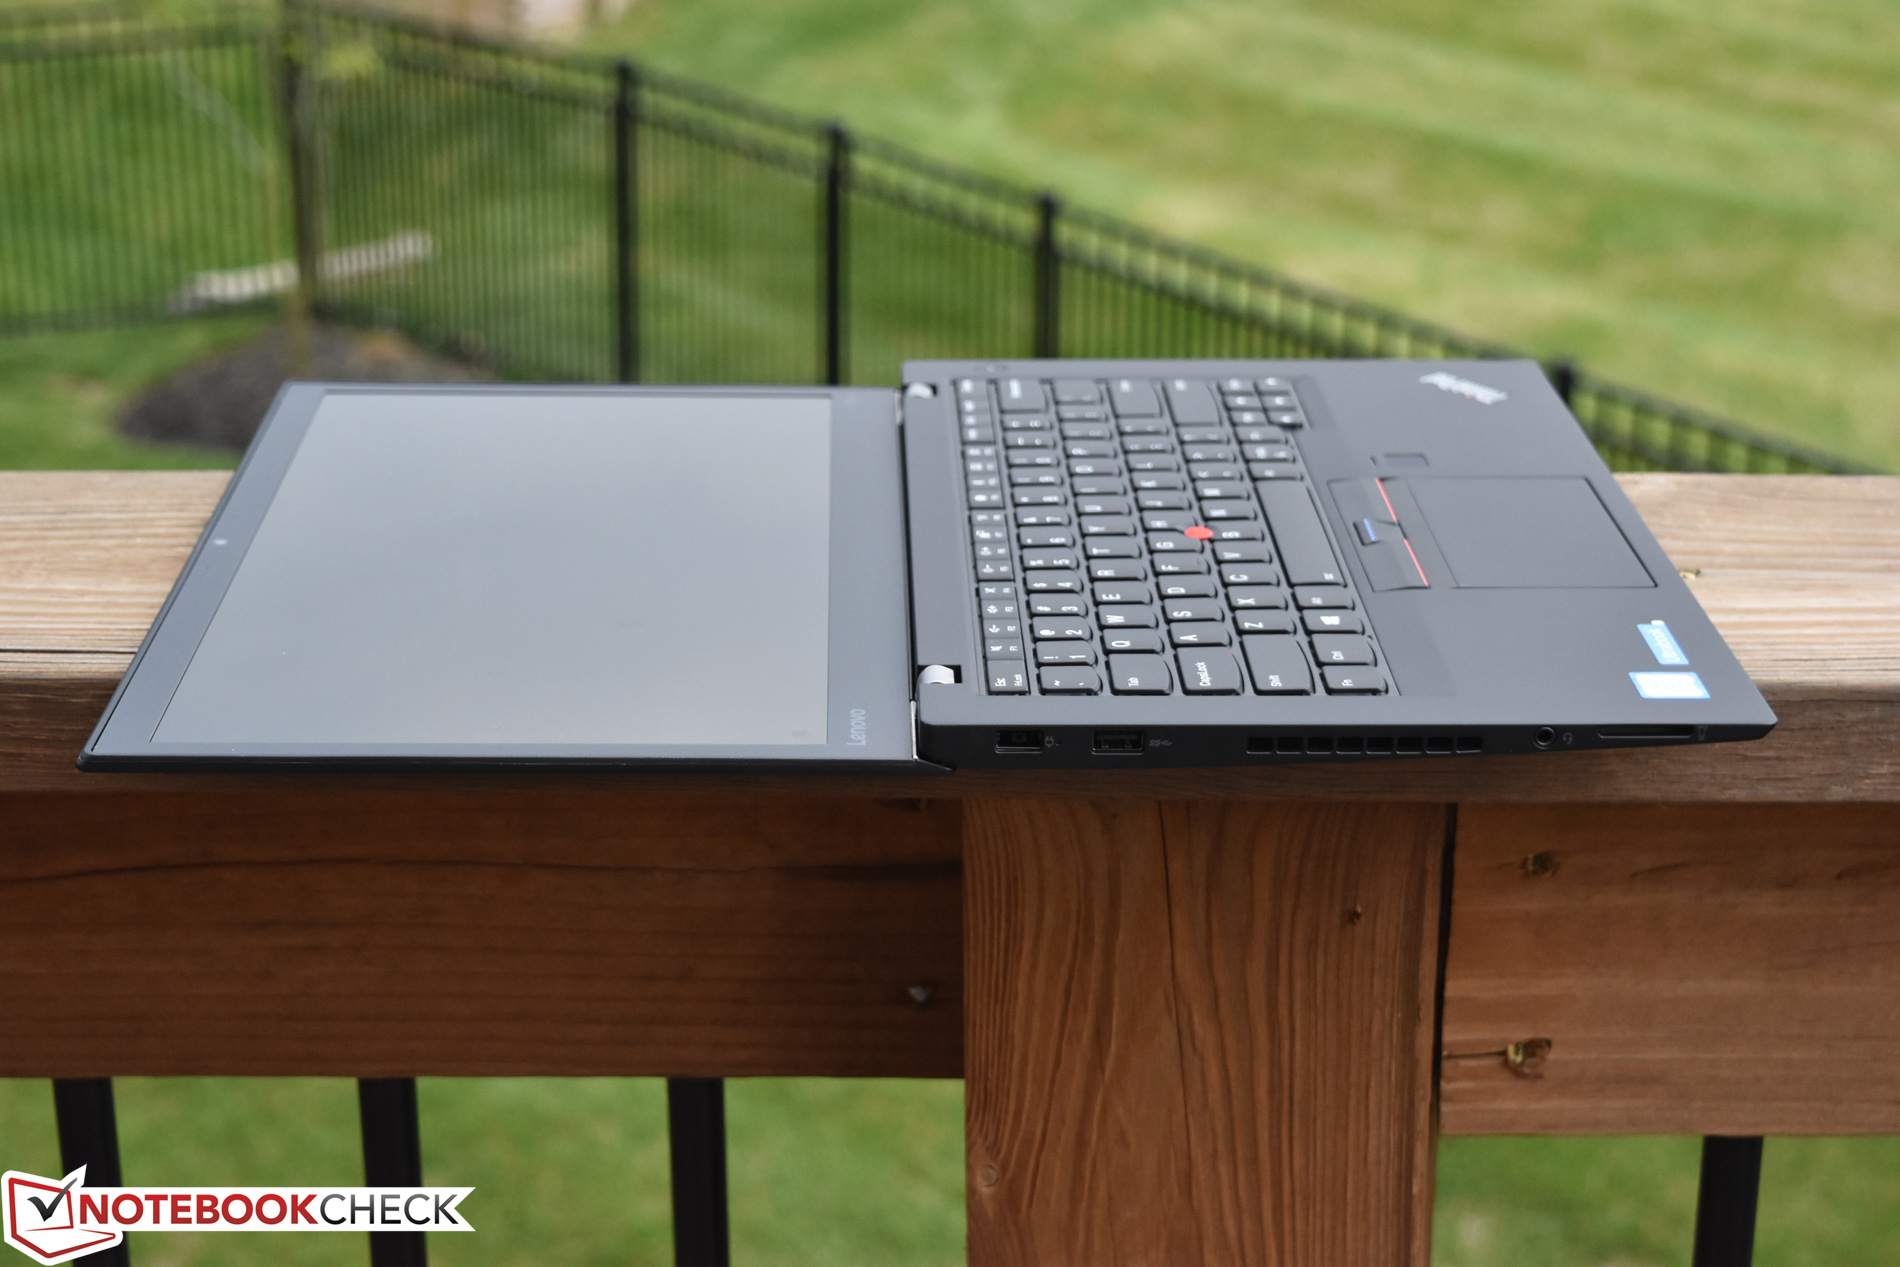
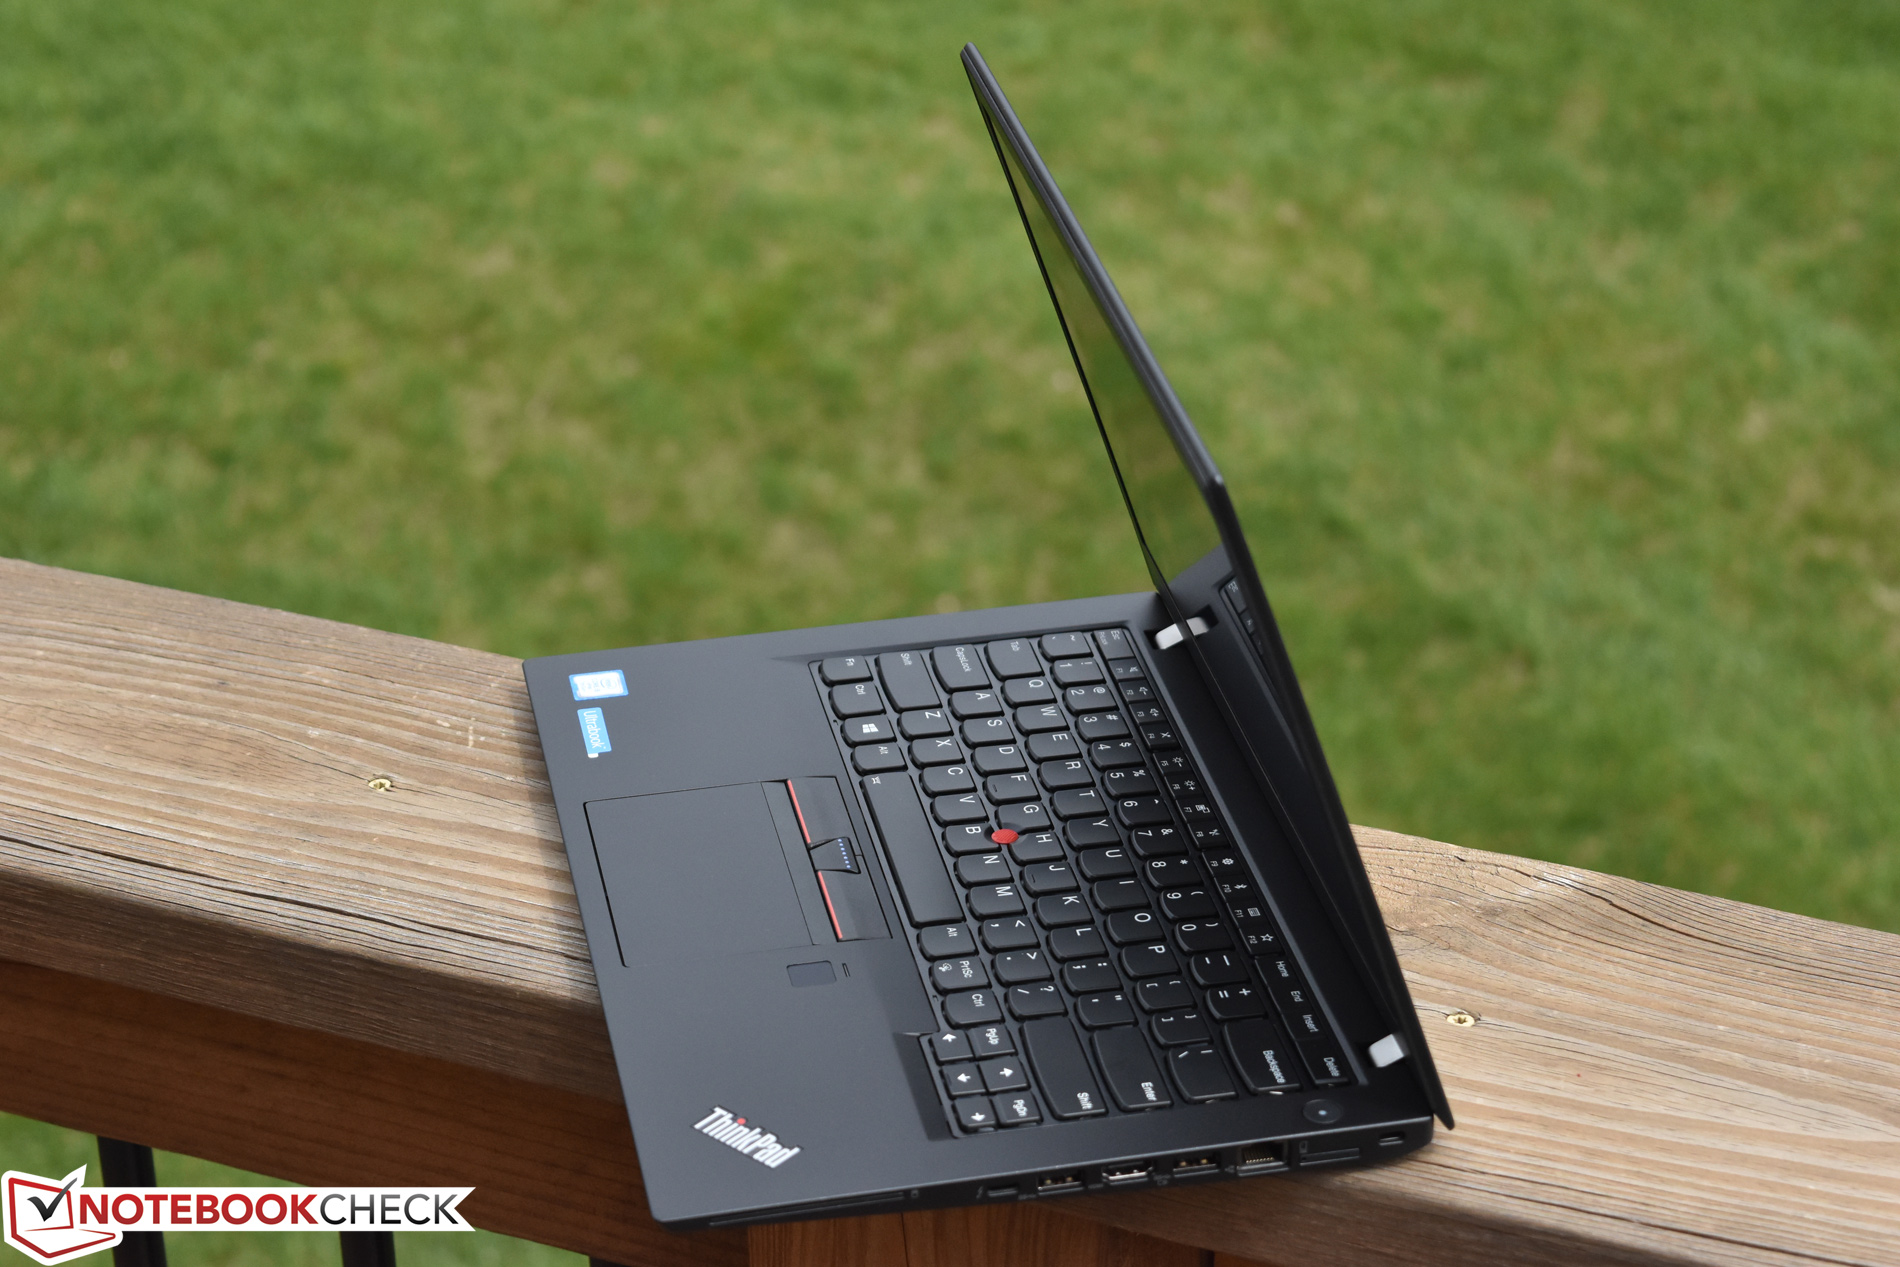
Lenovo ThinkPad T470s-20HF0012US
- 13-05-2017 v6 (old)
Steve Schardein
Price comparison
