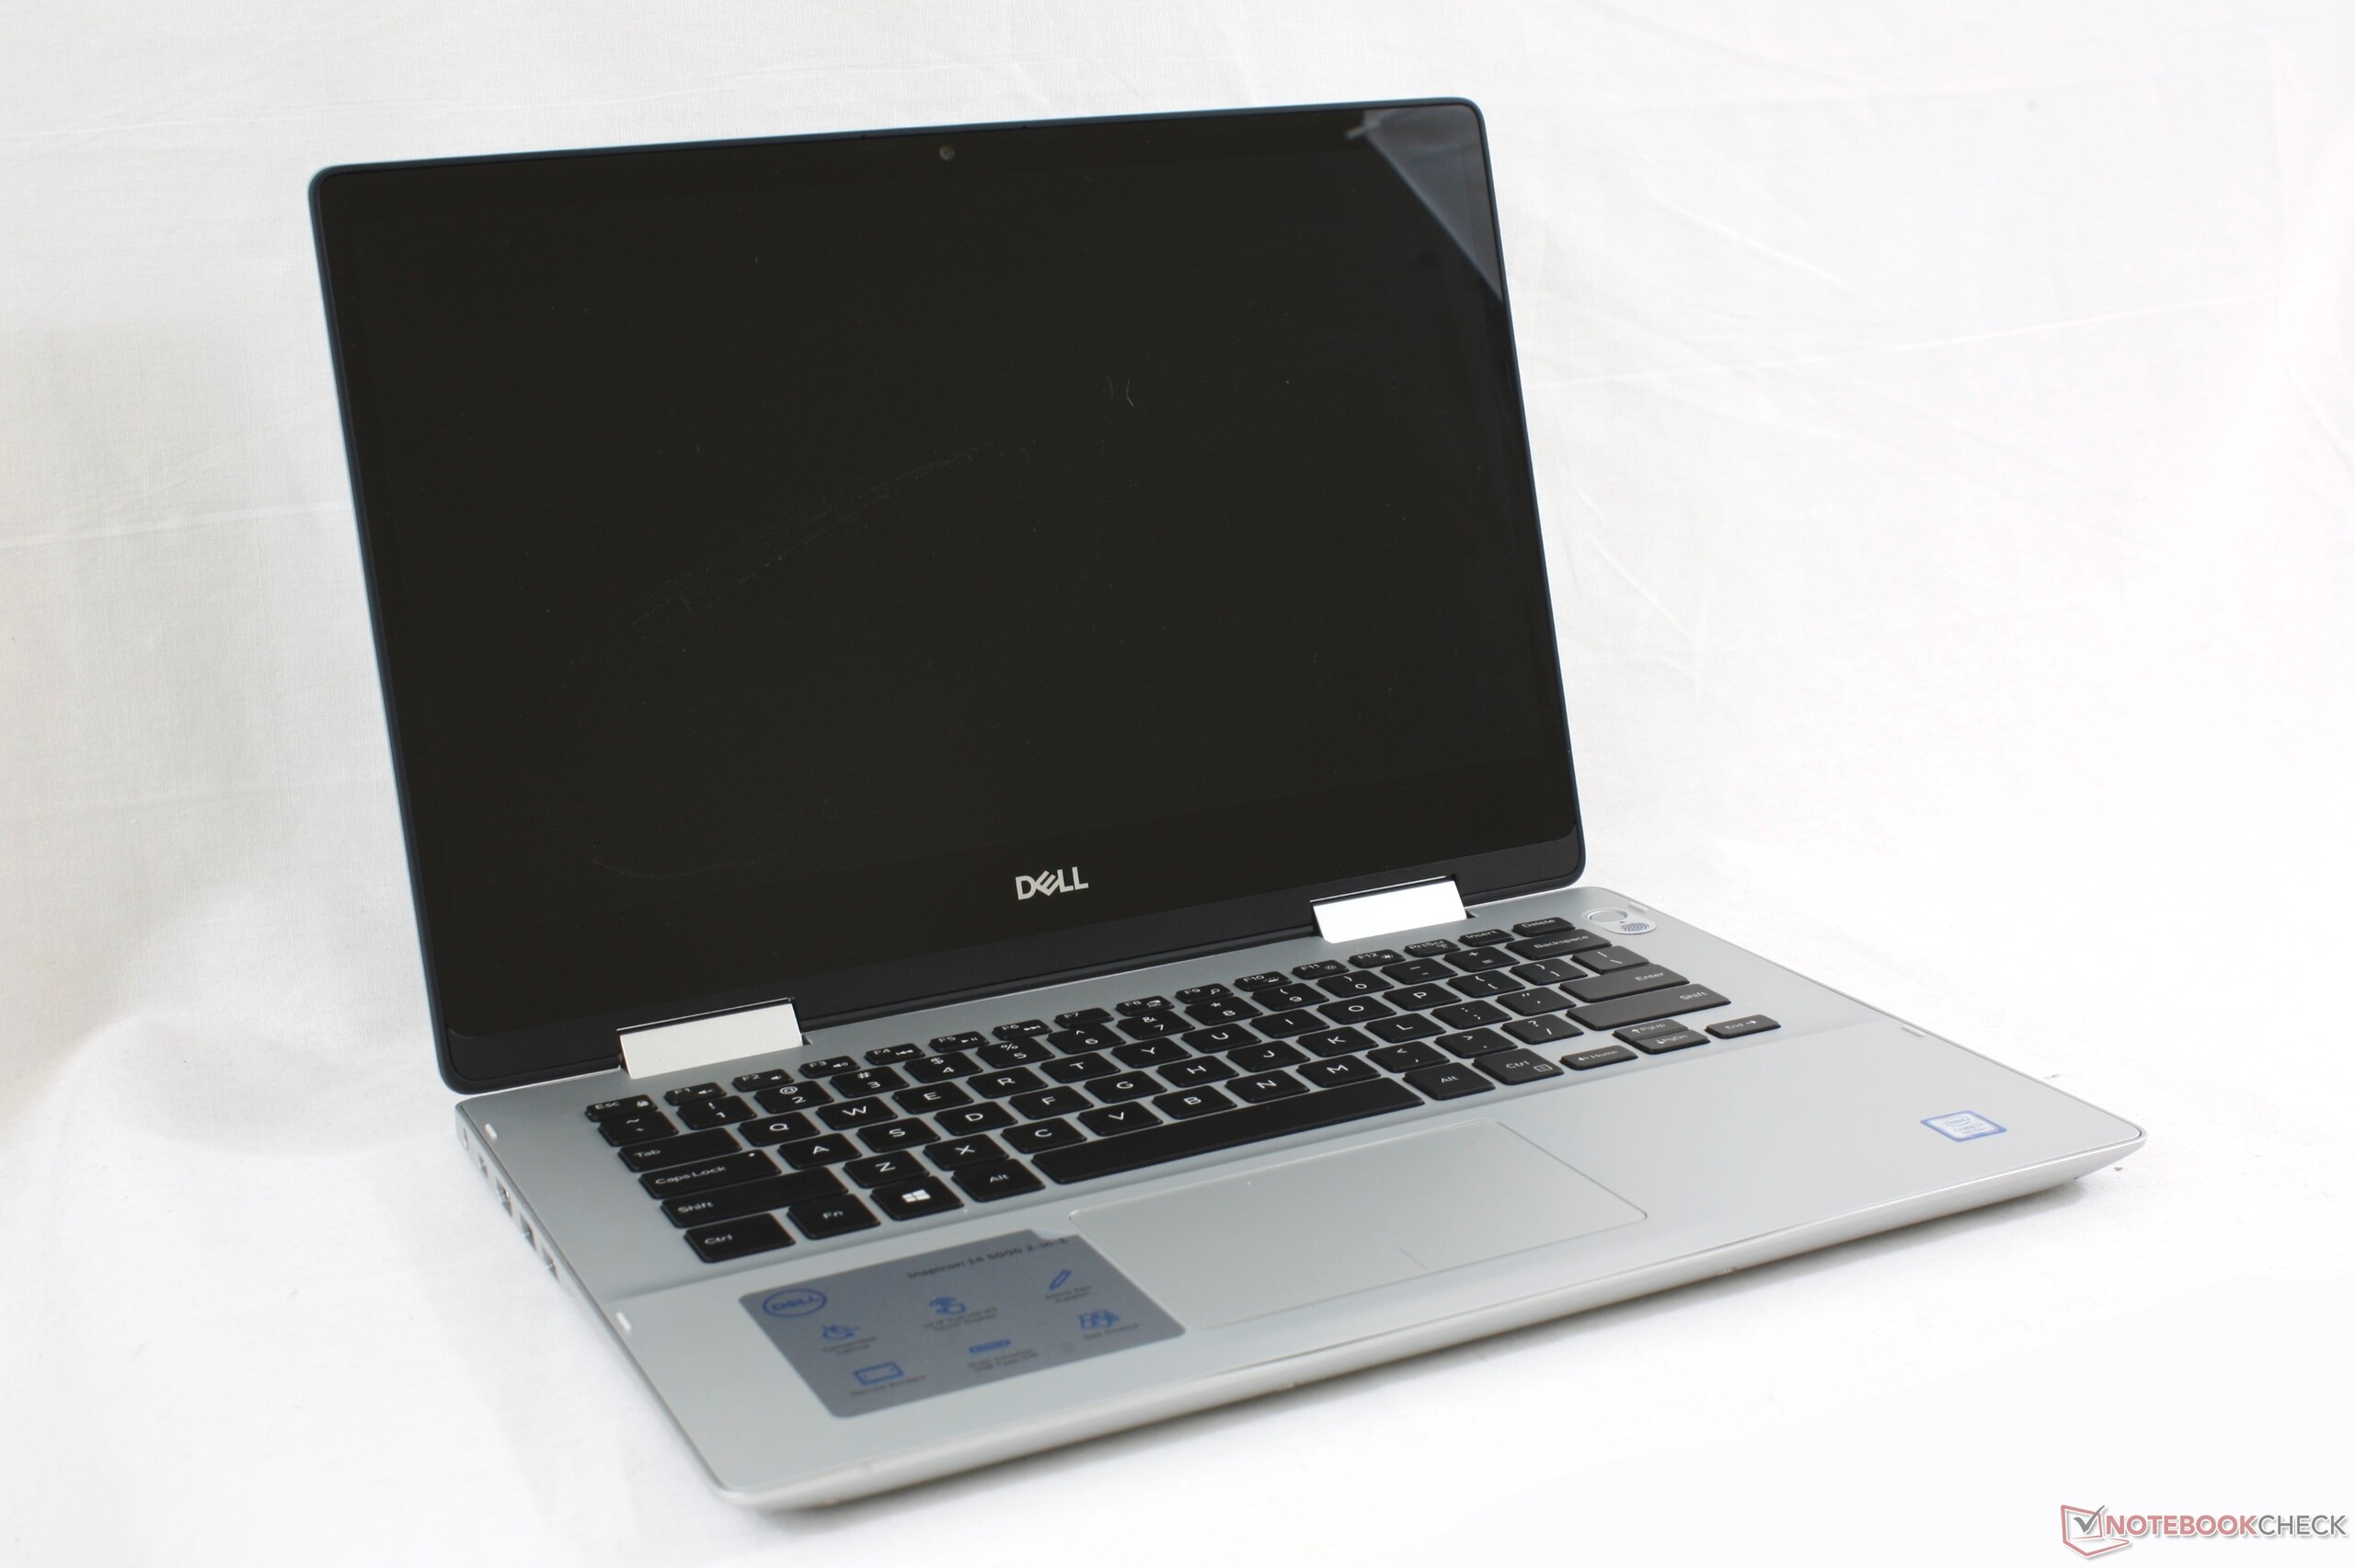
Kort testrapport Dell Inspiron 14 5000 5482 2-in-1 (i7-8565U) Convertible
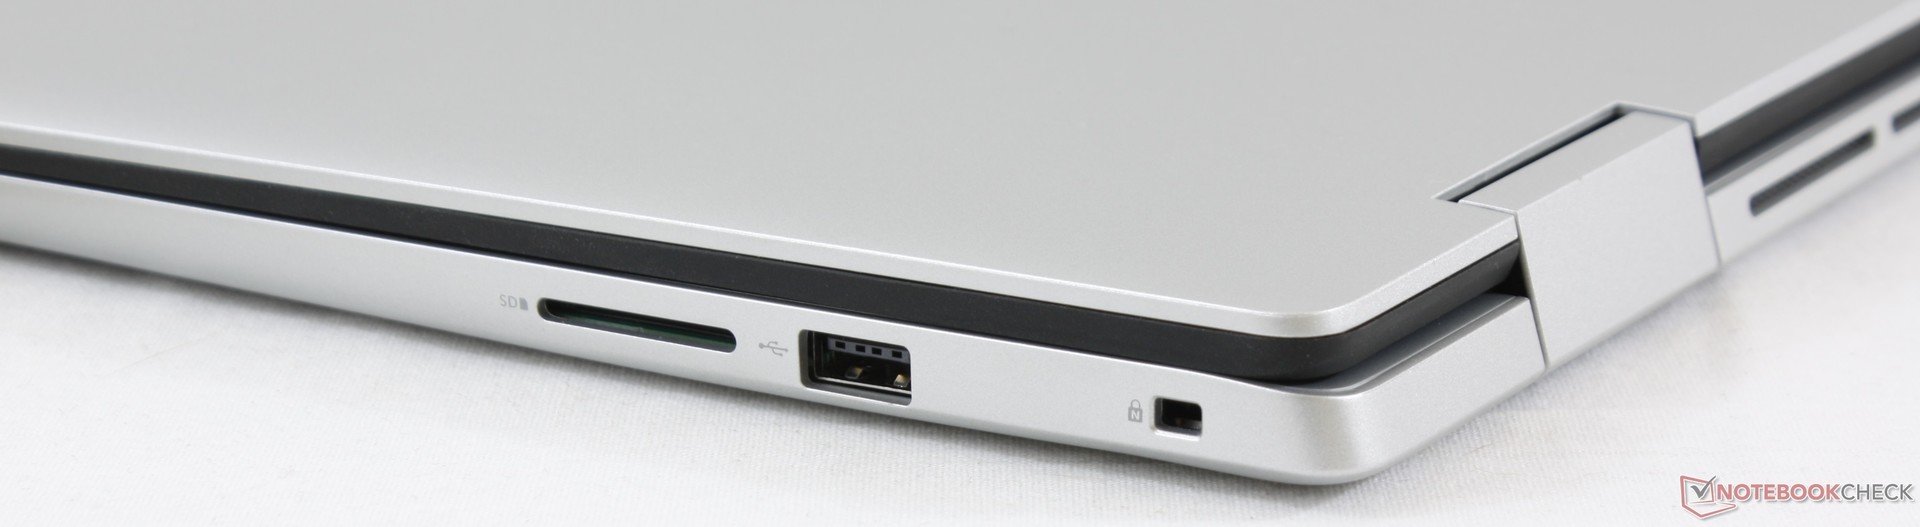

| SD Card Reader | |
| average JPG Copy Test (av. of 3 runs) | |
| Dell XPS 13 9370 i7 UHD (Toshiba Exceria Pro UHS-II) | |
| Dell Inspiron 14 5000 5482 2-in-1 (Toshiba Exceria Pro SDXC 64 GB UHS-II) | |
| Lenovo Yoga 530-14IKB-81EK00CWGE (Toshiba Exceria Pro SDXC 64 GB UHS-II) | |
| Asus VivoBook Flip 14 TP412UA-DB51T (Toshiba Exceria Pro SDXC 64 GB UHS-II) | |
| maximum AS SSD Seq Read Test (1GB) | |
| Dell XPS 13 9370 i7 UHD (Toshiba Exceria Pro UHS-II) | |
| Dell Inspiron 14 5000 5482 2-in-1 (Toshiba Exceria Pro SDXC 64 GB UHS-II) | |
| Lenovo Yoga 530-14IKB-81EK00CWGE (Toshiba Exceria Pro SDXC 64 GB UHS-II) | |
| Asus VivoBook Flip 14 TP412UA-DB51T (Toshiba Exceria Pro SDXC 64 GB UHS-II) | |
| |||||||||||||||||||||||||
Helderheidsverdeling: 78 %
Helderheid in Batterij-modus: 193.6 cd/m²
Contrast: 1139:1 (Zwart: 0.17 cd/m²)
ΔE ColorChecker Calman: 6.99 | ∀{0.5-29.43 Ø4.73}
calibrated: 4.86
ΔE Greyscale Calman: 5.7 | ∀{0.09-98 Ø4.97}
58.1% sRGB (Calman 2D)
37.6% AdobeRGB 1998 (Argyll 1.6.3 3D)
41.91% AdobeRGB 1998 (Argyll 3D)
58.6% sRGB (Argyll 3D)
40.57% Display P3 (Argyll 3D)
Gamma: 2.12
CCT: 5845 K
| Dell Inspiron 14 5000 5482 2-in-1 NV14N4H, IPS, 14", 1920x1080 | Lenovo Yoga 530-14IKB-81EK00CWGE InfoVision M140NWF5 R2, IPS, 14", 1920x1080 | Asus VivoBook Flip 14 TP412UA-DB51T AUO B140HAN04.0, IPS, 14", 1920x1080 | Dell XPS 13 9365-4537 2-in-1 Sharp LQ133Z1, IPS, 13.3", 3200x1800 | Lenovo Yoga C930-13IKB B139HAN03_0, IPS, 13.9", 1920x1080 | Huawei Matebook X Pro i5 Tianma XM, IPS, 13.9", 3000x2000 | |
|---|---|---|---|---|---|---|
| Display | 3% | -2% | 59% | 59% | 62% | |
| Display P3 Coverage (%) | 40.57 | 41.52 2% | 39.42 -3% | 64.4 59% | 64.3 58% | 65.9 62% |
| sRGB Coverage (%) | 58.6 | 62.1 6% | 59.2 1% | 92.9 59% | 94.6 61% | 95.2 62% |
| AdobeRGB 1998 Coverage (%) | 41.91 | 42.92 2% | 40.73 -3% | 66.1 58% | 66.2 58% | 67.6 61% |
| Response Times | 17% | 21% | 17% | 24% | 27% | |
| Response Time Grey 50% / Grey 80% * (ms) | 58.8 ? | 45 ? 23% | 38 ? 35% | 48 ? 18% | 40.8 ? 31% | 40.4 ? 31% |
| Response Time Black / White * (ms) | 33.2 ? | 30 ? 10% | 30.8 ? 7% | 28 ? 16% | 27.6 ? 17% | 25.6 ? 23% |
| PWM Frequency (Hz) | 198.4 ? | 520 ? | ||||
| Screen | 36% | 13% | 47% | 14% | 43% | |
| Brightness middle (cd/m²) | 193.6 | 240 24% | 255.5 32% | 348 80% | 316 63% | 442.7 129% |
| Brightness (cd/m²) | 181 | 234 29% | 242 34% | 306 69% | 291 61% | 428 136% |
| Brightness Distribution (%) | 78 | 93 19% | 87 12% | 78 0% | 83 6% | 84 8% |
| Black Level * (cd/m²) | 0.17 | 0.11 35% | 0.29 -71% | 0.2 -18% | 0.36 -112% | 0.31 -82% |
| Contrast (:1) | 1139 | 2182 92% | 881 -23% | 1740 53% | 878 -23% | 1428 25% |
| Colorchecker dE 2000 * | 6.99 | 4.98 29% | 4.18 40% | 2.79 60% | 5.9 16% | 2.24 68% |
| Colorchecker dE 2000 max. * | 23.58 | 10.75 54% | 19.15 19% | 5.53 77% | 12.9 45% | 7.19 70% |
| Colorchecker dE 2000 calibrated * | 4.86 | 3.33 31% | 3.8 22% | 1.3 73% | 1.11 77% | |
| Greyscale dE 2000 * | 5.7 | 3.51 38% | 2.2 61% | 3.47 39% | 8.6 -51% | 9.7 -70% |
| Gamma | 2.12 104% | 2.2 100% | 2.05 107% | 2.54 87% | 2.1 105% | 1.42 155% |
| CCT | 5845 111% | 6606 98% | 6599 98% | 6564 99% | 6854 95% | 6227 104% |
| Color Space (Percent of AdobeRGB 1998) (%) | 37.6 | 40 6% | 37.5 0% | 60 60% | 60.7 61% | 61.6 64% |
| Color Space (Percent of sRGB) (%) | 62 | 59.1 | 93 | 94.5 | 95 | |
| Totaal Gemiddelde (Programma / Instellingen) | 19% /
27% | 11% /
11% | 41% /
45% | 32% /
24% | 44% /
44% |
* ... kleiner is beter
Responstijd Scherm
| ↔ Responstijd Zwart naar Wit | ||
|---|---|---|
| 33.2 ms ... stijging ↗ en daling ↘ gecombineerd | ↗ 20 ms stijging | 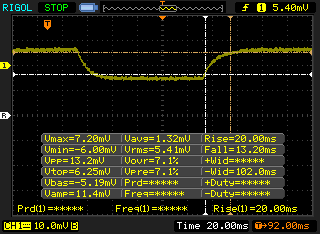 |
| ↘ 13.2 ms daling | ||
| Het scherm vertoonde trage responstijden in onze tests en is misschien te traag voor games. Ter vergelijking: alle testtoestellen variëren van 0.1 (minimum) tot 240 (maximum) ms. » 90 % van alle toestellen zijn beter. Dit betekent dat de gemeten responstijd slechter is dan het gemiddelde (19.9 ms) van alle geteste toestellen. | ||
| ↔ Responstijd 50% Grijs naar 80% Grijs | ||
| 58.8 ms ... stijging ↗ en daling ↘ gecombineerd | ↗ 25.6 ms stijging | 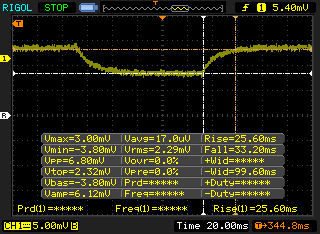 |
| ↘ 33.2 ms daling | ||
| Het scherm vertoonde trage responstijden in onze tests en is misschien te traag voor games. Ter vergelijking: alle testtoestellen variëren van 0.165 (minimum) tot 636 (maximum) ms. » 95 % van alle toestellen zijn beter. Dit betekent dat de gemeten responstijd slechter is dan het gemiddelde (31.1 ms) van alle geteste toestellen. | ||
Screen Flickering / PWM (Pulse-Width Modulation)
| Screen flickering / PWM waargenomen | 198.4 Hz | ≤ 98 % helderheid instelling | 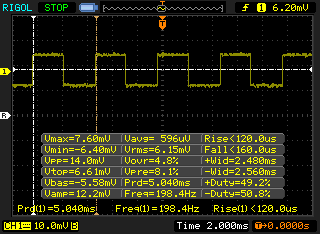 |
De achtergrondverlichting van het scherm flikkert op 198.4 Hz (in het slechtste geval, bijvoorbeeld bij gebruik van PWM) aan een helderheid van 98 % en lager. Boven deze helderheid zou er geen flickering / PWM mogen optreden. De frequentie van 198.4 Hz is redelijk laag en de meeste mensen die gevoelig zijn aan flickering kunnen dit dus waarnemen of geïrriteerde ogen krijgen (gebruikmakend van de vermelde helderheid en lager). Ter vergelijking: 52 % van alle geteste toestellen maakten geen gebruik van PWM om de schermhelderheid te verlagen. Als het wel werd gebruikt, werd een gemiddelde van 7794 (minimum: 5 - maximum: 343500) Hz waargenomen. | |||
* ... kleiner is beter
| PCMark 8 Home Score Accelerated v2 | 3537 punten | |
| PCMark 8 Work Score Accelerated v2 | 5032 punten | |
| PCMark 10 Score | 4069 punten | |
Help | ||
| Dell Inspiron 14 5000 5482 2-in-1 SK Hynix BC501 NVMe 256 GB | Lenovo Yoga 530-14IKB-81EK00CWGE SK hynix PC401 HFS256GD9TNG | Asus VivoBook Flip 14 TP412UA-DB51T Micron 1100 MTFDDAV256TBN | Dell XPS 13 9365-4537 2-in-1 Toshiba NVMe THNSN5256GPUK | Lenovo Yoga C930-13IKB SK hynix PC401 HFS256GD9TNG | Huawei Matebook X Pro i5 Samsung PM961 MZVLW256HEHP | |
|---|---|---|---|---|---|---|
| AS SSD | 13% | -41% | -22% | -5% | 51% | |
| Seq Read (MB/s) | 576 | 2071 260% | 437.9 -24% | 1342 133% | 1850 221% | 2416 319% |
| Seq Write (MB/s) | 471.6 | 721 53% | 350.3 -26% | 543 15% | 661 40% | 1170 148% |
| 4K Read (MB/s) | 39.48 | 34.44 -13% | 23.31 -41% | 34.77 -12% | 38.04 -4% | 48.33 22% |
| 4K Write (MB/s) | 112.4 | 91 -19% | 64.7 -42% | 85.8 -24% | 95 -15% | 103.1 -8% |
| 4K-64 Read (MB/s) | 522 | 448.2 -14% | 234.3 -55% | 512 -2% | 434.3 -17% | 1039 99% |
| 4K-64 Write (MB/s) | 416.5 | 268.9 -35% | 279.4 -33% | 249.4 -40% | 266.3 -36% | 399.6 -4% |
| Access Time Read * (ms) | 0.046 | 0.046 -0% | 0.079 -72% | 0.169 -267% | 0.069 -50% | 0.058 -26% |
| Access Time Write * (ms) | 0.032 | 0.054 -69% | 0.056 -75% | 0.041 -28% | 0.056 -75% | 0.036 -13% |
| Score Read (Points) | 619 | 690 11% | 301 -51% | 681 10% | 657 6% | 1329 115% |
| Score Write (Points) | 576 | 432 -25% | 379 -34% | 389 -32% | 427 -26% | 620 8% |
| Score Total (Points) | 1520 | 1416 -7% | 839 -45% | 1388 -9% | 1373 -10% | 2575 69% |
| Copy ISO MB/s (MB/s) | 773 | 414.4 -46% | 714 -8% | 539 -30% | 739 -4% | |
| Copy Program MB/s (MB/s) | 344.4 | 364.3 6% | 264.7 -23% | 209.7 -39% | 312.3 -9% | |
| Copy Game MB/s (MB/s) | 536 | 354 -34% | 457.8 -15% | 340 -37% | 486.3 -9% | |
| CrystalDiskMark 5.2 / 6 | 12% | -48% | 1% | 19% | ||
| Write 4K (MB/s) | 111.8 | 123.1 10% | 66.5 -41% | 94.5 -15% | 116.5 4% | |
| Read 4K (MB/s) | 42.6 | 43.24 2% | 24.65 -42% | 39.95 -6% | 42.18 -1% | |
| Write Seq (MB/s) | 716 | 763 7% | 413.2 -42% | 531 -26% | 1079 51% | |
| Read Seq (MB/s) | 1107 | 1632 47% | 465.2 -58% | 1499 35% | 1030 -7% | |
| Write 4K Q32T1 (MB/s) | 451.5 | 268.6 -41% | 227 -50% | 315.3 -30% | 225.7 -50% | |
| Read 4K Q32T1 (MB/s) | 316.8 | 345.2 9% | 188.4 -41% | 279.8 -12% | 302.9 -4% | |
| Write Seq Q32T1 (MB/s) | 809 | 800 -1% | 439.9 -46% | 829 2% | 1174 45% | |
| Read Seq Q32T1 (MB/s) | 1610 | 2620 63% | 533 -67% | 2570 60% | 3394 111% | |
| Write 4K Q8T8 (MB/s) | 332 | |||||
| Read 4K Q8T8 (MB/s) | 488.6 | |||||
| Totaal Gemiddelde (Programma / Instellingen) | 13% /
13% | -45% /
-44% | -22% /
-22% | -2% /
-3% | 35% /
39% |
* ... kleiner is beter

| 3DMark 06 Standard Score | 10342 punten | |
| 3DMark 11 Performance | 1911 punten | |
| 3DMark Cloud Gate Standard Score | 8073 punten | |
| 3DMark Fire Strike Score | 1025 punten | |
Help | ||
| lage | gem. | hoge | ultra | |
|---|---|---|---|---|
| BioShock Infinite (2013) | 51.1 | 30.3 | 24.5 | 7.6 |
| Rocket League (2017) | 50.6 | 24.3 | 15.7 | |
| Shadow of the Tomb Raider (2018) | 12 |
| Dell Inspiron 14 5000 5482 2-in-1 UHD Graphics 620, i7-8565U, SK Hynix BC501 NVMe 256 GB | Lenovo Yoga 530-14IKB-81EK00CWGE UHD Graphics 620, i5-8250U, SK hynix PC401 HFS256GD9TNG | Asus VivoBook Flip 14 TP412UA-DB51T UHD Graphics 620, i5-8250U, Micron 1100 MTFDDAV256TBN | Huawei Matebook X Pro i5 GeForce MX150, i5-8250U, Samsung PM961 MZVLW256HEHP | Microsoft Surface Laptop i7 Iris Plus Graphics 640, i7-7660U, Samsung PM971 KUS040202M | Lenovo ThinkPad A485-20MU000CGE Vega 8, R5 PRO 2500U, Samsung SSD PM981 MZVLB256HAHQ | |
|---|---|---|---|---|---|---|
| Noise | -3% | -2% | -3% | -10% | 2% | |
| uit / omgeving * (dB) | 28.2 | 30.3 -7% | 28.4 -1% | 27.9 1% | 30.5 -8% | 29.3 -4% |
| Idle Minimum * (dB) | 28.2 | 30.3 -7% | 28.4 -1% | 27.9 1% | 30.9 -10% | 29.3 -4% |
| Idle Average * (dB) | 28.2 | 30.3 -7% | 28.4 -1% | 27.9 1% | 30.9 -10% | 29.3 -4% |
| Idle Maximum * (dB) | 29.4 | 30.3 -3% | 28.4 3% | 27.9 5% | 30.9 -5% | 29.6 -1% |
| Load Average * (dB) | 35.8 | 36.1 -1% | 35.7 -0% | 36.2 -1% | 40.2 -12% | 31.6 12% |
| Load Maximum * (dB) | 35.8 | 33.9 5% | 39 -9% | 45.2 -26% | 40.2 -12% | 31.6 12% |
| Witcher 3 ultra * (dB) | 45 |
* ... kleiner is beter
Geluidsniveau
| Onbelast |
| 28.2 / 28.2 / 29.4 dB (A) |
| Belasting |
| 35.8 / 35.8 dB (A) |
 | ||
30 dB stil 40 dB(A) hoorbaar 50 dB(A) luid |
||
min: | ||
(+) De maximumtemperatuur aan de bovenzijde bedraagt 33.2 °C / 92 F, vergeleken met het gemiddelde van 35.4 °C / 96 F, variërend van 19.6 tot 60 °C voor de klasse Convertible.
(±) De bodem warmt op tot een maximum van 42.6 °C / 109 F, vergeleken met een gemiddelde van 36.9 °C / 98 F
(+) Bij onbelast gebruik bedraagt de gemiddelde temperatuur voor de bovenzijde 23.9 °C / 75 F, vergeleken met het apparaatgemiddelde van 30.3 °C / 87 F.
(+) De palmsteunen en het touchpad zijn met een maximum van ###max## °C / 75.6 F koeler dan de huidtemperatuur en voelen daarom koel aan.
(+) De gemiddelde temperatuur van de handpalmsteun van soortgelijke toestellen bedroeg 28 °C / 82.4 F (+3.8 °C / 6.8 F).
Dell Inspiron 14 5000 5482 2-in-1 audioanalyse
(-) | niet erg luide luidsprekers (68.2 dB)
Bas 100 - 315 Hz
(-) | bijna geen lage tonen - gemiddeld 16.4% lager dan de mediaan
(±) | lineariteit van de lage tonen is gemiddeld (8.9% delta ten opzichte van de vorige frequentie)
Midden 400 - 2000 Hz
(+) | evenwichtige middens - slechts 4.2% verwijderd van de mediaan
(±) | lineariteit van de middentonen is gemiddeld (7.3% delta ten opzichte van de vorige frequentie)
Hoog 2 - 16 kHz
(+) | evenwichtige hoogtepunten - slechts 3.4% verwijderd van de mediaan
(±) | lineariteit van de hoogtepunten is gemiddeld (8.6% delta ten opzichte van de vorige frequentie)
Algemeen 100 - 16.000 Hz
(±) | lineariteit van het totale geluid is gemiddeld (20.1% verschil met de mediaan)
Vergeleken met dezelfde klasse
» 51% van alle geteste apparaten in deze klasse waren beter, 6% vergelijkbaar, 44% slechter
» De beste had een delta van 6%, het gemiddelde was 20%, de slechtste was 57%
Vergeleken met alle geteste toestellen
» 52% van alle geteste apparaten waren beter, 8% gelijk, 40% slechter
» De beste had een delta van 4%, het gemiddelde was 24%, de slechtste was 134%
Apple MacBook 12 (Early 2016) 1.1 GHz audioanalyse
(+) | luidsprekers kunnen relatief luid spelen (83.6 dB)
Bas 100 - 315 Hz
(±) | verminderde zeebaars - gemiddeld 11.3% lager dan de mediaan
(±) | lineariteit van de lage tonen is gemiddeld (14.2% delta ten opzichte van de vorige frequentie)
Midden 400 - 2000 Hz
(+) | evenwichtige middens - slechts 2.4% verwijderd van de mediaan
(+) | de middentonen zijn lineair (5.5% delta ten opzichte van de vorige frequentie)
Hoog 2 - 16 kHz
(+) | evenwichtige hoogtepunten - slechts 2% verwijderd van de mediaan
(+) | de hoge tonen zijn lineair (4.5% delta naar de vorige frequentie)
Algemeen 100 - 16.000 Hz
(+) | het totale geluid is lineair (10.2% verschil met de mediaan)
Vergeleken met dezelfde klasse
» 7% van alle geteste apparaten in deze klasse waren beter, 2% vergelijkbaar, 91% slechter
» De beste had een delta van 5%, het gemiddelde was 18%, de slechtste was 53%
Vergeleken met alle geteste toestellen
» 5% van alle geteste apparaten waren beter, 1% gelijk, 94% slechter
» De beste had een delta van 4%, het gemiddelde was 24%, de slechtste was 134%
| Uit / Standby | |
| Inactief | |
| Belasting |
|
Key:
min: | |
| Dell Inspiron 14 5000 5482 2-in-1 i7-8565U, UHD Graphics 620, SK Hynix BC501 NVMe 256 GB, IPS, 1920x1080, 14" | Lenovo Yoga 530-14IKB-81EK00CWGE i5-8250U, UHD Graphics 620, SK hynix PC401 HFS256GD9TNG, IPS, 1920x1080, 14" | Asus VivoBook Flip 14 TP412UA-DB51T i5-8250U, UHD Graphics 620, Micron 1100 MTFDDAV256TBN, IPS, 1920x1080, 14" | Dell XPS 13 9365-4537 2-in-1 i5-7Y54, HD Graphics 615, Toshiba NVMe THNSN5256GPUK, IPS, 3200x1800, 13.3" | Lenovo Yoga C930-13IKB i5-8250U, UHD Graphics 620, SK hynix PC401 HFS256GD9TNG, IPS, 1920x1080, 13.9" | Huawei Matebook X Pro i5 i5-8250U, GeForce MX150, Samsung PM961 MZVLW256HEHP, IPS, 3000x2000, 13.9" | |
|---|---|---|---|---|---|---|
| Power Consumption | 13% | 18% | -37% | -10% | -31% | |
| Idle Minimum * (Watt) | 3.4 | 3.3 3% | 3.3 3% | 8.2 -141% | 3.3 3% | 3.5 -3% |
| Idle Average * (Watt) | 6.4 | 5.8 9% | 5.2 19% | 10.8 -69% | 6.8 -6% | 8.9 -39% |
| Idle Maximum * (Watt) | 7.8 | 8 -3% | 5.6 28% | 12.7 -63% | 9.5 -22% | 12.3 -58% |
| Load Average * (Watt) | 36.7 | 29.2 20% | 32.9 10% | 22.6 38% | 40.8 -11% | 54.2 -48% |
| Load Maximum * (Watt) | 49.3 | 31.1 37% | 35.2 29% | 24.6 50% | 57 -16% | 52.1 -6% |
| Witcher 3 ultra * (Watt) | 42.4 |
* ... kleiner is beter
| Dell Inspiron 14 5000 5482 2-in-1 i7-8565U, UHD Graphics 620, 42 Wh | Lenovo Yoga 530-14IKB-81EK00CWGE i5-8250U, UHD Graphics 620, 45 Wh | Asus VivoBook Flip 14 TP412UA-DB51T i5-8250U, UHD Graphics 620, 42 Wh | Dell XPS 13 9365-4537 2-in-1 i5-7Y54, HD Graphics 615, 46 Wh | Lenovo Yoga C930-13IKB i5-8250U, UHD Graphics 620, 60 Wh | Huawei Matebook X Pro i5 i5-8250U, GeForce MX150, 57.4 Wh | |
|---|---|---|---|---|---|---|
| Batterijduur | 13% | 33% | -6% | 54% | 48% | |
| Reader / Idle (h) | 12.4 | 15.3 23% | 23.9 93% | 20.7 67% | ||
| WiFi v1.3 (h) | 7.2 | 7 -3% | 9.6 33% | 6.8 -6% | 9.2 28% | 9.3 29% |
| Load (h) | 1.5 | 1.8 20% | 2.1 40% | 2.2 47% |
Pro
Contra
Voor het volledige, Engelse testrapport, klik hier.
De nieuwste Inspiron-cabriolet is een goed gebalanceerd apparaat. De notebook heeft geen uniek verkooppunt in vergelijking met zijn concurrenten om potentiële kopers te overtuigen. Kleine voordelen, zoals een helderder beeldscherm, een gratis WACOM-pen of sneller opladen, hadden de aantrekkingskracht van het systeem kunnen vergroten en zouden het apparaat beter onderscheiden van de rest.
Vanwege de zeer betaalbare startprijs en het 1080p-aanraakscherm is de Inspiron 14 5482 2-in-1 het meest geschikt voor gebruik door studenten en multimedia-gebruikers. Alternatieven zoals de Yoga 530 en VivoBook Flip 14 zijn inderdaad kleiner en lichter, maar worden verkocht voor iets hogere prijzen.
Een goed gebalanceerd instapmodel voor beginners. Het is een betaalbare back-to-school optie, zelfs als het niet iets buitengewoons biedt voor zijn categorie.
Dell Inspiron 14 5000 5482 2-in-1
- 07-12-2018 v6 (old)
Allen Ngo
Price comparison
