Kort testrapport Asus ZenBook 14 UX433F (i7-8565U) Laptop
| SD Card Reader | |
| average JPG Copy Test (av. of 3 runs) | |
| HP Spectre x360 13-ae048ng (Toshiba Exceria Pro M501 microSDXC 64GB) | |
| Dell XPS 13 9370 i7 UHD (Toshiba Exceria Pro UHS-II) | |
| Asus Zenbook UX430UN (Toshiba Exceria Pro SDXC 64 GB UHS-II) | |
| Asus ZenBook 14 UX433FA (Toshiba Exceria Pro M501 microSDXC) | |
| maximum AS SSD Seq Read Test (1GB) | |
| Dell XPS 13 9370 i7 UHD (Toshiba Exceria Pro UHS-II) | |
| HP Spectre x360 13-ae048ng (Toshiba Exceria Pro M501 microSDXC 64GB) | |
| Asus Zenbook UX430UN (Toshiba Exceria Pro SDXC 64 GB UHS-II) | |
| Asus ZenBook 14 UX433FA (Toshiba Exceria Pro M501 microSDXC) | |
| Networking | |
| iperf3 transmit AX12 | |
| Asus ZenBook 14 UX433FA | |
| Huawei Matebook X Pro i5 | |
| Dell XPS 13 9370 i7 UHD | |
| Asus Zenbook UX430UN | |
| iperf3 receive AX12 | |
| Dell XPS 13 9370 i7 UHD | |
| Huawei Matebook X Pro i5 | |
| Asus Zenbook UX430UN | |
| Asus ZenBook 14 UX433FA | |
| |||||||||||||||||||||||||
Helderheidsverdeling: 87 %
Helderheid in Batterij-modus: 332.8 cd/m²
Contrast: 1148:1 (Zwart: 0.29 cd/m²)
ΔE ColorChecker Calman: 5.14 | ∀{0.5-29.43 Ø4.72}
calibrated: 3.61
ΔE Greyscale Calman: 8.8 | ∀{0.09-98 Ø4.97}
89.2% sRGB (Argyll 1.6.3 3D)
58.1% AdobeRGB 1998 (Argyll 1.6.3 3D)
65.1% AdobeRGB 1998 (Argyll 3D)
89.7% sRGB (Argyll 3D)
64.3% Display P3 (Argyll 3D)
Gamma: 2.33
CCT: 8227 K
| Asus ZenBook 14 UX433FA AU Optronics B140HAN03.2, IPS, 14", 1920x1080 | Apple MacBook Air 2018 APPA039, IPS, 13.3", 2560x1600 | Dell XPS 13 9370 i7 UHD ID: Sharp SHP148B, Name: LQ133D1, Dell P/N: 8XDHY, IPS, 13.3", 3840x2160 | Huawei Matebook X Pro i5 Tianma XM, IPS, 13.9", 3000x2000 | Lenovo Yoga C930-13IKB 81C4 AUO B139HAN03_0, IPS, 13.9", 1920x1080 | Asus Zenbook UX430UN NV140FHM-N62, BOE0718, IPS, 14", 1920x1080 | |
|---|---|---|---|---|---|---|
| Display | 6% | 8% | 4% | 0% | -3% | |
| Display P3 Coverage (%) | 64.3 | 67.8 5% | 68.9 7% | 65.9 2% | 62.7 -2% | 64.6 0% |
| sRGB Coverage (%) | 89.7 | 96.1 7% | 98.4 10% | 95.2 6% | 92.6 3% | 84.8 -5% |
| AdobeRGB 1998 Coverage (%) | 65.1 | 69.8 7% | 69.5 7% | 67.6 4% | 64.7 -1% | 62 -5% |
| Response Times | -9% | -80% | -5% | 3% | -37% | |
| Response Time Grey 50% / Grey 80% * (ms) | 39.6 ? | 39.6 ? -0% | 69.6 ? -76% | 40.4 ? -2% | 34.4 ? 13% | 43.6 ? -10% |
| Response Time Black / White * (ms) | 24 ? | 28 ? -17% | 44 ? -83% | 25.6 ? -7% | 25.6 ? -7% | 39.2 ? -63% |
| PWM Frequency (Hz) | 113600 ? | 3759 ? | 200 ? | |||
| Screen | 31% | 25% | 23% | -11% | 6% | |
| Brightness middle (cd/m²) | 332.8 | 320 -4% | 478.5 44% | 442.7 33% | 312 -6% | 310.4 -7% |
| Brightness (cd/m²) | 310 | 315 2% | 466 50% | 428 38% | 295 -5% | 303 -2% |
| Brightness Distribution (%) | 87 | 95 9% | 86 -1% | 84 -3% | 87 0% | 89 2% |
| Black Level * (cd/m²) | 0.29 | 0.29 -0% | 0.43 -48% | 0.31 -7% | 0.43 -48% | 0.31 -7% |
| Contrast (:1) | 1148 | 1103 -4% | 1113 -3% | 1428 24% | 726 -37% | 1001 -13% |
| Colorchecker dE 2000 * | 5.14 | 1.2 77% | 3.09 40% | 2.24 56% | 7.6 -48% | 4.07 21% |
| Colorchecker dE 2000 max. * | 11.88 | 3.2 73% | 5.94 50% | 7.19 39% | 15.06 -27% | 8.33 30% |
| Colorchecker dE 2000 calibrated * | 3.61 | 0.5 86% | 2.06 43% | 1.11 69% | 1.96 46% | 4.07 -13% |
| Greyscale dE 2000 * | 8.8 | 0.8 91% | 2.4 73% | 9.7 -10% | 8.8 -0% | 2.8 68% |
| Gamma | 2.33 94% | 2.2 100% | 2.063 107% | 1.42 155% | 2.01 109% | 2.217 99% |
| CCT | 8227 79% | 6548 99% | 6883 94% | 6227 104% | 6874 95% | 7033 92% |
| Color Space (Percent of AdobeRGB 1998) (%) | 58.1 | 62.1 7% | 69.47 20% | 61.6 6% | 59.1 2% | 55.3 -5% |
| Color Space (Percent of sRGB) (%) | 89.2 | 96 8% | 98.36 10% | 95 7% | 92.3 3% | 84.6 -5% |
| Totaal Gemiddelde (Programma / Instellingen) | 9% /
22% | -16% /
9% | 7% /
16% | -3% /
-7% | -11% /
-1% |
* ... kleiner is beter
Responstijd Scherm
| ↔ Responstijd Zwart naar Wit | ||
|---|---|---|
| 24 ms ... stijging ↗ en daling ↘ gecombineerd | ↗ 14.4 ms stijging | 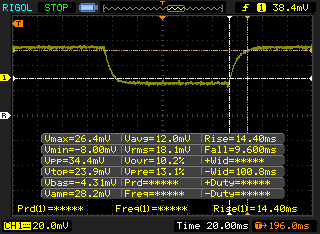 |
| ↘ 9.6 ms daling | ||
| Het scherm vertoonde prima responstijden in onze tests maar is misschien wat te traag voor competitieve games. Ter vergelijking: alle testtoestellen variëren van 0.1 (minimum) tot 240 (maximum) ms. » 54 % van alle toestellen zijn beter. Dit betekent dat de gemeten responstijd slechter is dan het gemiddelde (19.8 ms) van alle geteste toestellen. | ||
| ↔ Responstijd 50% Grijs naar 80% Grijs | ||
| 39.6 ms ... stijging ↗ en daling ↘ gecombineerd | ↗ 21.2 ms stijging | 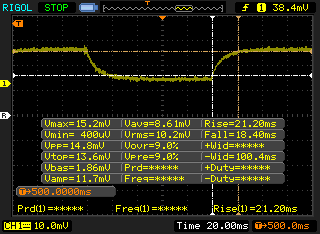 |
| ↘ 18.4 ms daling | ||
| Het scherm vertoonde trage responstijden in onze tests en is misschien te traag voor games. Ter vergelijking: alle testtoestellen variëren van 0.165 (minimum) tot 636 (maximum) ms. » 60 % van alle toestellen zijn beter. Dit betekent dat de gemeten responstijd slechter is dan het gemiddelde (31 ms) van alle geteste toestellen. | ||
Screen Flickering / PWM (Pulse-Width Modulation)
| Screen flickering / PWM niet waargenomen | 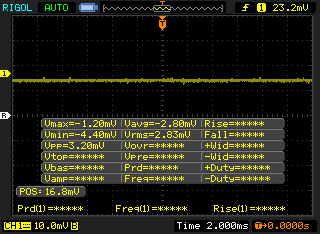 | ||
Ter vergelijking: 52 % van alle geteste toestellen maakten geen gebruik van PWM om de schermhelderheid te verlagen. Als het wel werd gebruikt, werd een gemiddelde van 7781 (minimum: 5 - maximum: 343500) Hz waargenomen. | |||
| Cinebench R11.5 | |
| CPU Single 64Bit | |
| Asus ZenBook 14 UX433FA | |
| Dell XPS 15 9575 i7-8705G | |
| Asus FX504GD | |
| Asus Zenbook UX430UN | |
| CPU Multi 64Bit | |
| Dell XPS 15 9575 i7-8705G | |
| Asus ZenBook 14 UX433FA | |
| Asus Zenbook UX430UN | |
| Asus FX504GD | |
| Cinebench R10 | |
| Rendering Multiple CPUs 32Bit | |
| Dell XPS 15 9575 i7-8705G | |
| Asus FX504GD | |
| Asus ZenBook 14 UX433FA | |
| Asus Zenbook UX430UN | |
| Lenovo Ideapad 720S-13ARR | |
| Rendering Single 32Bit | |
| Asus ZenBook 14 UX433FA | |
| Asus FX504GD | |
| Asus Zenbook UX430UN | |
| Dell XPS 15 9575 i7-8705G | |
| Lenovo Ideapad 720S-13ARR | |
| wPrime 2.10 - 1024m | |
| Asus Zenbook UX430UN | |
| Asus ZenBook 14 UX433FA | |
| Asus FX504GD | |
| Dell XPS 15 9575 i7-8705G | |
* ... kleiner is beter
| PCMark 8 Home Score Accelerated v2 | 3285 punten | |
| PCMark 8 Work Score Accelerated v2 | 4851 punten | |
| PCMark 10 Score | 3736 punten | |
Help | ||
| Asus ZenBook 14 UX433FA WDC PC SN520 SDAPNUW-512G | Dell XPS 13 9370 i7 UHD Toshiba XG5 KXG50ZNV512G | Huawei Matebook X Pro i5 Samsung PM961 MZVLW256HEHP | Lenovo Yoga C930-13IKB 81C4 SK hynix PC401 HFS256GD9TNG | Asus Zenbook UX430UN SanDisk SD8SN8U512G1002 | HP Spectre x360 13-ae048ng Toshiba NVMe THNSN51T02DUK | |
|---|---|---|---|---|---|---|
| AS SSD | -22% | -4% | -192% | -70% | -570% | |
| Seq Read (MB/s) | 1201 | 2205 84% | 2416 101% | 1228 2% | 494.4 -59% | 1574 31% |
| Seq Write (MB/s) | 931 | 435.8 -53% | 1170 26% | 544 -42% | 300.3 -68% | 377.1 -59% |
| 4K Read (MB/s) | 40.25 | 29.36 -27% | 48.33 20% | 39.16 -3% | 25.39 -37% | 31.73 -21% |
| 4K Write (MB/s) | 111.5 | 107.4 -4% | 103.1 -8% | 106.5 -4% | 47.88 -57% | 1.73 -98% |
| 4K-64 Read (MB/s) | 916 | 678 -26% | 1039 13% | 466.4 -49% | 366 -60% | 115.6 -87% |
| 4K-64 Write (MB/s) | 871 | 444.8 -49% | 399.6 -54% | 305.1 -65% | 183.5 -79% | 2.09 -100% |
| Access Time Read * (ms) | 0.05 | 0.059 -18% | 0.058 -16% | 0.46 -820% | 0.089 -78% | 0.044 12% |
| Access Time Write * (ms) | 0.032 | 0.055 -72% | 0.036 -13% | 0.51 -1494% | 0.088 -175% | 2.391 -7372% |
| Score Read (Points) | 1076 | 926 -14% | 1329 24% | 628 -42% | 441 -59% | 305 -72% |
| Score Write (Points) | 1075 | 596 -45% | 620 -42% | 466 -57% | 261 -76% | 42 -96% |
| Score Total (Points) | 2696 | 1911 -29% | 2575 -4% | 1394 -48% | 926 -66% | 455 -83% |
| Copy ISO MB/s (MB/s) | 1153 | 585 -49% | 739 -36% | 628 -46% | 467.6 -59% | 1205 5% |
| Copy Program MB/s (MB/s) | 415.1 | 570 37% | 312.3 -25% | 540 30% | 270.5 -35% | 281.8 -32% |
| Copy Game MB/s (MB/s) | 930 | 503 -46% | 486.3 -48% | 533 -43% | 225.1 -76% | 856 -8% |
* ... kleiner is beter

| 3DMark 06 Standard Score | 11207 punten | |
| 3DMark Vantage P Result | 7761 punten | |
| 3DMark 11 Performance | 2201 punten | |
| 3DMark Ice Storm Standard Score | 64710 punten | |
| 3DMark Cloud Gate Standard Score | 9469 punten | |
| 3DMark Time Spy Score | 461 punten | |
Help | ||
| lage | gem. | hoge | ultra | |
|---|---|---|---|---|
| BioShock Infinite (2013) | 78.5 | 38.1 | 31.8 | 9.7 |
| Rise of the Tomb Raider (2016) | 22.8 | 13.7 | 7.2 | 5.7 |
| Rocket League (2017) | 71.4 | 32.9 | 21.1 |
| Asus ZenBook 14 UX433FA UHD Graphics 620, i7-8565U, WDC PC SN520 SDAPNUW-512G | Dell XPS 13 9370 i7 UHD UHD Graphics 620, i5-8550U, Toshiba XG5 KXG50ZNV512G | Huawei Matebook X Pro i5 GeForce MX150, i5-8250U, Samsung PM961 MZVLW256HEHP | Asus Zenbook UX430UN GeForce MX150, i5-8550U, SanDisk SD8SN8U512G1002 | Lenovo Yoga C930-13IKB 81C4 UHD Graphics 620, i5-8550U, SK hynix PC401 HFS256GD9TNG | HP Spectre x360 13-ae048ng UHD Graphics 620, i5-8550U, Toshiba NVMe THNSN51T02DUK | |
|---|---|---|---|---|---|---|
| Noise | 4% | 1% | -4% | 4% | 2% | |
| uit / omgeving * (dB) | 28.8 | 28 3% | 27.9 3% | 28.3 2% | 27.9 3% | 30.13 -5% |
| Idle Minimum * (dB) | 28.8 | 28 3% | 27.9 3% | 28.9 -0% | 27.9 3% | 30.13 -5% |
| Idle Average * (dB) | 28.8 | 28 3% | 27.9 3% | 30 -4% | 27.9 3% | 30 -4% |
| Idle Maximum * (dB) | 29.1 | 28 4% | 27.9 4% | 30.2 -4% | 29.3 -1% | 30.13 -4% |
| Load Average * (dB) | 36.1 | 32.5 10% | 36.2 -0% | 41.8 -16% | 32 11% | 33.4 7% |
| Load Maximum * (dB) | 41.2 | 42.2 -2% | 45.2 -10% | 42 -2% | 39.3 5% | 33 20% |
| Witcher 3 ultra * (dB) | 45 | 42 |
* ... kleiner is beter
Geluidsniveau
| Onbelast |
| 28.8 / 28.8 / 29.1 dB (A) |
| Belasting |
| 36.1 / 41.2 dB (A) |
 | ||
30 dB stil 40 dB(A) hoorbaar 50 dB(A) luid |
||
min: | ||
(±) De maximumtemperatuur aan de bovenzijde bedraagt 42.4 °C / 108 F, vergeleken met het gemiddelde van 35.9 °C / 97 F, variërend van 21.4 tot 59 °C voor de klasse Subnotebook.
(±) De bodem warmt op tot een maximum van 45 °C / 113 F, vergeleken met een gemiddelde van 39.2 °C / 103 F
(+) Bij onbelast gebruik bedraagt de gemiddelde temperatuur voor de bovenzijde 28.5 °C / 83 F, vergeleken met het apparaatgemiddelde van 30.8 °C / 87 F.
(+) De palmsteunen en het touchpad zijn met een maximum van ###max## °C / 87.8 F koeler dan de huidtemperatuur en voelen daarom koel aan.
(-) De gemiddelde temperatuur van de handpalmsteun van soortgelijke toestellen bedroeg 28.2 °C / 82.8 F (-2.8 °C / -5 F).
Asus ZenBook 14 UX433FA audioanalyse
(±) | luidspreker luidheid is gemiddeld maar goed (75.8 dB)
Bas 100 - 315 Hz
(±) | verminderde zeebaars - gemiddeld 13.8% lager dan de mediaan
(±) | lineariteit van de lage tonen is gemiddeld (10.6% delta ten opzichte van de vorige frequentie)
Midden 400 - 2000 Hz
(+) | evenwichtige middens - slechts 3.4% verwijderd van de mediaan
(+) | de middentonen zijn lineair (4.8% delta ten opzichte van de vorige frequentie)
Hoog 2 - 16 kHz
(±) | higher highs - on average 5.2% higher than median
(+) | de hoge tonen zijn lineair (6.1% delta naar de vorige frequentie)
Algemeen 100 - 16.000 Hz
(±) | lineariteit van het totale geluid is gemiddeld (16.1% verschil met de mediaan)
Vergeleken met dezelfde klasse
» 39% van alle geteste apparaten in deze klasse waren beter, 4% vergelijkbaar, 57% slechter
» De beste had een delta van 5%, het gemiddelde was 18%, de slechtste was 53%
Vergeleken met alle geteste toestellen
» 26% van alle geteste apparaten waren beter, 5% gelijk, 69% slechter
» De beste had een delta van 4%, het gemiddelde was 24%, de slechtste was 134%
Apple MacBook 12 (Early 2016) 1.1 GHz audioanalyse
(+) | luidsprekers kunnen relatief luid spelen (83.6 dB)
Bas 100 - 315 Hz
(±) | verminderde zeebaars - gemiddeld 11.3% lager dan de mediaan
(±) | lineariteit van de lage tonen is gemiddeld (14.2% delta ten opzichte van de vorige frequentie)
Midden 400 - 2000 Hz
(+) | evenwichtige middens - slechts 2.4% verwijderd van de mediaan
(+) | de middentonen zijn lineair (5.5% delta ten opzichte van de vorige frequentie)
Hoog 2 - 16 kHz
(+) | evenwichtige hoogtepunten - slechts 2% verwijderd van de mediaan
(+) | de hoge tonen zijn lineair (4.5% delta naar de vorige frequentie)
Algemeen 100 - 16.000 Hz
(+) | het totale geluid is lineair (10.2% verschil met de mediaan)
Vergeleken met dezelfde klasse
» 7% van alle geteste apparaten in deze klasse waren beter, 2% vergelijkbaar, 91% slechter
» De beste had een delta van 5%, het gemiddelde was 18%, de slechtste was 53%
Vergeleken met alle geteste toestellen
» 5% van alle geteste apparaten waren beter, 1% gelijk, 94% slechter
» De beste had een delta van 4%, het gemiddelde was 24%, de slechtste was 134%
| Uit / Standby | |
| Inactief | |
| Belasting |
|
Key:
min: | |
| Asus ZenBook 14 UX433FA i7-8565U, UHD Graphics 620, WDC PC SN520 SDAPNUW-512G, IPS, 1920x1080, 14" | Dell XPS 13 9370 i7 UHD i5-8550U, UHD Graphics 620, Toshiba XG5 KXG50ZNV512G, IPS, 3840x2160, 13.3" | Huawei Matebook X Pro i5 i5-8250U, GeForce MX150, Samsung PM961 MZVLW256HEHP, IPS, 3000x2000, 13.9" | Lenovo Yoga C930-13IKB 81C4 i5-8550U, UHD Graphics 620, SK hynix PC401 HFS256GD9TNG, IPS, 1920x1080, 13.9" | Asus Zenbook UX430UN i5-8550U, GeForce MX150, SanDisk SD8SN8U512G1002, IPS, 1920x1080, 14" | HP Spectre x360 13-ae048ng i5-8550U, UHD Graphics 620, Toshiba NVMe THNSN51T02DUK, IPS, 1920x1080, 13.3" | |
|---|---|---|---|---|---|---|
| Power Consumption | -18% | -26% | -21% | -1% | 12% | |
| Idle Minimum * (Watt) | 3.9 | 5 -28% | 3.5 10% | 3.4 13% | 3 23% | 3.2 18% |
| Idle Average * (Watt) | 5.9 | 8.3 -41% | 8.9 -51% | 7.5 -27% | 5.8 2% | 6 -2% |
| Idle Maximum * (Watt) | 8.8 | 8.8 -0% | 12.3 -40% | 11.8 -34% | 6.2 30% | 9.2 -5% |
| Load Average * (Watt) | 41.7 | 46.4 -11% | 54.2 -30% | 47.7 -14% | 54.1 -30% | 29.5 29% |
| Load Maximum * (Watt) | 44 | 48.6 -10% | 52.1 -18% | 63.2 -44% | 56.4 -28% | 35.6 19% |
| Witcher 3 ultra * (Watt) | 42.4 | 45.9 |
* ... kleiner is beter
| Asus ZenBook 14 UX433FA i7-8565U, UHD Graphics 620, 50 Wh | Apple MacBook Air 2018 i5-8210Y, UHD Graphics 617, 50.3 Wh | Dell XPS 13 9370 i7 UHD i5-8550U, UHD Graphics 620, 52 Wh | Huawei Matebook X Pro i5 i5-8250U, GeForce MX150, 57.4 Wh | Lenovo Yoga C930-13IKB 81C4 i5-8550U, UHD Graphics 620, 60 Wh | Asus Zenbook UX430UN i5-8550U, GeForce MX150, 50 Wh | HP Spectre x360 13-ae048ng i5-8550U, UHD Graphics 620, 60 Wh | |
|---|---|---|---|---|---|---|---|
| Batterijduur | -14% | -33% | -12% | 6% | -24% | -16% | |
| Reader / Idle (h) | 19.1 | 13.7 -28% | 20.7 8% | 17.3 -9% | |||
| WiFi v1.3 (h) | 10.5 | 11.1 6% | 7.8 -26% | 9.3 -11% | 11.1 6% | 9.3 -11% | 8.8 -16% |
| Load (h) | 3.3 | 2.2 -33% | 1.8 -45% | 2.2 -33% | 1.6 -52% | 2.8 -15% |
Pro
Contra
Dit is de verkorte versie van het originele artikel. Het volledige, Engelse testrapport vind je hier.
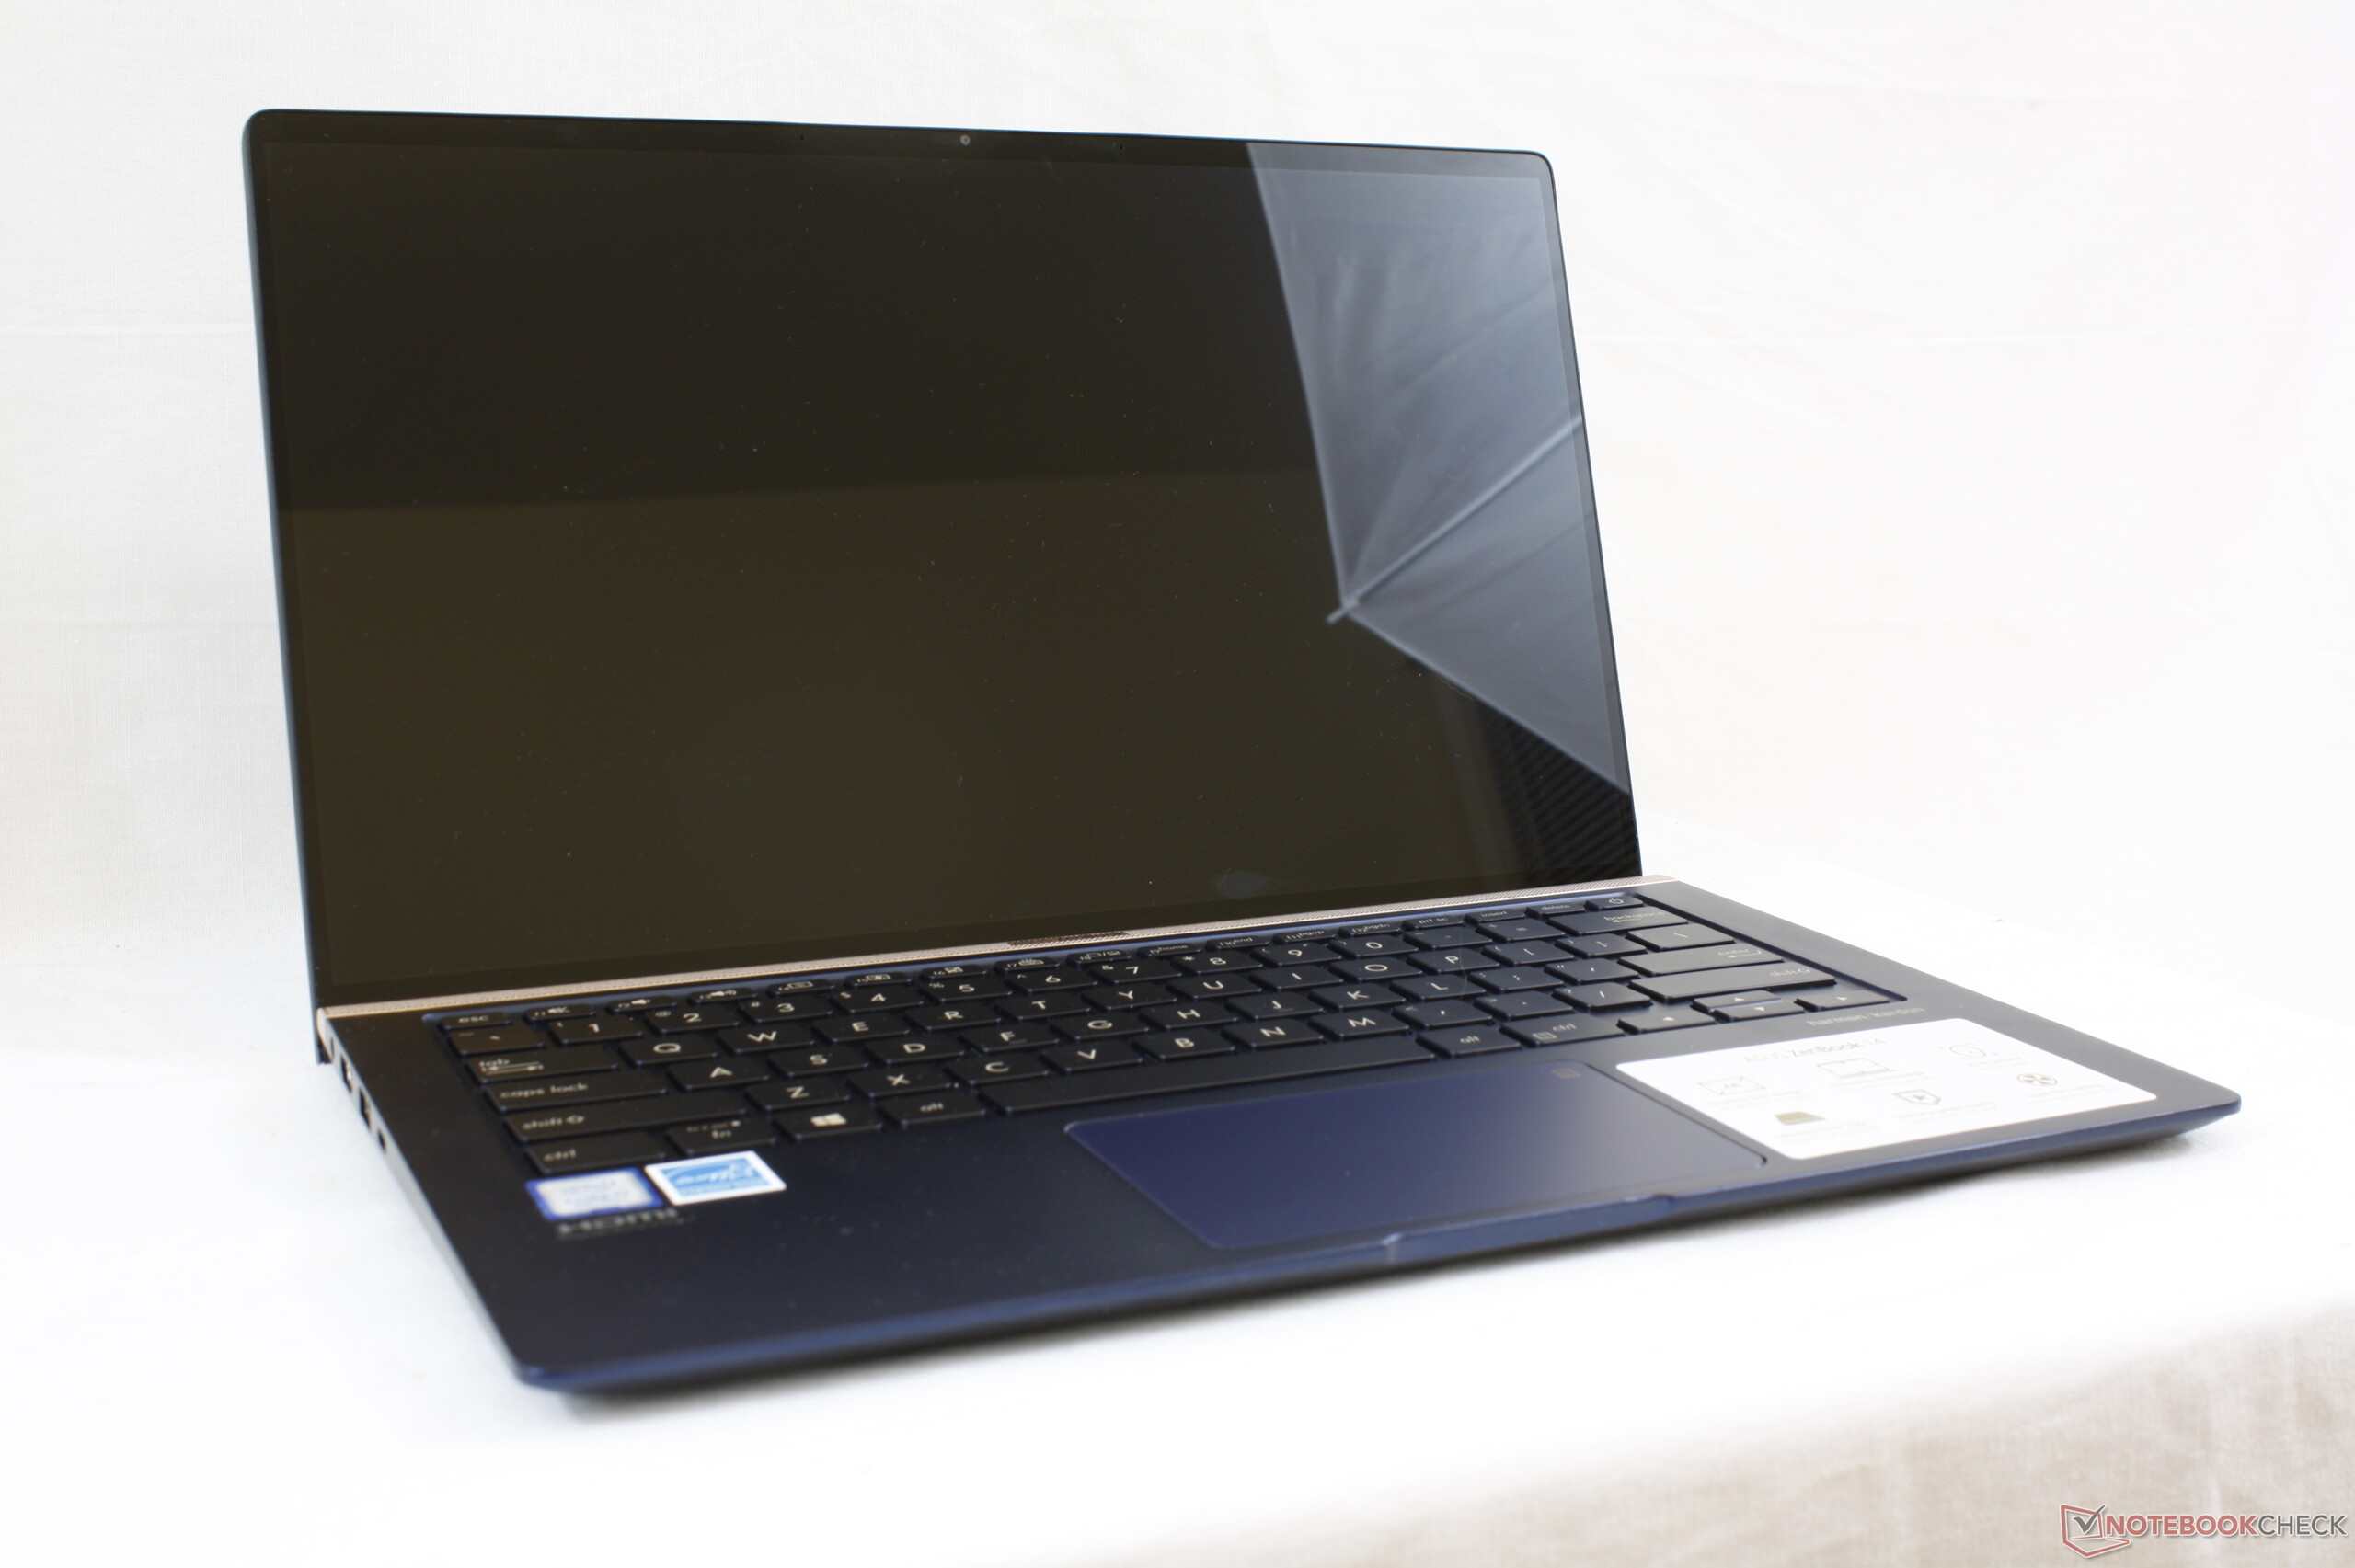
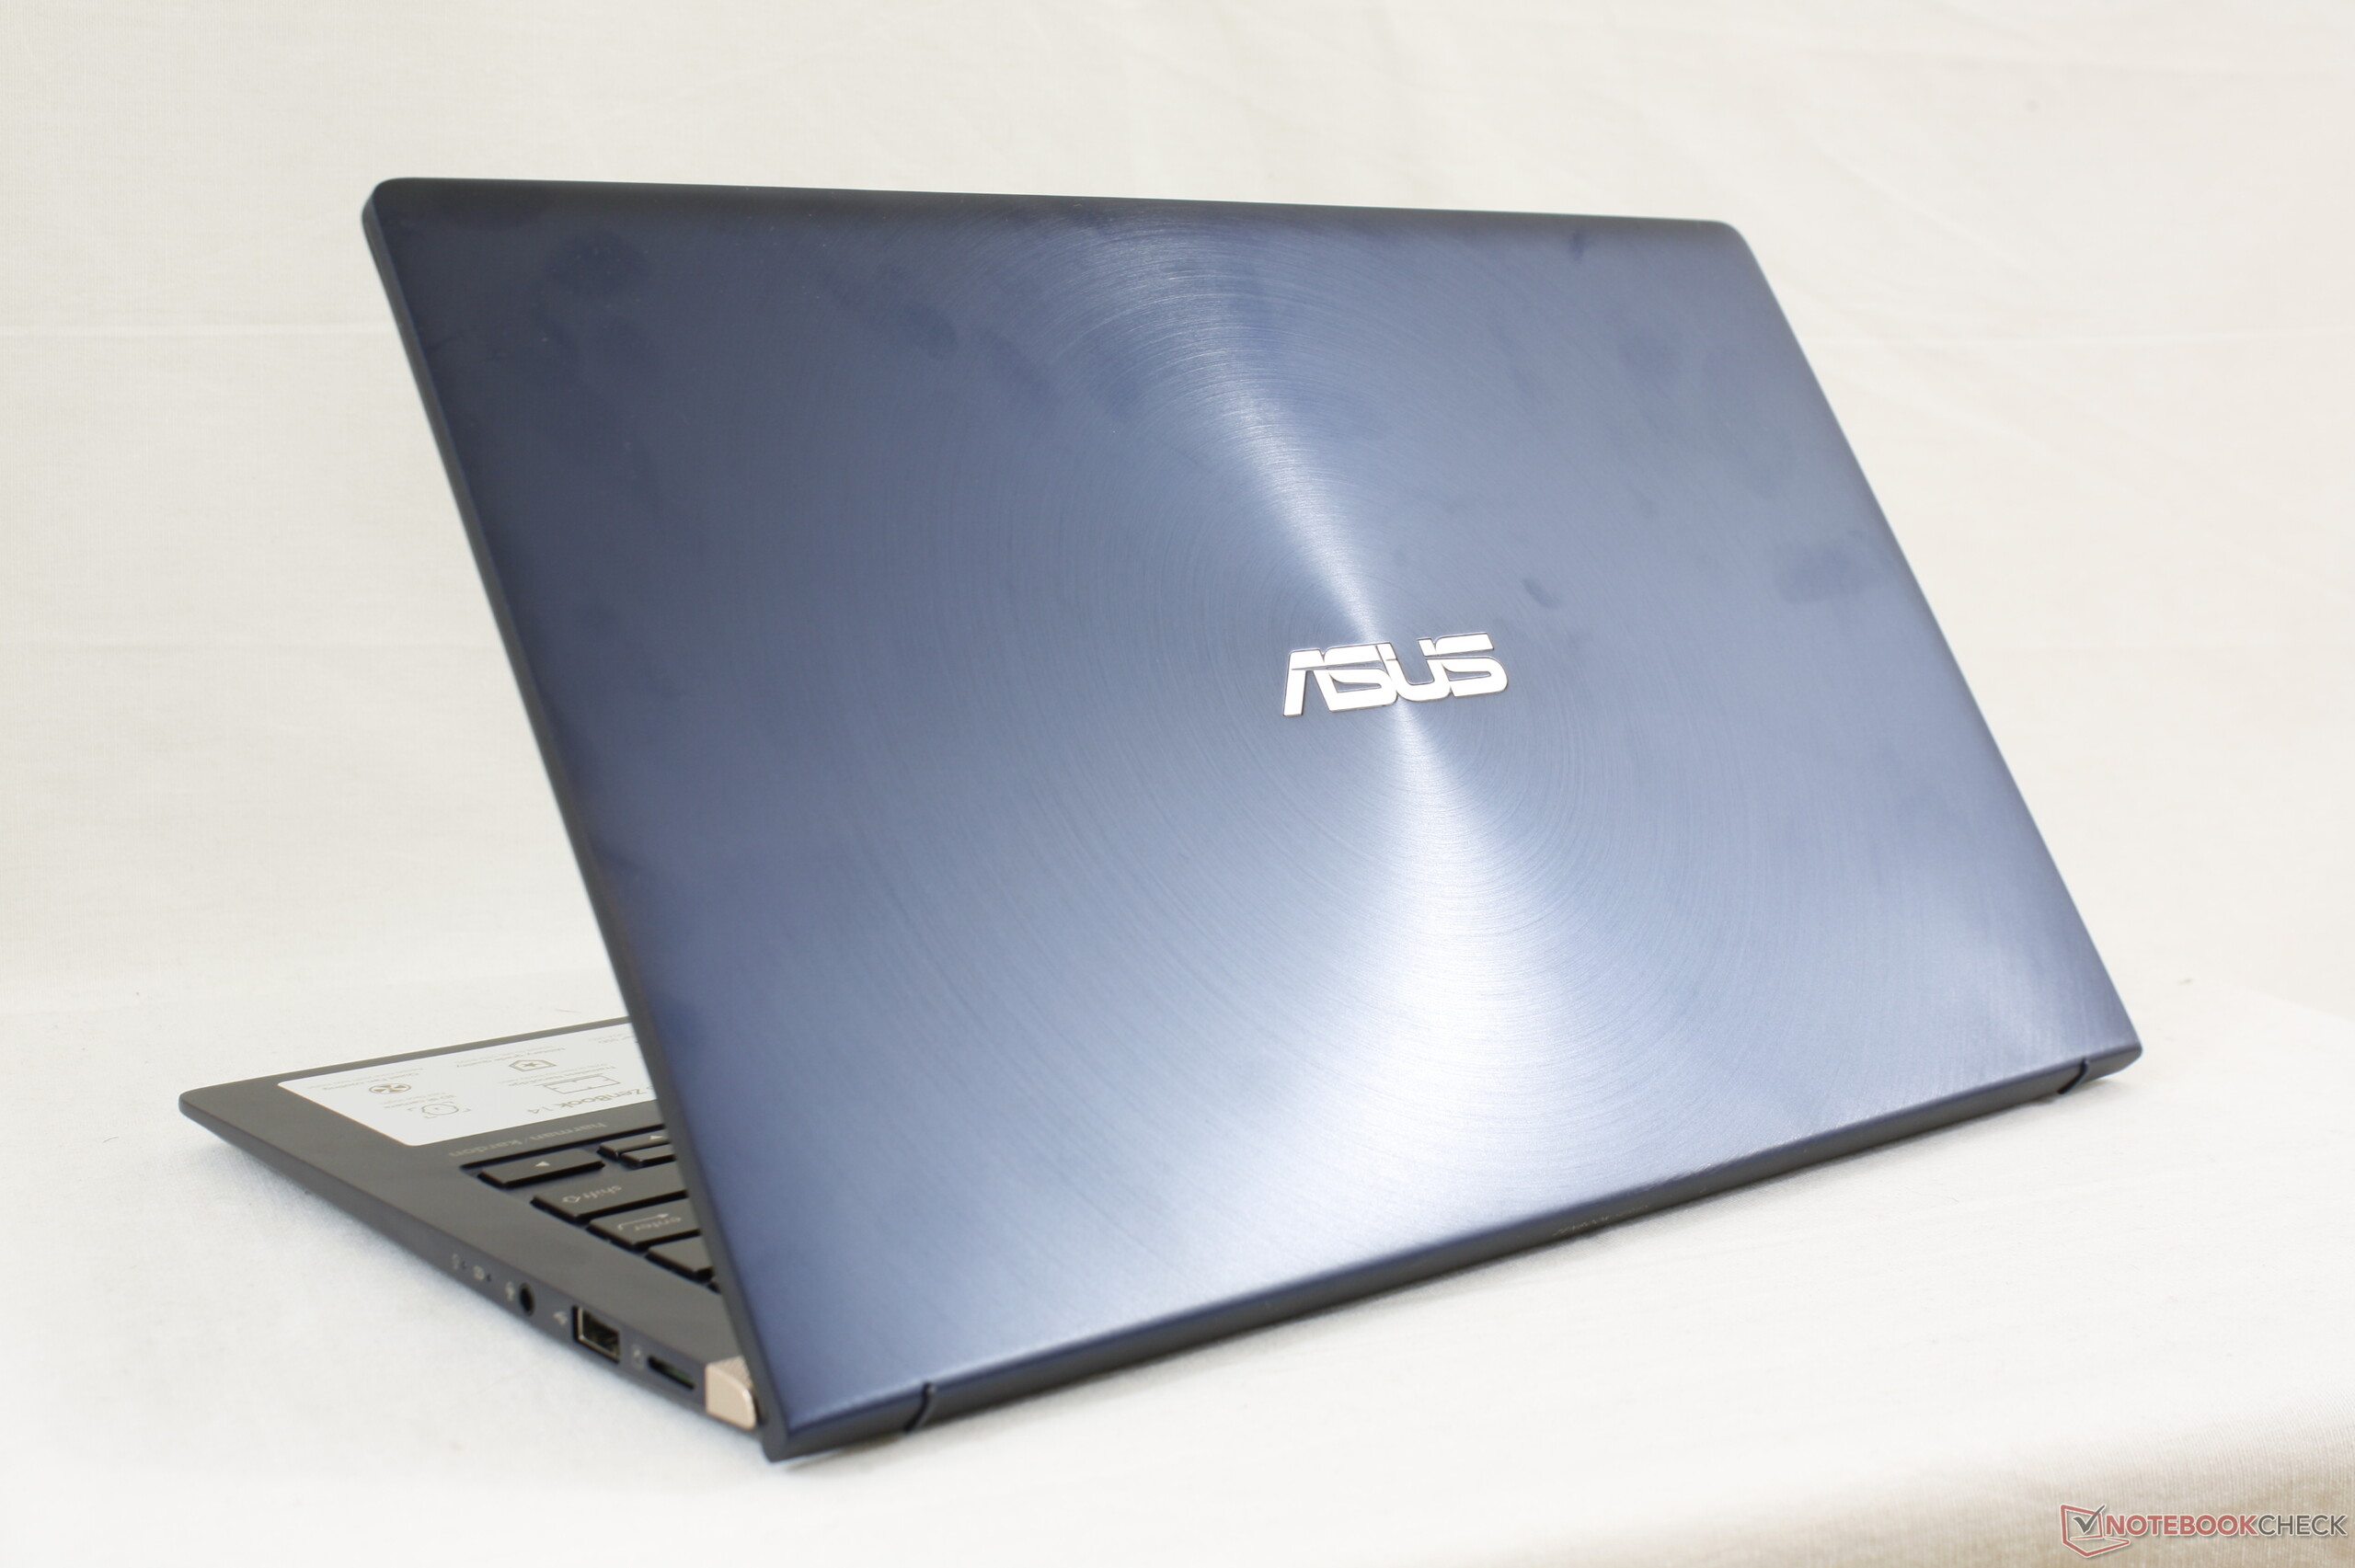
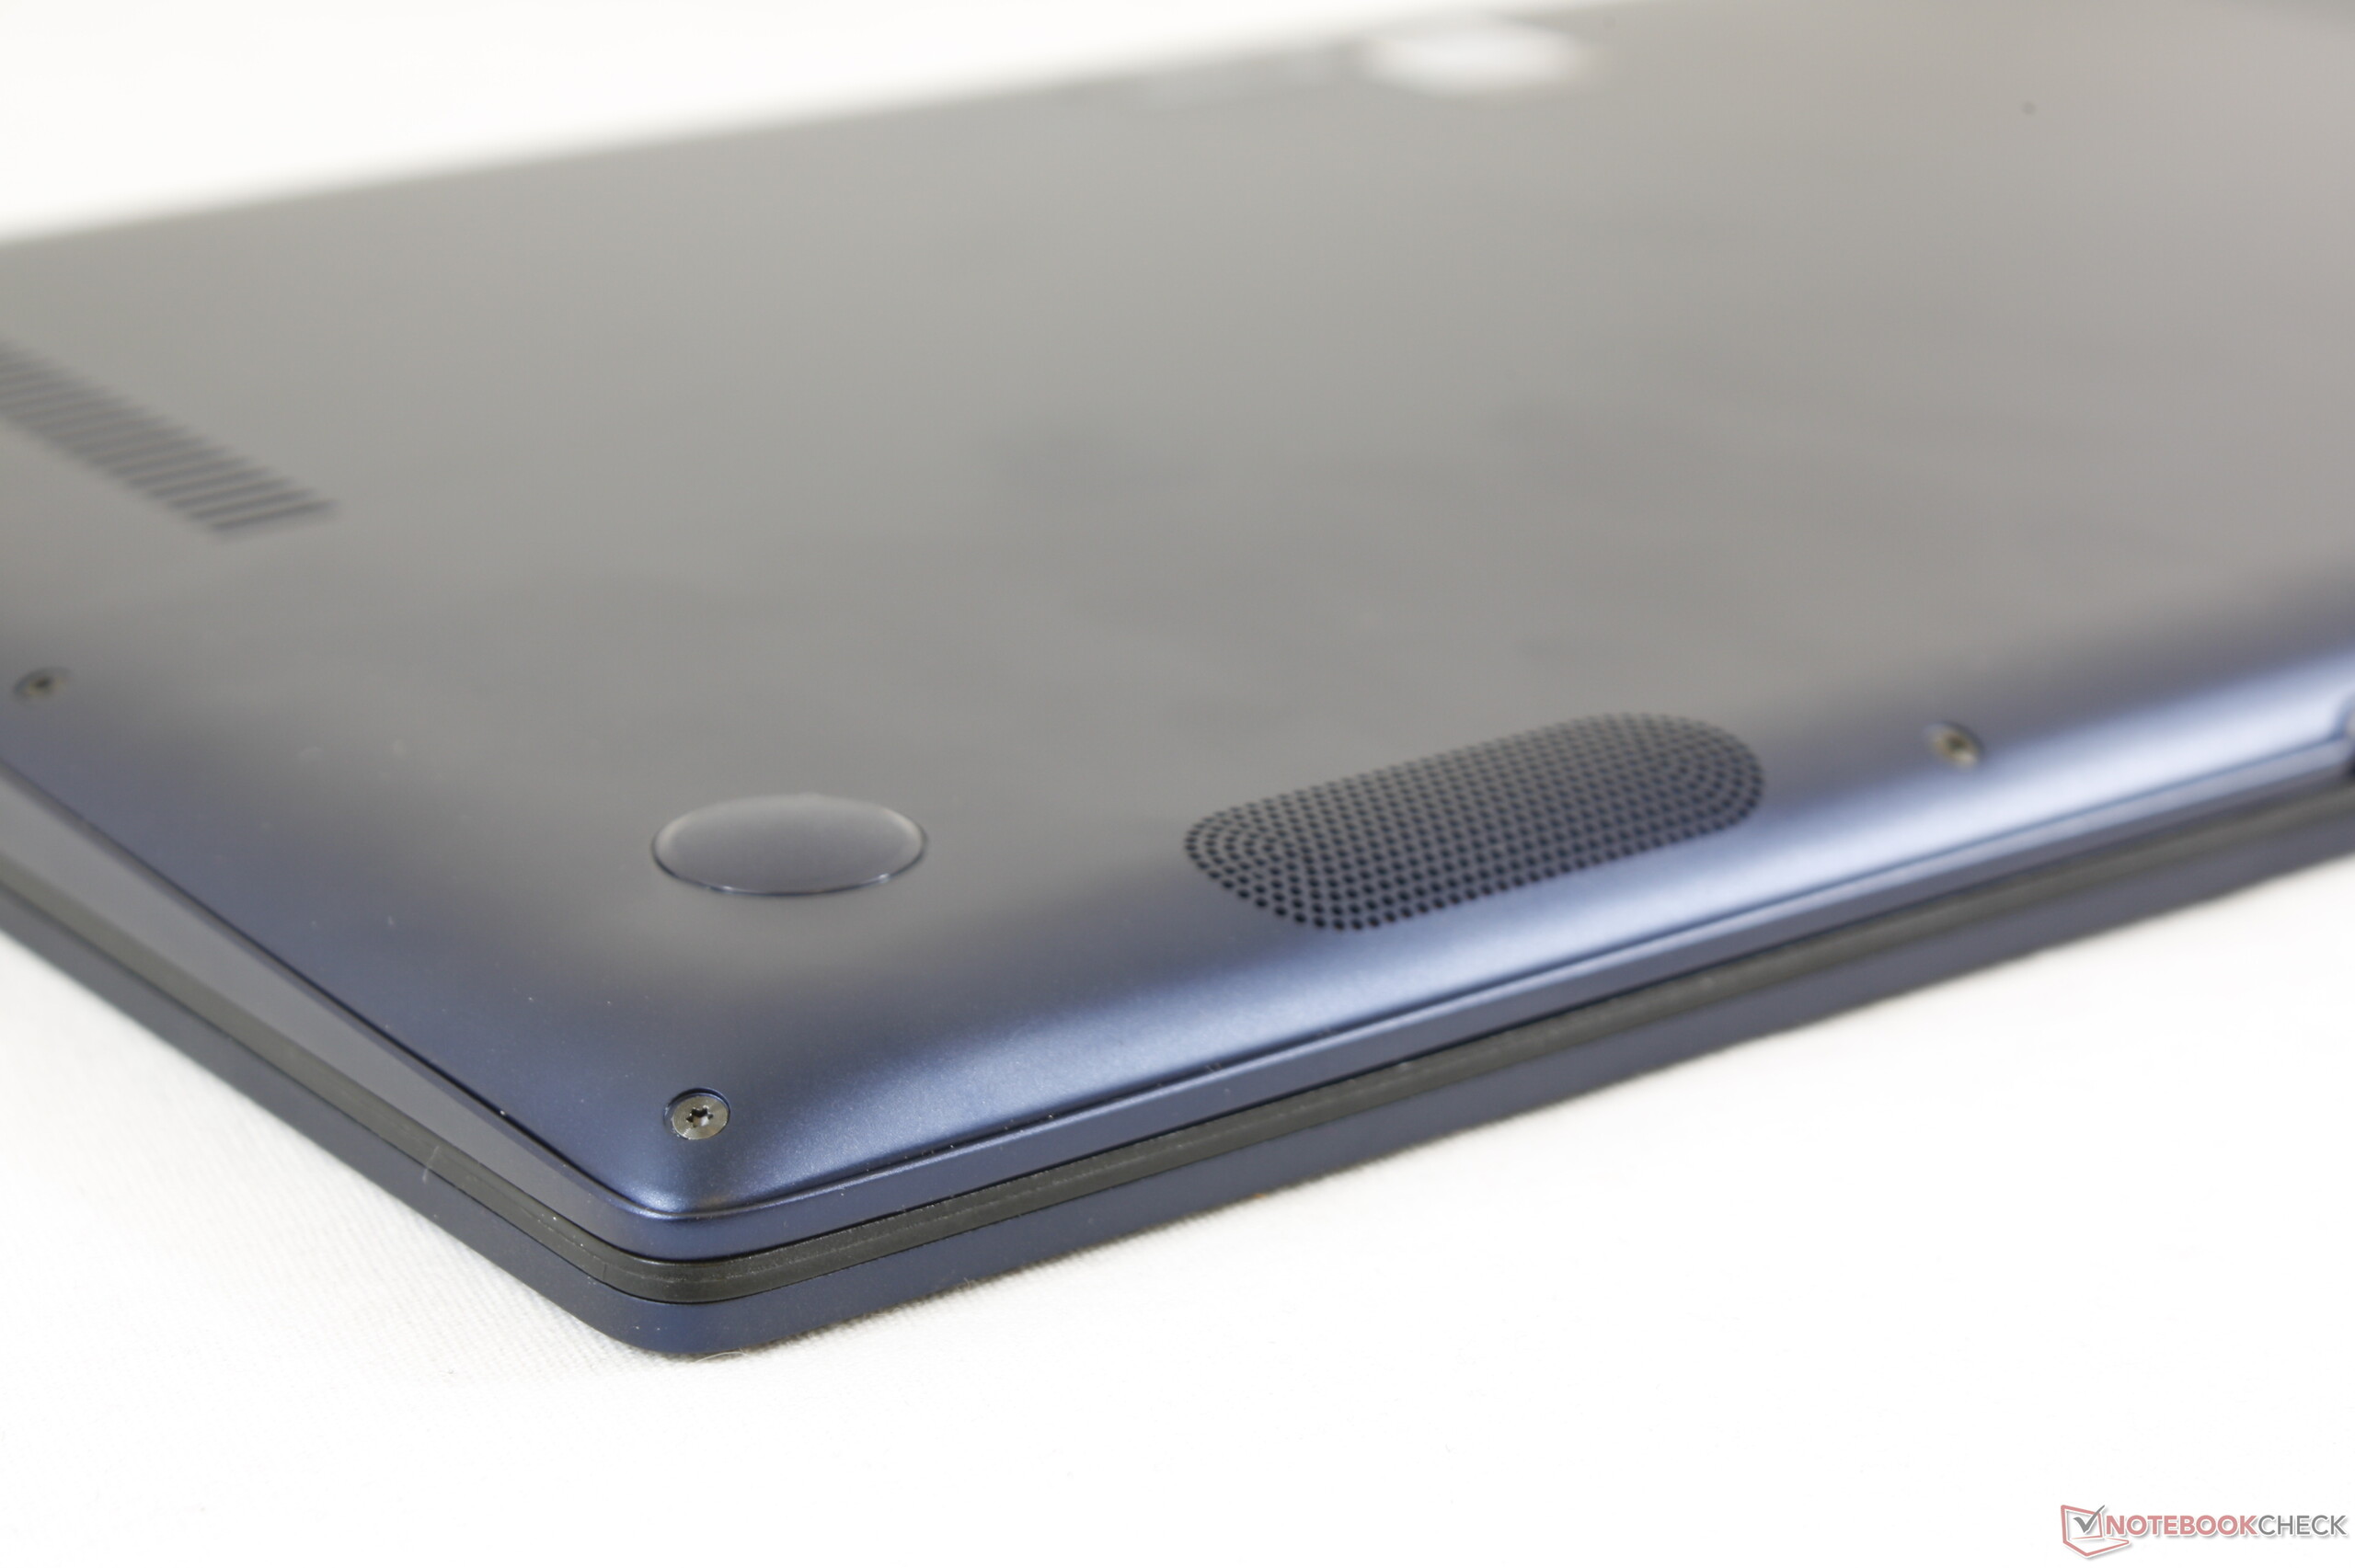
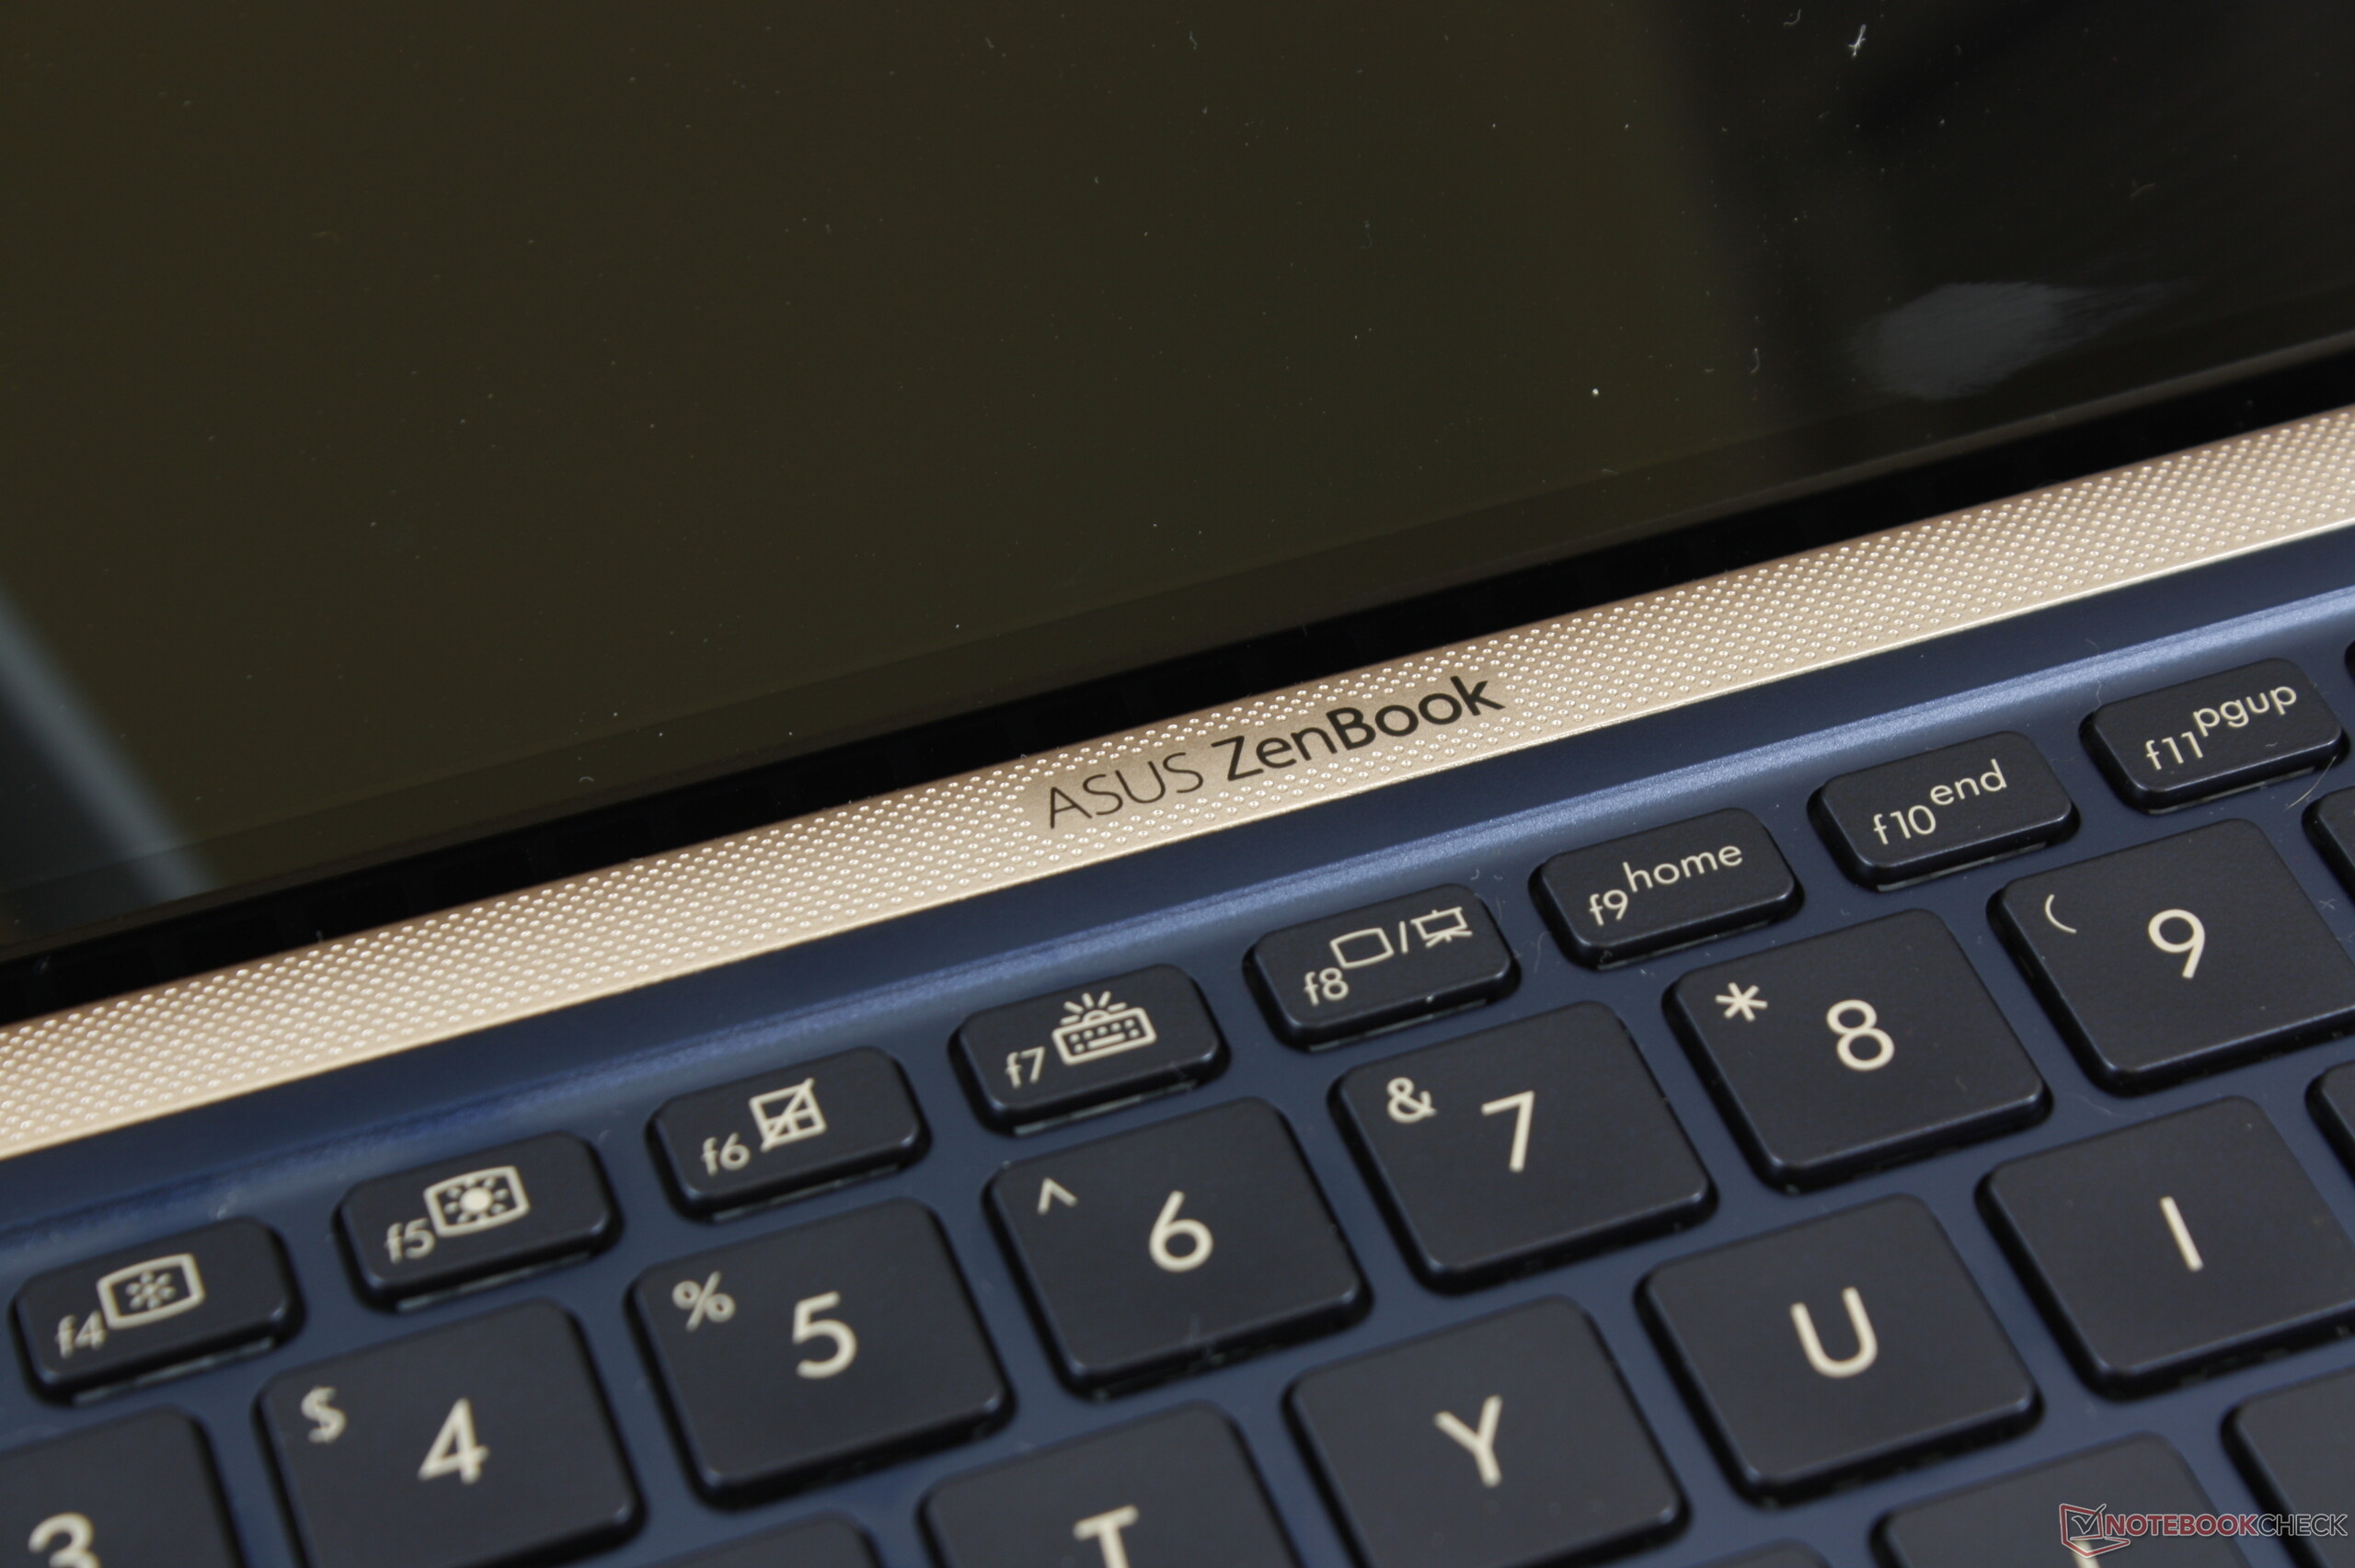
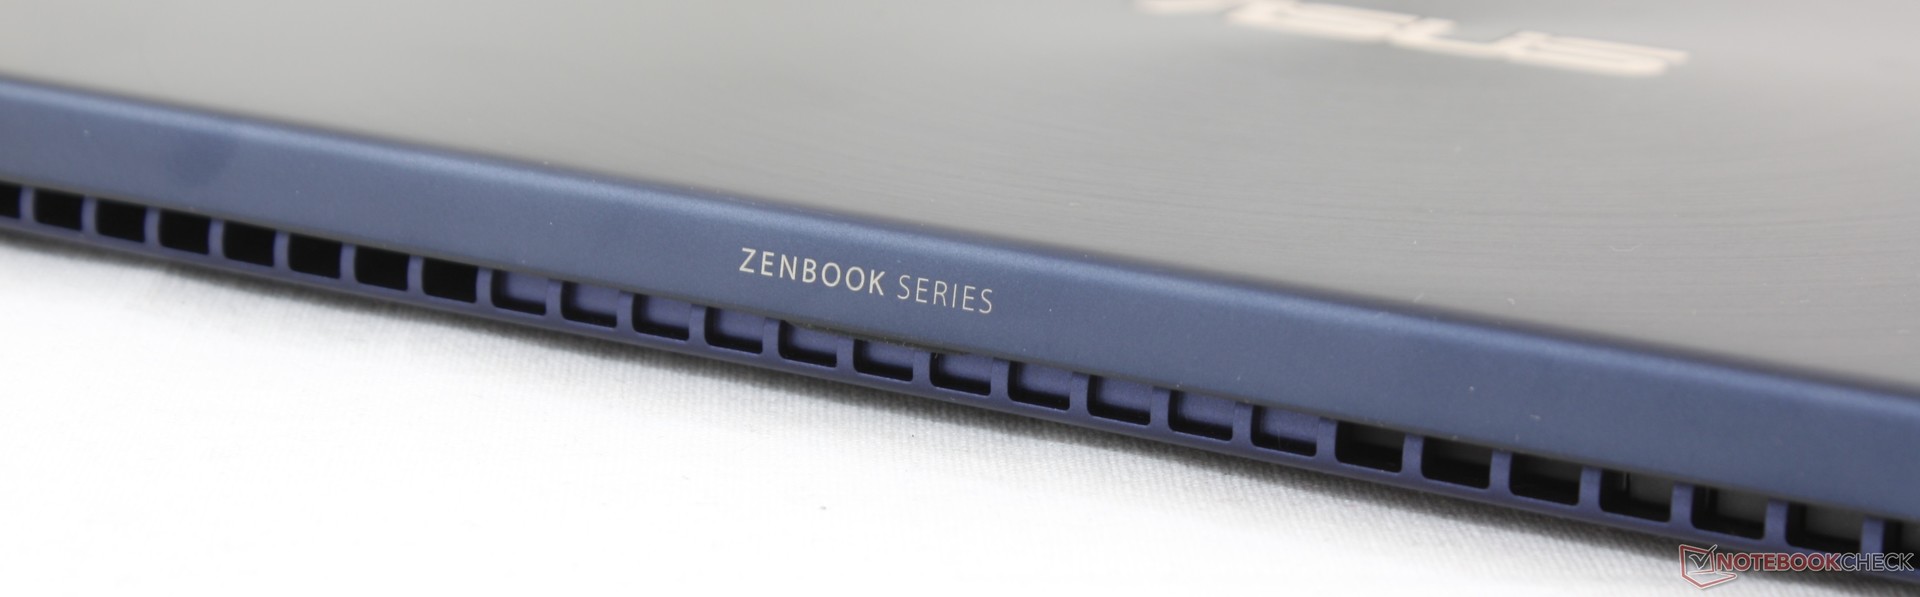
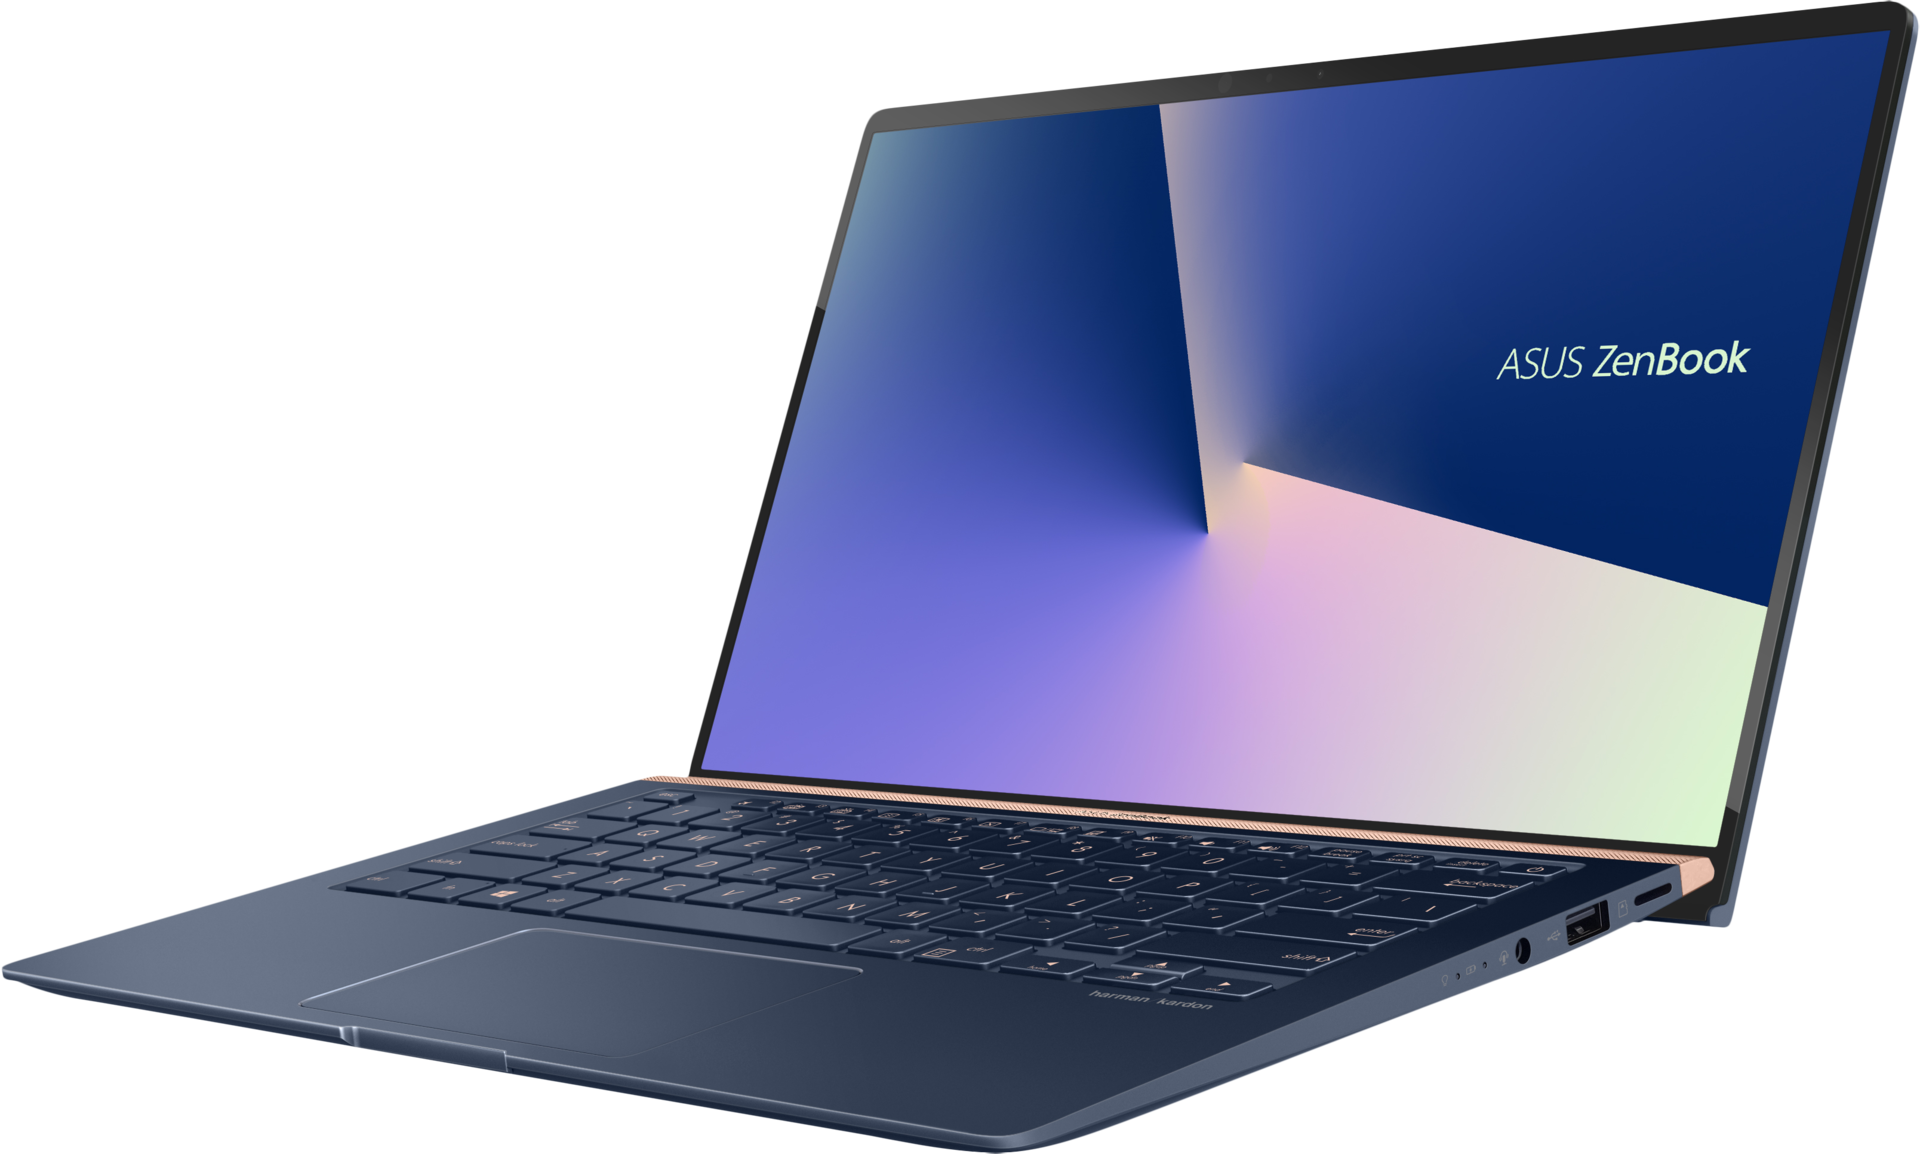
De markt van de ultrabooks telt steeds meer interessante opties waardoor het moeilijker wordt voor fabrikanten om zich van elkaar te onderscheiden. Toch slaagt Asus erin om ons te verrassen met unieke features zoals de UX580 ScreenPad en nu ook de NanoEdge-schermranden die de UX433 erg compact maken voor een 14-inch-schermformaat. Het nieuwe design is visueel uniek, maar blijft duidelijk "Zenbook" en verbetert de stabiliteit en connectiviteit van de vorige generatie. Het is de evolutionaire upgrade die we verwachtten, maar met een eigenheid die zowel visueel als ergonomisch weet te overtuigen.
We zijn erg tevreden met het feit dat de UX433 opties biedt voor een ontspiegeld en glanzend scherm en daarnaast een GeForce MX150. De meeste Ultrabooks zijn alleen verkrijgbaar met een glanzend scherm en een tragere geïntegreerde Intel-GPU.
Het zwakste punt van de UX433 is de performance van de CPU. De snelheid op zich stelt niet teleur, maar de Whiskey Lake-U-CPU is nauwelijks sneller dan Kaby Lake-R, waardoor gebruikers waarschijnlijk helemaal geen snelheidsverbetering zullen merken. Zelfs Asus is zich hiervan bewust, aangezien de officiële productpagina van de UX433 de vergelijking maakt tussen Whiskey Lake-U en Kaby Lake van de 7de generatie in plaats van Kaby Lake-R van de 8ste generatie om een grotere prestatiesprong te kunnen adverteren. We denken dat het systeem goedkoper en juist zo snel had kunnen zijn met de i7-8550U of i5-8250U.
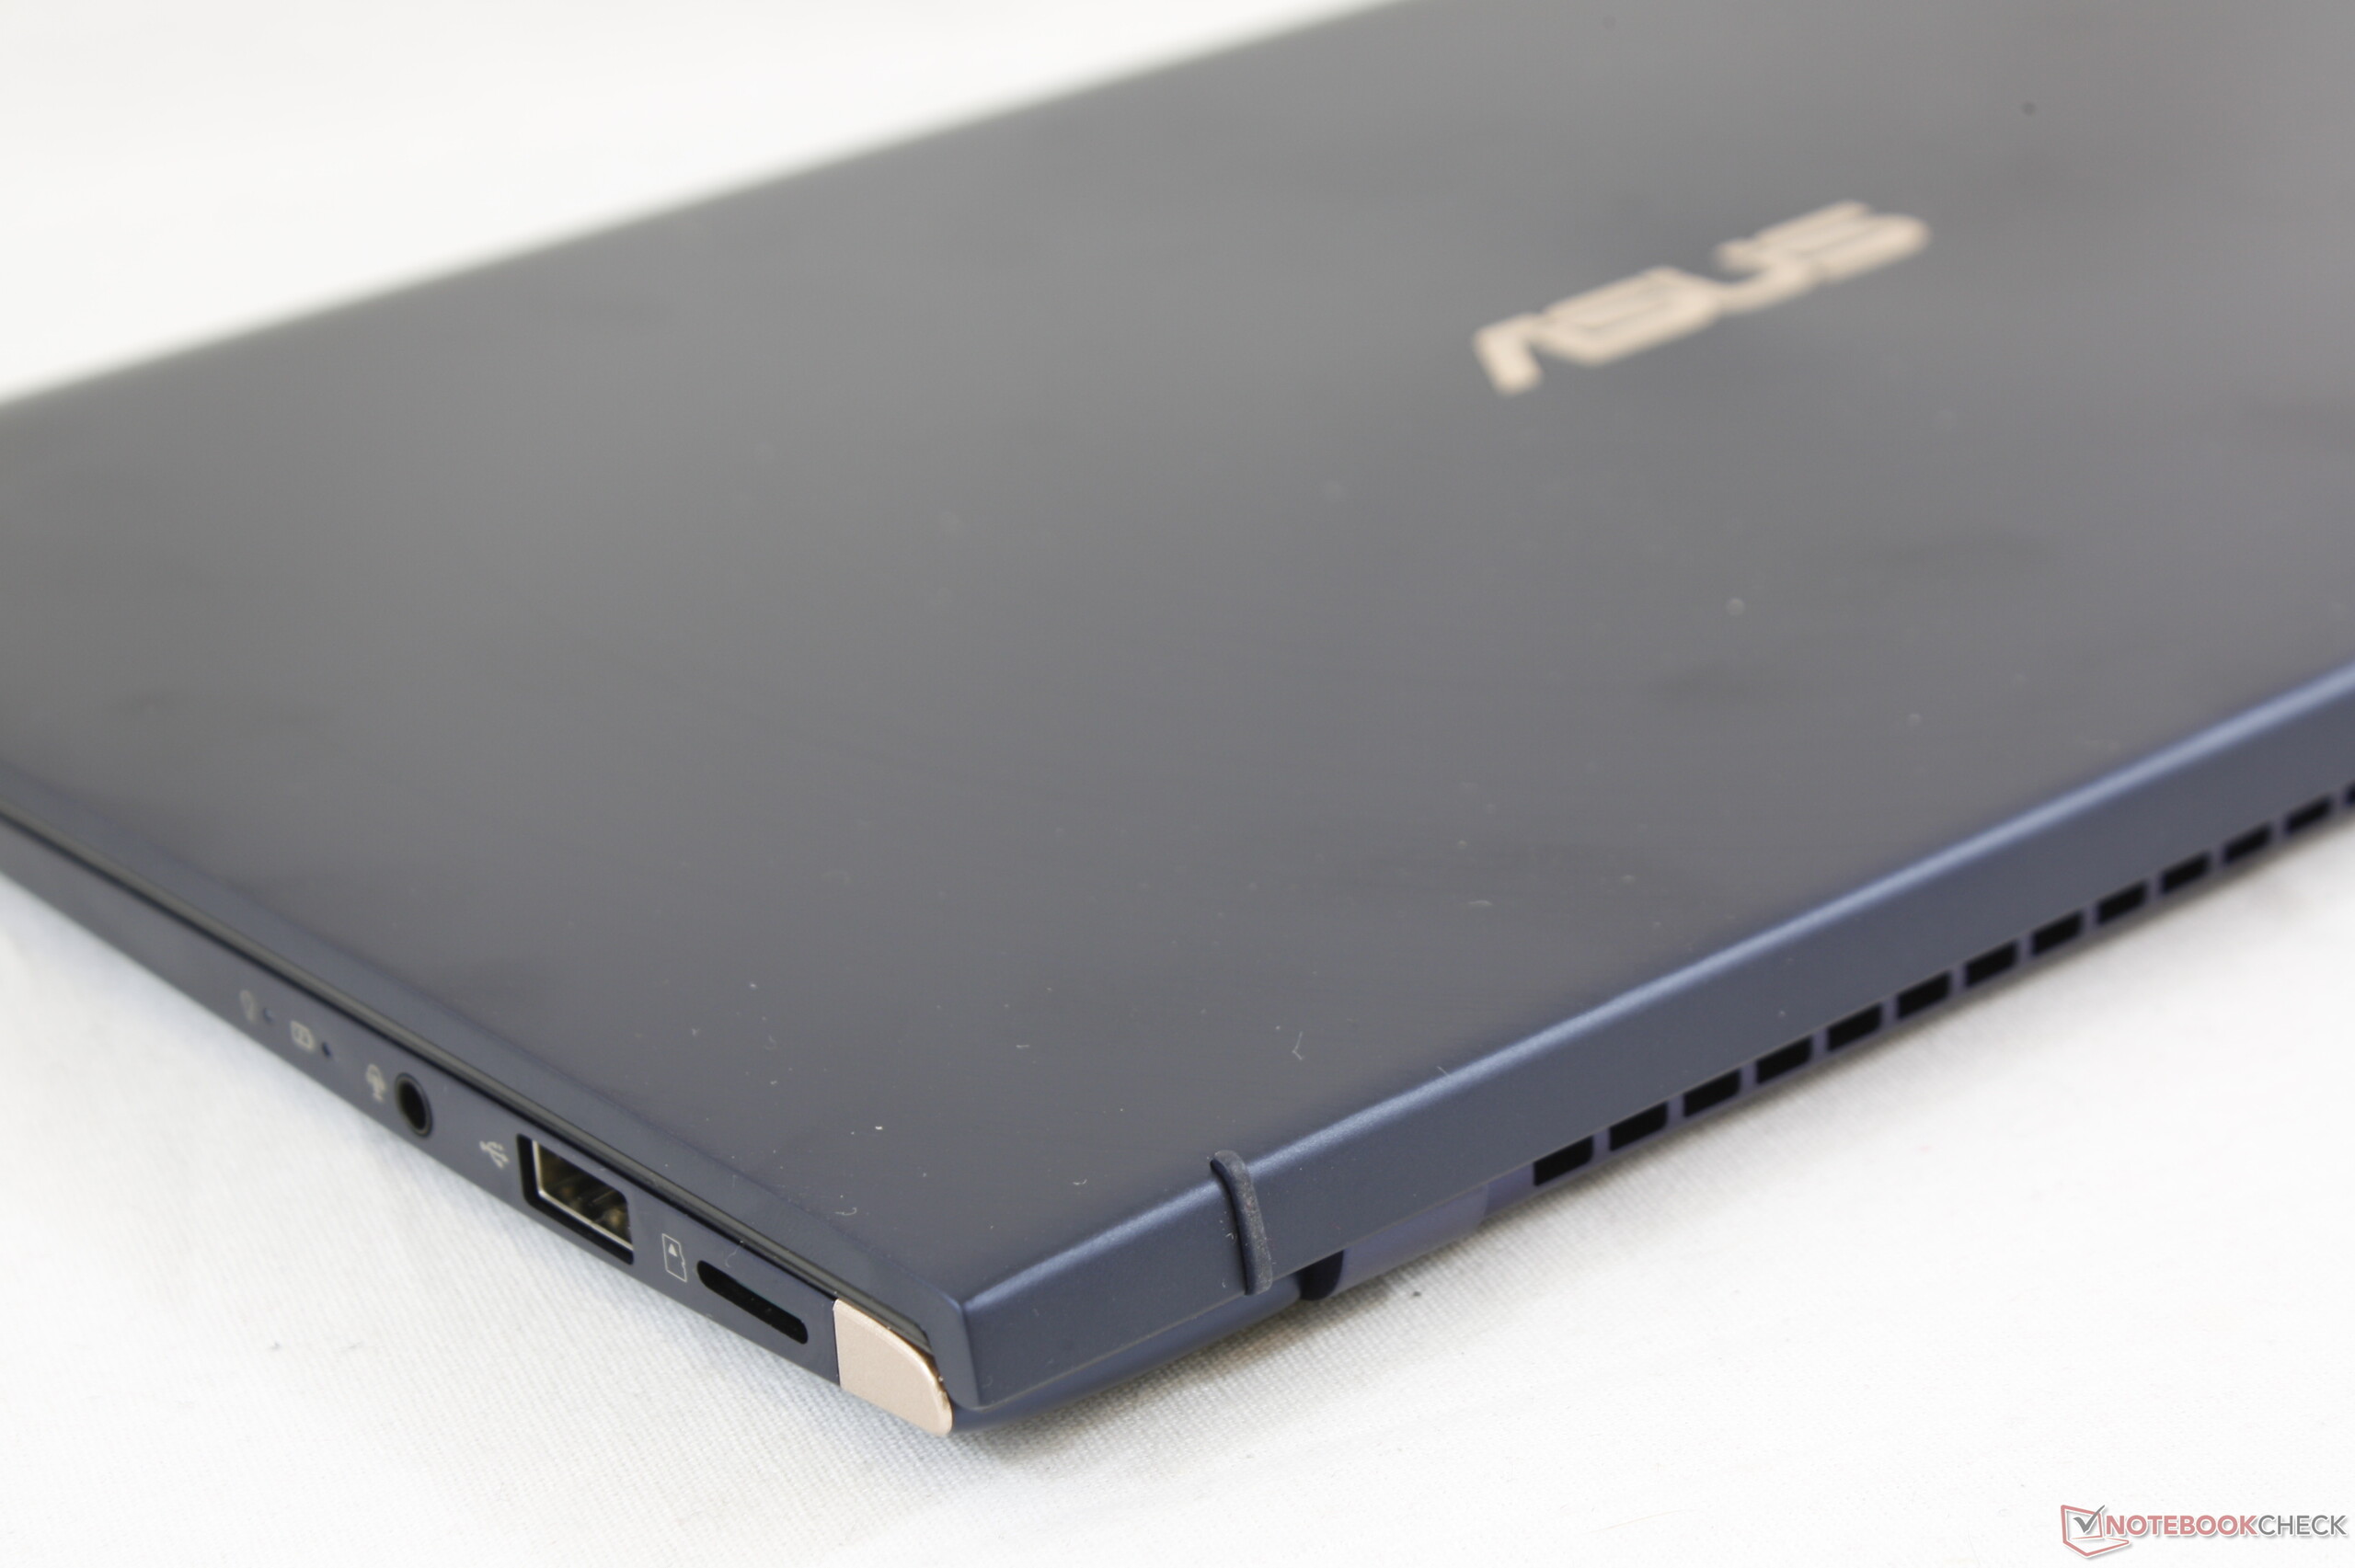
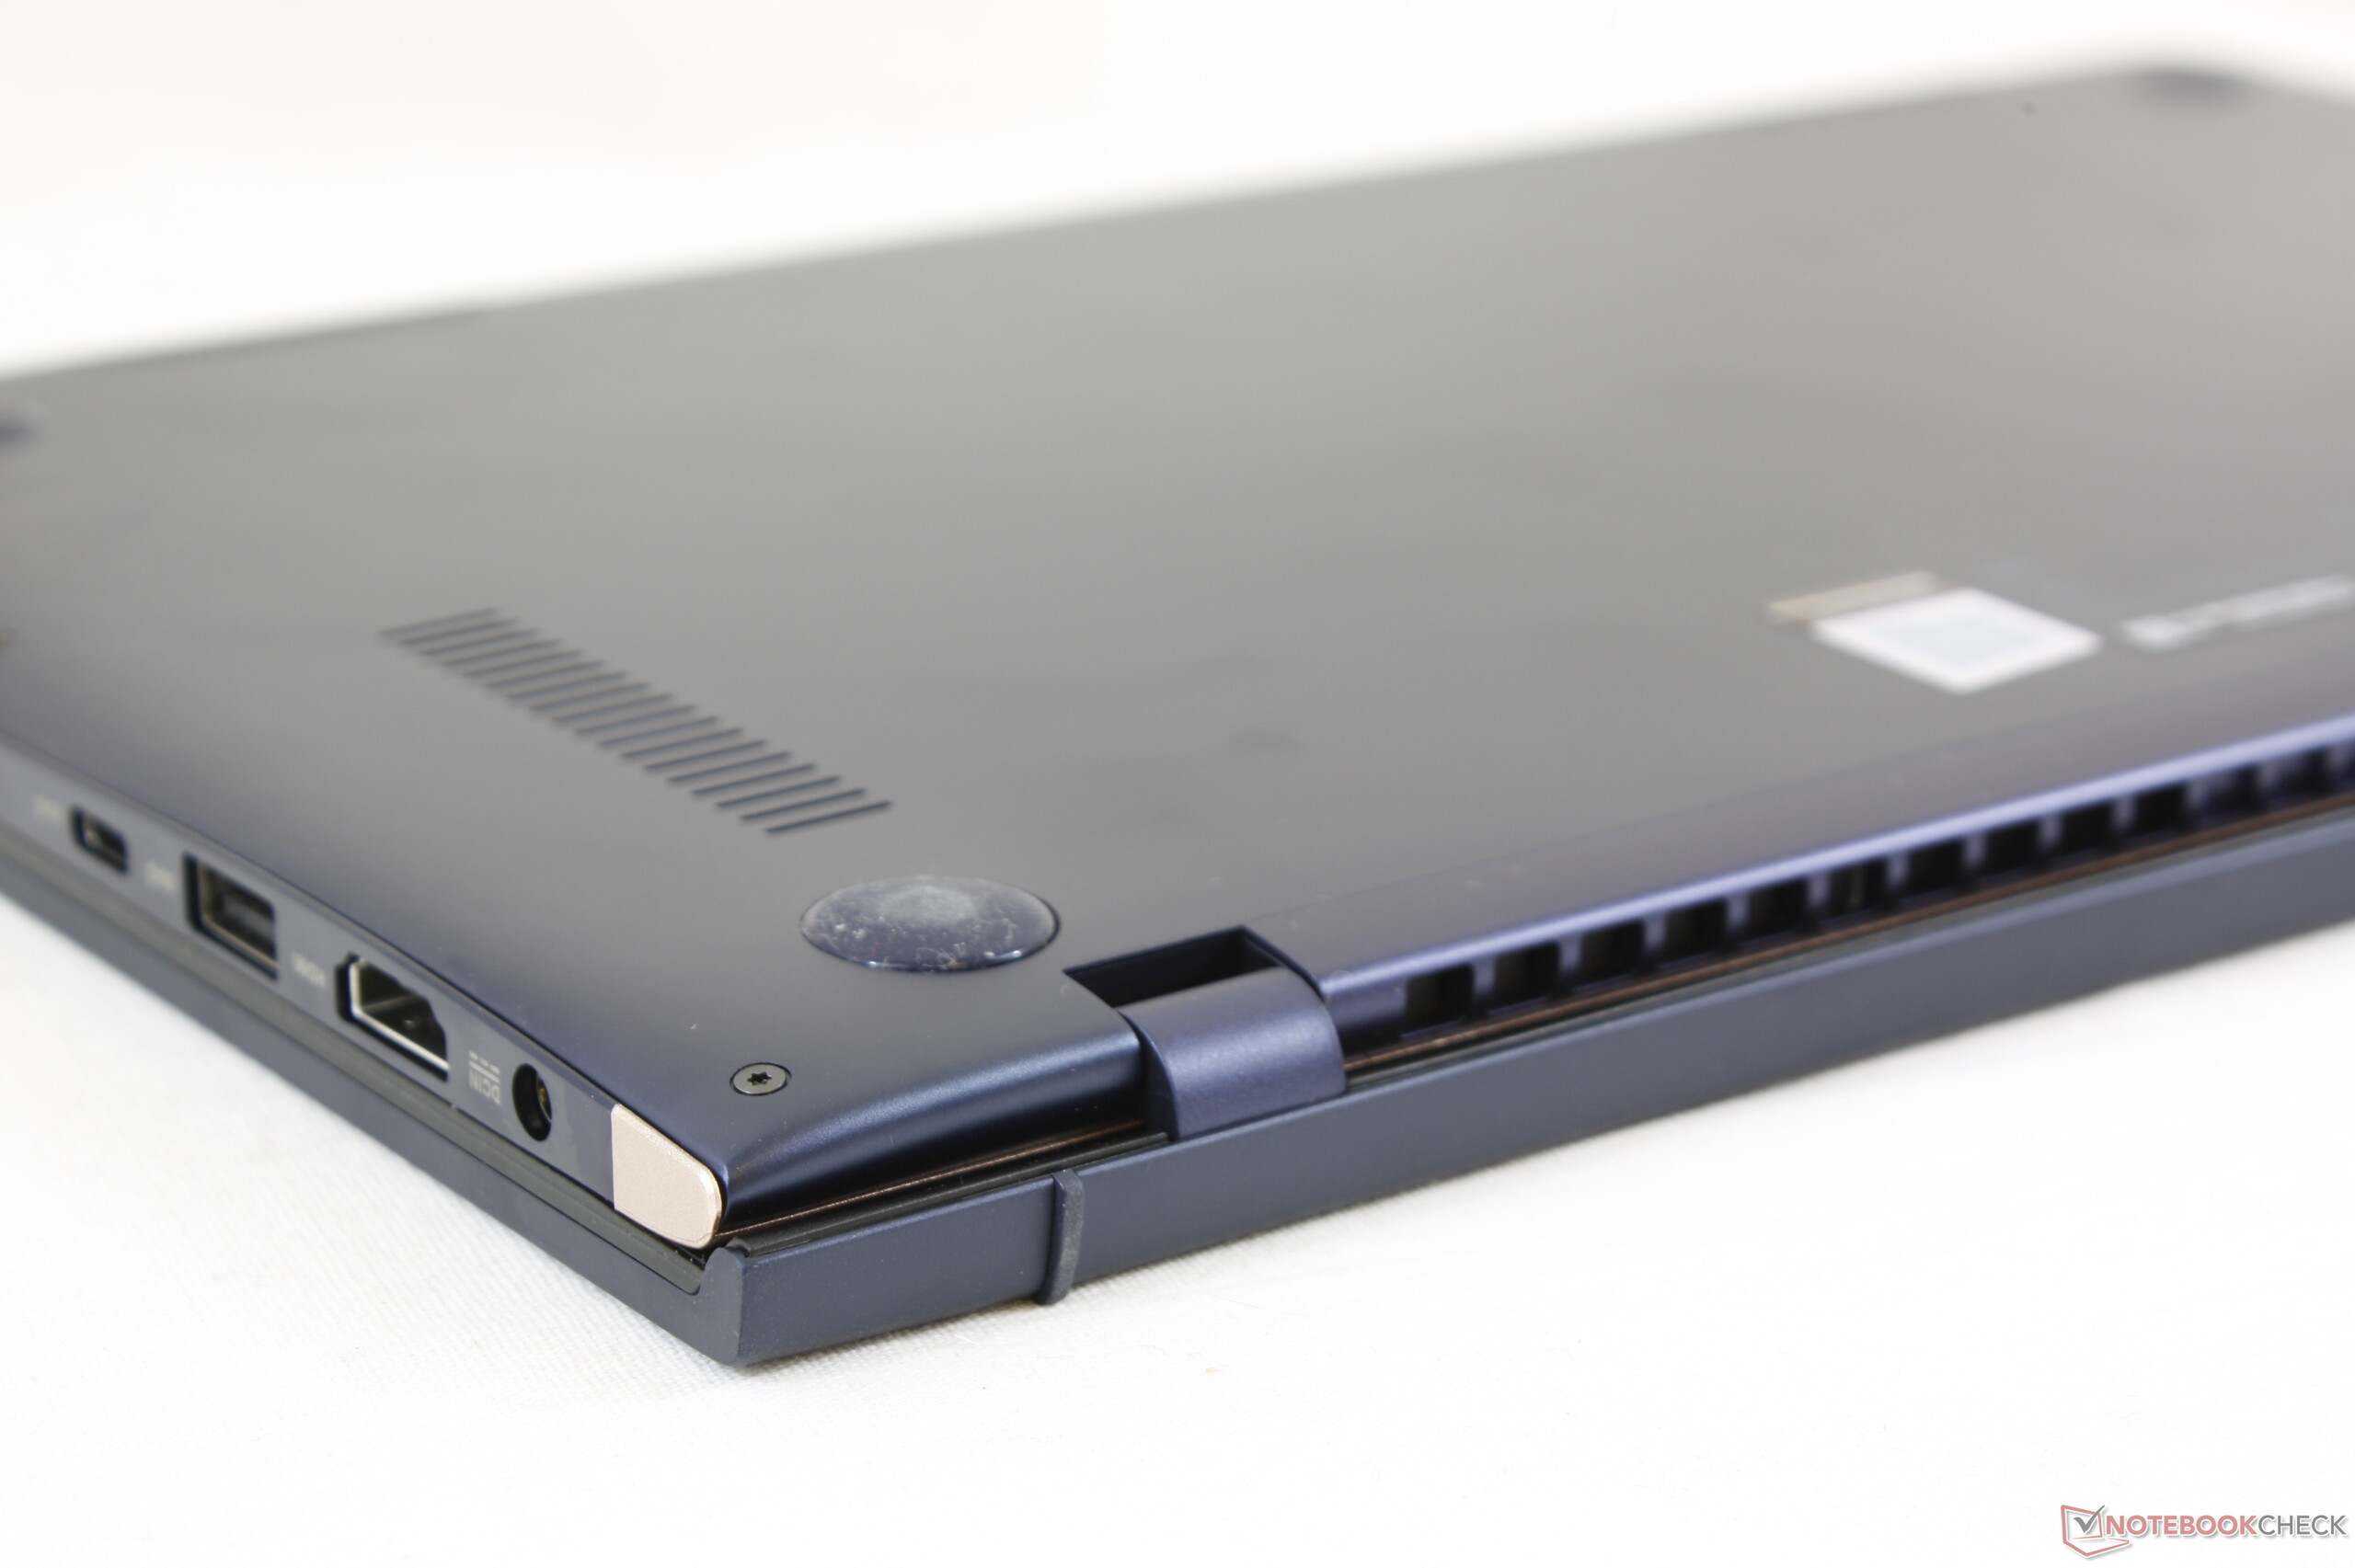
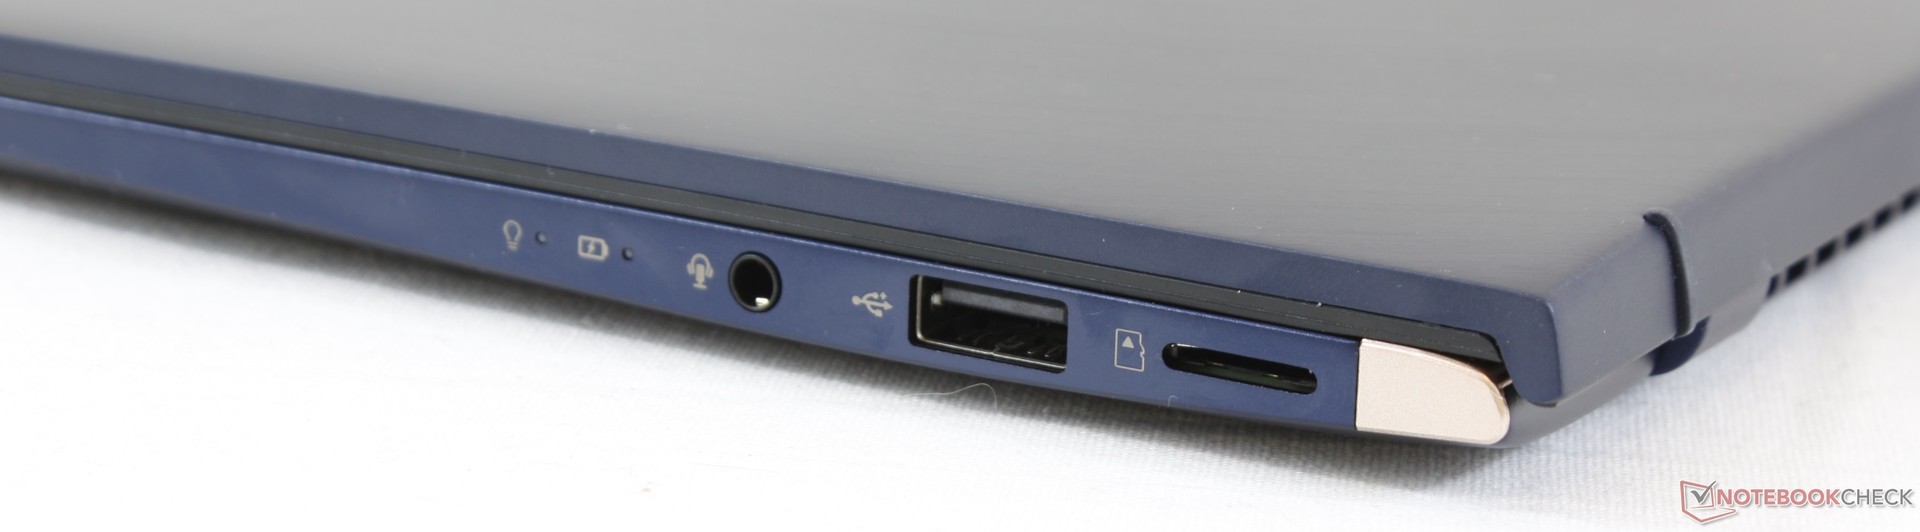
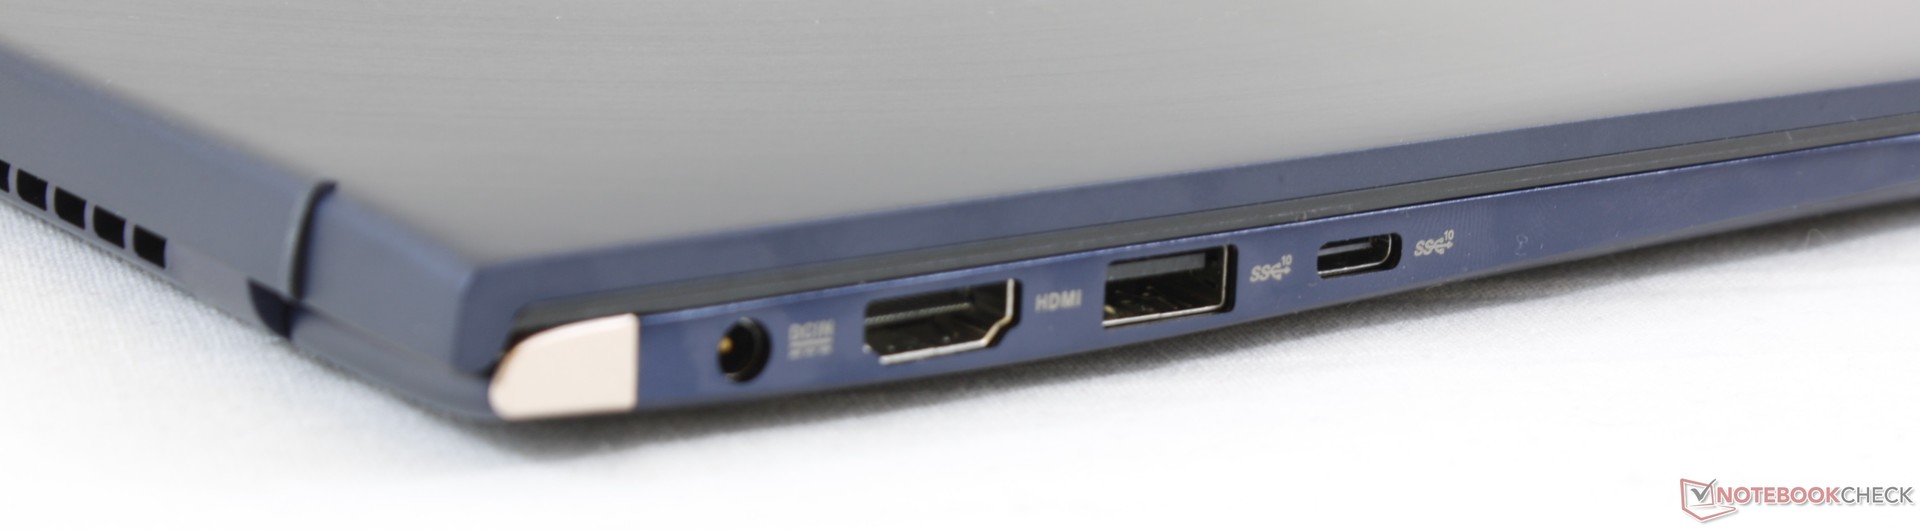
Voor toekomstige versies hadden we graag Thunderbolt 3 en een helderder scherm gezien om beter te concurreren met populaire alternatieven zoals de XPS 13, MateBook X Pro, MacBook Pro 13, Samsung NP900 en andere toestellen die geschikter zijn voor gebruik buitenshuis. Asus had zijn gepatenteerde adapter beter laten vallen voor het veelzijdigere USB Type-C. Haptische feedback voor het virtuele NumPad, een vingerafdruklezer en een toetsenbord dat beter bestand is tegen water zijn enkele afwezige features die de UX433 nog beter hadden kunnen maken.
Een visuele en kwalitatieve upgrade ten opzichte van de UX430 van de vorige generatie. Het systeem presteert prima voor het kleine formaat, al worden sommige features die wel te vinden zijn in andere ultrabooks in zijn prijsklasse achterwege gelaten. De CPU-upgrade van Whiskey Lake-U zal een stuk groter zijn voor wie van een laptop komt die op zijn minst twee of drie jaar oud is.
Asus ZenBook 14 UX433FA
- 20-11-2018 v6 (old)
Allen Ngo
Price comparison
