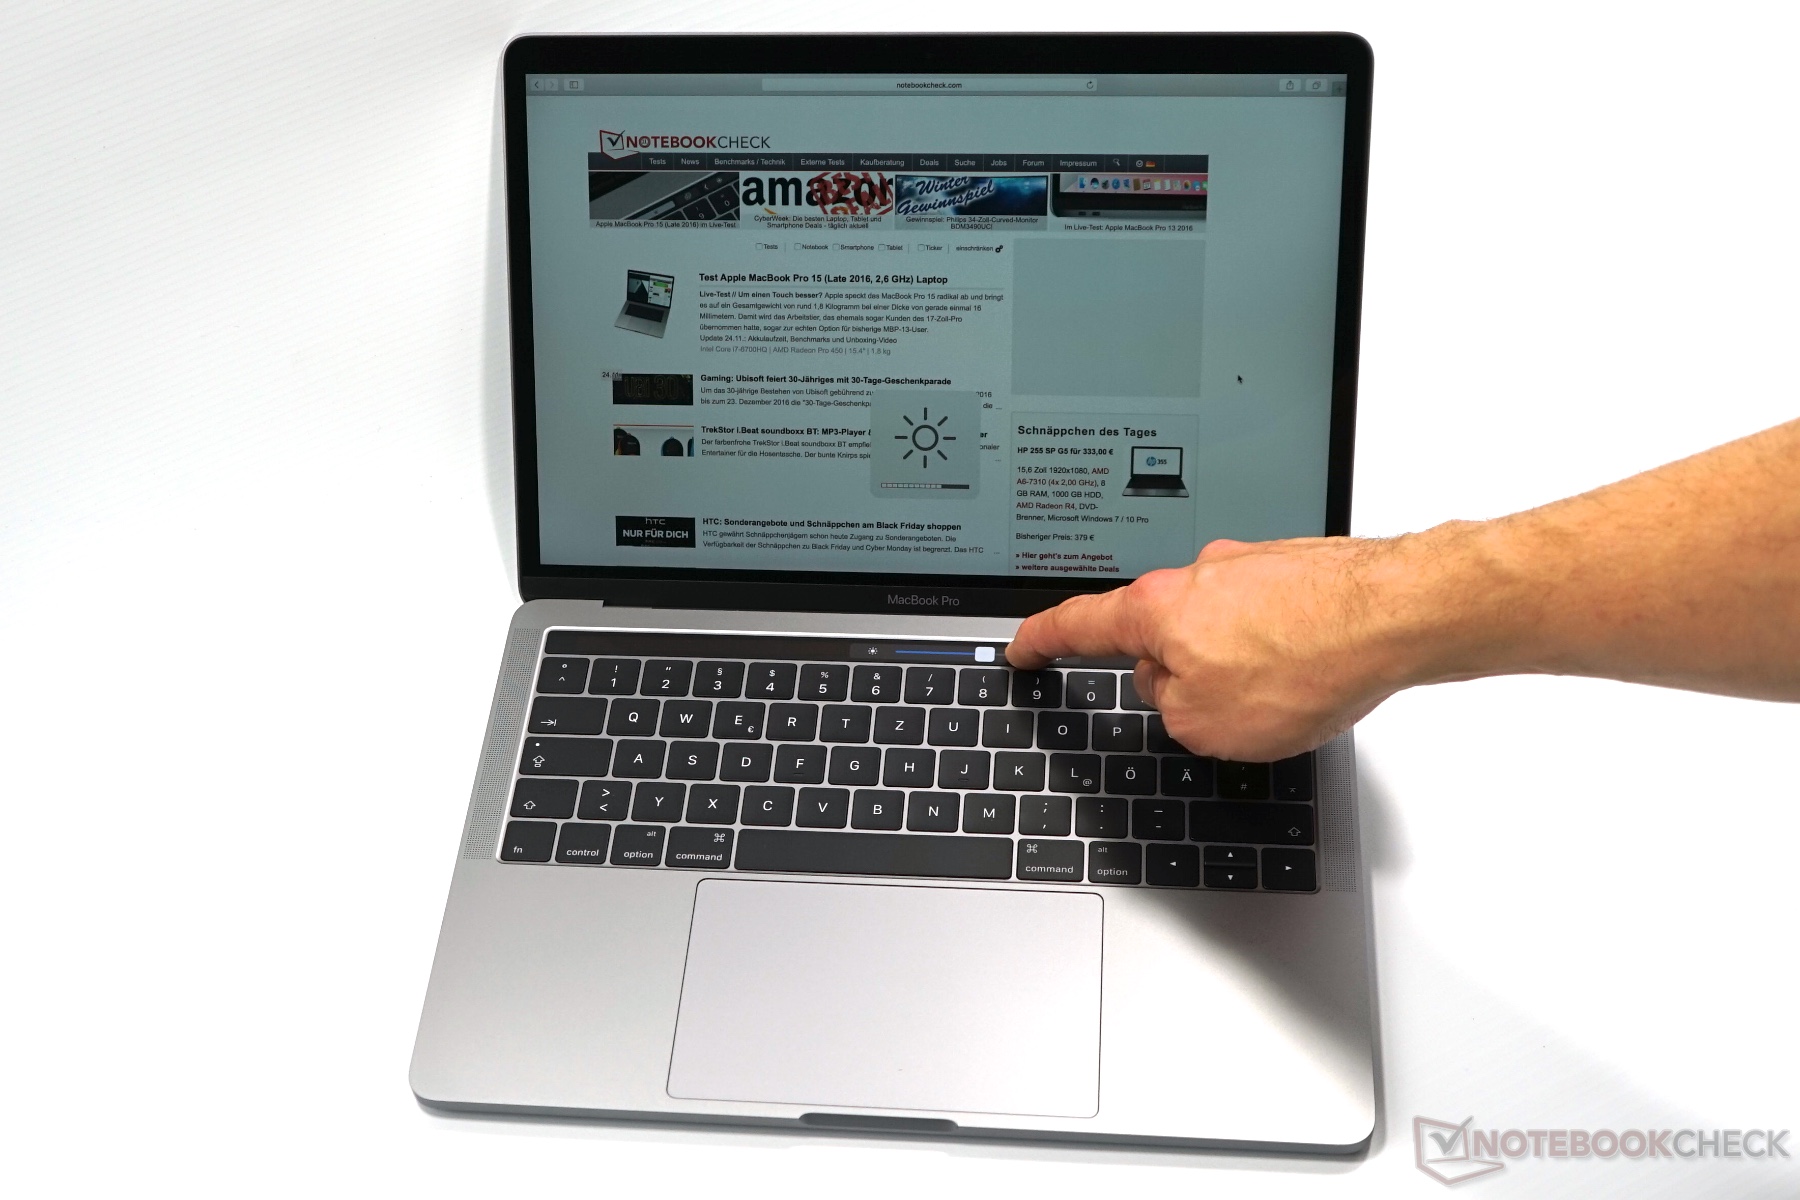
Kort testrapport Apple MacBook Pro 13 2018 (Touch Bar, i5) Laptop
Apple MacBook Pro 13 2018 Touchbar i5 (MacBook Pro 13 2018 Serie)
Processor
Intel Core i5-8259U 4c/8t 4 x 2.3 - 3.8 GHz, Coffee Lake-U
Grafische kaart
Intel Iris Plus Graphics 655, Core: 1050 MHz
Geheugen
8 GB
, LPDDR3-2133, gesoldeerd
Beeldscherm
13.30 inch 16:10, 2560 x 1600 pixel 227 PPI, APPA03E, IPS, TrueTone, glimmend: ja
Gewicht
1.37 kg, Voeding: 269 g
Prijs
1999 Euro
Links
Opmerking: De fabrikant kan onderdelen van verschillende leveranciers gebruiken, waaronder beeldschermen, schijven of geheugensticks met vergelijkbare specificaties.
| |||||||||||||||||||||||||
APPA03E getest met X-Rite i1Pro 2
Maximum: 519 cd/m² (Nits) Gemiddelde: 504.4 cd/m² Minimum: 4.6 cd/m²Helderheidsverdeling: 95 %
Helderheid in Batterij-modus: 524 cd/m²
Contrast: 1573:1 (Zwart: 0.33 cd/m²)
ΔE ColorChecker Calman: 1.4 | ∀{0.5-29.43 Ø4.73}
ΔE Greyscale Calman: 2.2 | ∀{0.09-98 Ø4.97}
99.99% sRGB (Argyll 1.6.3 3D)
77.3% AdobeRGB 1998 (Argyll 1.6.3 3D)
87.3% AdobeRGB 1998 (Argyll 3D)
99.9% sRGB (Argyll 3D)
98.5% Display P3 (Argyll 3D)
Gamma: 2.22
CCT: 6908 K
| Apple MacBook Pro 13 2018 Touchbar i5 APPA03E, , 2560x1600, 13.3" | Apple MacBook Pro 13 2017 Touchbar i5 APPA034, , 2560x1600, 13.3" | Apple MacBook Pro 13 2017 APPA033, , 2560x1600, 13.3" | Lenovo ThinkPad X1 Carbon 2018-20KGS03900 B140QAN02.0, , 2560x1440, 14" | Dell XPS 13 9370 i7 UHD ID: Sharp SHP148B, Name: LQ133D1, Dell P/N: 8XDHY, , 3840x2160, 13.3" | Huawei Matebook X Pro i5 Tianma XM, , 3000x2000, 13.9" | |
|---|---|---|---|---|---|---|
| Display | -0% | 0% | 1% | -17% | -20% | |
| Display P3 Coverage (%) | 98.5 | 98.6 0% | 99.2 1% | 87.7 -11% | 68.9 -30% | 65.9 -33% |
| sRGB Coverage (%) | 99.9 | 100 0% | 99.9 0% | 100 0% | 98.4 -2% | 95.2 -5% |
| AdobeRGB 1998 Coverage (%) | 87.3 | 86.5 -1% | 87.1 0% | 99.9 14% | 69.5 -20% | 67.6 -23% |
| Response Times | -5% | 9% | -19% | -45% | 16% | |
| Response Time Grey 50% / Grey 80% * (ms) | 46 ? | 48 ? -4% | 42.8 ? 7% | 59.2 ? -29% | 69.6 ? -51% | 40.4 ? 12% |
| Response Time Black / White * (ms) | 32 ? | 33.6 ? -5% | 28.8 ? 10% | 34.4 ? -8% | 44 ? -38% | 25.6 ? 20% |
| PWM Frequency (Hz) | 118000 ? | 119000 ? | 3759 ? | |||
| Screen | 10% | -6% | -11% | -34% | -63% | |
| Brightness middle (cd/m²) | 519 | 551 6% | 588 13% | 578 11% | 478.5 -8% | 442.7 -15% |
| Brightness (cd/m²) | 504 | 514 2% | 561 11% | 533 6% | 466 -8% | 428 -15% |
| Brightness Distribution (%) | 95 | 88 -7% | 92 -3% | 84 -12% | 86 -9% | 84 -12% |
| Black Level * (cd/m²) | 0.33 | 0.48 -45% | 0.45 -36% | 0.38 -15% | 0.43 -30% | 0.31 6% |
| Contrast (:1) | 1573 | 1148 -27% | 1307 -17% | 1521 -3% | 1113 -29% | 1428 -9% |
| Colorchecker dE 2000 * | 1.4 | 0.8 43% | 1.7 -21% | 1.9 -36% | 3.09 -121% | 2.24 -60% |
| Colorchecker dE 2000 max. * | 2.8 | 1.4 50% | 3.5 -25% | 3.8 -36% | 5.94 -112% | 7.19 -157% |
| Greyscale dE 2000 * | 2.2 | 1 55% | 1.9 14% | 3 -36% | 2.4 -9% | 9.7 -341% |
| Gamma | 2.22 99% | 2.16 102% | 2.33 94% | 2.14 103% | 2.063 107% | 1.42 155% |
| CCT | 6908 94% | 6672 97% | 6738 96% | 6377 102% | 6883 94% | 6227 104% |
| Color Space (Percent of AdobeRGB 1998) (%) | 77.3 | 77.92 1% | 88.8 15% | 69.47 -10% | 61.6 -20% | |
| Color Space (Percent of sRGB) (%) | 99.99 | 99.94 0% | 100 0% | 98.36 -2% | 95 -5% | |
| Colorchecker dE 2000 calibrated * | 0.8 | 2.06 | 1.11 | |||
| Totaal Gemiddelde (Programma / Instellingen) | 2% /
5% | 1% /
-3% | -10% /
-9% | -32% /
-32% | -22% /
-44% |
* ... kleiner is beter
Cinebench R15 CPU Multi 64-bit macOS
Dit is de verkorte versie van het originele artikel. Het volledige, Engelse testrapport vind je hier.
Ondersteuning voor TrueTone is zonder twijfel een leuke extra, maar het belangrijkste aspect van de 2018 MBP 13-update is de nieuwe quad-core-processor. De teleurstellende resultaten na onze initiële benchmarks beantwoorden echter niet aan onze verwachtingen. De Coffe Lake-U-chip verbruikt meer energie dan Kaby Lake-R-CPU's en de MacBook Pro 13 bereikt al na enkele seconden de temperatuurlimiet van de CPU. De prestatieverbetering lijkt dus eerder beperkt tot de geïntegreerde graphics, wat we uitvoerig zullen onderzoeken in de volgende paar dagen.
Price comparison
