Kort testrapport Dell XPS 15 9575 (i7-8705G, Vega M GL, 4K UHD) Convertible
| SD Card Reader | |
| average JPG Copy Test (av. of 3 runs) | |
| Eurocom Sky X9C (Toshiba Exceria Pro SDXC 64 GB UHS-II) | |
| Dell XPS 15 9575 i7-8705G (Toshiba Exceria Pro M501 UHS-II) | |
| Dell XPS 15 9560 (i7-7700HQ, UHD) (Toshiba Exceria Pro SDXC 64 GB UHS-II) | |
| Gigabyte Aero 14-K8 (Toshiba Exceria Pro SDXC 64 GB UHS-II) | |
| maximum AS SSD Seq Read Test (1GB) | |
| Dell XPS 15 9560 (i7-7700HQ, UHD) (Toshiba Exceria Pro SDXC 64 GB UHS-II) | |
| Eurocom Sky X9C (Toshiba Exceria Pro SDXC 64 GB UHS-II) | |
| Dell XPS 15 9575 i7-8705G (Toshiba Exceria Pro M501 UHS-II) | |
| Gigabyte Aero 14-K8 (Toshiba Exceria Pro SDXC 64 GB UHS-II) | |
| |||||||||||||||||||||||||
Helderheidsverdeling: 81 %
Helderheid in Batterij-modus: 488 cd/m²
Contrast: 1627:1 (Zwart: 0.3 cd/m²)
ΔE ColorChecker Calman: 3.16 | ∀{0.5-29.43 Ø4.71}
ΔE Greyscale Calman: 3.3 | ∀{0.09-98 Ø4.96}
97.9% sRGB (Argyll 1.6.3 3D)
71.7% AdobeRGB 1998 (Argyll 1.6.3 3D)
79.2% AdobeRGB 1998 (Argyll 3D)
97.9% sRGB (Argyll 3D)
78.7% Display P3 (Argyll 3D)
Gamma: 2.178
CCT: 6811 K
| Dell XPS 15 9575 i7-8705G Sharp SHP148D, IPS, 15.6", 3840x2160 | Dell XPS 15 9575 i5-8305G Sharp SHP148E, IPS, 15.6", 1920x1080 | Dell XPS 15 9560 (i7-7700HQ, UHD) IGZO IPS, 15.6", 3840x2160 | HP Spectre x360 15t-bl100 BOE06C3, IPS, 15.6", 3840x2160 | Dell Precision 5510 SHP143E, 7PHPT_LQ156D1, IGZO LED, 15.6", 3840x2160 | Lenovo ThinkPad P50 LQ156D1JW05, IPS, 15.6", 3840x2160 | |
|---|---|---|---|---|---|---|
| Display | -15% | 14% | -15% | 13% | 11% | |
| Display P3 Coverage (%) | 78.7 | 63.3 -20% | 89.7 14% | 66.6 -15% | 88.4 12% | 85.8 9% |
| sRGB Coverage (%) | 97.9 | 92.5 -6% | 100 2% | 86.9 -11% | 100 2% | 98.6 1% |
| AdobeRGB 1998 Coverage (%) | 79.2 | 63.9 -19% | 100 26% | 63.5 -20% | 99.5 26% | 98.2 24% |
| Response Times | -8% | -16% | 15% | -8% | 28% | |
| Response Time Grey 50% / Grey 80% * (ms) | 48.4 ? | 53.6 ? -11% | 57.2 ? -18% | 41.2 ? 15% | 56.4 ? -17% | 39.2 ? 19% |
| Response Time Black / White * (ms) | 34.8 ? | 36.4 ? -5% | 39.2 ? -13% | 29.6 ? 15% | 34 ? 2% | 22 ? 37% |
| PWM Frequency (Hz) | 1000 ? | 1000 ? | 962 | 1000 | 217 | |
| Screen | -14% | -19% | -21% | -16% | -29% | |
| Brightness middle (cd/m²) | 488 | 418.5 -14% | 370.1 -24% | 338.7 -31% | 391 -20% | 250 -49% |
| Brightness (cd/m²) | 440 | 391 -11% | 356 -19% | 325 -26% | 361 -18% | 250 -43% |
| Brightness Distribution (%) | 81 | 87 7% | 87 7% | 91 12% | 87 7% | 86 6% |
| Black Level * (cd/m²) | 0.3 | 0.35 -17% | 0.37 -23% | 0.28 7% | 0.4 -33% | 0.31 -3% |
| Contrast (:1) | 1627 | 1196 -26% | 1000 -39% | 1210 -26% | 978 -40% | 806 -50% |
| Colorchecker dE 2000 * | 3.16 | 3.5 -11% | 5.3 -68% | 4.9 -55% | 4.85 -53% | 4.5 -42% |
| Colorchecker dE 2000 max. * | 8.8 | 7.57 14% | 9.9 -13% | 8.7 1% | 9.3 -6% | |
| Greyscale dE 2000 * | 3.3 | 5.3 -61% | 4.6 -39% | 5.5 -67% | 4.01 -22% | 7.2 -118% |
| Gamma | 2.178 101% | 2.2 100% | 2.31 95% | 2.08 106% | 2.18 101% | 2.31 95% |
| CCT | 6811 95% | 7500 87% | 6284 103% | 7498 87% | 7340 89% | 6399 102% |
| Color Space (Percent of AdobeRGB 1998) (%) | 71.7 | 57.9 -19% | 88.3 23% | 63.5 -11% | 96 34% | 85 19% |
| Color Space (Percent of sRGB) (%) | 97.9 | 92.1 -6% | 100 2% | 86.92 -11% | 100 2% | 98.6 1% |
| Colorchecker dE 2000 calibrated * | 2.51 | |||||
| Totaal Gemiddelde (Programma / Instellingen) | -12% /
-14% | -7% /
-12% | -7% /
-15% | -4% /
-8% | 3% /
-13% |
* ... kleiner is beter
Responstijd Scherm
| ↔ Responstijd Zwart naar Wit | ||
|---|---|---|
| 34.8 ms ... stijging ↗ en daling ↘ gecombineerd | ↗ 19.2 ms stijging | 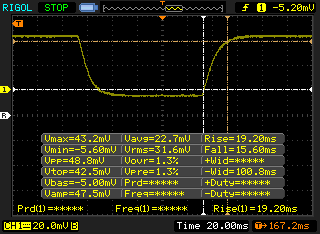 |
| ↘ 15.6 ms daling | ||
| Het scherm vertoonde trage responstijden in onze tests en is misschien te traag voor games. Ter vergelijking: alle testtoestellen variëren van 0.1 (minimum) tot 240 (maximum) ms. » 92 % van alle toestellen zijn beter. Dit betekent dat de gemeten responstijd slechter is dan het gemiddelde (19.8 ms) van alle geteste toestellen. | ||
| ↔ Responstijd 50% Grijs naar 80% Grijs | ||
| 48.4 ms ... stijging ↗ en daling ↘ gecombineerd | ↗ 23.2 ms stijging | 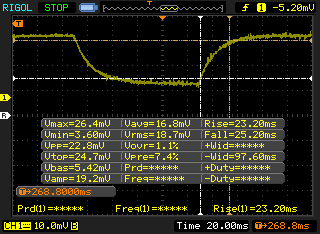 |
| ↘ 25.2 ms daling | ||
| Het scherm vertoonde trage responstijden in onze tests en is misschien te traag voor games. Ter vergelijking: alle testtoestellen variëren van 0.165 (minimum) tot 636 (maximum) ms. » 84 % van alle toestellen zijn beter. Dit betekent dat de gemeten responstijd slechter is dan het gemiddelde (30.9 ms) van alle geteste toestellen. | ||
Screen Flickering / PWM (Pulse-Width Modulation)
| Screen flickering / PWM waargenomen | 1000 Hz | ≤ 25 % helderheid instelling | 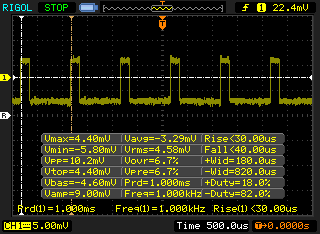 |
De achtergrondverlichting van het scherm flikkert op 1000 Hz (in het slechtste geval, bijvoorbeeld bij gebruik van PWM) aan een helderheid van 25 % en lager. Boven deze helderheid zou er geen flickering / PWM mogen optreden. De frequentie van 1000 Hz is redelijk hoog en de meeste mensen die gevoelig zijn aan flickering zouden dit dus niet mogen waarnemen of geïrriteerde ogen krijgen. Ter vergelijking: 52 % van alle geteste toestellen maakten geen gebruik van PWM om de schermhelderheid te verlagen. Als het wel werd gebruikt, werd een gemiddelde van 7744 (minimum: 5 - maximum: 343500) Hz waargenomen. | |||
| Cinebench R10 | |
| Rendering Multiple CPUs 32Bit | |
| Eurocom Tornado F5 | |
| Intel Hades Canyon NUC8i7HVK | |
| Dell XPS 15 9575 i7-8705G | |
| Dell Latitude 5590 | |
| Dell XPS 15 9575 i5-8305G | |
| Dell XPS 15 9560 (i7-7700HQ, UHD) | |
| Dell XPS 13 9370 i7 UHD | |
| Acer Swift 3 SF315-41-R6J9 | |
| Dell Latitude 13 7380 | |
| Rendering Single 32Bit | |
| Dell Latitude 5590 | |
| Eurocom Tornado F5 | |
| Intel Hades Canyon NUC8i7HVK | |
| Dell XPS 15 9575 i7-8705G | |
| Dell XPS 13 9370 i7 UHD | |
| Dell Latitude 13 7380 | |
| Dell XPS 15 9575 i5-8305G | |
| Dell XPS 15 9560 (i7-7700HQ, UHD) | |
| Acer Swift 3 SF315-41-R6J9 | |
* ... kleiner is beter
| PCMark 8 Home Score Accelerated v2 | 4235 punten | |
| PCMark 8 Creative Score Accelerated v2 | 6297 punten | |
| PCMark 8 Work Score Accelerated v2 | 4469 punten | |
| PCMark 10 Score | 5001 punten | |
Help | ||
| Dell XPS 15 9575 i7-8705G SK hynix PC401 NVMe 500 GB | Dell XPS 15 9575 i5-8305G Toshiba XG5 KXG50ZNV256G | Asus ZenBook Flip 15 UX561UD Micron 1100 MTFDDAV256TBN | Asus Zenbook Pro UX550VE-DB71T Samsung PM961 NVMe MZVLW512HMJP | Asus G501VW-FY081T Samsung CM871 MZNLF128HCHP | |
|---|---|---|---|---|---|
| AS SSD | -58% | -59% | 31% | -122% | |
| Copy Game MB/s (MB/s) | 944 | 250.5 -73% | 282.3 -70% | 477.1 -49% | 141.5 -85% |
| Copy Program MB/s (MB/s) | 487.9 | 174.9 -64% | 196.8 -60% | 294.6 -40% | 99.9 -80% |
| Copy ISO MB/s (MB/s) | 1523 | 392.7 -74% | 291 -81% | 1269 -17% | 163 -89% |
| Score Total (Points) | 2132 | 1113 -48% | 844 -60% | 3721 75% | 269 -87% |
| Score Write (Points) | 807 | 307 -62% | 371 -54% | 1421 76% | 63 -92% |
| Score Read (Points) | 921 | 595 -35% | 310 -66% | 1541 67% | 152 -83% |
| Access Time Write * (ms) | 0.051 | 0.056 -10% | 0.056 -10% | 0.034 33% | 0.225 -341% |
| Access Time Read * (ms) | 0.044 | 0.146 -232% | 0.097 -120% | 0.054 -23% | 0.207 -370% |
| 4K-64 Write (MB/s) | 637 | 181.2 -72% | 248.5 -61% | 1160 82% | 19.4 -97% |
| 4K-64 Read (MB/s) | 649 | 337.1 -48% | 235.5 -64% | 1269 96% | 87.6 -87% |
| 4K Write (MB/s) | 94.3 | 92.7 -2% | 84.8 -10% | 112.8 20% | 30.66 -67% |
| 4K Read (MB/s) | 41.38 | 24.78 -40% | 25.79 -38% | 51 23% | 13.87 -66% |
| Seq Write (MB/s) | 752 | 334.3 -56% | 379.3 -50% | 1475 96% | 126.9 -83% |
| Seq Read (MB/s) | 2302 | 2335 1% | 488 -79% | 2208 -4% | 504 -78% |
* ... kleiner is beter

| 3DMark 11 Performance | 9890 punten | |
| 3DMark Ice Storm Standard Score | 67107 punten | |
| 3DMark Cloud Gate Standard Score | 20851 punten | |
| 3DMark Fire Strike Score | 6280 punten | |
| 3DMark Fire Strike Extreme Score | 3100 punten | |
| 3DMark Time Spy Score | 2225 punten | |
Help | ||
| lage | gem. | hoge | ultra | 4K | |
|---|---|---|---|---|---|
| BioShock Infinite (2013) | 224.5 | 181.4 | 161 | 52.5 | |
| Batman: Arkham Knight (2015) | 108 | 95 | 54 | 16 | |
| Rise of the Tomb Raider (2016) | 133.1 | 81.2 | 42.4 | 32.8 | 14.3 |
| Ashes of the Singularity (2016) | 54.9 | 37 | 32.7 |
Geluidsniveau
| Onbelast |
| 28.2 / 28.2 / 28.2 dB (A) |
| Belasting |
| 29 / 47.4 dB (A) |
 | ||
30 dB stil 40 dB(A) hoorbaar 50 dB(A) luid |
||
min: | ||
| Dell XPS 15 9575 i7-8705G Vega M GL / 870, i7-8705G, SK hynix PC401 NVMe 500 GB | Lenovo Yoga 720-15IKB-80X7 GeForce GTX 1050 Mobile, i7-7700HQ, Samsung PM961 MZVLW256HEHP | Asus ZenBook Flip 15 UX561UD GeForce GTX 1050 Mobile, i5-8550U, Micron 1100 MTFDDAV256TBN | Asus Zenbook Pro UX550VE-DB71T GeForce GTX 1050 Ti Mobile, i7-7700HQ, Samsung PM961 NVMe MZVLW512HMJP | Alienware 13 R3 (i5-7300HQ, GTX 1050 Ti) GeForce GTX 1050 Ti Mobile, i5-7300HQ, Samsung PM961 MZVLW256HEHP | |
|---|---|---|---|---|---|
| Noise | -5% | -8% | -11% | -3% | |
| uit / omgeving * (dB) | 28.2 | 28.2 -0% | 30.4 -8% | 28.3 -0% | 29.7 -5% |
| Idle Minimum * (dB) | 28.2 | 28.2 -0% | 31.3 -11% | 30.4 -8% | 29.7 -5% |
| Idle Average * (dB) | 28.2 | 28.2 -0% | 31.3 -11% | 31 -10% | 29.7 -5% |
| Idle Maximum * (dB) | 28.2 | 28.2 -0% | 31.3 -11% | 31.2 -11% | 29.7 -5% |
| Load Average * (dB) | 29 | 39 -34% | 36.4 -26% | 43.3 -49% | 32.7 -13% |
| Witcher 3 ultra * (dB) | 44.7 | 46.2 -3% | 36.4 19% | ||
| Load Maximum * (dB) | 47.4 | 46.3 2% | 37.1 22% | 46.2 3% | 50 -5% |
* ... kleiner is beter
(±) De maximumtemperatuur aan de bovenzijde bedraagt 45 °C / 113 F, vergeleken met het gemiddelde van 36.8 °C / 98 F, variërend van 21 tot 71 °C voor de klasse Multimedia.
(+) De bodem warmt op tot een maximum van 36.6 °C / 98 F, vergeleken met een gemiddelde van 39.1 °C / 102 F
(+) Bij onbelast gebruik bedraagt de gemiddelde temperatuur voor de bovenzijde 24.8 °C / 77 F, vergeleken met het apparaatgemiddelde van 31.3 °C / 88 F.
(±) Bij het spelen van The Witcher 3 is de gemiddelde temperatuur voor de bovenzijde 33.5 °C / 92 F, vergeleken met het apparaatgemiddelde van 31.3 °C / 88 F.
(+) De palmsteunen en het touchpad zijn met een maximum van ###max## °C / 82.4 F koeler dan de huidtemperatuur en voelen daarom koel aan.
(±) De gemiddelde temperatuur van de handpalmsteun van soortgelijke toestellen bedroeg 28.7 °C / 83.7 F (+0.7 °C / 1.3 F).
| Uit / Standby | |
| Inactief | |
| Belasting |
|
Key:
min: | |
| Dell XPS 15 9575 i7-8705G i7-8705G, Vega M GL / 870, SK hynix PC401 NVMe 500 GB, IPS, 3840x2160, 15.6" | Dell XPS 15 9560 (i7-7700HQ, UHD) i7-7700HQ, GeForce GTX 1050 Mobile, Lite-On CX2-8B512-Q11, IGZO IPS, 3840x2160, 15.6" | Lenovo Yoga 720-15IKB-80X7 i7-7700HQ, GeForce GTX 1050 Mobile, Samsung PM961 MZVLW256HEHP, IPS, 1920x1080, 15.6" | Asus ZenBook Flip 15 UX561UD i5-8550U, GeForce GTX 1050 Mobile, Micron 1100 MTFDDAV256TBN, IPS, 3840x2160, 15.6" | Asus Zenbook Pro UX550VE-DB71T i7-7700HQ, GeForce GTX 1050 Ti Mobile, Samsung PM961 NVMe MZVLW512HMJP, IPS, 1920x1080, 15.6" | |
|---|---|---|---|---|---|
| Power Consumption | -37% | -2% | -3% | 8% | |
| Idle Minimum * (Watt) | 6.2 | 11.9 -92% | 8.3 -34% | 5.4 13% | 6.3 -2% |
| Idle Average * (Watt) | 12.9 | 17.1 -33% | 10.2 21% | 10.8 16% | 7.9 39% |
| Idle Maximum * (Watt) | 13.6 | 17.3 -27% | 10.4 24% | 13.9 -2% | 8.1 40% |
| Load Average * (Watt) | 76.1 | 94.7 -24% | 67.5 11% | 94 -24% | 84.9 -12% |
| Witcher 3 ultra * (Watt) | 84.3 | 104.8 -24% | 96.5 -14% | 96.3 -14% | |
| Load Maximum * (Watt) | 99.4 | 122 -23% | 117.2 -18% | 116.6 -17% | 102.4 -3% |
* ... kleiner is beter
| Dell XPS 15 9575 i7-8705G i7-8705G, Vega M GL / 870, 75 Wh | Dell XPS 15 9575 i5-8305G i5-8305G, Vega M GL / 870, 75 Wh | Lenovo Yoga 720-15IKB-80X7 i7-7700HQ, GeForce GTX 1050 Mobile, 72 Wh | Asus ZenBook Flip 15 UX561UD i5-8550U, GeForce GTX 1050 Mobile, 52 Wh | Asus Zenbook Pro UX550VE-DB71T i7-7700HQ, GeForce GTX 1050 Ti Mobile, 73 Wh | Asus Strix GL502VT-DS74 6700HQ, GeForce GTX 970M, 64 Wh | |
|---|---|---|---|---|---|---|
| Batterijduur | 17% | 40% | -5% | 30% | -16% | |
| Reader / Idle (h) | 11.2 | 11.1 -1% | 17.8 59% | 9.3 -17% | 17.1 53% | 9.7 -13% |
| WiFi v1.3 (h) | 7 | 9.4 34% | 8.1 16% | 5.2 -26% | 8.9 27% | 5.9 -16% |
| Load (h) | 1.1 | 1.3 18% | 1.6 45% | 1.4 27% | 1.2 9% | 0.9 -18% |
Pro
Contra
Dit is de verkorte versie van het originele artikel. Het volledige, Engelse testrapport vind je hier.
Net zoals er van de XPS 15 9560 versies met Core i5-7300HQ en Core i7-7700HQ beschikbaar zijn, bestaat er van de XPS 15 9575 een model met de Core i5-8305G en een met de Core i7-8705G. Waar de sprong van een i5-7300HQ naar i7-7700HQ een prestatieverhoging van wel 40 procent kan opleveren, is dit bij de sprong van een i5-8305G naar i7-8705G slechts 5 tot 10 procent. Als je het grote prijsverschil tussen de versie van de XPS 15 9575 met i5 ($1300) en i7 ($2200) in rekening brengt, wordt het al snel duidelijk dat gebruikers de versie met i7 maar beter kunnen vermijden als de prijs/prestaties-verhouding een belangrijk criterium is.
Dell tracht het grote prijsverschil te verantwoorden met extra RAM en een hogere resolutie, die momenteel alleen verkrijgbaar zijn in combinatie met de Core i7. Intensieve multi-taskers, liefhebbers van touchscreen-stylus en videobewerkers zullen veel meer baat hebben bij de optionele 16 GB en 4K-UHD-scherm dan de meeste 'normale' gebruikers. Niettemin is het wat teleurstellend dat de versies met Core i5 momenteel beperkt zijn tot slechts 8 GB RAM.
Afgezien van deze verschillen, zijn onze commentaren op de XPS 15 9575 met Core i5 hier nog altijd van toepassing. Kaby Lake-G toont zich een uitstekend alternatief voor de alomtegenwoordige combinatie van Core i7-7700HQ en GTX 1050 of 1050 Ti bij concurrerende toestellen. De convertible van Dell is nog energie-efficiënter en koeler dan deze toestellen en stiller dan de XPS 15 9560. Zolang gebruikers zich maar bewust zijn van de lange lijst van minpunten (zie rechts), komen concurrerende 15-inch-convertibles zelfs niet in de buurt van wat de XPS 15 9575 te bieden heeft; met de noemenswaardige uitzondering van de HP Spectre x360 15 (2018) die we binnenkort verwachten.
Je moet geen $2200 uitgeven aan de optionele Core i7-8705G als de Core i5-8705G maar iets trager is voor bijna $1000 minder. Zelfs de goedkoopste versie van de XPS 15 9575 is bijna even snel als de duurste XPS 15 9575 of XPS 9560. We hopen dat de versie met Core i5 in de toekomst meer opties voor RAM en schermkwaliteit krijgt zodat de serie nog aantrekkelijker wordt.
Dell XPS 15 9575 i7-8705G
- 08-05-2018 v6 (old)
Allen Ngo
Price comparison
