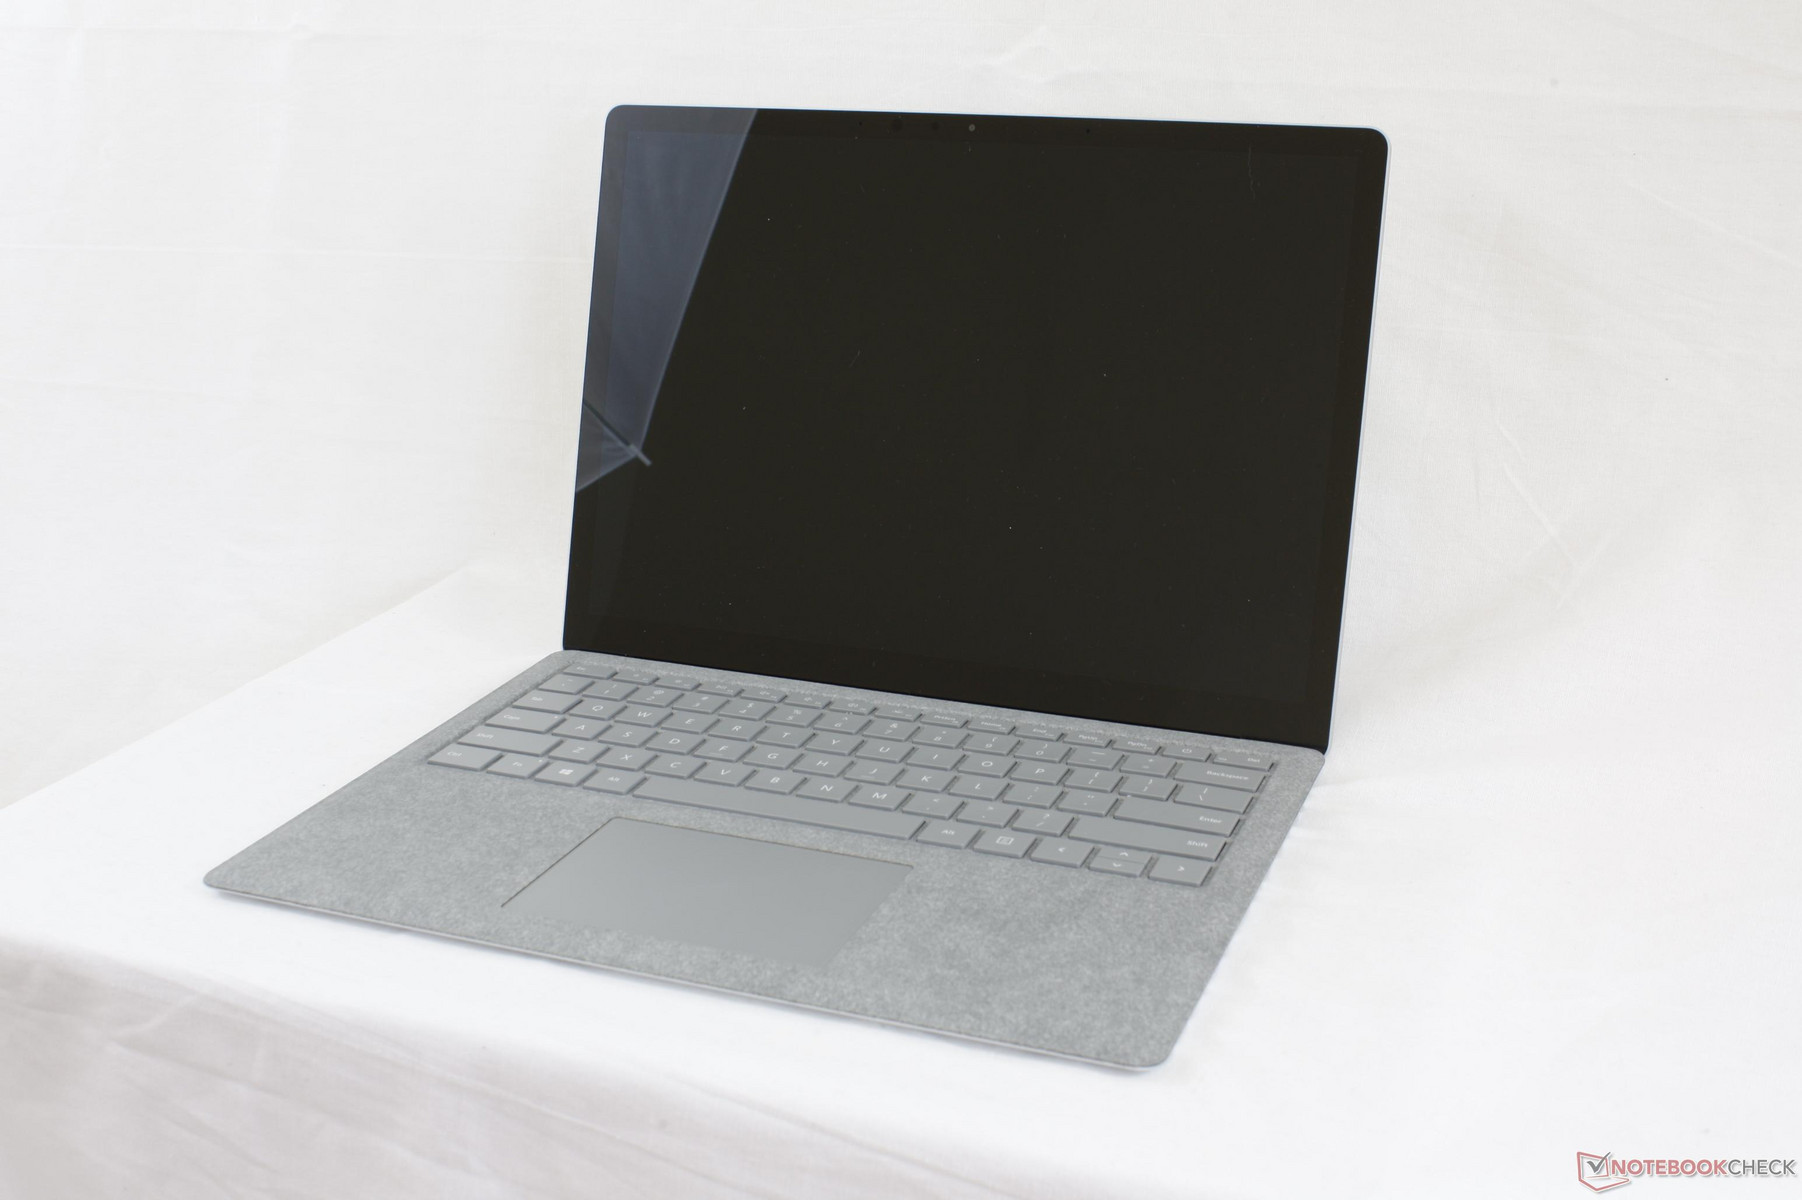
Kort testrapport Microsoft Surface (i7-7660U) Laptop
| |||||||||||||||||||||||||
Helderheidsverdeling: 89 %
Helderheid in Batterij-modus: 398 cd/m²
Contrast: 948:1 (Zwart: 0.42 cd/m²)
| Microsoft Surface Laptop i7 ID: MEI96A2, Name: Panasonic VVX14T092N00, , 2256x1504, 13.5" | Microsoft Surface Laptop i5 ID: MEI96A2, Name: Panasonic VVX14T092N00, , 2256x1504, 13.5" | Microsoft Surface Pro (2017) i7 LG Display LP123WQ112604, , 2736x1824, 12.3" | Apple MacBook Pro 13 2017 Touchbar i5 APPA034, , 2560x1600, 13.3" | Dell XPS 13 9360 FHD i7 Iris SHP1449, , 1920x1080, 13.3" | |
|---|---|---|---|---|---|
| Display | |||||
| Display P3 Coverage (%) | 67.8 | 66.6 | 98.6 | 51.6 | |
| sRGB Coverage (%) | 94.3 | 96.5 | 100 | 77.4 | |
| AdobeRGB 1998 Coverage (%) | 69.5 | 67.8 | 86.5 | 53.3 | |
| Response Times | |||||
| Response Time Grey 50% / Grey 80% * (ms) | 50.8 ? | 37 ? | 48 ? | 41.2 ? | |
| Response Time Black / White * (ms) | 37.2 ? | 25 ? | 33.6 ? | 30 ? | |
| PWM Frequency (Hz) | 22130 ? | 119000 ? | 19530 ? | ||
| Screen | 4% | 16% | 15% | 43% | |
| Brightness middle (cd/m²) | 398 | 384.2 -3% | 482 21% | 551 38% | 461 16% |
| Brightness (cd/m²) | 393 | 378 -4% | 466 19% | 514 31% | 418 6% |
| Brightness Distribution (%) | 89 | 90 1% | 92 3% | 88 -1% | 85 -4% |
| Black Level * (cd/m²) | 0.42 | 0.36 14% | 0.395 6% | 0.48 -14% | 0.2 52% |
| Contrast (:1) | 948 | 1067 13% | 1220 29% | 1148 21% | 2305 143% |
| Colorchecker dE 2000 * | 1.8 | 4 | 0.8 | 5.4 | |
| Colorchecker dE 2000 max. * | 4.2 | 7.2 | 1.4 | 12.2 | |
| Greyscale dE 2000 * | 1.2 | 5.7 | 1 | 5.4 | |
| Gamma | 2.21 100% | 2.28 96% | 2.16 102% | 2.15 102% | |
| CCT | 6708 97% | 7950 82% | 6672 97% | 7258 90% | |
| Color Space (Percent of AdobeRGB 1998) (%) | 63.7 | 62 | 48.6 | ||
| Color Space (Percent of sRGB) (%) | 94.2 | 96 | 76.9 | ||
| Totaal Gemiddelde (Programma / Instellingen) | 4% /
4% | 16% /
16% | 15% /
15% | 43% /
43% |
* ... kleiner is beter
| PCMark 8 Home Score Accelerated v2 | 4182 punten | |
| PCMark 8 Creative Score Accelerated v2 | 5509 punten | |
| PCMark 8 Work Score Accelerated v2 | 4700 punten | |
| PCMark 10 Score | 3812 punten | |
Help | ||
| Microsoft Surface Laptop i7 Samsung PM971 KUS040202M | Microsoft Surface Laptop i5 Toshiba THNSN0128GTYA | Microsoft Surface Pro (2017) i7 Samsung PM971 KUS040202M | Lenovo ThinkPad P51s 20HB000SGE Samsung SSD PM961 1TB M.2 PCIe 3.0 x4 NVMe (MZVLW1T0) | Dell XPS 13 9360 FHD i7 Iris Toshiba XG4 NVMe (THNSN5512GPUK) | |
|---|---|---|---|---|---|
| CrystalDiskMark 3.0 | -65% | 5% | 47% | 32% | |
| Read Seq (MB/s) | 1021 | 425.6 -58% | 1308 28% | 1189 16% | 1314 29% |
| Write Seq (MB/s) | 973 | 128.2 -87% | 961 -1% | 1138 17% | 617 -37% |
| Read 512 (MB/s) | 253 | 278.5 10% | 227.5 -10% | 782 209% | 1058 318% |
| Write 512 (MB/s) | 778 | 126.7 -84% | 792 2% | 959 23% | 502 -35% |
| Read 4k (MB/s) | 53 | 22.15 -58% | 53.6 1% | 54.8 3% | 37.31 -30% |
| Write 4k (MB/s) | 130.4 | 40.45 -69% | 136.3 5% | 161.4 24% | 133.6 2% |
| Read 4k QD32 (MB/s) | 453.3 | 77.8 -83% | 485.6 7% | 642 42% | 425.1 -6% |
| Write 4k QD32 (MB/s) | 389.7 | 41.18 -89% | 421.5 8% | 549 41% | 431.3 11% |

| 3DMark | |
| 1280x720 Cloud Gate Standard Graphics | |
| Apple MacBook Pro 13 2017 | |
| Microsoft Surface Pro (2017) i7 | |
| Dell XPS 13 9360 FHD i7 Iris | |
| Microsoft Surface Laptop i7 | |
| Microsoft Surface Laptop i5 | |
| 1920x1080 Fire Strike Graphics | |
| Apple MacBook Pro 13 2017 | |
| Microsoft Surface Pro (2017) i7 | |
| Dell XPS 13 9360 FHD i7 Iris | |
| Microsoft Surface Laptop i7 | |
| Microsoft Surface Laptop i5 | |
| 3DMark 06 Standard Score | 13164 punten | |
| 3DMark 11 Performance | 2561 punten | |
| 3DMark Cloud Gate Standard Score | 7558 punten | |
| 3DMark Fire Strike Score | 1236 punten | |
| 3DMark Time Spy Score | 476 punten | |
Help | ||
| Overwatch | |
| 1920x1080 Epic (Render Scale 100 %) AA:SM AF:16x | |
| Apple MacBook Pro 13 2017 | |
| 1920x1080 High (Render Scale 100 %) AA:SM AF:4x | |
| Apple MacBook Pro 13 2017 | |
| Dell XPS 13 9360 FHD i7 Iris | |
| Microsoft Surface Pro (2017) i7 | |
| 1366x768 Medium (Render Scale 100 %) AA:FX AF:2x | |
| Apple MacBook Pro 13 2017 | |
| Microsoft Surface Pro (2017) i7 | |
| Dell XPS 13 9360 FHD i7 Iris | |
| Microsoft Surface Laptop i7 | |
| 1280x720 Low (Render Scale 100 %) AA:FX AF:1x | |
| Apple MacBook Pro 13 2017 | |
| Microsoft Surface Pro (2017) i7 | |
| Dell XPS 13 9360 FHD i7 Iris | |
| Microsoft Surface Laptop i7 | |
| The Evil Within 2 - 1280x720 Low Preset AA:T | |
| Microsoft Surface Laptop i7 | |
| Middle-earth: Shadow of War - 1280x720 Lowest Preset | |
| Microsoft Surface Laptop i7 | |
| FIFA 18 | |
| 1920x1080 Medium Preset | |
| Microsoft Surface Laptop i7 | |
| 1280x720 Low Preset | |
| Microsoft Surface Laptop i7 | |
| F1 2017 | |
| 1920x1080 Medium Preset AF:4x | |
| Dell XPS 13 9360 FHD i7 Iris | |
| Microsoft Surface Laptop i7 | |
| 1280x720 Ultra Low Preset | |
| Microsoft Surface Laptop i7 | |
| Dell XPS 13 9360 FHD i7 Iris | |
| Team Fortress 2 | |
| 1920x1080 maximum AA:8x MS AF:16x | |
| Microsoft Surface Laptop i7 | |
| 1920x1080 high AF:16x | |
| Microsoft Surface Laptop i7 | |
| 1366x768 medium AF:4x | |
| Microsoft Surface Laptop i7 | |
| Playerunknown's Battlegrounds (PUBG) - 1280x720 Very Low Preset | |
| Microsoft Surface Laptop i7 | |
| Rocket League | |
| 1920x1080 High Quality AA:High FX | |
| Apple MacBook Pro 13 2017 | |
| Microsoft Surface Pro (2017) i7 | |
| Dell XPS 13 9360 FHD i7 Iris | |
| Microsoft Surface Laptop i7 | |
| 1920x1080 Quality AA:Medium FX | |
| Apple MacBook Pro 13 2017 | |
| Microsoft Surface Pro (2017) i7 | |
| Dell XPS 13 9360 FHD i7 Iris | |
| Microsoft Surface Laptop i7 | |
| 1280x720 Performance | |
| Microsoft Surface Pro (2017) i7 | |
| Apple MacBook Pro 13 2017 | |
| Microsoft Surface Laptop i7 | |
| Dell XPS 13 9360 FHD i7 Iris | |
| Titanfall 2 | |
| 1920x1080 High / Enabled AA:TS AF:8x | |
| Apple MacBook Pro 13 2017 | |
| 1366x768 Medium / Disabled AF:4x | |
| Apple MacBook Pro 13 2017 | |
| 1280x720 Low / Disabled AF:Trilinear | |
| Microsoft Surface Laptop i7 | |
| Apple MacBook Pro 13 2017 | |
| Dota 2 Reborn | |
| 1920x1080 ultra (3/3) best looking | |
| Microsoft Surface Laptop i7 | |
| Microsoft Surface Pro (2017) i7 | |
| 1920x1080 high (2/3) | |
| Microsoft Surface Pro (2017) i7 | |
| Microsoft Surface Laptop i7 | |
| 1366x768 med (1/3) | |
| Microsoft Surface Pro (2017) i7 | |
| Microsoft Surface Laptop i7 | |
| 1280x720 min (0/3) fastest | |
| Microsoft Surface Pro (2017) i7 | |
| Microsoft Surface Laptop i7 | |
| Battlefield 1 | |
| 1920x1080 High Preset AA:T | |
| Apple MacBook Pro 13 2017 | |
| Microsoft Surface Pro (2017) i7 | |
| 1366x768 Medium Preset AA:FX | |
| Apple MacBook Pro 13 2017 | |
| Microsoft Surface Pro (2017) i7 | |
| 1280x720 Low Preset | |
| Apple MacBook Pro 13 2017 | |
| Microsoft Surface Laptop i7 | |
| Microsoft Surface Pro (2017) i7 | |
| The Witcher 3 | |
| 1920x1080 Ultra Graphics & Postprocessing (HBAO+) | |
| Apple MacBook Pro 13 2017 | |
| 1366x768 Medium Graphics & Postprocessing | |
| Apple MacBook Pro 13 2017 | |
| 1024x768 Low Graphics & Postprocessing | |
| Microsoft Surface Pro (2017) i7 | |
| Apple MacBook Pro 13 2017 | |
| Dell XPS 13 9360 FHD i7 Iris | |
| Microsoft Surface Laptop i7 | |
| Sims 4 | |
| 1920x1080 Ultra Preset | |
| Microsoft Surface Pro (2017) i7 | |
| Microsoft Surface Laptop i7 | |
| 1920x1080 High Preset | |
| Microsoft Surface Laptop i7 | |
| Diablo III - 1920x1080 High AA:on | |
| Microsoft Surface Laptop i7 | |
| World of Warcraft - 1280x1024 high | |
| Microsoft Surface Laptop i7 | |
| lage | gem. | hoge | ultra | |
|---|---|---|---|---|
| World of Warcraft (2005) | 28.5 | |||
| Diablo III (2012) | 35.2 | |||
| Sims 4 (2014) | 28.6 | 20.2 | ||
| The Witcher 3 (2015) | 16.4 | |||
| Dota 2 Reborn (2015) | 68 | 55 | 27.6 | 23 |
| Overwatch (2016) | 53.6 | 24.1 | ||
| Battlefield 1 (2016) | 29.2 | |||
| Titanfall 2 (2016) | 45 | |||
| Rocket League (2017) | 96 | 33.9 | 24.9 | |
| Team Fortress 2 (2017) | 99 | 48 | 31.8 | |
| Playerunknown's Battlegrounds (PUBG) (2017) | 22.9 | |||
| F1 2017 (2017) | 38 | 15 | ||
| FIFA 18 (2017) | 69 (some slowdowns in game) | 38 (some slowdowns in game) | ||
| Middle-earth: Shadow of War (2017) | 28 | |||
| The Evil Within 2 (2017) | 13.8 |
Geluidsniveau
| Onbelast |
| 30.9 / 30.9 / 30.9 dB (A) |
| Belasting |
| 40.2 / 40.2 dB (A) |
 | ||
30 dB stil 40 dB(A) hoorbaar 50 dB(A) luid |
||
min: | ||
(+) De maximumtemperatuur aan de bovenzijde bedraagt 37 °C / 99 F, vergeleken met het gemiddelde van 35.9 °C / 97 F, variërend van 21.4 tot 59 °C voor de klasse Subnotebook.
(±) De bodem warmt op tot een maximum van 40 °C / 104 F, vergeleken met een gemiddelde van 39.2 °C / 103 F
(+) Bij onbelast gebruik bedraagt de gemiddelde temperatuur voor de bovenzijde 25.4 °C / 78 F, vergeleken met het apparaatgemiddelde van 30.8 °C / 87 F.
(+) De palmsteunen en het touchpad zijn met een maximum van ###max## °C / 86 F koeler dan de huidtemperatuur en voelen daarom koel aan.
(±) De gemiddelde temperatuur van de handpalmsteun van soortgelijke toestellen bedroeg 28.2 °C / 82.8 F (-1.8 °C / -3.2 F).
Microsoft Surface Laptop i7 audioanalyse
(±) | luidspreker luidheid is gemiddeld maar goed (78 dB)
Bas 100 - 315 Hz
(±) | verminderde zeebaars - gemiddeld 7.7% lager dan de mediaan
(-) | de lage tonen zijn niet lineair (15.9% delta naar de vorige frequentie)
Midden 400 - 2000 Hz
(+) | evenwichtige middens - slechts 3.8% verwijderd van de mediaan
(+) | de middentonen zijn lineair (4.6% delta ten opzichte van de vorige frequentie)
Hoog 2 - 16 kHz
(+) | evenwichtige hoogtepunten - slechts 1.6% verwijderd van de mediaan
(+) | de hoge tonen zijn lineair (4.4% delta naar de vorige frequentie)
Algemeen 100 - 16.000 Hz
(+) | het totale geluid is lineair (11.9% verschil met de mediaan)
Vergeleken met dezelfde klasse
» 13% van alle geteste apparaten in deze klasse waren beter, 5% vergelijkbaar, 82% slechter
» De beste had een delta van 5%, het gemiddelde was 18%, de slechtste was 53%
Vergeleken met alle geteste toestellen
» 9% van alle geteste apparaten waren beter, 2% gelijk, 89% slechter
» De beste had een delta van 4%, het gemiddelde was 23%, de slechtste was 134%
Microsoft Surface Laptop i5 audioanalyse
(-) | niet erg luide luidsprekers (64.6 dB)
Bas 100 - 315 Hz
(±) | verminderde zeebaars - gemiddeld 7.1% lager dan de mediaan
(±) | lineariteit van de lage tonen is gemiddeld (11.8% delta ten opzichte van de vorige frequentie)
Midden 400 - 2000 Hz
(+) | evenwichtige middens - slechts 4.1% verwijderd van de mediaan
(+) | de middentonen zijn lineair (5.6% delta ten opzichte van de vorige frequentie)
Hoog 2 - 16 kHz
(+) | evenwichtige hoogtepunten - slechts 1.2% verwijderd van de mediaan
(+) | de hoge tonen zijn lineair (4.7% delta naar de vorige frequentie)
Algemeen 100 - 16.000 Hz
(±) | lineariteit van het totale geluid is gemiddeld (15.6% verschil met de mediaan)
Vergeleken met dezelfde klasse
» 36% van alle geteste apparaten in deze klasse waren beter, 5% vergelijkbaar, 58% slechter
» De beste had een delta van 5%, het gemiddelde was 18%, de slechtste was 53%
Vergeleken met alle geteste toestellen
» 23% van alle geteste apparaten waren beter, 5% gelijk, 72% slechter
» De beste had een delta van 4%, het gemiddelde was 23%, de slechtste was 134%
Apple MacBook Pro 13 2017 Touchbar i5 audioanalyse
(+) | luidsprekers kunnen relatief luid spelen (86.2 dB)
Bas 100 - 315 Hz
(±) | verminderde zeebaars - gemiddeld 11.5% lager dan de mediaan
(±) | lineariteit van de lage tonen is gemiddeld (10.8% delta ten opzichte van de vorige frequentie)
Midden 400 - 2000 Hz
(±) | hogere middens - gemiddeld 5.2% hoger dan de mediaan
(+) | de middentonen zijn lineair (6.4% delta ten opzichte van de vorige frequentie)
Hoog 2 - 16 kHz
(+) | evenwichtige hoogtepunten - slechts 2.2% verwijderd van de mediaan
(+) | de hoge tonen zijn lineair (5.7% delta naar de vorige frequentie)
Algemeen 100 - 16.000 Hz
(+) | het totale geluid is lineair (11.9% verschil met de mediaan)
Vergeleken met dezelfde klasse
» 13% van alle geteste apparaten in deze klasse waren beter, 5% vergelijkbaar, 82% slechter
» De beste had een delta van 5%, het gemiddelde was 18%, de slechtste was 53%
Vergeleken met alle geteste toestellen
» 9% van alle geteste apparaten waren beter, 2% gelijk, 89% slechter
» De beste had een delta van 4%, het gemiddelde was 23%, de slechtste was 134%
| Uit / Standby | |
| Inactief | |
| Belasting |
|
Key:
min: | |
| Microsoft Surface Laptop i7 i7-7660U, Iris Plus Graphics 640, Samsung PM971 KUS040202M, IPS, 2256x1504, 13.5" | Microsoft Surface Laptop i5 i5-7200U, HD Graphics 620, Toshiba THNSN0128GTYA, IPS, 2256x1504, 13.5" | Dell XPS 13 9360 FHD i7 Iris i7-7560U, Iris Plus Graphics 640, Toshiba XG4 NVMe (THNSN5512GPUK), IPS, 1920x1080, 13.3" | Microsoft Surface Pro (2017) i7 i7-7660U, Iris Plus Graphics 640, Samsung PM971 KUS040202M, IPS, 2736x1824, 12.3" | Apple MacBook Pro 13 2017 i5-7360U, Iris Plus Graphics 640, Apple SSD AP0128, IPS, 2560x1600, 13.3" | |
|---|---|---|---|---|---|
| Power Consumption | 9% | 6% | -28% | -7% | |
| Idle Minimum * (Watt) | 2.7 | 3.2 -19% | 3.32 -23% | 4.2 -56% | 3.7 -37% |
| Idle Average * (Watt) | 7.6 | 6.5 14% | 5.27 31% | 10.1 -33% | 5.2 32% |
| Idle Maximum * (Watt) | 7.8 | 6.8 13% | 6.32 19% | 14 -79% | 7.6 3% |
| Load Average * (Watt) | 37.5 | 28.2 25% | 32 15% | 37.4 -0% | 41.6 -11% |
| Witcher 3 ultra * (Watt) | 31.7 | 38.1 -20% | |||
| Load Maximum * (Watt) | 41.6 | 36 13% | 45.9 -10% | 34 18% | 50.5 -21% |
* ... kleiner is beter
| Microsoft Surface Laptop i7 i7-7660U, Iris Plus Graphics 640, 45 Wh | Microsoft Surface Laptop i5 i5-7200U, HD Graphics 620, 45 Wh | Dell XPS 13 9360 FHD i7 Iris i7-7560U, Iris Plus Graphics 640, 60 Wh | Microsoft Surface Pro (2017) i7 i7-7660U, Iris Plus Graphics 640, 45 Wh | Apple MacBook Pro 13 2017 i5-7360U, Iris Plus Graphics 640, 54.5 Wh | |
|---|---|---|---|---|---|
| Batterijduur | 22% | 32% | -4% | 2% | |
| H.264 (h) | 12.8 | 15 17% | 10.2 -20% | 11.4 -11% | |
| WiFi v1.3 (h) | 7.6 | 10 32% | 10.9 43% | 8.2 8% | 11.4 50% |
| Load (h) | 1.9 | 2.1 11% | 2.6 37% | 1.9 0% | 1.3 -32% |
| Reader / Idle (h) | 22.5 | 25.4 | |||
| Witcher 3 ultra (h) | 1.9 |
Pro
Contra
Dit is de verkorte versie van het originele artikel. Het volledige, Engelse testrapport vind je hier.
Het is niet makkelijk voor ons om een definitief oordeel te geven over de Microsoft Surface Laptop i7. De Intel Core i7-7660U is en blijft een tweezijdig zwaard. Aan de ene kant zijn daar de teleurstellende resultaten van de Turbo Boost prestaties en lijkt het erop dat Microsoft niets geleerd heeft van de fouten die in het verleden gemaakt zijn met de Surface Pro i7 (2017).
Door throttling kan de hogere Turbo Boost kloksnelheid van de Intel Core i7-7660U niet volledig benut worden bij langere belasting. Wat betreft de prijs moet je € 350 meer betalen dan voor de i5-7200U.
Aan de andere kant valt dat eerste nadeel weer weg; ook is de i7 niet het enige component dat de hogere prijs veroorzaakt. Er is ook een aanzienlijk snellere SSD en de Iris Plus Graphics 640 GPU, geïntegreerd in de Intel Core i7-7660U. Nu kan dan ook de langzame SSD van Toshiba uit het i5 model bekritiseert worden en de snelle Samsung SSD in de i7 laptop geprezen. De krachtiger Irus Plus Graphics 640 is, in alle opzichten, de betere optie voor grafisch intensieve applicaties, hoewel deze van de i7 gebaseerde Surface Laptop nog geen game notebook maakt.
Net als bij het i5 model het geval is, mist de i7 variant een USB Type-C poort en een SD-kaartlezer, zelfs als deze geen prioriteit hebben voor de koper. De Alcantara textuur is ook niet van doorslaggevend belang in de aankoopbeslissing, hoewel het een welkome verandering is tegenover de gebruikelijke plastic oppervlakken. Er valt niets slechts te zeggen over de bouwkwaliteit, en de behuizing heeft dan ook van hoge kwaliteit. Het maakt een algeheel goede indruk. Ook de draagbaarheid kan als erg goed beschreven worden, dankzij de hoge batterijlevensduur. Met de Surface Laptops richt Microsoft zich op studenten, die met het betaalbaardere i5 model geen moeite zullen hebben om een dag lang klassen te vullen.
Concluderend staat de initiële vraag, of de Surface Laptop i7 aan te raden is, nog steeds open. Naar onze mening is het enige punt van kritiek de reeds genoemde constante dalen in prestaties na enkele minuten in Turbo Boost modus. Desondanks is de i7 laptop een sneller apparaat met betere CPU en GPU prestaties, zelfs met de throttling. Als je ook de snellere Samsung SSD in acht neemt, wordt de beslissing om een Surface Laptop i7 aan te schaffen een hele redelijke.
Microsoft Surface Laptop i7
- 24-10-2017 v6 (old)
Klaus Hinum, Daniel Puschina